Abstract
This study aims to evaluate the emissions of greenhouse gases (GHGs) stemming from the sludge treatment sector in China and to investigate the feasibility of novel technologies in curtailing these emissions, with the aim of fostering sustainable sludge management methodologies. Employing a life-cycle assessment (LCA) methodology, the research computed the comprehensive GHG emissions resulting from sludge treatment, taking into consideration diverse elements such as treatment techniques (e.g., landfills, incineration, and land application) and the geographical variations among China’s 660 municipalities. Findings indicate that the total amount of GHG emissions from sludge treatment amounted to 18.54 Mt CO2-eq in 2017, with incineration registering the highest emissions (10,011.53 kg CO2-eq/t dry sludge (DS)), followed by landfills (717.51 kg CO2-eq/t DS) and land application (276.41 kg CO2-eq/t DS). The geographical dispersion of emissions characteristics reveal notable regional disparities, with the top 1% of cities responsible for 34.2% of the overall emissions. The concentration of emissions in the top 1 percent of cities underscores the necessity for tailored mitigation measures that consider localized sustainable development challenges. Principal component analysis (PCA) demonstrates that economic determinants and treatment scales exert substantial influence on emissions, underscoring the imperative of aligning Sustainable Development Goals (SDGs) with economic advancement. To curtail the carbon footprint associated with sludge treatment and enhance sustainability, the study evaluated the emission mitigation potential and expenses of diverse technologies, encompassing thermal conversion, anaerobic digestion, hydrothermal treatment, and wet oxidation. These technologies have the capacity to slash GHG emissions by 0.09–0.46 t CO2-eq/t DS in comparison to traditional approaches, while concurrently advancing resource recuperation and principles of circular economy. For instance, gasification could diminish GHG emissions by 0.33–0.46 t CO2-eq/t DS, whereas anaerobic digestion could yield reductions of 0.09–0.30 t CO2-eq/t DS. The implementation of these innovative technologies across 660 Chinese municipalities could potentially curtail total GHG emissions from sludge treatment by 15–40%. Nevertheless, further enhancements are imperative to refine their environmental and economic efficiency and guarantee enduring sustainability. By deploying these technologies and embracing optimization tactics, China’s sludge treatment sector can make a substantial contribution towards attaining national carbon neutrality objectives and advancing sustainable development.
1. Introduction
Sludge management has become a critical issue in China due to rapid urbanization and population growth. Sludge, deriving from wastewater treatment, harbors various pollutants, like heavy metals, pathogens, and organic contaminants, thereby posing a substantial hazard to human health and the environment when not managed appropriately [1]. In 2020, China generated approximately 55 Mt of wet sludge, and this figure is expected to reach 60 Mt by 2025 [2]. Disposal of sludge contributes to 40% of the overall greenhouse gas (GHG) emissions from the wastewater domain in China [3]. Sustainable sludge management strategies that minimize GHG emissions while ensuring safe and efficient treatment are urgently needed. Improper disposal of sludge can lead to severe environmental and public health consequences [4]. A holistic approach to sludge management, focusing on minimizing sludge generation, optimizing treatment processes, promoting resource recovery, and ensuring safe disposal, is crucial for addressing the challenges associated with sludge treatment [5]. Recent studies have attempted to quantify GHG emissions stemming from sludge treatment in China. Guo et al. [6] estimated that the total GHG emissions from sludge treatment in China reached 18.6 Mt CO2-eq in 2018, with anaerobic digestion and landfills being the primary contributors. Similarly, Liu et al. [5] reported that the GHG emissions from sludge incineration in China amounted to 5.2 Mt of CO2-eq in 2017. However, these estimations often have limitations due to unclear system boundaries and methodological inconsistencies. Guo et al. [7] conducted a comparative scrutiny of average daily GHG emissions per capita in diverse nations, showing a notable range from 0.11 to 0.46. This disparity resulted from the research focus, which only addressed direct emissions from sludge treatment, while ignoring the indirect emission effects of energy use, transportation, and by-product disposal [8]. Moreover, the emission factors used in these calculations are often based on default values or limited local data, which may not reflect the actual emission levels under different treatment conditions. For instance, the utilization of various emission factors (EFs) exerts a notable influence on GHG emissions, leading to elevated emissions levels in the eastern region of China [6]. Xi et al. [9] compared diverse methodologies for evaluating carbon emissions and disclosed that the estimations from the Intergovernmental Panel on Climate Change (IPCC) 2006 substantially underestimated total GHG emissions by 87% compared to process-based calculation approaches. The primary reason for this inconsistency is mainly ascribed to the imprecise calculation of direct releases of N2O and CH4. Consequently, a methodical and thorough reassessment of GHG emissions arising from sludge management procedures in China becomes imperative to furnish a more precise and dependable foundation for decision-making.
Traditionally, landfills and land application have been the predominant techniques utilized for sludge disposal in China due to their simplicity and low cost. However, these methods have significant drawbacks in terms of environmental sustainability and GHG emissions. The practice of landfilling sludge has the potential to result in the release of CH4, a potent greenhouse gas with a global warming potential (GWP) 28 times greater than CO2 [10]. In addition, landfills require large areas of land and have the potential to contaminate groundwater if not properly managed [11]. Land application can reduce the volume of sludge and produce valuable fertilizer, but it also emits CO2 during the aerobic process [1]. To address these constraints, a variety of innovative technologies for sludge treatment have been devised and put into practice in recent times. For example, thermal treatment methods, such as incineration, pyrolysis, and gasification, can effectively reduce sludge volume and destroy pathogens while recovering energy [7]. Advanced anaerobic digestion techniques, such as temperature-phased anaerobic digestion (TPAD) and anaerobic membrane bioreactors (AnMBR), can enhance biogas production and nutrient recovery from sludge [12]. However, the GHG emission reduction potential of these emerging technologies compared to traditional methods remains largely unknown, impeding their widespread acceptance.
Several studies have investigated the cost aspects of novel sludge treatment technologies, acknowledging the importance of considering both environmental and economic factors when evaluating their feasibility [13,14]. Thermal treatment methods, particularly pyrolysis and gasification, show significant potential for reducing GHG emissions (0.2–0.5 t CO2-eq/t dry sludge) but have high costs (approximately 200–500 USD/t) [15,16]. Anaerobic digestion (AD) offers a more balanced option, with moderate GHG reduction potential (0.2–0.4 t CO2-eq/t dry sludge) and lower costs (100–300 USD/t) [17,18]. Incineration is the most expensive option due to high energy consumption and operational costs [15,19]. These studies highlight the importance of considering both GHG reduction potential and cost-effectiveness when evaluating the feasibility of novel sludge treatment technologies in China. While thermal treatment methods, particularly pyrolysis and gasification, show significant potential for reducing GHG emissions, their high costs may hinder widespread adoption. Further investigation and refinement are necessary to enhance the environmental and economic efficiency of these technologies and to support their integration into China’s sludge treatment sector.
The objective of this research is to conduct a thorough evaluation of GHG emissions originating from China’s sludge treatment sector and to investigate the capacity of emerging technologies in curbing these emissions. The distinctive feature of this study lies in the comprehensive method that merges the application of life-cycle assessment (LCA) for quantifying GHG emissions, spatial evaluations of emission patterns, the utilization of principal component analysis (PCA) for exploring socio-economic factors, and the evaluation of the environmental and economic effectiveness of novel sludge treatment technologies. The study goes beyond the state of the art by analyzing the influence of economic development on GHG emissions using PCA, providing new insights into the relationship between economic growth and environmental sustainability in the context of sludge treatment. Furthermore, the study conducts a comprehensive comparison of the economic and environmental aspects of selected novel sludge treatment technologies, including thermal treatment, advanced anaerobic digestion, and wet oxidation, to assess their feasibility and sustainability. This approach ensures a balanced evaluation of the potential of innovative technologies for reducing GHG emissions while considering their economic viability. By addressing these aspects together, the primary goal of this research is to make a substantial contribution to the development of a low-carbon and sustainable sludge management system in China, providing valuable insights for policymakers and industry stakeholders.
2. Methods
2.1. System Boundary and Data Sources
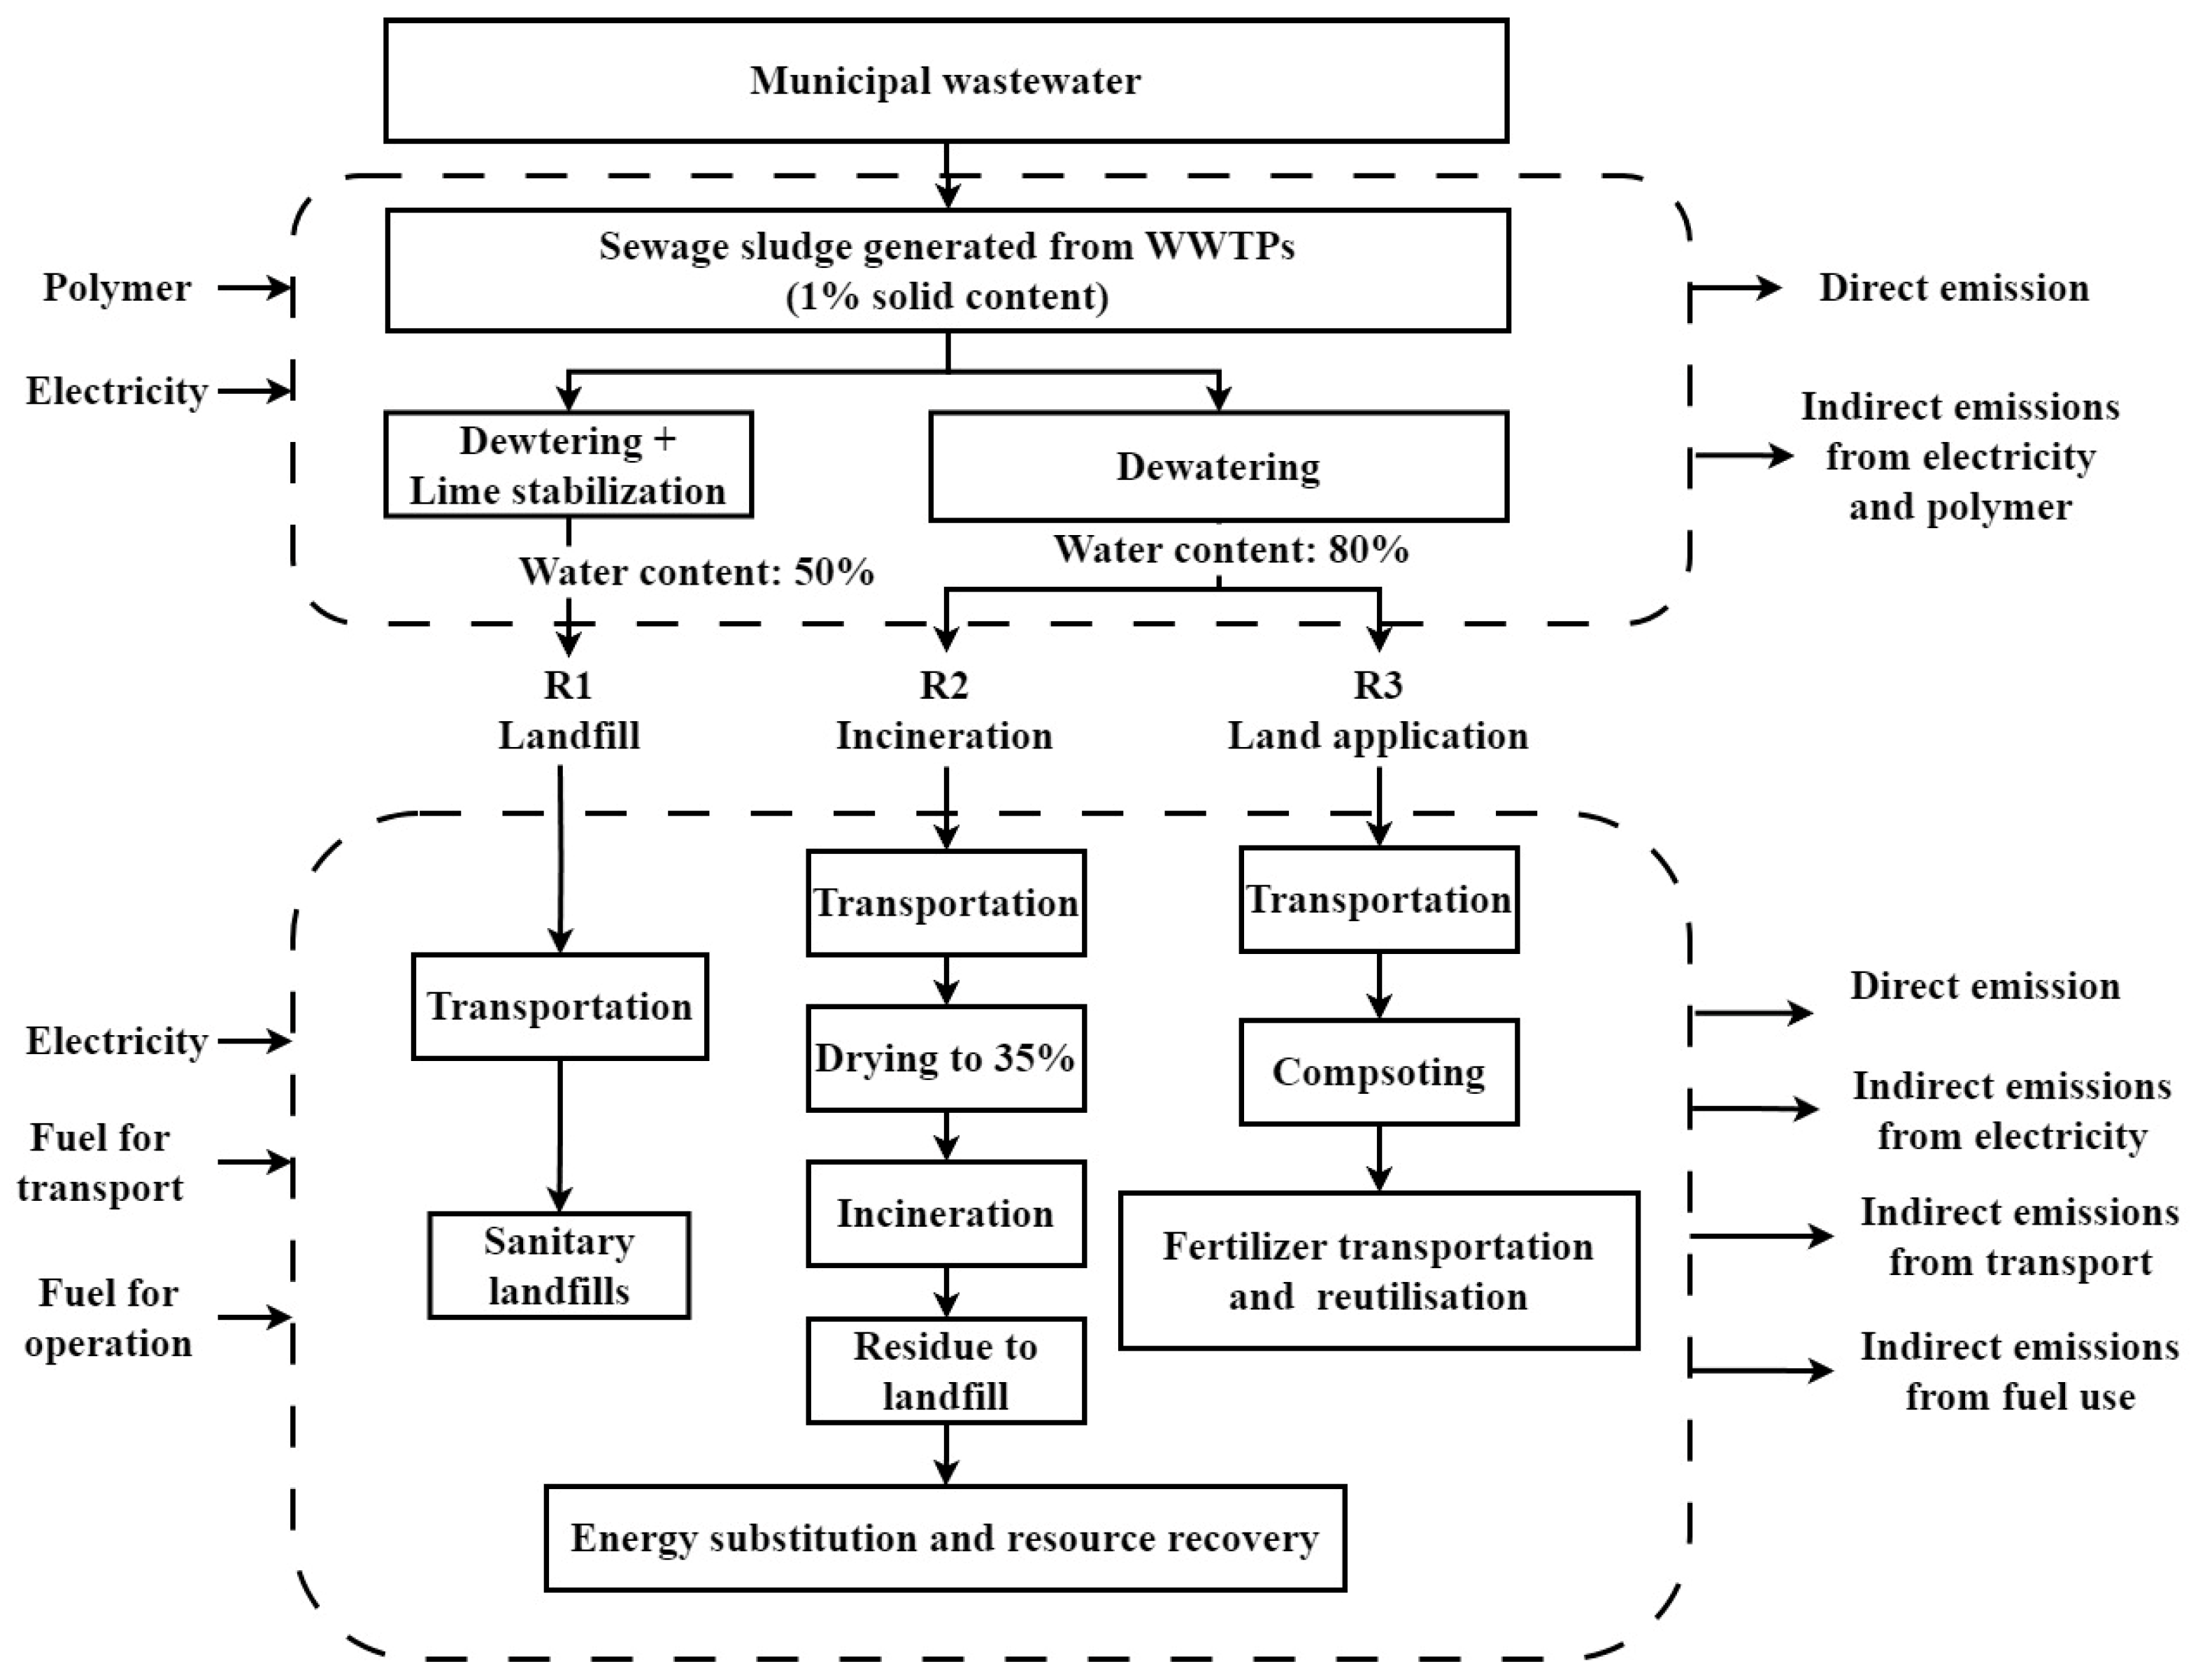
A life-cycle sludge treatment industry begins with sludge collection from WWTPs, followed by treatment and disposal, as depicted in Figure 1. Traditional sludge treatment and disposal methods include landfills, incineration, building materials application, and land application. In China, due to limited data, the primary methods are considered landfills, incineration, and land application [20]. Emissions of CH4 originating from anaerobic digestion of sludge are excluded from the scope of analysis in this research endeavor owing to their limited utilization rate, which accounts for approximately 3% of operations conducted at wastewater treatment facilities situated in China [6]. The geographical extent includes the 31 provincial administrative regions within China. Based on regional economic zones, China is divided into six regions in this study. Regional divisions are distinguished by offering detailed explanations of the geographic and economic characteristics of each area. The northern region encompasses Beijing, Tianjin, Hebei, Shanxi, Inner Mongolia, and Shandong, situated in the northern part of China, featuring a blend of well-developed urban and industrial zones. The northeastern region comprises Liaoning, Jilin, and Heilongjiang, known for their heavy industry and agricultural activities. The eastern region, including Shanghai, Jiangsu, Zhejiang, Anhui, and Fujian, stands out as one of China’s most economically advanced regions, with a focus on high-tech industries and international trade. The central region, encompassing Jiangxi, Henan, Hubei, Hunan, Chongqing, and Sichuan, is characterized by its expanding manufacturing and agricultural sectors. The southern region covers Guangdong, Guangxi, Hainan, Guizhou, and Yunnan, recognized for its tropical climate, tourism, and export-driven industries. Lastly, the northwest region, consisting of Tibet, Shaanxi, Gansu, Qinghai, Ningxia, and Xinjiang, is distinguished by its extensive land area, abundant natural resources, and comparatively less developed economy in comparison to other regions.
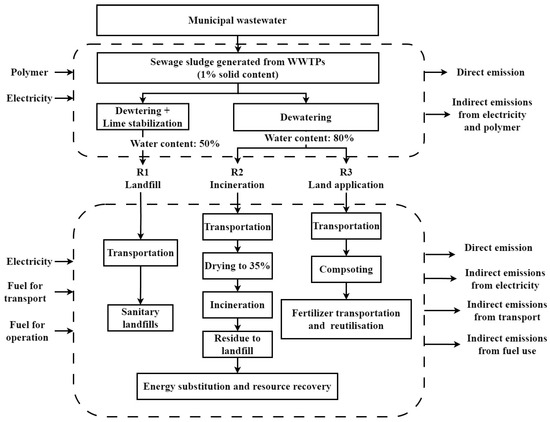
Figure 1.
System boundary to describe GHG emissions from the sludge treatment industry.
The utilization of the base year 2017 was applied in this research to quantify GHG emissions originating from the treatment of sludge within the industry. The Urban Construction Yearbook [20] provided socioeconomic preference data for 660 Chinese cities, including urban population, population density, GDP, daily water consumption, fixed asset investment, sludge creation, and sludge disposal methods. The data were utilized for the computation of GHG emissions stemming from the collection of wastewaters and the disposal of sludge. Furthermore, baseline emission parameters for regional power networks spanning six regions and 31 provinces were gathered by the Ministry of Ecology and Environment [21].
2.2. GHG Emission Quantifications
Overall GHG emissions from the sludge treatment industry were quantified using a LCA method, as described by Equation (1):
where AM represents the activity amount and EF is the emission factors of various activities during sludge treatment processes.
Direct CO2, N2O, and CH4 emissions during landfills, incineration, and land application were divided into on-site GHGs. Off-site emissions are the outcome of the processes of treating wastewater, transferring sludge, and disposing of it, which need energy, chemicals, and fuel [22]. GHG emissions for N2O and CH4 are expressed in CO2 equivalent (CO2-eq), with GWP of 1, 25, and 298 for CO2, N2O and CH4, respectively [10]. Total GHG emissions from different sludge treatment techniques (R1: landfills; R2: incineration, R3: land application) in various cities were calculated using:
where, K1, K2, and K3 are disposal method proportions.
Specific emissions for each method were calculated as:
where GHGCH4−1 describes the methane produced from landfills [23]. CO2−bio is the emission from bioprocesses [24]. During sludge incineration, GHGCH4−2 and GHGN2O produce [25]. Although complete combustion during sludge incineration should primarily produce CO2, small amounts of CH4 and N2O emissions are also considered in this study, as reported by Wei et al. [3]. These emissions can occur due to factors such as incomplete combustion, the presence of nitrogen compounds in the sludge, and suboptimal conditions during startup and shutdown phases of the incineration process. According to CO2−eq1, the aerobic composting of sludge results in CO2 emissions [3]. The amount of CO2−avoided is the amount of emissions offset by applying sludge instead of chemical fertilizers in land applications [26]. GHGt stands for the CO2 emissions that result from transporting sludge, and it is described as follows:
where DIt is the transportation distance, 30 km is the transportation lengths for landfills, 70 km is for incinerators, and 30 km is for land application from WWTPs to the corresponding places from WWTPs [27]. e1, e2, and e3 are the effective EFs for vehicles according to Chinese emission standard IV, with a fuel consumption rate of 0.2 L/km [18].
GHGdi is the CO2-eq of diesel produced by incineration and aerobic composting, as shown in the following:
where L1 shows that 3.1 L of fuel is used per ton while moving sludge to landfills [28]. e4, e5, and e6 are GHG emissions per liter of diesel consumed [29].
CO2−ele is the usage of electricity consumption, as shown in Equation (8):
where e7 presents the EF o electricity consumption. L2 is the amount of electricity used for three sludge treatment methods [16].
GHGco, which is defined as the CO2-eq emissions from coal used, is as follows:
where L3 stands for the amount of coal needed for sludge treatment [18,30]. e8, e9, and e10 are the corresponding emission factors for coal [3].
Table 1 displays the values of the associated EFs for each action during the sludge treatment operations.

Table 1.
EFs for various activities in the sludge treatment process.
2.3. Influencial Factors on GHG Emissions
Since the various evaluation indicators’ measurement scales influence the emission characteristics of GHGs in the sludge treatment industry, data harmonization is essential. PCA effectively converts data into a new subspace with high variance, so reducing dimensionality while maintaining important information [31]. The largest deviation from the original data is used to determine the orientation of the new coordinate axes. The features of the sludge treatment process and five social-economic indicators were chosen as input parameters. In addition, operational and infrastructure metrics were incorporated, such as treated sludge volume and treated wastewater volume.
3. Results and Discussion
3.1. An Overview of the Sludge Treatment Sector
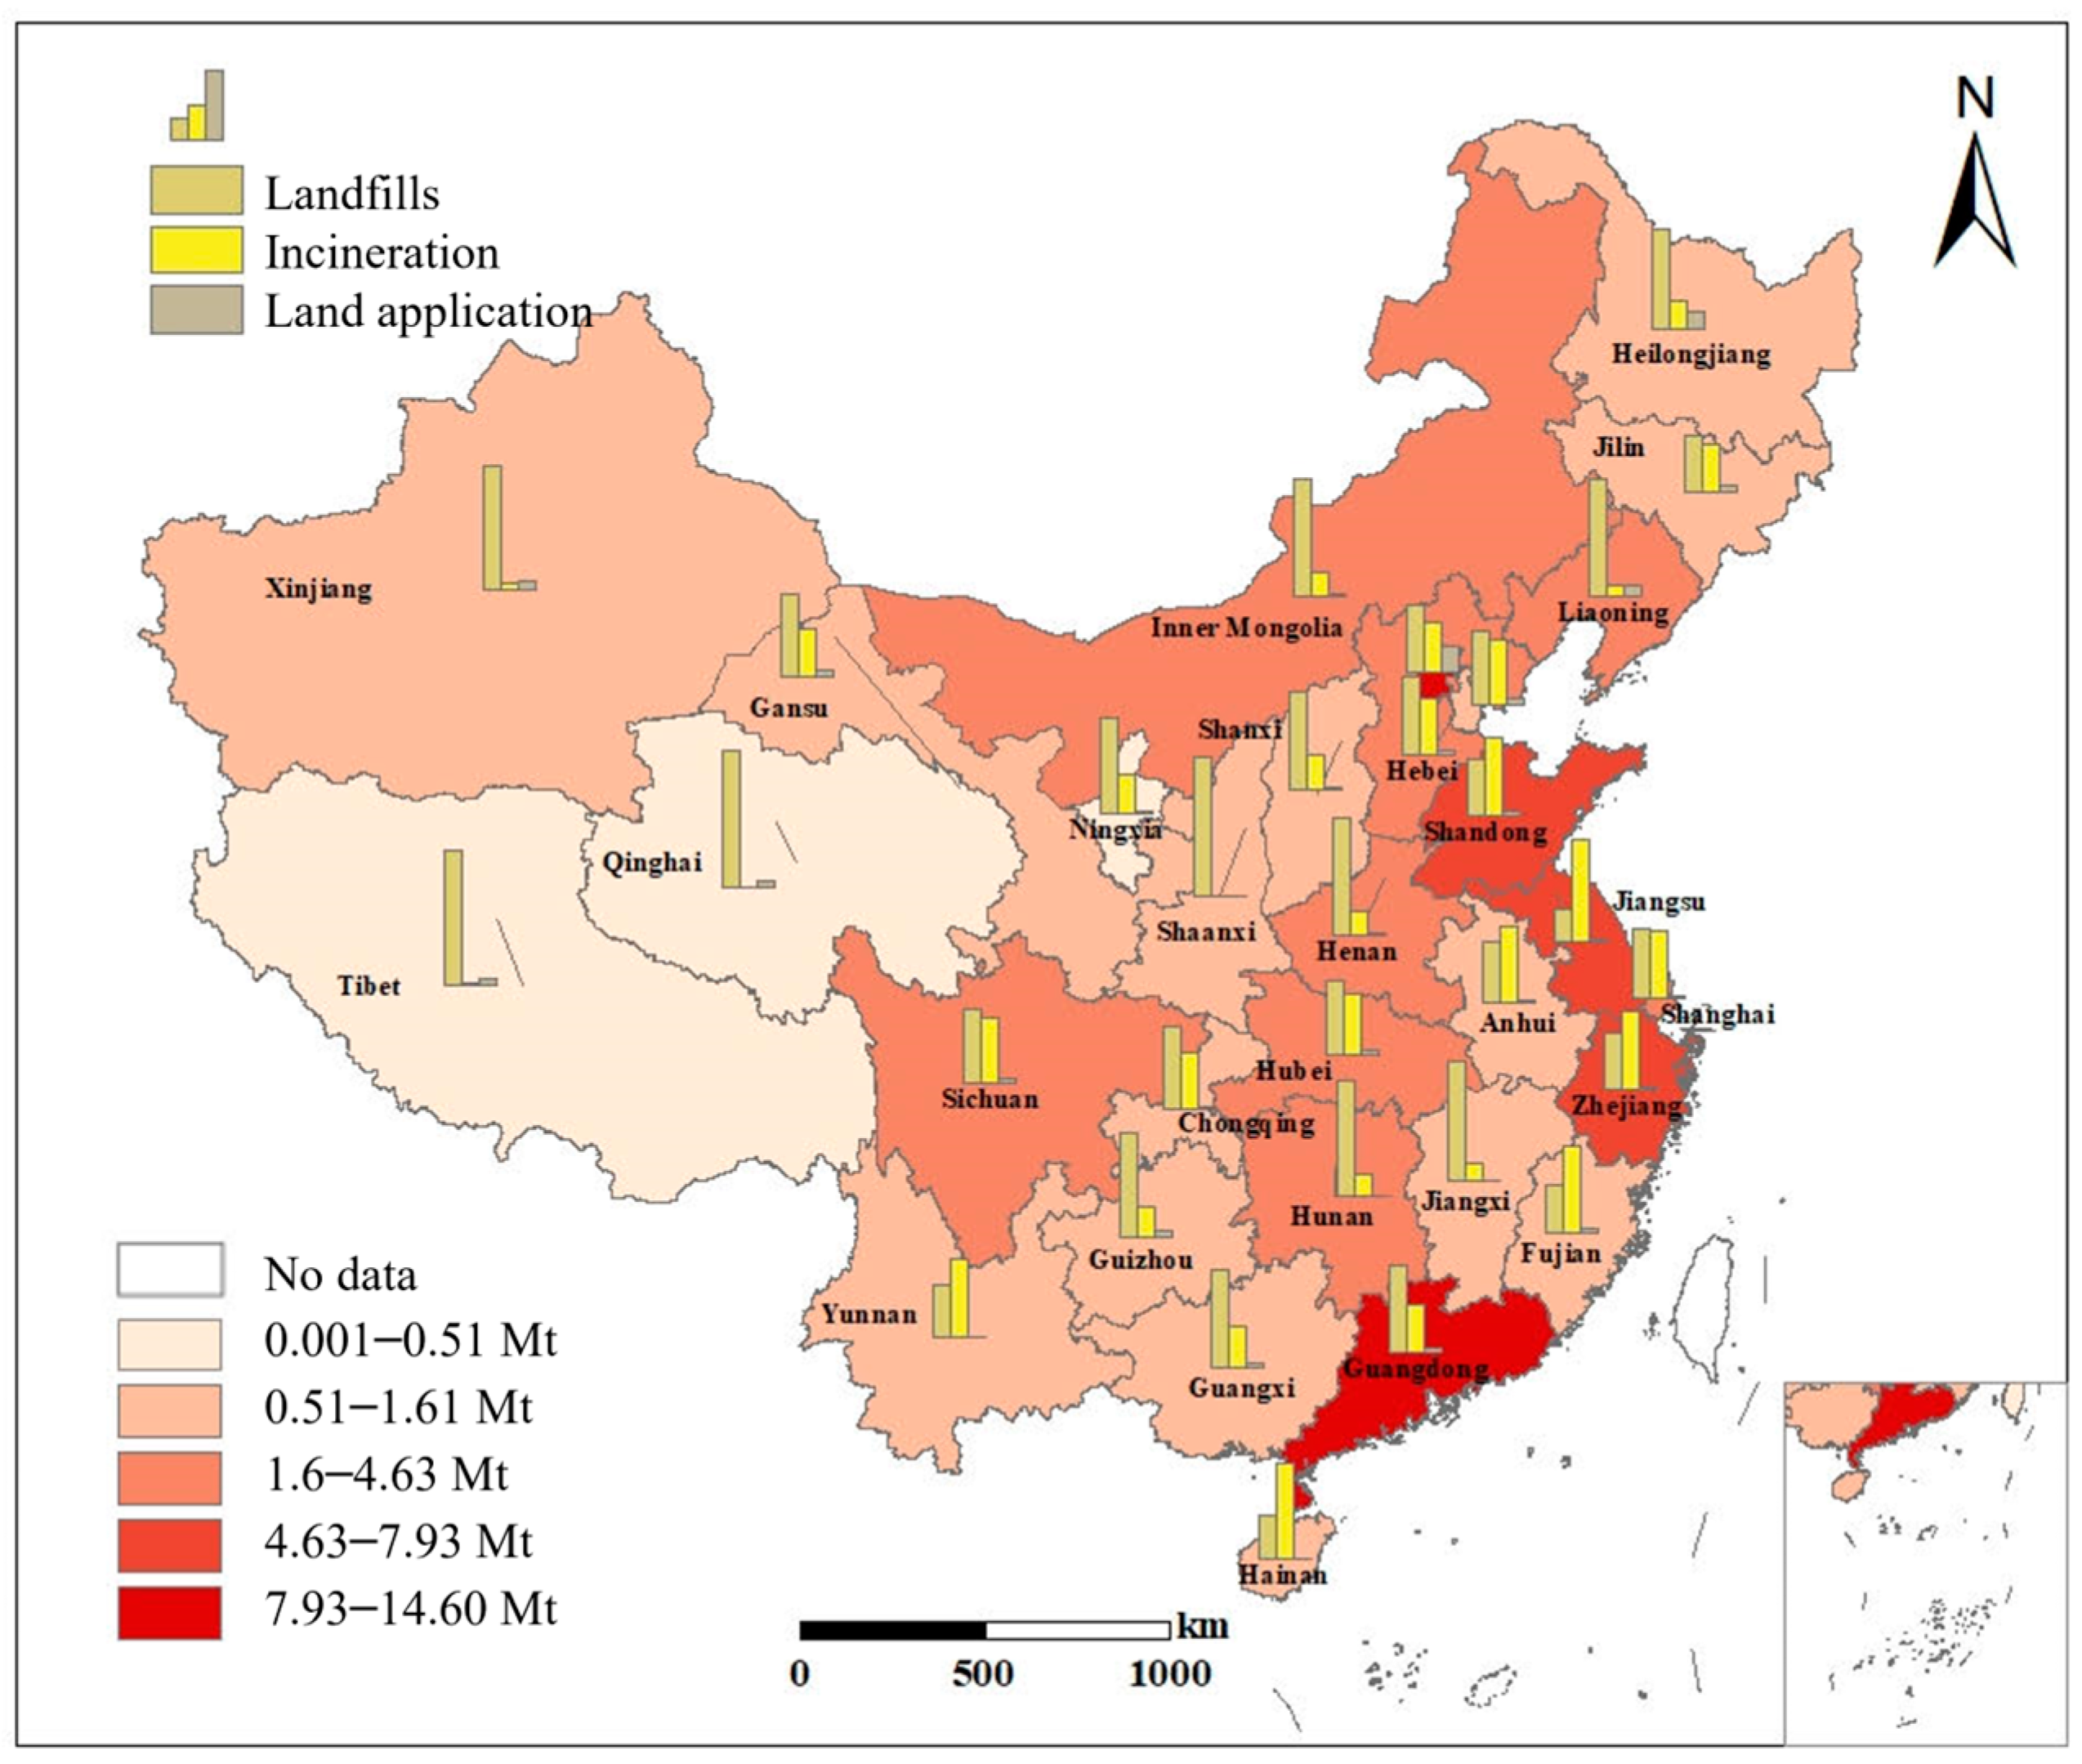
The amounts of processed sludge and the disposal techniques used in 31 Chinese provinces are shown in Figure 2 [9]. Guangdong, Beijing, and Zhejiang lead the domestic sludge treatment sector and process the most sludge, making up about 40% of the total volume treated nationwide. Landfills accounted for 56.5% of the sludge, the most common method and consistent with Zhang et al.’s [32] 50% estimate. Only 3.5% of the sludge was composted; over 40% was burned. Producers of large volumes of sludge and high GDP cities typically favor incineration because, despite greater fuel and equipment costs, it effectively decreases volume. Notably, Jiangyin, Wuxi, Shihezi, and Dali achieved a 100% incineration rate. In East China, incineration rates were particularly high, with Jiangsu at 74.2%, Fujian at 62.3%, Zhejiang at 56.7%, Anhui at 54.7%, and Shanghai at 48.6%. Additionally, Hainan and Yunnan exhibited significant incineration rates of 68.9% and 55.2%, respectively.

Figure 2.
Treated sludge produced in 31 provinces [20].
Conversely, provinces with over 50% landfills rates, particularly in northwest China, had rates exceeding 60%, with Shaanxi and Qinghai reaching 100% and 98.1%, respectively. This trend is attributed to the availability of extensive land resources and the relatively low costs associated with landfilling. Sludge composting was the least prevalent disposal method, with rates ranging from 0 to 17.3%, the highest being in Beijing, Heilongjiang, and Liaoning, with 17.3%, 12.6%, and 8.2%, respectively. These trends highlight regional disparities in sludge treatment methods and volumes, reflecting the economic, geographical, and infrastructural differences across China’s provinces, and emphasizing the need for tailored sludge management strategies to address regional challenges effectively [3].
3.2. Characteristics of Carbon Emission
In 2017, total GHG emissions from the sludge treatment industry was 18.54 Mt. Various countries reported that GHG emissions from the sludge treatment industry ranged from 0.15 to 1.2 t CO2-eq per functional unit (e.g., per ton of dry matter or per m3 of treated wastewater) [22,24,33,34,35,36]. The main contributors to these emissions include electricity consumption, direct emissions from treatment processes, and specific treatment methods, such as incineration, landfilling, and anaerobic digestion. The variations in reported emissions can be attributed to differences in treatment methods, energy sources, and country-specific factors. These findings underscore the need for considering local conditions and treatment practices when assessing the carbon footprint of sludge management and developing mitigation strategies.
Of the three sludge treatment techniques, incineration contributes the most to overall GHG emissions, as shown in Figure 3, with a total of 1011.53 kg CO2-eq/t DS. This is primarily because of the substantial CO2 emissions from incineration (897.56 kg CO2-eq), which are approximately 38% higher than the CO2 emissions from landfills (647.25 kg CO2-eq) and more than three times the CO2 emissions from land application (276.17 kg CO2-eq). Landfills has the second-highest total GHG emissions (717.51 kg CO2-eq), followed by land application (276.41 kg CO2-eq). The three approaches differ in the composition of greenhouse gas emissions and the contribution of various emission sources. This emphasizes the significance of taking these aspects into account when evaluating the environmental impact of sludge treatment. The reliance on coal in incineration, the high CH4 emissions from landfills, and the potential for emission offsets in land application are notable differences that should be considered when developing sustainable sludge management strategies.
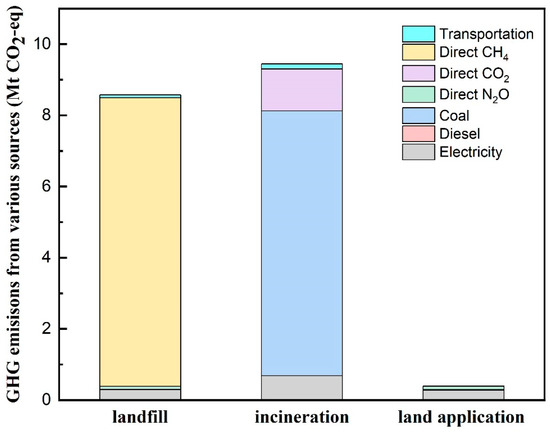
Figure 3.
GHG emission from various sources from three sludge treatment techniques.
The main GHG released by landfills is CO2, but they also release a substantial amount of CH4 (617.65 kg CO2-eq), which makes up 86.1% of their overall emissions. In contrast, CH4 emissions from incineration and land application are minimal (0.47 and 0.24 kg CO2-eq, respectively), representing only 0.05% and 0.09% of their total emissions, respectively. N2O emissions are relatively low for all three methods, with incineration having the highest N2O emissions at 113.10 kg CO2-eq (11.2% of total emissions), followed by landfills at 7.01 kg CO2-eq (0.98% of total emissions) and land application at 0.0002% of total emissions. The contributions of different emission sources vary among the treatment methods. Incineration heavily relies on coal, which contributes 7.44 kg CO2-eq to its total emissions, whereas coal is not applicable for landfills and land application. Land application, incineration, and landfills had the largest electricity use, which accounted for 0.01 kg, 0.09 kg, and 0.29 kg CO2-eq.
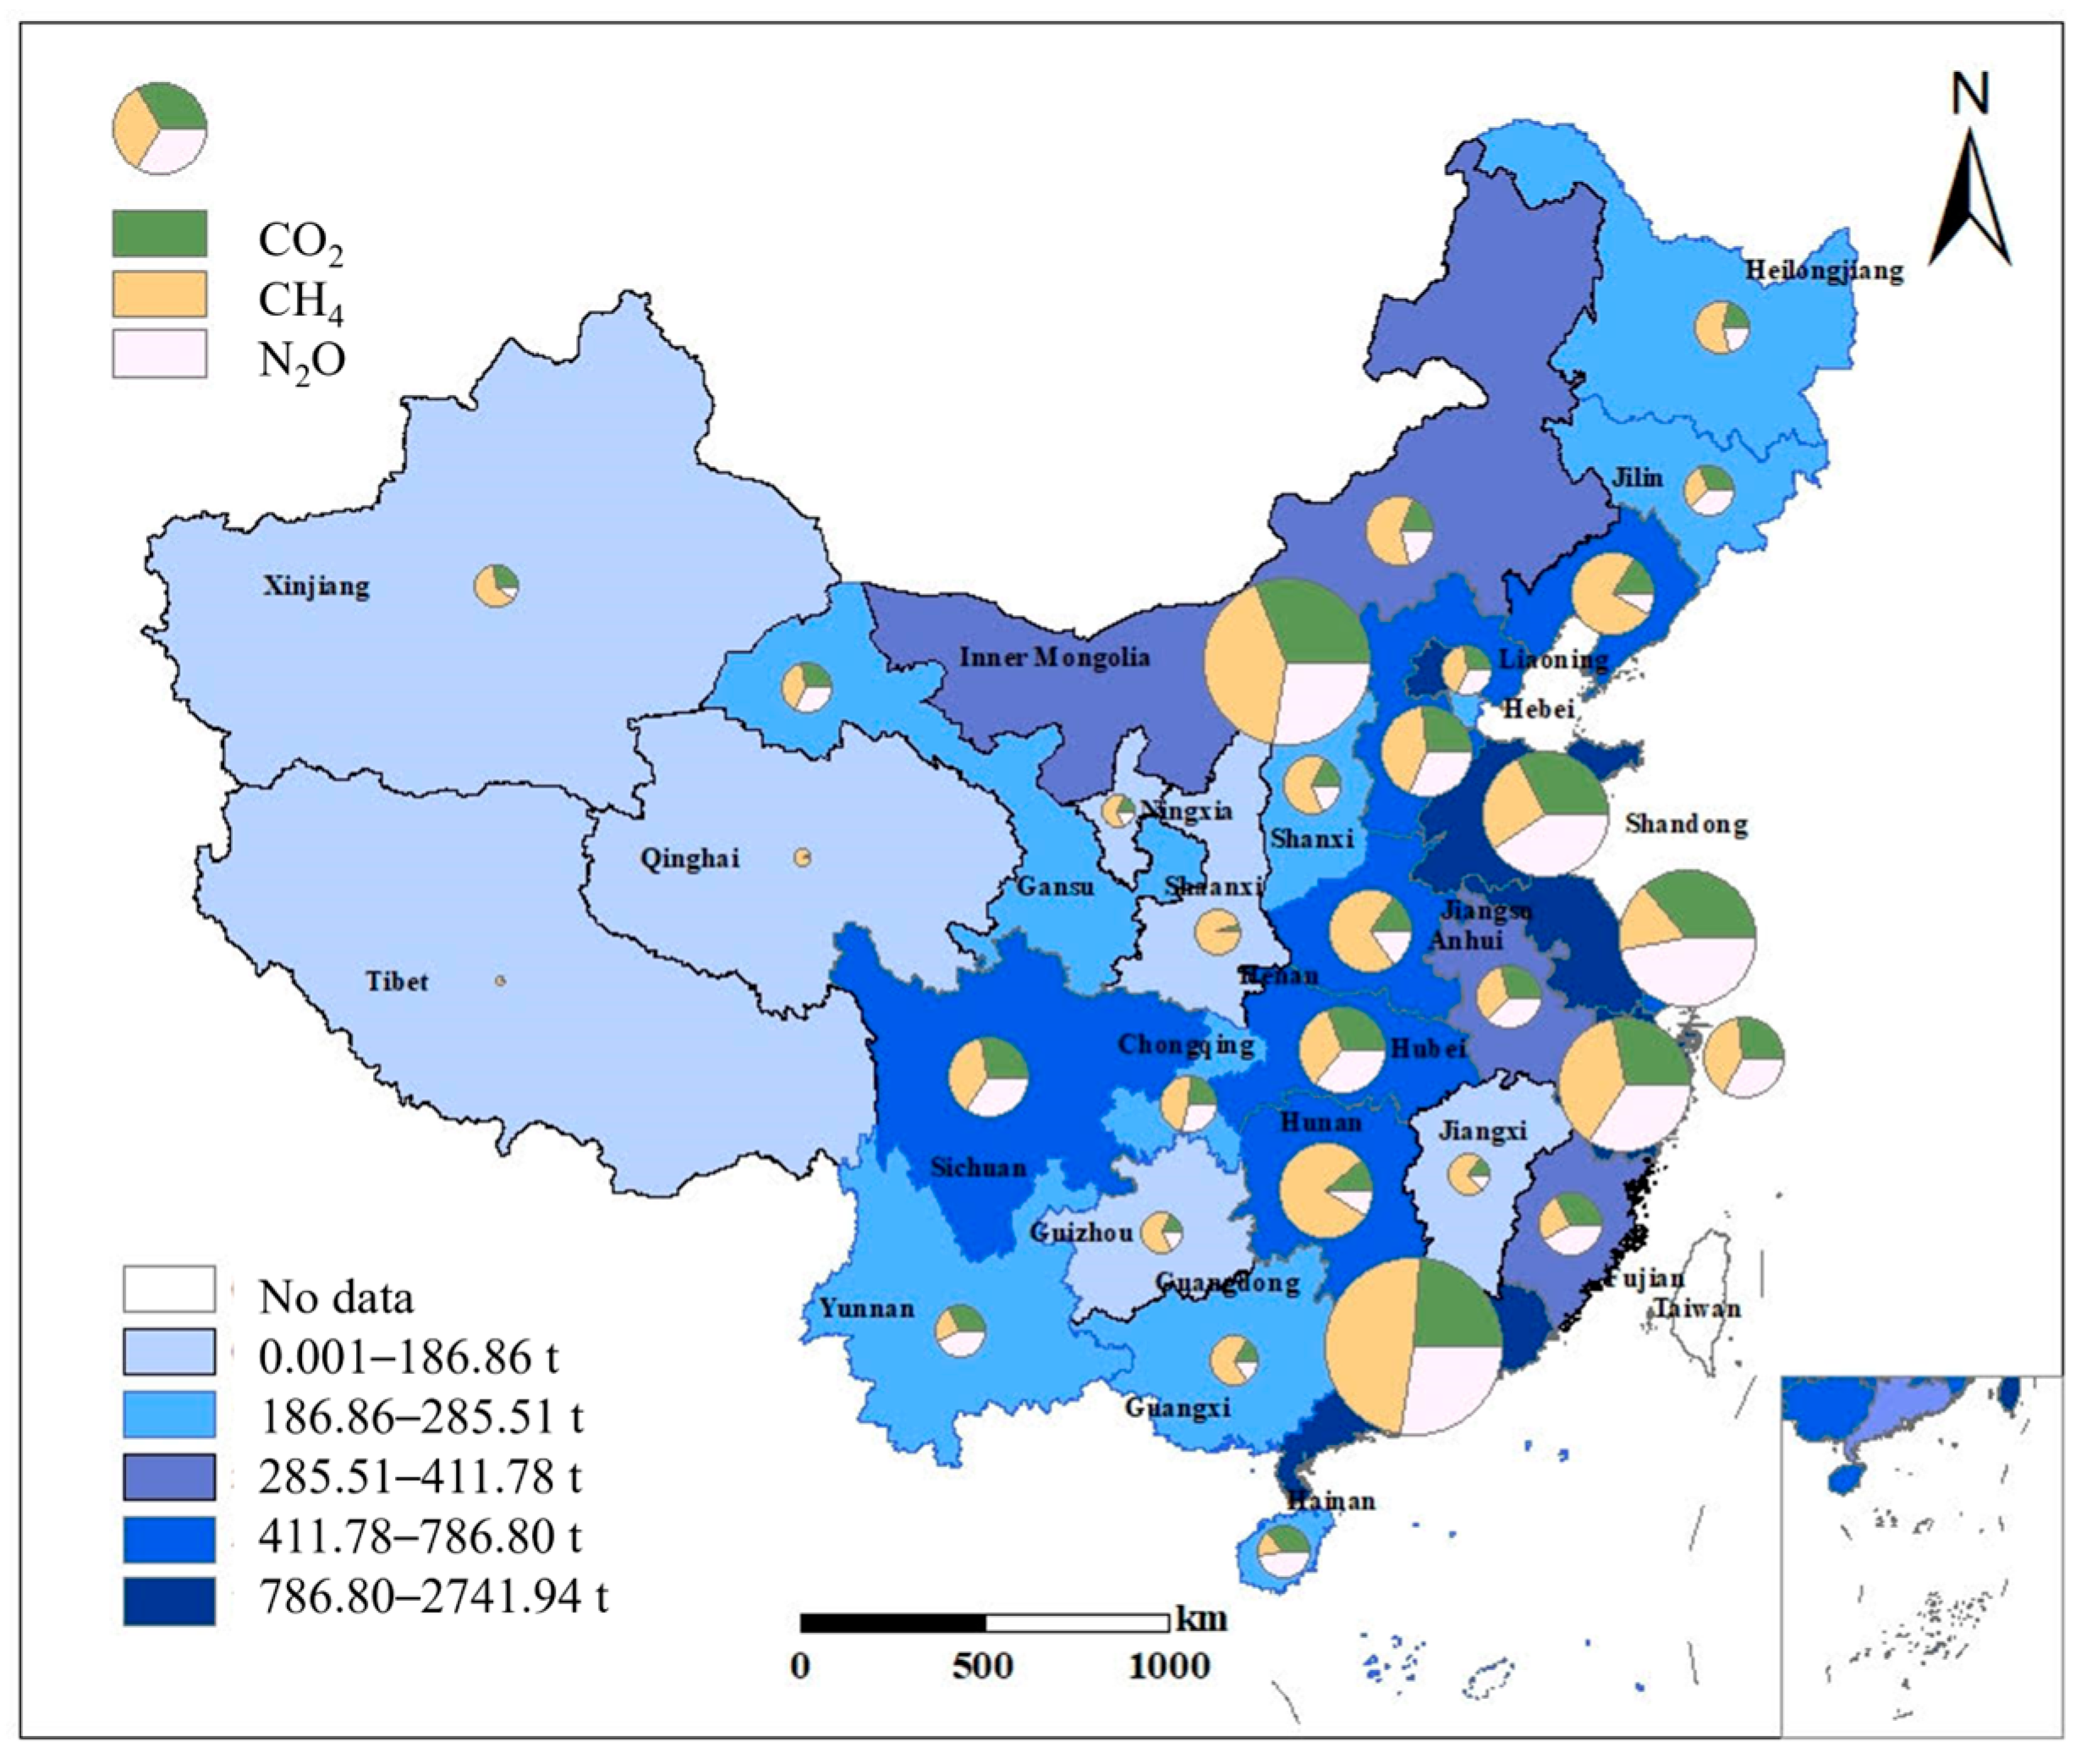
Figure 4 illustrates how the total GHG emissions from sludge treatment differ considerably throughout 31 provinces. Guangdong has the highest total emissions at 2741.94 t CO2-eq, followed by Zhejiang (1371.97 t CO2-eq) and Shandong (1367.49 t CO2-eq). In contrast, Tibet has the lowest total emissions at 22.87 t CO2-eq, followed by Qinghai (93.23 t CO2-eq) and Ningxia (145.73 t CO2-eq). The composition of GHG emissions also differs among provinces. CO2 is the primary contributor across all provinces, ranging from 56.7% to 91.6% of total emissions. Yunnan has the highest share of CO2 emissions at 91.6% (786.68 t CO2-eq), while Ningxia has the lowest at 56.7% (82.62 t CO2-eq). CH4 emissions vary more significantly among provinces, with Ningxia having the highest share at 36.75% (53.54 t CO2-eq) and Hainan the lowest at 10.25% (24.49 t CO2-eq). N2O emissions generally account for a smaller portion of total emissions, ranging from 0.03% in Tibet (0.01 t CO2-eq) to 6.64% in Shaanxi (18.80 t CO2-eq).
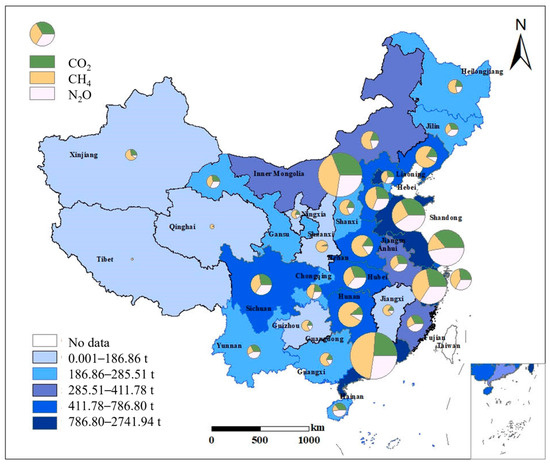
Figure 4.
Provincial GHG emission characteristics from sludge treatment sector.
Comparing the different greenhouse gases, CO2 emissions dominate across all provinces, with a total of 20,796.94 t CO2-eq. The top three provinces for CO2 emissions are Guangdong, Zhejiang, and Jiangsu, the emission from which were 1179.90, 1265.26, and 2562.98 t CO2-eq, respectively. CH4 emissions amount to 3502.17 t CO2-eq nationwide, with Guangdong (172.81 t CO2-eq), Shandong (135.95 t CO2-eq), and Jiangsu (117.80 t CO2-eq) being the top contributors. N2O emissions are comparatively lower, totaling 371.84 t CO2-eq. The provinces with the highest N2O emissions are Guangdong (52.23 t CO2-eq), Hubei (22.18 t CO2-eq), and Jiangsu (21.07 t CO2-eq).
At the regional level, the northern region has the highest total GHG emissions at 6176.14 t CO2-eq, followed by the eastern region (5836.77 t CO2-eq) and the central region (5209.68 t CO2-eq). The northeastern and northwestern regions have significantly lower emissions at 1520.52 and 1122.65 t CO2-eq, respectively. CO2 emissions are the main contributors across all regions, with the northern region emitting 5148.80 t CO2-eq, followed by the eastern region (4969.63 t CO2-eq) and the central region (4418.78 t CO2-eq). The northern region also leads in CH4 emissions (902.83 t CO2-eq), followed by the eastern region (774.10 t CO2-eq) and the central region (726.02 t CO2-eq). N2O emissions are highest in the northern region (124.51 t CO2-eq), followed by the eastern region (93.04 t CO2-eq) and the central region (64.88 t CO2-eq). With 4195.72, 568.49, and 40.98 t CO2-eq emitted from CO2, CH4, and N2O, the southern region came in fourth place overall in terms of emissions (4805.19 t CO2-eq). Table 2 presents the three types of GHG emissions from seven regions.
Table 2.
Regional GHG emissions of China (Unit: t CO2-eq).
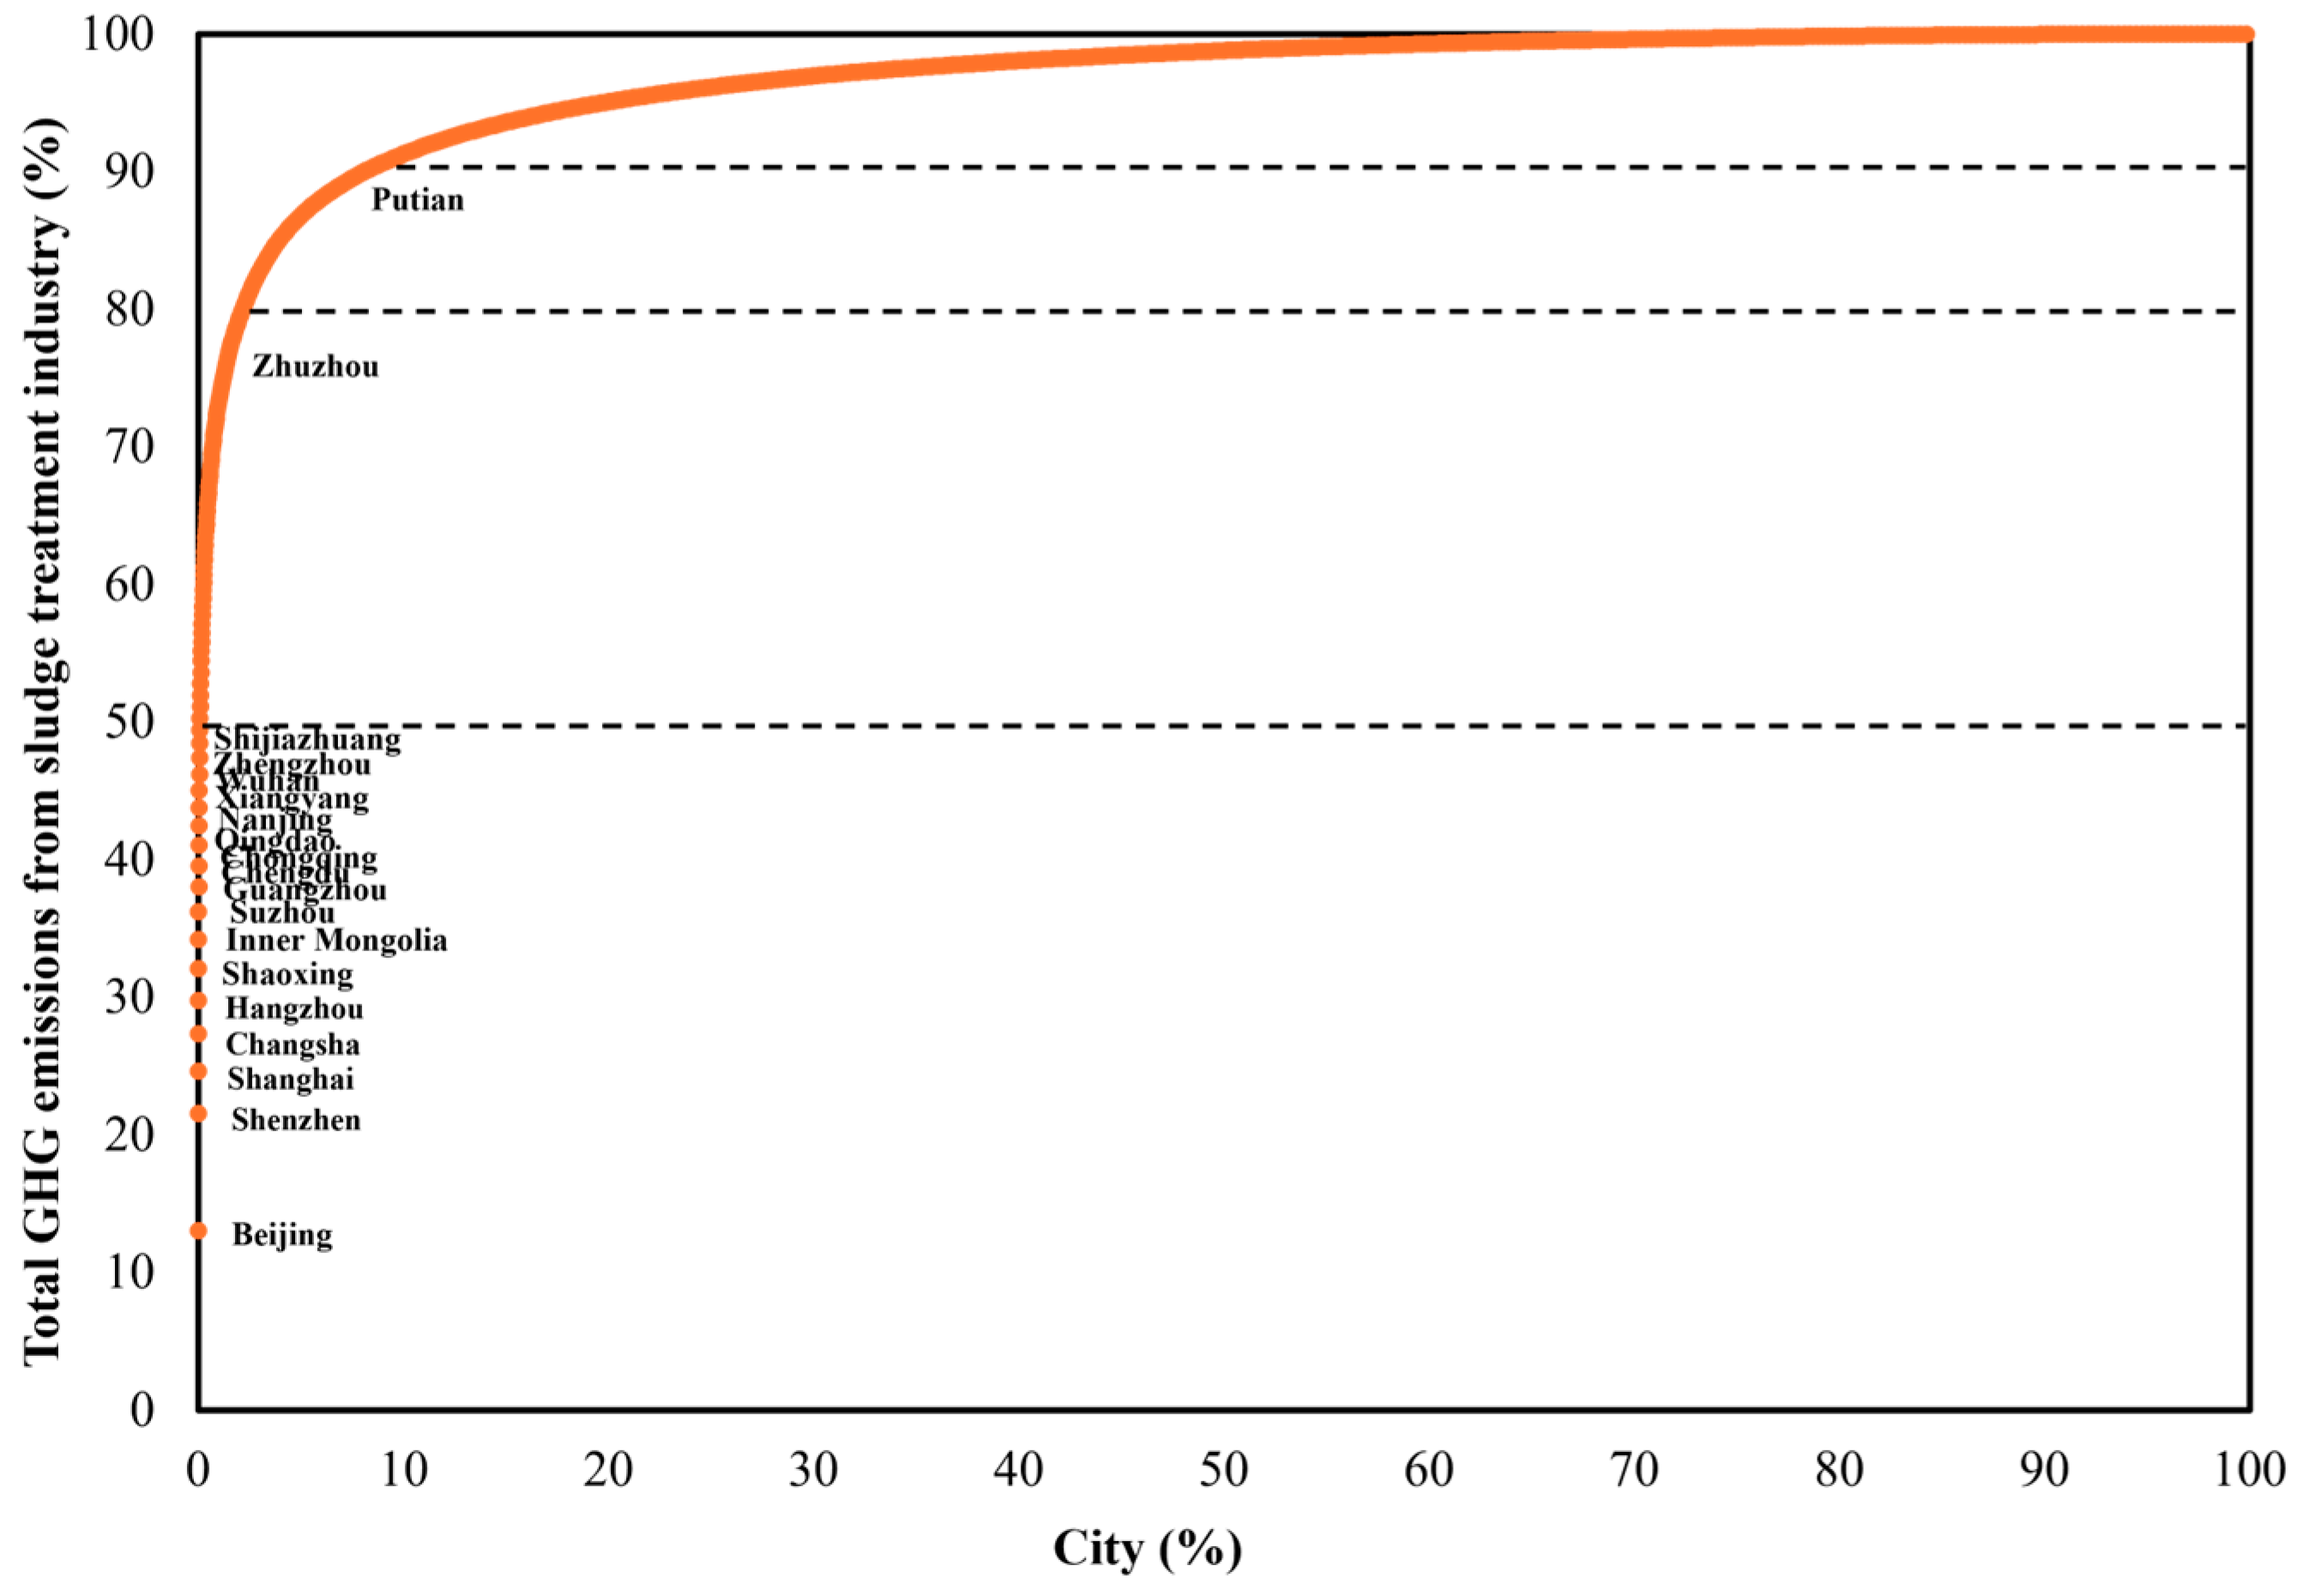
A Lorenz curve illustrating the cumulative percentage of China’s sludge treatment industry’s total GHG emissions across 660 cities is shown in Figure 5. The results reveal a highly uneven distribution of emissions among cities, with a small number of cities contributing to a significant portion of the total emissions. Interestingly, seven cities (approximately 1% of the total) account for a staggering 34.2% of the total GHG emissions. These cities are Beijing, Shenzhen, Shanghai, Changsha, Hangzhou, Shaoxing, and Inner Mongolia. More broadly, 90% of the total emissions come from the top 188 cities, which account for 28.5% of the total. Furthermore, just eighteen cities account for half of these emissions, which include the aforementioned seven cities, along with Suzhou, Guangzhou, Chengdu, Chongqing, Qingdao, Nanjing, Xiangyang, Wuhan, Tianjin, Zhengzhou, and Shijiazhuang.
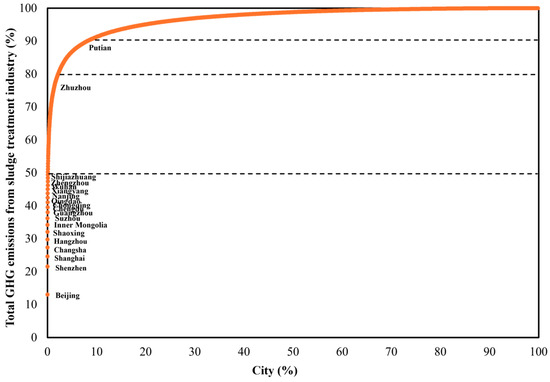
Figure 5.
Distributions of GHG emissions at city level.
According to the study, the urban sewage treatment sector releases 0.11 Mt CO2-eq of GHGs on average, with 77.3% of cities emitting between 0.0001 and 0.10 Mt CO2-eq. Remarkably, more than 20 percent of all emissions are attributed to the top 1% of cities, which are primarily huge metropolitan centers. With 4.26 Mt CO2-eq (5.8% of the total), Beijing was the biggest emitter. These cities—which are either economically developed coastal towns or those under direct federal government control—have sizable populations, high GDP, and developed businesses, which raises the amount of wastewater produced and greenhouse gas emissions. Of the total emissions, 60% are produced by the following 167 cities, which are ranked from the top 1.1% to 26.3%, with 43.83 Mt CO2-eq emissions. Ataylor, Urumqi, Kunming, Honghe, Yinchuan, Lanzhou, Xining, Deyang, Mianyang, Nanchong, and Leshan are among the cities that are primarily located in Eastern China; a smaller number of them are in Western China. The remaining 486 cities, which are mostly in the northwest and southeast and are less developed or urbanized, account for only 20% of all GHG emissions.
Mitigation efforts should concentrate on cities with larger GHG outputs to rectify this gap in emissions. Energy recovery technologies can be used to improve WWTPs and potentially balance their operating energy demands while lowering off-site greenhouse gas emissions. Thermal conversion technology can reduce the volume of sludge and greenhouse gas emissions in cities that produce a lot of sludge. For instance, a carbonization co-digestion sludge system with biochar can produce a net energy gain of 219 GJ, zero N2O emissions, and a 25% reduction in GHG emissions [37]. Additionally, if the volatile solids to total solids (VS/TS) ratio is greater than 63%, integrated pyrolysis systems can produce a net energy output. Nevertheless, these cutting-edge technologies are still in the research and development phase and need significant funding and, thus, wealthy cities with higher GDP and fixed investment.
3.3. Impacts of GHG Emissions
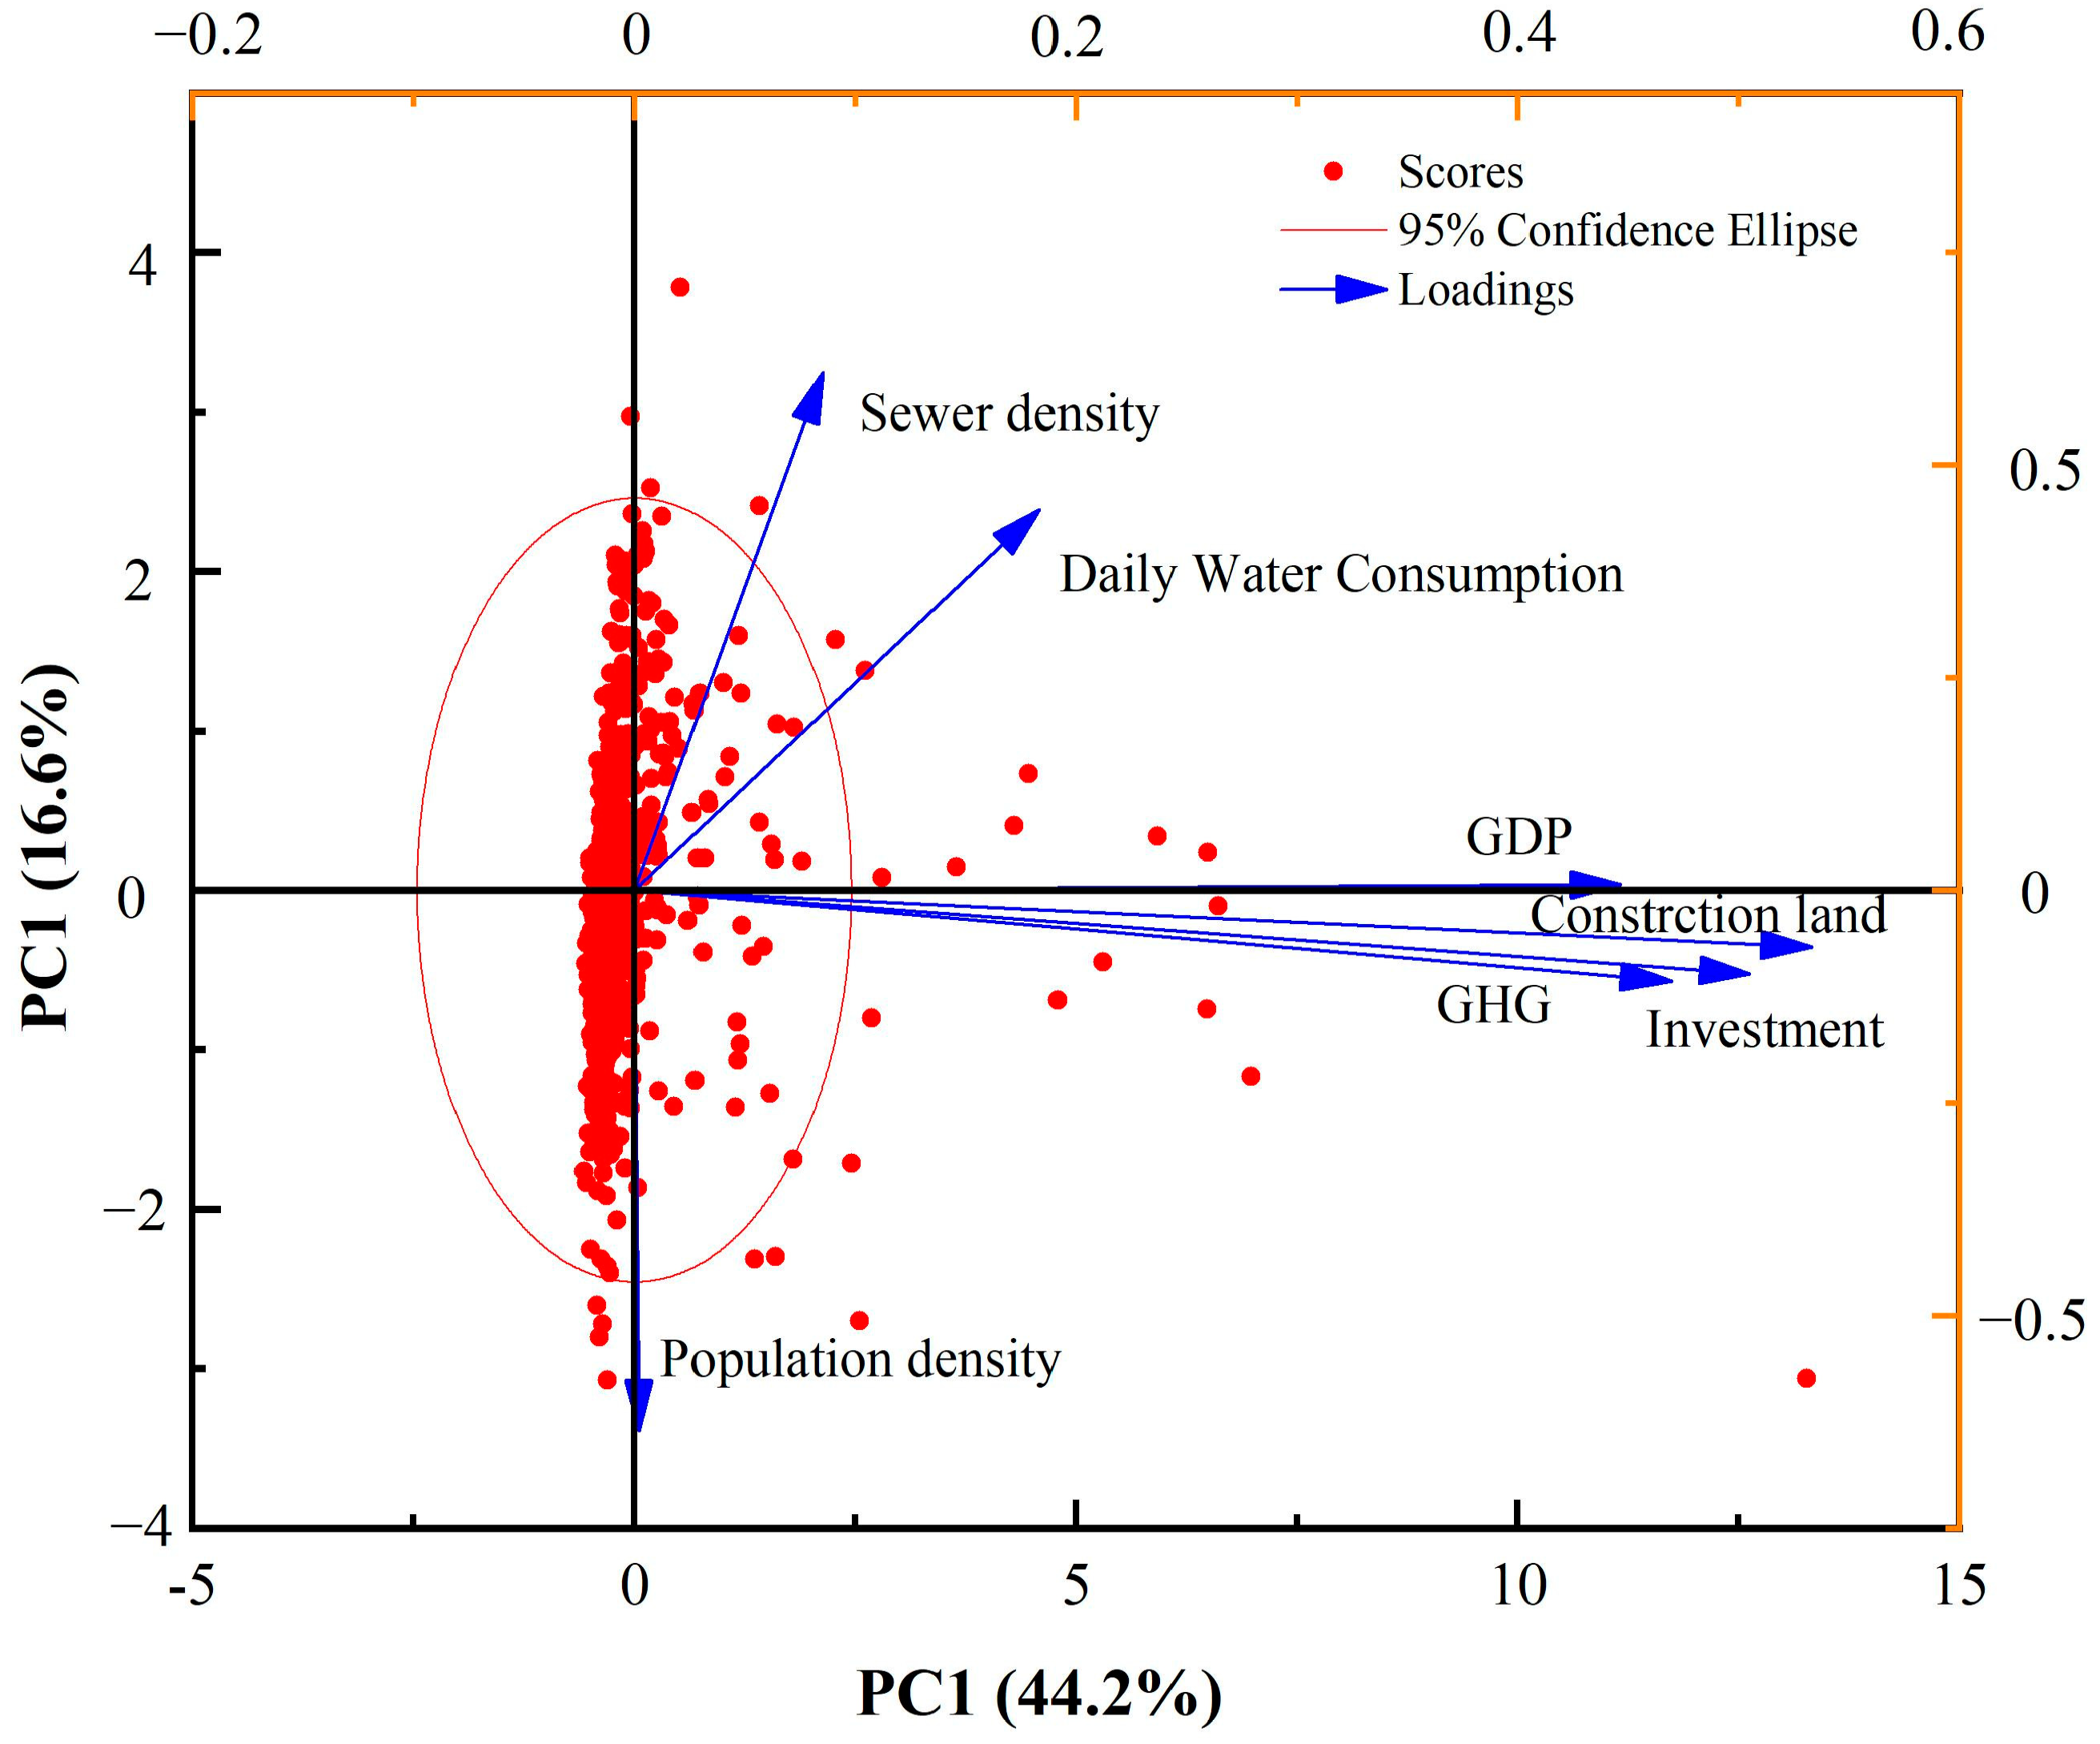
Plots of loading data using PCA show how different parameters affect GHG emissions from the sludge treatment sector. PC1 and PC2 account for 60.8% of the variance in the input data, highlighting their significance in comprehending GHG emissions across various urban areas, as shown in Figure 6. Indicators such as GDP, daily water consumption, and construction land, located in the first quadrant, positively affect total GHG emissions, suggesting that higher values of these indicators correlate with increased emissions. Specifically, GDP and treated sludge show the highest correlations with GHG emissions, reflecting the impact of economic and treatment scale factors. Sewer density and population density primarily influence PC2, but in opposite directions, with higher sewer density linked to increased emissions and higher population density showing a mitigating effect. Super first-tier cities with considerable treatment infrastructure and economic activities, such as Beijing, Shanghai, and Shenzhen, are highly impacted by GDP and treated quantities of wastewater and sludge. Tianshui and Sanya are notably affected by sewer and population densities, respectively, due to their unique geographic and demographic characteristics. To reduce GHG emissions, especially in affluent cities, adopting novel technologies like sludge pyrolysis and wet oxidation can effectively reduce sludge volume and emissions.
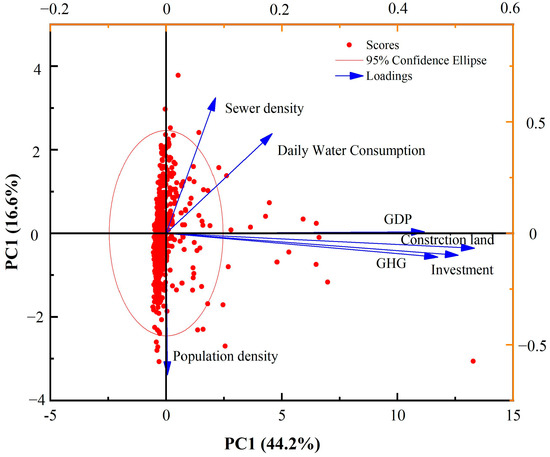
Figure 6.
Principal component analysis.
4. Potential of GHG Emission Mitigation
To minimize the carbon footprint of sludge treatment technology, evaluation and optimization are essential if China is to meet its 2060 carbon neutrality target. This analysis focuses on the GHG emission mitigation potential and cost analysis of various sludge treatment methods, including thermal conversion technologies (pyrolysis, gasification, and incineration), AD, hydrothermal processes (HTP), and wet oxidation (WO). Table 3 shows the comparison of reduction potential and cost analysis of these sludge treatment technologies. Since the actual GHG emission reductions can vary based on a number of factors, including the particular process setup, operating conditions, and the makeup of the sludge, the reduction potential values are shown as ranges. The ranges are derived from a comprehensive review of relevant literature and case studies.
Table 3.
Comparison of GHG reduction potential, costs, and characteristics of various sludge treatment processes.
Although incineration is a popular sludge treatment technique, it produces the most greenhouse gas emissions because it requires a large amount of coal and electricity for drying [41]. The volume of sludge and net greenhouse gas emissions can also be decreased by other thermal methods, such pyrolysis, gasification, and carbonization [12,37]. These techniques, which are primarily used in laboratories, necessitate drying sludge to a moisture level of around 30%, which increases energy and chemical consumption. The necessity for continuous manufacture of high-calorific-value products is highlighted by the fact that a 15% loss of energy and material recovery during pyrolysis results in additional emission of 195.96 kg CO2-eq [40]. By comparison, compared to incineration, gasification can lower greenhouse gas emissions by 0.33 to 0.46 t CO2-eq/t DS [33].
A potential way to boost methane production is to combine advanced AD with thermal hydrolysis, which results in a net energy output of 372 kWh per ton of DS [42]. These systems have the potential to meet energy requirements in wastewater treatment facilities by producing biogas from 60% to 70% of organic matter [7]. With expenses ranging from $100 to $200 USD per ton, activated sludge lowers GHG emissions by 0.09 to 0.3 tons of CO2-eq per ton of dry solids in comparison to traditional sludge treatments [15,38].
Hydrothermal approaches, such as advanced thermal hydrolysis (ATH) and HTP, offer efficient sludge treatment and resource recovery. However, hydrolysis produces a large amount of carbon emissions due to its energy-intensive nature. There are several ways that hydrothermal treatment can lower emissions; two of these methods can reduce emissions by 75.55 and 44.5 kg CO2-eq, respectively. Comparatively, a 15% increase in resource and energy efficiency would result in a 194.04 and 181.98 kg CO2-eq decrease in the potential for global warming, respectively [40,43]. In comparison to incineration, HTP can further reduce GHG emissions by 0.2 to 0.4 tons CO2-eq per ton of dry solids, though the cost per ton ranges from $300 to $500 USD [34,38].
Another practical method for reducing greenhouse gas emissions during sludge drying is WO. This method drastically lowers the amount of sludge in the liquid phase by quickly oxidizing the organic materials in the sludge. Depending on the kind of sludge and the operating environment, WO can remove more than 80% of the chemical oxygen demand (COD) [5]. The standard WO conditions are 180–315 °C, 2–15 MPa pressure, and 15–120 min of residence time [7]. The main determinant is temperature, which is followed by oxygen partial pressure and residence duration. Furthermore, WO facilitates the recovery of beneficial byproducts that can be utilized again in biological treatments at WWTPs, such as nitrogen, phosphorus, and acetic acid. Compared to incineration, WO can reduce GHG emissions by 0.1 to 0.3 tons CO2-eq per ton of dry solids, operating expenses per ton ranging from $150 to $300 USD [5,7].
The results of the LCA show that creative approaches to sludge treatment can significantly improve the environment by efficiently using resources. To beat conventional approaches in reducing pollution and carbon emissions, they still require advancements. Creating clean chemicals based on resources, choosing environmentally friendly heat sources, and improving heat recovery systems are examples of promising approaches. These upgrades have the potential to greatly increase these technologies’ capacity to reduce carbon emissions [40,43]. While thermal conversion technologies, AD, hydrothermal processes, and wet oxidation offer potential for GHG emission mitigation in sludge treatment, further research and optimization are necessary to enhance their environmental performance and economic feasibility. The cost analysis reveals that AD is the most cost-effective option, followed by wet oxidation, pyrolysis, gasification, and HTP. However, the actual costs may vary depending on factors such as plant scale, location, local regulations, and market conditions. China’s carbon neutrality aim can be substantially aided by the sludge treatment industry’s adoption of optimization tactics and the application of these technologies.
The total potential GHG emission reductions for the 660 cities are as follows: gasification (2.45–3.42 Mt CO2-eq), AD (1.67–5.57 Mt CO2-eq), HTP (1.49–2.97 Mt CO2-eq), WO (0.74–2.23 Mt CO2-eq), and pyrolysis (1.11–2.23 Mt CO2-eq). Cities with large sludge volumes currently relying on incineration, such as Beijing, Shanghai, and Shenzhen, have the highest potential for GHG emission reductions. For example, implementing gasification in these cities could reduce emissions by 0.15–0.21, 0.12–0.17, and 0.09–0.13 Mt CO2-eq, respectively. Of all the cities, AD has the largest potential for reducing emissions overall, with a reduction of 1.67–5.57 Mt CO2-eq. This is because of the applicability to a wide range of sludge treatment methods and its relatively high reduction potential compared to conventional methods. HTP and WO also show significant emission reduction potentials, particularly for cities currently relying on incineration, offering a more sustainable alternative with lower GHG emissions. Pyrolysis has a moderate emission reduction potential, but actual performance can differ based on particular treatment circumstances as well as the effectiveness of material and energy recovery.
Implementing these novel sludge treatment technologies in the 660 Chinese cities could reduce total GHG emissions from sludge treatment by 15–40%, demonstrating their significant potential for mitigating emissions and contributing to China’s carbon neutrality goals. However, the actual reductions achieved will depend on factors such as technology optimization, local conditions, and policy support. By providing specific emission reduction potentials for each technology and city, this analysis offers a more granular understanding of the opportunities for mitigating GHG emissions in China’s sludge treatment industry, enabling policymakers and stakeholders to prioritize investments and develop targeted strategies for promoting the adoption of sustainable sludge management practices.
5. Conclusions
This research offers a thorough evaluation of China’s GHG emissions originating from the sludge treatment sector and investigates the mitigation potential of GHGs of novel technologies and advancing sustainable sludge management techniques. The overall GHG emissions from sludge treatment in 2017 were approximated at 18.54 Mt CO2-eq, with the primary contributor being incineration (10,011.53 kg CO2-eq/t DS), followed by landfillss (717.51 kg CO2-eq/t DS) and land application (276.41 kg CO2-eq/t DS). The spatial distribution of emissions across 660 cities reveals significant regional disparities, with the top 1% of cities accounting for 34.2% of the total emissions, highlighting the need for targeted mitigation strategies in high-emission areas. The study also identifies the key drivers of GHG emissions in the sludge treatment industry, with economic factors such as GDP and treatment scale playing a significant role. Novel sludge treatment technologies, including thermal conversion, anaerobic digestion, hydrothermal processes, and wet oxidation, demonstrate potential for reducing GHG emissions by 0.09–0.46 t CO2-eq/t DS compared to conventional methods. Implementing these novel technologies in the 660 Chinese cities could reduce total GHG emissions from sludge treatment by 15–40%, demonstrating their significant potential for mitigating emissions and contributing to carbon mitigation goals. Implementing novel technologies, adopting optimization strategies, and promoting policy incentives would encourage the adoption of sustainable sludge management practices. Future research should focus on refining the life-cycle assessment methodology, incorporating more granular data on regional sludge treatment practices, and evaluating the long-term environmental and economic impacts of novel technologies.
Author Contributions
Conceptualization, D.H. and S.L.; methodology, D.H.; software, D.H. and P.J.; validation, D.H. and S.L.; formal analysis, D.H. and S.L.; investigation, P.J., Y.C. and S.L.; resources, D.H. and S.L.; data curation, D.H. and S.L.; writing—original draft preparation, D.H.; writing—review and editing, D.H., P.J., Y.C., F.G. and S.L.; visualization, D.H., P.J., Y.C., F.G. and S.L.; supervision, D.H. and S.L.; project administration, S.L.; funding acquisition, F.G. All authors have read and agreed to the published version of the manuscript.
Funding
This research was funded by Zhejiang Provincial Natural Science Foundation of China, grant number: LZ21E060002.
Data Availability Statement
The data presented in this study are openly available in Statistical Yearbook of Urban Construction, 2017 [20].
Acknowledgments
The authors are grateful to the anonymous reviewers for their insightful comments and suggestions on our work.
Conflicts of Interest
Author Peng Jiang is employed by the company Shenzhen Gas Corporation Ltd. The remaining authors declare that the research was conducted in the absence of any commercial or financial relationships that could be construed as a potential conflict of interest.
References
- Xu, Y.; Liu, R.; Yang, D.; Dai, X. Sludge treatment and resource recovery towards carbon neutrality in China: Current status and future perspective. Blue-Green Syst. 2021, 3, 119–127. [Google Scholar] [CrossRef]
- Statistical Yearbook of Urban Construction, 2021; Ministry of Ecology and Environment of China: Beijing, China, 2021.
- Wei, L.; Zhu, F.; Li, Q.; Xue, C.; Xia, X.; Yu, H.; Zhao, Q.; Jiang, J.; Bai, S. Development, current state and future trends of sludge management in China: Based on exploratory data and CO2-equivaient emissions analysis. Environ. Int. 2020, 144, 106093. [Google Scholar] [CrossRef]
- Lv, N.; Wang, B.; Wang, H.; Xiao, T.; Dong, B.; Xu, Z. The occurrence characteristics, removal efficiency, and risk assessment of polycyclic aromatic hydrocarbons in sewage sludges from across China. Chemosphere 2024, 351, 141033. [Google Scholar] [CrossRef] [PubMed]
- Liu, Y.; Li, B.; Guo, D.; Munir, M.T.; Song, L.; Wu, X.; Huang, Y. Feasibility of using different hydrothermal processes for sewage sludge management in China. Sci. Total Environ. 2022, 838, 156154. [Google Scholar] [CrossRef] [PubMed]
- Guo, S.; Huang, H.; Dong, X.; Zeng, S. Calculation of greenhouse gas emissions of municipal wastewater treatment and its temporal and spatial trend in China. Water Wastewater Eng. 2019, 45, 56–62. (In Chinese) [Google Scholar]
- Guo, D.; Li, B.; Yu, W.; Han, J.-C.; Zhou, Y.; Ye, Z.; Wu, X.; Young, B.; Huang, Y. Revisiting China’s domestic greenhouse gas emission from wastewater treatment: A quantitative process life-cycle assessment. Sci. Total Environ. 2023, 876, 162597. [Google Scholar] [CrossRef]
- Ding, A.; Zhang, R.; Ngo, H.H.; He, X.; Ma, J.; Nan, J.; Li, G. Life cycle assessment of sewage sludge treatment and disposal based on nutrient and energy recovery: A review. Sci. Total Environ. 2021, 769, 144451. [Google Scholar] [CrossRef]
- Xi, J.; Gong, H.; Zhang, Y.; Dai, X.; Chen, L. The Evaluation of GHG Emissions from Shanghai Municipal Wastewater Treatment Plants Based on IPCC and Operational Data Integrated Methods (ODIM). Sci. Total Environ. 2021, 797, 148967. [Google Scholar] [CrossRef] [PubMed]
- Kumar, A.; Thanki, A.; Padhiyar, H.; Singh, N.K.; Pandey, S.; Yadav, M.; Yu, Z.-G. Greenhouse gases emission control in WWTS via potential operational strategies: A critical review. Chemosphere 2021, 273, 129694. [Google Scholar] [CrossRef]
- Tarpani, R.R.Z.; Azapagic, A. Life cycle sustainability assessment of advanced treatment techniques for urban wastewater reuse and sewage sludge resource recovery. Sci. Total Environ. 2023, 869, 161771. [Google Scholar] [CrossRef]
- Zhou, H.; Zhang, W.; Li, L.; Zhang, M.; Wang, D. Environmental impact and optimization of lake dredged-sludge treatment and disposal technologies based on life cycle assessment (LCA) analysis. Sci. Total Environ. 2021, 787, 147703. [Google Scholar] [CrossRef]
- Nkuna, S.G.; Olwal, T.O.; Chowdhury, S.D.; Ndambuki, J.M. A review of wastewater sludge-to-energy generation focused on thermochemical technologies: An improved technological, economical and socio-environmental aspect. Clean. Waste Syst. 2024, 7, 100130. [Google Scholar] [CrossRef]
- Janaszek, A.; da Silva, A.F.; Jurišević, N.; Kanuchova, M.; Kozáková, Ľ.; Kowalik, R. The Assessment of Sewage Sludge Utilization in Closed-Loop Economy from an Environmental Perspective. Water 2024, 16, 383. [Google Scholar] [CrossRef]
- Yuan, H.; Zhai, S.; Fu, H.; Li, Z.; Gao, D.; Zhu, H. Environmental and economic life cycle assessment of emerging sludge treatment routes. J. Clean. Prod. 2024, 449, 141792. [Google Scholar] [CrossRef]
- Huang, D.; Wu, Y.; Zhang, L.; Tang, Y.; Liu, C.; Zhang, R.; Wang, Y.; Gao, Y. Life cycle assessment of sewage sludge treatment and disposal technologies based on carbon emissions and environmental impacts. Environ. Technol. 2024. [Google Scholar] [CrossRef] [PubMed]
- Ferrentino, R.; Langone, M.; Fiori, L.; Andreottola, G. Full-Scale Sewage Sludge Reduction Technologies: A Review with a Focus on Energy Consumption. Water 2023, 15, 615. [Google Scholar] [CrossRef]
- Di Fraia, S.; Massarotti, N.; Vanoli, L.; Costa, M. Thermo-economic analysis of a novel cogeneration system for sewage sludge treatment. Energy 2016, 115, 1560–1571. [Google Scholar] [CrossRef]
- Wang, Z.; Li, X.; Liu, H.; Li, J.; Vodnar, D.C.; Lin, C.S.K.; Wang, Q. Life cycle assessment of traditional and innovative sludge management scenarios in Australia: Focusing on environmental impacts, energy balance, and economic benefits. Resour. Conserv. Recycl. 2024, 204, 107496. [Google Scholar] [CrossRef]
- SYUC Statistical Yearbook of Urban Construction. 2018. Available online: https://www.mohurd.gov.cn/file/old/2020/20200327/w02020032722244243052500000.xls (accessed on 6 January 2018).
- Ministry of Ecological Environment. 2017. Available online: http://www.tanjiaoyi.com/article-25419-1.html (accessed on 21 December 2018).
- Shrestha, A.; Bhattarai, T.N.; Ghimire, S.; Mainali, B.; Treichel, H.; Paudel, S.R. Estimation of greenhouse gases emission from domestic wastewater in Nepal: A scenario-based analysis applicable for developing countries. Chemosphere 2022, 300, 134501. [Google Scholar] [CrossRef]
- Yin, Z.; Toucai, Z.; Hongjiang, L. Predictive method research of sludge landfills gas production. China Environ. Sci. 2010, 30, 204–208. (In Chinese) [Google Scholar]
- Hong, J.; Hong, J.; Otaki, M.; Jolliet, O. Environmental and economic life cycle assessment for sewage sludge treatment processes in Japan. Waste Manag. 2009, 29, 696–703. [Google Scholar] [CrossRef]
- IPCC. 2007 IPCC Guidelines for National Greenhouse Gas Inventories; IPCC: Geneva, Switzerland, 2007. [Google Scholar]
- Liu, H.T.; Zheng, H.X.; Chen, T.B.; Zheng, G.D.; Gao, D. Reduction in greenhouse gas emissions from sewage sludge aerobic compost in China. Water Sci. Technol. 2014, 69, 1129–1135. [Google Scholar] [CrossRef] [PubMed]
- Liu, B.; Wei, Q.; Zhang, B.; Bi, J. Life cycle GHG emissions of sewage sludge treatment and disposal options in Tai Lake Watershed, China. Sci. Total Environ. 2013, 447, 361–369. [Google Scholar] [CrossRef] [PubMed]
- Chen, Y.C.; Kuo, J. Potential of greenhouse gas emissions from sewage sludge management: A case study of Taiwan. J. Clean. Prod. 2016, 129, 196–201. [Google Scholar] [CrossRef]
- IPCC. 2006 IPCC Guidelines for National Greenhouse Gas Inventories. Intergovernmental Panel on Climate Change, Japan; IPCC: Geneva, Switzerland, 2006. [Google Scholar]
- Murray, A.; Horvath, A.; Nelson, K.L. Hybrid life-cycle environmental and cost inventory of sewage sludge treatment and end-use scenarios: A case study from China. Environ. Sci. Technol. 2008, 42, 3163–3169. [Google Scholar] [CrossRef]
- Li, Y.; Chen, Y.; Wu, J. Enhancement of methane production in anaerobic digestion process: A review. Appl. Energy 2019, 240, 120–137. [Google Scholar] [CrossRef]
- Zhang, Q.H.; Yang, W.N.; Ngo, H.H.; Guo, W.S.; Jin, P.K.; Dzakpasu, M.; Yang, S.J.; Wang, Q.; Wang, X.C.; Ao, D. Current status of urban wastewater treatment plants in China. Environ. Int. 2016, 92–93, 11–22. [Google Scholar] [CrossRef]
- Twagirayezu, E.; Fan, L.; Liu, X.; Iqbal, A.; Lu, X.; Wu, X.; Zan, F. Comparative life cycle assessment of sewage sludge treatment in Wuhan, China: Sustainability evaluation and potential implications. Sci. Total Environ. 2024, 913, 169686. [Google Scholar] [CrossRef]
- Xiao, L.; Lin, T.; Wang, Y.; Ye, Z.; Liao, J. Comparative life cycle assessment of sludge management: A case study of Xiamen, China. J. Clean. Prod. 2018, 192, 354–363. [Google Scholar]
- Zhang, H.; Rigamonti, L.; Visigalli, S.; Turolla, A.; Gronchi, P.; Canziani, R. Environmental and economic assessment of electro-dewatering application to sewage sludge: A case study of an Italian wastewater treatment plant. J. Clean. Prod. 2019, 210, 1180–1192. [Google Scholar] [CrossRef]
- Pradel, M.; Reverdy, A.L. Assessing GHG Emissions from Sludge Treatment and Disposal Routes: The Method behind GESTABoues Tool. 2020. Available online: https://hal.science/hal-00781673 (accessed on 6 January 2018).
- Nakakubo, T.; Yoshida, N.; Hattori, Y. Analysis of greenhouse gas emission reductions by collaboratively updating equipment in sewage treatment and municipal solid waste incineration plants. J. Clean. Prod. 2017, 168, 803–813. [Google Scholar] [CrossRef]
- Chen, W.; Liu, J.; Zhu, B.-H.; Shi, M.-Y.; Zhao, S.-Q.; He, M.-Z.; Yan, P.; Fang, F.; Guo, J.-S.; Li, W.; et al. The GHG mitigation opportunity of sludge management in China. Environ. Res. 2022, 212, 113284. [Google Scholar] [CrossRef] [PubMed]
- Guo, D.; Li, B.; Yu, W.; Baroutian, S.; Young, B.R. A system engineering perspective for net zero carbon emission in wastewater and sludge treatment industry: A review. Sustain. Prod. Consum. 2024, 46, 369–381. [Google Scholar] [CrossRef]
- Huang, Y.; Zhen, Y.; Liu, L.; Ning, X.; Wang, C.; Li, K.; Zhao, L.; Lu, Q. Comprehensive competitiveness assessment of four typical municipal sludge treatment routes in China based on environmental and techno-economic analysis. Sci. Total Environ. 2023, 895, 141792. [Google Scholar] [CrossRef] [PubMed]
- Hao, X.; Chen, Q.; van Loosdrecht, M.C.; Li, J.; Jiang, H. Sustainable disposal of excess sludge: Incineration without anaerobic digestion. Water Res. 2020, 170, 115298. [Google Scholar] [CrossRef] [PubMed]
- Gahlot, P.; Balasundaram, G.; Tyagi, V.K.; Atabani, A.; Suthar, S.; Kazmi, A.; Štěpanec, L.; Juchelková, D.; Kumar, A. Principles and potential of thermal hydrolysis of sewage sludge to enhance anaerobic digestion. Environ. Res. 2022, 214, 113856. [Google Scholar] [CrossRef]
- Yin, Z.; Wang, J.; Wang, M.; Liu, J.; Chen, Z.; Yang, B.; Zhu, L.; Yuan, R.; Zhou, B.; Chen, H. Application and improvement methods of sludge alkaline fermentation liquid as a carbon source for biological nutrient removal: A review. Sci. Total Environ. 2023, 873, 162341. [Google Scholar] [CrossRef]

Disclaimer/Publisher’s Note: The statements, opinions and data contained in all publications are solely those of the individual author(s) and contributor(s) and not of MDPI and/or the editor(s). MDPI and/or the editor(s) disclaim responsibility for any injury to people or property resulting from any ideas, methods, instructions or products referred to in the content. |
© 2024 by the authors. Licensee MDPI, Basel, Switzerland. This article is an open access article distributed under the terms and conditions of the Creative Commons Attribution (CC BY) license (https://creativecommons.org/licenses/by/4.0/).