Article

Study of Low-Temperature Energy Consumption Optimization of Battery Electric Vehicle Air Conditioning Systems Considering Blower Efficiency

1
School of Automotive Studies, Tongji University, Shanghai 201804, China
2
School of Mechanical and Electrical Engineering, Wenzhou University, Wenzhou 325035, China
*
Author to whom correspondence should be addressed.
Processes 2024, 12(7), 1495; https://doi.org/10.3390/pr12071495
Submission received: 22 June 2024 / Revised: 10 July 2024 / Accepted: 15 July 2024 / Published: 17 July 2024

Abstract

:
Battery electric vehicle (BEV) air conditioning systems often use positive temperature coefficient (PTC) heaters to heat the passenger compartment. The heating process consumes a lot of energy in low-temperature environments, which seriously affects the driving range and user experience. This study aims to reduce the low-temperature energy consumption of the air conditioning system and improve energy efficiency through an innovative optimization method. In this study, the energy consumption composition of the air conditioning system was analyzed, and the goal of minimizing the sum of the total power consumption of the PTC heater and the blower was determined, while the efficiency characteristic of the blower was considered at the same time. The relationship between the average temperature of the passenger compartment measurement points and the PTC power and airflow rate was studied by combining experiments and numerical simulations, and the alternative operating conditions that met the temperature requirement were determined. On this basis, the total power consumption of the air conditioning system was analyzed and optimized. The results show that PTC power, airflow rate, and blower efficiency all have an important influence on the total power consumption of the air conditioning system. The optimized scheme could reduce the theoretical total power from 1315.32 W of the original scheme to 1246.83 W, and the actual total power from 1350.05 W of the original scheme to 1326.56 W, with reductions of 5.21% and 1.74%, respectively. The low-temperature energy consumption optimization method for the BEV air conditioning systems proposed in this study is instructive for the selection of blowers and the design of control strategies for air conditioning systems.

1. Introduction

Due to the requirements of energy saving, environmental protection, and energy security, new energy vehicles have attracted the attention of countries around the world and developed rapidly [1,2,3]. Among them, battery electric vehicles (BEVs) have become the dominant force in new energy vehicles and have developed rapidly due to their advantages, such as zero emissions and low noise [4,5]. At present, people’s requirements for the energy efficiency and driving range of BEVs are constantly increasing [6,7,8]. However, in low-temperature environments, the heating process of the air conditioning system of BEVs will increase significant energy consumption, seriously affecting its user experience in winter [9,10,11]. Therefore, it is necessary to optimize the low-temperature heating process of the air conditioning system to reduce energy consumption and improve energy efficiency.
Compared with traditional fuel vehicles, BEVs do not use the engine as a heat source. In low-temperature environments, they cannot use the heat of the engine coolant to heat the passenger compartment. Their air-conditioning systems must consume a large amount of electricity in the battery pack during the heating process [12,13]. At present, there are three main passenger compartment heating methods used in BEV air conditioning systems: positive temperature coefficient (PTC) heater heating, heat pump heating, and waste heat recovery heating [14]. PTC heating is divided into two types: air-heated PTC heating and water-heated PTC heating. Among them, in air-heated PTC heating, the blower pushes air through the hot PTC core into the passenger compartment to achieve the heating effect; water-heated PTC heating is where the PTC first heats the liquid and then the blower pushes the air to exchange heat with the hot liquid before entering the passenger compartment. Heat pump heating uses a compressor to push the refrigerant to move the heat outside the vehicle into the passenger compartment for heating. Compared with PTC heating, heat pump heating has lower energy consumption due to its coefficient of performance value being greater than 1 [15]. However, costs are high, and its heating capacity is seriously reduced in severe cold, so PTC heating is often required for auxiliary heating [16,17,18]. Waste heat recovery heating collects the waste heat from the battery and electric drive system for passenger compartment heating. This method can significantly improve energy utilization efficiency, but at the same time, its pipeline design and control are relatively complex and costly. In addition, due to the volatility of the recoverable waste heat with changes in operating conditions, it is often only used as an auxiliary heating method for PTC heating or heat pump heating [19,20]. At present, air-heated PTC heating is widely used in BEV air conditioning systems due to its simple structure, reliable operation, and low cost.
To reduce the energy consumption of air conditioning systems at low temperatures, researchers have conducted considerable research. Meyer et al. used a combination of the PTC heater and the heat pump to extend the driving range by 5–22% in an ambient temperature range of −18 °C to 5 °C by making better use of heat storage and waste heat [11]. Zeng et al. developed an integrated thermal management control system, proposed a PTC and heat pump hybrid heating scheme and a motor waste heat recovery scheme, and established a control strategy model to effectively reduce the energy consumption of the thermal management system at low temperatures [21]. Rolando et al. developed a numerical model of the thermal architecture of BEVs in the GT-Suite environment and compared the performance of the thermal architecture based on the heat pump and the standard air conditioning system integrated with the PTC heater under different environmental conditions [22]. Sevilgen et al. comprehensively considered the heating time and driving range and studied the advantages and disadvantages of different heating modes for the coordination of the PTC heater and the heat pump [23].
Reducing the low-temperature energy consumption of air conditioning systems by improving the performance of PTC is also an important research direction. Park et al. designed a radiation fin with better heat transfer performance for the PTC heater and conducted a comprehensive analysis of its air-side heat transfer and friction characteristics [24]. Xia et al. studied the effects of fin pitch, fin amplitude, fin thickness, and ripple number on the heat transfer performance and resistance performance of the PTC heater through numerical simulation and obtained the optimal parameter combination [25]. Shin et al. developed a modular integrated PTC heating system that was lightweight while improving power density and greatly reducing the required electrode material by improving the sintering process of PTC elements [26,27]. These related studies were all aimed at improving the performance of the PTC itself, and no synergistic optimization of the PTC and air conditioning system has been found.
The efficiency characteristic of the blower also has an important impact on the energy consumption of air conditioning systems. Some studies have investigated the efficiency of the blower while taking into account the noise characteristics of the blower. Nielsen et al. evaluated 21 energy-saving measures for in-vehicle climate [28]. The results showed that few single energy-saving measures could significantly reduce energy consumption. The most promising measure was to improve the efficiency of the blower, which could reduce electrical power consumption by 46%. Li et al. simulated the influence of structural parameters on the efficiency and noise of the vehicle blower [29]. The global sensitivity analysis method was used to optimize the performance and noise of the blower, which increased the efficiency of the blower by 4.75% and reduced the noise amplitude by 4.39 dB. Kamada et al. used genetic algorithms to explore the optimal value of the dual-objective problem of blower efficiency and noise [30]. In addition, there have also been some studies focusing on airflow rate and air recirculation strategies [31,32,33], local air conditioning [34,35,36], control optimization, etc. [37,38,39,40,41,42,43].
For BEV air conditioning systems that use the air-heated PTC heating method, the energy consumption of the air conditioning system comes from two aspects: one is the energy consumed by the PTC itself, and the other is the energy consumed by the blower. The energy consumed by the PTC is used to heat the air and then the passenger compartment. Since the PTC electric-heat conversion efficiency is very high, reaching more than 99%, there is almost no energy loss [44], so the electric power consumed by the PTC can be considered to be equal to the heat generation power of the PTC. The energy consumed by the blower is mainly used to push the air to overcome the resistance in the flow path and enter the passenger compartment. The airflow rate and the corresponding pressure drop determine the effective power of the blower, and the efficiency of the blower determines the actual electric power consumed by the blower [45]. According to experience, the electric power consumed by the vehicle blower during operation is generally 20–400 W. From a numerical point of view, this power consumption cannot be ignored.
In general, the existing research mainly focuses on the combination of PTC and heat pumps, the improvement of PTC performance, and the optimization of the blower. Research on the energy consumption of air conditioning systems using the pure air-heated PTC heating method is very rare. There has been no report on the optimization research of the minimum total energy consumption of the air conditioning system when the PTC and the blower work together. Combined with the survey of automobile manufacturers, the current matching design of the PTC and the blower is mostly selected through experience and then verified through experiments. Most of them only consider whether the selected blower meets the design demand for airflow, and there is no in-depth discussion on how to compare and select the optimal blower. From the perspective of control, the adjustment of the air conditioning system during heating is guided by meeting the target temperature, which cannot guarantee the economy of the determined control scheme, and there is room for the optimization of the total power consumption of the air conditioning system.
Given the above situation, this paper aims to optimize the total energy consumption of BEV air conditioning systems using the air-heated PTC heating method in low-temperature environments, so as to save energy and increase the driving range of BEVs. Compared with existing studies, this study innovatively considers the PTC power consumption, blower power consumption, and blower efficiency characteristics, and, on this basis, summarizes and proposes an innovative low-temperature energy consumption optimization method for BEV air conditioning systems and clarifies the guiding significance of this optimization method for blower selection and air conditioning system control strategy design. The research environment, temperature measurement points layout, etc., are based on the Chinese national standard “Test methods for energy consumption and range of electric vehicles—Part 1: Light-duty vehicles” [46]. The main contents of this study include:
  • The total energy consumption of the air conditioning system of BEVs was theoretically calculated and analyzed.
  • The vehicle test, blower performance test, and component performance test were carried out, and the relevant data were analyzed to determine the benchmark working condition of the three-dimensional numerical simulation.
  • The three-dimensional numerical model of the passenger compartment and air conditioning system was established, and the influence of PTC power and airflow rate on the average temperature of the measurement points was analyzed. The isotherm diagram of the average temperature concerning PTC power and airflow rate was obtained. On this basis, the alternative working conditions that meet the temperature requirement were determined.
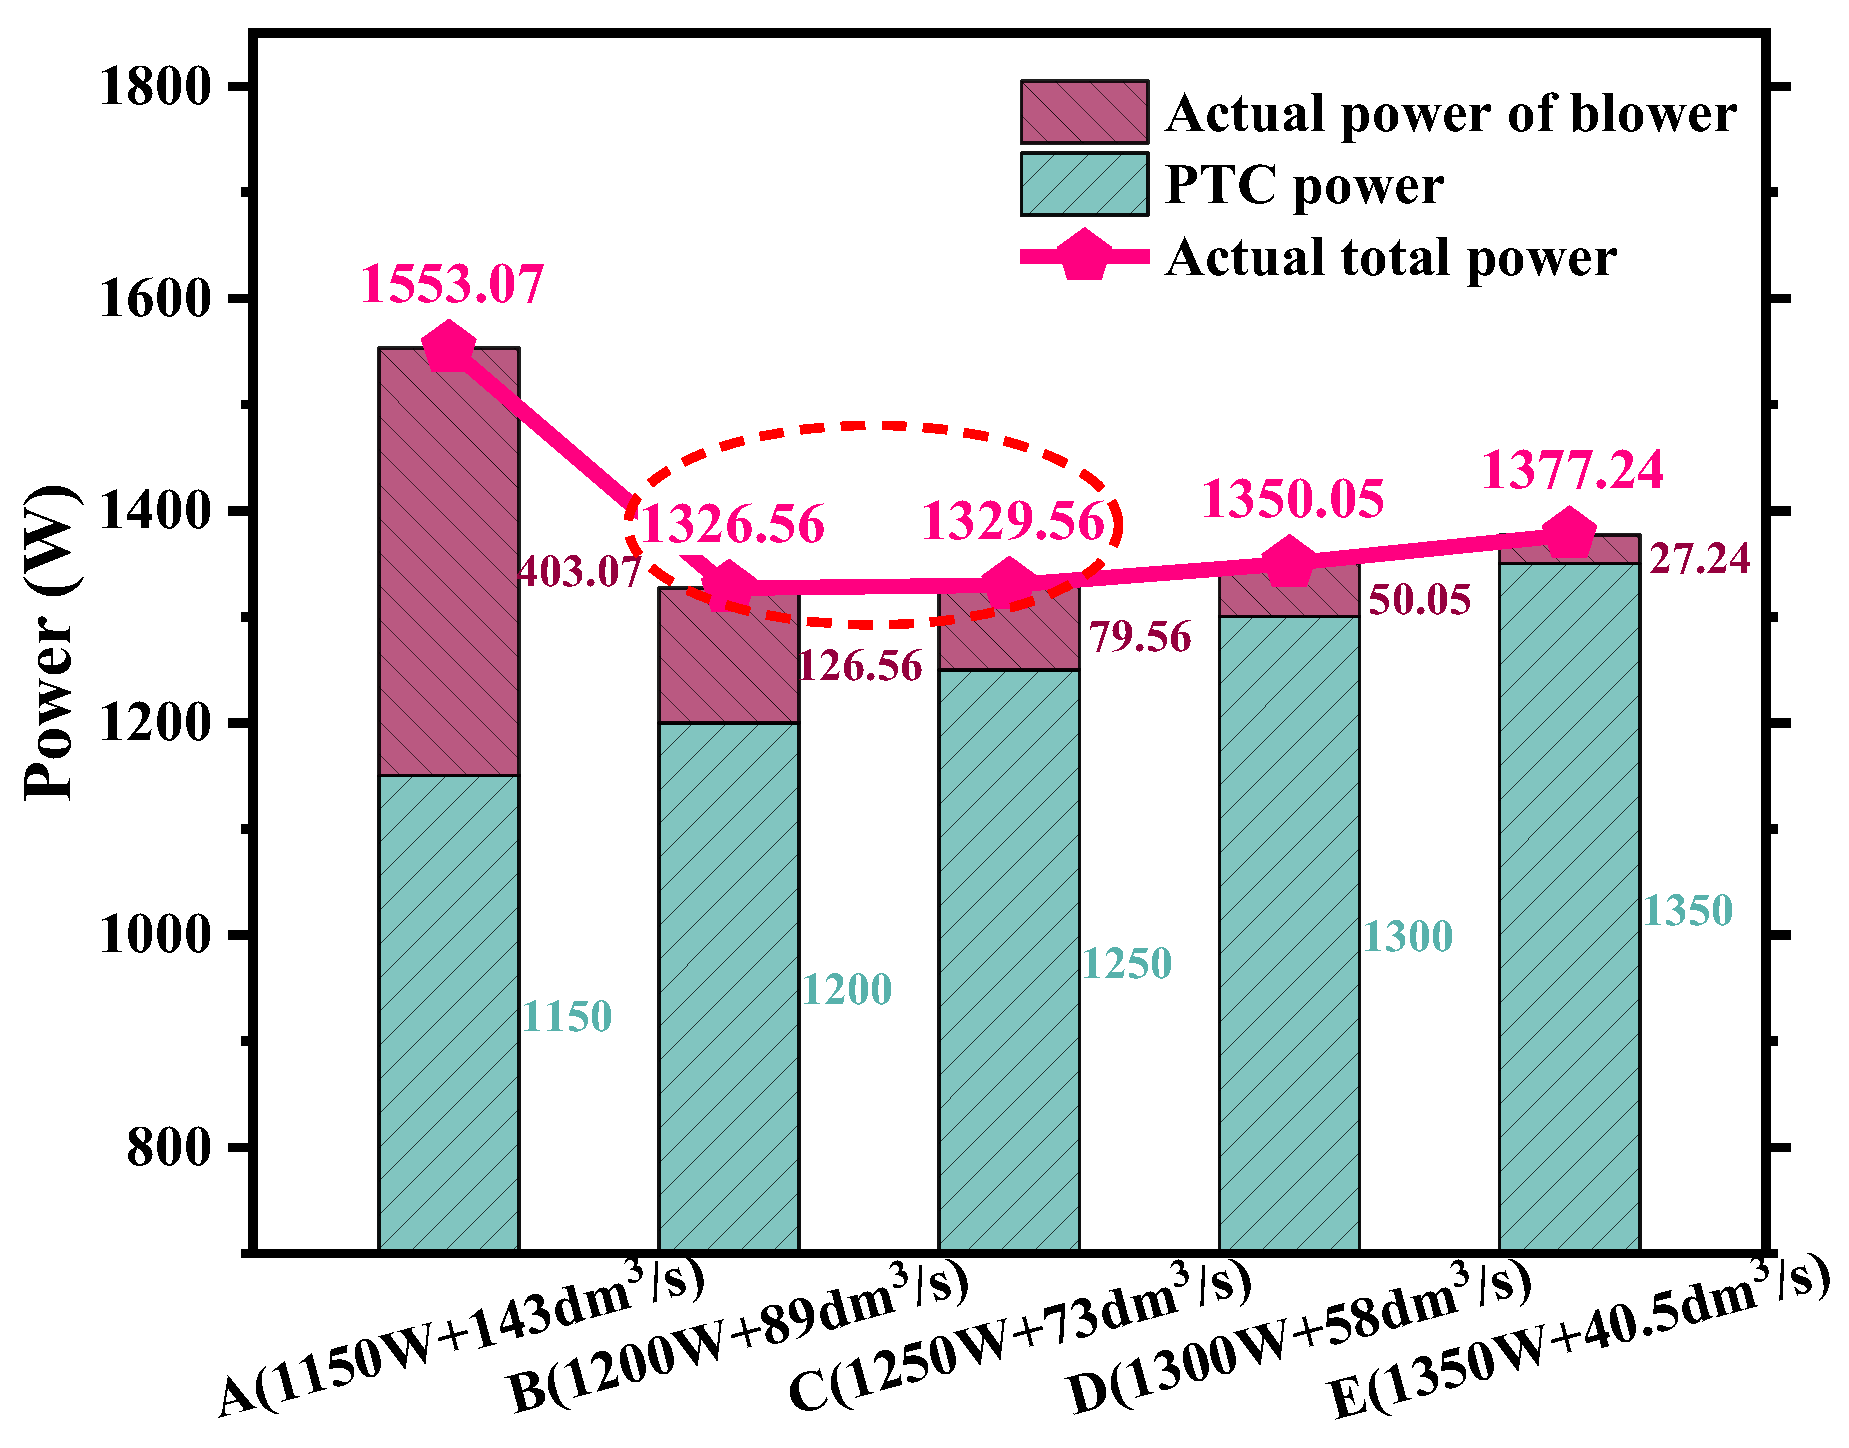
  • The optimization study was carried out on the alternative working conditions. Compared with the benchmark working condition, the theoretical total power of the optimized scheme was reduced by 68.49 W, and the actual total power was reduced by 23.49 W. The results show that the optimization of the total power consumption of the air conditioning system should comprehensively consider PTC power, airflow rate, and blower efficiency.
  • The optimized scheme was tested to verify the reliability of the research method, and a general method for optimizing the low-temperature energy consumption of the air conditioning system of BEVs was summarized and proposed. This method can be used as a guide for the selection of blowers and the development of control strategies for the air conditioning system.

2. Materials and Methods

2.1. Theoretical Analysis of Total Energy Consumption

For BEV air conditioning systems that use the air-heated PTC heating method, once the target temperature in the passenger compartment is determined, ignoring the small amount of energy consumed by the control system, the actual total power N TA can be determined by Equation (1):
N TA = N BA + N PTC
where N BA is the actual power of the blower, W; N PTC is the power of the PTC, W.
The actual power of the blower N BA can be calculated by Equation (2):
N BA = N BE η
where N BE is the effective power of the blower, W; η is the total efficiency of the blower.
The effective power of the blower N BE can be calculated by Equation (3):
N BE = Q   ×   P T
where Q is the airflow rate, m3/s; P T is the total pressure of the blower, Pa.
The theoretical total power of the air conditioning system N TT can be calculated by Equation (4):
N TT = N BE + N P TC
From the above analysis, we can know that to determine the total power of the air conditioning system, we need to know the power of the PTC, the airflow rate, and the total pressure of the blower. The PTC power and airflow rate determine the temperature in the passenger compartment, and the total pressure of the blower is related to the current airflow rate and the air conditioning system pipeline.
The airflow route of the air conditioning system studied in this paper is shown in Figure 1. It can be seen that the airflow route includes the fresh air inlet under the front windshield, the air conditioning filter, the blower, the evaporator, the PTC module, and the air conditioning outlet.
Figure 2 is a simplified diagram of the airflow route. The four sections 1, 2, 3, and 4 in the figure represent the fresh air inlet under the front windshield, the blower inlet, the blower outlet, and the air conditioning outlet, respectively. P 1 , P 2 , P 3 , and P 4 are the static pressures at each section, and V 1 , V 2 , V 3 , and V 4 are the airflow speeds at each section.
According to Figure 2, the total pressure P T i at each section can be calculated by Equation (5):
P T i = P i + ρ × V i 2 2 ,   i = 1 ,   2 ,   3 ,   4
where ρ × V i 2 2 is the dynamic pressure at section i .
Ignoring the effect of height, Equation (6) can be obtained based on the knowledge of fluid mechanics:
P T 1 + P T = P T 4 + P l 1 - 4
where P l 1 - 4 is the pressure loss between sections 1 and 4.
Similarly, Equation (7) can be obtained:
P T 1 = P T 2 + P l 1 - 2
where P l 1 - 2 is the pressure loss between sections 1 and 2.
Similarly, Equation (8) can be obtained:
P T 3 = P T 4 + P l 3 - 4
where P l 3 - 4 is the pressure loss between sections 3 and 4.
The relationship between P l 1 - 4 , P l 1 - 2 , and P l 3 - 4 can be determined by Equation (9):
P l 1 - 4 = P l 1 - 2 + P l 3 - 4
Combining Equations (6)–(9), Equation (10) can be obtained:
P T = ( P T 1   -   P T 2 ) + ( P T 3   -   P T 4 ) + ( P T 4   - P T 1 )
where ( P T 1   -   P T 2 ) is the pressure drop between sections 1 and 2, recorded as P D 1 ; ( P T 3   -   P T 4 ) is the pressure drop between sections 3 and 4, recorded as P D 2 .
Considering that the airflow speed near sections 1 and 4 is not large, the total pressure difference is small, so their total pressure difference is ignored, and Equation (11) can be obtained:
P T = P D 1 + P D 2
That is, the total pressure of the blower is equal to the sum of the pressure drops of the two sections of pipeline before and after the blower.

2.2. Experimental Research

The experiments include the vehicle test, blower performance test, and component performance test.

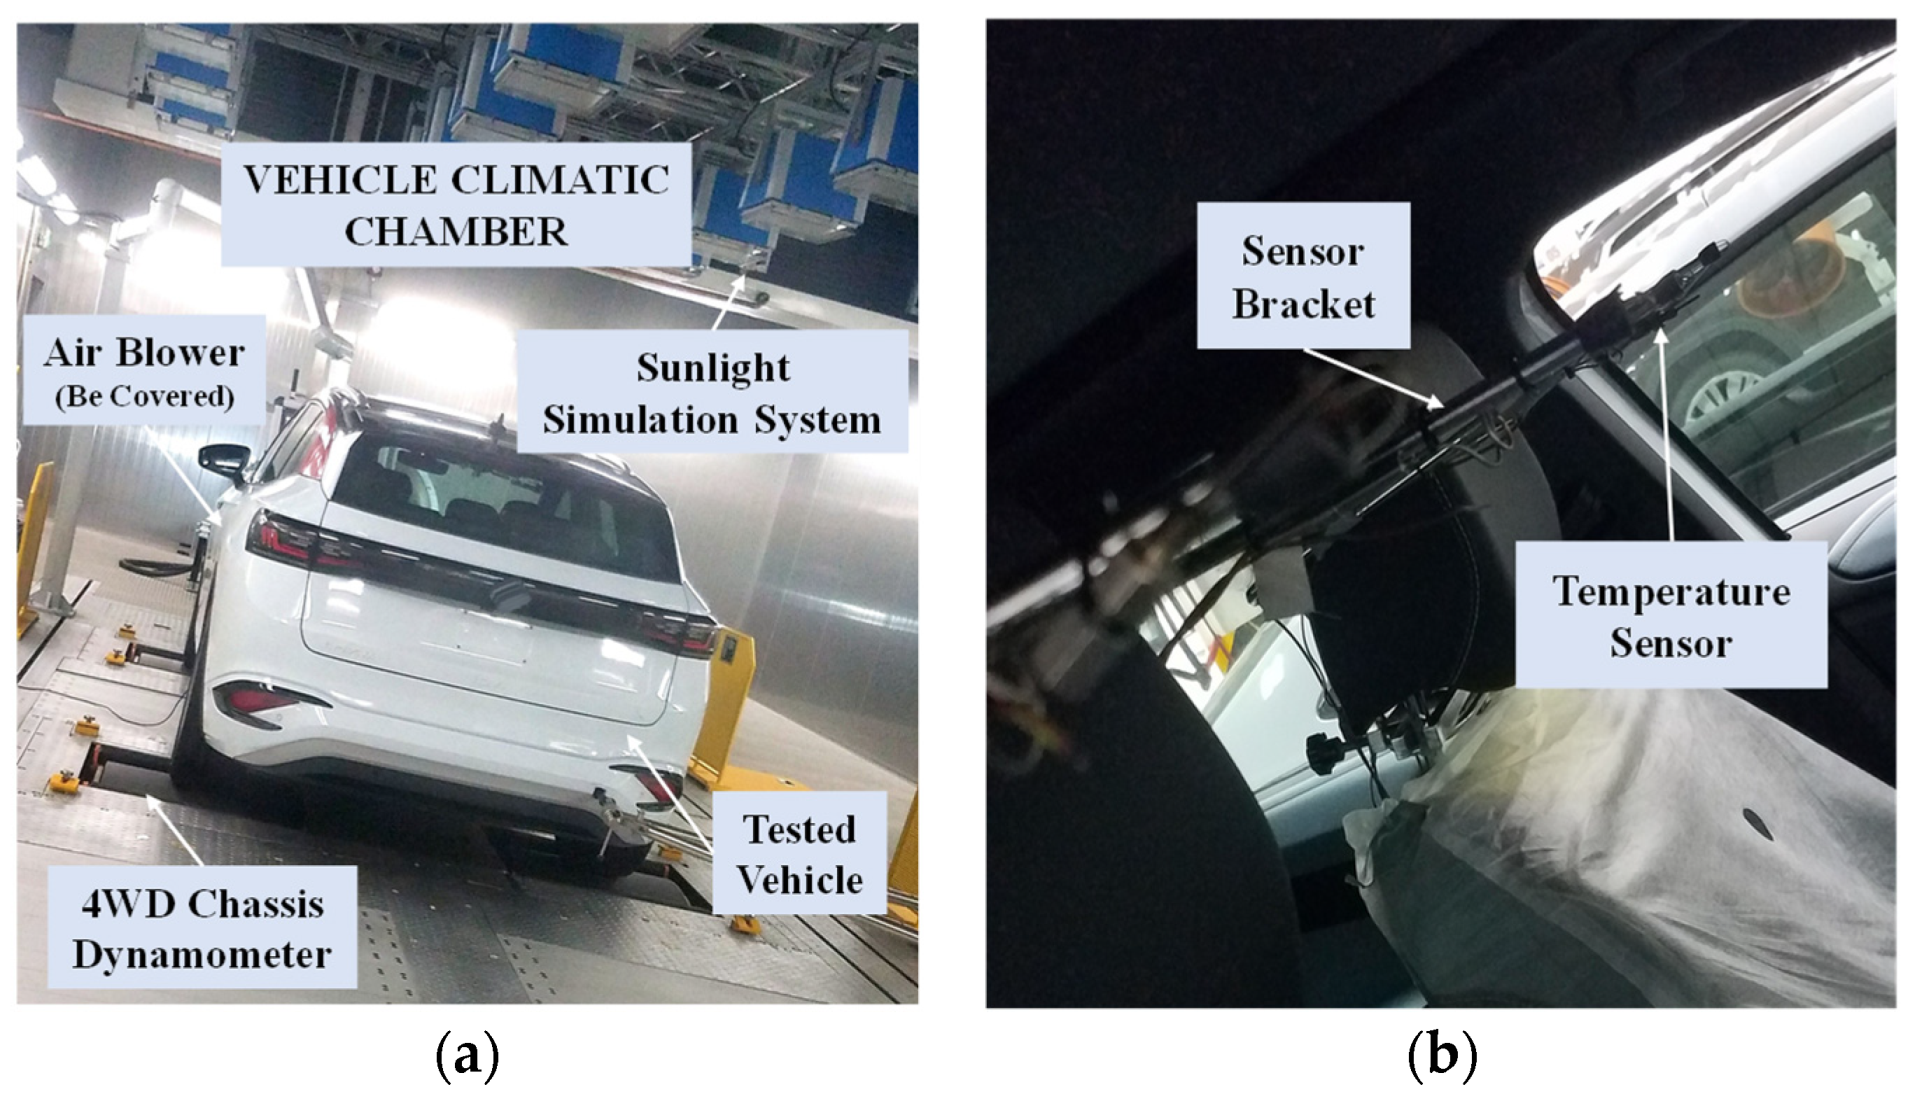
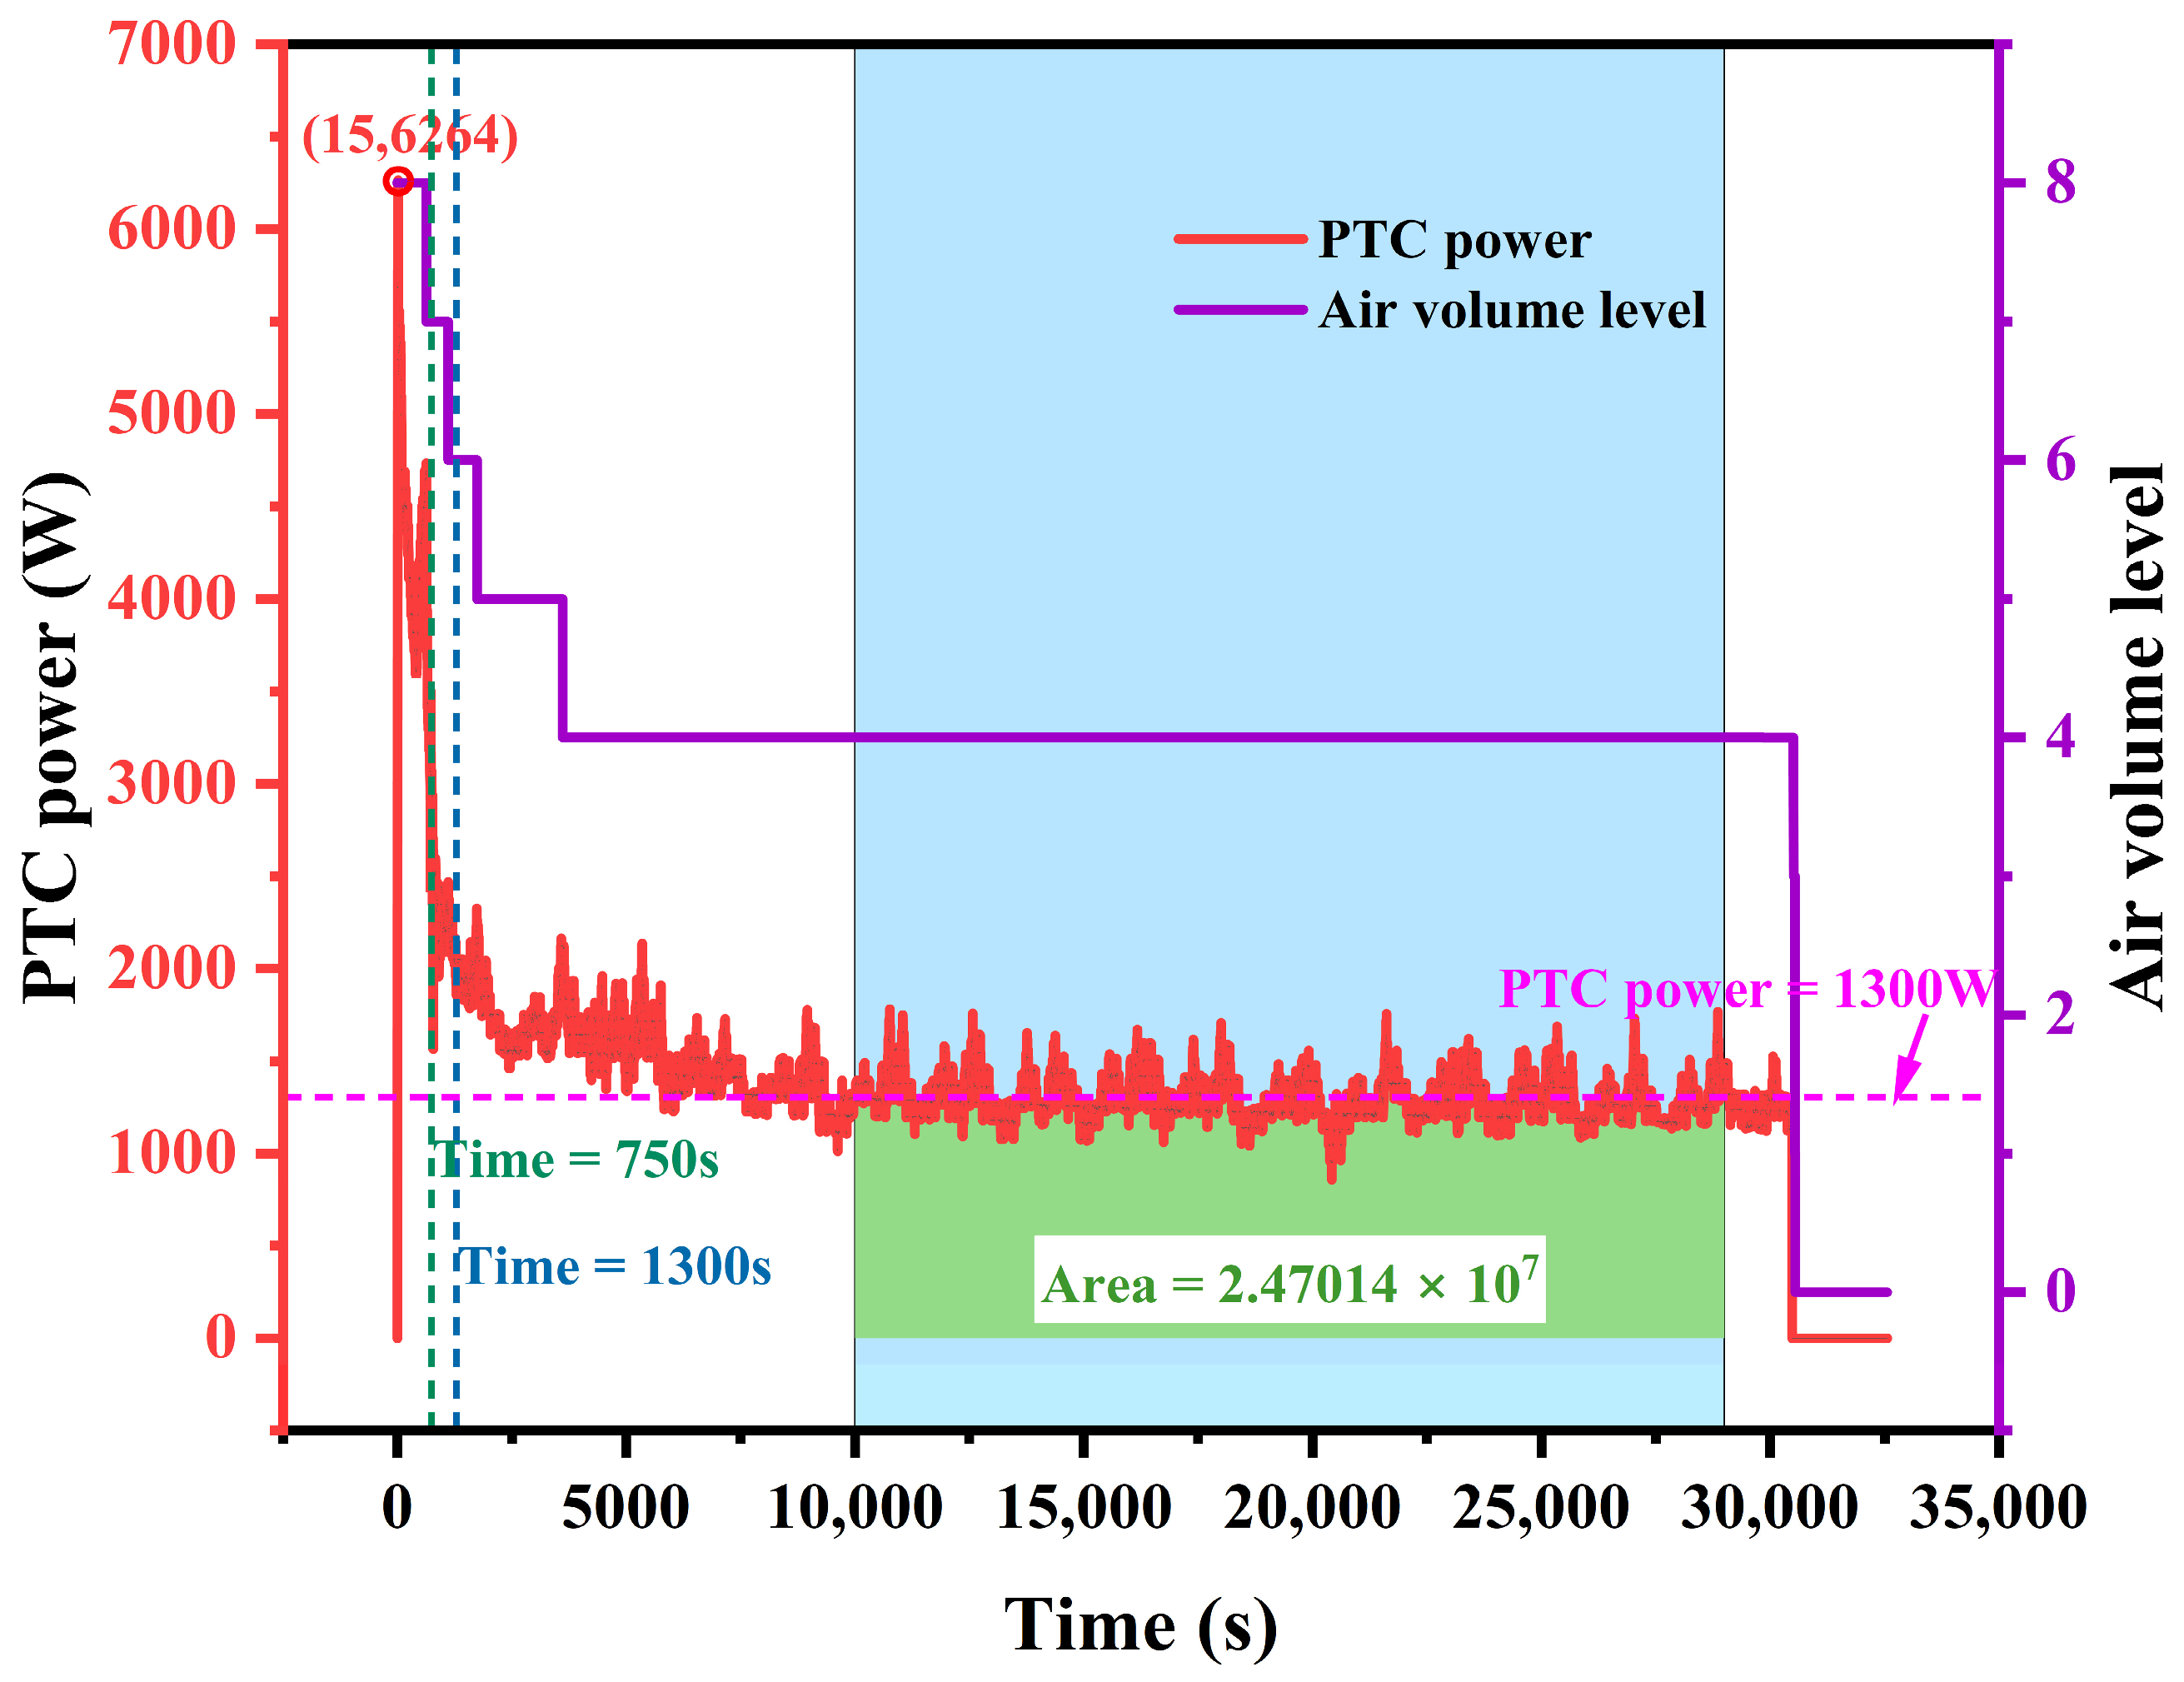
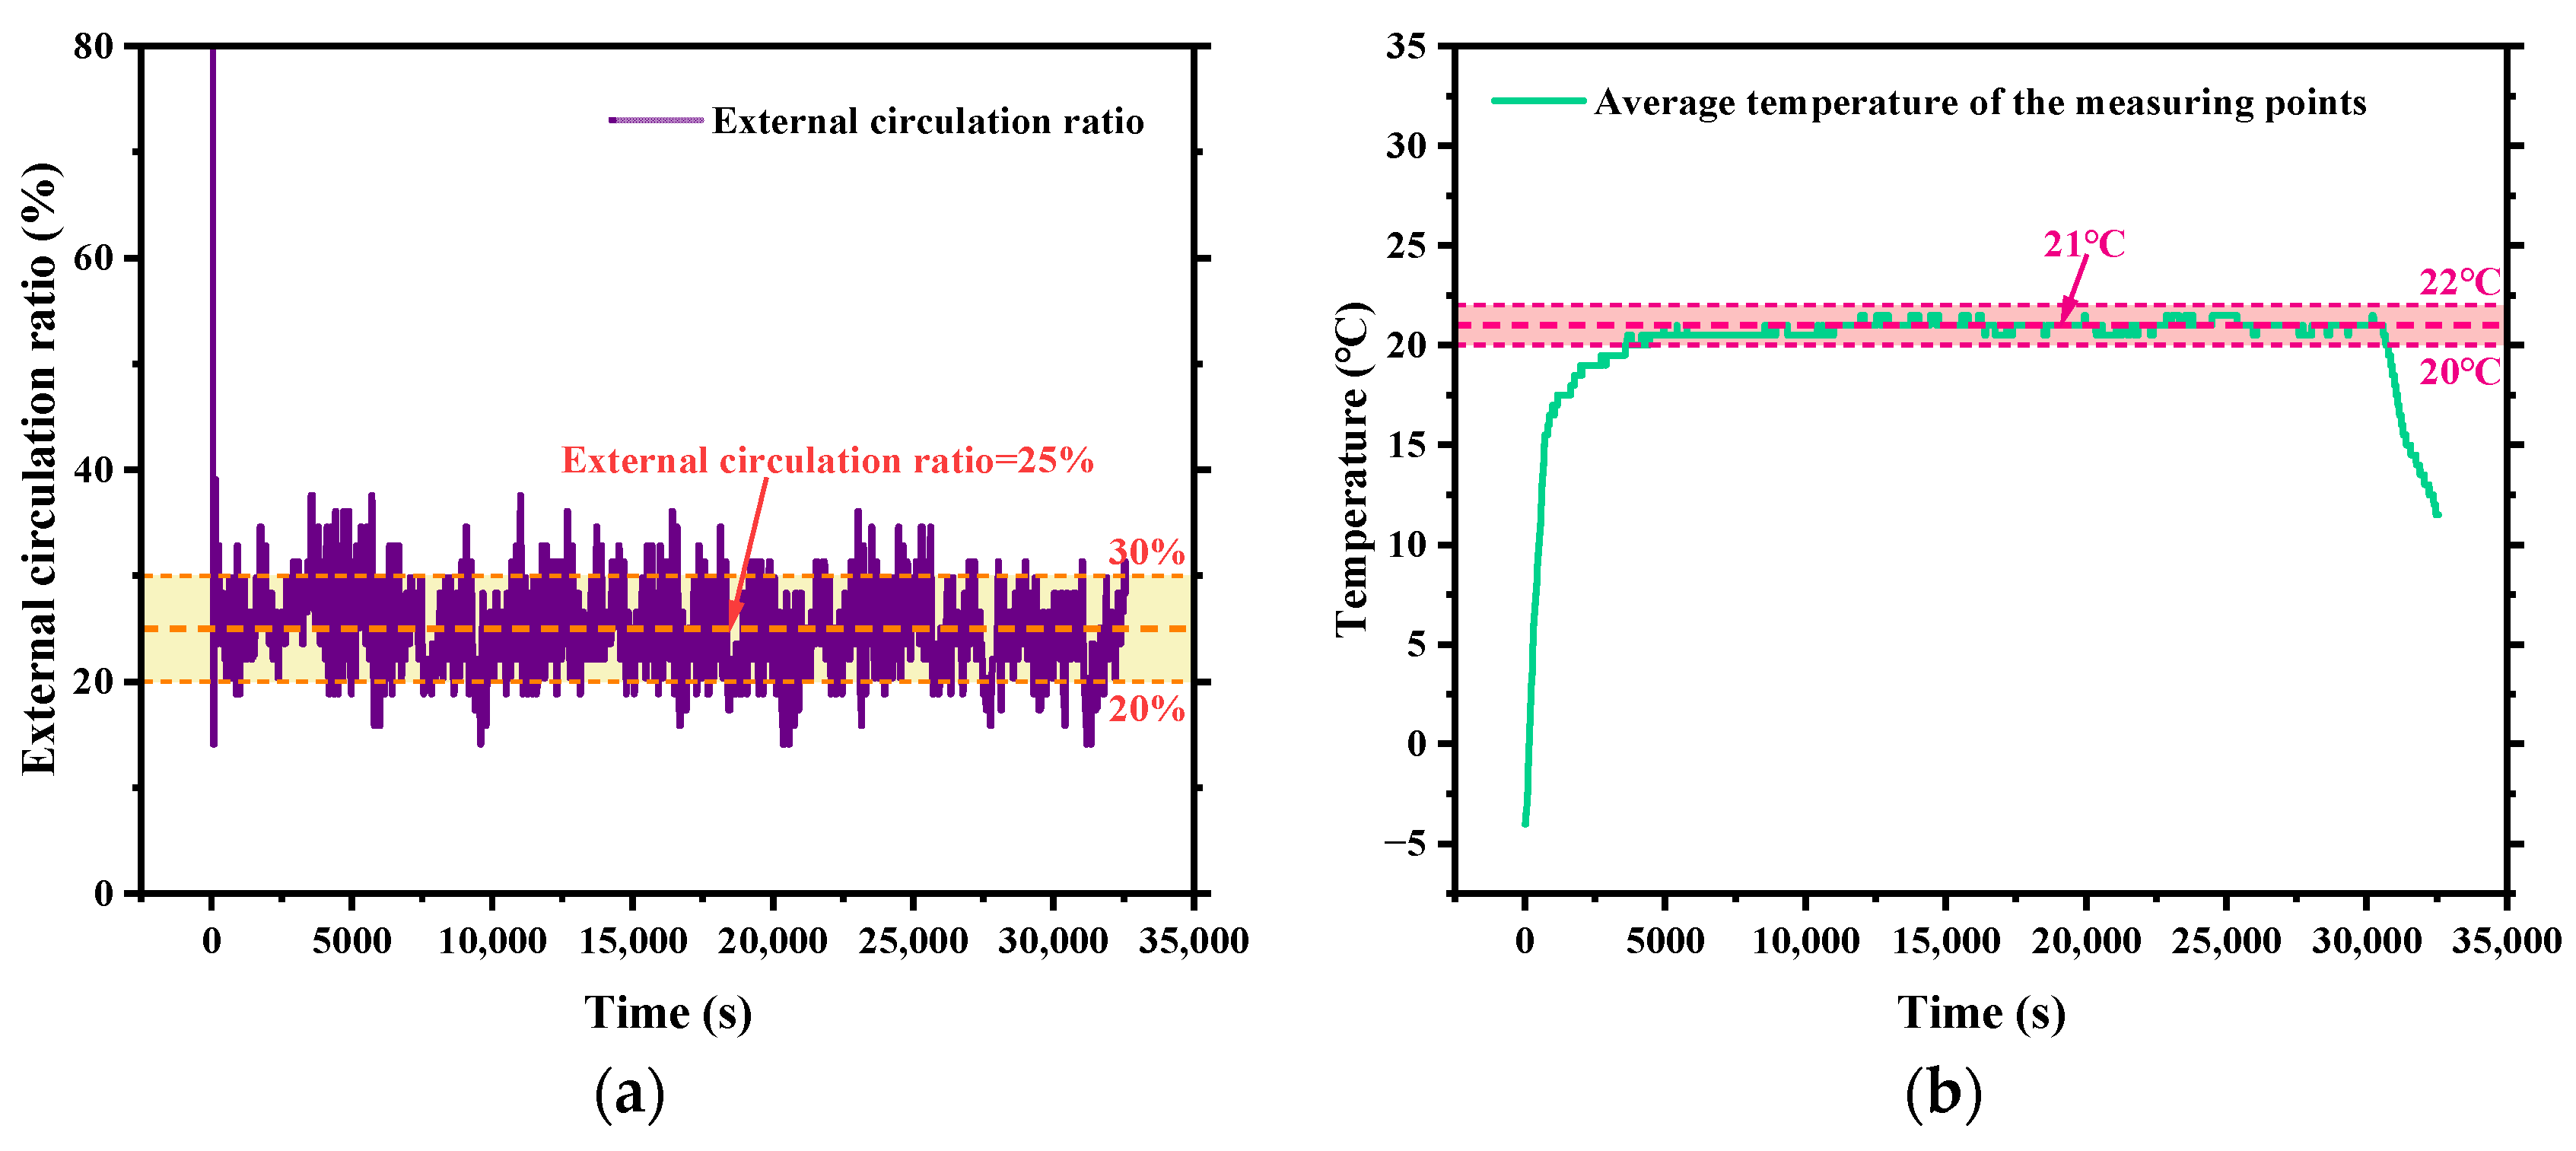
2.2.1. The Vehicle Test

The purpose of the vehicle test is to obtain and analyze time-varying parameters such as PTC power and the external circulation ratio, as well as the temperature at the measurement points of the air conditioning system of the real vehicle. The results of the test will be used as the basis for subsequent 3D numerical simulations.
The vehicle test was conducted in a climatic chamber. The test referred to the “Test method for energy consumption and driving range in low-temperature environments with the heater on” in the Chinese national standard “Test methods for energy consumption and range of electric vehicles—Part 1: Light-duty vehicles” [46]. The temperature of the climatic chamber was set at −7 °C, and the test cycle adopted the China light-duty vehicle test cycle for the passenger car (CLTC-P) test cycle [47]. The test started when the state of charge (SOC) of the battery was 100% until the vehicle could no longer follow the speed of the test cycle. During the test, the vehicle was placed on a drum test bench, and the driving resistance was loaded by a chassis dynamometer. The high-power blower in front of the vehicle was used to simulate the oncoming airflow during the driving process. The main parameters of the climatic chamber are shown in Table 1. The standard also stipulates the method for determining the position of the temperature measurement points in the passenger compartment [46]. As shown in Figure 3, the temperature measurement points are located in front of the driver and co-driver seats. Figure 4a is a test photo of the vehicle climatic chamber, and Figure 4b is a test photo of the temperature sensors. The type of temperature sensor was a Pt100, with a calibrated range of −50 °C to 200 °C and an accuracy of ±0.15 °C.
The air conditioning system was the focus of the test. During the test, the air conditioning system was placed in automatic mode according to the standard requirement, the air outlet grills were centered, the temperature was set to 22 °C, and the rear air conditioning outlets were closed. A total of four temperature sensors were arranged at the temperature measurement points to collect temperature data. The voltage and current of the PTC and the ratio of the external circulation were directly recorded in real time through the vehicle controller area network (CAN) signal, and the air volume level of the air conditioning system displayed on the instrument was recorded at the same time. It should be noted that the air conditioning system of the tested vehicle was only provided with heat by the PTC, without the participation of other heat sources such as motor waste heat. The total test duration was about 10 h.

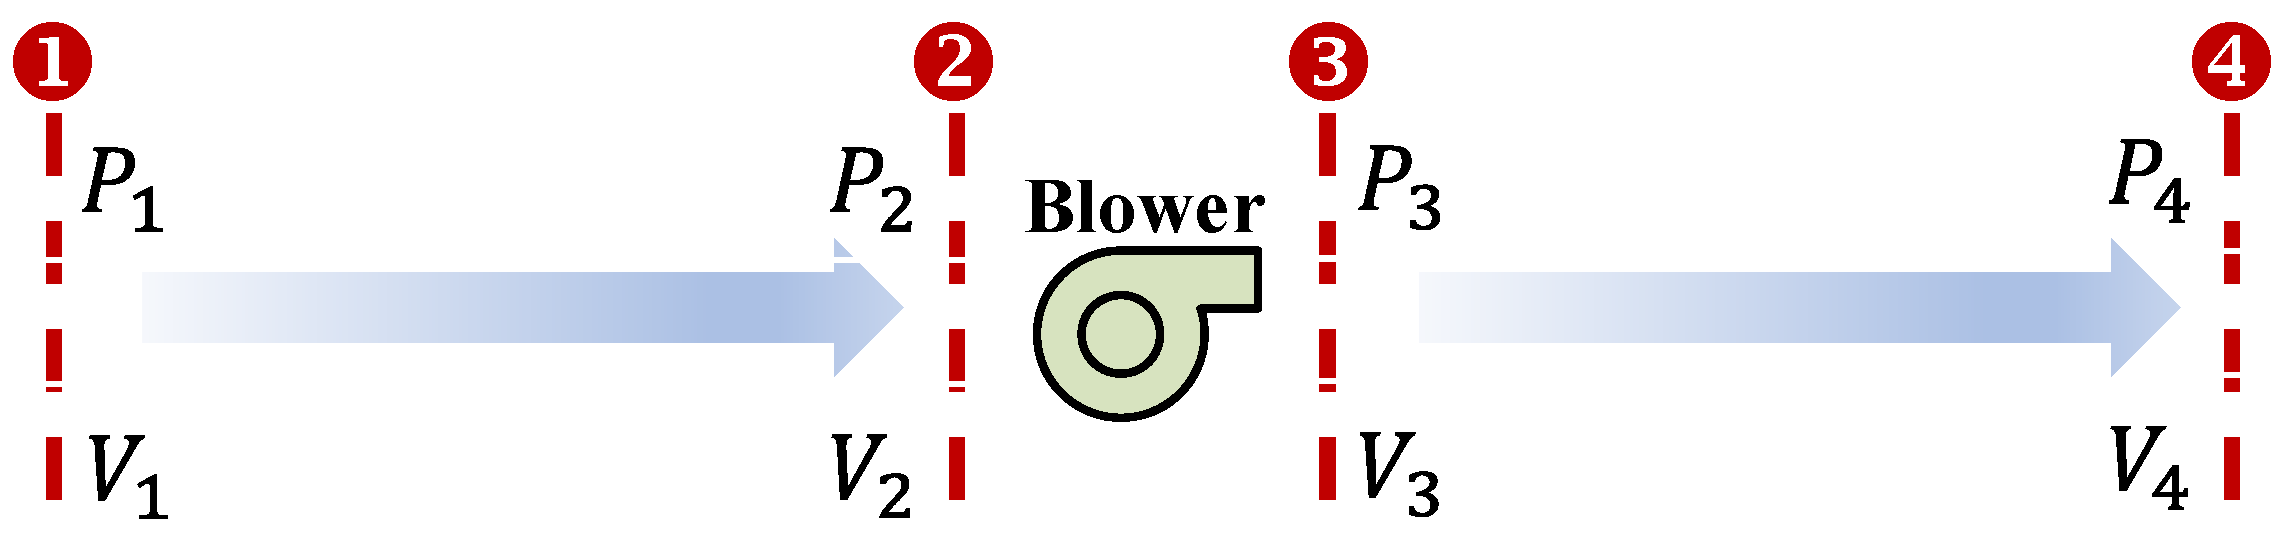
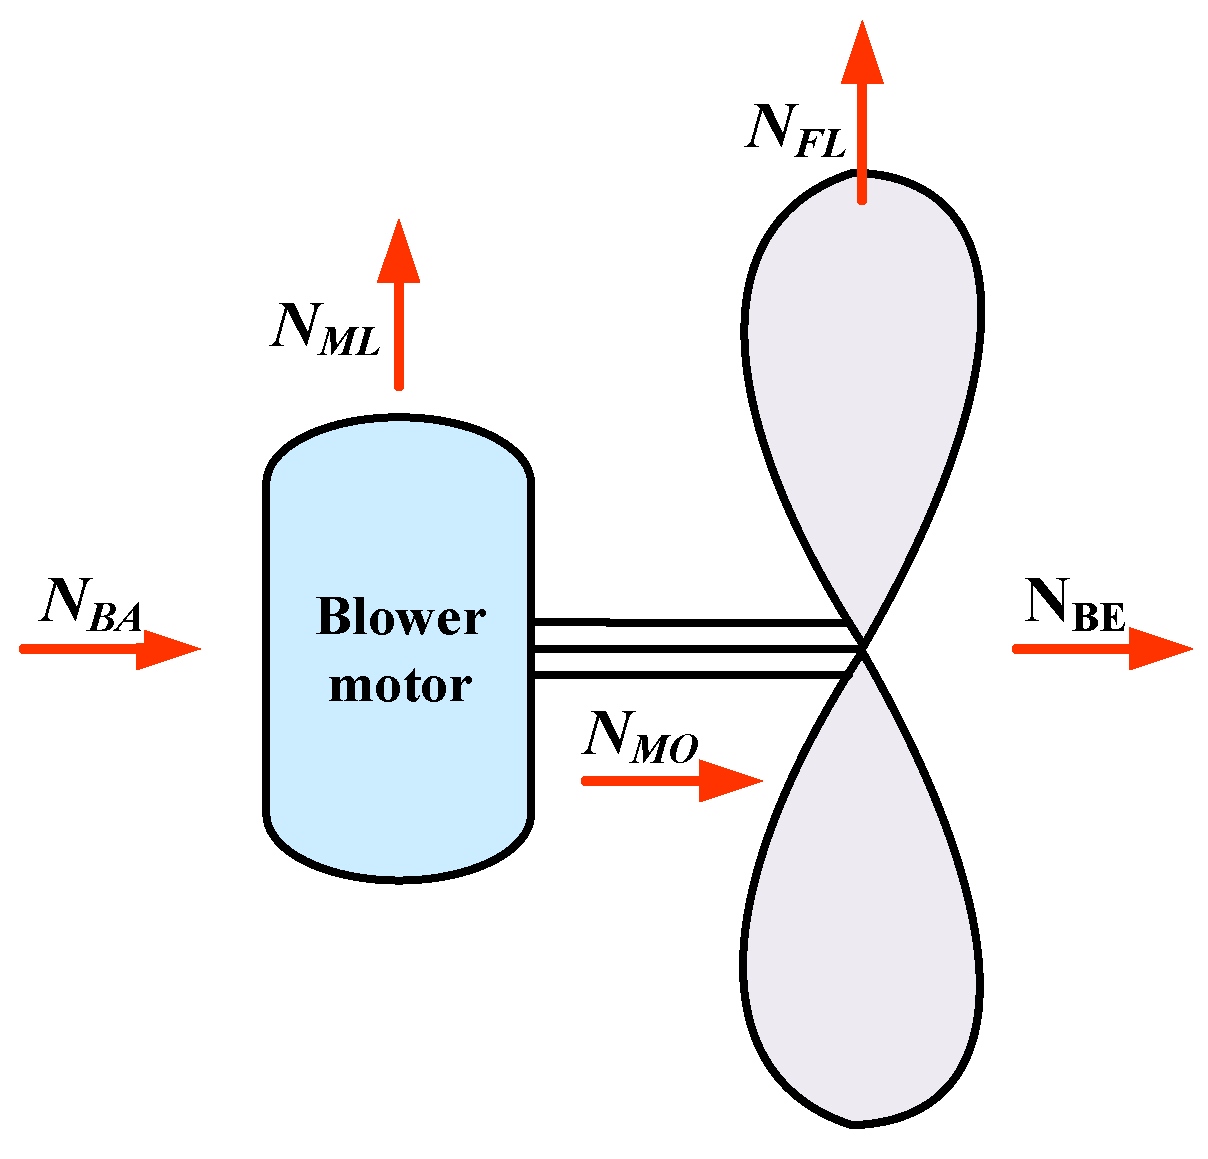
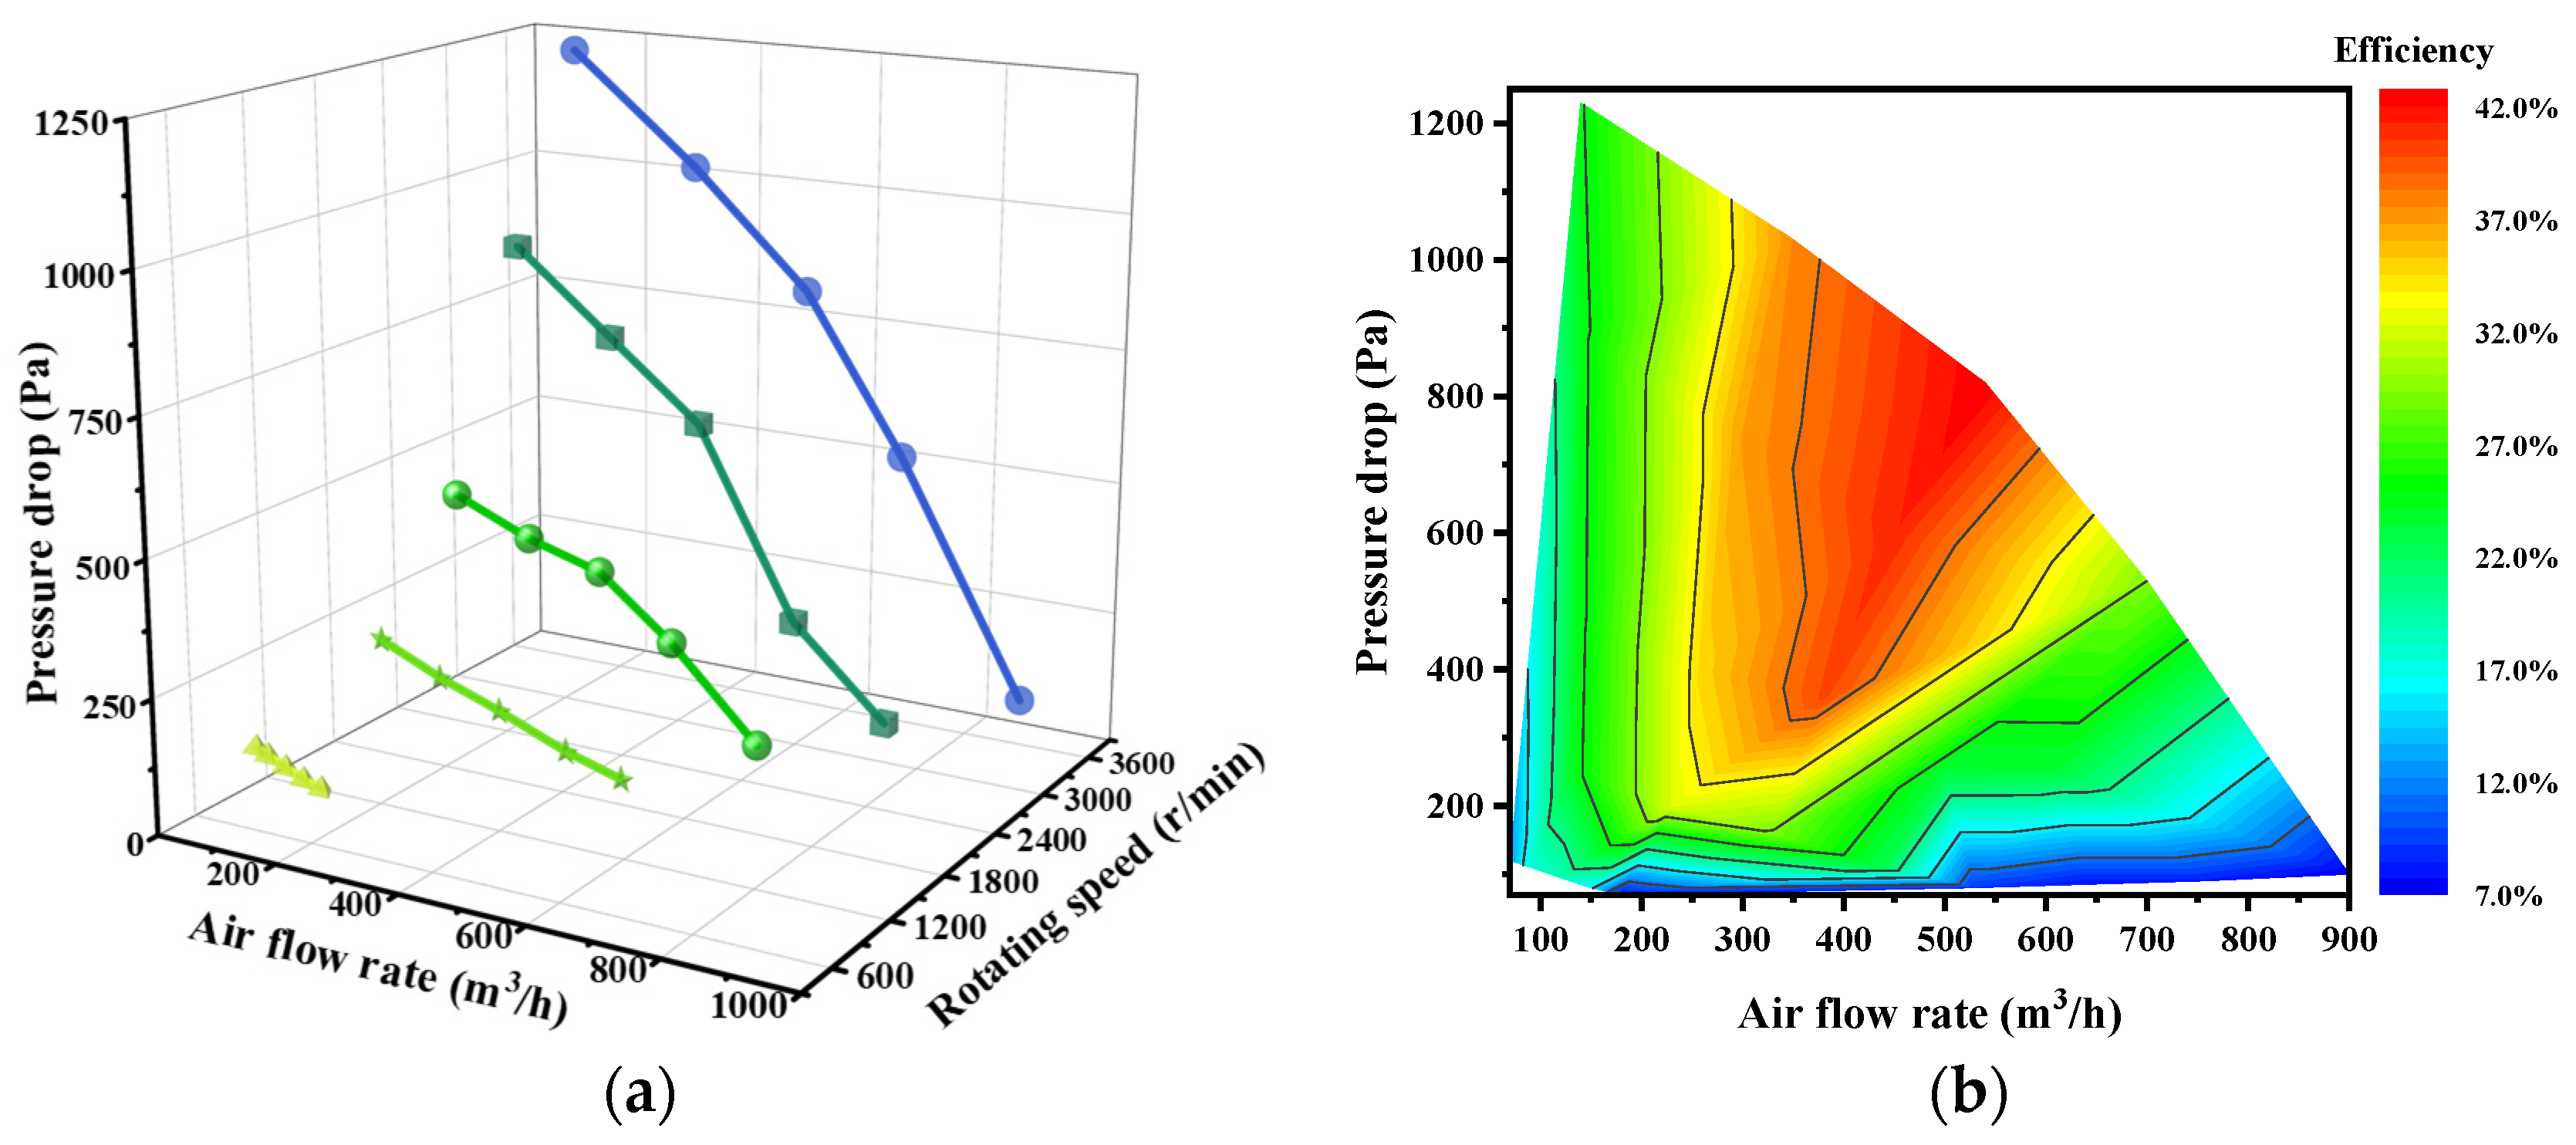
2.2.2. The Blower Performance Test

The purpose of the blower performance test is to obtain the total pressure-airflow rate relationship and corresponding total efficiency data of the blower at different rotation speeds. The input and output of the blower power are shown in Figure 5. N BA is the input power of the blower, that is, the actual power of the blower, W; N ML is the power loss of the blower motor, W; N MO is the output power of the blower motor, W; N FL is the fan loss power of the blower, including flow loss power, volume loss power, and mechanical loss power, W; N BE is the output power of the blower, that is, the effective power of the blower, W.
The total efficiency of the blower consists of two parts: the motor efficiency η M and the fan efficiency η B , which can be determined by Equations (12) and (13), respectively:
η M = N MO N BA × 100 %
η B = N BE N MO × 100 %
The total efficiency of the blower η can be determined by Equation (14):
η = η M × η B
The rated voltage of the tested blower is 12 V, the rated current is 32 A, and the rated rotation speed is 3500 r/min. The test was carried out on an automobile air conditioning blower performance test bench. The bench’s airflow rate range is 50 m3/h to 3000 m3/h, the airflow rate accuracy is ±2%, the pressure drop range is 0 Pa to 2000 Pa, and the power accuracy is ±1%. The total pressure-airflow rate relationship of the blower at different rotation speeds obtained in the test is shown in Figure 6a. Figure 6b is an iso-efficiency diagram of the blower efficiency versus the pressure drop and airflow rate obtained in the test.

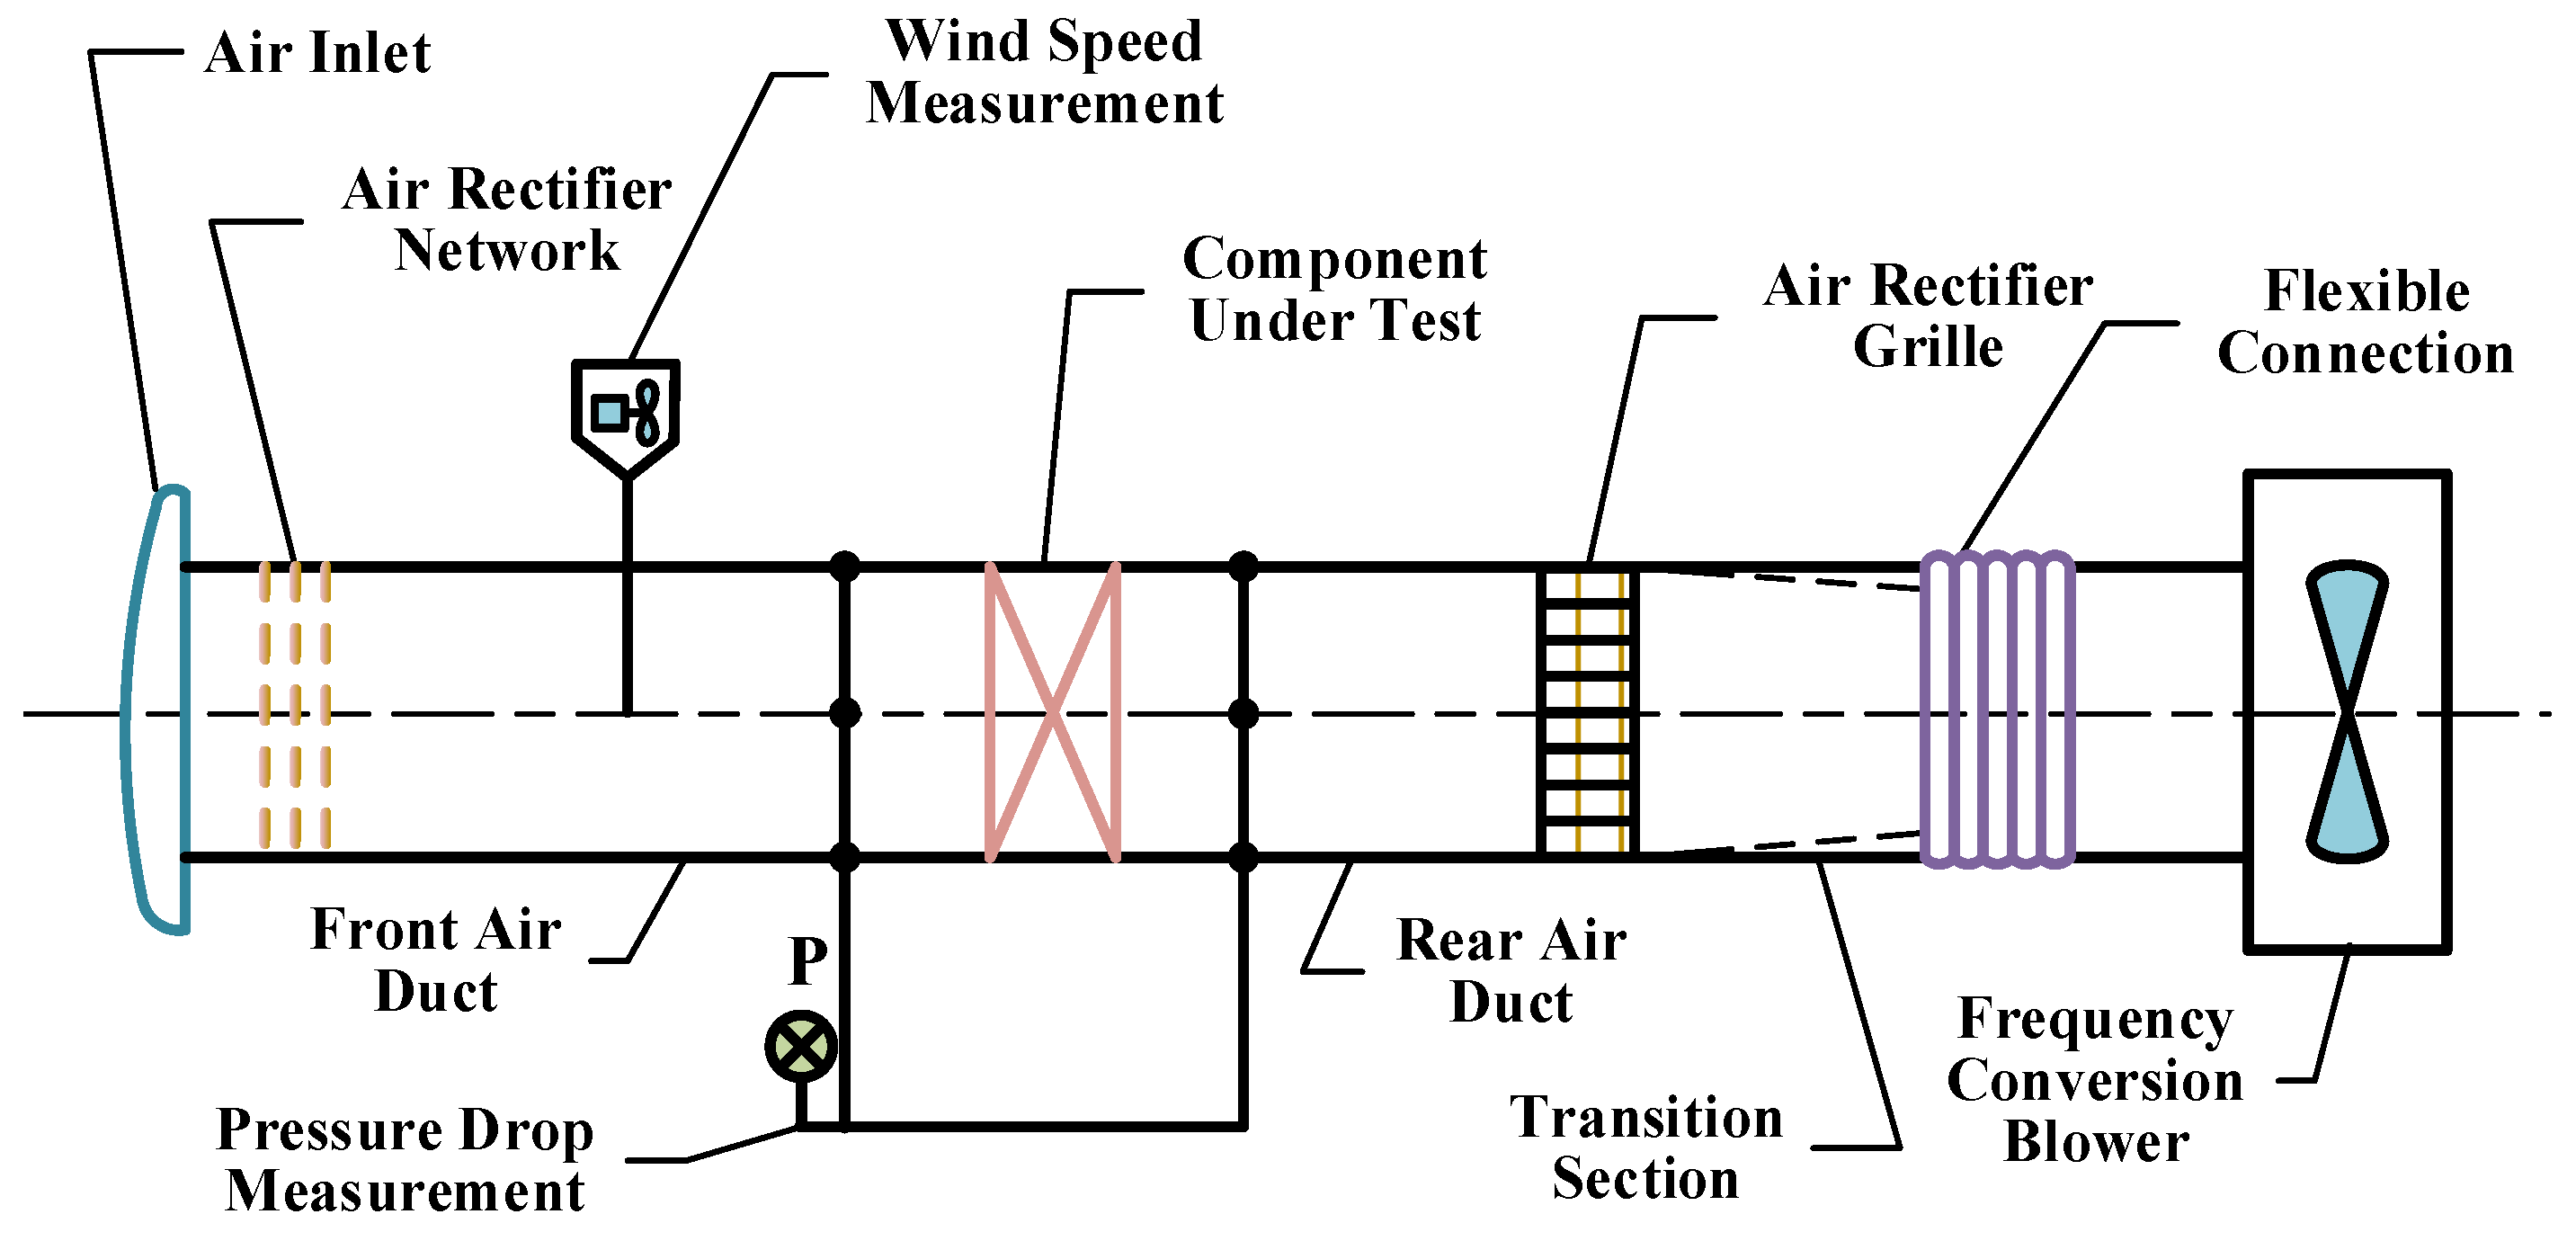
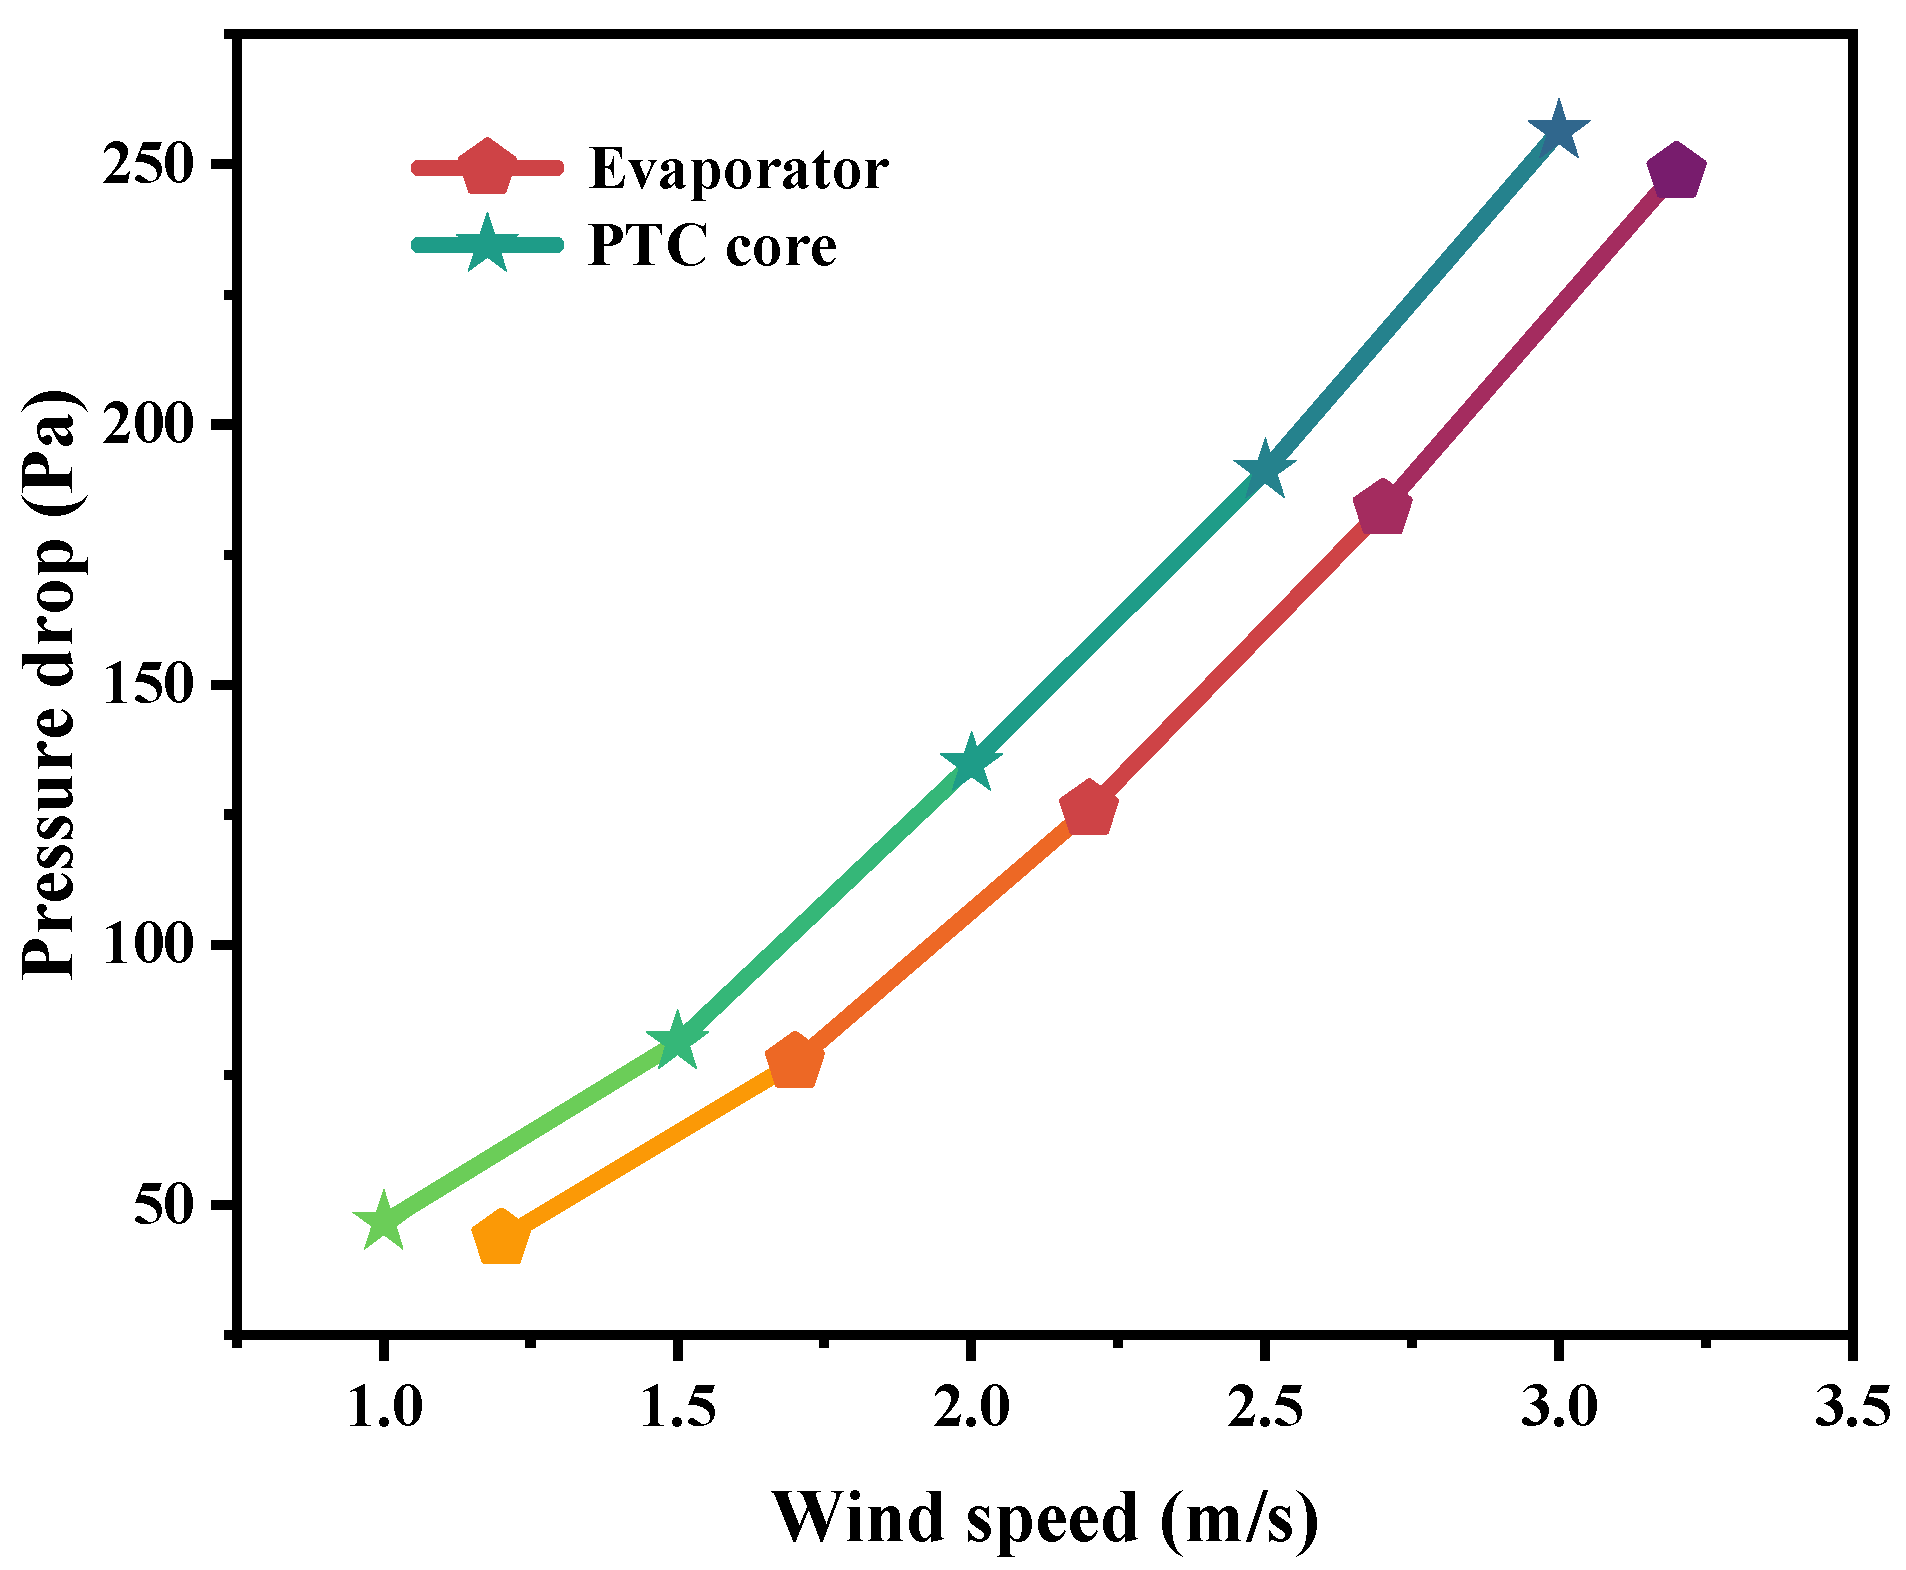
2.2.3. The Component Performance Test

The purpose of the component performance test is to determine the air resistance characteristics of the two components, the evaporator and the PTC core, to provide a basis for the subsequent establishment of a three-dimensional numerical model. The test was carried out on the corresponding test bench. The layout of the test bench is shown in Figure 7. The wind speed range of the test bench is 1 m/s to 15 m/s, the accuracy of wind speed is ±0.1 m/s, and the accuracy of pressure is ±0.1 Pa. The evaporator and PTC core were tested in turn, and the pressure drop data of the two components under different wind speeds were collected.
Figure 8 shows the test result. It can be seen that as the wind speed increases, the pressure drop of the evaporator and the PTC core gradually increases.

2.2.4. The Vehicle Test Results and Analysis

Figure 9 shows the changes in PTC power and air volume level over time during the vehicle test. In the initial stage of the test, the PTC power increased rapidly, reaching a peak of 6264 W at 15 s to meet the need for the rapid heating of the passenger compartment. Then, the PTC power decreased rapidly, falling to below 3000 W at 750 s and below 2000 W at 1300 s. After that, the PTC power decreased in fluctuation and gradually stabilized near a fixed value. From the perspective of thermal balance, the passenger compartment had entered a quasi-thermal balance state at this time, which can be regarded as basically reaching thermal balance. It can also be seen from the figure that the changing trend in the air volume level is similar to that of the PTC power. At the beginning of the test, the air volume level decreased rapidly from the highest level of 8 to 5 and then stabilized at 4, which also confirmed the judgment that the passenger compartment had entered a thermal equilibrium state. The PTC power after entering a relatively stable state is integrated from 10,000 s to 29,000 s, i.e., the green area in Figure 9. The integral result is 24,701,400 J, and the average power of the PTC is 1300.07 W. This shows that after reaching a thermal equilibrium state, the power of the PTC was stable at around 1300 W. Therefore, 1300 W was used as a boundary condition for the benchmark condition of the three-dimensional numerical simulation. In addition, it was learned from the manufacturer that the total airflow rate of the air conditioning system corresponding to the fourth-level air volume was 60 dm3/s.
Figure 10a shows the change in the air conditioning external circulation ratio over time during the test. Similar to the PTC power, the external circulation ratio basically stayed near 25%, which means that in automatic mode and the test environment, the air conditioning external circulation ratio was also approximately in a stable state. The fresh airflow rate of the air conditioning system was 15 dm3/s at this time. Figure 10b shows the change in the average temperature of the measurement points over time during the test. The Chinese national standard requires that the average temperature be maintained at around 21 °C, and it can be seen that the vehicle meets this requirement [46]. Furthermore, 21 °C can be considered the equilibrium temperature under the test conditions. This temperature was later used to verify the reliability of the three-dimensional numerical model. In addition, 21 °C was also used as the target temperature in the subsequent optimization study.

2.3. Three-Dimensional Numerical Model

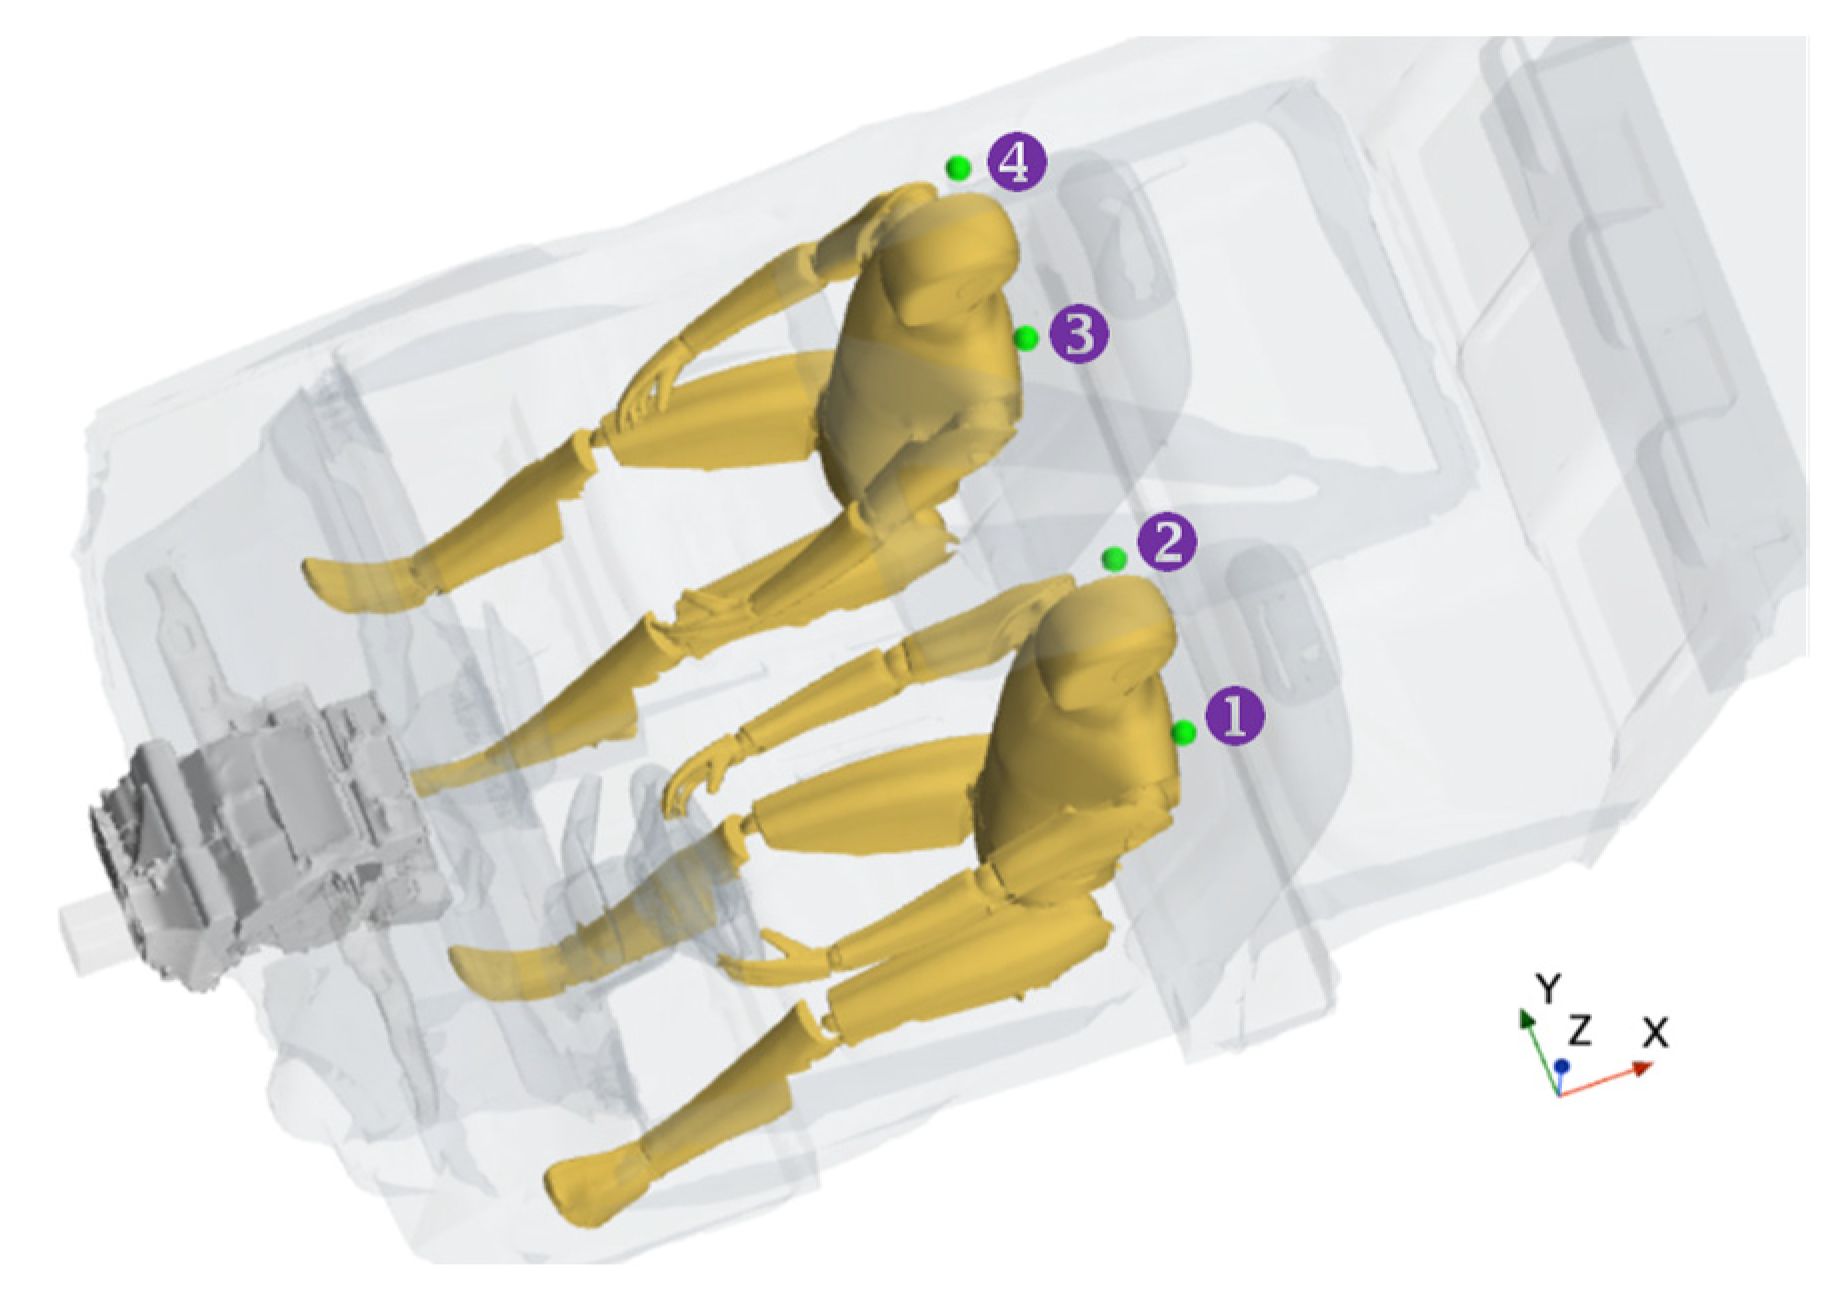
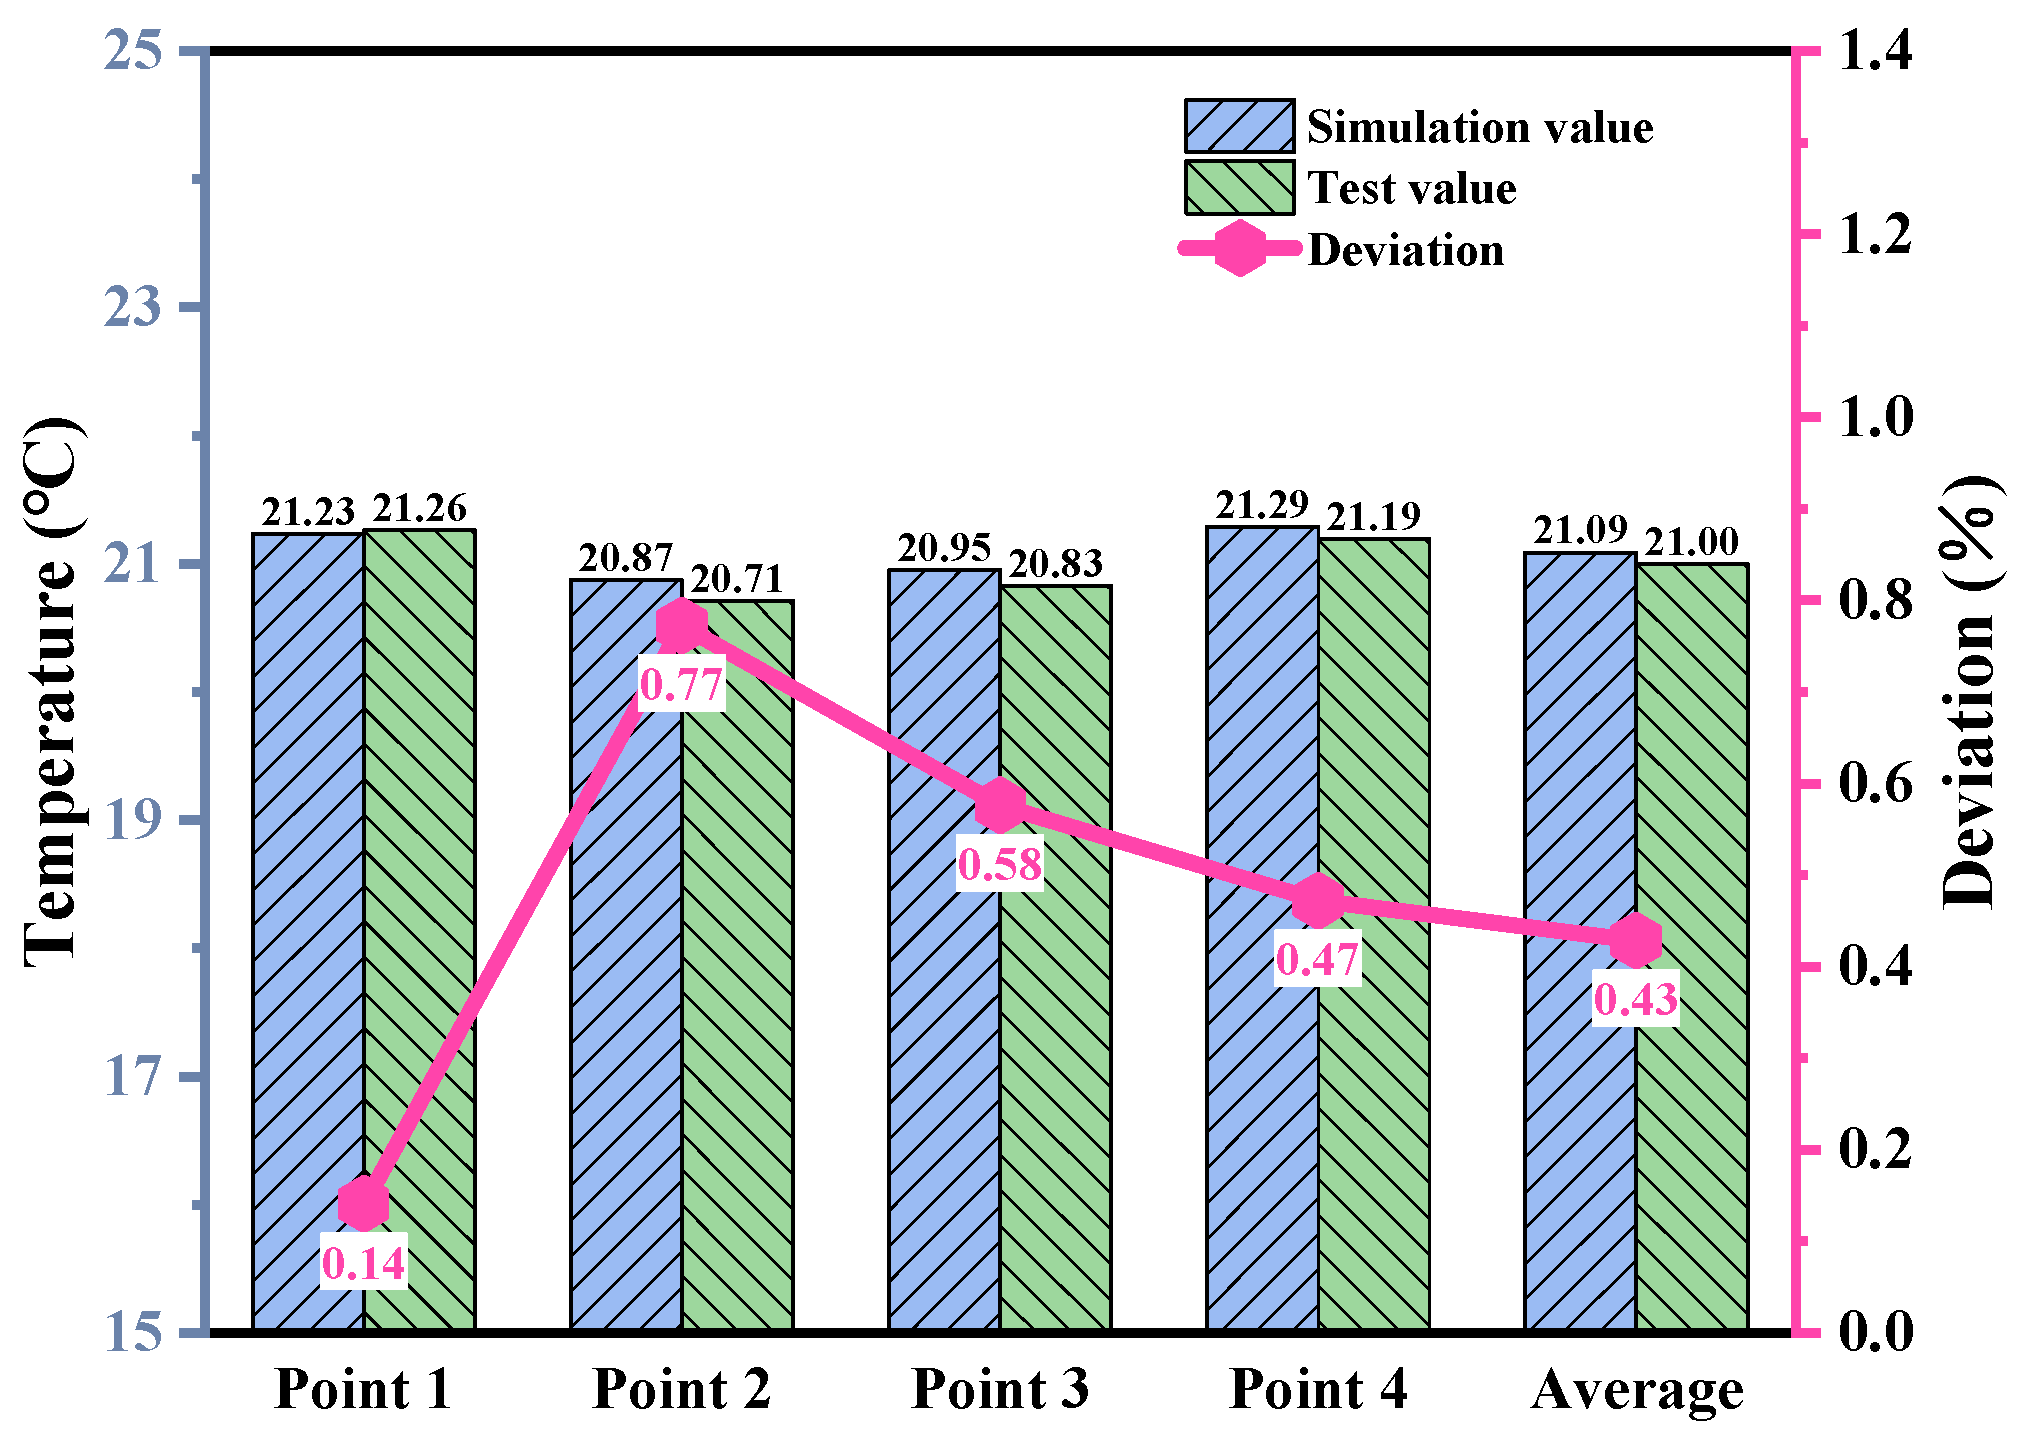
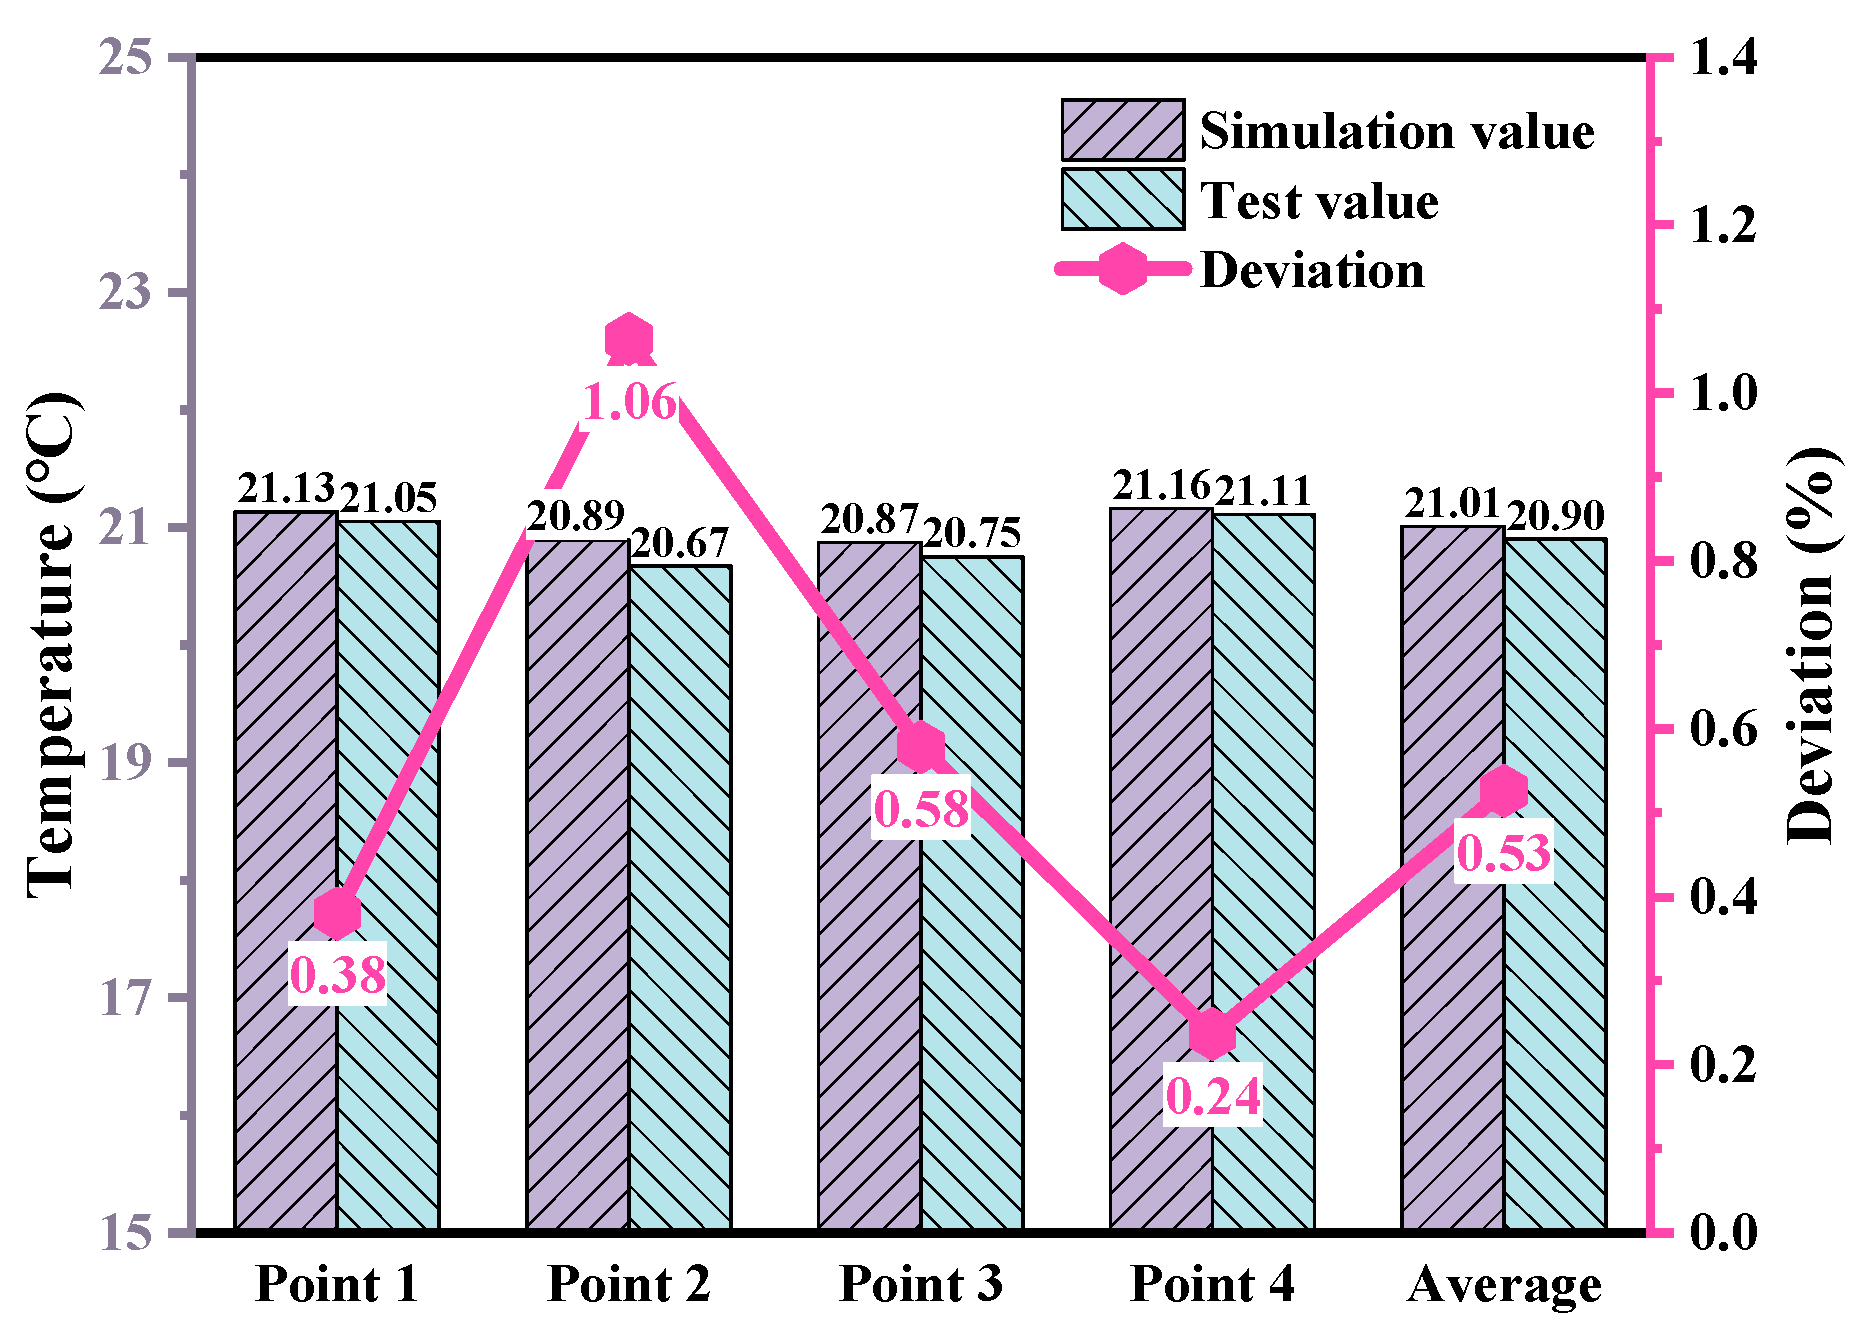
2.3.1. Establishment and Verification of the Three-Dimensional Numerical Model

A three-dimensional numerical model was established based on STAR-CCM+ 18.04 software, including the passenger compartment, dummy, air conditioning box, air duct, air conditioning outlet, etc. The air conditioning box includes the evaporator and PTC core, and the passenger compartment includes the doors, roof, windows, console, seats, etc. Figure 11 shows the three-dimensional numerical model. It should be pointed out that the numerical model starts from the blower outlet and omits the route from the fresh air inlet under the front windshield to the blower. The pressure drop for this section used in subsequent research was provided by the manufacturer. Some minor features were appropriately ignored or simplified in the pre-processing stage. All the pre-processing works were completed in STAR-CCM+ software, including surface repair, surface wrap, re-mesh, and volume mesh generation. In order to calculate the pressure drop from the blower outlet to the air conditioning outlet, the evaporator and PTC core were set as porous regions [48]. The polyhedral mesher and prism layer mesher were used, and mesh encryption was set for key areas such as the air conditioning outlets. After analyzing the temperature of the measurement point calculated with different numbers of cells, it was found that about 5.8 million cells could better balance the numerical accuracy and calculation time. At this time, the base size was set to 10 mm, the prism layer total thickness was set to 2 mm, the volume growth rate was set to 1.2, and the maximum test size was set to 50 mm.
A three-dimensional simulation of the benchmark working condition was performed in accordance with the vehicle test. In the simulation model, it was assumed that the PTC power was constant, the air was incompressible, the air conditioning external circulation ratio was constant, and the external ambient temperature was constant. The inlet was set to a mass flow inlet with an airflow rate of 60 dm3/s, of which the fresh airflow rate was 15 dm3/s. The model outlet was set to a pressure outlet with a reference pressure of 1 atmosphere. The vehicle surface boundary was set to the third thermal boundary condition. The convective heat transfer coefficients of the windows, roof, doors, and console were set to 7.9 W/m2·°C, 44.5 W/m2·°C, 44.5 W/m2·°C, and 22.3 W/m2·°C, respectively. The ambient and initial temperatures were set to −7 °C, and the PTC heating power was set to 1300 W. The metabolic rate of the dummy was set to 58 W/m2. The air density was set to 1.18415 kg/m3. Four temperature measurement points were set in the numerical model in accordance with the requirements of the standard mentioned above, as shown in Figure 12.
The steady-state simulation was run. After the calculation converged, the temperatures of the four measurement points were recorded and compared with the vehicle test values. The results are shown in Figure 13. It can be seen that the temperature simulation values of the four measurement points are in good agreement with the test values, all of which are around 21 °C. The maximum temperature difference does not exceed 0.2 °C, and the maximum error is within 1%. The numerical model can reflect the actual situation well, indicating that the model has sufficient reliability for subsequent research.

2.3.2. Using the Numerical Model to Study the Influence of PTC Power and Airflow Rate on Temperature

The main purpose of this study is to reduce the total power consumption of the PTC and blower. Since the heat generation power of the PTC can be considered the actual power consumed by the PTC, while the airflow rate and the corresponding pressure drop determine the power consumed by the blower, it is necessary to study the influence of PTC power and airflow rate on the temperatures of the measurement points. As shown in Table 2, based on the benchmark working conditions and experience, the PTC power was set to 1000 W, 1150 W, 1300 W, 1450 W, and 1600 W, and the airflow rate of the air conditioning system was set to 15 dm3/s, 30 dm3/s, 60 dm3/s, 90 dm3/s, 120 dm3/s, and 150 dm3/s, a total of 30 working conditions. Among them, working condition 3-3 can be regarded as the benchmark working condition that was simulated. The main purpose of the external circulation of the air conditioning system includes two aspects, one is to provide fresh air to prevent the high CO2 concentration in the passenger compartment from affecting the attention of the driver and passengers to ensure driving safety, and the other is to balance the humidity in the compartment to prevent the front windshield from fogging and affecting driving vision and safety [32,49,50]. The fresh airflow rate was set to 15 dm3/s in all of the above 30 working conditions. The steady-state simulations were run. After these calculations converged, the temperatures of the measurement points were recorded, and the average temperatures of the four measurement points were calculated. The results are shown in Table 3.

3. Results and Discussion

3.1. Analysis of the Influence of PTC Power and Airflow Rate on Temperature and Determination of Alternative Working Conditions

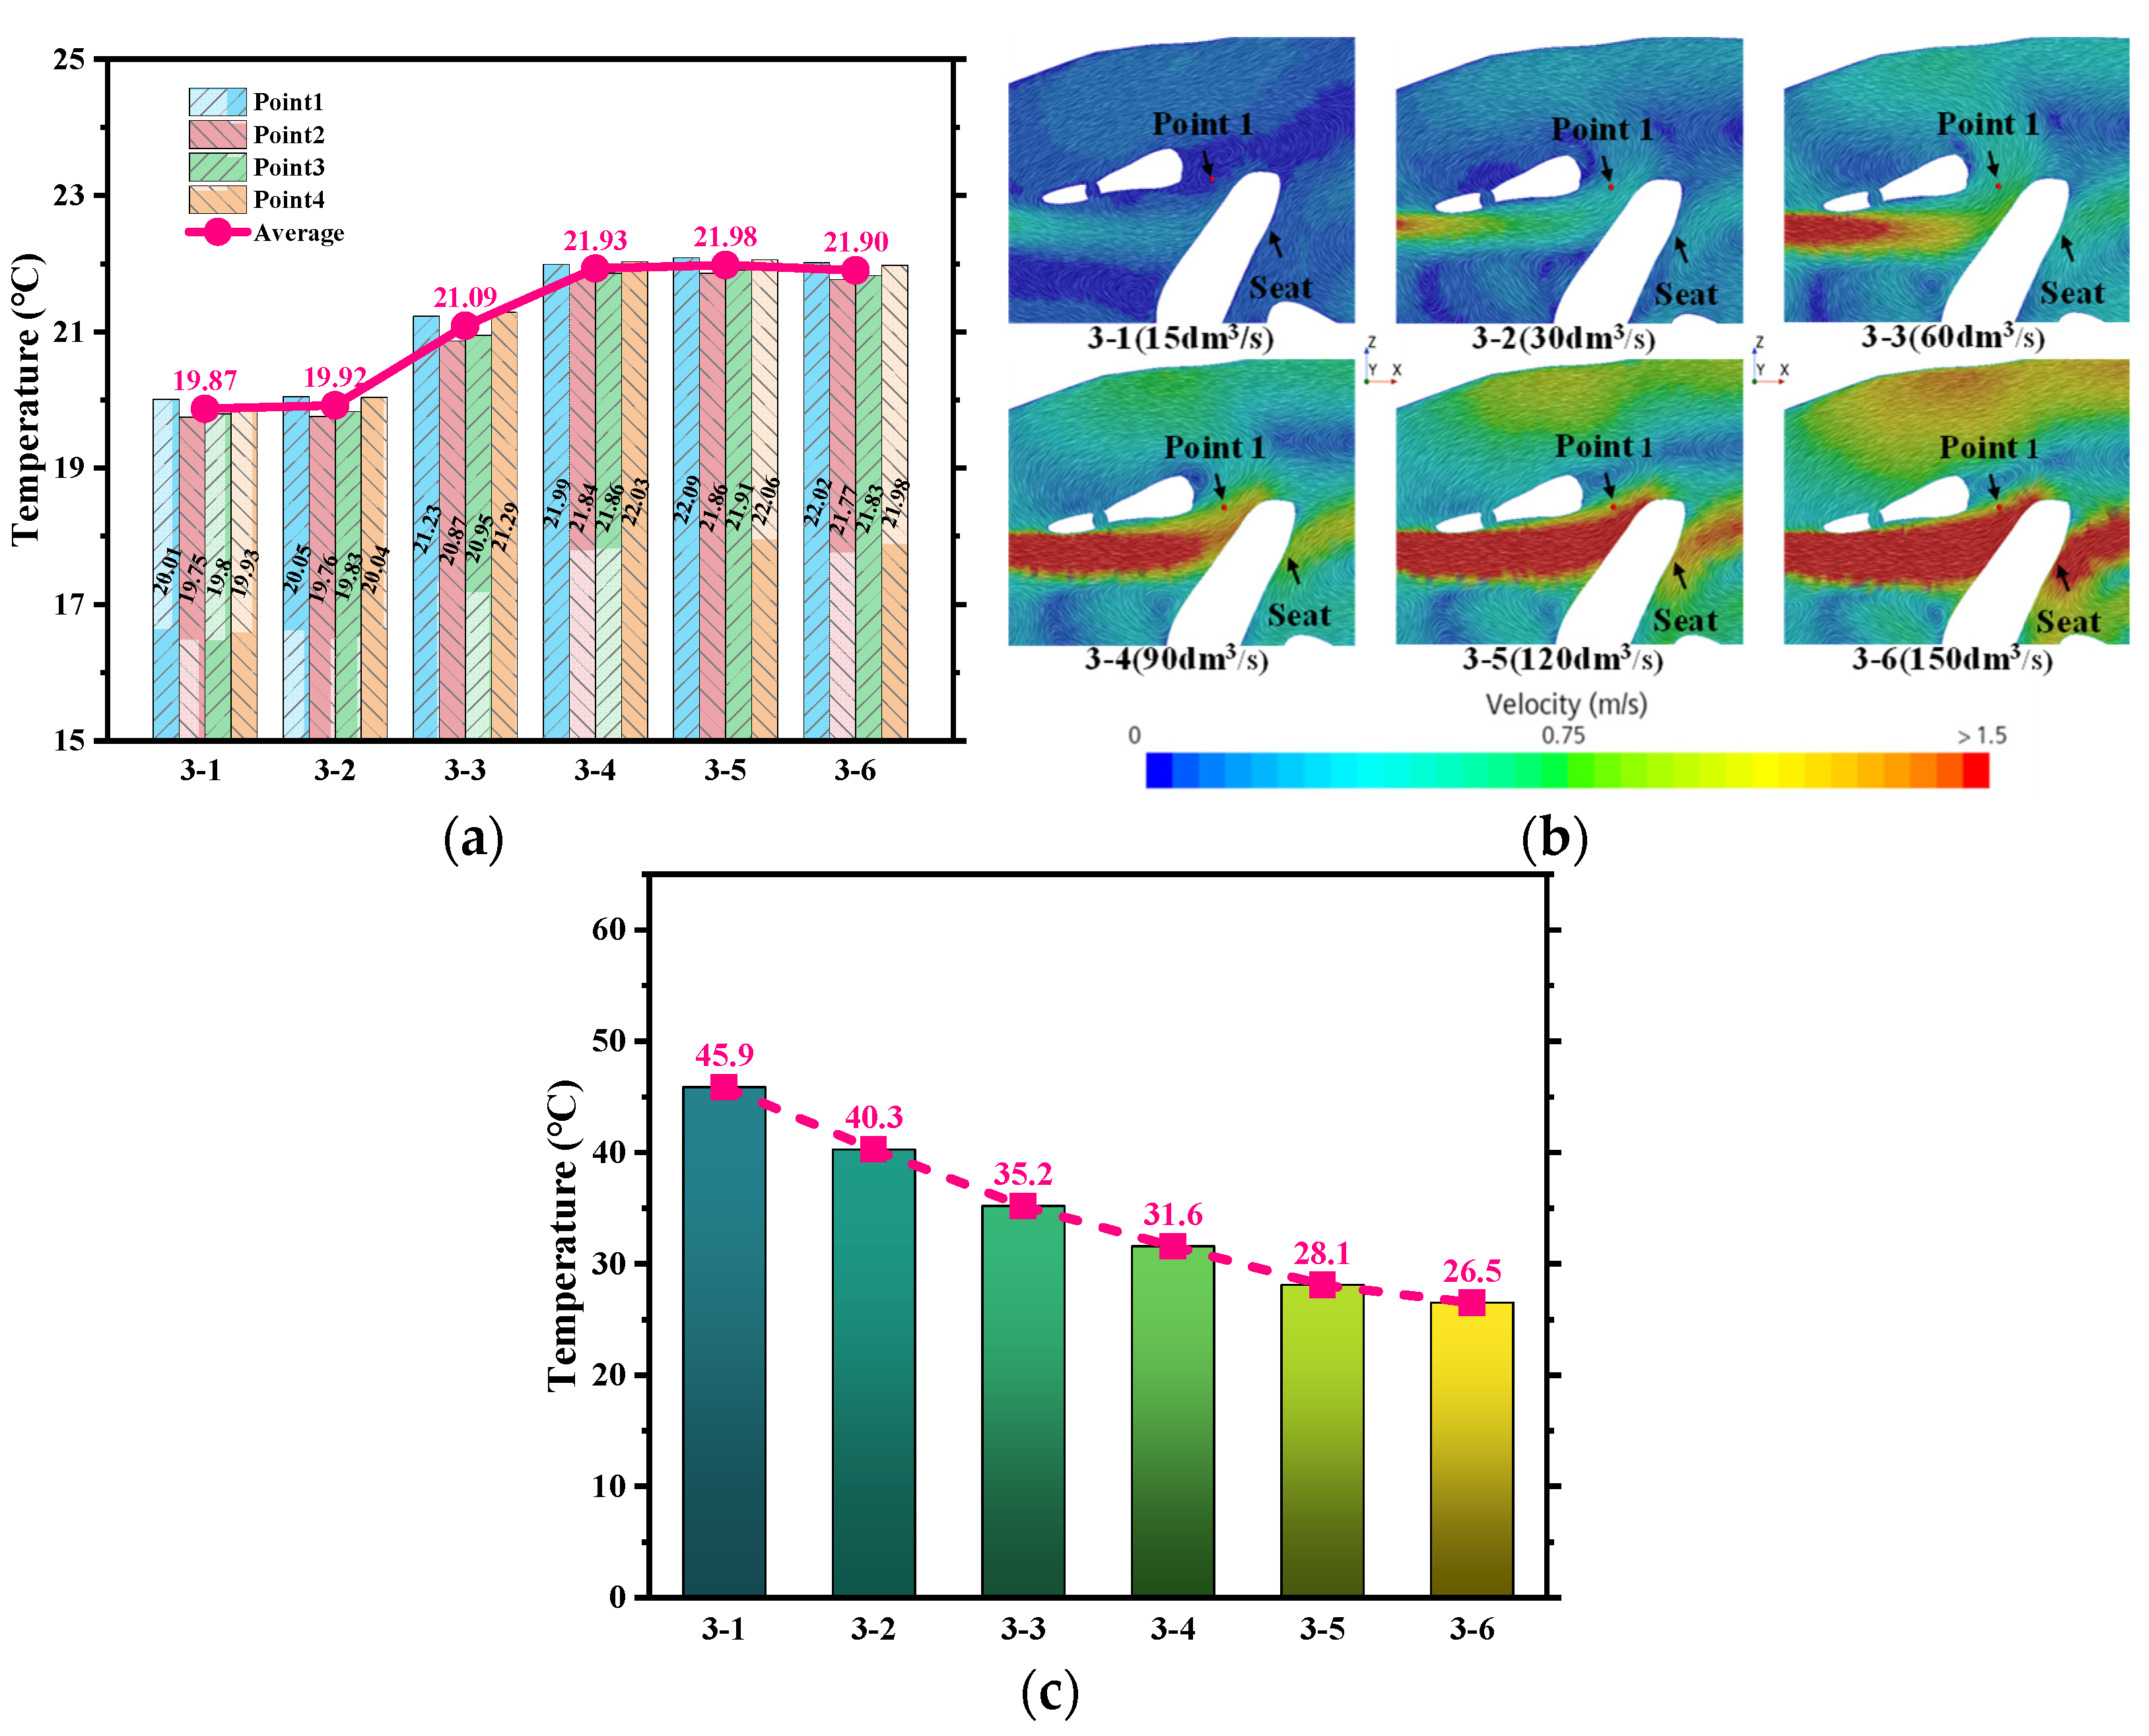
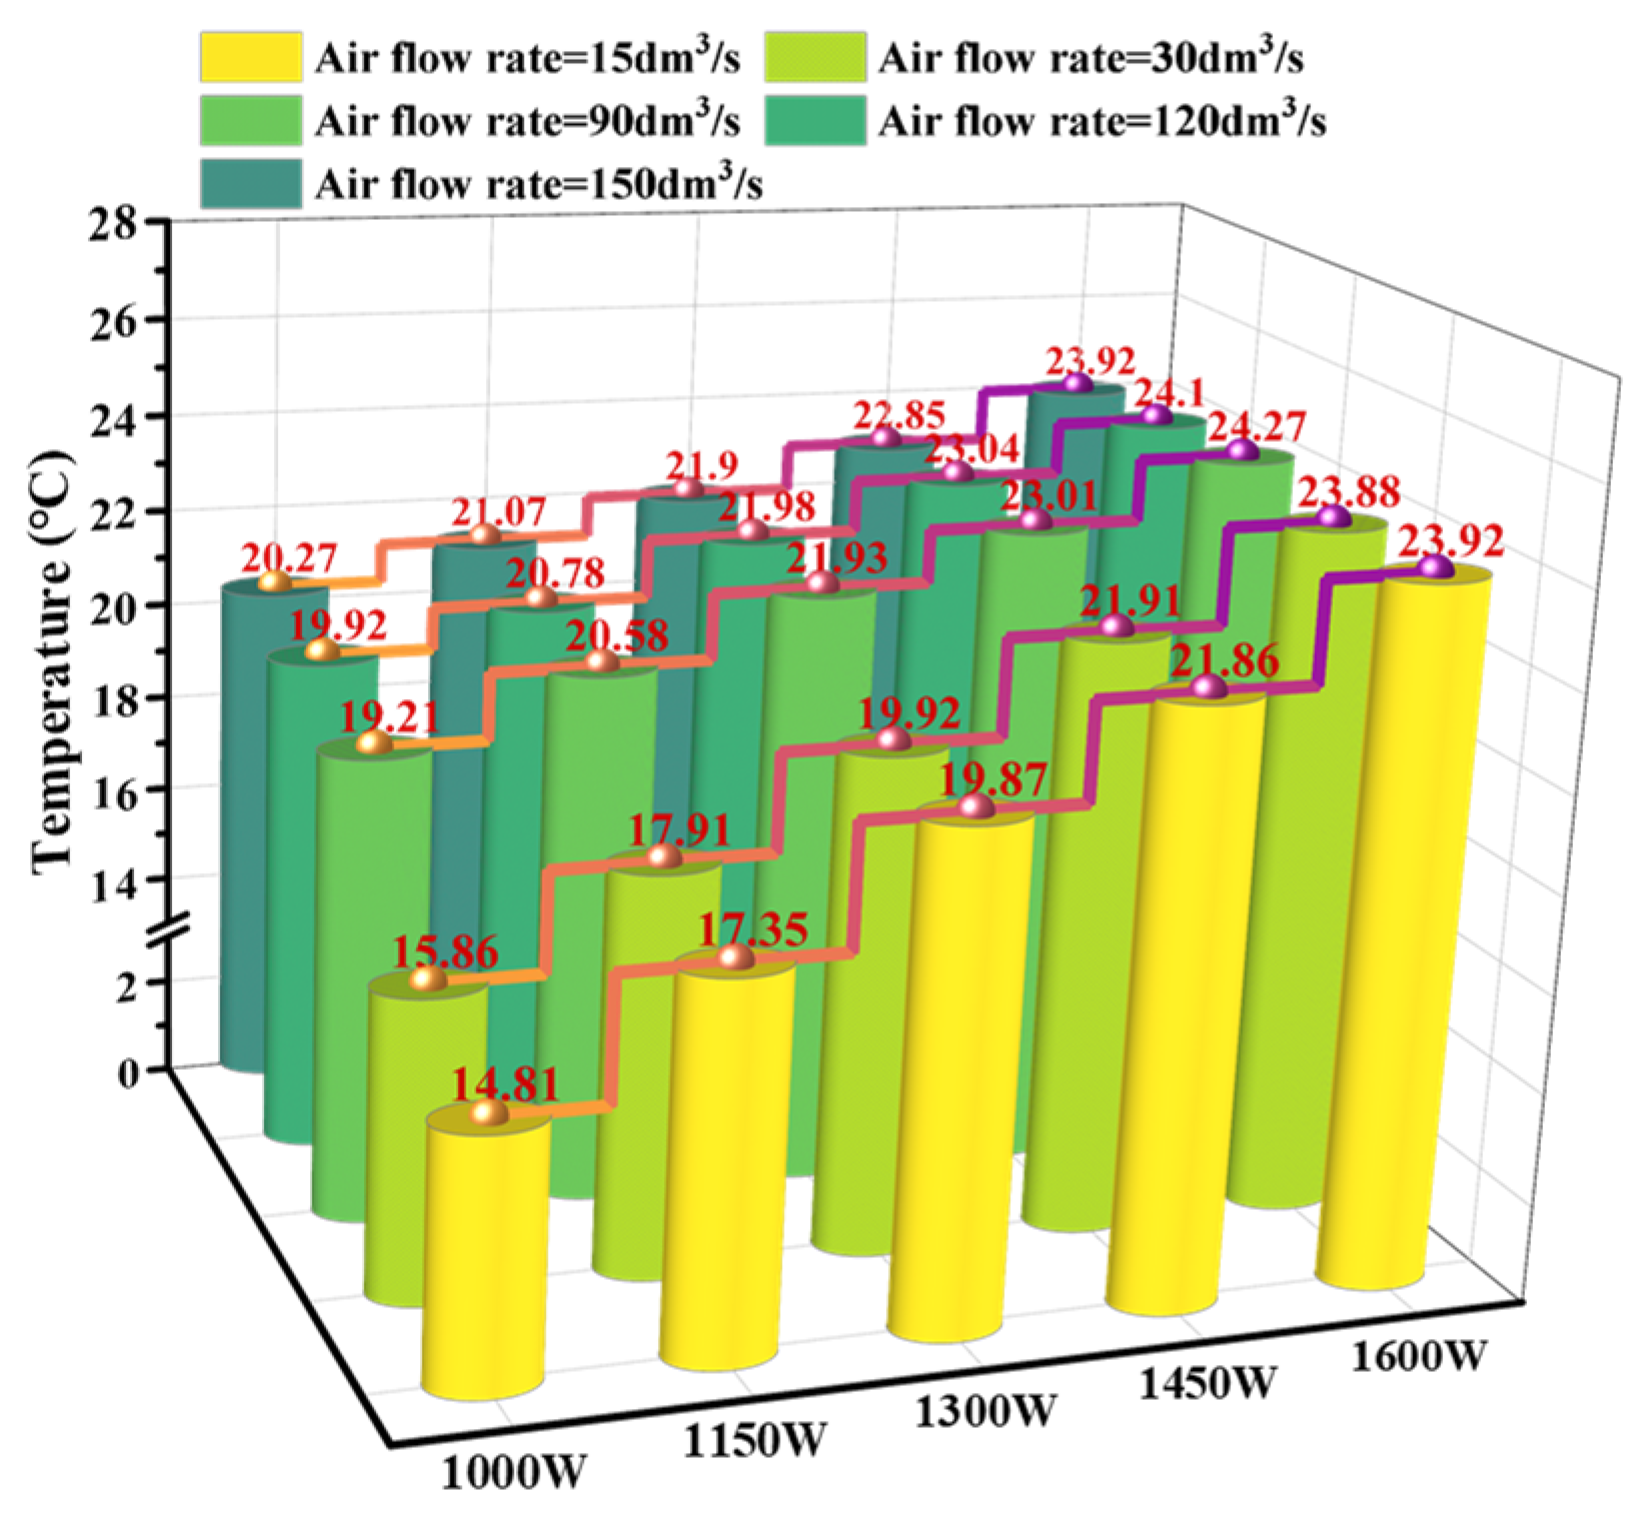
3.1.1. Analysis of Different Airflow Rates with the Same PTC Power

Figure 14a shows the temperature simulation results of the measurement points for the six working conditions with a PTC power of 1300 W. It can be seen from the figure that, under the same PTC power, with the increase in airflow rate, the temperatures of the four measurement points essentially show a trend of gradually increasing. When the airflow rate is 15 dm3/s, the average temperature of the measurement points reaches the minimum value of 19.87 °C; when the airflow rate is 120 dm3/s, the average temperature of the measurement points reaches the maximum value of 21.98 °C. Figure 14b shows the XZ-section velocity of point 1 in the above six working conditions. With the increase in airflow rate, the air velocity at the measurement point gradually increases. The difference in the velocity distribution of the flow field leads to a gradual increase in the temperature at the measurement point with the increase in the airflow rate. However, when the airflow rate continues to increase to 150 dm3/s, the temperatures of the measurement points do not continue to increase and are basically the same as the temperatures at 120 dm3/s with a slight decrease. Figure 14c shows the changes in the average temperature at the air conditioning outlets for the six working conditions. It can be seen that as the airflow rate increases, the average temperature gradually decreases. This explains why the increase in airflow rate does not always increase the temperature of the measurement point; that is, the decrease in air outlet temperature weakens the temperature gain brought by the increase in air velocity, and the excessive airflow rate may decrease the temperatures of the measurement points. In addition, Figure 14a shows that the temperatures at points 1 and 4 are slightly higher than at points 2 and 3. This is because the air outlets on the left and right sides of the air conditioning system are located slightly higher than the two middle air outlets. At the same time, the air volume at the two side air outlets is also slightly higher than that at the two middle air outlets.
Figure 15 shows the comparison of the average temperatures of the measurement points at different airflow rates when the PTC power is 1000 W, 1150 W, 1450 W, and 1600 W, respectively. It can be seen that when the PTC power is the same, as the airflow rate increases, the average temperature gradually increases, and its change trend is similar to that when the PTC power is 1300 W. In general, when the PTC power is the same, increasing the airflow rate can increase the temperatures of the measurement points, but an excessive airflow rate may have the opposite effect.

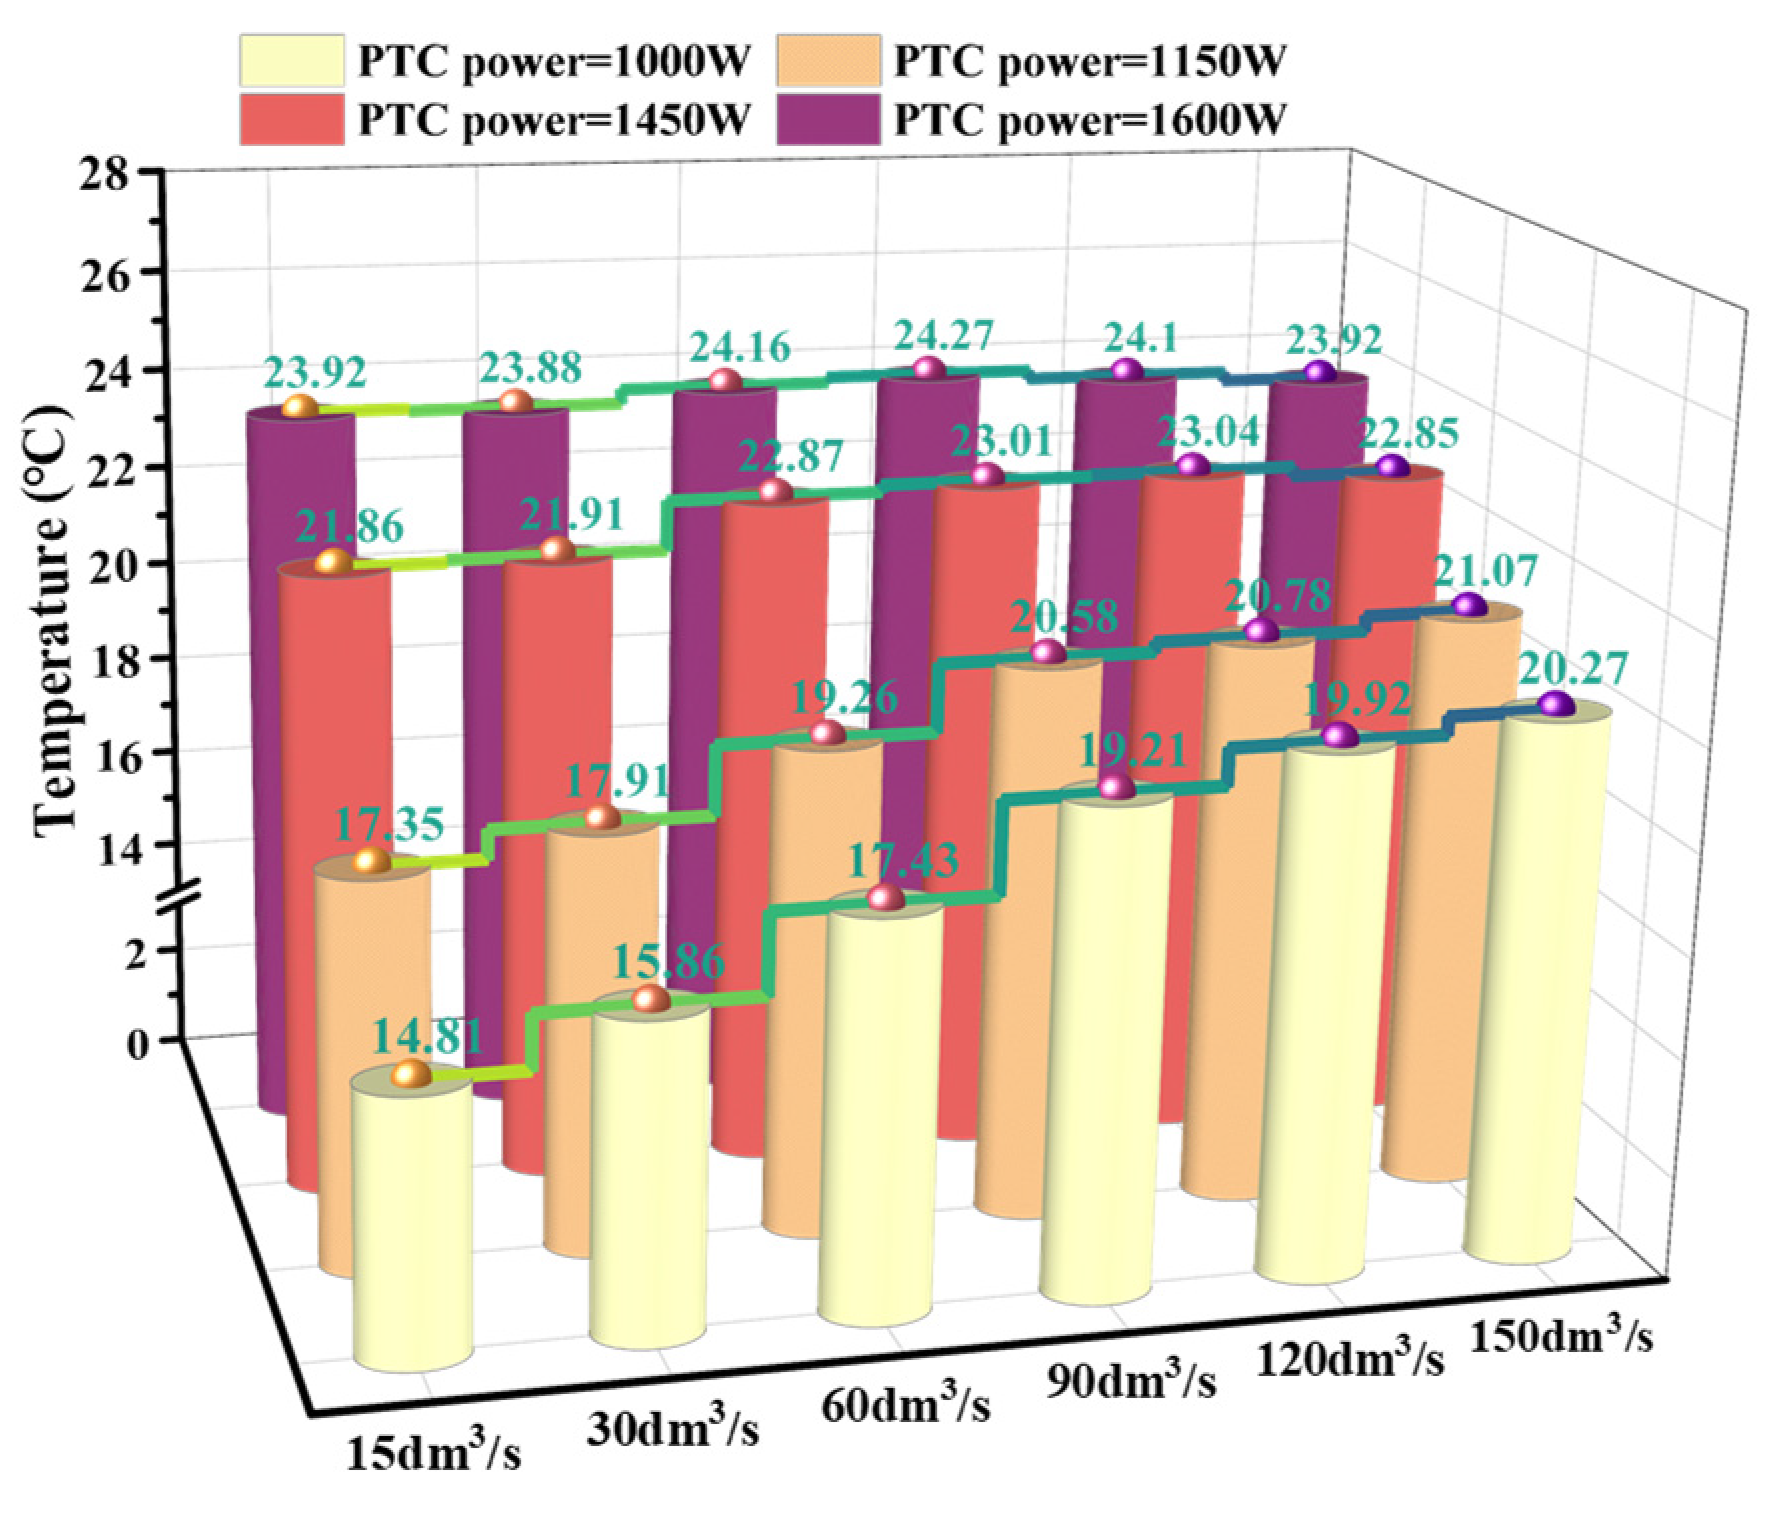
3.1.2. Analysis of Different PTC Powers with the Same Airflow Rate

Figure 16 shows the temperature simulation results for the five working conditions with an airflow rate of 60 dm3/s. It can be seen from the figure that when the airflow rate is the same, as the PTC power increases, the temperatures of the measurement points gradually increase. This is because when the airflow rate remains unchanged, the increase in PTC power will increase the air temperatures at the air conditioning outlets, thereby increasing the temperatures at the measurement points.
Figure 17 shows a comparison of the average temperatures of the measurement points at different PTC powers when the airflow rate is 15 dm3/s, 30 dm3/s, 90 dm3/s, 120 dm3/s, and 150 dm3/s, respectively. It can be seen that when the airflow rate is the same, as the PTC power increases, the average temperature gradually increases. For every 150 W increase in PTC power, the average temperature rises by about 1 °C.

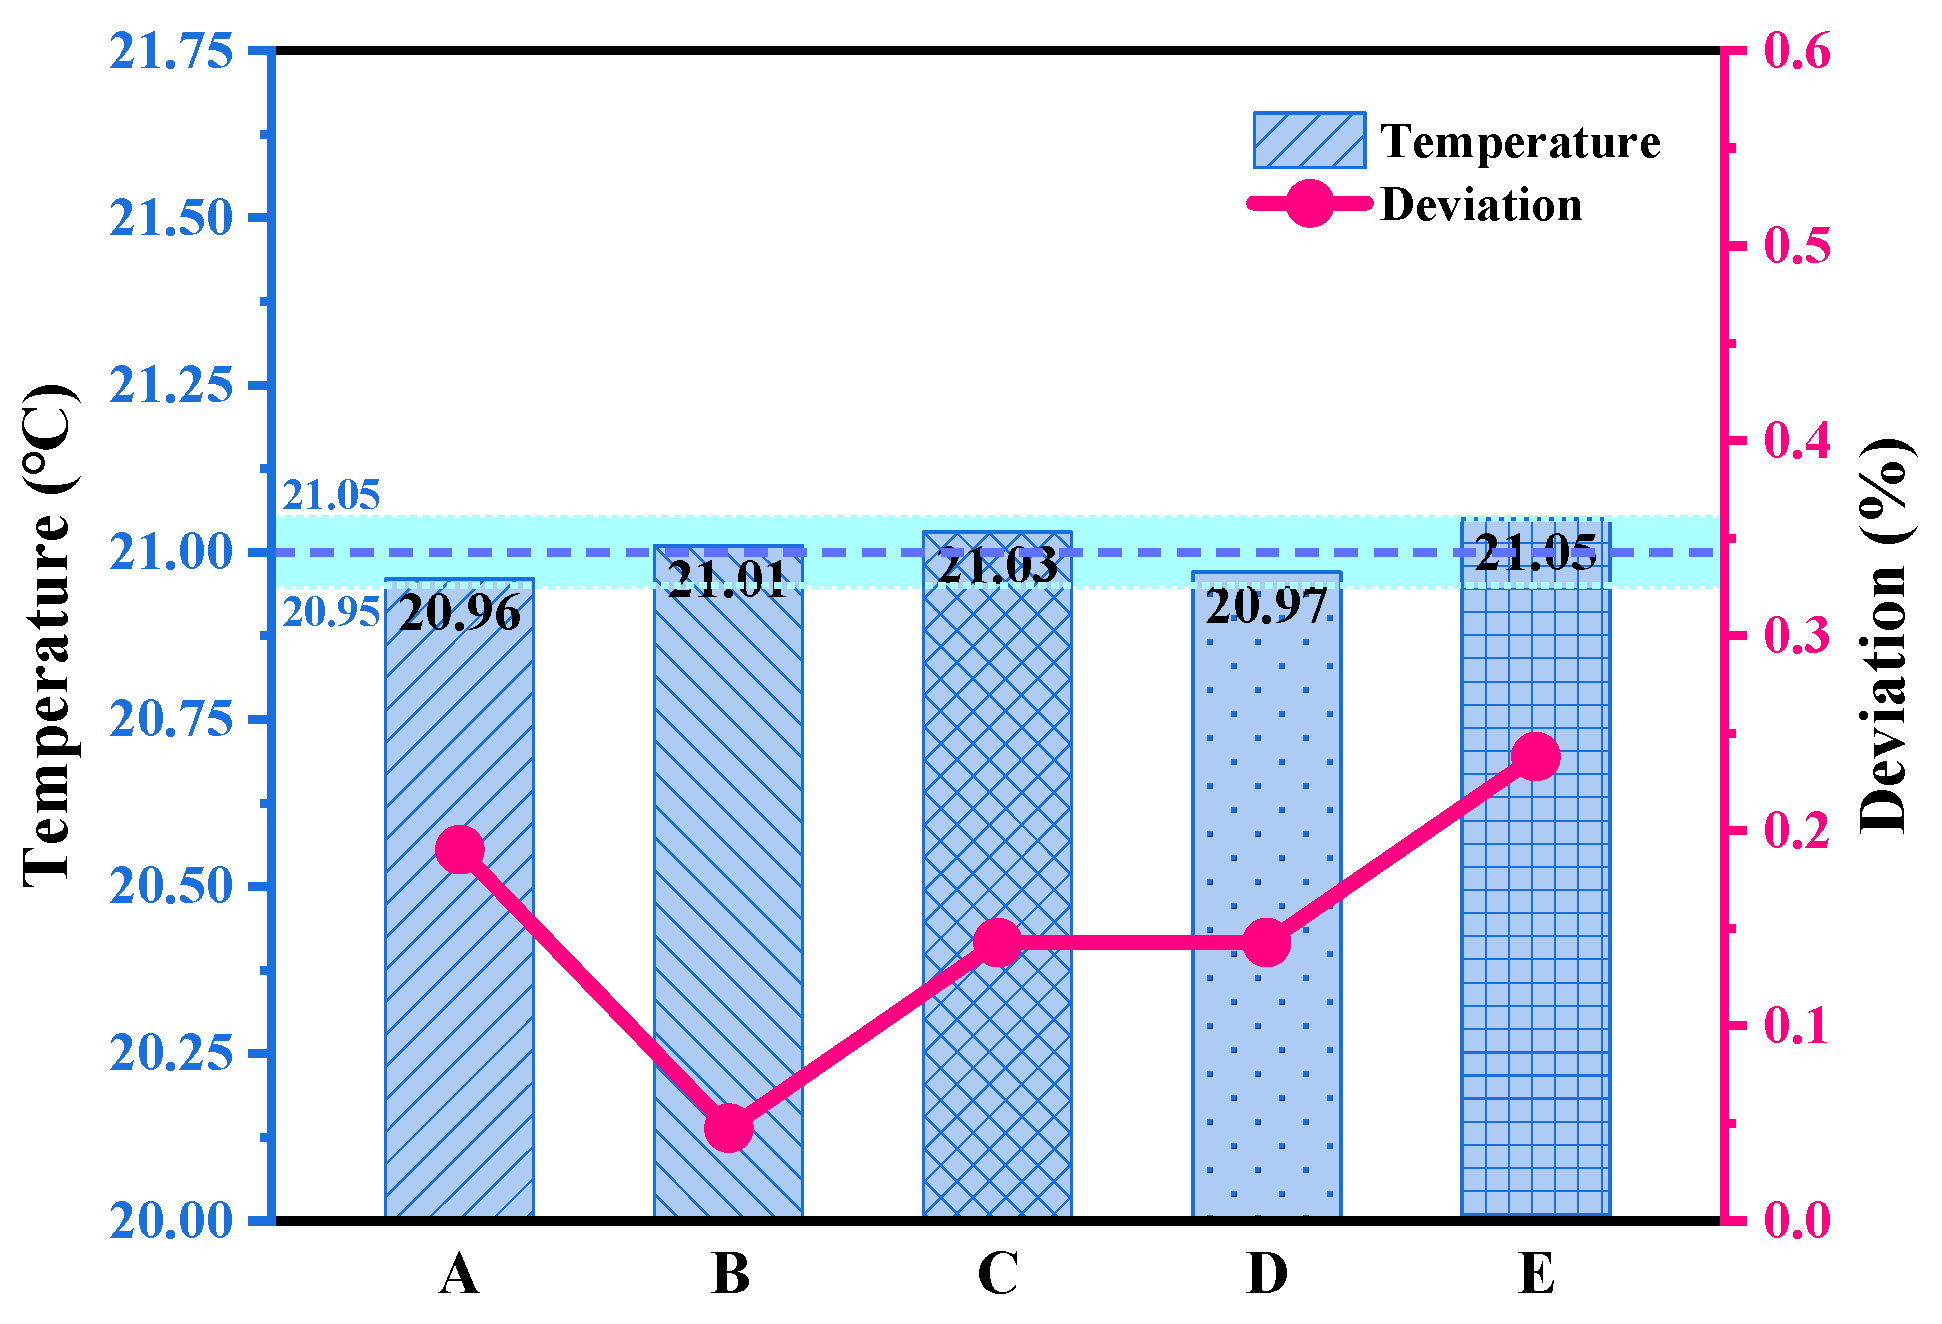
3.1.3. Determination of the Alternative Working Conditions

Based on the above analysis, either increasing the PTC power or increasing the airflow rate can increase the average temperature of the measurement points. Without considering the hardware limitation, both the PTC power and the airflow rate can be adjusted to reach a target temperature. This means that there are several combinations of PTC power and airflow rate that can meet the target temperature of 21 °C.
Figure 18 is the isothermal diagram of the average temperature of the measurement points versus PTC power and airflow rate drawn based on the simulation results. The lower left corner of the figure is the low-temperature area, the upper right corner is the high-temperature area, and the red mark in the middle is the isothermal line with a temperature of 21 °C. The alternative working conditions can be determined in combination with the isothermal line. Alternative working conditions were selected at intervals of 50 W starting from a PTC power of 1150 W. The details of the selected five working conditions are also marked in Figure 18. Among them, the PTC power corresponding to working condition D is 1300 W, and the airflow rate is 58 dm3/s, which is basically the same as the previously simulated benchmark working condition 3-3 and can be regarded as the benchmark working condition.
The simulations were run for the above alternative working conditions, and the average temperatures of the measurement points were collected. The results are shown in Figure 19. The average temperatures are all around 21 °C, and the maximum deviation from 21 °C does not exceed 0.5%. All the working conditions meet the target temperature requirement, indicating that these working conditions are comparable.

3.2. Optimization and Discussion of the Low-Temperature Energy Consumption of the Air Conditioning System

According to Equation (11), the total pressure of the blower can be calculated by summing the pressure drops of the two sections of the pipeline before and after the blower. The pressure drop P D 1 from the fresh air inlet to the blower inlet was given by the manufacturer, as shown in Figure 20. The resistance of the circulating air in the subsequent calculation will also be approximated by this. The pressure drop from the blower outlet to the air conditioning outlet is determined by the three-dimensional simulation.
Firstly, the theoretical total power of each alternative working condition was calculated and analyzed, and then the actual total power of each alternative working condition was calculated based on the efficiency characteristic of the blower.

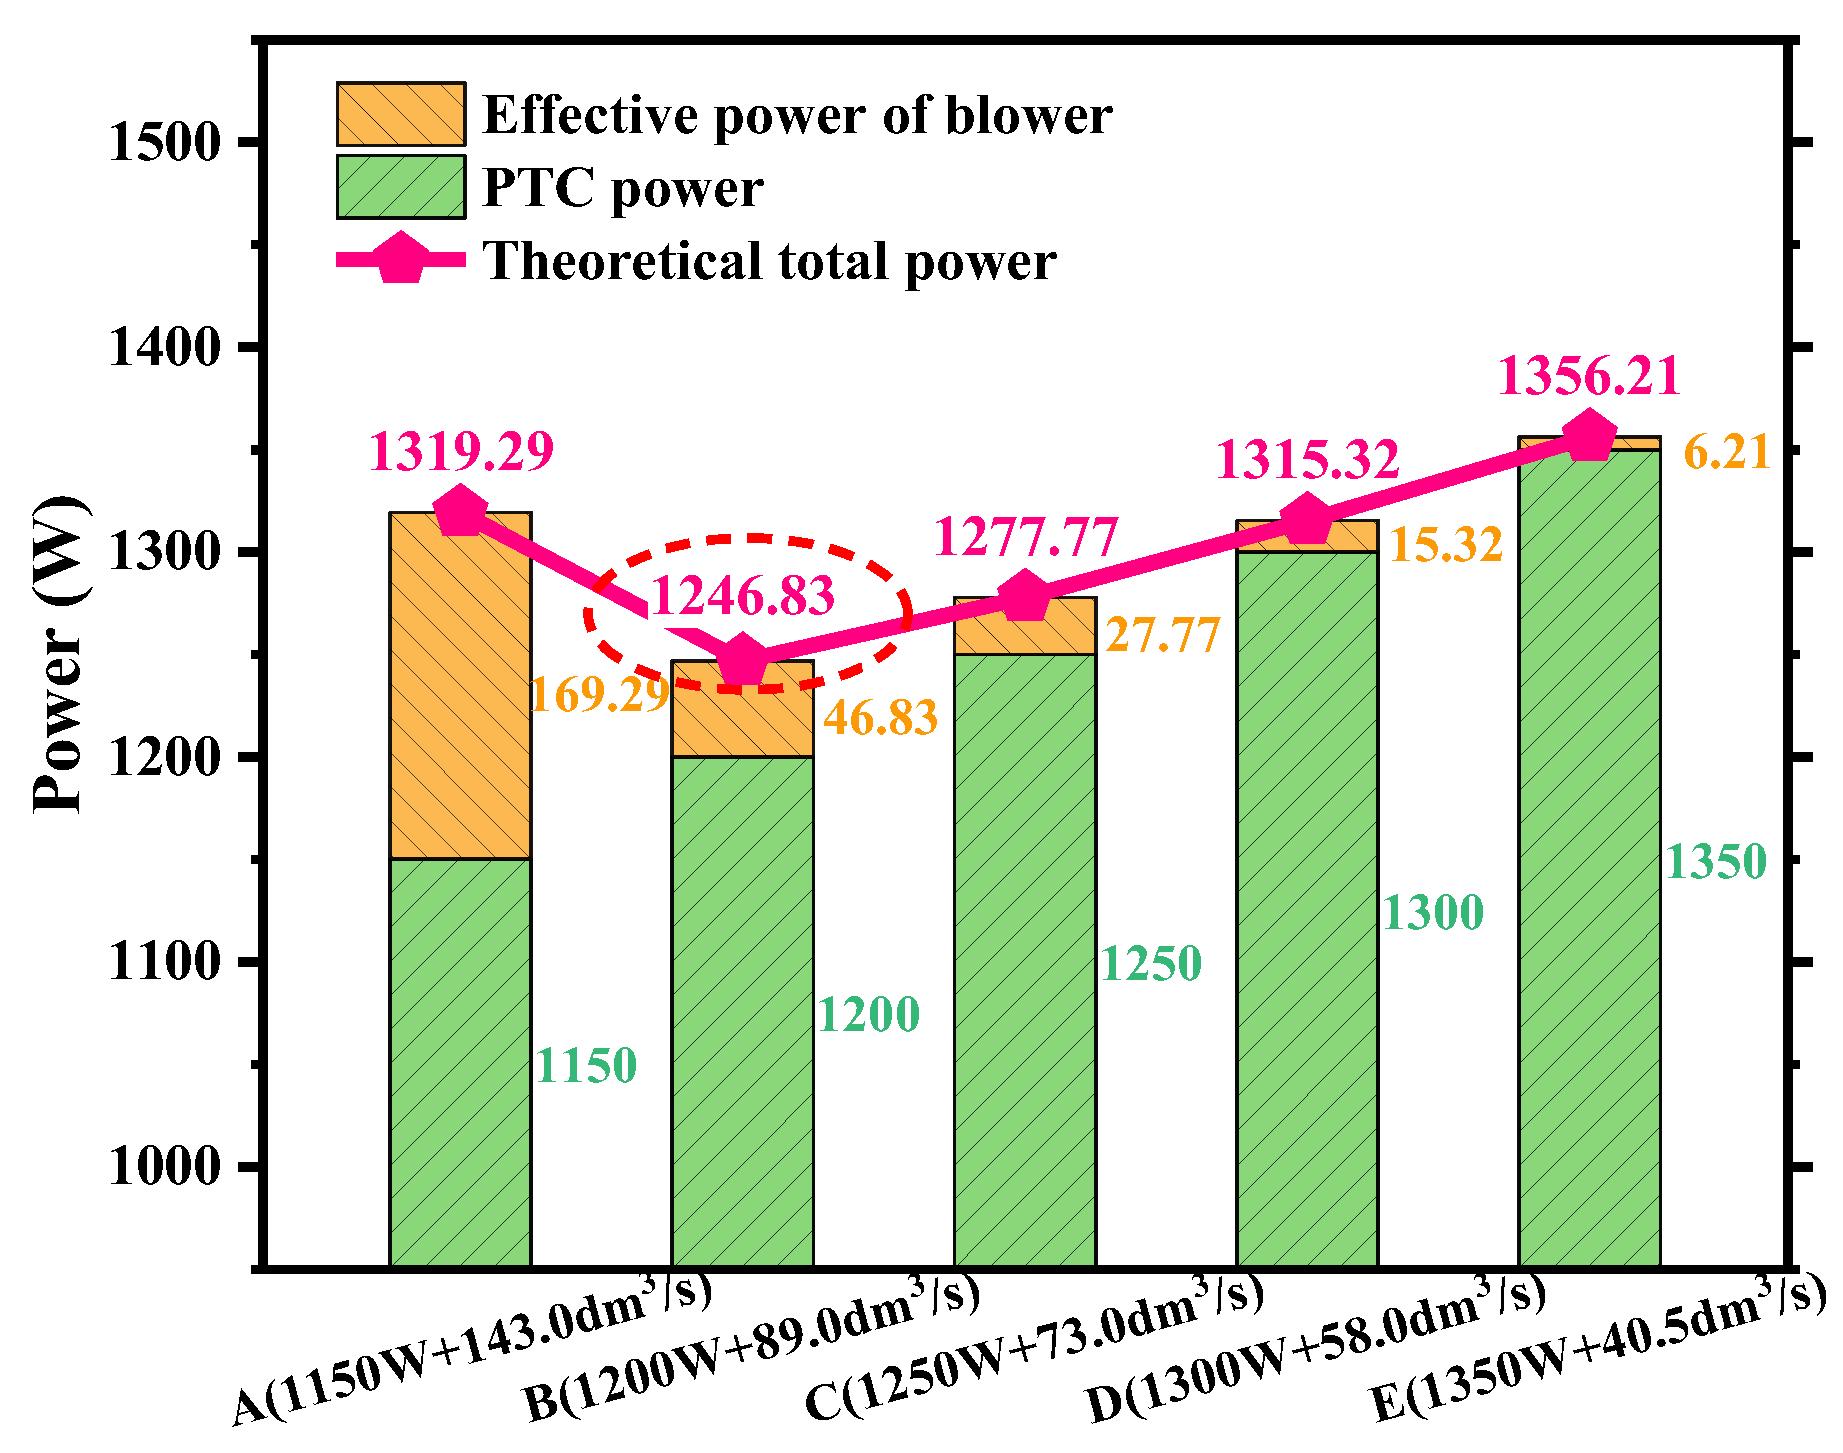
3.2.1. Optimization of the Theoretical Total Power of the Air Conditioning System

According to Equations (3) and (11), the effective power of the blower under the five alternative working conditions that met the temperature requirement was calculated. The results are shown in Table 4. Obviously, the smaller the airflow rate, the smaller the effective power of the blower.
Figure 21 shows the comparison of the theoretical total powers of the five alternative working conditions. It can be seen that the theoretical total power of working condition E, which has the highest PTC power, and working condition A, which has the highest blower power, are both at high values. Working condition B has the lowest theoretical total power. Compared with the benchmark working condition D, the theoretical total power is reduced by 68.49 W, a decrease of 5.21%.

3.2.2. Optimization of the Actual Total Power of the Air Conditioning System Considering the Blower Efficiency

Figure 22 shows the blower efficiencies corresponding to the five alternative working conditions. Working condition A is outside the range of the iso-efficiency diagram, and without prejudice to the conclusions, the maximum efficiency of 42% was taken for this working condition in the later calculation.
The actual total power of the air conditioning system under the five alternative working conditions was calculated, and the results are shown in Figure 23. It can be seen that the lowest actual total power still occurs in working condition B. However, at this time, the actual total power of working condition C is basically the same as that of working condition B. This result is different from the result of the theoretical total power when only the effective power of the blower is considered. Working condition B has higher efficiency than working condition C, but when the blower efficiency is taken into account, the advantage of the low theoretical total power of working condition B is weakened. This is because the advantage of the low theoretical total power of working condition B mainly comes from its lower PTC power, and its blower effective power is larger than that of working condition C. After considering the blower efficiency, the weakness of the absolute value of its blower effective power is further amplified, resulting in its actual total power being basically equivalent to that of working condition C. This indicates that it is necessary to consider the blower efficiency during the study. Although working condition A has the highest blower efficiency and the smallest PTC power, its blower effective power is too large in absolute value, resulting in its actual total power remaining the largest. Similarly, although working condition E has the lowest blower efficiency and the largest PTC power, its blower effective power is small in absolute value, resulting in its actual total power not showing a significant disadvantage.
In general, PTC power, airflow rate, and blower efficiency have a great impact on the actual total power of the air conditioning system. Simply reducing PTC power and airflow rate or simply pursuing the blower to operate in the highest efficiency range cannot guarantee a satisfactory actual total power consumption. The actual total power of working condition B selected by the optimization method in this paper is reduced by 23.49 W compared with the benchmark working condition D, a decrease of 1.74%.

3.2.3. Experimental Verification of the Optimization Result

The optimized scheme was tested to verify the reliability of the research method. The test was still carried out in the climatic chamber. During the test, the manufacturer controlled the PTC power and airflow rate to be consistent with the optimized scheme. After the temperatures of the measurement points were balanced, the temperature data were recorded at a time interval of 1 s for five consecutive minutes. The test results were compared with the simulation results, as shown in Figure 24. It can be seen that the simulation values are basically consistent with the test values. The temperatures of the measurement points are around 21 °C, and the errors are within 2%, which verifies the reliability of the optimization result in this paper.

3.3. Summary of General Optimization Method for Low-Temperature Energy Consumption of BEV Air Conditioning Systems

The boundary conditions used in this study, such as ambient temperature, target temperature of the measurement point, and location of the temperature measurement point, are specific, but the research idea is instructive for other situations. At the same time, this research method is also instructive for the selection of blowers and the determination of control strategies for air conditioning systems. Reviewing the research process, a general low-temperature energy optimization method for the BEV air conditioning systems can be summarized as follows:
  • Determine the benchmark working conditions under the target boundary conditions through the vehicle test, and obtain the efficiency characteristic of the blower through the blower performance test as the basis of numerical simulation;
  • Clarify the influence of PTC power and airflow rate on the measurement point temperature through numerical simulation and obtain the isotherm diagram of the measurement point temperature versus PTC power and airflow rate;
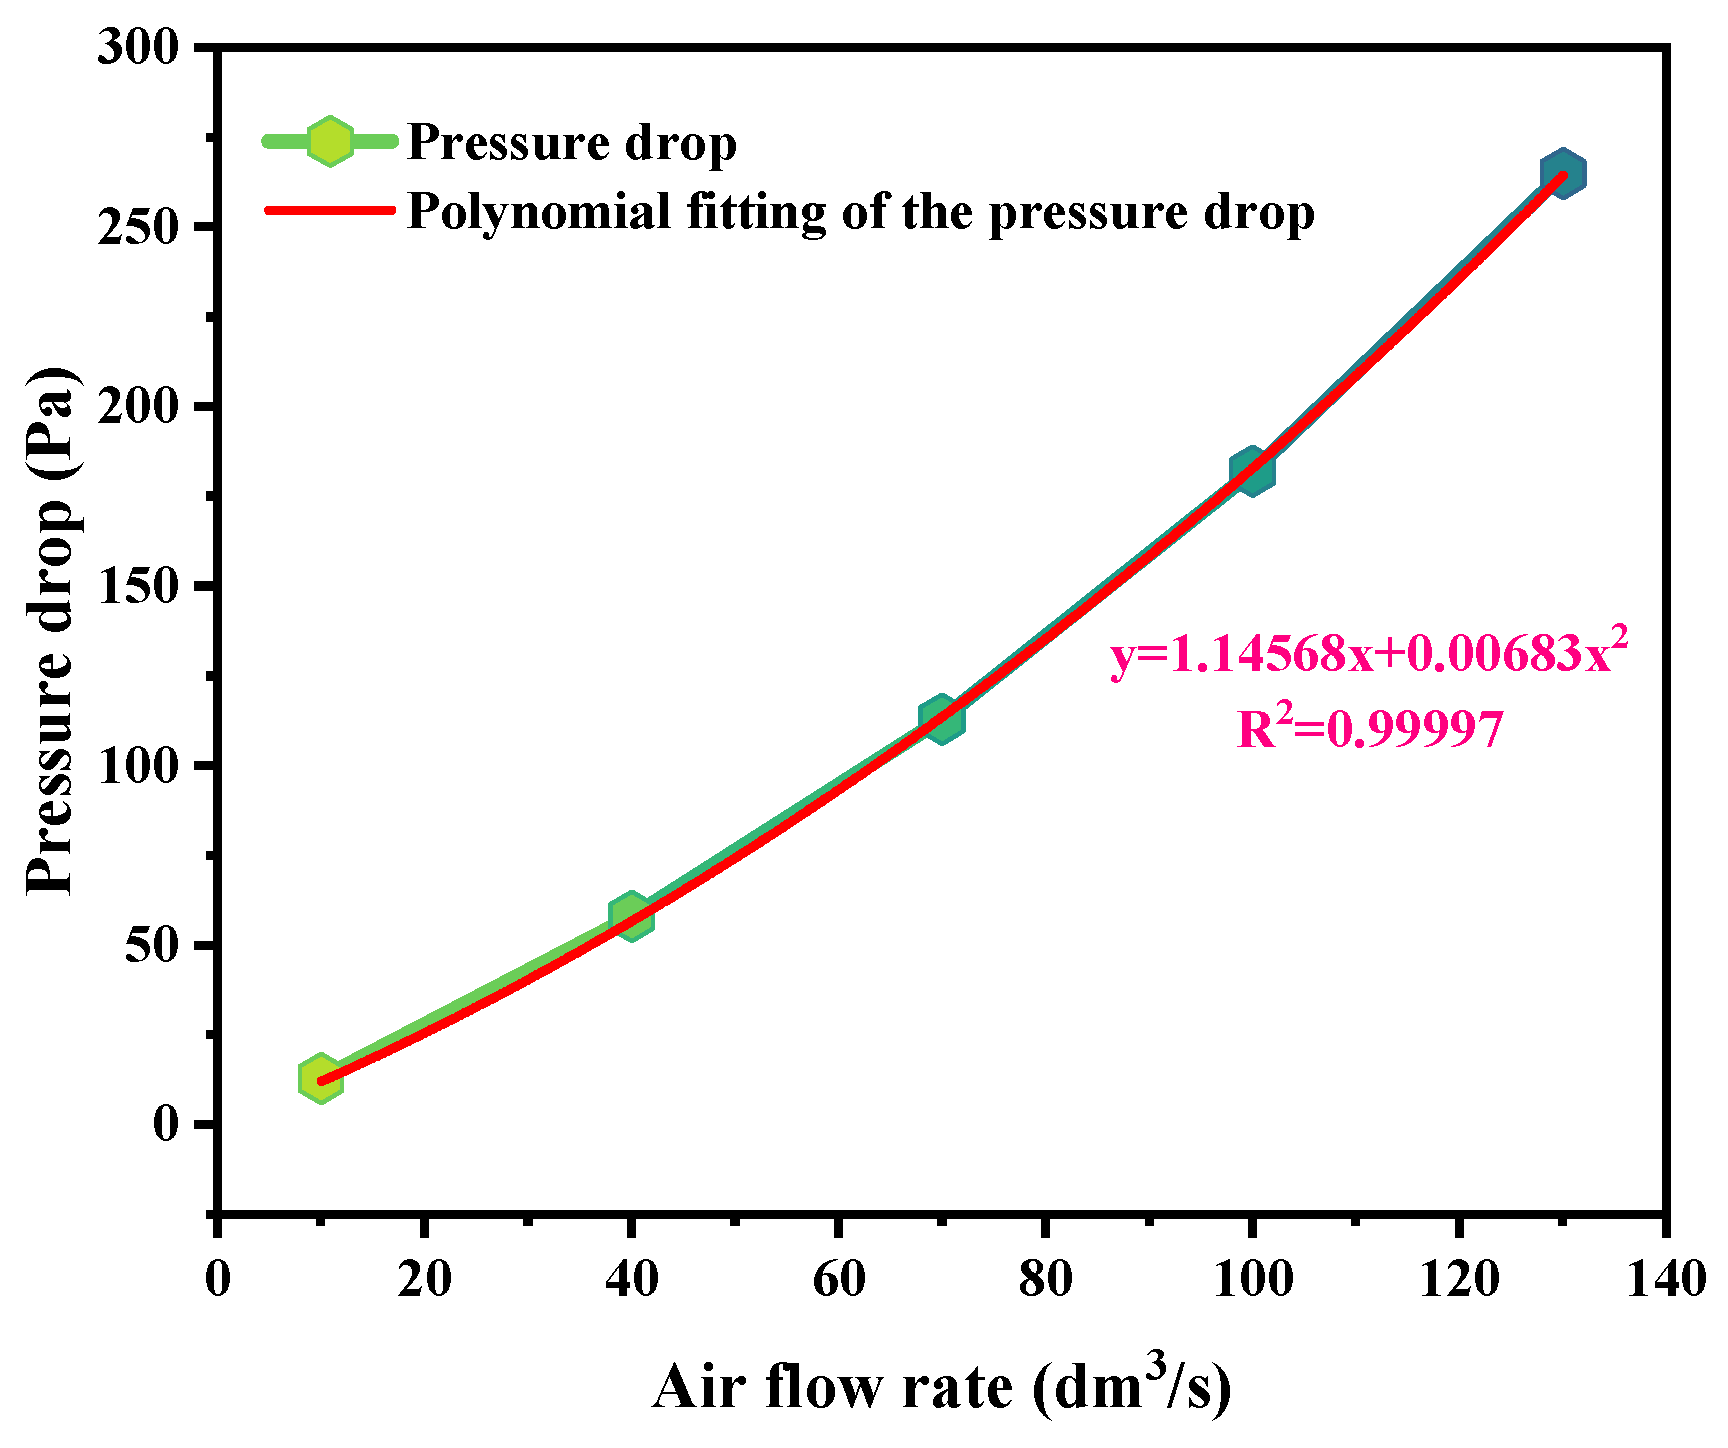
  • Determine the alternative working conditions based on the isotherm diagram and the target measurement point temperature. Run simulations to verify the measurement point temperature and obtain the pressure drop corresponding to each operating condition;
  • Calculate the actual total power of the air conditioning system corresponding to the alternative operating conditions based on the efficiency of the blower, and select the optimal working condition;
  • When there are multiple blowers as alternatives, this method can guide the comparative selection of blowers. When selecting, the optimal working condition of each blower should be obtained first, and then the blower that makes the actual total power consumption of the air conditioning system smaller should be selected. When the boundary conditions are changed or there are multiple boundary conditions, the total power consumption of the selected blower should be minimized under the commonly used conditions;
  • After the blower is selected or given, this method can guide the determination of the control strategies of the air conditioning system. The optimal working conditions for the actual total power consumption of the air conditioning system under various boundary conditions should be obtained first, and control strategies should be formulated to try to make the air conditioning system operate under the optimal working conditions under each boundary condition.

4. Conclusions

This study takes the minimum total power consumption of the air conditioning system as the research goal and optimizes the low-temperature energy consumption in combination with the blower efficiency. The research methodology helps to save energy and improve the range of BEVs, and it is also a guide for selecting the blower and designing the air conditioning system’s control strategies. This study did not consider the high-temperature environment and transient processes, nor did it consider human comfort. Further research may consider the above aspects. The main conclusions are as follows:
  • The concept of the total power consumption of the air conditioning systems at low temperatures was proposed as an evaluation indicator. The efficiency characteristic of the blower and the benchmark working condition of the three-dimensional numerical simulation can be obtained through experiments, and the test results can be used as the basis for the establishment and verification of the numerical model.
  • The numerical model can be used to study the influence of PTC power and airflow rate on the temperatures of the measuring points. When the PTC power is the same, the temperature gradually increases in general as the airflow rate increases; when the airflow rate is the same, the temperature also increases as the PTC power increases. The isotherm diagram obtained based on the simulation results can be used to determine alternative working conditions for optimization. The theoretical total power of the optimized scheme is reduced by 68.49 W, and the actual total power is reduced by 23.49 W. The optimization of the actual total power needs to comprehensively consider the influence of PTC power, airflow rate, and blower efficiency.
  • The general low-temperature energy consumption optimization method of BEV air conditioning systems proposed in this research can improve energy efficiency and drive range. It also has an instructive role in the selection of blowers and the development of control strategies.

Author Contributions

Conceptualization, D.Z.; methodology, J.N.; software, D.Z.; validation, D.Z. and J.N.; formal analysis, X.S.; writing—original draft preparation, D.Z.; writing—review and editing, D.Z. and J.N.; project administration, J.N.; funding acquisition, J.N. and X.S. All authors have read and agreed to the published version of the manuscript.

Funding

This research was funded by the National Natural Science Foundation of China Youth Science Foundation project (Grant No. 22102116) and the Prospective Research Funding of Nanchang Automotive Institute of Intelligence & New Energy (TPD-TC202211-03).

Data Availability Statement

The original contributions presented in the study are included in the article, further inquiries can be directed to the corresponding author.

Acknowledgments

The team of authors acknowledges anonymous reviewers for their feedback, which certainly improved the clarity and quality of this paper.

Conflicts of Interest

The authors declare no conflicts of interest.

References

  1. Thakur, A.K.; Sathyamurthy, R.; Velraj, R.; Saidur, R.; Pandey, A.K.; Ma, Z.; Singh, P.; Hazra, S.K.; Sharshir, S.W.; Prabakaran, R.; et al. A state-of-the art review on advancing battery thermal management systems for fast-charging. Appl. Therm. Eng. 2023, 226, 120303. [Google Scholar] [CrossRef]
  2. Kumar, R.R.; Alok, K. Adoption of electric vehicle: A literature review and prospects for sustainability. J. Clean Prod. 2020, 253, 119911. [Google Scholar] [CrossRef]
  3. Jiang, F.; Yuan, X.H.; Hu, L.L.; Xie, G.M.; Zhang, Z.Q.; Li, X.P.; Hu, J.; Wang, C.; Wang, H.C. A comprehensive review of energy storage technology development and application for pure electric vehicles. J. Energy Storage 2024, 86, 111159. [Google Scholar] [CrossRef]
  4. Li, Z.H.; Khajepour, A.; Song, J.C. A comprehensive review of the key technologies for pure electric vehicles. Energy 2019, 182, 824–839. [Google Scholar] [CrossRef]
  5. Andwari, A.M.; Pesiridis, A.; Rajoo, S.; Martinez-Botas, R.; Esfahanian, V. A review of Battery Electric Vehicle technology and readiness levels. Renew. Sust. Energ. Rev. 2017, 78, 414–430. [Google Scholar] [CrossRef]
  6. Jones, N. The new car batteries that could power the electric vehicle revolution. Nature 2024, 626, 248–251. [Google Scholar] [CrossRef]
  7. Zhou, W.B.; Cleaver, C.J.; Dunant, C.F.; Allwood, J.M.; Lin, J.G. Cost, range anxiety and future electricity supply: A review of how today?s technology trends may influence the future uptake of BEVs. Renew. Sust. Energ. Rev. 2023, 173, 113074. [Google Scholar] [CrossRef]
  8. Rauh, N.; Franke, T.; Krems, J.F. Understanding the Impact of Electric Vehicle Driving Experience on Range Anxiety. Hum. Factors 2015, 57, 177–187. [Google Scholar] [CrossRef]
  9. Yang, D.X.; Liu, H.; Li, M.H.; Xu, H. Data-driven analysis of battery electric vehicle energy consumption under real-world temperature conditions. J. Energy Storage 2023, 72, 108590. [Google Scholar] [CrossRef]
  10. Zhao, C.; Li, Y.C.; Yang, Y.; Wan, S.; Yu, F.Y.; Yu, C.; Deng, C.H.; Zhou, A.J.; Shen, X.Y. Research on electric vehicle range under cold condition. Adv. Mech. Eng. 2022, 14, 16878132221087083. [Google Scholar] [CrossRef]
  11. Meyer, J.J.; Lustbader, J.; Agathocleous, N.; Vespa, A.; Rugh, J.; Titov, G. Range Extension Opportunities While Heating a Battery Electric Vehicle. In Proceedings of the 2018 SAE World Congress Experience, WCX 2018, Detroit, MI, USA, 10–12 April 2018. [Google Scholar] [CrossRef]
  12. Qi, Z.G. Advances on air conditioning and heat pump system in electric vehicles—A review. Renew. Sust. Energ. Rev. 2014, 38, 754–764. [Google Scholar] [CrossRef]
  13. Sun, X.L.; Zhou, F.; Fu, J.Q.; Liu, J.P. Experiment and simulation study on energy flow characteristics of a battery electric vehicle throughout the entire driving range in low-temperature conditions. Energy 2024, 292, 130542. [Google Scholar] [CrossRef]
  14. Yang, D.Z.; Huo, Y.L.; Zhang, Q.; Xie, J.; Yang, Z.K. Recent advances on air heating system of cabin for pure electric vehicles: A review. Heliyon 2022, 8, e11032. [Google Scholar] [CrossRef]
  15. Wang, A.C.; Yin, X.; Jia, F.; Cao, F.; Liu, Y.X.; Wang, X.L. Driving range evaluation based on different cabin thermal management goals of CO2 heat pumps for electric vehicles. J. Clean Prod. 2023, 382, 135201. [Google Scholar] [CrossRef]
  16. Song, J.; Kim, J.; Eom, S.; Lee, J.; Chu, Y.; Kim, J.; Choi, S.; Choi, M.; Choi, G.; Park, Y. Study on the refrigerant interchangeability under extreme operating conditions of R1234yf heat pump systems for electric vehicles. Appl. Therm. Eng. 2024, 245, 122789. [Google Scholar] [CrossRef]
  17. Tang, B.; Jiang, H.S.; Zhuge, W.L.; Sun, L. Adaptability and environmental impact of CO2/R41 mixture in heat pump air conditioning systems for electric vehicles. Appl. Therm. Eng. 2024, 250, 123463. [Google Scholar] [CrossRef]
  18. Li, K.; Luo, S.X.; Fan, L.; Hu, S.S.; Zhou, X.J.; Tu, R.; Zhang, H.Q.; Jin, X.T.; Zhao, X.S.; Su, L. Investigation on the performance and characteristics of a heat pump system for electric vehicles under extreme temperature conditions. Case Stud. Therm. Eng. 2021, 27, 101308. [Google Scholar] [CrossRef]
  19. Lee, S.W.; Chung, Y.; Kim, S.; Jeong, Y.; Kim, M.S. Predictive optimization method for the waste heat recovery strategy in an electric vehicle heat pump system. Appl. Energy 2023, 333, 120572. [Google Scholar] [CrossRef]
  20. Hong, J.; Song, J.; Han, U.; Kim, H.; Choi, H.; Lee, H. Performance investigation of electric vehicle thermal management system with thermal energy storage and waste heat recovery systems. Etransportation 2024, 20, 100317. [Google Scholar] [CrossRef]
  21. Zeng, X.; Huang, Y.; Song, D.; Gao, F. Design and Research on the Thermal Management Integrated Control System of BEV Based on Heat Pump Air Conditioner. SAE Int. J. Passeng. Vehicl. Syst. 2022, 15, 91–104. [Google Scholar] [CrossRef]
  22. Rolando, L.; Millo, F.; Vinogradov, A.; Paradisi, B.P.; Allocco, A.; Ceres, P.; Marco, R.; Rostagno, M.M. A virtual test rig for performance and efficiency assessment of heat pump thermal management system for battery electric vehicles. Appl. Therm. Eng. 2024, 247, 123055. [Google Scholar] [CrossRef]
  23. Sevilgen, G.; Kiliç, M.; Bayram, H.; Basak, E.; Dursun, H. The investigation of the innovative hybrid heat pump system designed and prototyped for heating process of electric vehicles. Alex. Eng. J. 2023, 68, 417–435. [Google Scholar] [CrossRef]
  24. Park, M.H.; Kim, S.C. Effects of geometric parameters and operating conditions on the performance of a high-voltage PTC heater for an electric vehicle. Appl. Therm. Eng. 2018, 143, 1023–1033. [Google Scholar] [CrossRef]
  25. Xia, Y.X.; Feng, G.Z.; Xu, J.J.; Zhu, J.T.; Han, G.; Zhou, W.M.; Xiao, Y.P. Research and optimization of new wavy fin geometry parameters in positive temperature coefficient heaters for electric vehicles. Appl. Therm. Eng. 2023, 222, 119859. [Google Scholar] [CrossRef]
  26. Shin, Y.H.; Sim, S.; Kim, S.C. Performance Characteristics of a Modularized and Integrated PTC Heating System for an Electric Vehicle. Energies 2016, 9, 18. [Google Scholar] [CrossRef]
  27. Shin, Y.H.; Ahn, S.K.; Kim, S.C. Performance Characteristics of PTC Elements for an Electric Vehicle Heating System. Energies 2016, 9, 813. [Google Scholar] [CrossRef]
  28. Nielsen, F.; Uddheim, Å.; Dalenback, J.O. Potential energy consumption reduction of automotive climate control systems. Appl. Therm. Eng. 2016, 106, 381–389. [Google Scholar] [CrossRef]
  29. Li, K.; Huang, Y.; Li, L.; Dong, D. Global sensitivity analysis of structural parameters for automobile air conditioning blower. In Proceedings of the 1st International Conference on Mechanics, Electronics, Automation and Automatic Control, MEAAC 2023, Hybrid, Wuhan, China, 13–15 May 2023. [Google Scholar] [CrossRef]
  30. Kamada, M.; Shimoyama, K.; Sato, F.; Washiashi, J.; Konishi, Y. Multi-objective design optimization of a high efficiency and low noise blower unit of a car air-conditioner. Proc. Inst. Mech. Eng. Part D-J. Automob. Eng. 2019, 233, 3493–3503. [Google Scholar] [CrossRef]
  31. Liang, Y.Q.; Wang, J.B.; Wang, S. Intelligent Control Strategy of Fresh Air Volume in Cabin Under Heating Condition and Evaluation of Its Energy-Saving Effect. J. Therm. Sci. Eng. Appl. 2023, 15, 091009. [Google Scholar] [CrossRef]
  32. Jose, S.S.; Chidambaram, R.K. Electric Vehicle Air Conditioning System and Its Optimization for Extended Range-A Review. World Electr. Vehicle J. 2022, 13, 204. [Google Scholar] [CrossRef]
  33. Babu, A.R.; Sebben, S.; Chronéer, Z.; Etemad, S. An adaptive cabin air recirculation strategy for an electric truck using a coupled CFD-thermoregulation approach. Int. J. Heat Mass Transf. 2024, 221, 125056. [Google Scholar] [CrossRef]
  34. Oh, M.S.; Ahn, J.H.; Kim, D.W.; Fang, D.S.; Kim, Y. Thermal comfort and energy saving in a vehicle compartment using a localized air-conditioning system. Appl. Energy 2014, 133, 14–21. [Google Scholar] [CrossRef]
  35. Wu, J.; Liu, J.; Zhao, J.; Su, Y. Influencing assessment of different heating modes on thermal comfort in electric vehicle cabin. Energy Environ. 2024, 5, 556–567. [Google Scholar] [CrossRef]
  36. Zhang, S.; Cheng, Y.; Fang, Z.S.; Huan, C.; Lin, Z. Optimization of room air temperature in stratum-ventilated rooms for both thermal comfort and energy saving. Appl. Energy 2017, 204, 420–431. [Google Scholar] [CrossRef]
  37. Lian, Y.B.; Ling, H.P.; Zhu, J.P.; Lv, J.L.; Xie, Z.W. Thermal management optimization strategy of electric vehicle based on dynamic programming. Control Eng. Pract. 2023, 137, 105562. [Google Scholar] [CrossRef]
  38. Cvok, I.; Ratkovic, I.; Deur, J. Multi-Objective Optimisation-Based Design of an Electric Vehicle Cabin Heating Control System for Improved Thermal Comfort and Driving Range. Energies 2021, 14, 1203. [Google Scholar] [CrossRef]
  39. Liu, X.A.; Zhang, F.T.; Zhang, Z.C.; Huang, Y.; Chen, L.; Li, X.Y. A three-heat source segmented heating control strategy based on waste heat recovery technology for electric vehicles. Energy Convers. Manage. 2024, 300, 117932. [Google Scholar] [CrossRef]
  40. Pan, C.F.; Tao, Y.X.; Wang, L.M.; Li, H.H.; Yang, J.F. Fuzzy energy management strategy for electric vehicle combining driving cycle construction and air-conditioning load identification. Adv. Mech. Eng. 2021, 13, 1687814021994381. [Google Scholar] [CrossRef]
  41. Li, N.; Xie, K.; Liu, C.X.; Zhou, J.M.; Yin, J.P. New control methodology of electric vehicles energy consumption optimization based on air conditioning thermal comfort. Appl. Therm. Eng. 2024, 241, 122375. [Google Scholar] [CrossRef]
  42. Tian, Z.; Qian, C.H.; Gu, B.; Yang, L.; Liu, F. Electric vehicle air conditioning system performance prediction based on artificial neural network. Appl. Therm. Eng. 2015, 89, 101–114. [Google Scholar] [CrossRef]
  43. He, L.E.; Li, P.P.; Zhang, Y.; Jing, H.D.; Gu, Z.H. Intelligent control of electric vehicle air conditioning system based on deep reinforcement learning. Appl. Therm. Eng. 2024, 245, 122817. [Google Scholar] [CrossRef]
  44. Park, M.H.; Kim, S.C. Heating Performance Characteristics of High-Voltage PTC Heater for an Electric Vehicle. Energies 2017, 10, 1494. [Google Scholar] [CrossRef]
  45. June, M.S.; Kribs, J.; Lyons, K.M. Measuring efficiency of positive and negative ionic wind devices for comparison to fans and blowers. J. Electrost. 2011, 69, 345–350. [Google Scholar] [CrossRef]
  46. GB/T 18386.18381-12021; Test Methods for Energy Consumption and Range of Electric Vehicles—Part 1: Light-Duty Vehicles. Standards Press of China: Beijing, China, 2021.
  47. GB/T 38146.38141-32019; China Automotive Test Cycle—Part 1: Light-Duty Vehicles. Standards Press of China: Beijing, China, 2019.
  48. Tan, L.B.; Yuan, Y.J. Computational fluid dynamics simulation and performance optimization of an electrical vehicle Air-conditioning system. Alex. Eng. J. 2022, 61, 315–328. [Google Scholar] [CrossRef]
  49. Forrest, W.O.; Bhatti, M.S. Energy efficient automotive air conditioning system. In Proceedings of the SAE 2002 World Congress, Detroit, MI, USA, 4–7 March 2002. [Google Scholar] [CrossRef]
  50. Pan, L.Y.; Liu, C.C.; Zhang, Z.Q.; Wang, T.Y.; Shi, J.Y.; Chen, J.P. Energy-saving effect of utilizing recirculated air in electric vehicle air conditioning system. Int. J. Refrig.-Rev. Int. Froid 2019, 102, 122–129. [Google Scholar] [CrossRef]
Figure 1. The airflow route of the air conditioning system.
Processes 12 01495 g001
Figure 2. Simplified diagram of the airflow route.
Processes 12 01495 g002
Figure 3. The position of the temperature measurement points.
Processes 12 01495 g003
Figure 4. Test photos: (a) The vehicle climatic chamber; (b) The temperature sensors.
Processes 12 01495 g004
Figure 5. The input and output of the blower power.
Processes 12 01495 g005
Figure 6. The blower performance: (a) The total pressure-airflow rate relationship of the blower at different rotation speeds; (b) The iso-efficiency diagram of the blower efficiency versus the pressure drop and airflow rate.
Processes 12 01495 g006
Figure 7. The layout of the component performance test bench.
Processes 12 01495 g007
Figure 8. The component performance test result.
Processes 12 01495 g008
Figure 9. The changes in PTC power and air volume level over time.
Processes 12 01495 g009
Figure 10. The changes in external circulation ratio and average temperature over time: (a) Air conditioning external circulation ratio; (b) Average temperature of the measurement points.
Processes 12 01495 g010
Figure 11. The three-dimensional numerical model.
Processes 12 01495 g011
Figure 12. Temperature measurement points in the numerical model.
Processes 12 01495 g012
Figure 13. Comparison of simulation and test values of the benchmark condition.
Processes 12 01495 g013
Figure 14. Simulation results when the PTC power is 1300 W: (a) Temperatures of the measurement points; (b) XZ-section velocity of point 1; (c) Average temperature at the air conditioning outlets.
Processes 12 01495 g014
Figure 15. Comparison of the average temperatures at different airflow rates.
Processes 12 01495 g015
Figure 16. Temperature simulation results of the measurement points when the airflow rate is 60 dm3/s.
Processes 12 01495 g016
Figure 17. Comparison of the average temperatures at different PTC powers.
Processes 12 01495 g017
Figure 18. The isothermal diagram of the average temperature of the measurement points versus PTC power and airflow rate.
Processes 12 01495 g018
Figure 19. The simulation results of the alternative working conditions.
Processes 12 01495 g019
Figure 20. The change in the pressure drop from the fresh air inlet to the blower inlet with the airflow rate.
Processes 12 01495 g020
Figure 21. Comparison of the theoretical total powers of the alternative working conditions.
Processes 12 01495 g021
Figure 22. The blower efficiencies corresponding to the five alternative working conditions.
Processes 12 01495 g022
Figure 23. Comparison of the actual total powers of the alternative working conditions.
Processes 12 01495 g023
Figure 24. Comparison of simulation and test values.
Processes 12 01495 g024
Table 1. The main parameters of the climatic chamber.
ParameterValueParameterValue
Dimensions of the climatic
chamber
16 m × 7.5 m × 5.5 mHumidity deviation<5% RH
Temperature range−40 °C~+60 °CNumber of axes on the chassis
dynamometer
2
Temperature deviation<0.5 °CMaximum speed200 km/h
Temperature uniformity *≤1 °CMaximum vehicle weight6000 kg
Humidity range10~90% RHPower density of the sunlight
simulation system
300~1200 W/m2
* Between any two points.
Table 2. Simulation working conditions.
Working ConditionPTC Power (W)Airflow Rate (dm3/s)Working ConditionPTC Power (W)Airflow Rate (dm3/s)Working ConditionPTC Power (W)Airflow Rate (dm3/s)
1-11000153-11300155-1160015
1-2303-2305-230
1-3603-3605-360
1-4903-4905-490
1-51203-51205-5120
1-61503-61505-6150
2-11150154-1145015-
2-2304-230
2-3604-360
2-4904-490
2-51204-5120
2-61504-6150
Table 3. Temperature simulation values of the measurement points.
Working ConditionTemperature (°C)Working ConditionTemperature (°C)
Point 1Point 2Point 3Point 4AveragePoint 1Point 2Point 3Point 4Average
1-114.9214.7214.7114.8814.813-421.9921.8421.8622.0321.93
1-215.9715.6815.7716.0215.863-522.0921.8621.9122.0621.98
1-317.4917.3217.4117.5117.433-622.0221.7721.8321.9821.90
1-419.4018.9619.0819.3919.214-121.9821.6721.7522.0221.86
1-520.0919.7419.8420.0119.924-222.2221.7021.6822.0421.91
1-620.3420.2120.2220.3120.274-323.0122.7622.7222.9922.87
2-117.4217.2717.2717.4417.354-423.2222.8922.7023.2323.01
2-217.9717.8217.8617.9917.914-523.1922.9722.8723.1323.04
2-319.3519.2319.1419.3119.264-622.9422.7722.7722.9222.85
2-420.6420.5120.5620.6120.585-124.0023.8823.8323.9623.92
2-520.9320.6720.6320.8920.785-224.0523.7523.6824.0423.88
2-621.2221.0220.9321.1221.075-324.4124.0923.8724.2724.16
3-120.0119.7519.8019.9319.875-424.4124.2124.0824.3624.27
3-220.0519.7619.8320.0419.925-524.2623.9923.9624.1924.10
3-321.2320.8720.9521.2921.095-624.1023.8023.7724.0123.92
Table 4. The effective powers of the blower under the alternative working conditions.
Working
Condition
PTC
Power (W)
Airflow Rate (dm3/s) P D 1 (Pa) P D 2 (Pa) P T (Pa) N BE (W)
A1150143.0303.50880.341183.84169.29
B120089.0156.07370.08526.1546.83
C125073.0120.03260.33380.3627.77
D130058.089.43174.65264.0815.32
E135040.557.6095.73153.336.21
Disclaimer/Publisher’s Note: The statements, opinions and data contained in all publications are solely those of the individual author(s) and contributor(s) and not of MDPI and/or the editor(s). MDPI and/or the editor(s) disclaim responsibility for any injury to people or property resulting from any ideas, methods, instructions or products referred to in the content.

