Article

Application of Principal Component Analysis for the Elucidation of Operational Features for Pervaporation Desalination Performance of PVA-Based TFC Membrane

by
Hamdi Chaouk
1,2,
Emil Obeid
1,
Jalal Halwani
2,
Jack Arayro
1,
Rabih Mezher
1,
Semaan Amine
1,
Eddie Gazo Hanna
1,
Omar Mouhtady
1 and
Khaled Younes
1,*
1
College of Engineering and Technology, American University of the Middle East, Egaila 54200, Kuwait
2
Water and Environment Sciences Laboratory, Lebanese University, Tripoli P.O. Box 6573/14, Lebanon
*
Author to whom correspondence should be addressed.
Processes 2024, 12(7), 1502; https://doi.org/10.3390/pr12071502
Submission received: 4 June 2024 / Revised: 11 July 2024 / Accepted: 15 July 2024 / Published: 17 July 2024
(This article belongs to the Special Issue Latest Innovations in Seawater Desalination Processes)

Abstract

:
Principal Component Analysis (PCA) serves as a valuable tool for analyzing membrane processes, offering insights into complex datasets, identifying crucial factors influencing membrane performance, aiding in design and optimization, and facilitating monitoring and fault diagnosis. In this study, PCA is applied to understand operational features affecting pervaporation desalination performance of PVA-based TFC membranes. PCA-biplot representation reveals that the first two principal components (PCs) accounted for 62.34% of the total variance, with normalized permeation with selective layer thickness (Pnorm), water permeation flux (P), and operational temperature (T) contributing significantly to PC1, while salt rejection dominates PC2. Membrane clustering indicates distinct influences, with membranes grouped based on correlation with operational factors. Excluding outliers increases total variance to 74.15%, showing altered membrane arrangements. Interestingly, the adopted strategy showed a high discrepancy between P and Pnorm, indicating the relevance of comparing between PVA membranes with specific layers and those with none. PCA results showed that Pnorm is more important than P in operational features, highlighting its significance in both research and practical applications. Our findings show that even know P remains a key performance property; Pnorm is critical for developing high-performance, efficient, and economically viable pervaporation desalination membranes. Subsequent PCA for membranes without specific layers (M1 to M6) and with specific layers (M7 to M11) highlights higher total variance and influence of variables, aiding in understanding membranes’ behavior and suitability under different conditions. Overall, PCA effectively delineates performance characteristics and potential applications of PVA-based TFC membranes. This study would confirm the applicability of the PCA approach in monitoring the operational efficiency of pervaporation desalination via these membranes.

1. Introduction

Pervaporation, a membrane-based separation technique, is extensively utilized for separating components from liquid feed solutions. The process involves selective components dissolving into the membrane at the feeding side, diffusing through it, and evaporating at the permeated side under reduced pressure [1,2]. It has found widespread application in liquid–liquid separation of organic solvent mixtures and dehydration of aqueous solutions of organic solvents. Key factors affecting pervaporation performance include permeation flux and the separation factor. Recently, it has also been employed in desalination processes, offering a solution for treating highly salty water from industrial processes and producing freshwater from seawater [3]. Although two-dimensional nanomaterial-based membranes have shown high water fluxes in pervaporation desalination, polymeric membranes, particularly polyvinyl alcohol (PVA)-based membranes, remain of interest due to their cost-effectiveness, well-established fabrication techniques, and operational convenience [4,5]. PVA membranes exhibit high salt rejection and notable water permeation fluxes. Strategies to enhance water permeation fluxes include increasing membrane surface area through hierarchically nanostructured surfaces and utilizing mixed matrix membranes (MMM) containing inorganic additives like silica nanoparticles, carbon nanotubes (CNTs), graphene oxides (GOs), and laponite [5,6,7]. These additives alter PVA’s chain entanglements and crystalline structures, promoting water diffusion through membranes. Crosslinking agents containing sulfonic acid groups maintain membrane hydrophilicity while providing channels for water molecule movement, enhancing water permeation [8]. Surface-functionalized CNTs are also effective in constructing water-transportation pathways within PVA membranes, resulting in significant increases in water permeation fluxes. These strategies highlight the ongoing efforts to optimize PVA-based membranes for pervaporation applications, aiming for improved efficiency and performance [4,5].
Principal Component Analysis (PCA) is a powerful statistical technique widely employed in various fields, including membrane processes, to extract meaningful information from complex datasets. In membrane processes, PCA finds extensive application in understanding and optimizing membrane performance, designing membranes, and analyzing experimental data [9,10]. One of the primary applications of PCA in membrane processes is in understanding the relationships between multiple variables involved in membrane performance [9]. Membrane processes typically involve numerous parameters, such as feed composition, operating conditions, membrane properties, and performance indicators like flux and selectivity [9,10,11]. By applying PCA to experimental data, researchers can identify underlying patterns and correlations among these variables. PCA can reveal which variables are most influential in determining membrane performance and how they interact with each other. This understanding is invaluable for optimizing process parameters and designing membranes tailored to specific applications [9,11]. Moreover, PCA facilitates the identification of key factors or principal components (PCs) driving variability in membrane performance. These principal components represent linear combinations of the original variables and capture the most significant sources of variation in the dataset [12,13]. By focusing on these PCs, researchers can simplify the analysis and interpretation of complex datasets. For example, in membrane-fouling studies, PCA can identify dominant foulants or fouling mechanisms based on variations in key performance indicators [14,15].
In membrane design and optimization, PCA aids in reducing the dimensionality of the design space and identifying critical parameters for membrane performance. By identifying the PCs contributing most to the desired outcomes, researchers can prioritize these factors in membrane design and optimization efforts. This targeted approach saves time and resources by focusing experimental efforts on the most influential parameters. Additionally, PCA can help in identifying trade-offs between conflicting objectives, such as flux and selectivity, in membrane design [9,11]. Furthermore, PCA plays a crucial role in process monitoring and fault diagnosis in membrane systems. By analyzing real-time or historical data using PCA, deviations from normal operating conditions can be detected early, allowing for timely intervention to prevent system failures or performance degradation. PCA-based monitoring systems can flag abnormal patterns in variables such as pressure, temperature, and permeate quality, indicating potential issues such as fouling, scaling, or membrane degradation. This proactive approach to process monitoring improves the reliability and efficiency of membrane processes [9,14,15].
The aim of this study is to explore the potential of applying PCA for estimating the performance of the pervaporation desalination process using PVA-based TFC membranes. Our intention is to provide experimentalists with a better understanding of how this statistical tool can be utilized to optimize the operational features of these membranes’ pervaporation process.
It is important to demonstrate the relevance of PCA by showing that the tendencies and patterns identified through this analysis align with established knowledge and expectations in the field. This alignment indicates that PCA is capturing meaningful and significant relationships within the data. If the tendencies observed were entirely unexpected, it would suggest that PCA might not be effective for optimization purposes in this context.
Several studies have demonstrated the efficacy of PCA in various fields of chemical engineering [16,17]. PCA has been effectively used to optimize processes by identifying critical variables and reducing experimental efforts [16,17]. By applying PCA to the pervaporation desalination process using PVA-based TFC membranes, we aim to contribute to this body of knowledge, offering a methodological approach that experimentalists can adopt to enhance the efficiency and effectiveness of their operations.

2. PVA-Based TFC Membranes: With and without Selective Layers

Table 1 offers a comparison of several PVA-based TFC membranes, particularly emphasizing the impact of selective layer thickness. The data reveal significant insights into how the thickness of the separative layers influences water permeation flux and salt rejection [5]. The SPTA-crosslinked PVA/Ws-OL-50 membrane, with a thickness of 0.53 μm, achieves a high water permeation flux of 78.6 kg m2 h−1 at 65 °C and a salt rejection of 99.91%. This indicates that a well-optimized selective layer thickness can significantly enhance water flux while maintaining high salt rejection [5]. In contrast, membranes with thicker selective layers generally exhibit lower water permeation fluxes. For example, the PVA/Sulfo-succinic acid PAN ultrafiltration membrane, with a 4.9 μm selective layer, shows a flux of 27.9 kg m2 h−1 at 70 °C, which is lower compared to thinner layers [5] (Table 1).
The inclusion of hydrophilic additives like Ws-OL and the use of sulfonic acid-containing crosslinking agents are critical in enhancing membrane performance. The SPTA-crosslinked PVA/Ws-OL-50 membrane demonstrates superior performance compared to other configurations, highlighting the synergistic effect of optimized selective layer thickness and the incorporation of effective additives. The study by Liang et al. [8] supports this finding, showing that sulfonic acid groups facilitate water transportation through the membrane, thereby increasing the permeation flux. Similarly, Xue et al. [18] demonstrated that tailoring the molecular structure of crosslinked polymers can significantly improve pervaporation desalination performance.
When compared with other PVA-based TFC membranes reported in the literature, such as those utilizing glutaraldehyde as a crosslinking agent on electrospun PAN nanofiber mats, the SPTA-crosslinked PVA/Ws-OL membrane exhibits superior water permeation flux [5]. For instance, a membrane reported by Liang et al. [8] with a selective layer thickness of 0.62 μm and a water permeation flux of 7.36 kg m2 h−1 at 25 °C falls short in comparison. Additionally, the performance of the SPTA-crosslinked membrane surpasses that of membranes modified with other agents like pyromellitic dianhydride or polyacrylic acid, which, despite achieving high salt-rejection rates, do not match the water permeation flux achieved by the PVA/Ws-OL membrane (Table 1) [5].
The operational temperature significantly impacts membrane performance. Higher temperatures typically enhance water permeation flux due to increased molecular movement and reduced viscosity of water [5,19]. For example, the water permeation flux of the SPTA-crosslinked PVA/Ws-OL membrane increases from 14,540 g m2 h−1 at 25 °C to 56,420 g m2 h−1 at 65 °C [5]. This temperature dependence is quantified by the activation energy (Ea) of water permeation. The lower Ea of 27 kJ mol−1 for the PVA/Ws-OL-50 membrane compared to the neat PVA membrane (47 kJ mol−1) indicates enhanced water transport facilitated by the Ws-OL additive and SPTA crosslinking [5].
Table 1. Pervaporation desalination performance of PVA-based TFC membranes.
Separative LayerCrosslinking AgentPorous SubstrateThickness
of Separative Layer (δ; μm)
NaCl Concentrations
of the Feeding Solution (NaCl; wt%)
Operation Temperature (T; °C)Water Permeation Flux (P; kg m−2 h−1)Normalized P
with Selective Layer Thickness
(Pnorm; kg μm m−2 h−1)
Salt Rejection (%)Reference
PVAGlutaraldehydeElectrospun PAN nanofiber mat on polyester nonwoven0.623.5257.364.5699.5[20]
PVAMaleic acidPolysulfone hollow fiber0.13.0707.40.7499.9[21]
PVASulfo-succinic acidPAN ultrafiltration membrane4.93.57027.9136.799.8[22]
PVASPTAPAN ultrafiltration membrane0.83.57046.337.099.5[8]
PVAPyromellitic dianhydridePAN ultrafiltration membrane23.57032.364.699.98[23]
PVAPoly acrylic acid
co-2-acrylamido-2-methyl propane sulfonic acid
Electrospun PAN nanofiber mat0.733.575234.9171.599.7[18]
PVA/GOGlutaraldehydeElectrospun PAN nanofiber mat0.123.57069.18.399.9[24]
PVA/CNTMaleic anhydridePAN ultrafiltration membrane1.03.54514.514.599.96[25]
PVA/UIO 66 MOF aP (AA-AMPS) bPorous polysulfone membrane0.953.57012011499.9[26]
PVA/Ws-OLMaleic anhydridePAN ultrafiltration membrane0.533.56556.429.999.97[5]
PVA/Ws-OLSPTAPAN ultrafiltration membrane0.533.56578.641.699.91[5]
a MOF: metal organic framework. b Data with 3.5 wt% NaCl(aq) not available.
Some ambiguous findings could be entailed from Table 1, as maleic acid-crosslinked PVA membrane with a thickness of 0.1 μm has a flux of 7.4 kg m2 h−1, whereas sulfo-succinic-crosslinked PVA membrane exhibits a layer approximately 50 times thicker (4.9 μm) and has a flux of 27.9 kg m2 h−1. Similarly, polyacrylic acid co2-acrylamido-2-methylpropane sulfonic acid-crosslinked PVA membrane with a thickness of 0.73 μm has a flux of 234.9 kg m2 h−1. These disparities and contradictory findings, with respect to the thickness, would indicate a higher relation of intrinsic properties of these membranes over the operational features [27,28,29].
The findings from Table 1 and supporting literature underline the critical importance of selective layer in the performance of PVA-based TFC membranes for pervaporation desalination. Membranes with optimized selective layers, particularly those incorporating hydrophilic additives and effective crosslinking agents, achieve superior water permeation flux and high salt rejection [5]. This optimization is crucial for the economic viability and operational efficiency of pervaporation desalination technologies.
Future research should continue to explore the interplay between membrane composition, selective layer, and operational conditions to further enhance desalination performance. By applying PCA to the pervaporation desalination process using PVA-based TFC membranes, we aim to offer a methodological approach that experimentalists can adopt to enhance the efficiency and effectiveness of their optimization operations.

3. Materials and Methods

3.1. Data Normalization

Data normalization holds paramount relevance before analysis due to its pivotal role in ensuring the comparability and accuracy of results. By standardizing the scale of variables, normalization eliminates the influence of differing magnitudes, thereby preventing biases in analytical outcomes. This preprocessing step enhances the effectiveness of various analytical techniques, such as machine learning algorithms and statistical analyses, by facilitating fair comparisons and improving the stability of models. Moreover, normalization aids in improving the convergence speed of optimization algorithms and mitigating issues related to multicollinearity [12]. Overall, the practice of data normalization serves as a crucial prerequisite for generating reliable insights and making informed decisions based on data-driven analyses. The variance in individuals’ weights has been rectified through a normalization method similar to that employed by Mouhtady et al. [30]. The objective is to mitigate bias stemming from variations in magnitude, and the procedure is outlined as follows:
X s t = ( V a l u e M e a n ) S t a n d a r d   D e v i a t i o n
where “Xst” presents the standardized dataset values.

3.2. PCA

PCA findings were yielded by using XLSTAT 2014 software, following the similar approach adopted by Mouhtady et al. [30]. Hence, PCA has been applied for pervaporation desalination performance of PVA-based TFC membranes, influenced by six different operational features (Lai et al. [5]). PCA is a data-driven unsupervised machine learning technique that works on the reduction of a certain dataset. The outcome of such reduction has been applied for a better visualization of certain phenomena, seeking hidden knowledge by the given correlations (negative or positive), and the representativity of the PCs. The jth PC matrix (Fi) is expressed using a unit-weighting vector (Uj), and the original data matrix M with m × n dimensions (m: number variables; n: number of datasets) as follows [11,13,31]:
F i = U j T M = i = 0 U j i M i
where u is the loading coefficient and M is the data vector of size n. The variance matrix M(Var(M)) is obtained by projecting M to U and should be maximized as follows:
V a r M = 1 n U M U M T = 1 n U M M T U
M a x V a r M = M a x 1 n   U M M T U
Since 1 n M M T is the same as the covariance matrix of M(cov(M)), Var(M) can be expressed as follows:
V a r   M = U T c o v   M   U
The Lagrangian function can be defined by performing the Lagrange multiplier method as follows:
L = U T
L = U T c o v M U δ ( U T U 1 )
For (7), “UTU − 1” is considered to be equal to zero, since the weighting vector is a unit vector. Hence, the maximum value of var(M) can be calculated by equating the derivative of the Lagrangian function (L), with respect to U, as follows:
d L d U = 0
c o v M U δ U = c o v M δ I U = 0
where
δ: eigenvalue of cov(M);
U: eigenvector of cov(M).

4. Results and Discussion

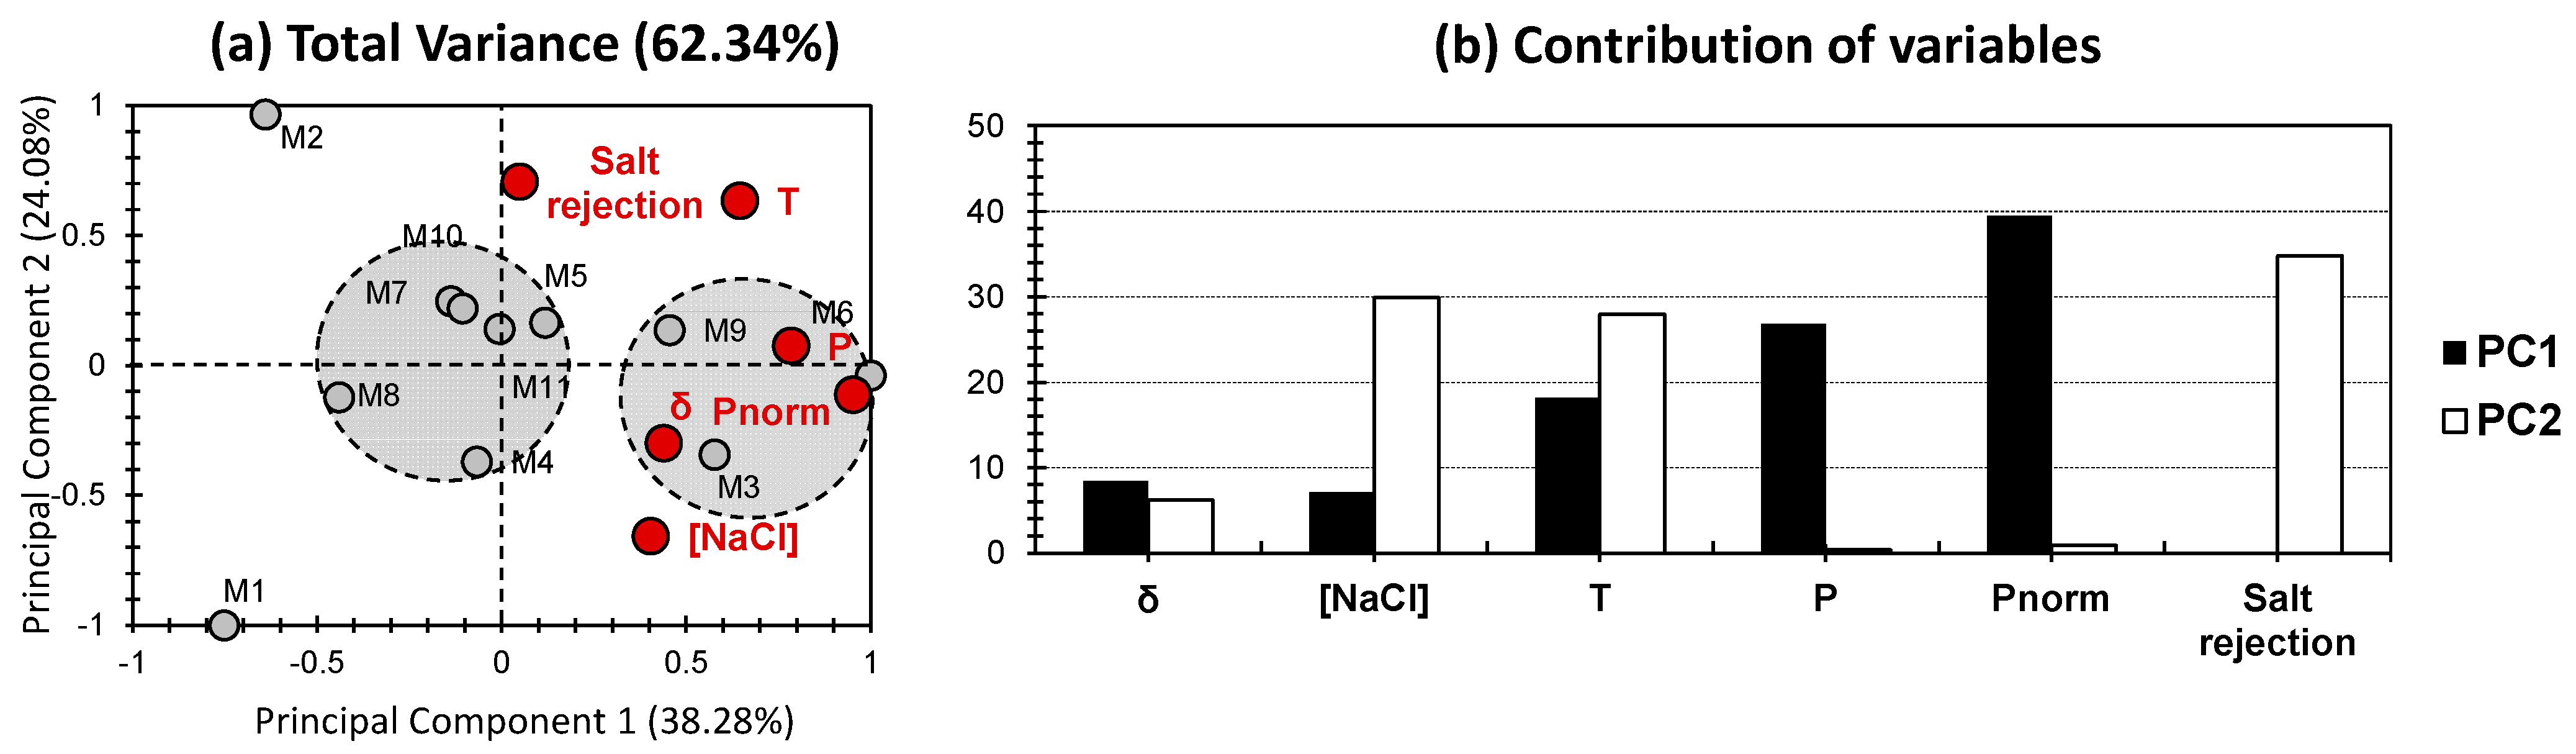
4.1. PCA All-in-One Dataset

Figure 1 shows the PCA-biplot representation for all datasets for pervaporation desalination performance of the investigated PVA-based TFC membranes, obtained from the study of Lai et al. [5]. The first two PCs exhibited 62.34% of the total variance (PC1 and PC2 scoring 38.28% and 24.08%, respectively; Figure 1a). This variance is considered as moderate, yet acceptable for the sake of seeking patterns between the investigated TFC membranes. For the variables, normalized permeation with selective layer thickness (Pnorm) yielded the highest contribution towards PC1, scoring nearly 40% (Figure 1b). In fact, layer thickness significantly affects the performance of PVA-based TFC membranes in pervaporation desalination. Thinner selective layers generally lead to higher water flux due to reduced resistance to mass transfer. For example, water flux increased as the thickness of the PVA selective layer decreased from 1.35 µm to 0.35 µm [32]. However, excessively thin layers can compromise mechanical stability and selectivity, resulting in lower salt-rejection rates. Moderate contributions can be noticed for the water permeation flux (P) and temperature (T) (around 27% and 18%; Figure 1b). Regarding water permeation flux (P), studies have shown that this parameter significantly influences desalination performance [6,33,34]. A higher water flux enables faster water vapor transport through the membrane, resulting in efficient desalination. In the study by Selim et al. [33], Laponite nanodisc/PVA membranes exhibited excellent desalination performance, achieving a water flux of 49.25 kg/m2 h with a rejection of 99.94% when desalinating a 5 wt.% NaCl solution at 70 °C. For the rest of the variables, minor to negligible contributions were obtained. For PC2, the highest contribution has been scored by salt rejection, scoring 35% of the axis’s contribution (Figure 1b). NaCl and T exhibited moderate contributions (around 30%), and the rest of the variables scored minor to negligible contributions. It should be noted that increasing the temperature leads to higher salt-rejection rates [35]. Interestingly, high separation of variables was scored between the two PCs (except for T), indicating a relative independence (or lack of correlation) between the variables of PC1 and PC2, from one hand and another.
For TFC membranes (here the individuals), two clusters were distinguished (Figure 1a). The green cluster contains M3, M6, and M9, and showed high positive correlation along PC1, with a minor positive/contribution along PC2. This would indicate that membranes of the following clusters are more likely influenced by the variables that exhibited exclusive contribution along PC1. These variables are more likely permeation features (P and Pnorm; Figure 1). The blue cluster, including M4, M5, M7, M8, M10, and M11, showed a high distance from the variables, and exhibited a central position on the node. This would indicate that they are less influenced by the investigated variables than membranes of the green cluster. Only M1 and M2 were skewed away from the rest of the membranes, yielding a high negative input along PC1, with a respective negative and positive input, along PC2 (Figure 1). Even knowing that the “all dataset” approach allowed discerning between different sets of membranes, and highlighted the high influence of permeation on M3, M6, and M9 (blue cluster), the moderate contribution of the total variance would make findings less reliable. It is noteworthy that the separation between different performance features along both PCs is peculiar, and would indicate the independence of these variables from each other. This assumption is far away from the truth, so the high discrepancy between performance features would indicate the relevance on relying on other operational/performance features in order to discern a better decision.
Figure 2 shows the PCA-biplot representation for all datasets for pervaporation desalination performance, with the exception of the outliers in the first PCA approach: M1 and M2. Excluding these two samples allowed an increase in the total variance to 74.15% (PC1 and PC2 scoring 47.95% and 26.20%, respectively; Figure 2a). The higher variance would confirm the efficiency of excluding outliers from a dataset, for the sake of seeking more accurate trends. For the variables, and similarly to the all datasets case, high separation between variables can be noticed. For PC1, temperature (T) and both permeation fluxes (P and Pnorm) exhibited moderate contributions towards PC1 (26–32%; Figure 2b). For salt rejection, a minor contribution was expressed (14%; Figure 2b), along with a negligible one for the thickness of the separative layer (δ). For PC2, the dominant contribution was yielded for the thickness of separative layers “δ”, scoring for more than 70% of the contribution, along this axis (Figure 2b). These findings are intriguing, since minor contributions of δ were yielded in the first approach (Figure 1). This difference would confirm the influence of removing outliers from the dataset, as totally different trends were yielded in our case. For TFC membranes, and similarly to the first case (Figure 1), two clusters were obtained, yet with totally different arrangements. The green cluster encompassed M4 and M9, and showed a moderate positive correlation along PC1. The blue cluster encompassed M5, M7, M10, and M11 and showed a moderate negative influence, along PC1. The high proximity between the two clusters and the plotting around the node of the first two PCs would indicate some high similarities between the investigated membranes. M3, M6, and M8 can be excluded from this similarity, as they were plotted away from these two clusters. On the other hand, δ have interestingly shown a high influence for M3; this matter is peculiar since this variable exhibits dominance of influence in this approach. Interestingly, both permeation features showed a high dispatchment along PC1, as P and Pnorm showed a high positive and negative influence, respectively (Figure 1). Water permeation flux refers to the rate at which water molecules pass through a given material or membrane per unit area per unit time. This flux can be influenced by factors such as the properties of the material or membrane (such as pore size, porosity, thickness), the pressure gradient across the material, and the concentration gradient of water [5,9,36]. Higher water permeation flux indicates faster water transport through the material or membrane [36]. Normalized permeation with a selective thickness layer (Pnorm) refers to a measure of permeation that considers the presence of a specific layer of material with a known thickness and permeability [5,8,37]. This concept is often used in the context of composite materials or membranes, where different layers have different properties. By normalizing the permeation with respect to the thickness and permeability of the selective layer, researchers can better understand the contribution of each layer to the overall permeation process. This allows for comparisons between different materials or membranes by accounting for the presence of the selective layer. Having this discrepancy between these two features would indicate the relevance of having a selective layer in separation [5,8,37]. These trends were obtained when M1 and M2 (PVA only as separative layer; Table 1) were excluded from the statistical study (Figure 2). For the sake of deciphering the sensitive layer effect, PCA can be single-handedly attempted for pervaporation desalination performance on PVA-based TFC membranes with and without added specific layers (Figure 3 and Figure 4, respectively).

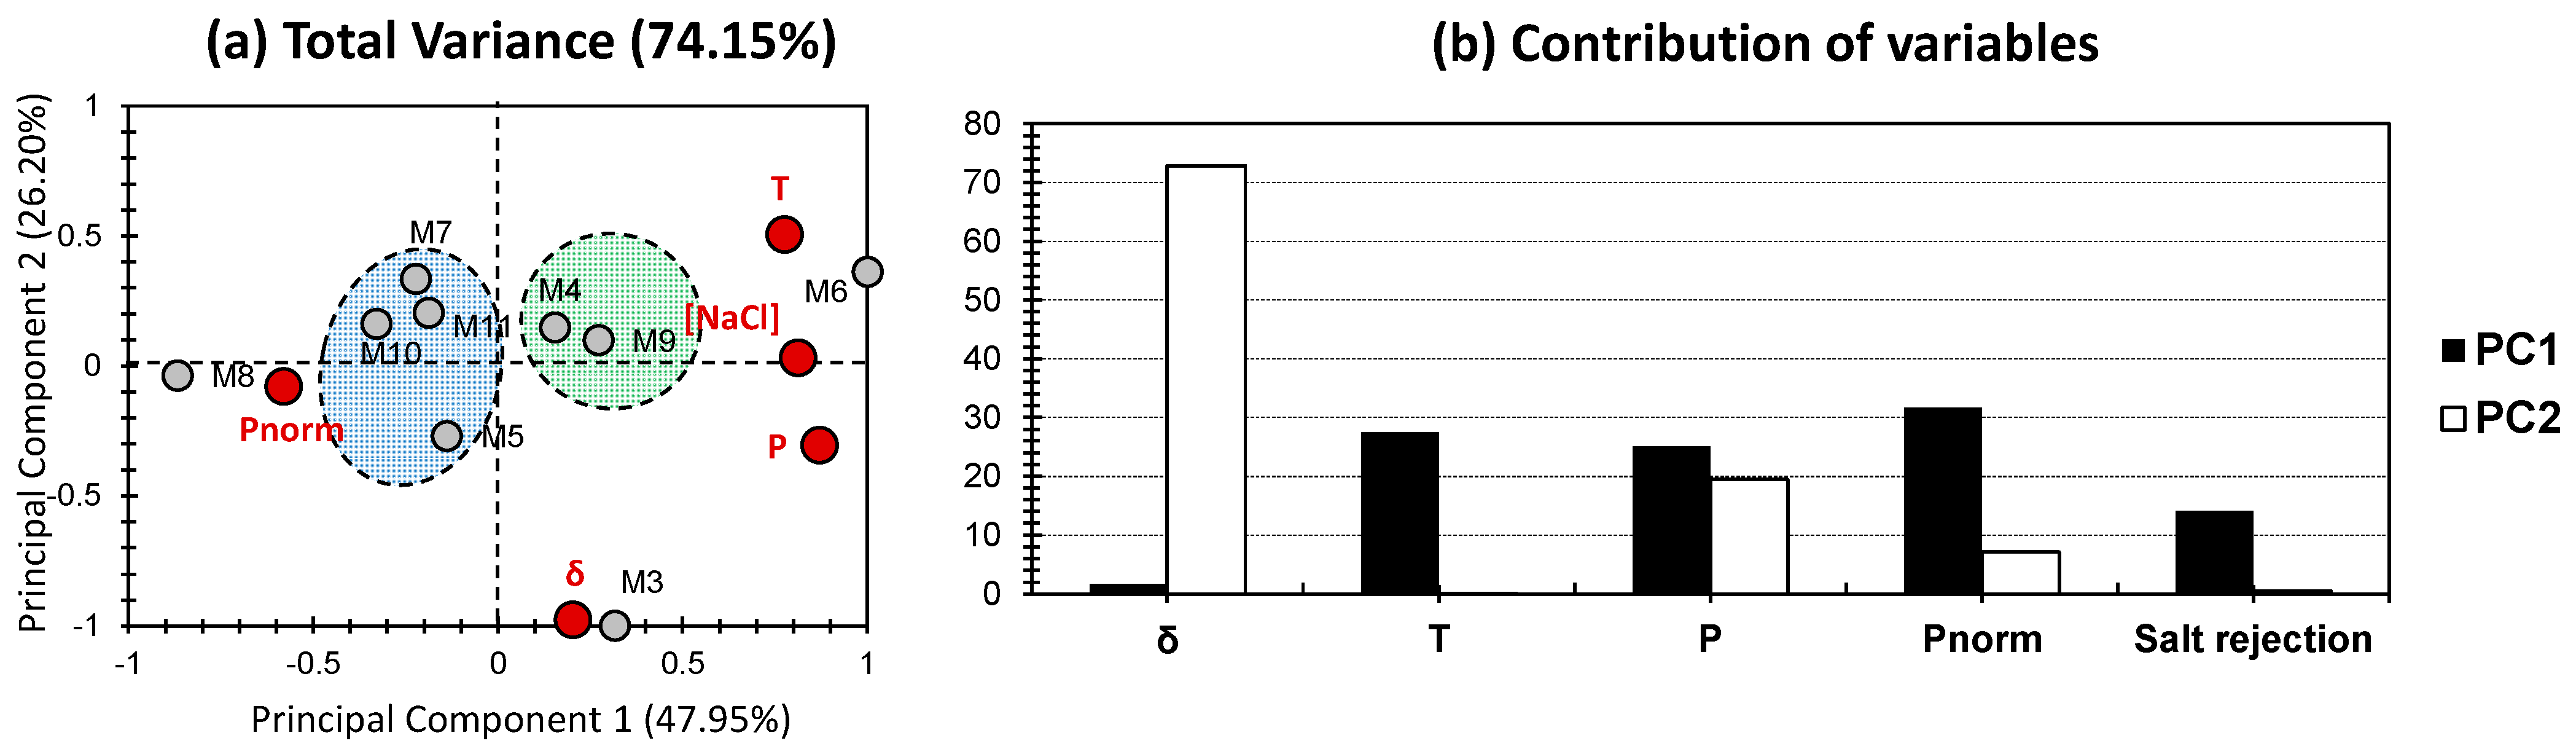
4.2. PCA of PVA-Based TFC with and without Specific Layers

Figure 3 shows the PCA-biplot representation for the dataset for pervaporation desalination performance on PVA-based TFC membranes without any added specific layers (M1 to M6; Table 1). The first two PCs accounted for 69.98% of the total variance (PC1 and PC2 scoring 40.82% and 29.15%, respectively; Figure 3a). The higher variance in this case (compared with the all datasets approach; Figure 1) can indicate the higher reliability of the analysis, when PCA is performed on a definite type of membranes. For variables, the highest contribution along PC1 was obtained for Pnorm (around 40%; Figure 3b). In fact, desalination was found to be impacted by the temperature and the thickness. However, water permeation flux was found to be the main indicative parameter on desalination efficiency according to the literature [38]. For T, P, and δ, a moderate contribution was obtained, scoring between 10% and 20% (Figure 3b), and the rest of the variables scored minor to negligible contributions towards PC1. According to Qian et al. [39], increasing the temperature causes a narrowing in the layer pores due to thermal expansion which results in the spill out of PVA, thus creating a rough surface. The roughness leads to a greater filtration area and therefore a higher permeation flux [6]. For PC2, the highest contributions were scored for NaCl and salt rejection (scoring around 34% and 42%, respectively, Figure 3b). A moderate contribution was yielded for temperature (T) (around 20%, Figure 3b), along with minor to negligible contribution for the rest of the variables. It should be mentioned that increasing the temperature leads to an increase in salt-rejection rates [38], which is consistent with the latter findings, indicating a positive correlation between salt rejection and temperature (both on the positive side of PC2). Furthermore, an increase in operational temperatures, for extended periods of usage, can cause an increase in the thickness and pore sizes of PVA membranes, due to the rise in crosslinking degree. This in turn, leads to a decrease in the surface charge and a growth in salt rejection as well as water permeation flux [40,41]. Interestingly, when PVA membranes without special layers (M1 to M5) were exclusively taken into consideration, it scored similar trends of variables in comparison with the all datasets approach (Figure 1). Hence, a good separation between variables was obtained between PC1 and PC2 with the exception of temperature (T) that mutually contributed on both PCs, as was evidenced in the above analysis: temperature increase affects both the permeation flux and the salt-rejection rate. On the other hand, PC2 was the axis dedicated to estimating salt-removal efficiency. For individuals, no clustering was obtained; this would somehow indicate the efficiency of PCA in distinguishing between PVA-based TFC membranes without any added specific layers. Nonetheless, individuals can be subdivided into two different groups: one presenting a positive correlation with all of the investigated factors; this is plotted on the positive side of PC1 (M3, M5, and M6; Figure 3a); and another group presenting a negative correlation with all of the variables, and therefore it is plotted on the negative side of PC1 (M1, M2, and M4; Figure 3a). This dissociation into two major clusters would indicate the capacity of positively plotted membranes to work better under higher performance conditions, and the opposite is true for the negatively plotted ones.
Figure 4 shows the PCA-biplot representation for datasets for pervaporation desalination performance on PVA-based TFC membranes with added specific layers (M7 to M11; Table 1). The first two PCs accounted for 92.22% of the total variance (PC1 and PC2 scoring 60.11% and 32.11%, respectively; Figure 4a). A high variance would indicate an increase in similarities between the investigated materials, and shows the high applicability of PCA for PVA-based TFC membranes with added specific layers. For variables and along PC1, moderate contributions were yielded for salt rejection, P, and T (accounting for between 20% and 30%, Figure 4a). Concerning T and salt rejection, the reader can refer to the discussion highlighted in Figure 3, applicable for the current findings, relating the temperature to the pore sizes. On the other hand, increasing temperature has a role in the growth of salt-rejection rates. However, the permeation P depends on the membrane type and on possible added layers. As a matter of fact, it was highlighted that adding Ws-OL to the PVA membrane resulted in an increase in the water permeation flux by a factor of 2.1 compared to the pure PVA membrane [42]. The main interpretation of this enhancement is due to the fact that crystalline regions of PVA membranes act as obstacles for water diffusion. Thus, adding Ws-OL to the PVA membrane reduced the crystallite sizes, making it more adequate for permeation [4]. The rest of the investigated variables scored low to negligible tendencies around PC1. For PC2, the highest contribution was dominated by average thickness of separative layers “δ”, scoring nearly 60% (Figure 4b). In concordance with this finding, it is evidenced that in the prevaporation technique, adding specific layers strongly attracts water, and allows water to pass through during pervaporation. In particular, Lai et al. 2023 [5] concluded that the addition of Ws-OL makes the membrane highly hydrophilic; thus, it is considered as an enhancing component for the production of such membranes. A similar conclusion was reported when electrospun PAN nanofibers were added to the PVA membrane [18]. A moderate contribution was scored for Pnorm (Figure 4b), along with low to negligible contribution for the rest of the variables. Comparatively to the case of no specific layers, high separation between the variables was obtained as variables that exhibited contributions on one of the axes did not show contributions on the other. The only exception is Pnorm, where a contribution towards both PCs was obtained, yet to a lower extent for PC1.
For individuals, and similarly to the PVA-based TFC membranes with added specific layers (Figure 4), no clustering was obtained, indicating the efficiency of PCA in distinguishing between these membranes. The difference resides in a higher distribution of variables for this case, unlike the exclusively positive trends of PC1 (Figure 3). Individuals can be subdivided into two different groups: one presenting a positive correlation with the investigated factors on the positive side of PC1 (Pnorm, P, and T; Figure 4a); and another group presenting a positive correlation with the investigated factors on the negative side of PC1 (δ and salt rejection; Figure 4a). This dissociation would indicate that M7, M9, and M11 are more likely suited in situations where high permeation and temperatures are present, from one side. From another side, it showed the higher reliance of M8 and M10 on salt rejection and thickness of separative layers “δ”.

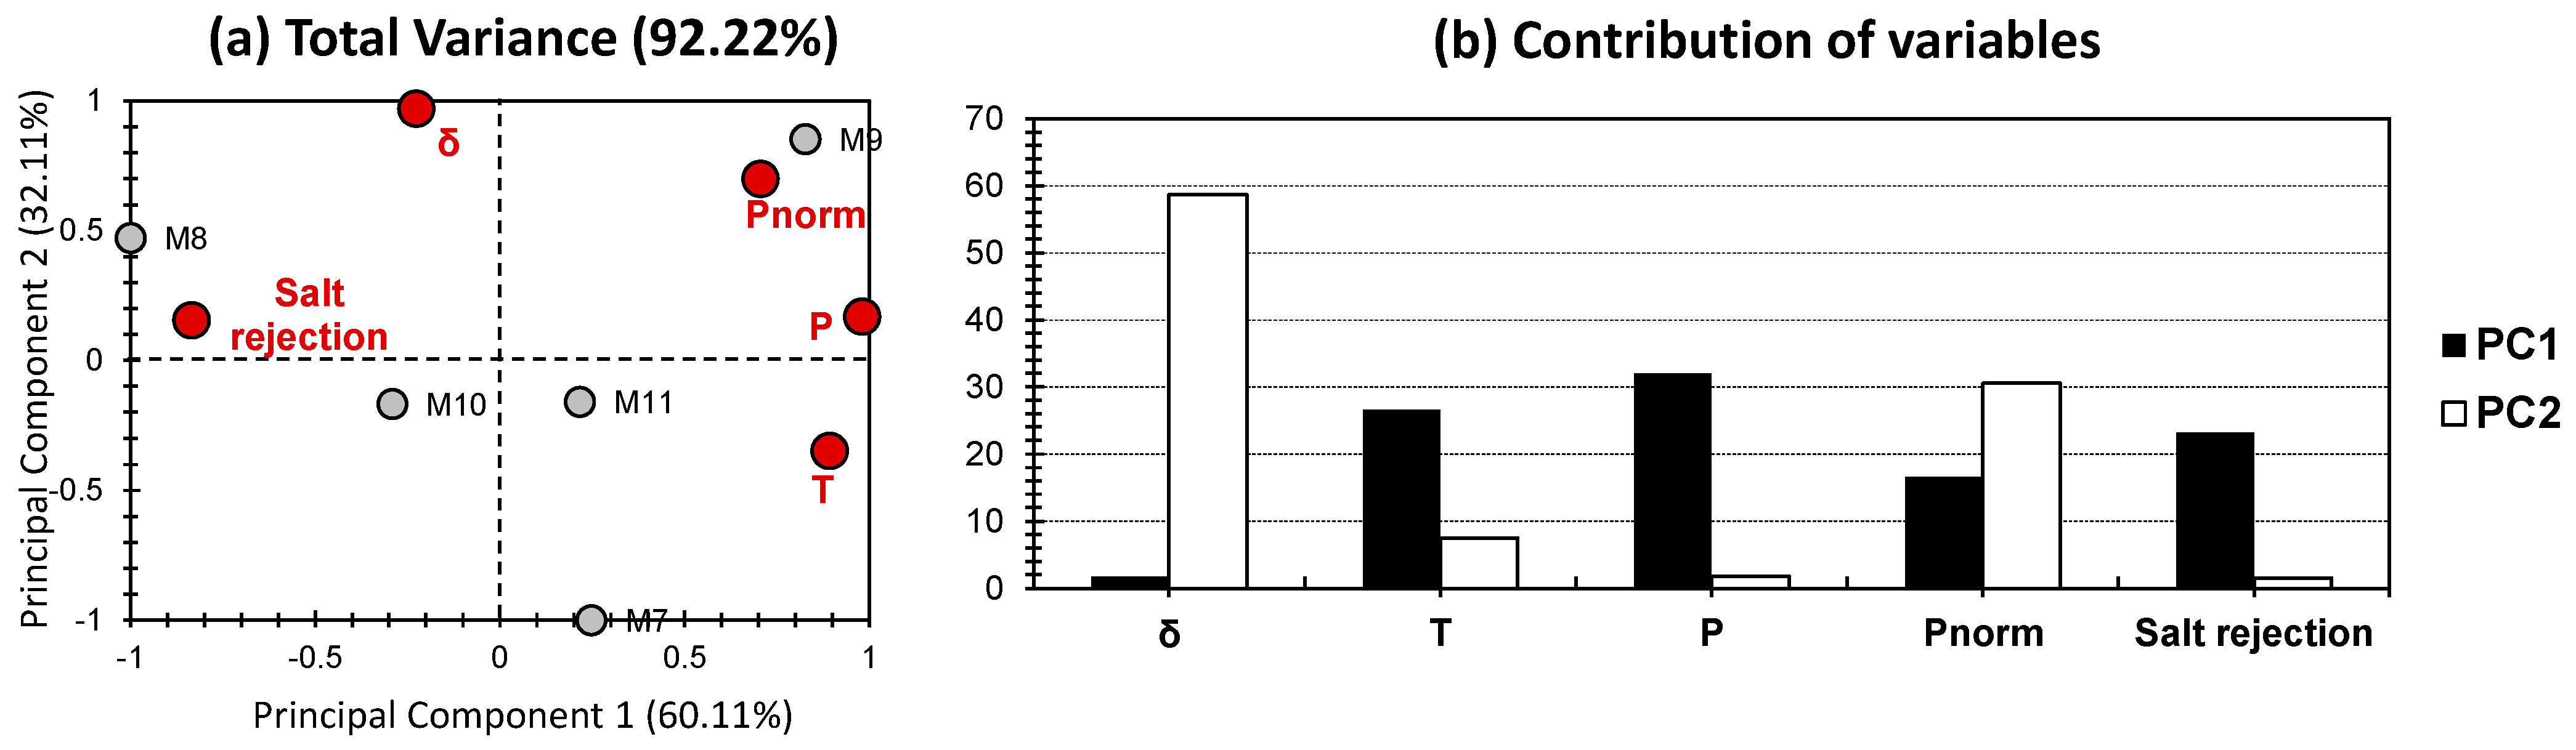
4.3. Permeation: Between Intrinsic Properties and Operational Features

In evaluating the performance of PVA-based TFC membranes, two critical parameters often come into focus: normalized permeation with selective layer thickness (Pnorm) and water permeation flux (P). Understanding the relevance of these factors is crucial for optimizing membrane design and enhancing desalination efficiency. Pnorm is a parameter that accounts for the permeation rate of water through the membrane normalized by the thickness of the selective layer. This parameter is essential for comparing the performance of membranes with varying selective layer thicknesses. By normalizing the permeation rate, Pnorm provides a more accurate representation of the intrinsic permeability of the membrane material, independent of the membrane’s thickness [43]. Pnorm offers insight into the inherent water permeability of the membrane material, which is critical for material selection and development, and helps eliminate the influence of thickness variations, providing a consistent basis for comparison among different membranes. This aspect is particularly important, where membranes with varying thicknesses are tested [27]. On the other hand, water permeation flux (P) is a measure of the amount of water that passes through a unit area of the membrane per unit time, directly indicating the membrane’s desalination performance in practical applications [28]. High P is desirable for efficient desalination as it indicates a higher throughput of desalinated water. P is a primary performance metric in pervaporation desalination, correlating directly with the productivity of the desalination process and translating to higher operational efficiency and lower energy consumption per unit of desalinated water, which is crucial for the economic viability of pervaporation desalination technologies [29]. Moreover, understanding the influences on water permeation flux, such as membrane material, structure, operating conditions, and feed composition, helps in designing membranes with optimized performance for specific desalination applications [27,28,29]. However, our results have shown opposite trends, indicating that Pnorm is actually more important than P in operational features. Pnorm mostly showed a higher contribution in PCAs where operational variables mostly dominate (Figure 1, Figure 2 and Figure 3). While Pnorm was found to be crucial in research and development phases for optimizing the intrinsic properties of membrane materials [27], our findings suggest that it also plays a more significant role in practical applications. In brief, both normalized permeation with selective layer thickness (Pnorm) and water permeation flux (P) are crucial for assessing the performance of PVA-based TFC membranes in pervaporation desalination. While P remains a key indicator of practical desalination performance [28], our findings indicate that Pnorm is more relevant for operational features, making it a critical parameter to ensure the development of high-performance, efficient, and economically viable pervaporation desalination membranes.

4.4. Layer Thickness: Influence of Selective Layer

The thickness of the selective layers in PVA-based TFC membranes plays a crucial role in determining their performance in pervaporation desalination. Membranes with specific, well-defined selective layers often exhibit more controlled and predictable permeation characteristics compared to those without a distinct selective layer [44]. In membranes with specific selective layers, the thickness directly influences the permeation flux and selectivity; a thinner selective layer generally results in higher water permeation flux due to reduced resistance to water molecules [45], but it may also lead to decreased salt rejection if the layer is too thin to maintain selectivity [46]. Conversely, a thicker selective layer tends to enhance salt rejection due to a longer diffusion path for salt ions, though it may reduce the overall water flux [47]. These findings go along the orthogonal positioning of δ along with P and salt rejection for the membrane samples with selective layers (Figure 4). For PVA-based TFC membranes without a specific selective layer, the performance tends to be less optimized as the membrane’s thickness can vary inconsistently, leading to unpredictable permeation rates and selectivity [48]. These membranes may not achieve the same level of efficiency and reliability in desalination applications as those with carefully controlled selective layers [48]. This would explain the moderate to low contribution of δ, when membrane samples without selective layers were investigated (Figure 3) The relevance of controlling the thickness of selective layers lies in achieving a balance between high water flux and effective salt rejection, which is essential for the economic and operational efficiency of pervaporation desalination processes [49]. Membranes with well-defined selective layers that are optimized for thickness can offer superior performance, making them preferable for high-demand desalination applications [49].

5. Conclusions

This study aims to apply the Principal Component Analysis (PCA) technique to better understand operational features for pervaporation desalination performance of PVA-based TFC membranes. When the entire dataset of PVA-based TFC membranes (with and without specific layers) was taken into consideration, it was shown that layer thickness significantly affect membrane performance. Thinner selective layers generally lead to higher water flux due to reduced resistance to mass transfer. On the other hand, the correlation between temperature and salt rejection confirms the influence of temperature on membrane efficiency. To increase the variance, PCA was applied with the exclusion of outliers (M1 and M2). Excluding these two samples raised the total variance to 74.15%. The higher variance confirms the efficiency of excluding outliers from a dataset to seek more accurate trends. This PCA approach allowed for the examination of permeation fluxes (P and Pnorm), along with the thickness of separative layers (δ), and temperature.
To decipher the effect of the sensitive layer, PCA was separately applied to membranes with and without added specific layers. It was revealed that Pnorm is the most influential variable for PVA-based TFC membranes without specific layers. PCA results showed that Pnorm is more important than P in operational features, highlighting its significance in both research and practical applications. Our findings suggest that while P remains a key performance property, Pnorm is critical for developing high-performance, efficient, and economically viable pervaporation desalination membranes. Conversely, a high contribution was noted for NaCl and salt rejection.
For membranes with specific layers, PCA showed the highest total variance of 92.22%. This approach highlighted the role of increasing temperature in the growth of salt-rejection rates. Additionally, the dominance of the contribution of δ showcased that adding specific layers strongly attracts water and allows it to pass through during pervaporation. Membranes with well-defined selective layers exhibit more controlled permeation characteristics, where thinner layers increase water flux but may reduce salt rejection, and thicker layers enhance salt rejection but lower water flux. These findings align with the orthogonal positioning of δ, P, and salt rejection, yielded by PCA and indicating the importance of optimizing selective layer thickness for superior performance. Membranes without specific selective layers show less predictable performance, emphasizing the need for controlled layer thickness to balance high water flux and effective salt rejection for economic and efficient desalination applications.

Author Contributions

Methodology, K.Y.; validation, K.Y.; formal analysis, H.C. and K.Y.; data curation, H.C., E.O. and K.Y.; writing—original draft, H.C., E.O., J.A., R.M., S.A., E.G.H. and O.M.; writing—review & editing, E.O., J.H., J.A., R.M., S.A., E.G.H., O.M. and K.Y.; supervision, J.H. and K.Y.; project administration, K.Y. All authors have read and agreed to the published version of the manuscript.

Funding

This research received no external funding.

Data Availability Statement

The contributions presented in the study are included in the article.

Conflicts of Interest

The authors declare no conflict of interest.

References

  1. Liu, S.; Zhou, G.; Cheng, G.; Wang, X.; Liu, G.; Jin, W. Emerging Membranes for Separation of Organic Solvent Mixtures by Pervaporation or Vapor Permeation. Sep. Purif. Technol. 2022, 299, 121729. [Google Scholar] [CrossRef]
  2. Dong, G.; Zhang, Y.; Pang, X.; Guo, M.; Moriyama, N.; Nagasawa, H.; Kanezashi, M.; Tsuru, T. Sub-Nanometer Scale Tailoring of the Microstructures of Composite Organosilica Membranes for Efficient Pervaporation of Toluene/n-Heptane Mixtures. J. Membr. Sci. 2023, 672, 121469. [Google Scholar] [CrossRef]
  3. Liu, G.; Jin, W. Pervaporation Membrane Materials: Recent Trends and Perspectives. J. Membr. Sci. 2021, 636, 119557. [Google Scholar] [CrossRef]
  4. Yang, G.; Xie, Z.; Cran, M.; Ng, D.; Gray, S. Enhanced Desalination Performance of Poly (Vinyl Alcohol)/Carbon Nanotube Composite Pervaporation Membranes via Interfacial Engineering. J. Membr. Sci. 2019, 579, 40–51. [Google Scholar] [CrossRef]
  5. Lai, C.-Y.; Sun, Y.-M.; Liu, Y.-L. Water-Soluble Ozonated Lignin as a Hydrophilic Modifier for Poly (Vinyl Alcohol) Membranes for Pervaporation Desalination. J. Membr. Sci. 2023, 685, 121959. [Google Scholar] [CrossRef]
  6. Selim, A.; Toth, A.J.; Haaz, E.; Fozer, D.; Szanyi, A.; Hegyesi, N.; Mizsey, P. Preparation and Characterization of PVA/GA/Laponite Membranes to Enhance Pervaporation Desalination Performance. Sep. Purif. Technol. 2019, 221, 201–210. [Google Scholar] [CrossRef]
  7. Song, Y.; Li, R.; Pan, F.; He, Z.; Yang, H.; Li, Y.; Yang, L.; Wang, M.; Wang, H.; Jiang, Z. Ultrapermeable Graphene Oxide Membranes with Tunable Interlayer Distances via Vein-like Supramolecular Dendrimers. J. Mater. Chem. A 2019, 7, 18642–18652. [Google Scholar] [CrossRef]
  8. Liang, B.; Li, Q.; Cao, B.; Li, P. Water Permeance, Permeability and Desalination Properties of the Sulfonic Acid Functionalized Composite Pervaporation Membranes. Desalination 2018, 433, 132–140. [Google Scholar] [CrossRef]
  9. Kim, M.; Chang, J.W.; Park, K.; Yang, D.R. Comprehensive Assessment of the Effects of Operating Conditions on Membrane Intrinsic Parameters of Forward Osmosis (FO) Based on Principal Component Analysis (PCA). J. Membr. Sci. 2022, 641, 119909. [Google Scholar] [CrossRef]
  10. Jalaei Salmani, H.; Hardian, R.; Kalani, H.; Moradi, M.R.; Karkhanechi, H.; Szekely, G.; Matsuyama, H. Predicting the Performance of Organic Solvent Reverse Osmosis Membranes Using Artificial Neural Network and Principal Component Analysis by Considering Solvent–Solvent and Solvent–Membrane Affinities. J. Membr. Sci. 2023, 687, 122025. [Google Scholar] [CrossRef]
  11. Younes, K.; Mouhtady, O.; Chaouk, H.; Obeid, E.; Roufayel, R.; Moghrabi, A.; Murshid, N. The Application of Principal Component Analysis (PCA) for the Optimization of the Conditions of Fabrication of Electrospun Nanofibrous Membrane for Desalination and Ion Removal. Membranes 2021, 11, 979. [Google Scholar] [CrossRef]
  12. Joliffe, I.; Morgan, B. Principal Component Analysis and Exploratory Factor Analysis. Stat. Methods Med. Res. 1992, 1, 69–95. [Google Scholar] [CrossRef]
  13. Younes, K.; Abdallah, M.; Hanna, E.G. The Application of Principal Components Analysis for the Comparison of Chemical and Physical Properties among Activated Carbon Models. Mater. Lett. 2022, 325, 132864. [Google Scholar] [CrossRef]
  14. Peiris, R.H.; Budman, H.; Moresoli, C.; Legge, R.L. Understanding Fouling Behaviour of Ultrafiltration Membrane Processes and Natural Water Using Principal Component Analysis of Fluorescence Excitation-Emission Matrices. J. Membr. Sci. 2010, 357, 62–72. [Google Scholar] [CrossRef]
  15. Peiris, R.H.; Budman, H.; Moresoli, C.; Legge, R.L. Development of a Species Specific Fouling Index Using Principal Component Analysis of Fluorescence Excitation–Emission Matrices for the Ultrafiltration of Natural Water and Drinking Water Production. J. Membr. Sci. 2011, 378, 257–264. [Google Scholar] [CrossRef]
  16. Younes, K.; Kharboutly, Y.; Antar, M.; Chaouk, H.; Obeid, E.; Mouhtady, O.; Abu-samha, M.; Halwani, J.; Murshid, N. Application of Unsupervised Learning for the Evaluation of Aerogels’ Efficiency towards Dye Removal—A Principal Component Analysis (PCA) Approach. Gels 2023, 9, 327. [Google Scholar] [CrossRef]
  17. Younes, K.; Kharboutly, Y.; Antar, M.; Chaouk, H.; Obeid, E.; Mouhtady, O.; Abu-samha, M.; Halwani, J.; Murshid, N. Application of Unsupervised Machine Learning for the Evaluation of Aerogels’ Efficiency towards Ion Removal—A Principal Component Analysis (PCA) Approach. Gels 2023, 9, 304. [Google Scholar] [CrossRef]
  18. Xue, Y.L.; Huang, J.; Lau, C.H.; Cao, B.; Li, P. Tailoring the Molecular Structure of Crosslinked Polymers for Pervaporation Desalination. Nat. Commun. 2020, 11, 1461. [Google Scholar] [CrossRef]
  19. Ashtekar, S.; McLeod, A.S.; Mantle, M.D.; Barrie, P.J.; Gladden, L.F.; Hastings, J.J. Determining the Adsorption Sites for Binary Mixtures of -Xylene and n-Heptane in Silicalite Using FT-Raman Spectroscopy and Temperature-Programmed Desorption. J. Phys. Chem. B 2000, 104, 5281–5287. [Google Scholar] [CrossRef]
  20. Liang, B.; Pan, K.; Li, L.; Giannelis, E.P.; Cao, B. High Performance Hydrophilic Pervaporation Composite Membranes for Water Desalination. Desalination 2014, 347, 199–206. [Google Scholar] [CrossRef]
  21. Chaudhri, S.G.; Rajai, B.H.; Singh, P.S. Preparation of Ultra-Thin Poly(Vinyl Alcohol) Membranes Supported on Polysulfone Hollow Fiber and Their Application for Production of Pure Water from Seawater. Desalination 2015, 367, 272–284. [Google Scholar] [CrossRef]
  22. Zhang, R.; Liang, B.; Qu, T.; Cao, B.; Li, P. High-Performance Sulfosuccinic Acid Cross-Linked PVA Composite Pervaporation Membrane for Desalination. Environ. Technol. 2019, 40, 312–320. Available online: https://www.tandfonline.com/doi/full/10.1080/09593330.2017.1388852 (accessed on 23 May 2024). [CrossRef]
  23. Zhang, R.; Xu, X.; Cao, B.; Li, P. Fabrication of High-Performance PVA/PAN Composite Pervaporation Membranes Crosslinked by PMDA for Wastewater Desalination. Pet. Sci. 2018, 15, 146–156. [Google Scholar] [CrossRef]
  24. Cheng, C.; Shen, L.; Yu, X.; Yang, Y.; Li, X.; Wang, X. Robust Construction of a Graphene Oxide Barrier Layer on a Nanofibrous Substrate Assisted by the Flexible Poly(Vinylalcohol) for Efficient Pervaporation Desalination. J. Mater. Chem. A 2017, 5, 3558–3568. [Google Scholar] [CrossRef]
  25. Tseng, C.; Liu, Y.-L. Creation of Water-Permeation Pathways with Matrix-Polymer Functionalized Carbon Nanotubes in Polymeric Membranes for Pervaporation Desalination. J. Membr. Sci. Lett. 2022, 2, 100027. [Google Scholar] [CrossRef]
  26. Xing, Y.; Xue, Y.; Qin, D.; Zhao, P.; Li, P. Microwave-Induced Ultrafast Crosslinking of Poly (Vinyl Alcohol) Blended with Nanoparticles as Wave Absorber for Pervaporation Desalination. J. Membr. Sci. Lett. 2022, 2, 100021. [Google Scholar] [CrossRef]
  27. Saleh, T.A.; Gupta, V.K. Nanomaterial and Polymer Membranes: Synthesis, Characterization, and Applications; Elsevier: Amsterdam, The Netherlands, 2016. [Google Scholar]
  28. Yan, D. Membrane Desalination Technologies. In A Multidisciplinary Introduction to Desalination; River Publishers: Aalborg, Denmark, 2022; pp. 155–199. [Google Scholar]
  29. Cohen-Tanugi, D.; McGovern, R.K.; Dave, S.H.; Lienhard, J.H.; Grossman, J.C. Quantifying the Potential of Ultra-Permeable Membranes for Water Desalination. Energy Environ. Sci. 2014, 7, 1134–1141. [Google Scholar] [CrossRef]
  30. Mouhtady, O.; Obeid, E.; Abu-samha, M.; Younes, K.; Murshid, N. Evaluation of the Adsorption Efficiency of Graphene Oxide Hydrogels in Wastewater Dye Removal: Application of Principal Component Analysis. Gels 2022, 8, 447. [Google Scholar] [CrossRef]
  31. Younes, K.; Moghrabi, A.; Moghnie, S.; Mouhtady, O.; Murshid, N.; Grasset, L. Assessment of the Efficiency of Chemical and Thermochemical Depolymerization Methods for Lignin Valorization: Principal Component Analysis (PCA) Approach. Polymers 2022, 14, 194. [Google Scholar] [CrossRef]
  32. Dmitrenko, M.; Kuzminova, A.; Zolotarev, A.; Ermakov, S.; Roizard, D.; Penkova, A. Enhanced Pervaporation Properties of PVA-Based Membranes Modified with Polyelectrolytes. Application to IPA Dehydration. Polymers 2020, 12, 14. [Google Scholar] [CrossRef]
  33. Selima, A.; Totha, A.; Fozera, D.; Haaza, E.; Nagya, T.; Mizseya, P. Laponite/PVA Pervaporation Membrane for Desalinating Simulated RO High-Salinity by-Product. Alcohol 2019, 12, 18. [Google Scholar] [CrossRef]
  34. Galiano, F.; Castro-Muñoz, R.; Figoli, A. Pervaporation, Vapour Permeation and Membrane Distillation: From Membrane Fabrication to Application. Membranes 2021, 11, 162. [Google Scholar] [CrossRef] [PubMed]
  35. Unlu, D. Water Desalination by Pervaporation Using MIL-101(Cr) and MIL-101(Cr)@GODoped PVA Hybrid Membranes. Water. Air. Soil Pollut. 2023, 234, 96. [Google Scholar] [CrossRef]
  36. Praptowidodo, V.S. Influence of Swelling on Water Transport through PVA-Based Membrane. J. Mol. Struct. 2005, 739, 207–212. [Google Scholar] [CrossRef]
  37. Zhang, J.; Li, S.; Ren, D.; Li, H.; Lv, X.; Han, L.; Su, B. Fabrication of Ultra-Smooth Thin-Film Composite Nanofiltration Membrane with Enhanced Selectivity and Permeability on Interlayer of Hybrid Polyvinyl Alcohol and Graphene Oxide. Sep. Purif. Technol. 2021, 268, 118649. [Google Scholar] [CrossRef]
  38. Sun, Z.; Zhu, X.; Tan, F.; Zhou, W.; Zhang, Y.; Luo, X.; Xu, J.; Wu, D.; Liang, H.; Cheng, X. Poly(Vinyl Alcohol)-Based Highly Permeable TFC Nanofiltration Membranes for Selective Dye/Salt Separation. Desalination 2023, 553, 116479. [Google Scholar] [CrossRef]
  39. Qian, X.; Li, N.; Wang, Q.; Ji, S. Chitosan/Graphene Oxide Mixed Matrix Membrane with Enhanced Water Permeability for High-Salinity Water Desalination by Pervaporation. Desalination 2018, 438, 83–96. [Google Scholar] [CrossRef]
  40. Zhan, Z.-M.; Tang, Y.-J.; Zhu, K.-K.; Xue, S.-M.; Ji, C.-H.; Tang, C.Y.; Xu, Z.-L. Coupling Heat Curing and Surface Modification for the Fabrication of High Permselectivity Polyamide Nanofiltration Membranes. J. Membr. Sci. 2021, 623, 119073. [Google Scholar] [CrossRef]
  41. Mahto, A.; Halakarni, M.A.; Maraddi, A.; D’Souza, G.; Samage, A.A.; Thummar, U.G.; Mondal, D.; Nataraj, S.K. Upcycling Cellulose Acetate from Discarded Cigarette Butts: Conversion of Contaminated Microfibers into Loose-Nanofiltration Membranes for Selective Separation. Desalination 2022, 535, 115807. [Google Scholar] [CrossRef]
  42. Shi, C.; Zhang, S.; Wang, W.; Linhardt, R.J.; Ragauskas, A.J. Preparation of Highly Reactive Lignin by Ozone Oxidation: Application as Surfactants with Antioxidant and Anti-UV Properties. ACS Sustain. Chem. Eng. 2020, 8, 22–28. [Google Scholar] [CrossRef]
  43. Stafie, N. Poly (Dimethyl Siloxane)—Based Composite Nanofiltration Membranes for Non-Aqueous Applications. Ph.D. Thesis, University of Twente, Enschede, The Netherlands, 2004. [Google Scholar]
  44. Cuperus, F.P.; Smolders, C.A. Characterization of UF Membranes: Membrane Characteristics and Characterization Techniques. Adv. Colloid Interface Sci. 1991, 34, 135–173. [Google Scholar] [CrossRef]
  45. Scott, K. Handbook of Industrial Membranes; Elsevier: Amsterdam, The Netherlands, 1995. [Google Scholar]
  46. Ng, L.Y.; Mohammad, A.W.; Ng, C.Y. A Review on Nanofiltration Membrane Fabrication and Modification Using Polyelectrolytes: Effective Ways to Develop Membrane Selective Barriers and Rejection Capability. Adv. Colloid Interface Sci. 2013, 197, 85–107. [Google Scholar] [CrossRef] [PubMed]
  47. Wang, L.; Cao, T.; Dykstra, J.E.; Porada, S.; Biesheuvel, P.M.; Elimelech, M. Salt and Water Transport in Reverse Osmosis Membranes: Beyond the Solution-Diffusion Model. Environ. Sci. Technol. 2021, 55, 16665–16675. [Google Scholar] [CrossRef]
  48. Khoo, Y.S.; Lau, W.J.; Liang, Y.Y.; Yusof, N.; Ismail, A.F. Surface Modification of PA Layer of TFC Membranes: Does It Effective for Performance Improvement? J. Ind. Eng. Chem. 2021, 102, 271–292. [Google Scholar] [CrossRef]
  49. Li, L.; Hou, J.; Ye, Y.; Mansouri, J.; Chen, V. Composite PVA/PVDF Pervaporation Membrane for Concentrated Brine Desalination: Salt Rejection, Membrane Fouling and Defect Control. Desalination 2017, 422, 49–58. [Google Scholar] [CrossRef]
Figure 1. (a) PCA biplot representation of all datasets for pervaporation desalination performance of PVA-based TFC membranes (data were obtained from the previous findings of Lai et al. [5]). Grey bullets indicate the different PVA-based TFC membranes. Red bullets indicate operational features. (b) The % contribution of the different variables in-hand, relative to PC1 (black) and PC2 (white).
Processes 12 01502 g001
Figure 2. (a) PCA biplot representation of datasets, excluding M1 and M2, for pervaporation desalination performance of PVA-based TFC membranes (data were obtained from the previous findings of Lai et al. [5]). Grey bullets indicate the different PVA-based TFC membranes. Red bullets indicate operational features (NaCl was removed due to the high proximity between the investigated materials). (b) The % contribution of the different variables in-hand, relative to PC1 (black) and PC2 (white).
Processes 12 01502 g002
Figure 3. (a) PCA biplot representation of datasets for pervaporation desalination performance of PVA-based TFC membranes without any specific layers (M1 to M6; data were obtained from the previous findings of Lai et al. [5]). Grey bullets indicate the different PVA-based TFC membranes. Red bullets indicate operational features. (b) The % contribution of the different variables in-hand, relative to PC1 (black) and PC2 (white).
Processes 12 01502 g003
Figure 4. (a) PCA biplot representation of datasets for pervaporation desalination performance of PVA-based TFC membranes with specific layers (M7 to M11; data were obtained from the previous findings of Lai et al. [5]). Grey bullets indicate the different PVA-based TFC membranes. Red bullets indicate operational features (NaCl was removed due to its proximity between the investigated materials). (b) The % contribution of the different variables in-hand, relative to PC1 (black) and PC2 (white).
Processes 12 01502 g004
Disclaimer/Publisher’s Note: The statements, opinions and data contained in all publications are solely those of the individual author(s) and contributor(s) and not of MDPI and/or the editor(s). MDPI and/or the editor(s) disclaim responsibility for any injury to people or property resulting from any ideas, methods, instructions or products referred to in the content.

