Abstract
Deep carbonate gas reservoirs exhibit diverse reservoir types and complex seepage patterns. To study the gas production capabilities of different composite reservoir types, we classified the reservoirs of the fourth member of the Dengying Formation in the Anyue Gas Field into high-quality reservoirs (HRs) and poor-quality reservoirs (PRs) based on high-pressure mercury injection (HPMI) experiment results. By varying the differential pressure of the depletion experiment and the connection method, as well as the permeability and water saturation of the composite core, the effects of well location deployment, permeability ratio of the high-quality reservoir and poor-quality reservoir (PRHPR), gas well production pressure difference (GWPPD), and water saturation on the depletion gas production characteristics of the composite reservoir were studied. The research results show that (1) deploying wells on HR enables high gas production rates and ultimate recovery rates; (2) only when the PRHPR falls within a reasonable range (21.88–43.19) can the “dynamic recharge” capability of PR and the high permeability of HR be coordinated to achieve high gas recovery rates; (3) a GWPPD of 3 MPa is optimal, resulting in fast gas production rates and high ultimate recovery rates for PR; (4) high water saturation (≥50%) leads to premature water breakthrough at the well bottom, decreased gas production rate, and sealing of HR and PR reserves by formation water. Combining experimental results with field production data is our next research focus. Our future research focus will be on integrating experimental results with field production data to provide solid theoretical support for the efficient development of this type of gas reservoir.
1. Introduction
As a low-carbon, environmentally friendly, and clean energy, natural gas has received continuous attention in the global energy field [1]. Statistical data reveal that carbonate reservoirs account for approximately 45% of the world’s recoverable natural gas reserves and 60% of total production [2]. As a result, carbonate gas reservoirs are a vital component of the global natural gas landscape, playing a pivotal role in the development of the world’s natural gas industry. In China, the carbonate rock region spans over one-third of the country’s land area, covering an estimated 3,000,000 square kilometers [3]. Carbonate gas reservoirs develop cross-scale porous media, with pores, cavities, and fractures coexisting with various types of reservoirs and strong heterogeneity. Actual gas reservoirs are composite reservoirs (CRs) containing multiple types of reservoirs, and different types of reservoirs are distributed horizontally and vertically, resulting in complex macroscopic seepage laws of gas reservoirs, large differences in gas well productivity, and mismatch between single well high production and stable production capacity [4,5,6,7,8]. The Dengying Formation gas pool in the Anyue Gas Field is a typical representative of ancient deep carbonate gas pools in China, with a gas-bearing area of about 7500 km2 and a proven natural gas reserve of 0.59 trillion m3 [4,9]. From the two aspects of microscopic pore-throat structure characteristics and macroscopic seepage law, the Dengying Formation carbonate reservoirs can be divided into three types: pore type, cavity type, and fracture-cavity type [10,11,12,13,14]. At present, the development effect of reservoirs in the platform margin zone of the Dengying Formation is good, and the gas wells are mainly medium–high production wells with generally strong production stability. However, large-scale reservoirs in the intra-platform have not been developed on a large scale, mainly because the reservoirs in the intra-platform are thin, poor in physical properties, low in gas well productivity, and lack economic benefits [15,16]. How to economically and effectively develop the reserves of pore-type reservoirs and improve the production degree of the reserves has become the key to realizing the scale-effective development of intra-platform gas reservoirs.
Gas well productivity is the most critical and direct indicator to describe the development effect of gas reservoirs, and the gas production capacity of reservoirs directly determines the productivity of gas wells [17,18,19]. The common research methods of reservoir gas production capacity mainly include well test analysis, numerical simulation, and physical simulation, each of which has advantages and disadvantages. For carbonate gas reservoirs with strong heterogeneity, the results of well test analyses are often only applicable to single-well productivity evaluation, which has no obvious guiding significance for the overall development of gas reservoirs, and the time and economic costs are relatively large. Additionally, using numerical simulation software to accurately simulate the production and development process of carbonate reservoirs requires accurate geological data and huge computing resources.
Currently, physical modeling research related to reservoir gas production capacity mainly focuses on tight sandstone reservoirs and coal seams. Zhu et al. [20] used sandstone to conduct “series” experiments to study the dynamic gas production characteristics of composite reservoirs with planar heterogeneity. Yang et al. [21] selected tight sandstone for “serial and parallel” experiments and discussed the influence of fracture width, fracture–substrate configuration relationship, etc., on the gas mass transfer efficiency of tight sandstone. Zhang et al. [22] selected coal seam samples as the research object and carried out “series and parallel” experiments to study the relationship between gas volume flow rate, core permeability, and displacement pressure difference under different combination modes. Hu et al. [23] used sandstone to conduct “serial” experiments to study the influence of well location deployment mode on the gas production characteristics of planar heterogeneous sandstone reservoirs. In addition, Wang et al. [10] established a multi-layer commingled production simulation experimental model using plunger cores based on the study of the pore throat structure of carbonate gas reservoirs and studied the effects of interlayer heterogeneity, production pressure difference, water saturation, and water invasion on the gas supply capacity of gas reservoirs. However, Wang’s model treats each type of reservoir as an independent pressure system, neglecting the fluid exchange between different reservoirs and the actual flow of reservoir gas, which deviates from the actual seepage rules. To date, relevant research on gas reservoir production capacity has mainly concentrated on sandstone reservoirs. In contrast, there is a scarcity of studies on the seepage law and gas production capacity of carbonate composite reservoirs, resulting in a limited understanding of the gas production characteristics of this type of gas reservoir and unclear seepage mechanisms.
As a common method to characterize the pore-throat distribution characteristics of rocks, high-pressure mercury intrusion testing technology has achieved good application results in various reservoir rocks [24,25,26]. In this paper, the reservoir cores of the fourth member of the Dengying Formation in the Gaoshiti-Moxi block of the Anyue gas field were selected, and HPMI experiments and series and parallel depletion seepage experiments of full-diameter cores were carried out. On the basis of grasping the microscopic pore-throat characteristics of the typical core, the gas reservoirs in the study area are divided into HR and PR. On this basis, the effects of well deployment mode, PRHPR, GWPPD, and reservoir water saturation on the depleted gas production capacity of CR were further studied. The aim was to explore how to develop HR, such as cavity-type and fractured-cavity-type reservoirs, while also considering the development of PR. This research aims to achieve favorable development outcomes in terms of both economic benefits and reserve extraction levels. The findings will provide valuable insights for the efficient development of the reserves of PR in intra-platform gas reservoirs of the study area, thus achieving economies of scale.
2. Experimental Section
2.1. Experimental Materials
The experimental cores were all taken from the Gaoshiti-Moxi block of the fourth member of the Sinian Dengying Formation in the Anyue gas field. A total of 6 plunger cores and 6 full-diameter cores were selected according to the experimental requirements. Notably, the full-diameter cores were chosen for their large size, which allowed for the preservation of cavities and fractures in their complete form, enabling a more realistic simulation of actual gas reservoirs. The permeability of the selected cores ranged from 0.009 to 5.092 × 10⁻³ μm2, and the porosity ranged from 1.89 to 4.31%. The detailed physical parameters of each core are shown in Table 1. Referring to the composition analysis data of the formation water in the study area, the laboratory is equipped with iso-salinity brine, the water type is CaCl2, and the salinity is 75,312 mg/L (see Table 2). Furthermore, to ensure the safety of high-temperature and high-pressure seepage experiments, nitrogen with a purity of 99.99% (Huangyuan Chemical gas Co., LTD, Beijing, China) was used to simulate reservoir natural gas.

Table 1.
Physical parameters of the experimental core.
Table 2.
Formation water composition.
2.2. HPMI Method
The HPMI experiment involves indirectly obtaining the core pore throat structure characteristics by recording the corresponding mercury injection pressure at different mercury injection saturations of rock samples. In this experiment, a Pore Maste-60 automatic mercury intrusion instrument (Hua’an Co., Ltd., Haian, China) was used, with a maximum mercury injection pressure of 205 MPa, a surface tension of 485 mN/m, and a contact angle of 140°. The specific operation and data processing of the HPMI experiment refer to the national standard of the People’s Republic of China, “Measuring the Pore Size Distribution and Porosity of Solid Materials by Mercury Intrusion and Gas Adsorption Method Part 1: Mercury Intrusion Method” [27]. HPMI experiments were carried out on six plunger cores using the mercury porosimeter, and after obtaining the mercury intrusion curves of the samples, the intrusion curves were converted into throat size distribution curves using Formula (1).
where pc is capillary pressure, MPa. rc is throat radius, μm.
2.3. High-Temperature and High-Pressure Depletion Seepage Test Method
2.3.1. Experimental Principle
This part uses high-temperature and high-pressure depletion seepage experiments to simulate the actual gas reservoir depletion development process, which ensures high similarity in the following four aspects: (1) The physical properties of the reservoirs are similar. According to the porosity and permeability, 6 full-diameter cores were selected in the study area as samples for this experiment. (2) The temperature and pressure conditions are similar. Referring to the average temperature and pressure conditions in the study area, the fluid pressure is set at 56 MPa, the overlying confining pressure is 135 MPa, and the temperature is 150 °C. (3) The production mode is similar; the experimental pressure difference is designed according to the actual production pressure difference of the gas well, and the production is carried out according to the constant volume depletion method. (4) The physical models are similar, and the actual reservoirs are simulated by combining the characteristic cores of different types of reservoirs in series or in parallel.
2.3.2. Experimental Equipment
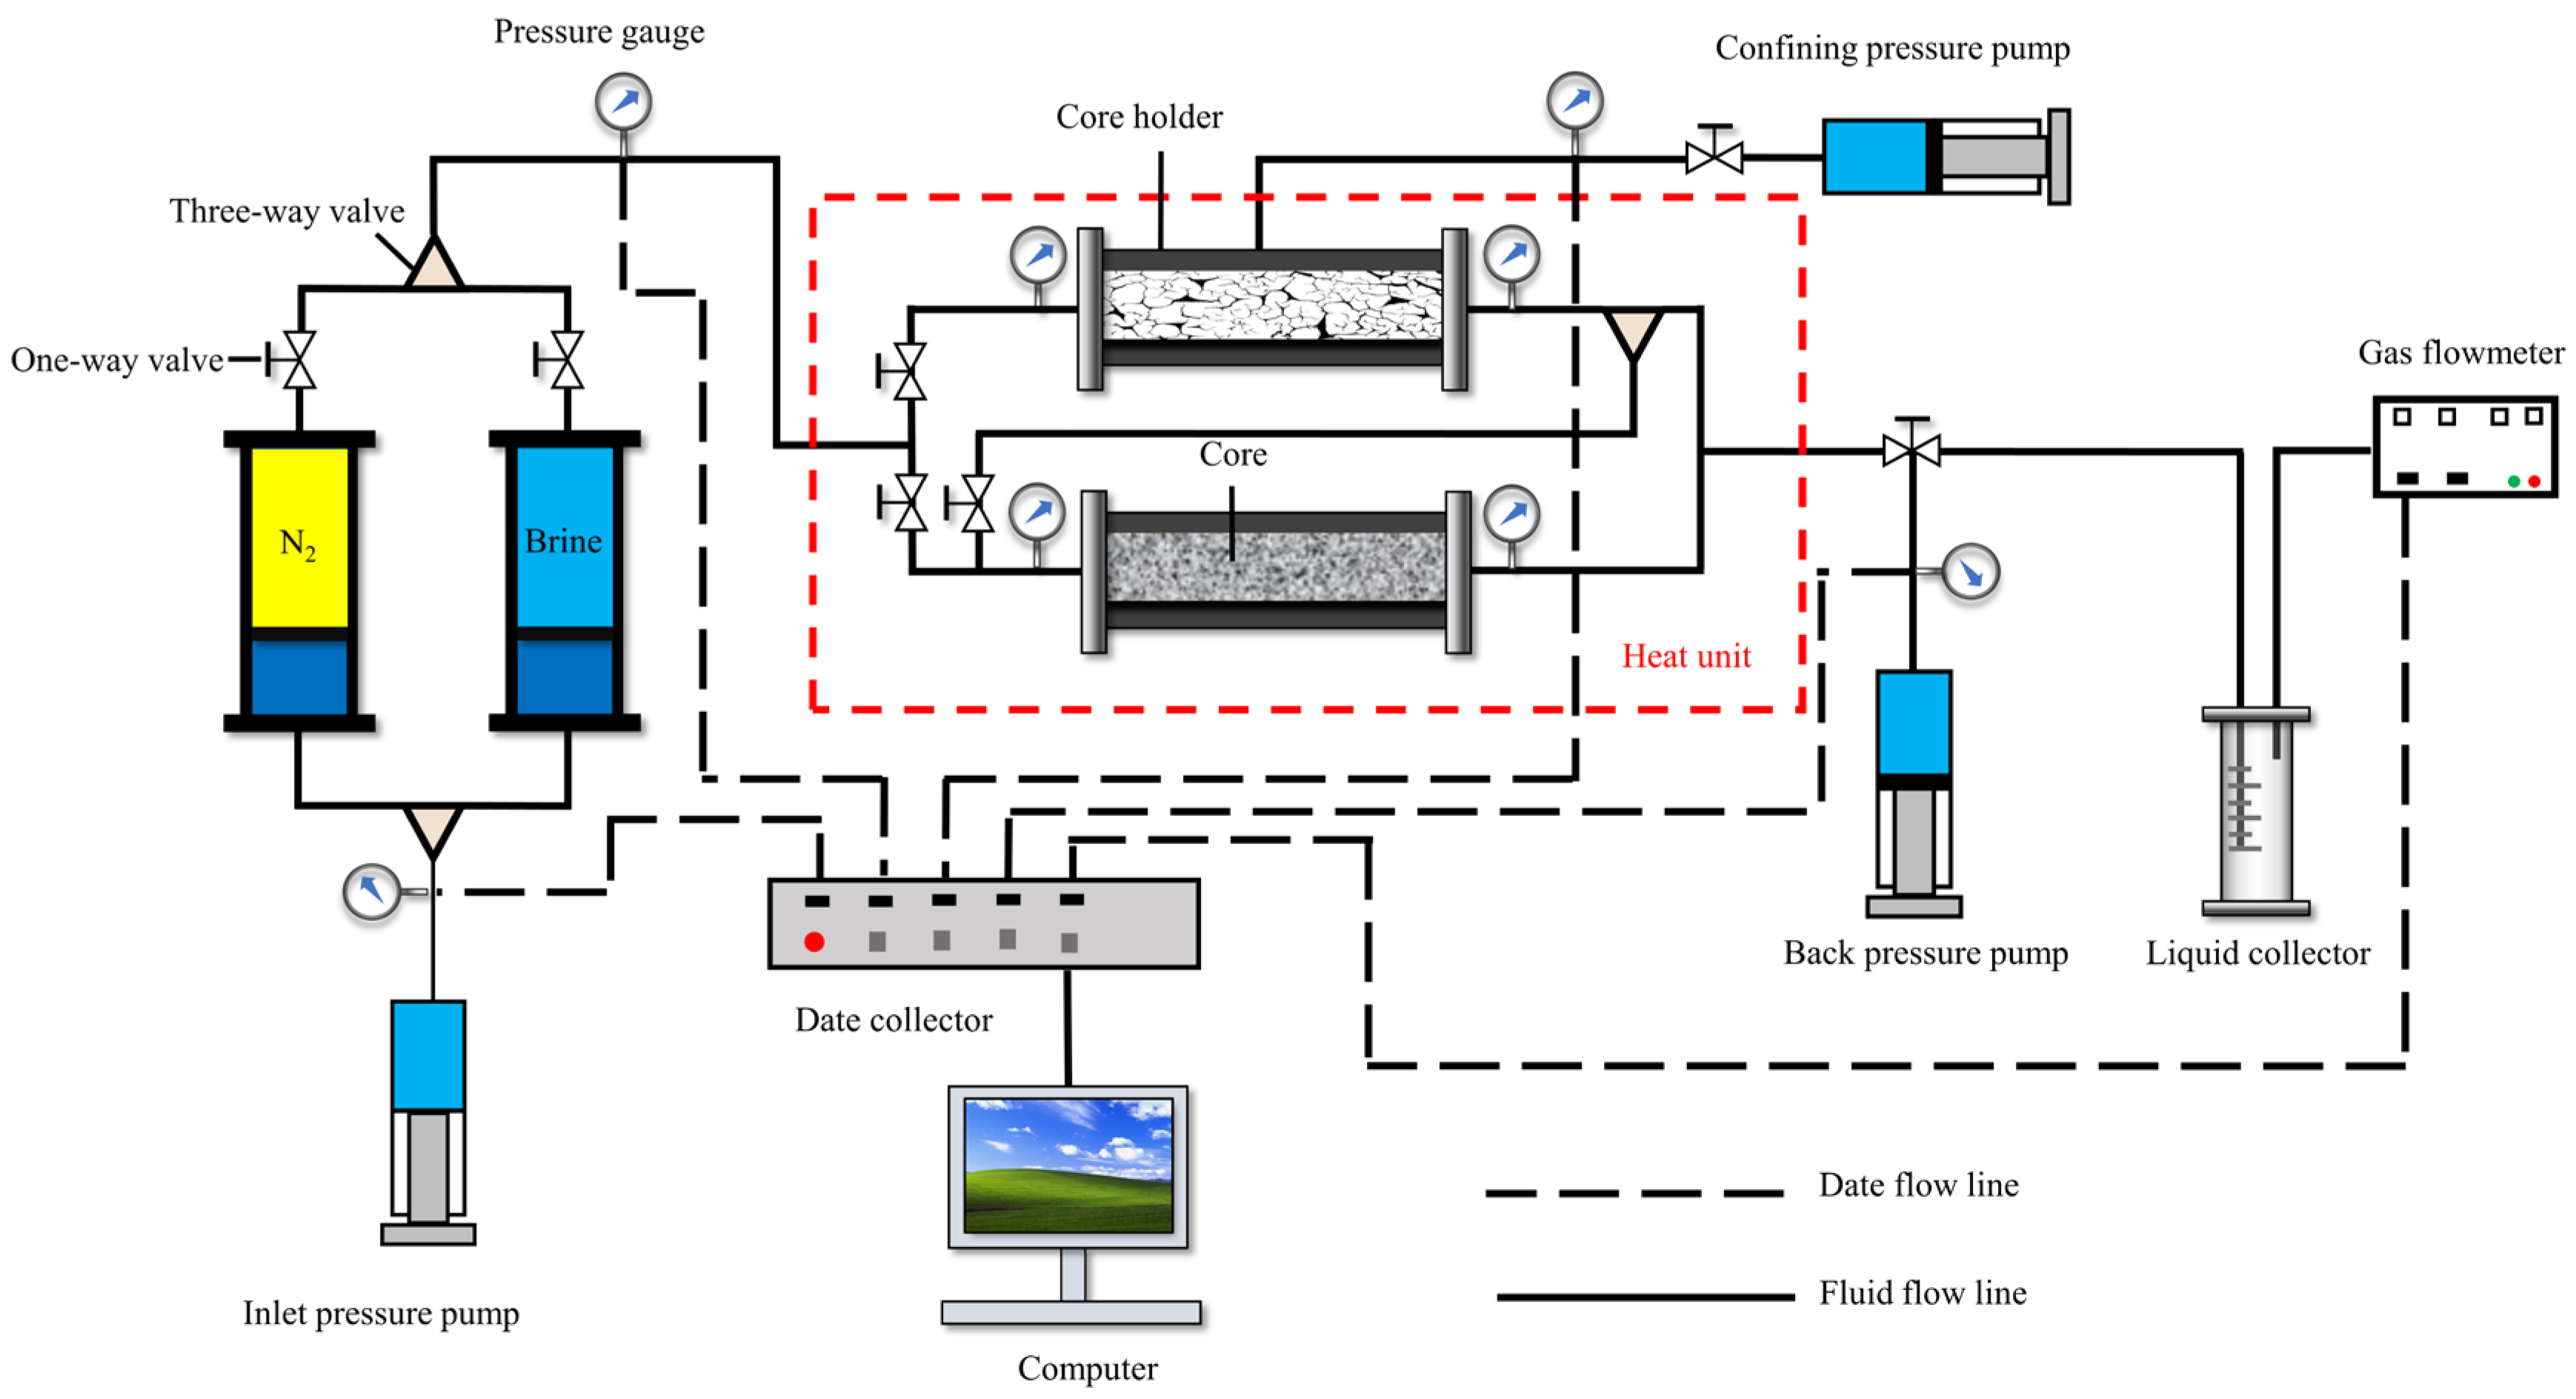
This experiment adopts the TC-180 multifunctional seepage experimental system developed by Haian Petroleum Research Instrument Co., Ltd. (Jiangsu, China). The seepage system mainly includes five functions of gas/liquid supply, pressurization, maintaining temperature, metering, and data collection. In addition, it has the characteristics of high pressure bearing, good temperature resistance, excellent sealing, safety, and stability, which can fully meet the needs of this experiment. The flow chart of the experimental device is shown in Figure 1.

Figure 1.
Physical simulation device for depleted development of composite reservoirs in high-temperature and high-pressure gas reservoirs.
2.3.3. Experimental Protocol Design
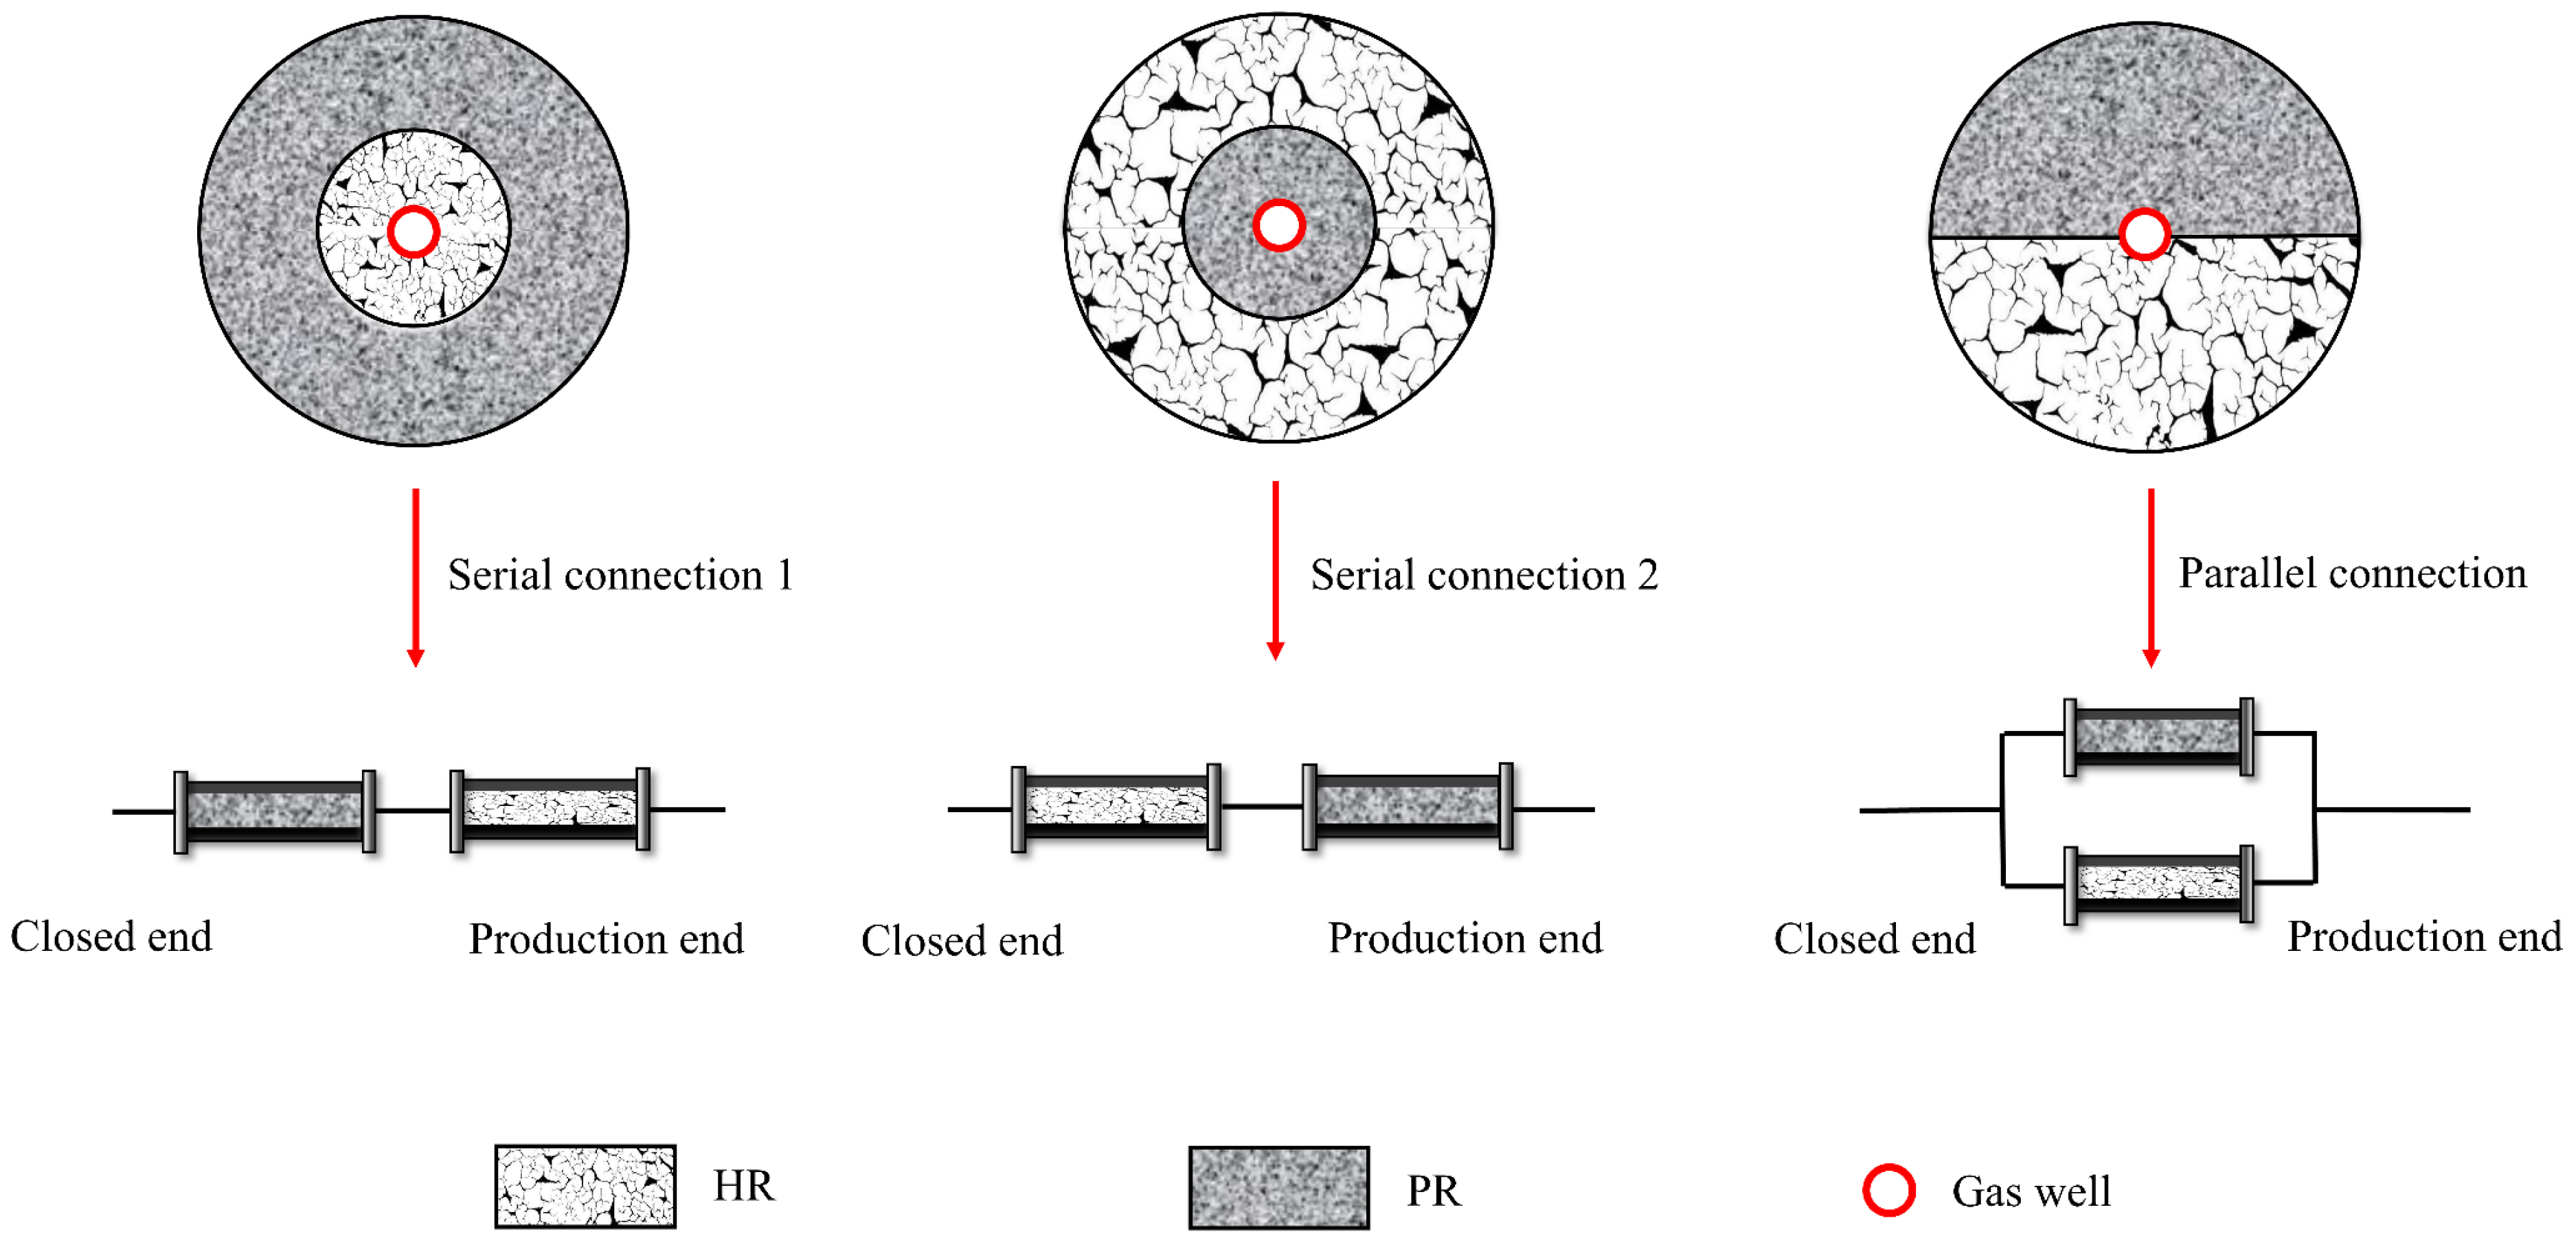
The experimental program consists of four primary items: (1) By altering the core connection methods, the influence of well location deployment mode on the gas production characteristics of composite reservoirs is studied (see Figure 2). (2) By modifying the permeability of composite cores, the influence of PRHPR on gas production characteristics of composite reservoirs is studied. (3) By varying the experimental pressure difference, the influence of GWPPD on gas production characteristics of composite reservoirs is studied. (4) By establishing different water saturations (10%, 30%, 50%, 70%, and 90%) in rock samples, the influence of water saturation on gas production characteristics of composite reservoirs was studied. The detailed experimental design is shown in Table 3.
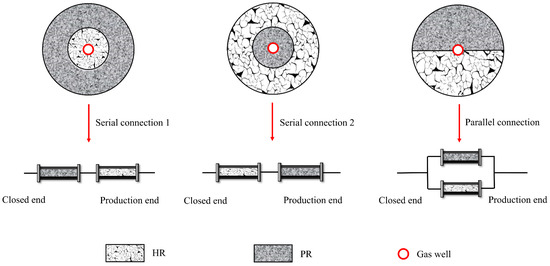
Figure 2.
Physical simulation methods corresponding to different well deployment modes.
Table 3.
Experimental protocol design.
Additionally, irreducible water saturation measurement experiments were carried out on three types of cores. The measurement results show that the irreducible water saturation of pore-type cores is between 21% and 33%, the irreducible water saturation of cavity-type cores is between 17% and 25%, and the irreducible water saturation of fracture-cavity type is between 12% and 18% (minimum). In order to prevent the unsteady gas-water two-phase flow from interfering with the experimental results, the initial water saturation of the core was uniformly set to 10% (below the irreducible water saturation of the core).
2.3.4. Experimental Procedures
This part provides a detailed description of the specific process of conducting high-temperature and high-pressure depletion seepage experiments. First, the 6 experimental cores were placed into an oven at 100 °C for 8 h of drying treatment, followed by accurate measurements of the dry weight of the samples and the pore volume of the cores. Next, the experimental core was placed in a vacuum vessel, where it was vacuum-saturated with the prepared experimental water sample. The core was removed every 10 min and re-weighed to calculate and check whether the established water saturation met the required value. This operation was repeated until the water saturation of the experimental core met the experimental requirements. The water-saturated core was then placed in the core holder, and the confining pressure pump was increased stepwise to 135 MPa to simulate the pressure of the overlying strata on the reservoir. The back pressure pump was set to 58 MPa to prevent gas escape during pressurization. The flow pressure pump was set to 56 MPa to slowly increase the fluid pressure in the core holder. When the pressure indications at both ends of the core holder are stable and consistent, the reservoir flow pressure simulation is completed. Finally, the upstream valve of the core holder is closed, the gas supply is cut off, and a closed boundary is formed. At the same time, the downstream valve of the core holder is opened, and the pressure of the back pressure pump is reduced so that the initial fluid pressure difference between the upstream and downstream of the core holder is the experimental pressure difference, and the data collection device is used to collect the pressure gauge and flowmeter data in real time. The above steps are repeated until all the experimental content is completed.
3. Reservoir Division Standard Based on Hpmi Results
3.1. Pore Characteristics by Capillary Pressure Curves of HPMI Results
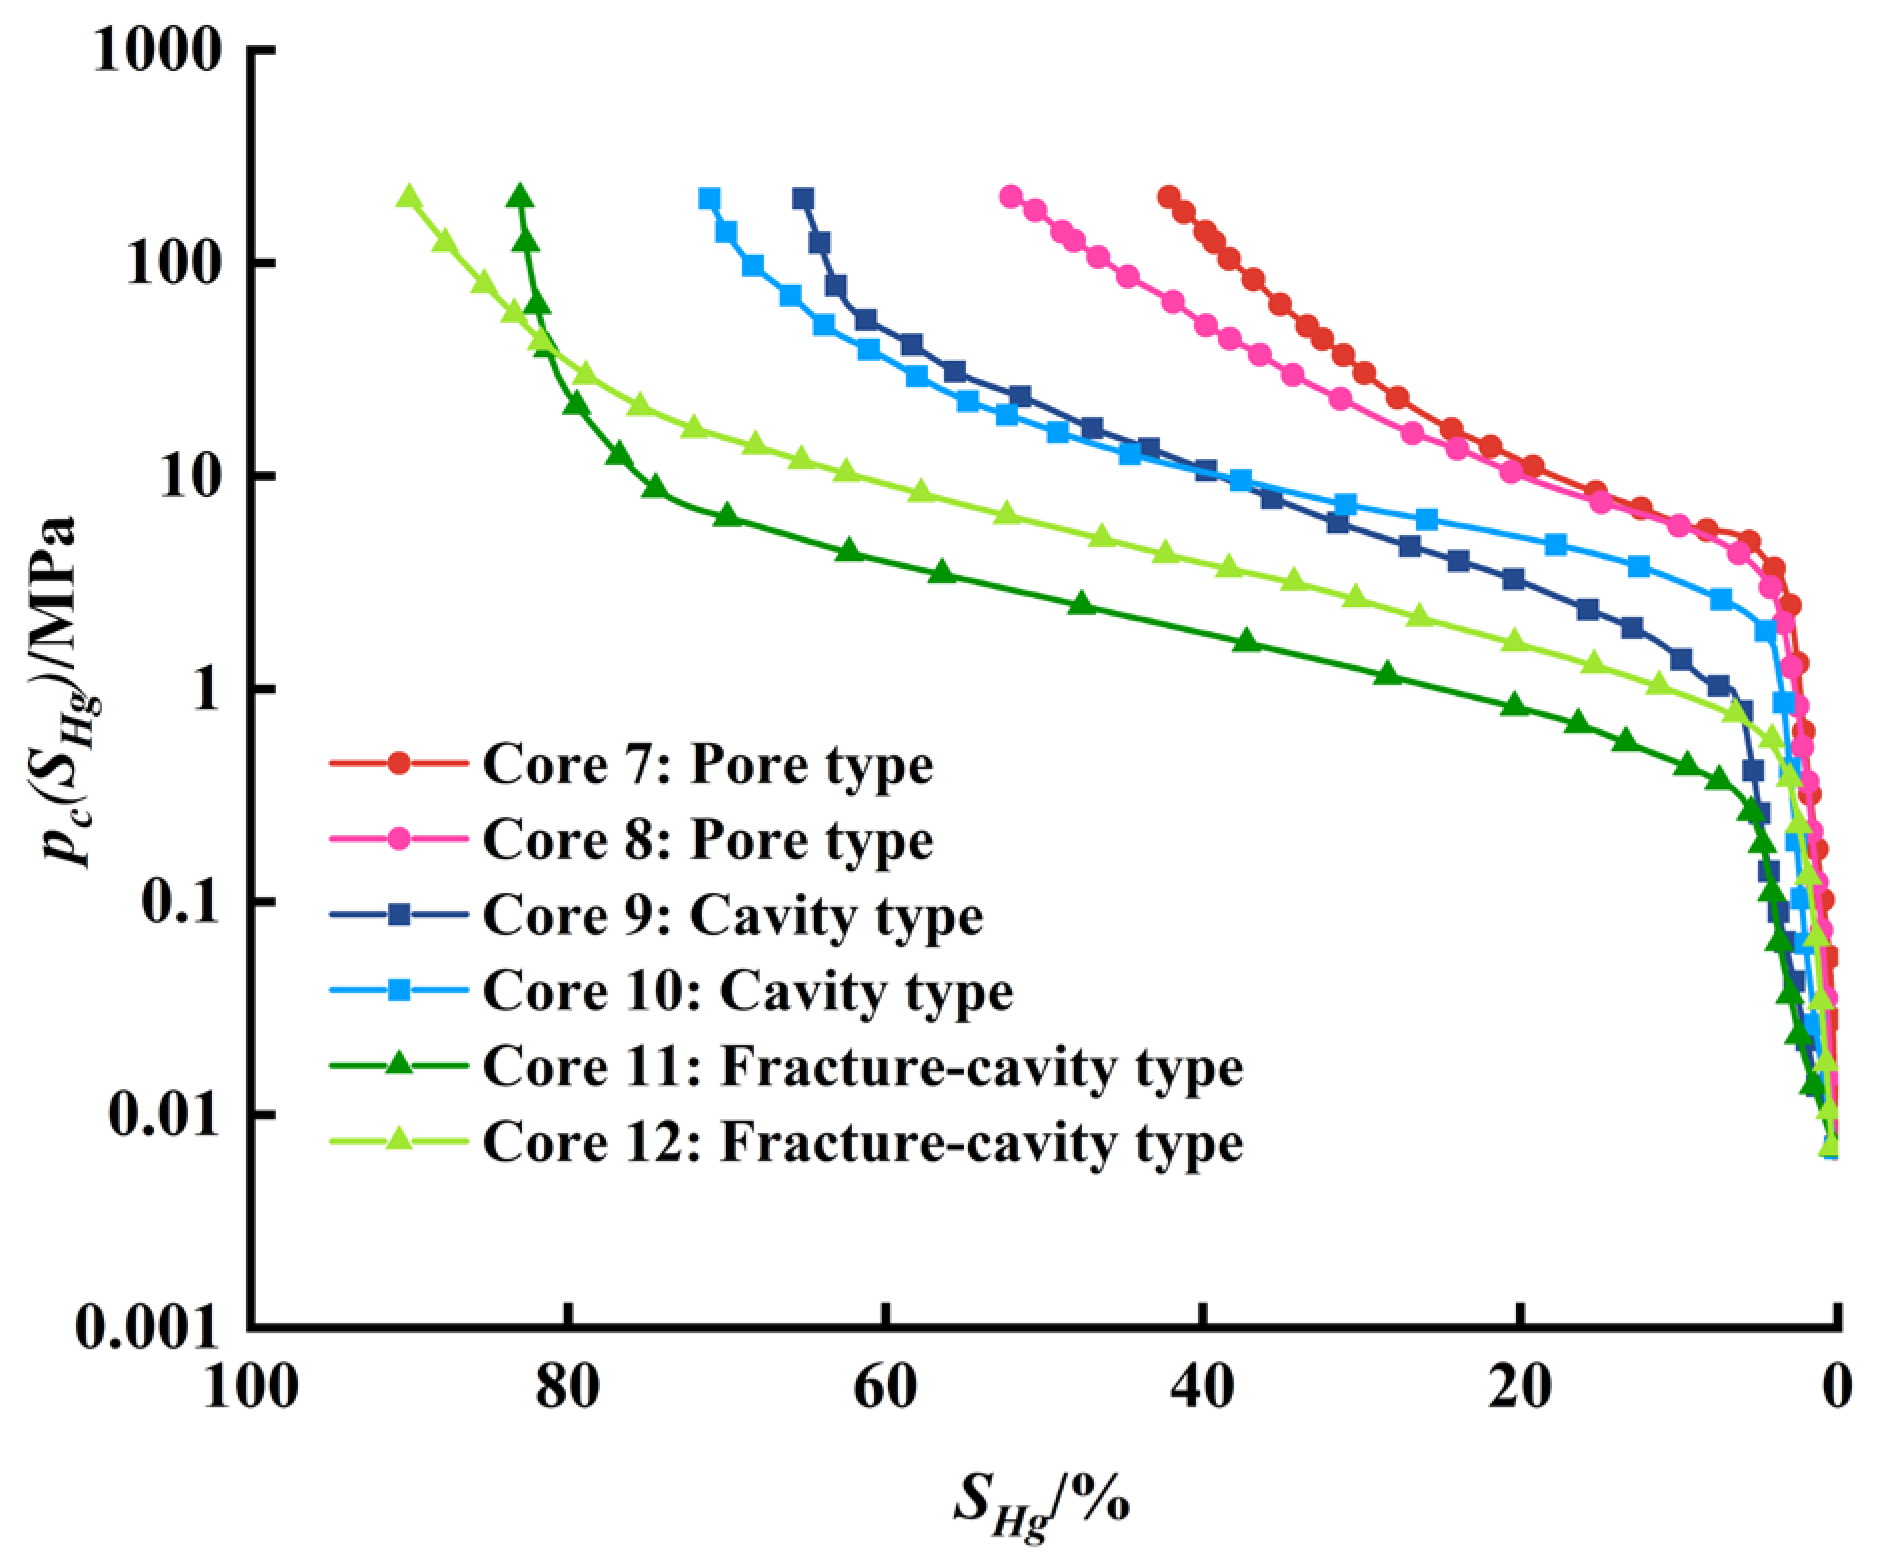
Figure 3 presents the capillary pressure curves for six core samples generated using data obtained from high-pressure mercury injection experiments. The slopes of the capillary pressure curves of samples 7 and 8 are relatively steep, with low mercury saturations of 42.13% and 52.08%, respectively, and high displacement pressures of 4.90 MPa and 4.32 MPa, respectively. This indicates that the non-wetting phase of mercury will experience great flow resistance when it first invades the porous core. As the mercury injection amount increases, the capillary pressure at the invasion front rises sharply, and the final mercury injection amount of the sample is relatively small. Therefore, it is evident that the pore-throat size of the pore-type reservoirs is small, with a narrow and skewed distribution of pore-throats, poor connectivity, and overall low seepage capacity.
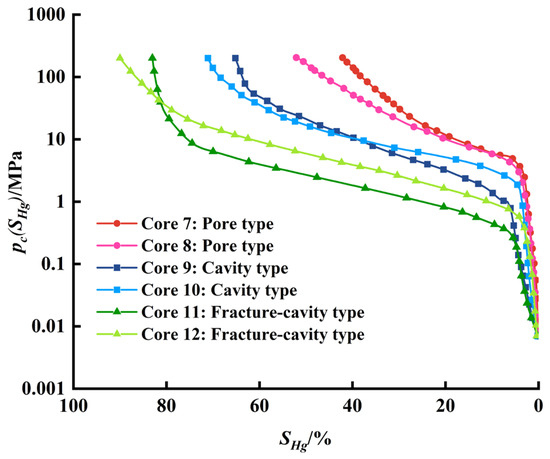
Figure 3.
Capillary pressure curve of HPMI.
In contrast to the capillary pressure curves of samples 7 and 8, the slopes of the capillary pressure curves of samples 9 and 10 are distinctly gentler, with a relatively slow plateau appearing in the middle stage of mercury intrusion. The mercury saturation of sample 9 and sample 10 is higher, at 65.18% and 71.08%, respectively, and the displacement pressure of sample 9 and sample 10 is lower, 1.04 MPa and 1.87 MPa, respectively. This shows that the pore throats of cavity-type reservoirs are relatively thick, the connectivity is better, the distribution of pore throats is slightly skewed, and the overall seepage capacity is relatively strong.
Compared to the capillary pressure curves of samples 9 and 10, the slopes of the capillary pressure curves of samples 11 and 12 are further flattened, exhibiting a wider and gentler plateau in the middle stage of mercury invasion. The mercury saturation of sample 11 and sample 12 is very high, at 83.02% and 90.01%, respectively, and the displacement pressure of sample 11 and sample 12 is very small, 0.26 MPa and 0.58 MPa, respectively. It is not difficult to see that the fractured-cavity type reservoir has large pore throats and good connectivity, the distribution of pore throats is coarse and skewed, and the overall seepage capacity is very strong.
3.2. Pore Characteristics by Pore Throat Distribution Curves of HPMI Results
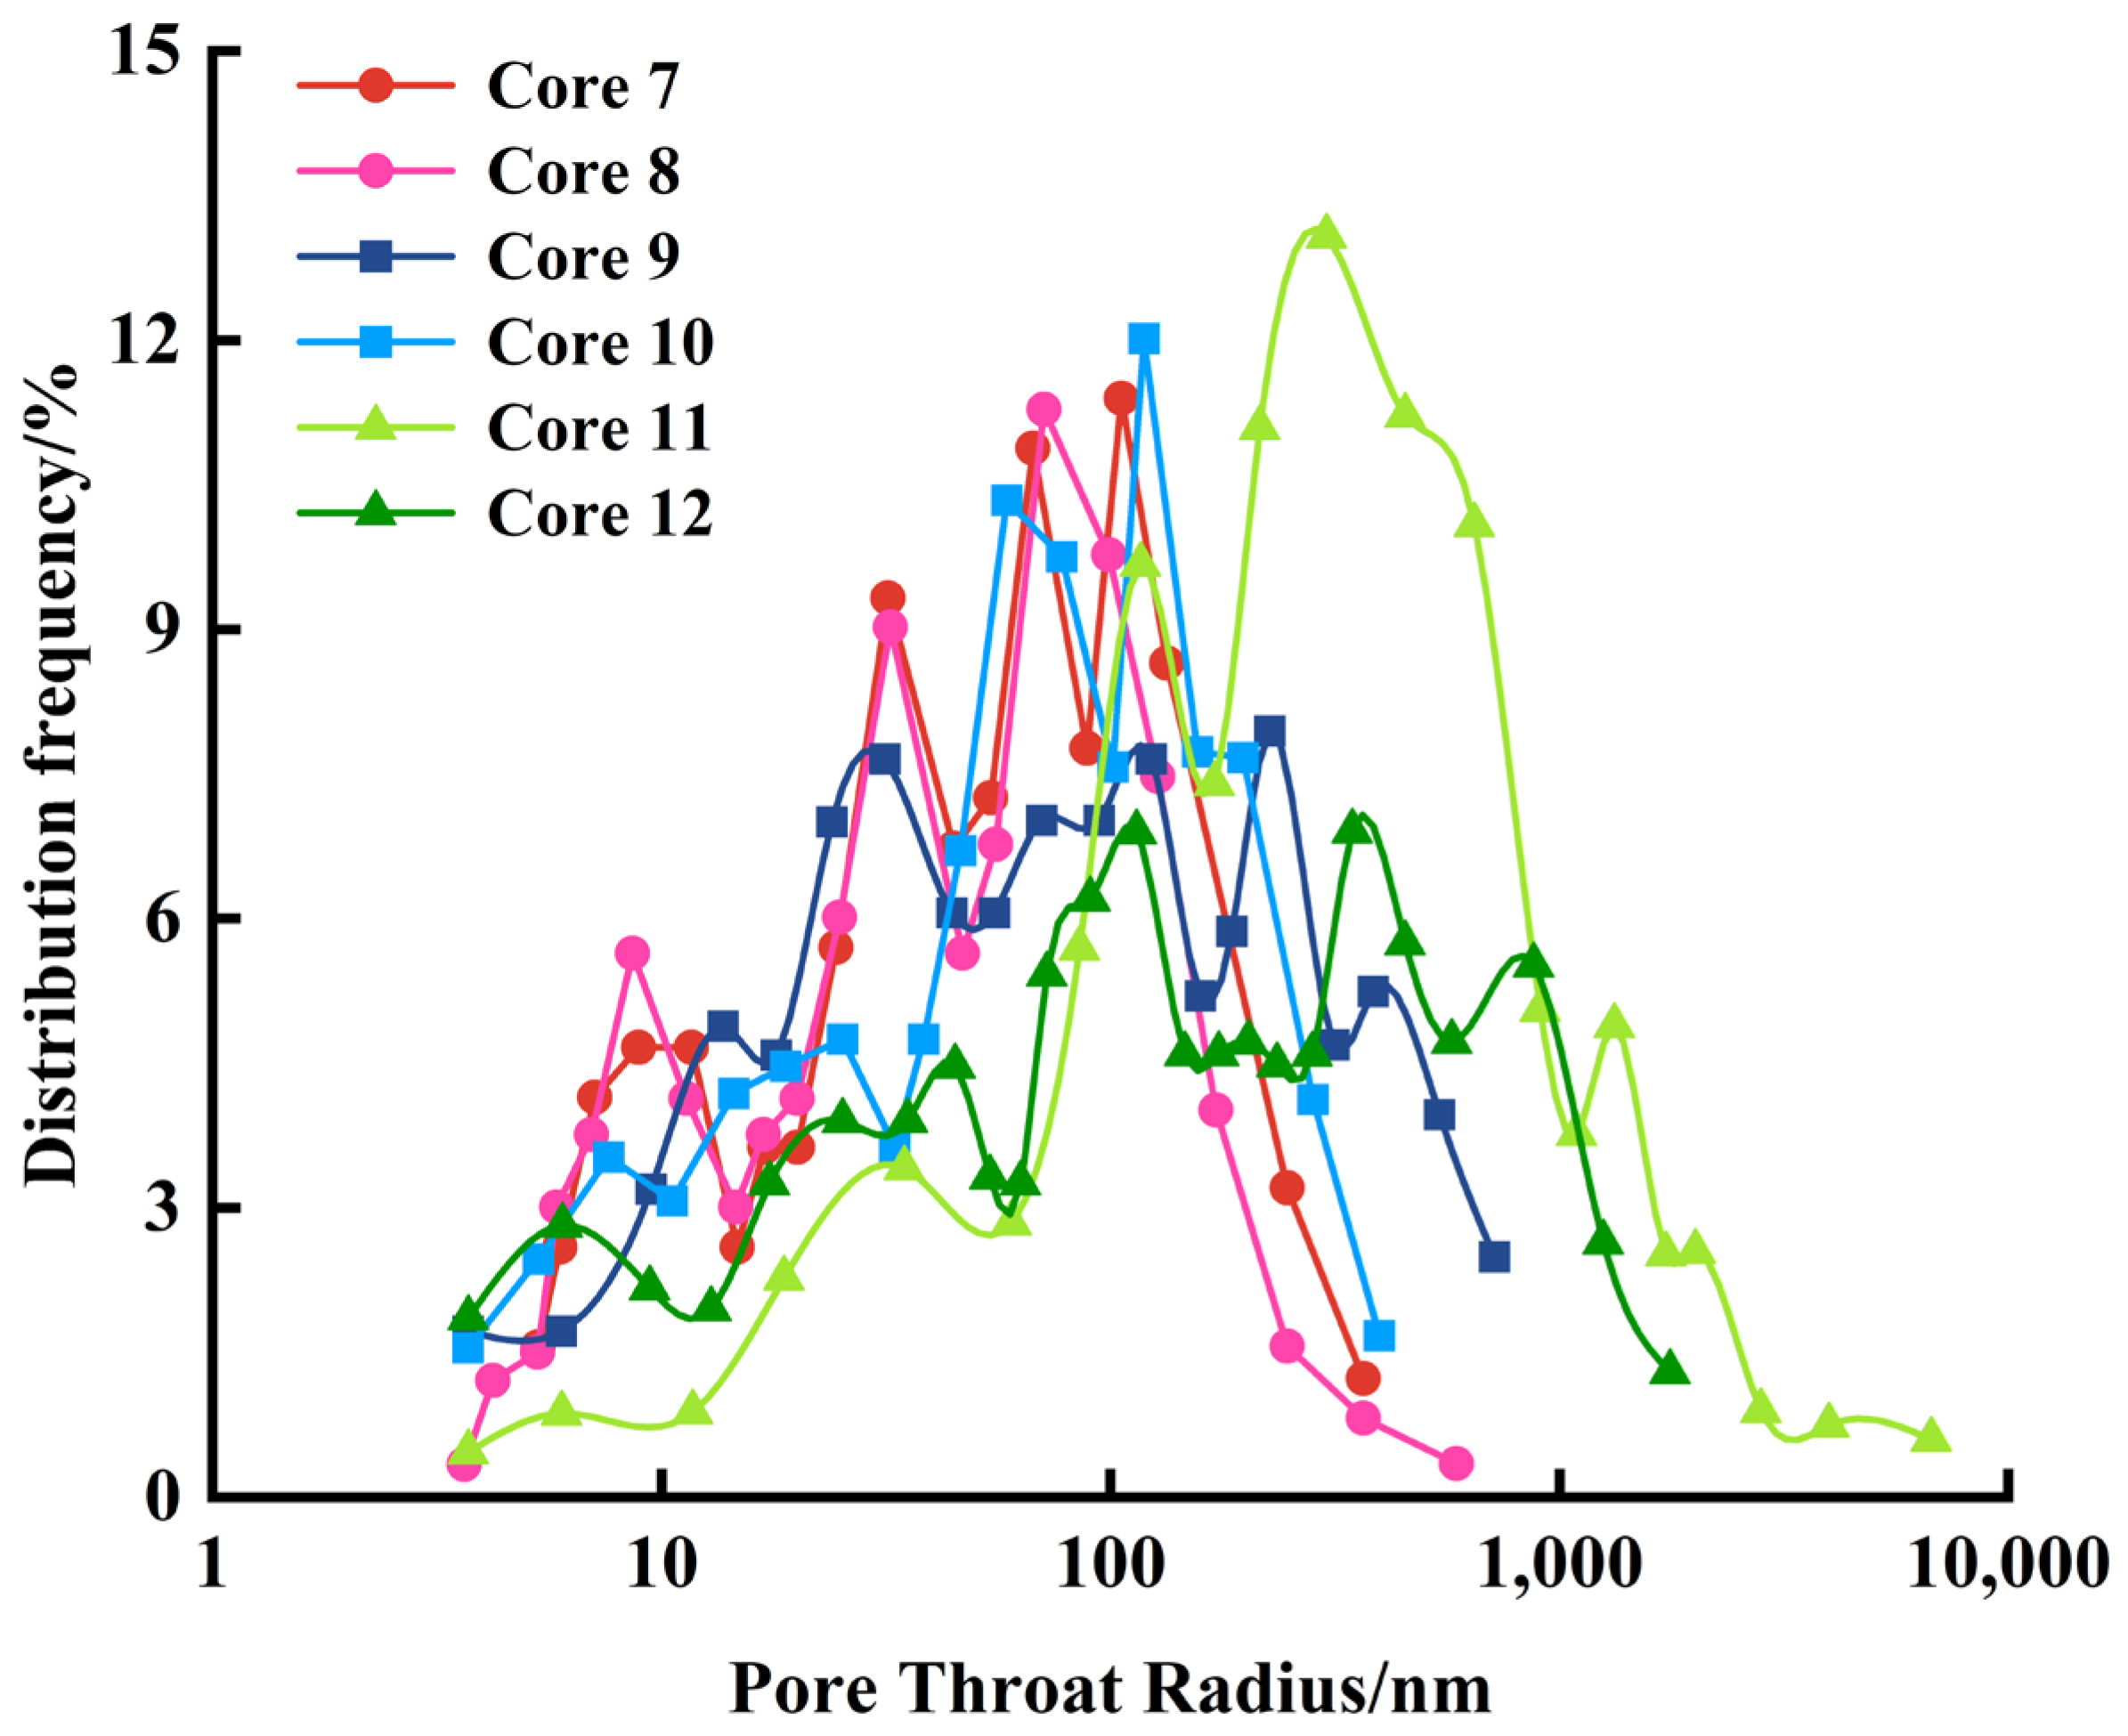
Figure 4 presents the pore-throat radius distribution curve converted from the capillary pressure curves of six core samples. The pore-throat radius distributions of sample 7 and sample 8 are multi-peaked, with the pore-throat radii corresponding to the main peaks being 105.91 nm and 71.14 nm, respectively. The pore-throat radius distribution range is primarily between 10–100 nm, and the overall level is low. The main reason for this is that the cavities and fractures in the pore-type reservoir are less developed, and the small matrix pores are the main storage and seepage medium of the pore-type reservoir. Compared with sample 7 and sample 8, the pore-throat distribution curves of sample 9 and sample 10 shifted to the right as a whole, the main peak radii were 123.43 nm and 118.89 nm, respectively, and the main distribution range of the pore-throat radius was obviously wider, between 20 and 540 nm, It shows that the large pore throats are relatively developed inside the cavity-type reservoir, which greatly improves the seepage capacity of this type of reservoir. The pore-throat radius distribution of sample 11 is unimodal; the main peak radius is 303.29 nm, and the pore-throat radius distribution range is extremely wide, mainly between 20 and 2000 nm. The pore-throat radius of sample 12 is broad-peaked, and there is no obvious main peak. However, the pore-throat radius distribution range is wide, mainly between 20 and 1200 nm. The pore-throat distribution characteristics of samples 11 and 12 show that the pore-throat radius distribution of the fracture-cavity-type reservoirs is wide, the average pore-throat is thick, and the seepage capacity is strong.
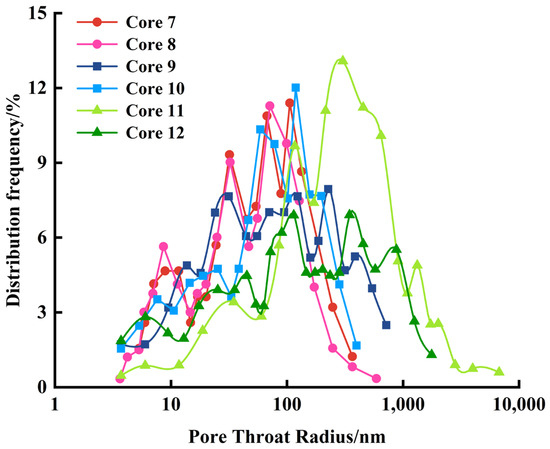
Figure 4.
Pore-throat radius distribution curve of HPMI.
3.3. Classification Criteria for HR and PR
Based on the HPMI experiments of three types of cores, it is clear that cavity-type and fracture-cavity-type reservoirs have large pore throats, good connectivity, and strong seepage capacity, which categorize them as HR. In contrast, the karst caves and fractures in the pore-type reservoir are less developed, with small pore throats, poor connectivity, and weak seepage capacity, classifying them as poor-quality reservoirs (PRs). The classification standards of HR and PR are highly consistent with field understanding, and subsequent experimental research will be based on this classification standard without distinguishing reservoir types.
4. Results and Discussion of Core Seepage Experiment
The practice results of gas reservoir development in the study area demonstrate that HRs have large pore throats and excellent seepage capacity, enabling full recovery of internal reserves during the development of gas reservoirs. In addition, during the actual development process of gas reservoirs, when gas well production is very low and has no obvious economic value, well shut-in operations are often performed. To align the experimental conclusions in this paper with the actual gas reservoir development conditions, when the ratio of the recovery factor of the HR to the theoretical recovery factor reaches 0.99 under a certain GWPPD, the timing of the well shut-in is considered. Notably, the theoretical recovery factor refers to the gas recovery rate corresponding to when the upstream pressure is reduced to equal the downstream pressure under a certain production pressure difference, which can be easily obtained using the ideal gas equation of state. The recovery rate of the reservoir when the well is shut down is regarded as the ultimate recovery rate, and the ratio of the ultimate recovery rate to the theoretical recovery rate is the reserve recovery efficiency (RRE). Furthermore, to further subdivide the dynamic gas production characteristics of HRs and PRs in different development periods, the depletion time corresponding to the ratio of the CR recovery factor to the theoretical recovery factor reaches 0.5 and 0.9, respectively, is used as the node to divide early stage, middle stage, and late stage.
4.1. Influence of Well Deployment Mode on Gas Production Characteristics of CR
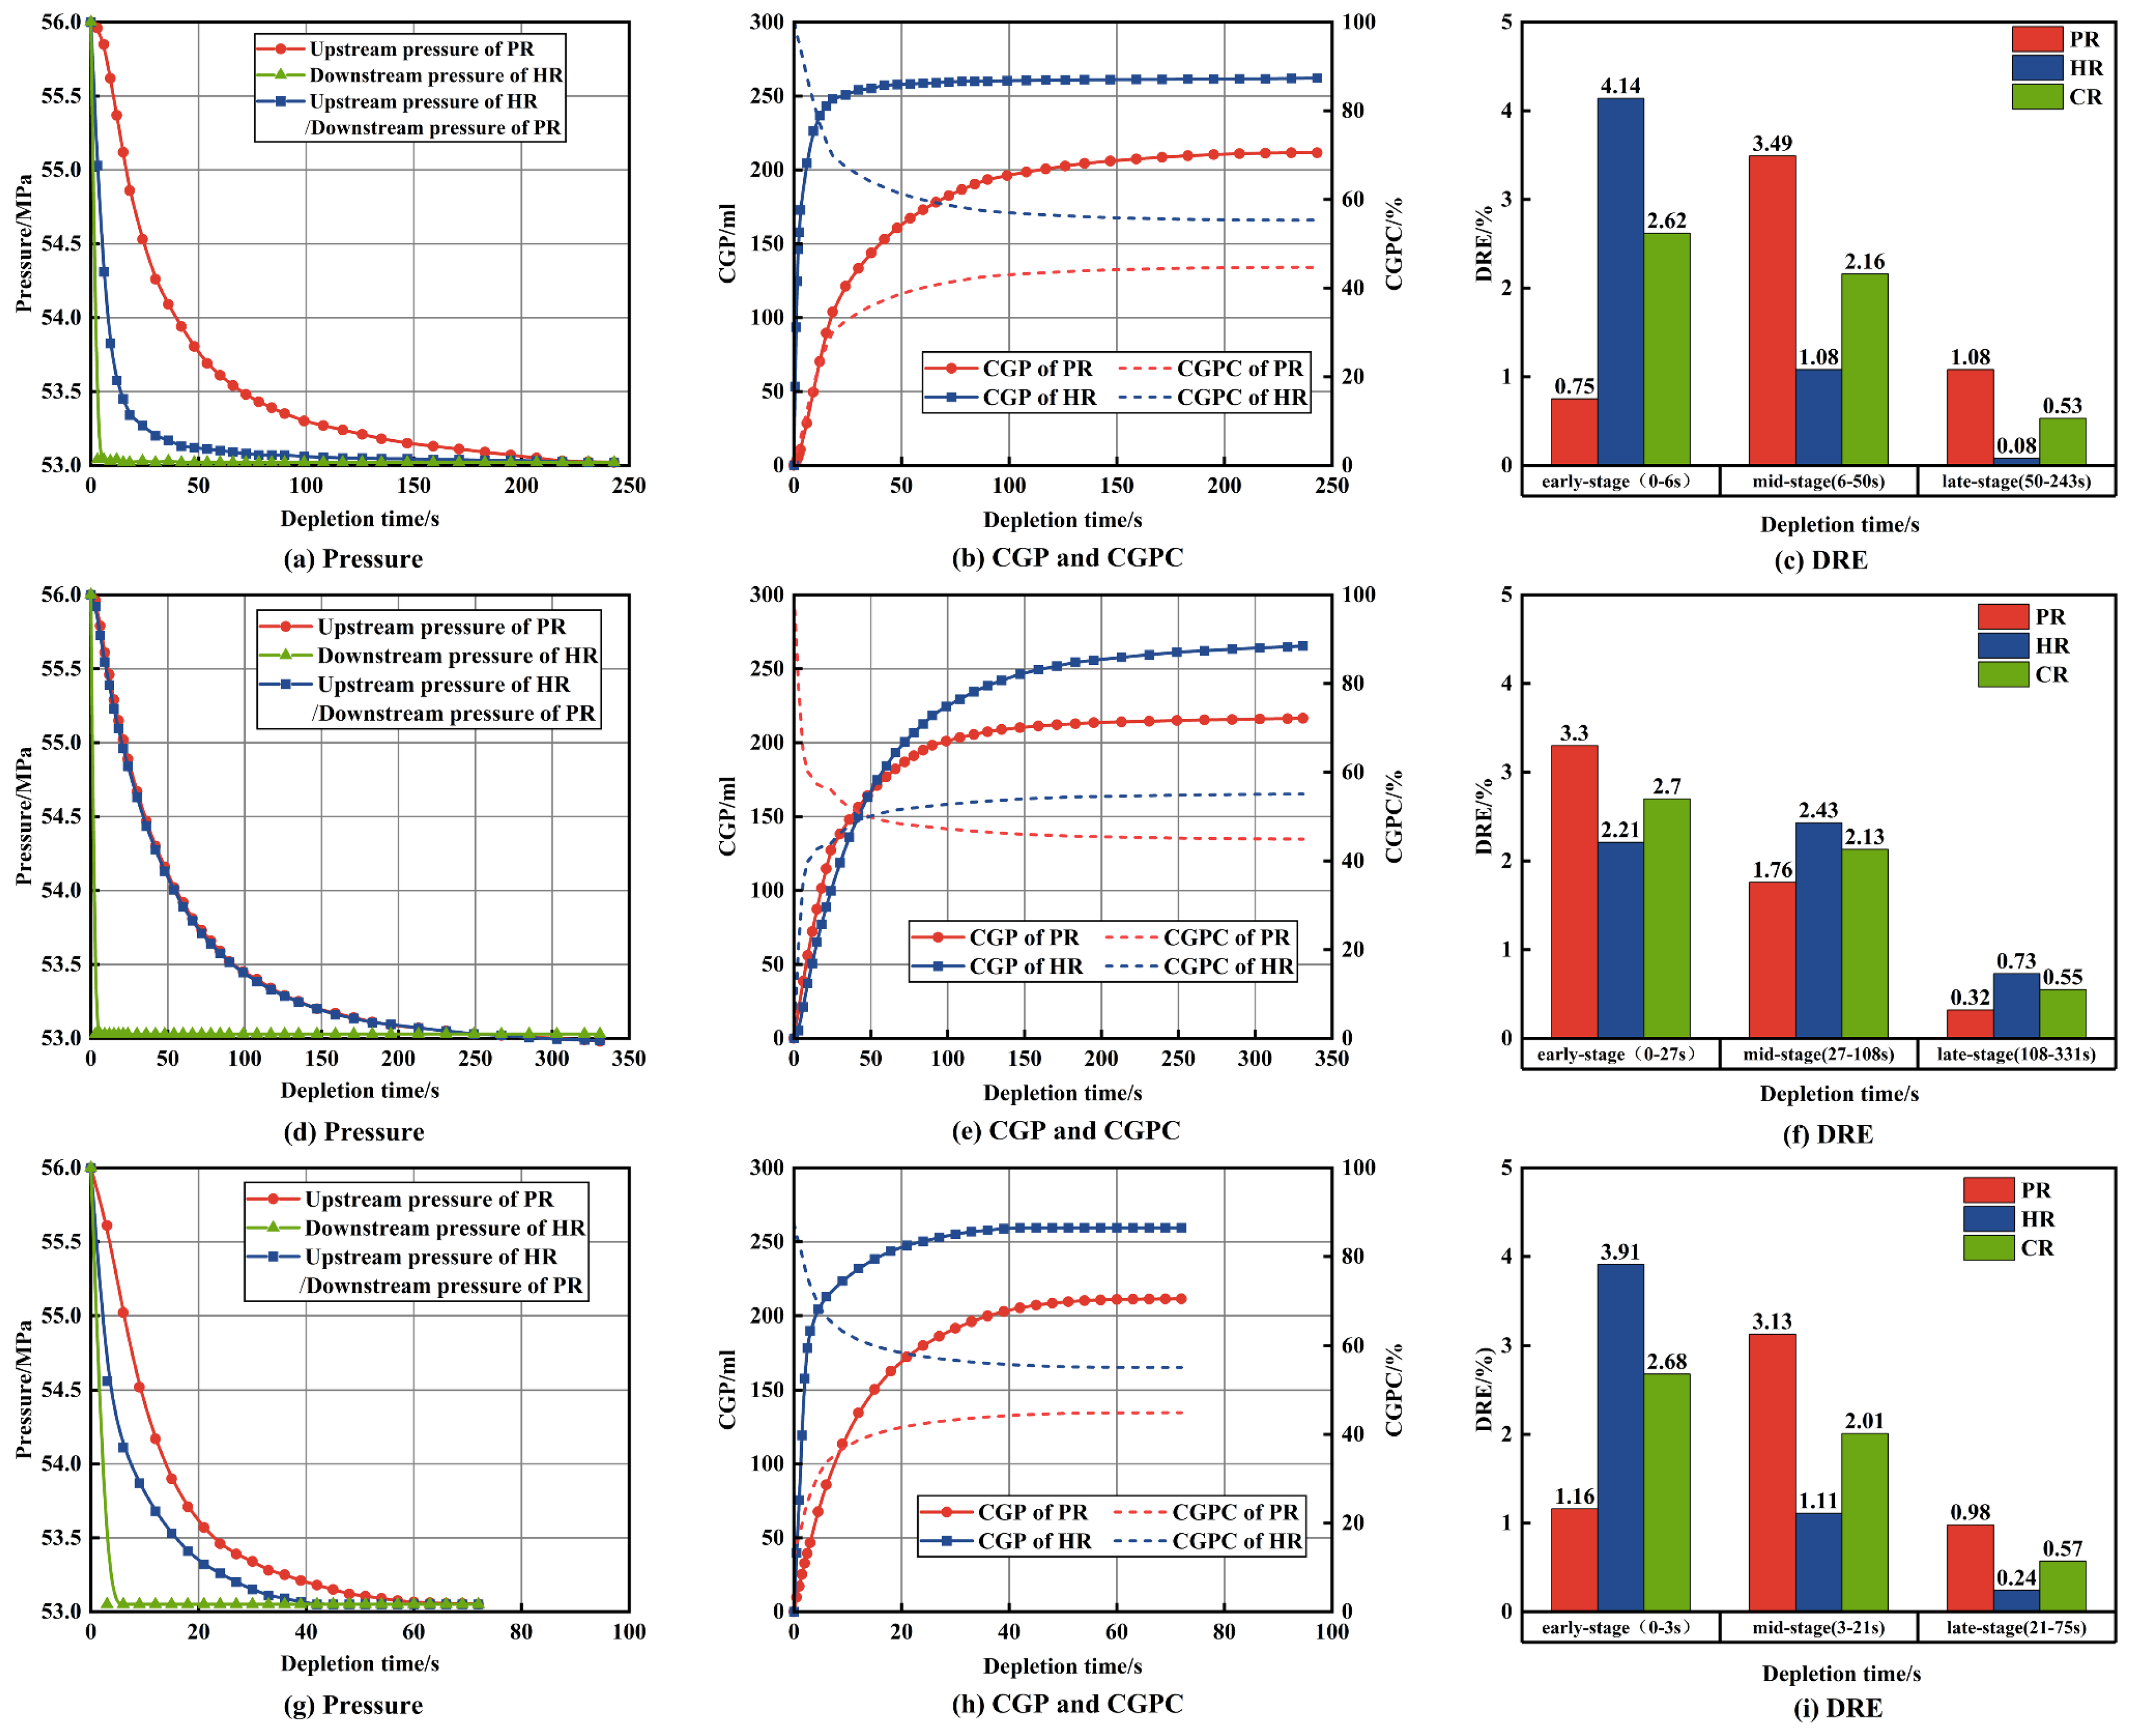
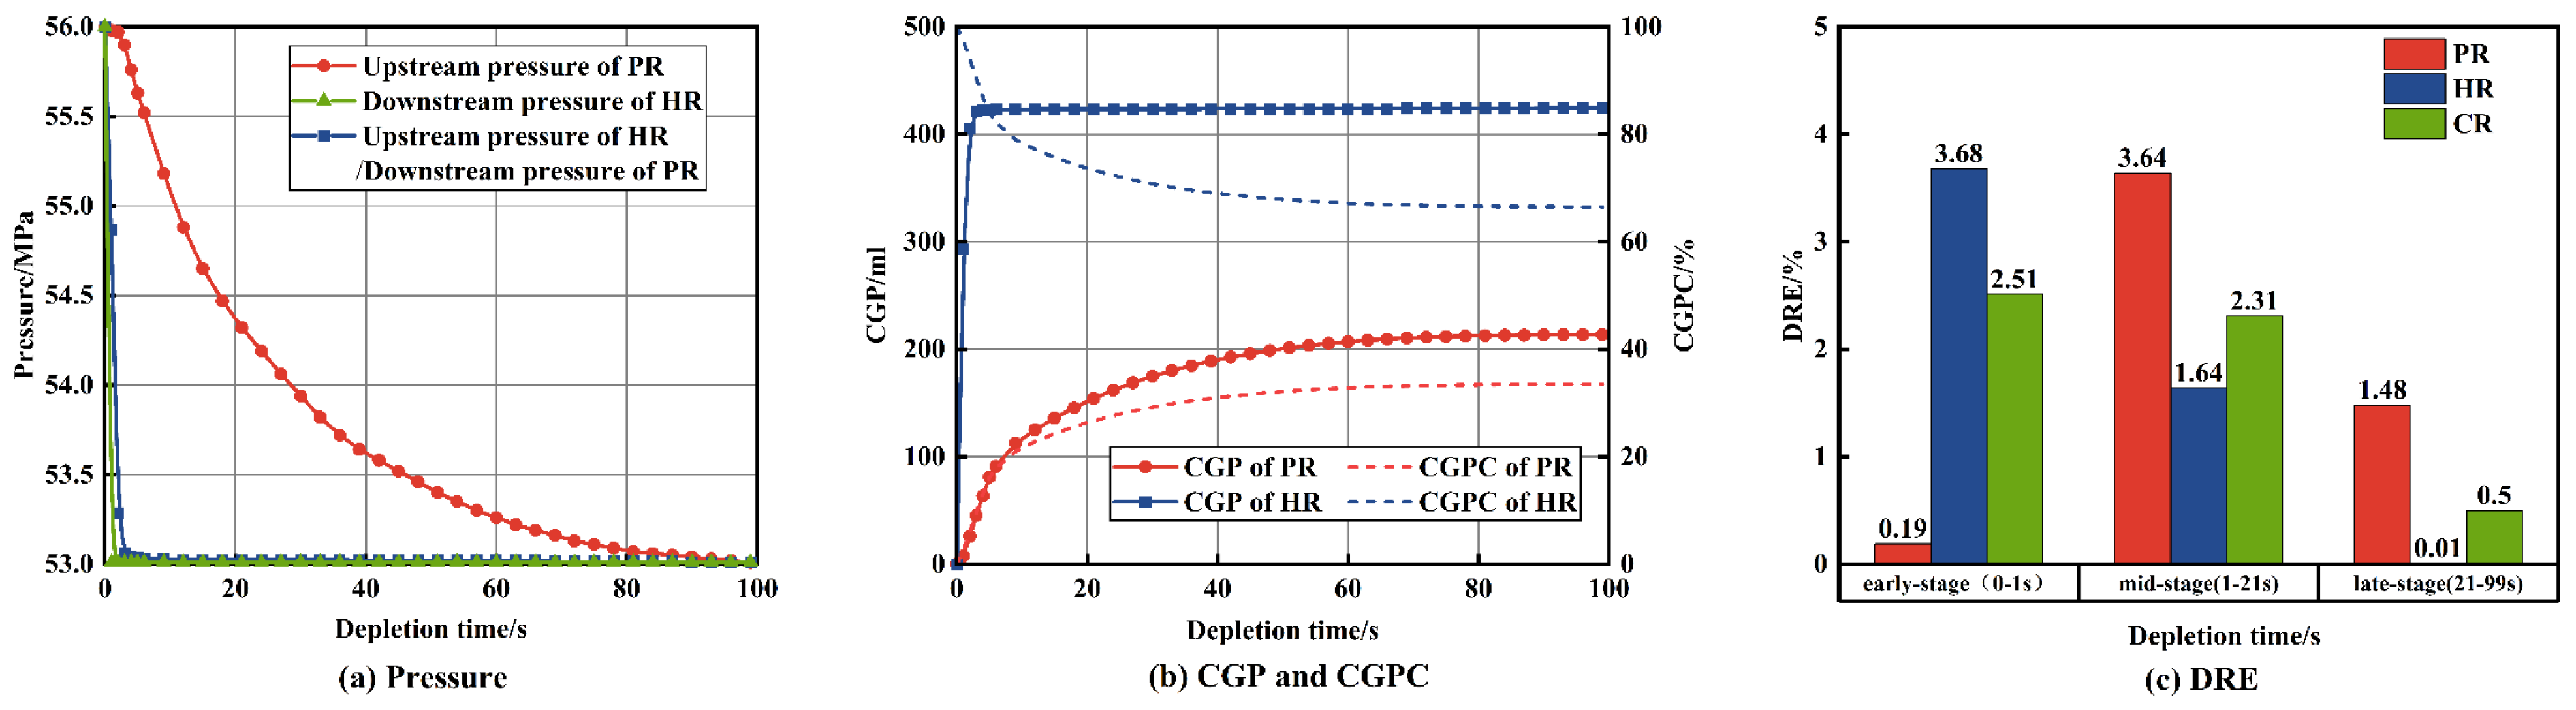
Figure 5 presents the physical simulation experiment results of CR depletion development under different well location deployment modes. It is evident that the parameters, including reservoir pressure, cumulative gas production (CGP), cumulative gas production contribution (CGPC), and reserve recovery degree (DRE), exhibit distinct changes at different development stages for both HR and PR. In the following section, the characteristics of depleted gas production of gas reservoirs under the three types of well location deployment modes are analyzed in detail, and the best well location deployment mode is optimized.
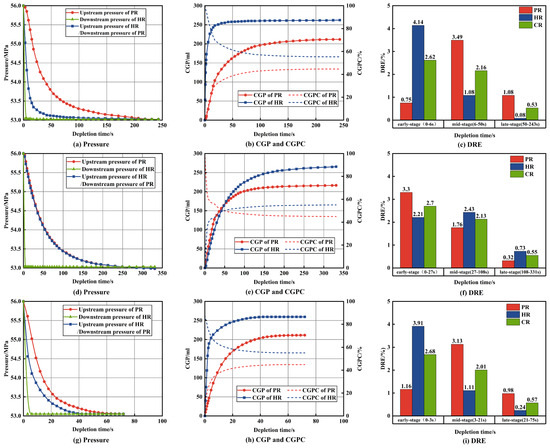
Figure 5.
(a–c) Experimental results of gas well depletion development in HRs. (d–f) Experimental results of gas well depletion development in PR. (g–i) Experimental results of gas well depletion development at the interface between HRs and PRs.
When gas wells are located on HRs, during the early stage of development (0–6 s), the pressure of the HR drops sharply, whereas the pressure change of the PR lags behind. At this stage, the DRE of the HR reaches 4.14%, and the CGPC is approximately 90%, indicating that the HR is the primary gas-producing layer. During the middle development stage (6–54 s), the pressure drop of the HR slows down, and the gas supply capacity and CGPC gradually decrease. In contrast, the pressure of the PR remains relatively high, and the gas production rate decreases slowly. The DRE of the PR increased from 0.75% to 3.49%, and the CGPC increased from 12.78% to 39.76%, suggesting that the PR becomes the primary gas-producing layer. In the late development stage (54–243 s), the pressure drop of the PR slows down significantly, and the pressure of the HR is close to the bottom hole pressure. At this stage, gas is only supplied by the PR, which lasts for a long time, and the output is very low, which has no economic value.
When gas wells are located on PRs, the pressure decline of both the HR and PR is relatively gentle throughout the entire development process. Specifically, the pressure drop lasts for 27 s and 81 s during the early and middle stages of development, respectively. Characterized by a low gas production rate and prolonged production time, this scenario is distinct from the previous one. Notably, the pressure of the HR is nearly identical to the upstream pressure of the PR, and the two types of reservoirs exhibit similar performances in terms of CGP, CGPC, and DRE.
When gas wells are located at the interface between the HR and PR, the development process can be divided into three stages. During the early development stage (0–3 s), the pressure of the HR drops sharply, while the pressure of the PR decreases gradually. At this stage, the DRE of the HR is 3.91%, and the CGPC is approximately 80%, indicating that the HR is the primary gas-producing layer. In the middle development stage (3–21 s), the pressure drop of the HR slows down, and the pressure drop of the PR slows down slightly. The DRE of the PR increases from 1.16% to 3.13%, and the CGPC increases from 19.45% to 41.05%, making the PR the primary gas-producing layer at this stage. In the late development stage (21–75 s), the pressure drop of both the HR and PR slows down significantly, approaching the bottom hole pressure. This stage lasts the longest, but the production is extremely low, rendering it economically unviable.
Comparing this type of well location deployment mode with the well location deployment on HR, it is found that the variation laws of parameters such as pressure, CGP, and CGPC of PR in each development stage under the two types of well location deployment modes are very similar, indicating that the production rules of the PR under the two types of well location deployment patterns are roughly the same. The difference is that if the wells are deployed on HRs, the contact area between gas wells and HR will be larger, the production of gas wells will be higher, and the overall development effect of gas reservoirs will be better.
Under different well deployment modes, gas wells exhibit distinct gas production characteristics. Considering the depletion time of the gas reservoir and DRE, deploying wells on HR for depletion-type development fully utilizes the high-speed permeability of the HR and the dynamic replenishment effect of the PR, which represents the optimal well deployment pattern. This approach ensures high initial production and stable production in the mid-term for gas wells while also considering the development of reserves in PR.
4.2. Influence of PRHPR on Gas Production Characteristics of CR
Under different PRHPR, the changing patterns of parameters such as pressure of HR and PR, CGP, and CGPC are roughly consistent with those shown in Figure 5a–c. However, there are some differences in the rate of change. Specifically, when the PRHPR reaches 192.12 (see Figure 6), the pressure of HR drops sharply immediately after well opening, whereas the pressure changes of PRs lag behind and occurs at a slower rate. After 1 s of depletion mining, the DRE of the PR is only 0.19%, and a large number of PRs have not been recovered in time.
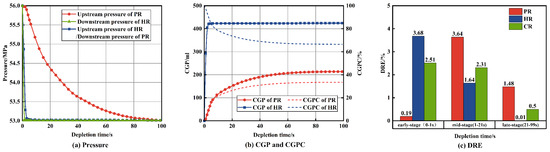
Figure 6.
Experimental results of CR (water saturation of 10%, PRHPR of 192.12, and GWPPD of 3 MPa).
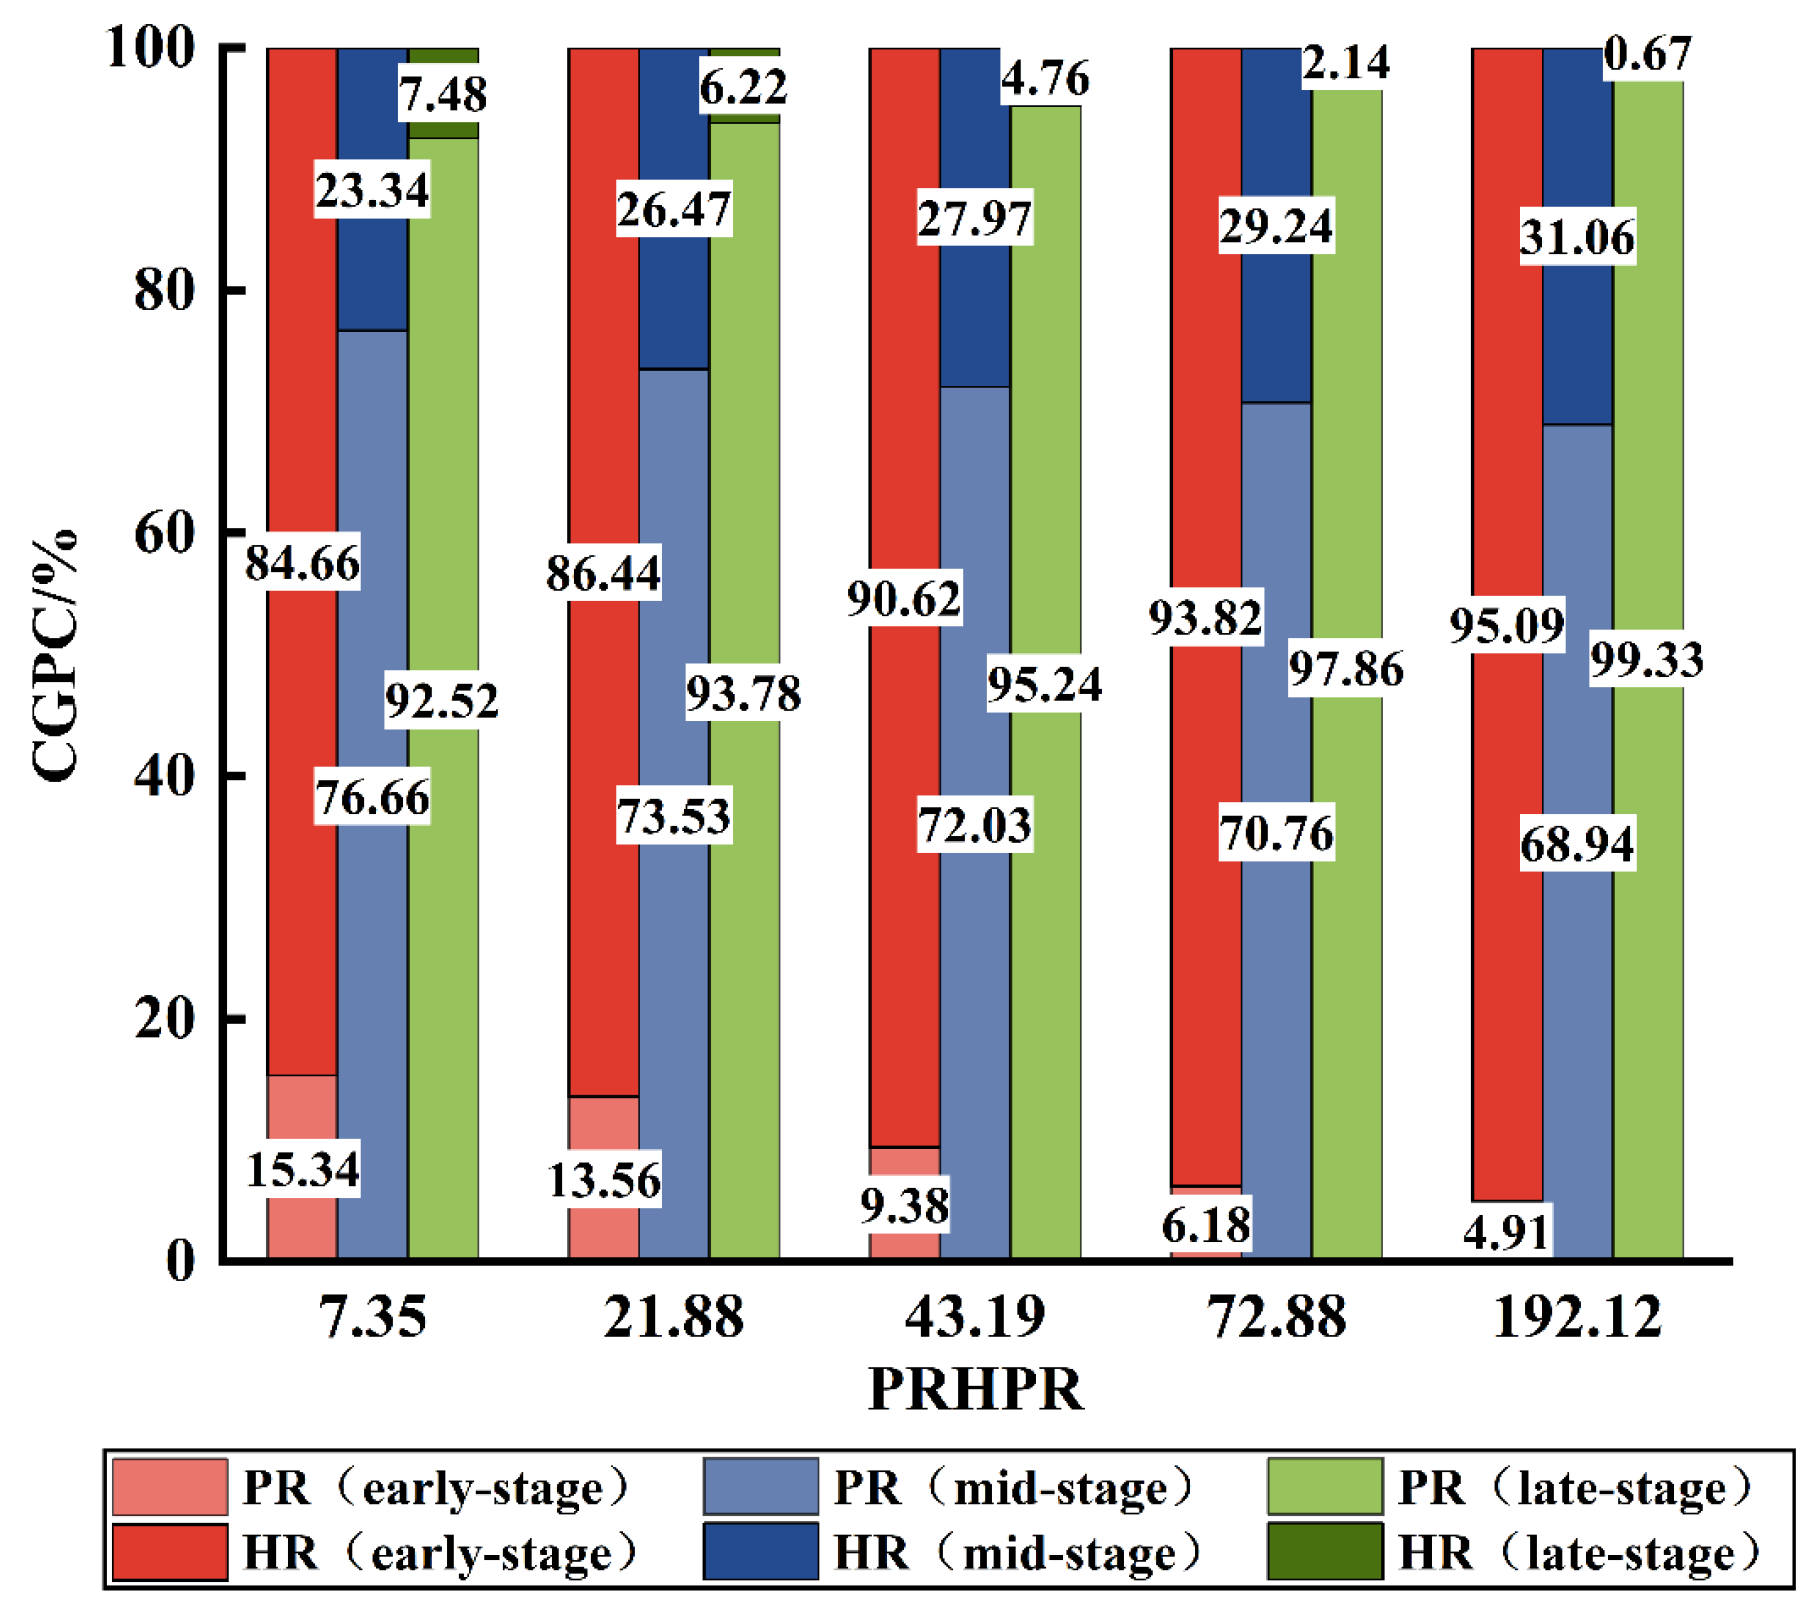
Figure 7 illustrates the changes in CGPC of HRs and PRs under different PRHPR. HRs are mainly concentrated in the early-stage and mid-stage gas production. The CGPC of HRs exceeds 80% during the early development period, remains above 20% during the mid-development period, and drops to less than 8% during the later development period, indicating that the HR is the primary production layer during the early development period. As the PRHPR increases, the difference in gas production capacity between the two types of reservoirs becomes more pronounced. Furthermore, the faster the gas production rate of HR, the higher the CGPC in the early and middle periods of development. The gap between the rate of gas supply from the PR to the HR and the rate of gas production inside the HR is also greater.

Figure 7.
Under different PRHPRs, the change law of CGPC of HRs and PRs in different development periods.
Figure 8 illustrates the variation of the ultimate recovery factor and ultimate depletion time of reservoirs under different PRHPR. If the PRHPR is too small, the gas production rate of the gas well will be too low, resulting in a prolonged well opening time and negligible short-term economic benefits. On the other hand, if the PRHPR is too large, it will lead to an excessively high gas production rate, a shortened gas production time, a low ultimate recovery rate of PRs, and long-term economic decline. Only when the PRHPR is within a reasonable range (21.88–43.19) can both a reasonable gas production rate and a high ultimate recovery of PRs be guaranteed.
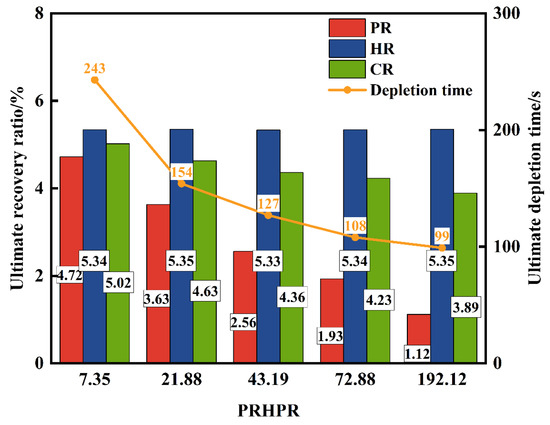
Figure 8.
The ultimate recovery and depletion time of reservoirs varies under different PRHPRs.
4.3. Influence of GWPPD on Gas Production Characteristics of CR
Figure 9 illustrates the REE of HR and PR under different GWPPDs. It is evident that the ultimate recovery of HRs increases gradually with the increase of GWPPDs, while the REE of HRs remains basically unchanged, indicating that HRs can achieve good development results under GWPPD. In contrast, the ultimate recovery of the PR increases gradually with the increase in GWPPD, while the REE of the PR shows a trend of first increasing and then decreasing with the increase in GWPPD, reaching the maximum value (86.79%) at 3 MPa. This phenomenon can be attributed to the complex pore-throat structure of tight reservoirs, which tends to induce low-velocity non-Darcy flow under low-pressure gradients, resulting in weak seepage capacity [28,29,30]. When the GWPPD is low (1 MPa), most of the gas in the pore space of PRs is in a low-velocity non-Darcy flow state, leading to weak overall seepage capacity and limited replenishment effect on HRs. Conversely, when the GWPPD is high (7 MPa), the high permeability of the HR enables rapid gas production, but the PR, despite continuously supplying gas supply to the HR, is constrained by its inferior fluid flow capacity, resulting in a limited supply rate. Consequently, a substantial amount of gas in the PR remains unproduced upon well closure. Considering the gas production rate of the gas well and the ultimate recovery factor of the reservoir, the GWPPD of 3 MPa is the optimal production differential pressure.

Figure 9.
The ultimate recovery ratio and RRE of different reservoirs under different GWPPDs.
4.4. Influence of Water Saturation on Gas Production Characteristics of CR
Figure 10 presents the results of the depletion development experiment when the water saturation of the reservoir reaches 50%. During the early development stage (0–15 s), the pressure of HRs initially lags briefly before dropping rapidly, accompanied by a brief period of high gas production. Subsequently, formation water begins to be continuously produced, leading to a sharp decline in the gas production rate. In contrast, the pressure drop of the PR is minimal, and its gas production capacity is weak. Notably, the DRE of the PR in this stage is only 0.05%, and the CGPC of the PR is merely 1.48%. In the middle development stage (15–75 s), the pressure drop of the HR slows down, and the gas production capacity continues to decline. Meanwhile, the pressure of the PR decreased slightly, and its gas production capacity increased. During this stage, the DRE of the PR increased from 0.05% to 0.75%, and the CGPC increased from 1.48% to 13.63%. In the late stage of development (75–126 s), the pressure drop of the two types of reservoirs is weak, and only the PRs produce gas with a small gas volume, which has no economic value.
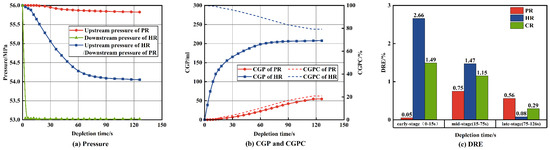
Figure 10.
Experimental results of CR (water saturation of 50%, PRHPR of 7.35, and GWPPD of 3 MPa).
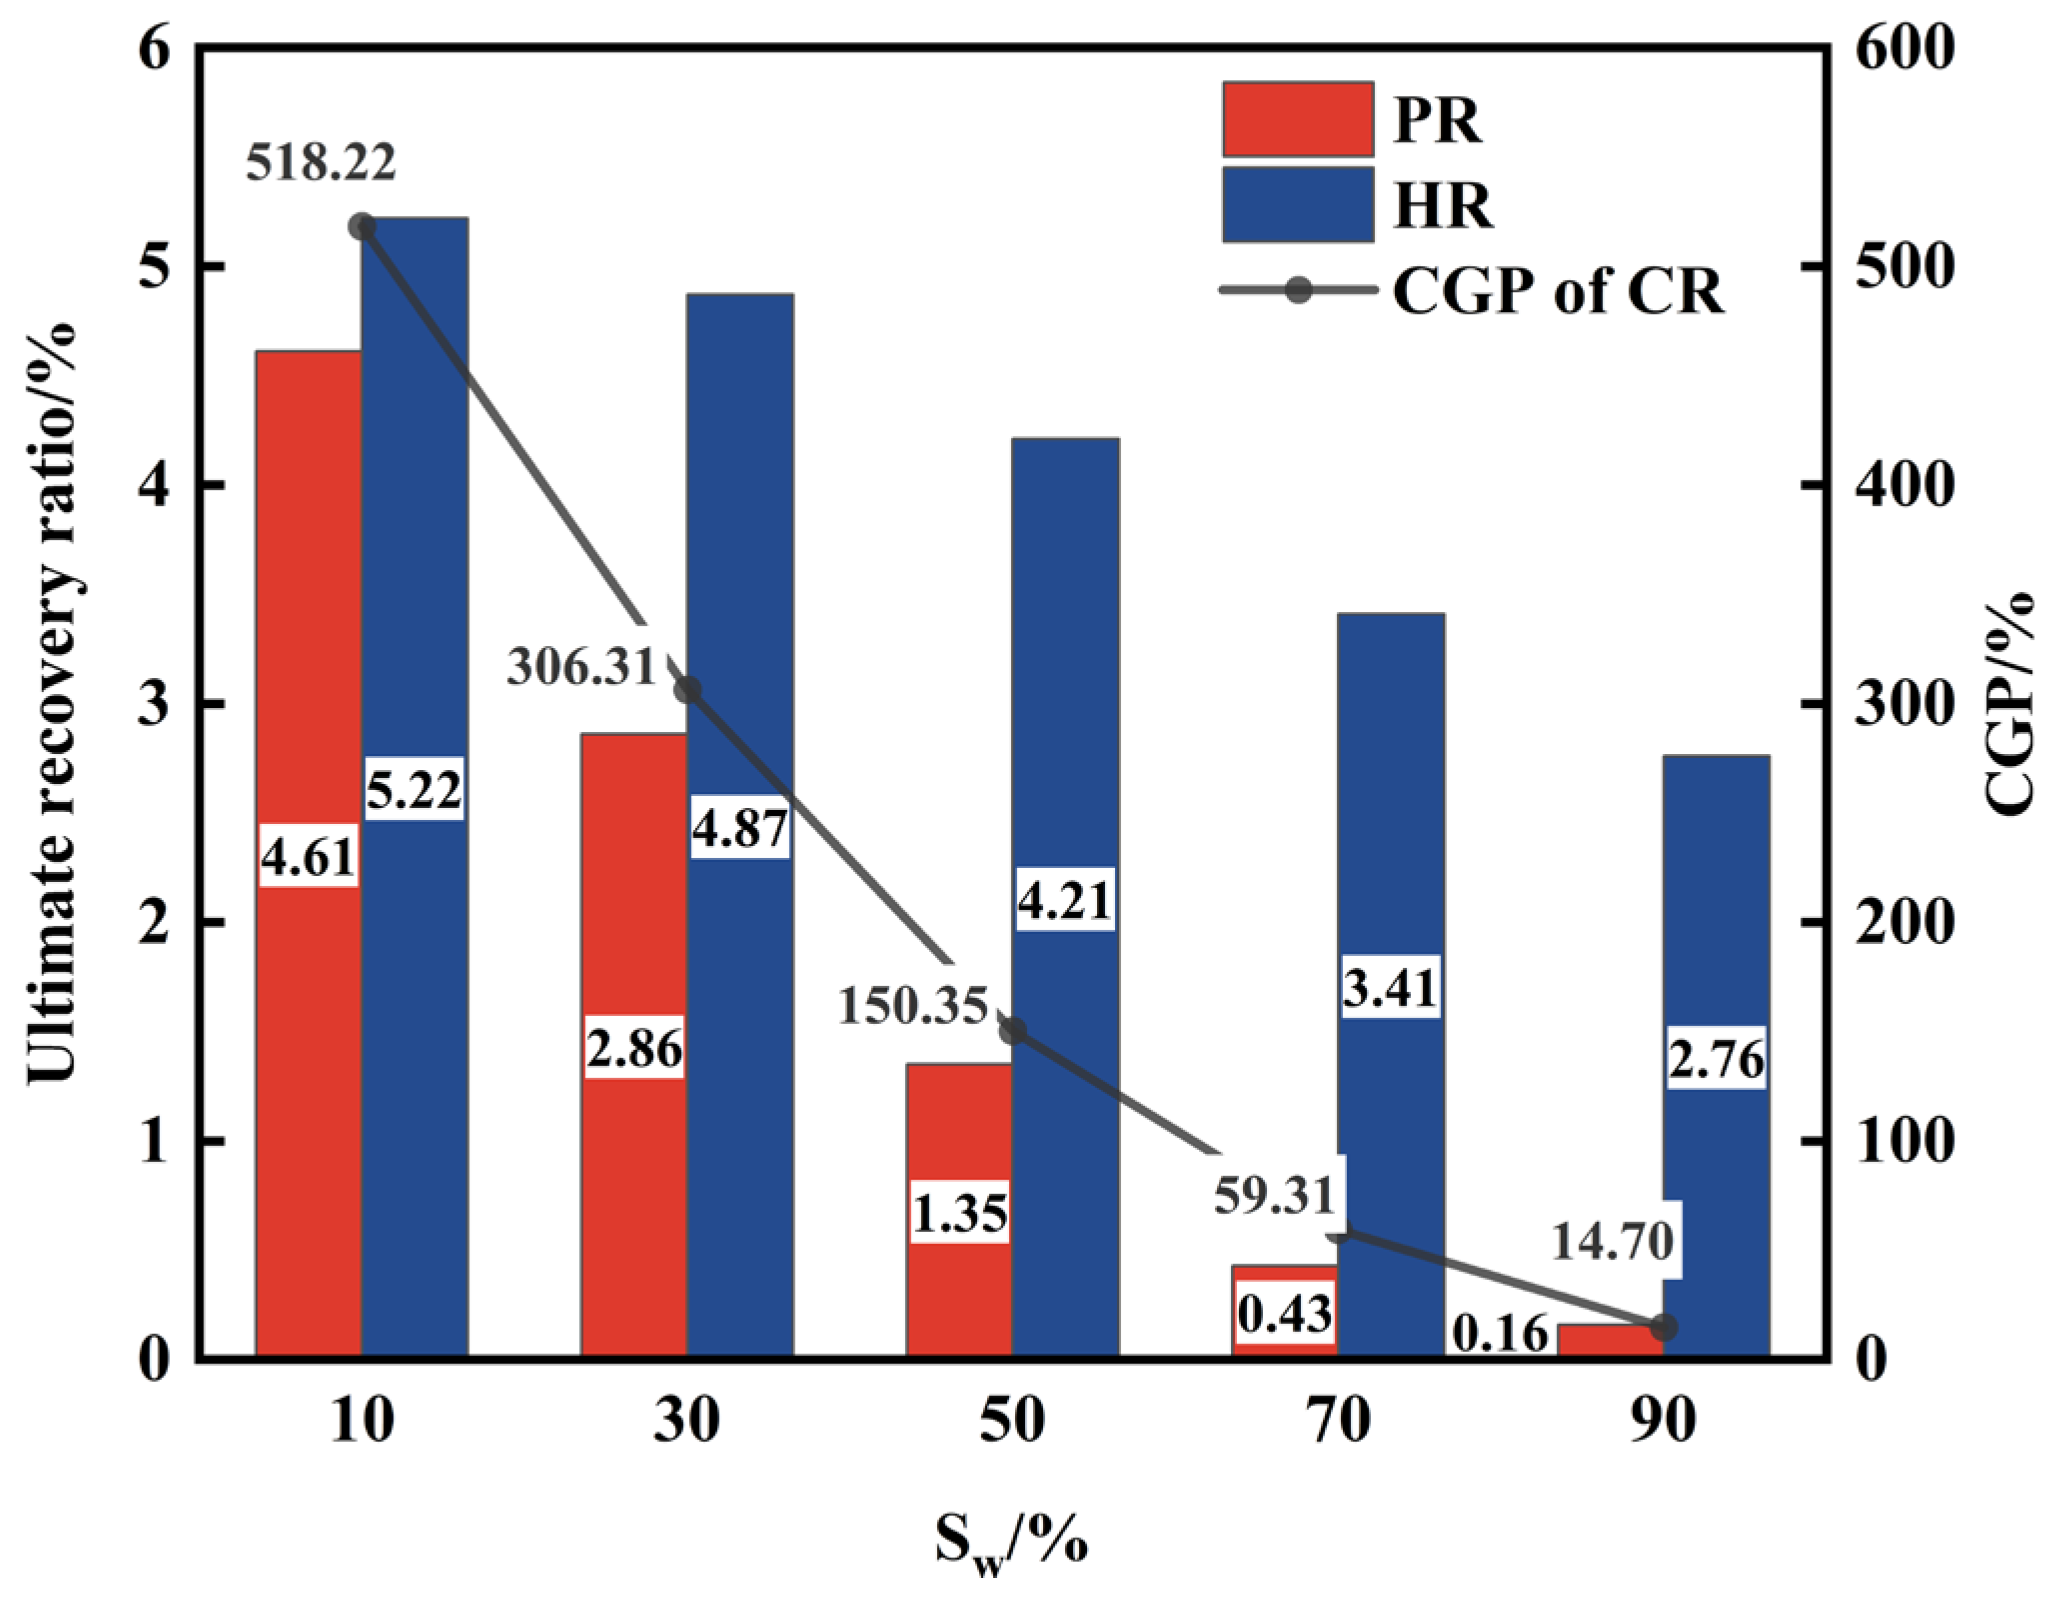
The increase in reservoir water saturation significantly reduces gas well production and DRE of the reservoir, and this adverse effect gradually intensifies with the increase in water saturation (see Figure 11). Formation water tends to form a water film on the porous medium wall, blocking the throat and filling microcapillaries under capillary self-priming, resulting in a decrease in seepage capacity of large pore throats, loss of seepage capacity of small pore throats, and part of the gas volume is blocked and cannot be recovered [31,32,33]. HR, with their large pore throats and good connectivity, are relatively less affected by formation water. In contrast, PR, with their small pore throats and poor connectivity, are more severely impacted by formation water. Under high water saturation, PRs essentially lose their gas production capacity, and most of their reserves cannot be produced. Therefore, for gas reservoirs with active edge and bottom water or high original water saturation, the identification of gas–water layers inside the reservoir should be strengthened, the dynamic changes of the gas–water interface should be monitored, the GWPPD should be selected reasonably, and effective water control and water shutoff measures should be taken. This is of great significance for gas wells to maintain a longer water-free gas production period and a higher cumulative gas production.

Figure 11.
Ultimate recovery ratio and CGP of different reservoirs at different water saturation. (Gas wells located on HR, PRHPR of 7.35, and GWPPD of 3 MPa).
5. Conclusions
This paper classifies the deep carbonate gas reservoirs based on the HPMI results of cores. By modulating the differential pressure of the depletion experiment and the connection method, permeability, and water saturation of the composite core, the effects of well location deployment, PRHPR, GWPPD, and water saturation on the depletion gas production characteristics of the composite reservoir were studied. However, the lack of on-site production data from gas reservoirs to validate the experimental conclusions obtained necessitates further verification to strengthen the accuracy of the research conclusions presented in this article. In addition, there are various composite methods for deep carbonate gas reservoirs, and limited experiments may not fully encompass all composite types. Nevertheless, combining numerical simulation methods may achieve more comprehensive research results.
This study mainly draws the following conclusions:
- (1)
- Different types of reservoirs of the fourth member of the Dengying Formation in the Anyue gas field have unique microscopic pore structure characteristics: pore-type reservoirs have small pore-throats, poor connectivity, and are PRs; cavity-type and fracture-cavity-type reservoirs have large pore throats and good connectivity, which are HRs.
- (2)
- The gas production characteristics of gas wells are significantly different under different well location deployment modes. When gas wells are deployed on HRs, the gas production rate is fast, and the ultimate recovery rate of the reservoirs is high.
- (3)
- If the PRHPR is too small or too large, it will cause inconsistency between the recharge capacity of the PR and the high permeability of the HR, which is not conducive to the beneficial development of gas reservoirs.
- (4)
- Under the GWPPD of 3 MPa, the effect of “dynamic recharge” between the HR and PR is the best, and the ultimate recovery of the PR is the highest.
- (5)
- The seepage capacity of the reservoir is greatly affected by the formation of water. Some reserves of HRs and most of the reserves of PRs are sealed inside the reservoir under high water saturation and cannot be recovered.
Author Contributions
Conceptualization, Y.L.; methodology, Q.Q.; software, A.Z.; validation, F.Y.; data curation, M.L.; writing—original draft, Y.Z.; writing—review and editing, A.J. All authors have read and agreed to the published version of the manuscript.
Funding
This research is supported by the National Natural Science Foundation of China; Funding Name: Study on the Microscopic Phase Behavior and Migration Mechanism of CO2 and Multicomponent Alkanes in Shale Dynamical Nanopore (No. 52004038).
Data Availability Statement
Data are contained within the article.
Conflicts of Interest
Authors Yuan Li, Qing Qian, Anhai Zhong, Feng Yang, Mingjing Lu, Yuzhe Zhang and Ana Jiang were employed by the Sinopec Shengli Oilfield Co., Ltd. The authors declare that the research was conducted in the absence of any commercial or financial relationships that could be construed as a potential conflict of interest. The Sinopec Shengli Oilfield Co., Ltd. had no role in the design of the study; in the collection, analyses, or interpretation of data; in the writing of the manuscript, or in the decision to publish the results.
Nomenclature
| HR | high-quality reservoirs |
| PR | poor-quality reservoirs |
| CR | composite reservoirs |
| HPMI | high-pressure mercury injection |
| PRHPR | permeability ratio of high-quality reservoir and poor-quality reservoir, % |
| GWPPD | gas well production pressure difference, MPa |
| CGP | cumulative gas production, ml |
| CGPC | cumulative gas production contribution, % |
| DRE | reserve recovery degree, % |
| RRE | reserve recovery efficiency, % |
References
- Hu, J.; Yang, S.; Wang, B.; Deng, H.; Wang, M.; Li, J.; Zhao, S.; Shen, B.; Gao, X.; Yang, K. Effect of Pore Structure Characteristics on Gas-Water Seepage Behaviour in Deep Carbonate Gas Reservoirs. Geoenergy Sci. Eng. 2024, 238, 212–881. [Google Scholar] [CrossRef]
- Yan, H.; Jia, A.; Meng, F.; Xia, Q.; Xu, W.; Feng, Q.; Luo, W.; Li, X.; Zhu, X.; Liu, Y. Comparative study on the reservoir characteristics and development technologies of two typical karst weathering-crust carbonate gas reservoirs in China. Geofluids 2021, 663–1006. [Google Scholar] [CrossRef]
- Jia, A.; Yan, H. Problems and countermeasures for various types of typical carbonate gas reservoirs development. Acta Pet. Sin. 2014, 35, 519–527. [Google Scholar]
- Yan, H.J.; He, D.B.; Jia, A.L.; Li, Z.P.; Guo, J.L.; Peng, X.; Meng, F.K.; Li, Y.X.; Zhu, Z.M.; Deng, H.; et al. Characteristics and development model of karst reservoirs in the fourth member of Sinian Dengying Formation in central Sichuan Basin, SW China. Pet. Explor. Dev. 2022, 49, 704–715. [Google Scholar] [CrossRef]
- Ma, X.H.; Yang, Y.; Wen, L.; Luo, B. Distribution and exploration direction of medium- and large-sized marine carbonate gas fields in Sichuan Basin, SW China. Pet. Explor. Dev. 2019, 46, 1–15. [Google Scholar] [CrossRef]
- He, D.B.; Yan, H.J.; Yang, C.C.; Wei, Y.S.; Zhang, L.J.; Guo, J.L.; Luo, W.L.; Liu, X.X.; Hu, D.; Xia, Q.Y.; et al. Gas reservoir characteristics and technical countermeasures for development in the fourth Member of Dengying Formation in Anyue gas field. Acta Pet. Sin. 2022, 43, 977–988. [Google Scholar]
- Xu, Y.; Tan, X.; Li, X.; Liu, Q. Blasingame production decline and production prediction model of inclined well in triple-porosity carbonate gas reservoir. J. Nat. Gas Sci. Eng. 2021, 92, 103–983. [Google Scholar] [CrossRef]
- Xie, X.; Lu, H.; Deng, H.; Li, H. Characterization of unique natural gas flow in fracture-vuggy carbonate reservoir: A case study on dengying carbonate reservoir in China. J. Pet. Sci. Eng. 2019, 182, 106–243. [Google Scholar] [CrossRef]
- Tian, X.W.; Peng, H.L.; Wang, Y.L.; Yang, D.L.; Sun, Y.T. Analysis of reservoir difference and controlling factors between the platform margin and the inner area of the fourth member of Sinian Dengying Formation in Anyue Gas Field, central Sichuan. Nat. Gas Geosci. 2020, 31, 1225–1238. [Google Scholar]
- Wang, L.; Yang, S.; Liu, Y.; Xu, W.; Deng, H.; Meng, Z.; Han, W.; Qian, K. Experiments on gas supply capability of commingled production in a fracture-cavity carbonate gas reservoir. Pet. Explor. Dev. 2017, 44, 824–833. [Google Scholar] [CrossRef]
- Wang, Z.C.; Zhao, W.Z.; Hu, S.Y.; Xu, A.N.; Jiang, Q.C.; Jiang, H.; Huang, S.P.; Li, Q.F. Control of tectonic differentiation on the formation of large oil and gas fields in craton basins: A case study of Sinian–Triassic of the Sichuan Basin. Nat. Gas Ind. 2017, 37, 9–23. [Google Scholar] [CrossRef]
- Zhang, Y.X.; Yang, S.L.; Zhang, Z.; Li, Q.; Deng, H.; Chen, J.Y.; Geng, W.Y.; Wang, M.Y.; Chen, Z.X.; Chen, H. Multiscale pore structure characterization of an ultra-deep carbonate gas reservoir. J. Pet. Sci. Eng. 2022, 208, 109–751. [Google Scholar] [CrossRef]
- Wang, L.; He, Y.M.; Deng, H.; Liu, Y.C.; Xu, W. Pore structure characteristics of an ultradeep carbonate gas reservoir and their effects on gas storage and percolation capacities in the deng iv member, gaoshiti-moxi area, sichuan basin, sw China. Mar. Pet. Geol. 2020, 111, 44–65. [Google Scholar] [CrossRef]
- Zhou, Y.; Yang, F.; Ji, Y.; Zhang, C. Characteristics and controlling factors of dolomite karst reservoirs of the sinian dengying formation, central sichuan basin, southwestern china. Precambrian Res. 2020, 343, 105708. [Google Scholar] [CrossRef]
- Li, J.; Yang, C.L.; Xie, W.R.; Rui, Y.R.; Wang, X.B.; Zhang, L.; Xie, Z.Y.; Guo, Z.Q. Differences of natural gas accumulation and play fairways in the marginal zone and interior of Sinian platform in Anyue gas field, Sichuan Basin. Oil Gas Geol. 2023, 44, 34–45. [Google Scholar]
- Zhang, M.; Dai, X.F.; Pang, C.X.; Jiang, L.; Geng, C.; Xu, Y.P. Identification and application of the gas reservoirs in the intra-platform of the Sinian Dengying Formation in central Sichuan Basin. Nat. Gas Geosci. 2021, 32, 764–771. [Google Scholar]
- Guo, C.Q.; Li, F.M.; Liu, H.N.; Xia, Z.H.; Liu, X.W.; Fan, H.L.; Liu, L.L. Analysis of quantitative relationship between gas offtake and plateau duration of natural gas reservoir. Acta Pet. Sin. 2009, 30, 908–911. [Google Scholar]
- Yan, H.J.; Deng, H.; Wan, Y.J.; Yu, Q.C.; Xia, Q.Y.; Xu, W.; Luo, R.L.; Chen, M.H.; Yan, Y.J.; Zhang, L.; et al. The gas well productivity distribution characteristics in strong heterogeneity carbonate gas reservoir in the fourth Member of Dengying Formation in Moxi area, Sichuan Basin. Nat. Gas Geosci. 2020, 31, 1152–1160. [Google Scholar]
- Gao, S.S.; Liu, H.X.; Ren, D.; Hu, Z.M.; Ye, L.Y. Productivity equation of fractured-cave carbonate reservoirs and its influencail factors. Nat. Gas Ind. 2015, 35, 48–54. [Google Scholar]
- Zhu, H.Y.; Hu, Y.; Zhu, W.Y.; Wang, F.J.; Luo, R.L. Physical simulation technology for gas reservoir development behavior analysis. Oil Drill. Prod. Technol. 2010, 32, 54–57. [Google Scholar]
- Yang, J.; Kang, Y.L.; Wang, Y.Z.; Guo, H.Z. An experimental study of gas mass-transfer for fractured tight sand gas reservoirs. Nat. Gas Ind. 2010, 30, 39–41. [Google Scholar]
- Zhang, X.Y.; Wang, J.J.; Wang, G.; Wang, N.; Liu, Z.X.; Gong, H.Y.; Wang, W.G. Gas production path of coalbed methane reservoir:A case study of Mabidong Block, southern Qinshui Basin. Pet. Geo. Recy. Eff. 2020, 27, 137–142. [Google Scholar]
- Hu, Y.; Jia, Y.Z.; He, D.B.; Wang, J.P.; Li, Z.C.; Zhou, M.F.; Wei, K.Y.; Jiang, L.J.; Xu, X.; Jiao, C.Y.; et al. Characterization method of gas reservoir heterogeneity and physical simulation experiment of production. Nat. Gas Geosci. 2022, 33, 297–302. [Google Scholar]
- Gong, Y.J.; Liu, S.B.; Zhao, M.J.; Xie, H.B.; Liu, K.Y. Characterization of micro pore throat radius distribution in tight oil reservoirs by NMR and high pressure mercury injection. Pet. Geol. Exp. 2016, 38, 389–394. [Google Scholar]
- Kong, X.X.; Xiao, D.S.; Jiang, S.; Lu, S.F.; Sun, B.; Wang, J.M. Application of the combination of high-pressure mercury injection and nuclear magnetic resonance to the classification and evaluation of tight sandstone reservoirs: A case study of the Linxing Block in the Ordos Basin. Nat. Gas Ind. 2020, 40, 38–47. [Google Scholar] [CrossRef]
- Ning, C.X.; Jiang, Z.X.; Gao, Z.Y.; Li, Z.; Zhu, R.F.; Su, S.Y.; Li, T.W.; Wang, Z.; Huang, R.Z.; Chen, L. Quantitative evalution of pore connectivity with nuclear magnetic resonance and high pressure mercury injection: A case study of the lower section of Es3 in Zhanhua sag. J. China Univ. Min. Technol. 2017, 46, 578–585. [Google Scholar]
- 20067102-T-469; Measuring the Pore Size Distribution and Porosity of Solid Materials by Mercury Intrusion and Gas Adsorption Method Part 1: Mercury Intrusion Method; China National Institute of Standardization: Beijing, China, 2008.
- Cheng, Z.; Ning, Z.; Wang, Q.; Zhang, W. The effect of pore structure on non-darcy flow in porous media using the lattice boltzmann method. J. Pet. Sci. Eng. 2019, 172, 391–400. [Google Scholar] [CrossRef]
- Muljadi, B.P.; Blunt, M.J.; Raeni, A.Q.; Bijeljic, B. The impact of porous media heterogeneity on non-darcy flow behaviour from pore-scale simulation. Adv. Water Resour. 2016, 95, 329–340. [Google Scholar] [CrossRef]
- Balhoff, M.T.; Wheeler, M.F. A predictive pore-scale model for non-Darcy flow in porous media. SPE J. 2009, 14, 579–587. [Google Scholar] [CrossRef]
- Wang, L.; Yang, S.L.; Peng, X.; Deng, H.; Li, L.X.; Meng, Z.; Qian, K.; Wang, Q. Visual experiments on the occurrence characteristics of multi-type reservoir water in fracture-cavity carbonate gas reservoir. Acta Pet. Sin. 2018, 39, 686–696. [Google Scholar]
- Zhang, J.; Li, X.Z.; Gao, S.S.; Ye, L.Y.; Liu, H.X.; Zhu, W.Q.; Fang, F.F. Water production mechanism of tight sandstone gas reservoir and its influence on percolation capacity. Nat. Gas Geosci. 2019, 30, 1519–1530. [Google Scholar]
- Sima, L.Q.; Wang, C.; Wang, L.; Wu, F.; Ma, L.; Wang, Z.J. Effect of pore structure on the seepage characteristics of tight sandstone reservoirs: A case study of Upper Jurassic Penglaizhen Fm reservoirs in the western Sichuan Basin. Nat. Gas Ind. 2016, 36, 18–25. [Google Scholar] [CrossRef]


Disclaimer/Publisher’s Note: The statements, opinions and data contained in all publications are solely those of the individual author(s) and contributor(s) and not of MDPI and/or the editor(s). MDPI and/or the editor(s) disclaim responsibility for any injury to people or property resulting from any ideas, methods, instructions or products referred to in the content. |
© 2024 by the authors. Licensee MDPI, Basel, Switzerland. This article is an open access article distributed under the terms and conditions of the Creative Commons Attribution (CC BY) license (https://creativecommons.org/licenses/by/4.0/).