Article

Optimal Multiple Wind Power Transmission Schemes Based on a Life Cycle Cost Analysis Model

1
State Grid Hubei Electric Power Co., Ltd., Wuhan 430077, China
2
State Grid Hubei Electric Power Research Institute, Wuhan 430077, China
3
Hubei Key Laboratory of Power Equipment & System Security for Integrated Energy, Wuhan University, Wuhan 430072, China
4
School of Electrical and Automation, Wuhan University, Wuhan 430072, China
*
Author to whom correspondence should be addressed.
Processes 2024, 12(8), 1594; https://doi.org/10.3390/pr12081594 (registering DOI)
Submission received: 1 July 2024 / Revised: 22 July 2024 / Accepted: 23 July 2024 / Published: 30 July 2024
(This article belongs to the Section Energy Systems)

Abstract

:
Due to the high cost and complex challenges faced by offshore wind power transmission, economic research into offshore wind power transmission can provide a scientific basis for optimal decision-making on offshore wind power projects. Based on the analysis of the topology structure and characteristics of typical wind power transmission schemes, this paper compares the economic benefits of five different transmission schemes with a 3.6 GW sizeable onshore wind farm as the primary case. Research includes traditional high voltage alternating current (HVAC), voltage source converter high voltage direct current transmission (VSC-HVDC), a fractional frequency transmission system (FFTS), and two hybrid DC (MMC-LCC and DR-MMC) transmission scenarios. The entire life cycle cost analysis model (LCCA) is employed to thoroughly assess the cumulative impact of initial investment costs, operational expenses, and eventual scrap costs on top of the overall transmission scheme’s total cost. This comprehensive evaluation ensures a nuanced understanding of the financial implications across the project’s entire lifespan. In this example, HVAC has an economic advantage over VSC-HVDC in the transmission distance range of 78 km, and the financial range of a FFTS is 78–117 km. DR-MMC is better than the flexible DC delivery scheme in terms of transmission capacity, scalability, and offshore working platform construction costs in the DC delivery scheme. Therefore, the hybrid DC delivery scheme of offshore wind power composed of multi-type converters has excellent application prospects.

1. Introduction

In recent decades, renewable energy sources, primarily wind power, have grown substantially and now rank as the third most significant electrical energy provider, trailing only thermal and hydroelectric power [1]. Numerous nations have invested significantly in large-scale land-based wind power projects to attain a more consistent and dependable supply of wind-generated electricity. According to international renewable energy transmission statistics [2], by the conclusion of 2022, the global installation of new wind power capacity reached approximately 88.6 megawatts. China, in its “13th Five-Year Plan for Wind Power Development,” has outlined a proactive and steady approach to wind power construction, resulting in a total installed capacity that surpasses Germany’s 93.8 million kilowatts, positioning it as the second-largest wind power installation in the world.
In recent years, the evolution of wind farms has shifted towards inland regions, where vast tracts of land abound with wind energy resources. These inland areas boast superior average wind speeds, greater stability, and ample operational hours compared to traditional locations, with fewer limitations [3]. Notably, Horn One in the United Kingdom and EnB HoheSee in Germany have set benchmarks as the farthest-reaching wind farms, spanning over 1000 km. Concurrently, advancements in turbine manufacturing technology have led to a yearly increase in the capacity of individual wind turbine generators. This advancement has reduced the number of turbines required for wind farms (excluding exceptionally high wind speed areas), thereby lowering operational and maintenance costs. For instance, in 2010, the average single turbine capacity in Europe was a mere 4 MW, whereas in 2019, it escalated to 7.8 MW. Today, the state-of-the-art Siemens Gamesa SG14-222DD wind turbine generator boasts a remarkable capacity of 14 MW. Hence, as the capacity and reach of individual wind turbines expand, the potential of wind power to drive economic growth becomes more evident, offering significant cost savings and long-term sustainability.
The offshore wind farm landscape is evolving towards installations that are increasingly distant from the shore and situated in deeper waters. According to preliminary statistics, by 2022, the average offshore distance for newly commissioned offshore wind farms in European nations had surpassed 100 km, with water depths averaging between 30 and 40 m. China’s Southern Power Grid has also formulated plans for the development of deep-sea wind farms in coastal regions like Yangjiang, Zhanjiang, and Chaoshan. Consequently, harnessing advanced transmission technologies to enable the transportation of future large-scale offshore wind power hubs has emerged as a pivotal direction within the broader context of future grid construction and new infrastructure initiatives. Among the leading nations in AC grid connection, the United Kingdom and Denmark stand out. However, these systems necessitate reactive power compensation, and their transmission capacity is constrained by the capacitor charging effect, rendering them unsuitable for long-distance transmission schemes. Conversely, Germany represents the forefront of DC transmission methods, primarily employing a modular multi-level converter (MMC) system pioneered by Siemens and ABB. This approach boasts significant advantages in long-distance, high-capacity transmission, including independent reactive power control, isolation of offshore wind farms from the onshore grid, and self-starting capabilities [4]. Nevertheless, it also incurs a higher converter volume, platform construction, and maintenance costs compared to AC transmission solutions. In parallel, the utilization of multi-type converters in hybrid DC power transmission and fractional frequency transmission systems (FFTSs) has emerged as an alternative for extensive wind power transmission, offering a viable solution for distant wind power dissemination [5,6].
Furthermore, numerous scholarly investigations have delved into the economic evaluation of wind power development strategies. One such study focused on financial assessments of HVDC transmission systems incorporating intermediate compensation stations [7]. Additionally, leveraging the framework of the lifecycle cost theory, a cost analysis model for the key transformer components of booster stations was formulated, dissected, and computed for each individual part [8]. A comparative analysis was undertaken in [9], evaluating the cost-effectiveness of the entire lifecycle costs between AC grid-connected and VSC-HVDC transmission solutions. The economically feasible transmission lengths of fractional frequency transmission systems (FFTSs) were determined by comparing FFTS and HVDC economic intervals using the iso-annual value method in [10]. To examine the various transmission modalities of the emerging uncontrolled rectifier DR converter, we conducted an economic assessment comparing VSC-HVDC and hybrid DR-MMC HVDC transmission strategies. This analysis employed a comprehensive lifecycle model as its analytical tool [11]. Moreover, the suitability of HVAC and VSC-HVDC in wind power applications was scrutinized, considering Germany’s grid connectivity’s current status and characteristics. A wind power analytical model was introduced in [12], providing further insights into this realm.
In [13], the emphasis was placed on examining how the cost of pivotal equipment, including wind power infrastructure and submarine cables, impacts the investment cost, particularly when considering variations in transportation distances. Additionally, ref. [14] employed a discounted cash flow evaluation model to scrutinize the economic feasibility of diverse transmission modalities and utilized an enhanced particle swarm optimization algorithm to identify the most economically viable grid connection strategies under varying conditions. However, these existing frameworks have not fully explored the range of wind power transmission techniques, such as novel uncontrolled rectification and frequency division transmission methods, across multiple temporal and spatial scales and in diverse dimensions, nor have they delineated the economic applicability of each scheme.
In conclusion, this paper presents an analytical approach for evaluating the economic benefits of multiple wind power transmission schemes, encompassing HVAC, VSC-HVDC, FFTS, MMC-LCC, and DR-MMC. The paper’s contributions can be highlighted as a beacon of hope for the future of renewable energy, emphasizing the significant cost savings and long-term sustainability these schemes offer.
(1) The development of an LCCA model tailored for analyzing the life cycle costs of diverse wind power DC transmission system topologies.
(2) An in-depth analysis of how factors such as distance and installed capacity impact the lifecycle costs of wind power transmission systems based on the unique topological characteristics of each scheme. This analysis further leads to determining the economic application range for each modality.
The paper’s organization is as follows: The paper introduces the fundamental characteristics and configurations of five commonly employed wind power transmission systems. Subsequently, an economic comparison framework is formulated, utilizing a whole life cycle analysis model to compare the five transmission modalities regarding fixed investment costs, maintenance expenses, and operational losses incurred by the crucial equipment. Further, using a 3.6 GW wind farm as a practical case, the paper designs a transmission grid structure that considers each method’s unique transmission capabilities. Ultimately, the paper concludes the economic viability of the five transmission schemes.

2. Topology of Grid Connection Scheme for Wind Farm

2.1. Overview of Wind Farm Construction

In the context of planning extensive land-based wind power development in the southeastern coastal provinces, this paper thoroughly delves into the economic analysis of diverse wind power transmission systems. Figure 1 illustrates the designated wind power planning and construction areas, segmented into 12 wind farms labeled H1 through H12, each boasting an installed capacity of approximately 300 MW. The total anticipated installed capacity for this locale stands at 3.6 GW. The wind farms are geographically distributed and numbered consecutively from H1 to H12. Given the generalizability of the offshore wind farm examined in this paper, the following constraints have been imposed:
(1) Transmission Distance Constraint: In anticipation of China’s offshore wind power developments, where the average offshore distance exceeds 100 km and may reach a maximum of 200 km, this study prioritizes distances greater than 100 km, focusing on those anticipated in the next decade. The analysis range is between 50 and 250 km, mirroring realistic application scenarios.
(2) Water Depth Constraint: Coastal offshore wind power development in China primarily occurs on the continental shelf, characterized by a gradual increase in water depth. With an average depth of approximately 40 m, this study incorporates the influence of water depth into the exponential coefficient of converter station capacity, acknowledging its impact on transmission system costs.
(3) Service Life Constraint: Based on historical offshore wind power projects, this paper assumes an annual utilization time of 3600 h for the studied offshore wind farm, with a projected life cycle spanning 25 years.

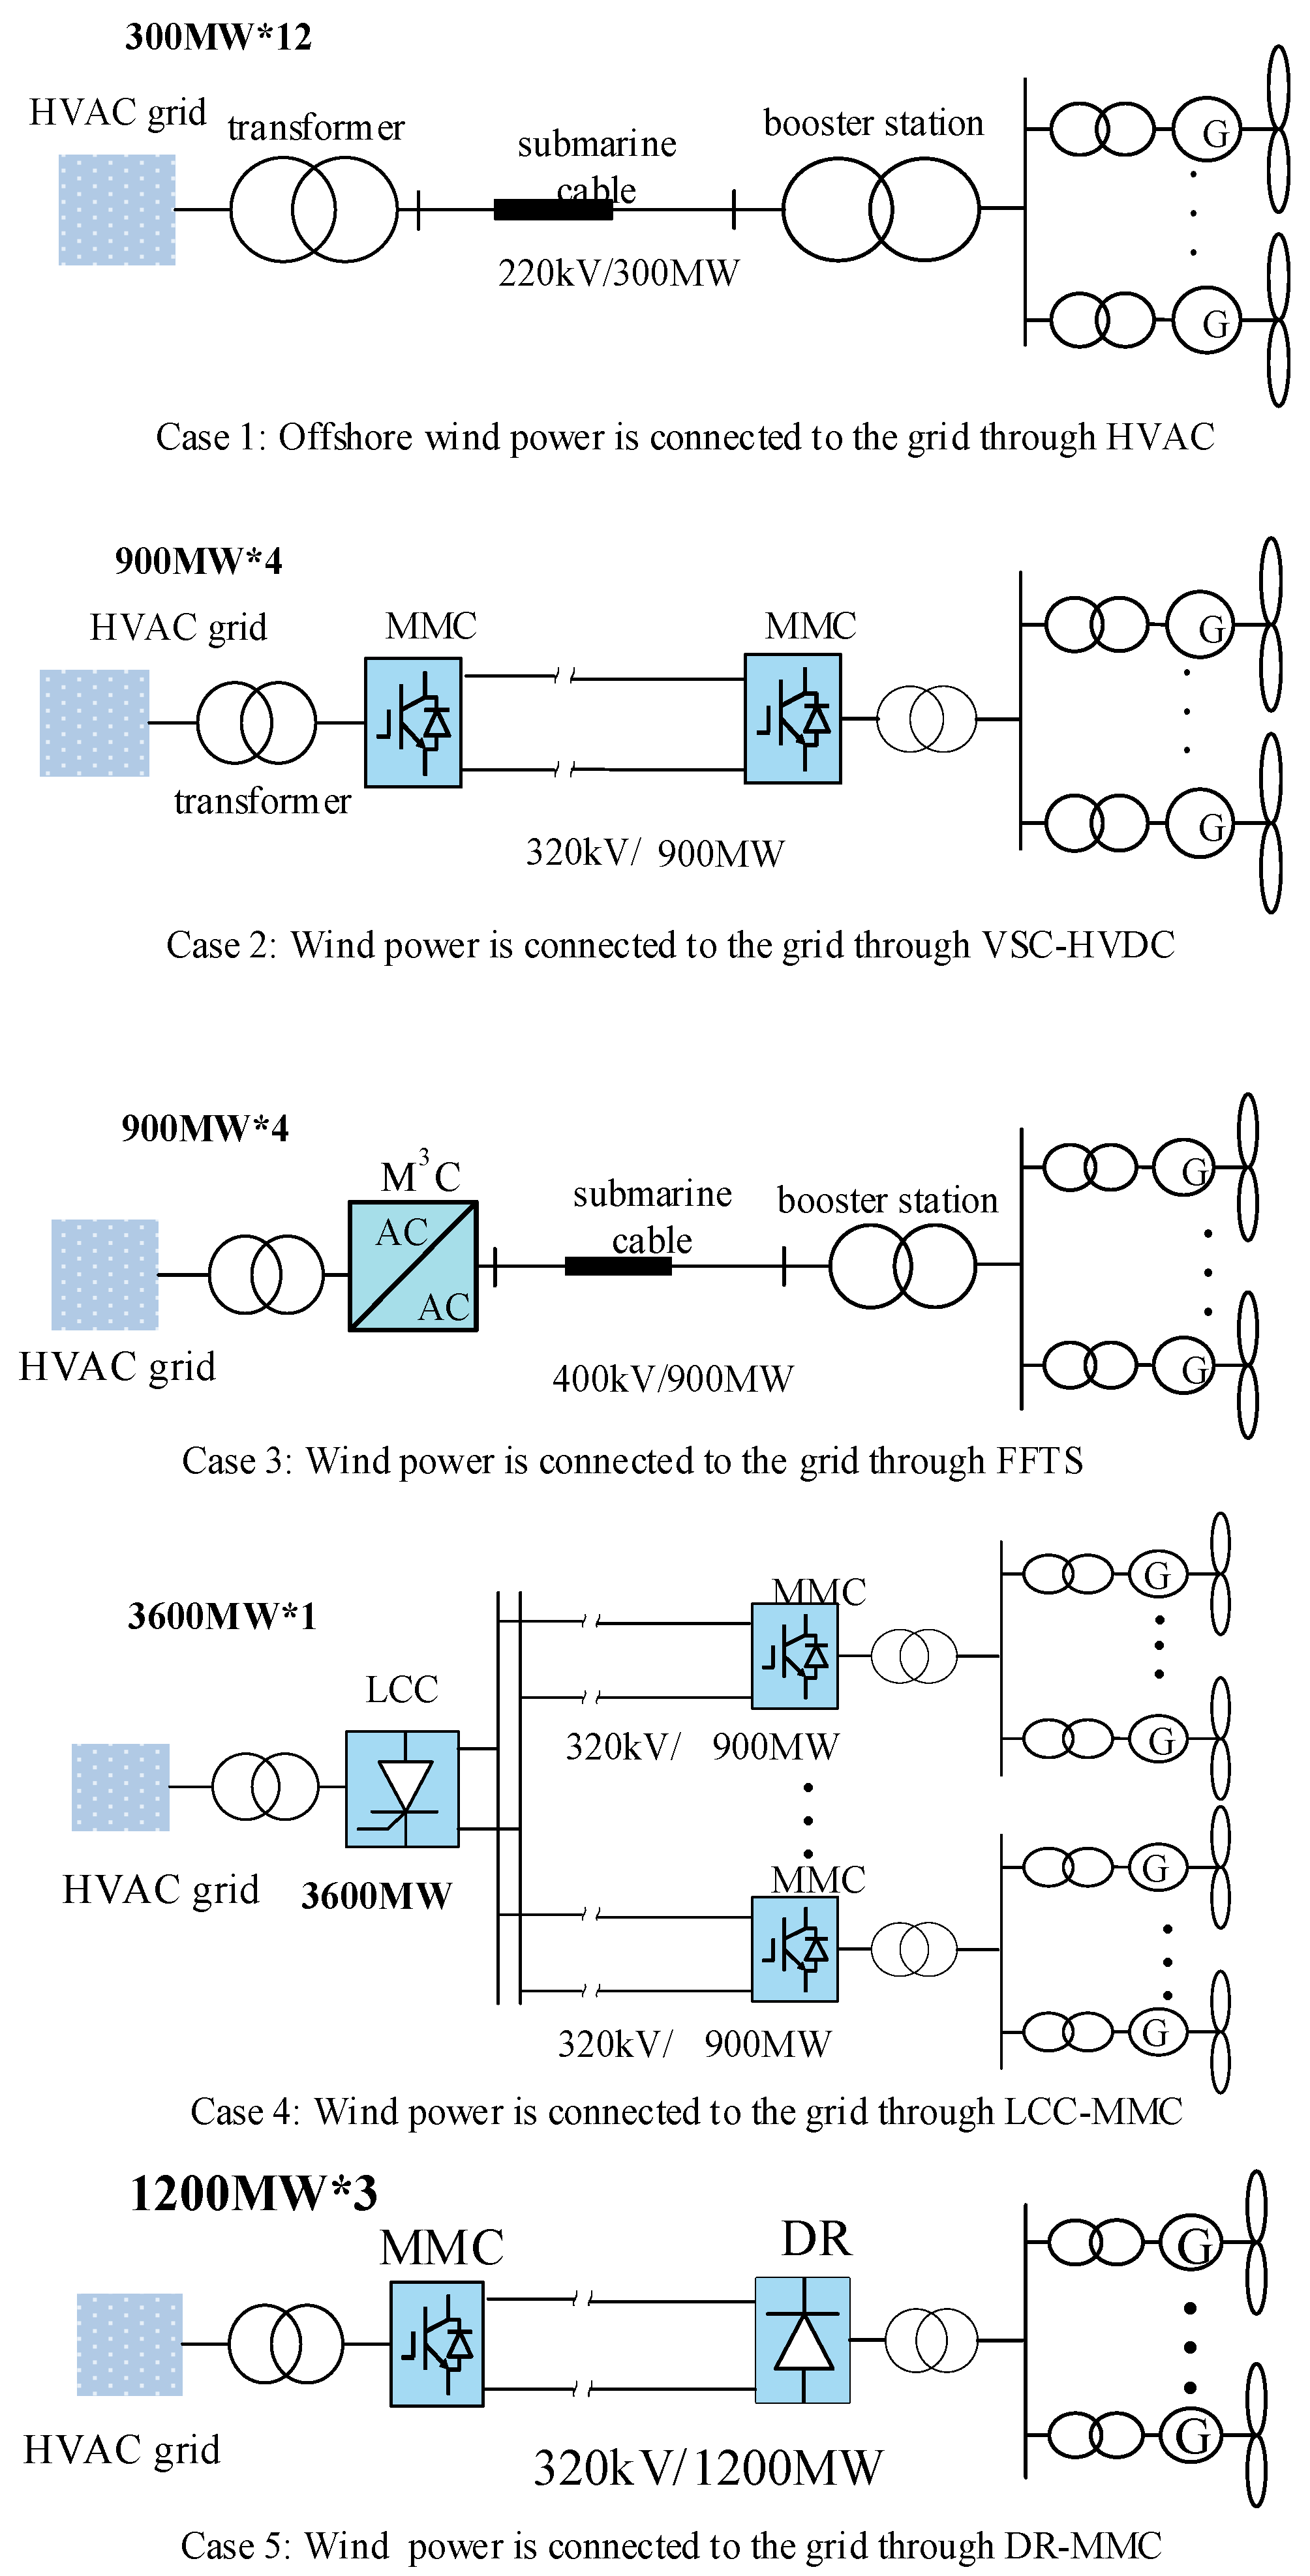
2.2. Kinds of Wind Power Grid-Connected Structure Design Scheme

The transmission schemes for five kinds of land wind power grid-connected structures are shown in Figure 2.
(1) Scheme 1: High-voltage AC (HVAC) is the chosen transmission method. This scheme utilizes a transformer to initially boost the voltage, followed by two additional voltage elevations through the collection system and booster station. The elevated power is then dispatched to the receiving transformer station via a high-voltage submarine AC cable. HVAC incorporates AC work platforms, reactive power compensation equipment, and AC submarine cables.
(2) Scheme 2: The VSC-HVDC transmission method is implemented with modular multilevel converters (MMC) at both ends. Drawing from data from existing German wind farms, the MMC converter capacity has attained the 1.0 GW mark. However, considering factors like the construction volume and heat dissipation, the installed capacity of a single loop is set at 900 MW.
(3) Scheme 3: The frequency division transmission (FFTS) method is employed. The modular multilevel matrix converter (M3C), known for its flexibility, serves as the cornerstone of this transmission scheme. In comparison to an AC–AC inverter, M3C utilizes a fully controllable device (IGBT), offering greater flexibility in control and high-frequency shutdown capability. This arrangement leads to a reduction in the required filtering equipment capacity [15].
(4) Scheme 4: A hybrid MMC-LCC transmission system is utilized. Here, four DC cables converge through a DC bus and are integrated into the AC power grid via the terminal converter LCC. The onshore converter’s installed capacity can reach an impressive 4 GW due to the receiver converter’s high LCC transmission capacity.
(5) Scheme 5: A hybrid DR-MMC system is adopted, with the feeding converter composed of an uncontrollable diode (DR). DR, with its compact size and simplified control strategy, boasts significant advantages, enabling a single loop’s installed capacity to reach 1.2 GW. The system’s startup necessitates the use of an energy storage device or a self-starting power supply [16].

3. Analysis Method-Life Cycle Cost Analysis (LCCA) Model

3.1. Mathematical Model of LCCA

The lifecycle cost model is a pivotal tool for a comprehensive economic analysis of the wind power transmission system’s lifespan. This assessment spans crucial stages such as feasibility assessments, construction, operational efficiency, maintenance, and decommissioning. The model also incorporates safety and reliability aspects of the transmission system.
When it comes to evaluating lifecycle cost analysis (LCCA) models, it is not just about considering a range of factors. It is about navigating the complexities of emerging equipment and technologies like the FFTS DR, where there are no commercial precedents to establish design parameters or generate cost data. This task is imperative and challenging, encompassing capital outlays, maintenance costs, power efficiency losses, and equipment reliability, among other pertinent variables.
When it comes to conducting a thorough economic assessment of wind power transmission schemes, one thing is indispensable: leveraging construction data from analogous projects and individual equipment ventures. These data are key to deriving accurate cost estimates, particularly for the DR and M3C components.
(1) Cost Analysis of FFTS Inverters: The pricing of the DC converter station is established upon adopting a unit capacity cost of 2 million RMB per megawatt. It is a common understanding that offshore DC converter stations incur a 33% premium in construction costs compared to their onshore counterparts. The M3C converter station, which employs a modular multilevel matrix converter for terrestrial frequency transformation, has an investment cost 1.5 times that of a conventional onshore MMC inverter station.
(2) Evaluation of DR Inverter Expenses: Drawing from the withstand voltage ratings of the components and pertinent engineering knowledge, the DR terminal will utilize four sets of 6-pulse rectifier valve groups, each rectifier valve serially connected to 95 diodes. This translates to a total of 2260 diodes for the entire project. Given the similarity in capacity between the DR and LCC filters, cost estimates reveal that the LCC cost exceeds the DRU-MMC cost, and is approximately 1.38 times higher. On the other hand, the AC filter’s investment cost is relatively minimal, accounting for approximately 11% of the DR unit’s total cost. Even with the inclusion of the AC filter’s investment cost, the DRU-MMC topology still exhibits a cost advantage of roughly 36% over the MMC and is approximately 19% lower than the FFTS. Table 1 shows the costs for various inverters with a 300 MW capacity.
The calculation expression pertaining to the life cycle cost analysis (LCCA) model for the wind power transmission plan is delineated in the following formulation (1):
L = C 0 + C L + C M + C D
Here, C0 represents the initial investment cost; C1 represents the operating cost; CM represents the maintenance cost; CD represents the scrap cost.
The discounted cash flow model serves as a mechanism for translating anticipated future cash flows into their equivalent present-day cost value, enabling a comparative analysis of costs across various schemes [17]. t represents hues facilitating cost comparison between different schemes. Disparities in operational expenses across different years are deemed negligible in this context. The mathematical expression for computing the discounted cash flow is outlined as follows:
L = C 1 + 1 + r n c 1 r 1 + r n c C 0 + C M + C D
Here, the value of nc represents 25 according to the annual life of the transmission and transformation equipment, and the annual interest rate r is 8% according to the investment recovery rate of the power industry in [18].

3.2. Fixed Investment Cost Analysis

When considering fixed investment costs, various factors are considered, such as procurement expenditures for wind turbines, converter stations, booster stations, submarine transmission cables, and associated ancillary equipment. Furthermore, these costs include the expenses related to the construction, foundation, and platform installation of the necessary equipment [9].
Amidst the numerous components in wind farms, wind turbines, their foundations, and installation modules constitute the most significant share of investment, accounting for approximately 60% of the total investment. The turbine procurement and installation costs remain identical for all five transmission schemes mentioned. Therefore, the turbine and installation costs are excluded from the fixed investment cost calculation to ensure a more precise comparison of the expenses between different transmission methods. Additionally, this study disregards the recovered equipment’s disposal costs and salvage value. The subsequent sections will elaborate on the detailed methodologies for calculating costs in each segment. The life cycle cost composition of wind power grid-connected scheme is shown in Figure 3.
(1) Converter acquisition and installation costs
The investment cost associated with converters comprises various aspects such as capital expenditure for construction, equipment procurement, and installation. There are charges for the platform and plant cost, including the onshore plant cost (OPC), which covers the costs incurred for the platform and plant facilities. Drawing from the commercial experience formulas presented in [19,20,21], Table 2 outlines the pricing for various converter types.
(2) Transmission line laying and loss cost
Transmission cables primarily constitute AC cables and DC cables, and their single-loop capacity is specified for wind power grid-connection configurations. It is imperative to select the appropriate cable type based on the specific capacity requirements of the five transmission schemes. The costs associated with cable procurement are detailed in Table 2, while the laying costs can be estimated at a rate of 300,000 ¥ per kilometer.
C c a b l e = t c l c n + 3 10 5 l c
Here, tc represents the cable price; lc represents the length; n represents the number of loops.
(3) Reactive power compensation cost
In the initial stage, it is essential to undertake an analysis of the transmission capacity of AC cables. Notably, in submarine cable transmission systems, ground capacitance emerges as the primary factor that imposes constraints on the effective transmission of active power. Reactive power QC generated by the capacitor charging current can be calculated as follows:
C c a b l e = t c l c n + 3 10 5 l c
L I = 9.8 × 10 3 ρ I π D + R e q R e q
Here, Vn represents the rated voltage of the system; fn represents the frequency; C represents the capacitance of the cable to the ground.
To enhance the active power transmission capacity, the implementation of reactive power compensation devices at both extremities of the cable line is advisable. As a result, the overall cost of reactive power compensation can be determined through the following calculation:
C Q _ H V A C = Q o f f C Q _ o f f + Q o n C Q _ o n = 0.1756 V n 2 2 π f n C l c 10 6
Here, CQ_HVAC represents the reactive power compensation cost of the AC line, CQ_on represents the unit onshore reactive power compensation cost, and CQ_off represents the marine reactive power compensation cost.
(4) HVDC circuit breaker cost
Based on the assessment conducted in [22,23] for HVDC circuit breakers, adopting such breakers is estimated to incur a cost range of approximately 150,000 to 250,000 ¥ per megawatt. However, given the technological advancements, the cost adopted in this paper is pegged at 150,000 ¥ per megawatt.

3.3. Operating Costs

The operational expenses encompass both maintenance costs and operational loss costs. Maintenance costs primarily comprise the power losses stemming from scheduled maintenance outages and unexpected component failures. Meanwhile, operational loss costs incorporate converter losses and line losses. Assuming an annual utilization of 3600 h, the formula for calculating these costs is expressed as:
C 1 = C M + C L
Here, C1 represents the operating cost, CM represents the maintenance cost, and CL represents the operating wear cost.
(1) Maintenance costs
The maintenance costs are segmented into two distinct categories: routine maintenance expenditures for all components, and the costs associated with failure recovery time as well as power losses incurred during maintenance outages.
C M = C m + C E + C d o w n
Here, Cm represents the daily maintenance cost, CE represents the fault recovery cost, and Cdown represents the maintenance outage cost.
(1) Daily maintenance cost Cm includes all components:
C m = m s _ c o n v C 0 _ c o n v + m s _ s u b C 0 _ s u b + m s _ c a b l e C 0 _ c a b l e
Here, C0 represents the fixed investment cost and ms represents the annual maintenance ratio of the corresponding device; the coefficients are shown in Table 3, and subscripts conv, sub and cable are short for converter station, booster station, and cable, respectively.
(2) The fault recovery cost [23] consists of four parts: the cost of damaged devices, repair costs, the cost of the standby power supply, and the cost of power transmission loss in the event of a power outage.
Therefore, it is much higher than the operating loss power cost, which is usually 1.0–23,000 ¥/MWh in East China; this paper sets it as 10,000 ¥/MWh.
C E = E F R T E T op 365 S T
Here, FR represents the probability of failure, E represents the price of breakdown maintenance, ST represents the transmission capacity, and TE indicates the average time to repair faults. Top indicates the effective working hours of the wind farm.
(3) Annual transmission energy loss cost during downtime maintenance:
C d o w n = T d o w n 365 E o p S T T op 0.8
Here, Eop represents the on-grid electricity price, which is set as 0.6 ¥/kW·h in this paper.
Given that maintenance activities are typically scheduled during periods of low wind conditions, a discount factor of 0.8 is taken into account. Table 3 provides an overview of the downtime associated with various devices. To minimize overall downtime, it is assumed that all maintenance procedures commence simultaneously. Consequently, the total downtime is determined by the component with the longest restoration time.
(4) Operation loss cost
A transmission system’s power loss cost (LC) is the cumulative cost associated with the operating time, capacity, and price EOP. The power loss cost of the converter and line power loss cost are given in this paper.
C L = C L _ c o n v + C L _ s u b + C L _ c a b l e T o p S T
MMC operation loss: Converter MMC adopts a fully controlled device IGBT. According to the operation loss distribution characteristics, the on-state loss of switching device, cut-off loss, and energy storage device loss [12] are calculated respectively.
P loss _ VSC = 6 N P T _ cond + P D _ cond + P T _ off + P D _ off + P C  
Here, N is the number of submodules of the converter bridge arm; PT_cond and PD_cond are on-state losses of the IGBT and anti-parallel diode, respectively. PT_off and PD_off are the cut-off loss of the IGBT and diode, respectively. PC is the loss of energy storage components in the converter.
According to the voltage level of the selected IGBT and the voltage level of the project, the number of series IGBTs in each sub-module is determined to meet the required voltage level. Table 4 shows the parameters of some large IGBTs from ABB and Infineon.
(1) By referring to relevant [27,28], the converter loss costs of each sending scheme are summarized in the following Table 5:
It can be seen from the data in Table 3 that:
C L = γ s u b S T T o p E o p
Here, γsub represents the percentage of booster loss, and ST indicates the transmission capacity.
(2) For the AC line loss calculation, the formula is as follows:
C L _ cable = 3 S T . η o f f n c . 3 V n 2 r c l c n c T o p E o p δ
Here, CL_cable represents the loss of the AC cable and δ represents the loss load factor (0.231 in this paper). ηoff represents the efficiency of the HVAC transformer (set to 99.6% in this paper). lc represents the distance of wind power and rc represents the unit kilometer resistance.
(3) HVDC cable line loss
In the context of HVDC submarine cable transmission systems, the loss cost comprises the converter station loss and line loss, as cited in [29,30,31]. The converter station loss is typically quantified by the converter station loss rate, representing the percentage of energy dissipated at the converter station relative to the total transmitted power. Meanwhile, the line loss can be derived using Formula (16).
P DC _ loss = P / U D C 2 × R × 2 l c
Here, P represents the system to transport active power, and UDC represents the positive and negative voltage difference, while R indicates the DC resistance per unit length.

4. Economic Comparative Analysis

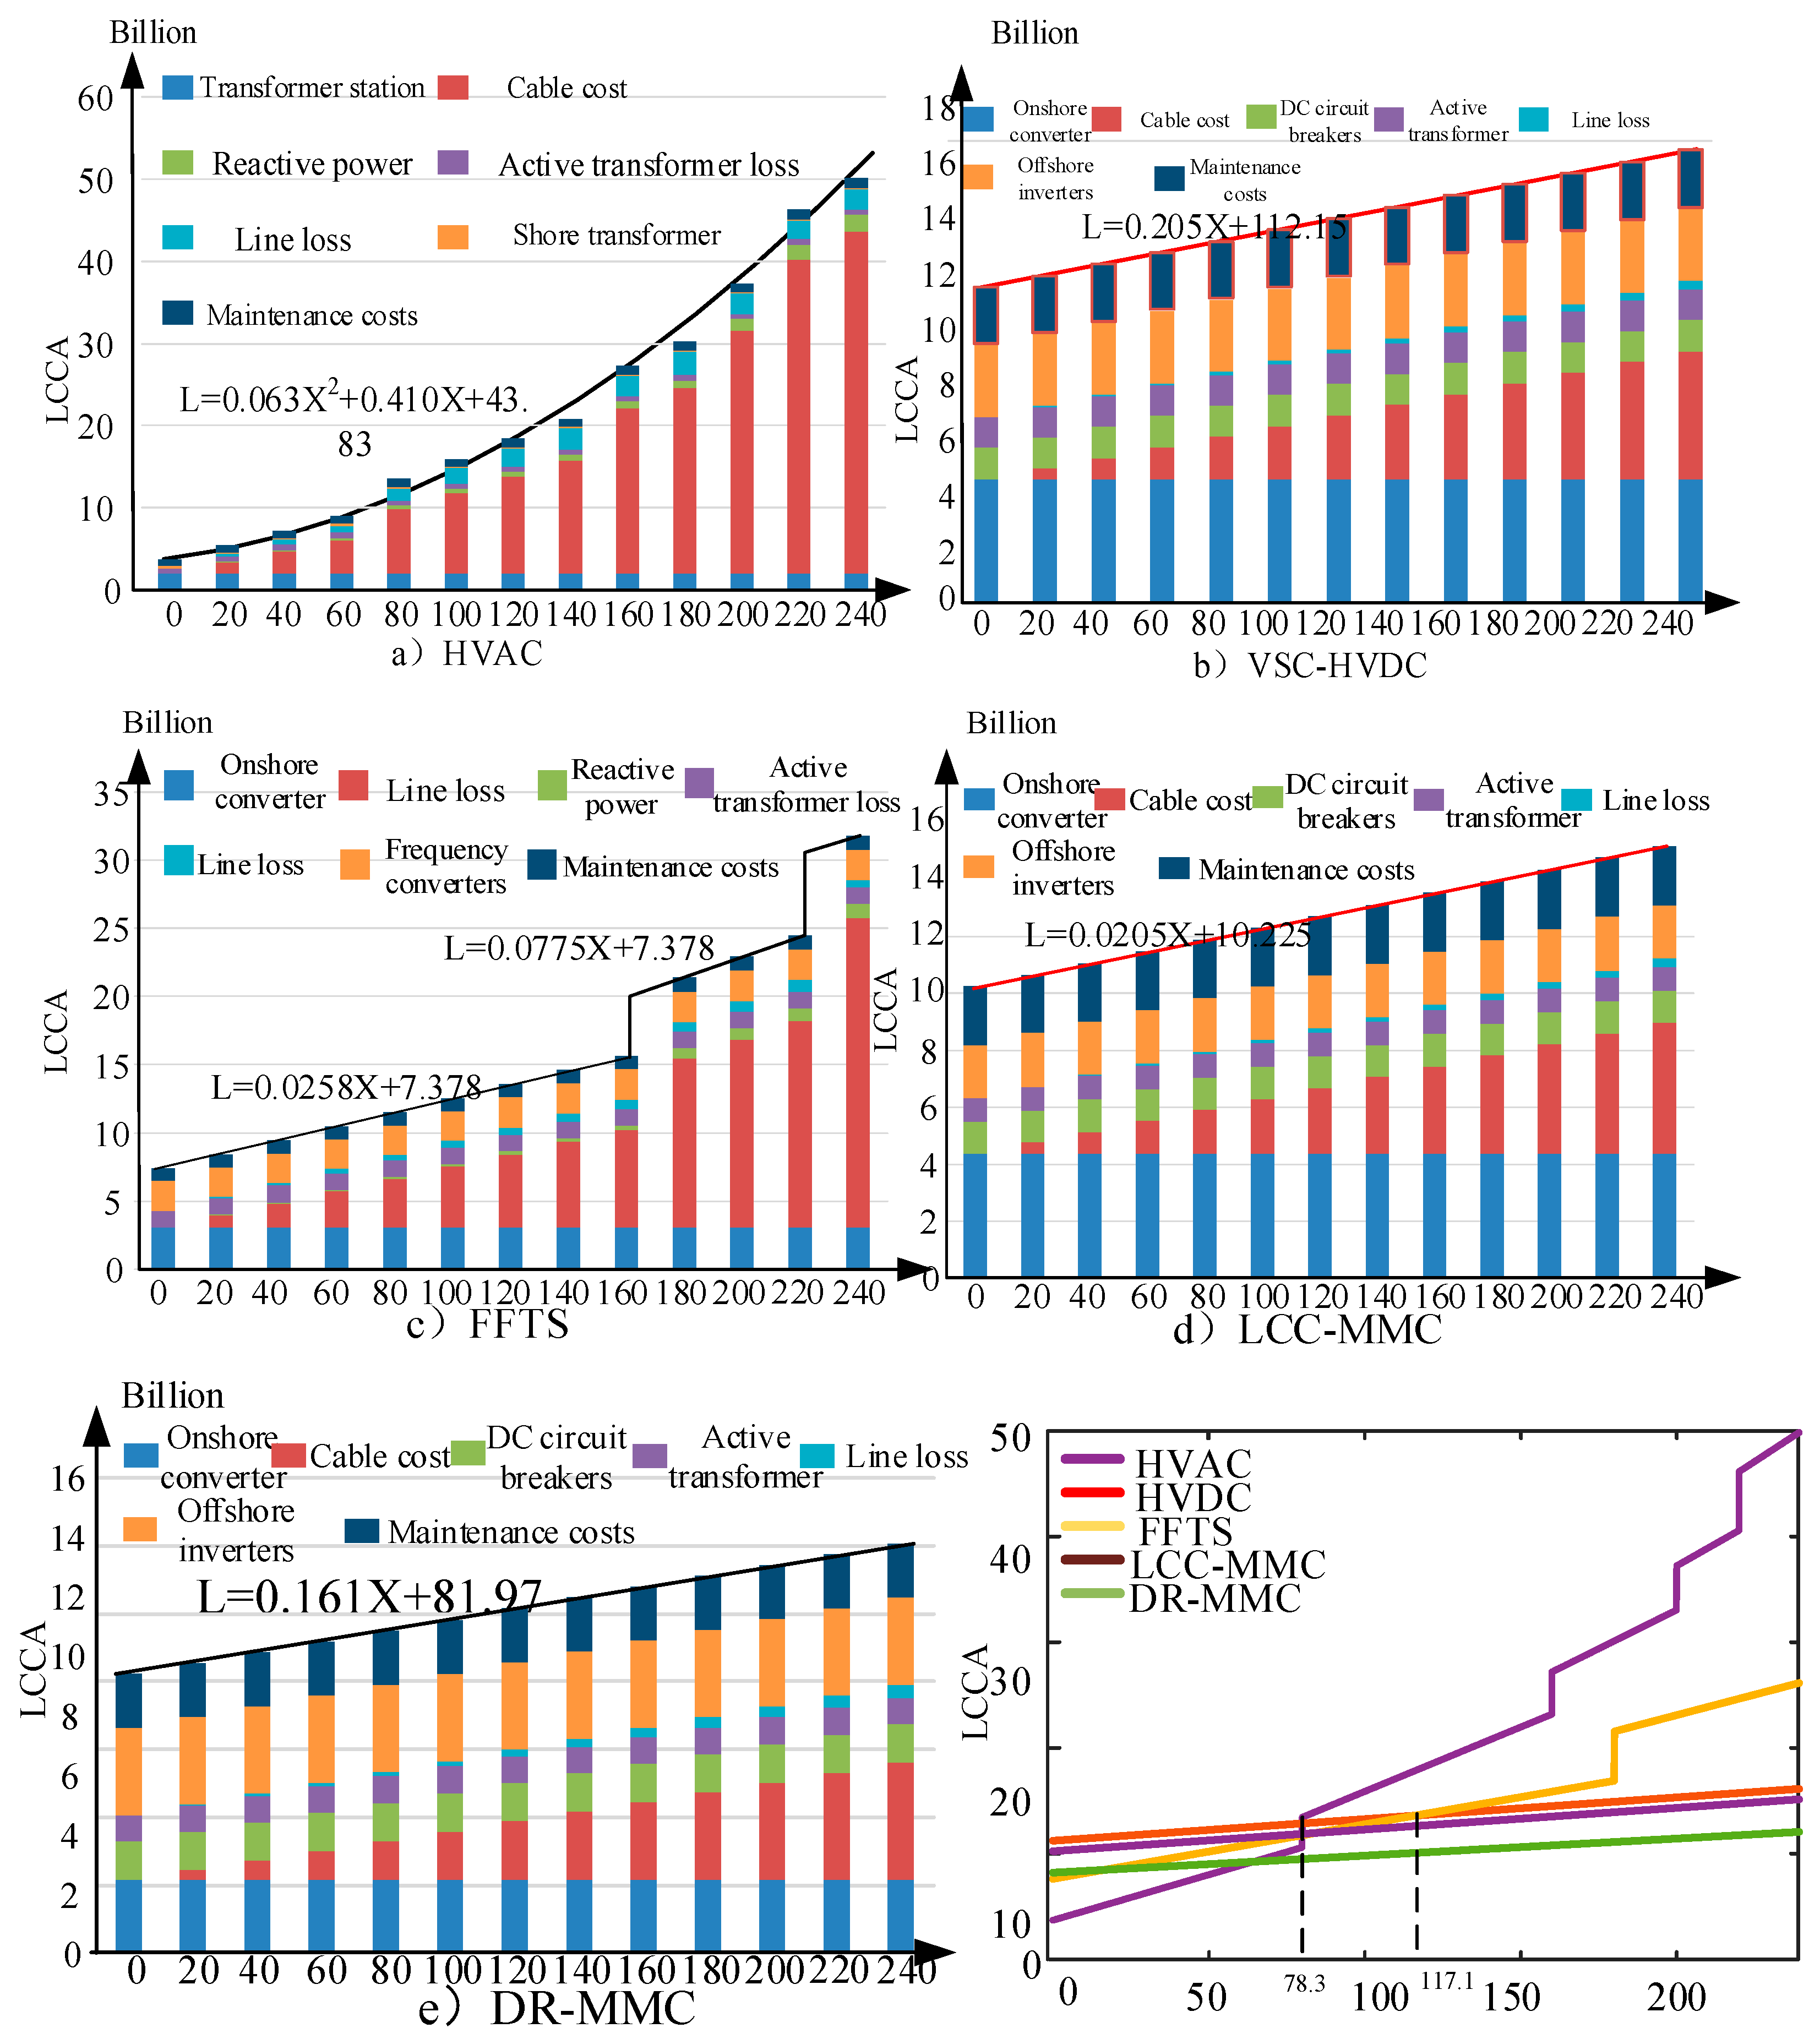
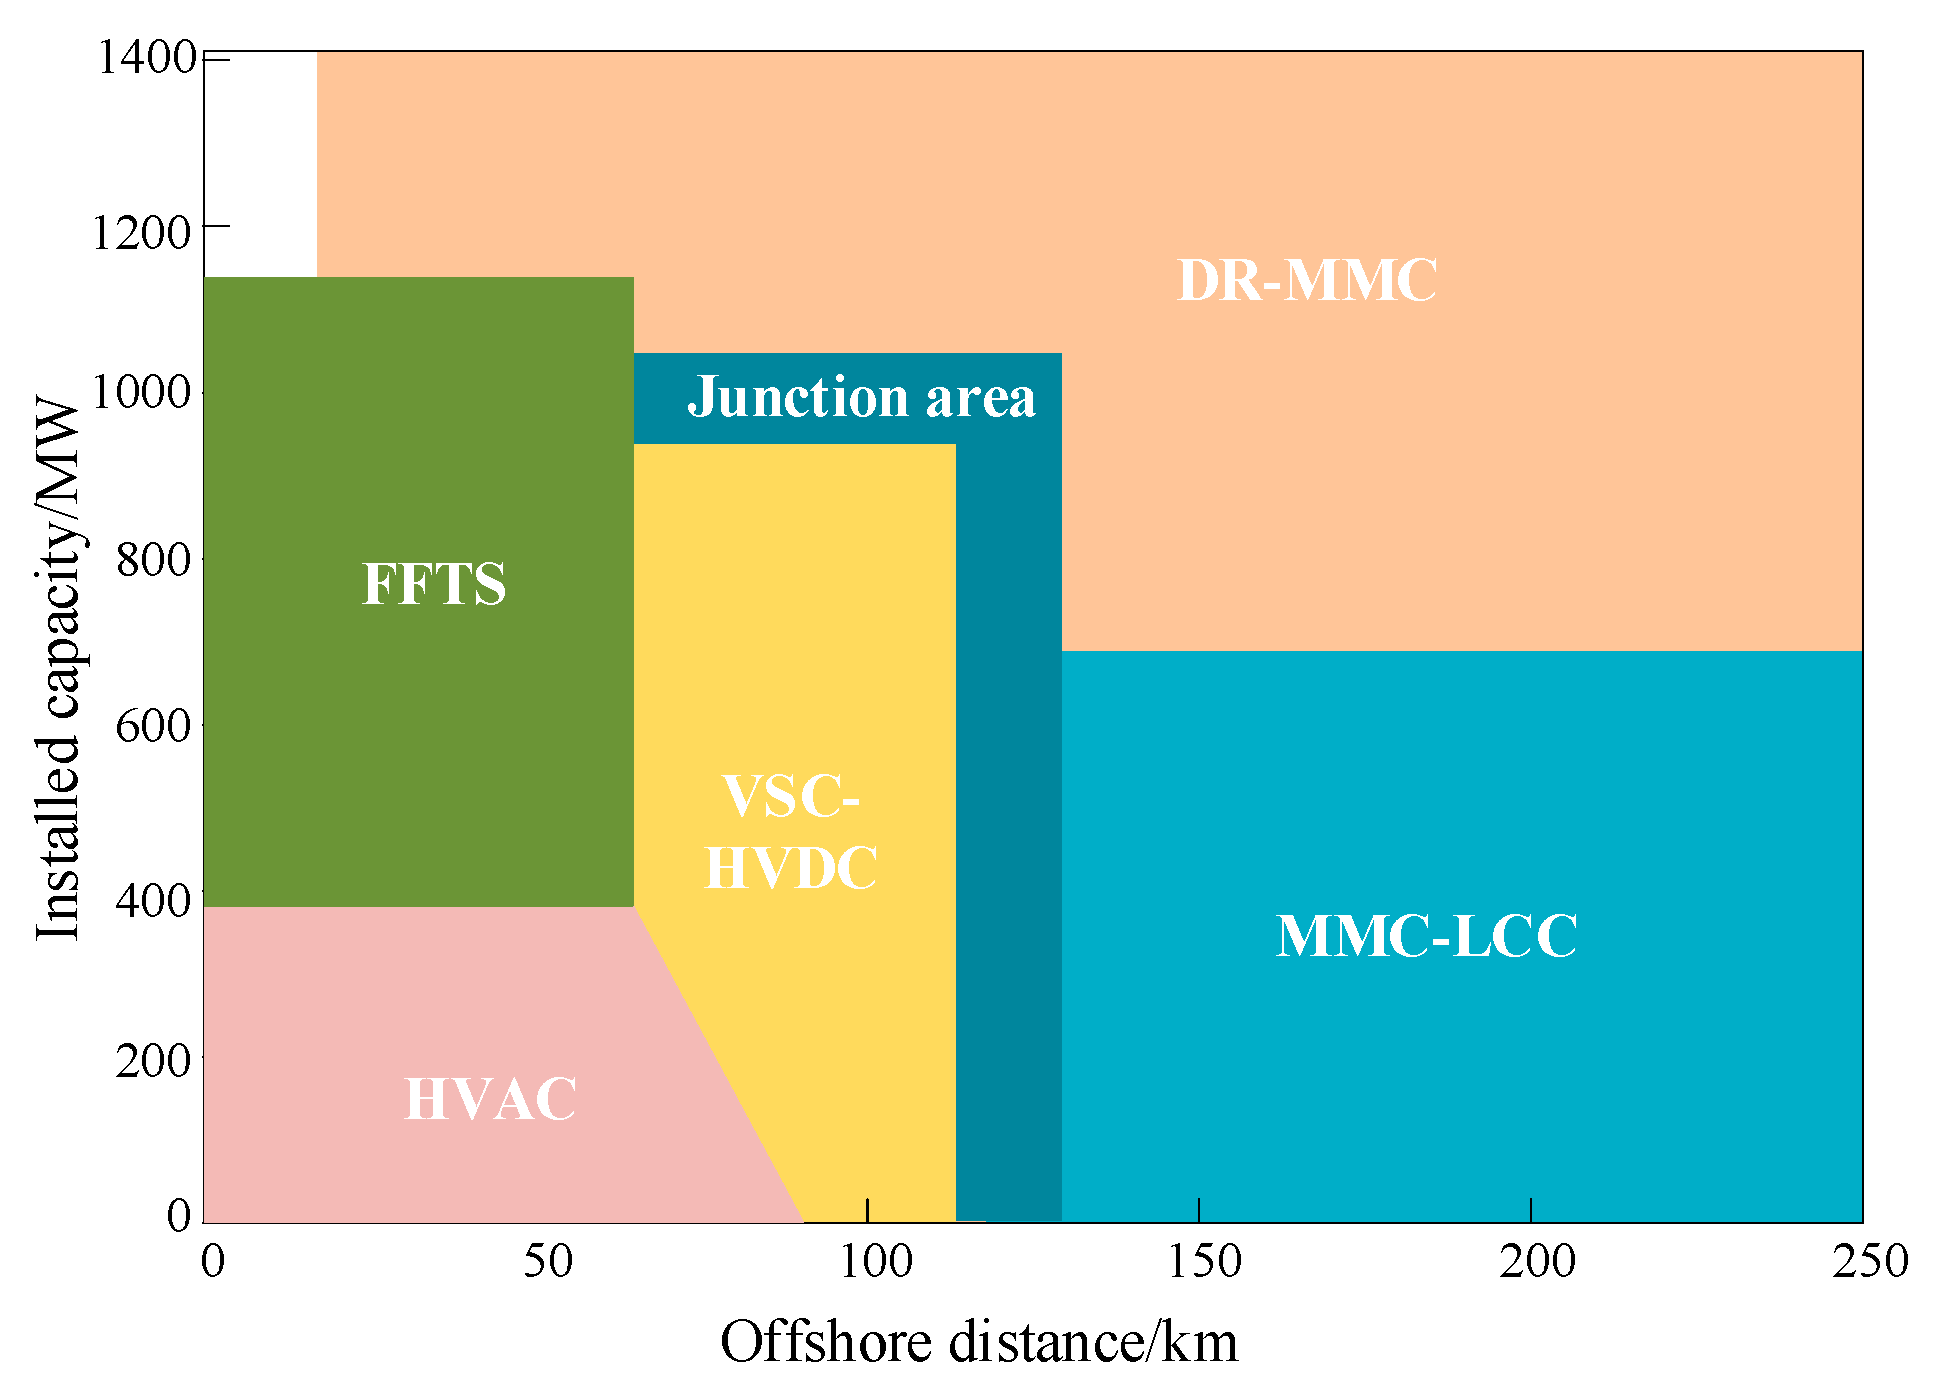
4.1. Relationship between LCCA Investment Cost and Distance

When the 3.6 GW large wind farm changes with distance, its life cycle analysis model (LCCA) investment cost changes are shown in Figure 4.
Figure 4 shows that the total HVAC cost exhibits an approximate quadratic relationship with distance, whereas the DC output scheme follows a linear pattern. The initial point of significant deviation in the FFTS curve occurs at 160 km, primarily attributed to the augmentation in the circuit count and cable cost. A comparative analysis of the HVAC, VSC-HVDC, and FFTS reveals that the FFTS economic range spans approximately 80–117 km. The acquisition cost of FFTS converters approximates VSC-HVDC, while the line cost aligns with the HVAC. The transmission capacity of DC lines is robust, and DC grid-connected systems demonstrate superior economics over AC grid-connected systems for distances exceeding 120 km. The DR is minimal, facilitating simplified platform construction, with costs of approximately 70% of comparable VSC-HVDC systems. As DR installed capacity increases, the number of transmission lines required for equivalent capacity decreases, resulting in a lower incremental cost per distance than VSC-HVDC and MMC-LCC. The MMC-LCC converter construction cost is comparable to VSC-HVDC. Nevertheless, the larger installed capacity of the onshore converter LCC reduces the number of converters, thereby minimizing construction and maintenance expenses.

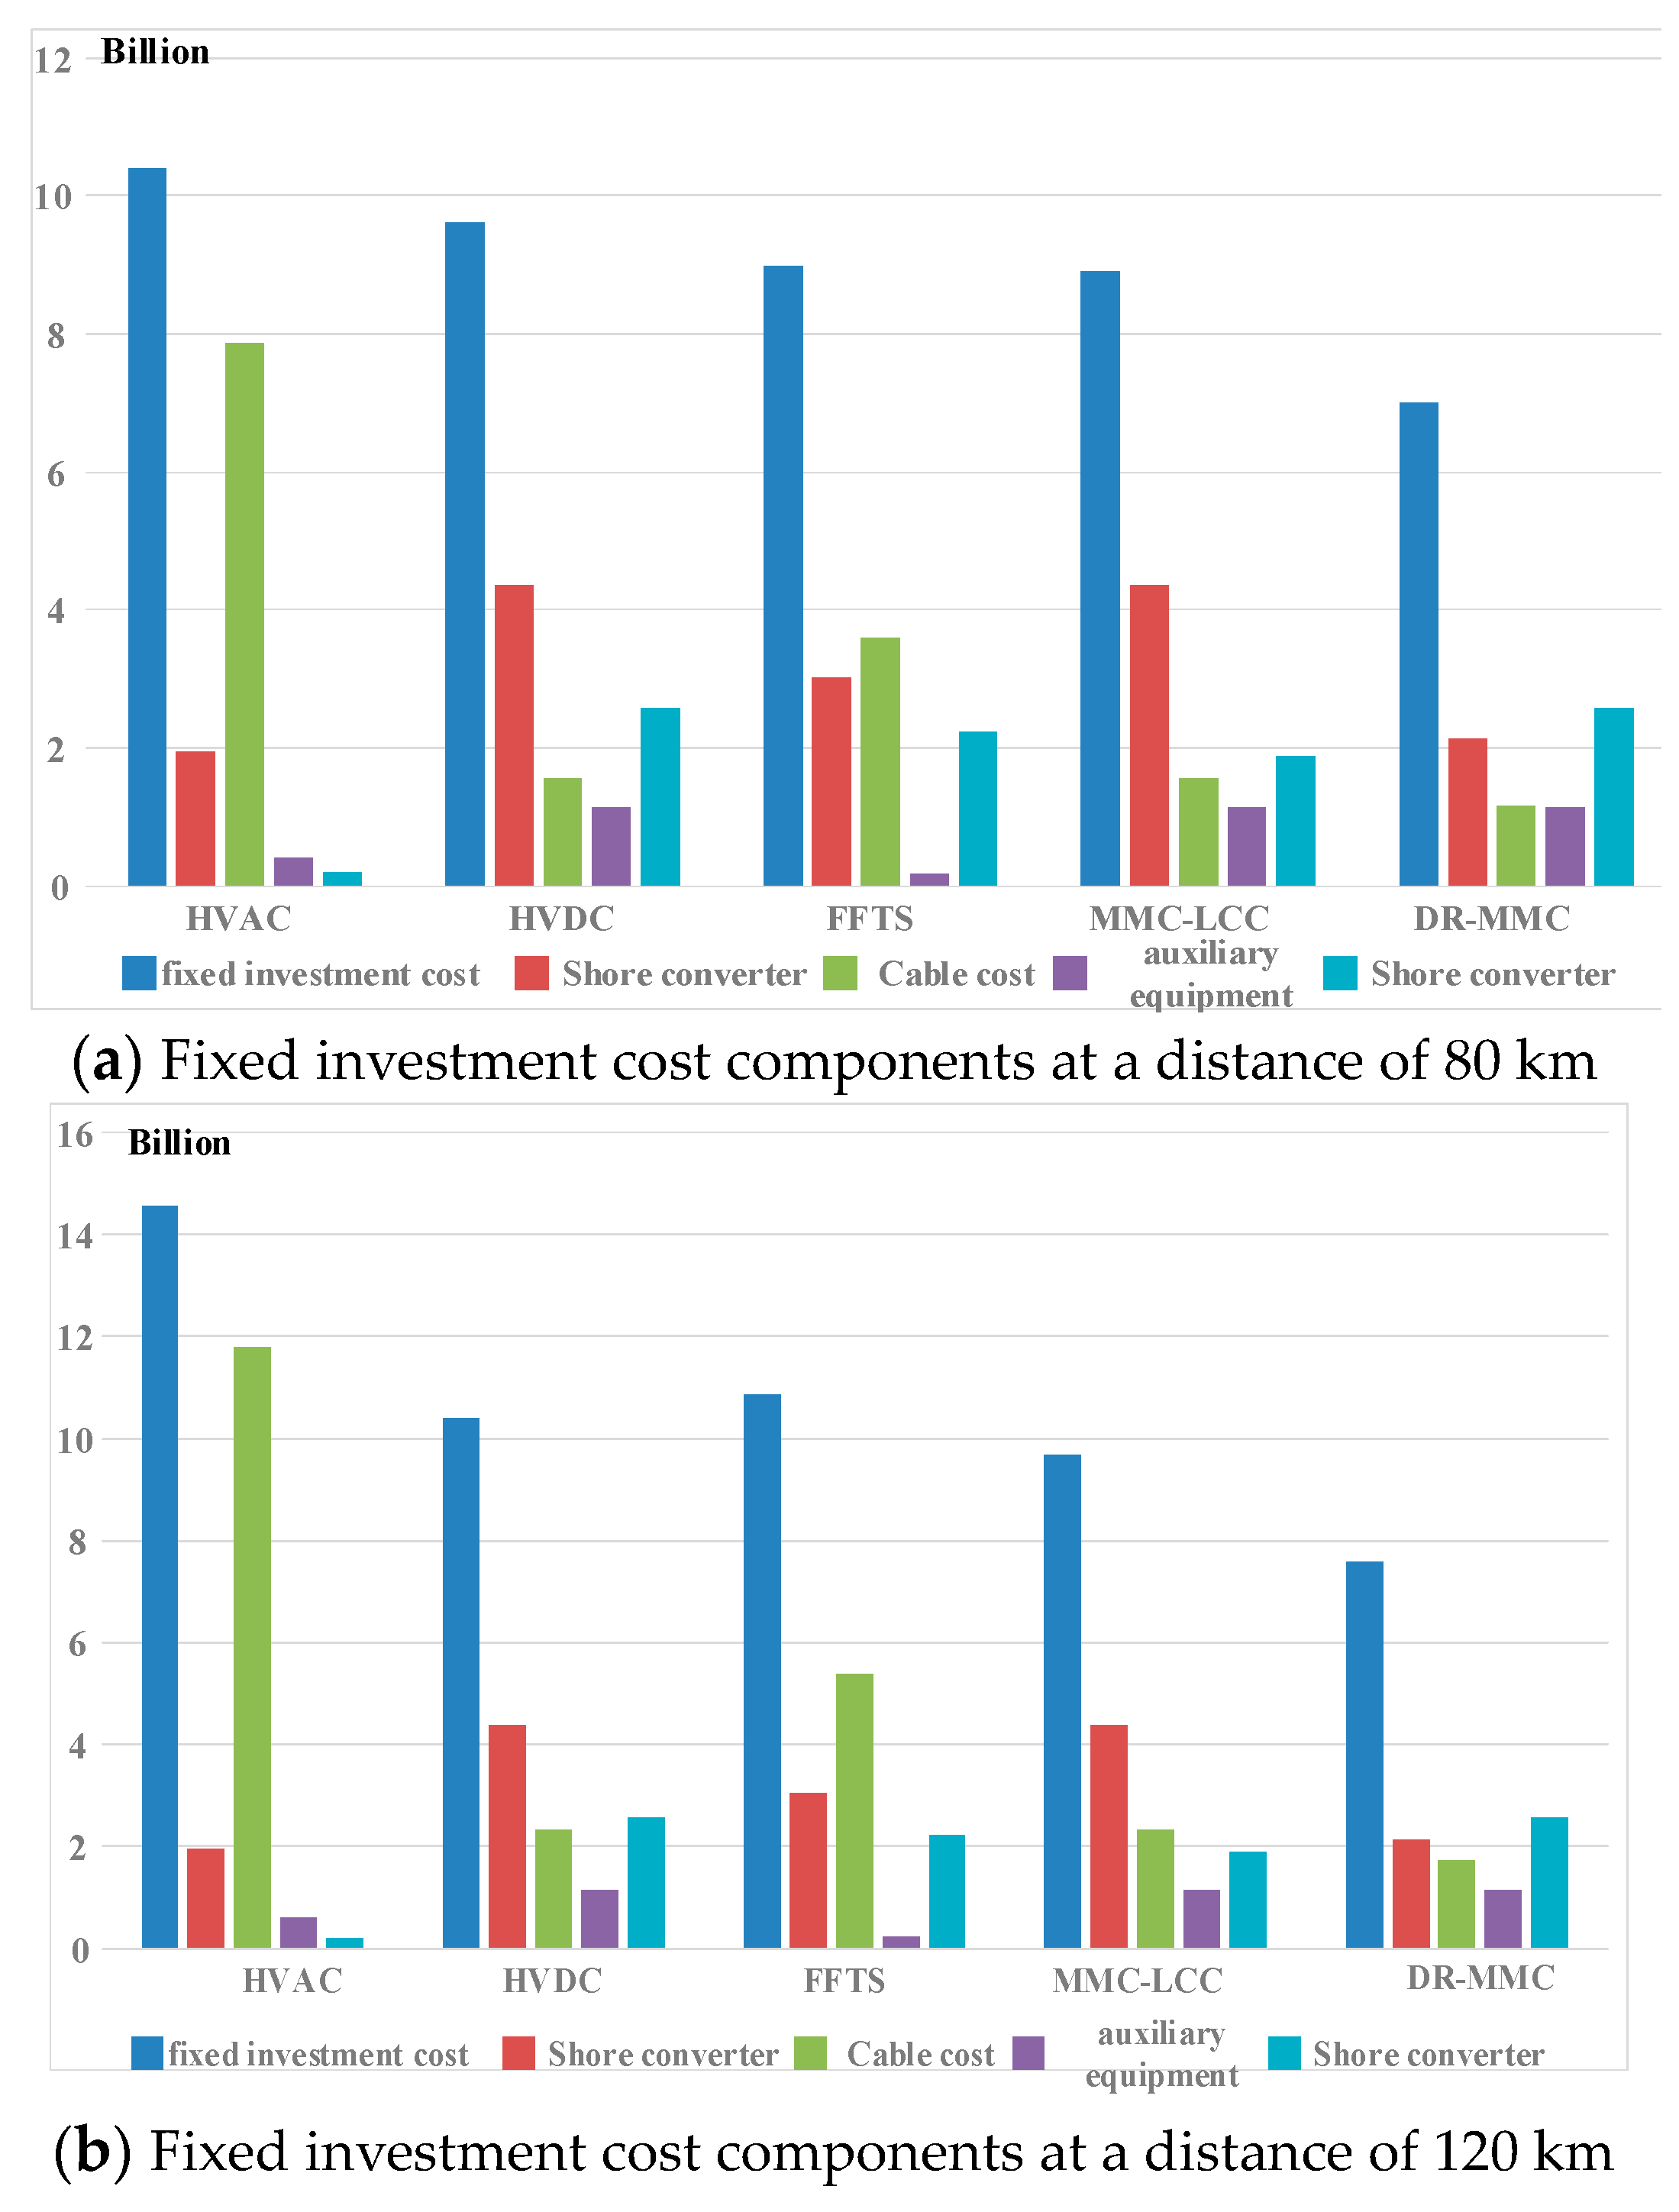
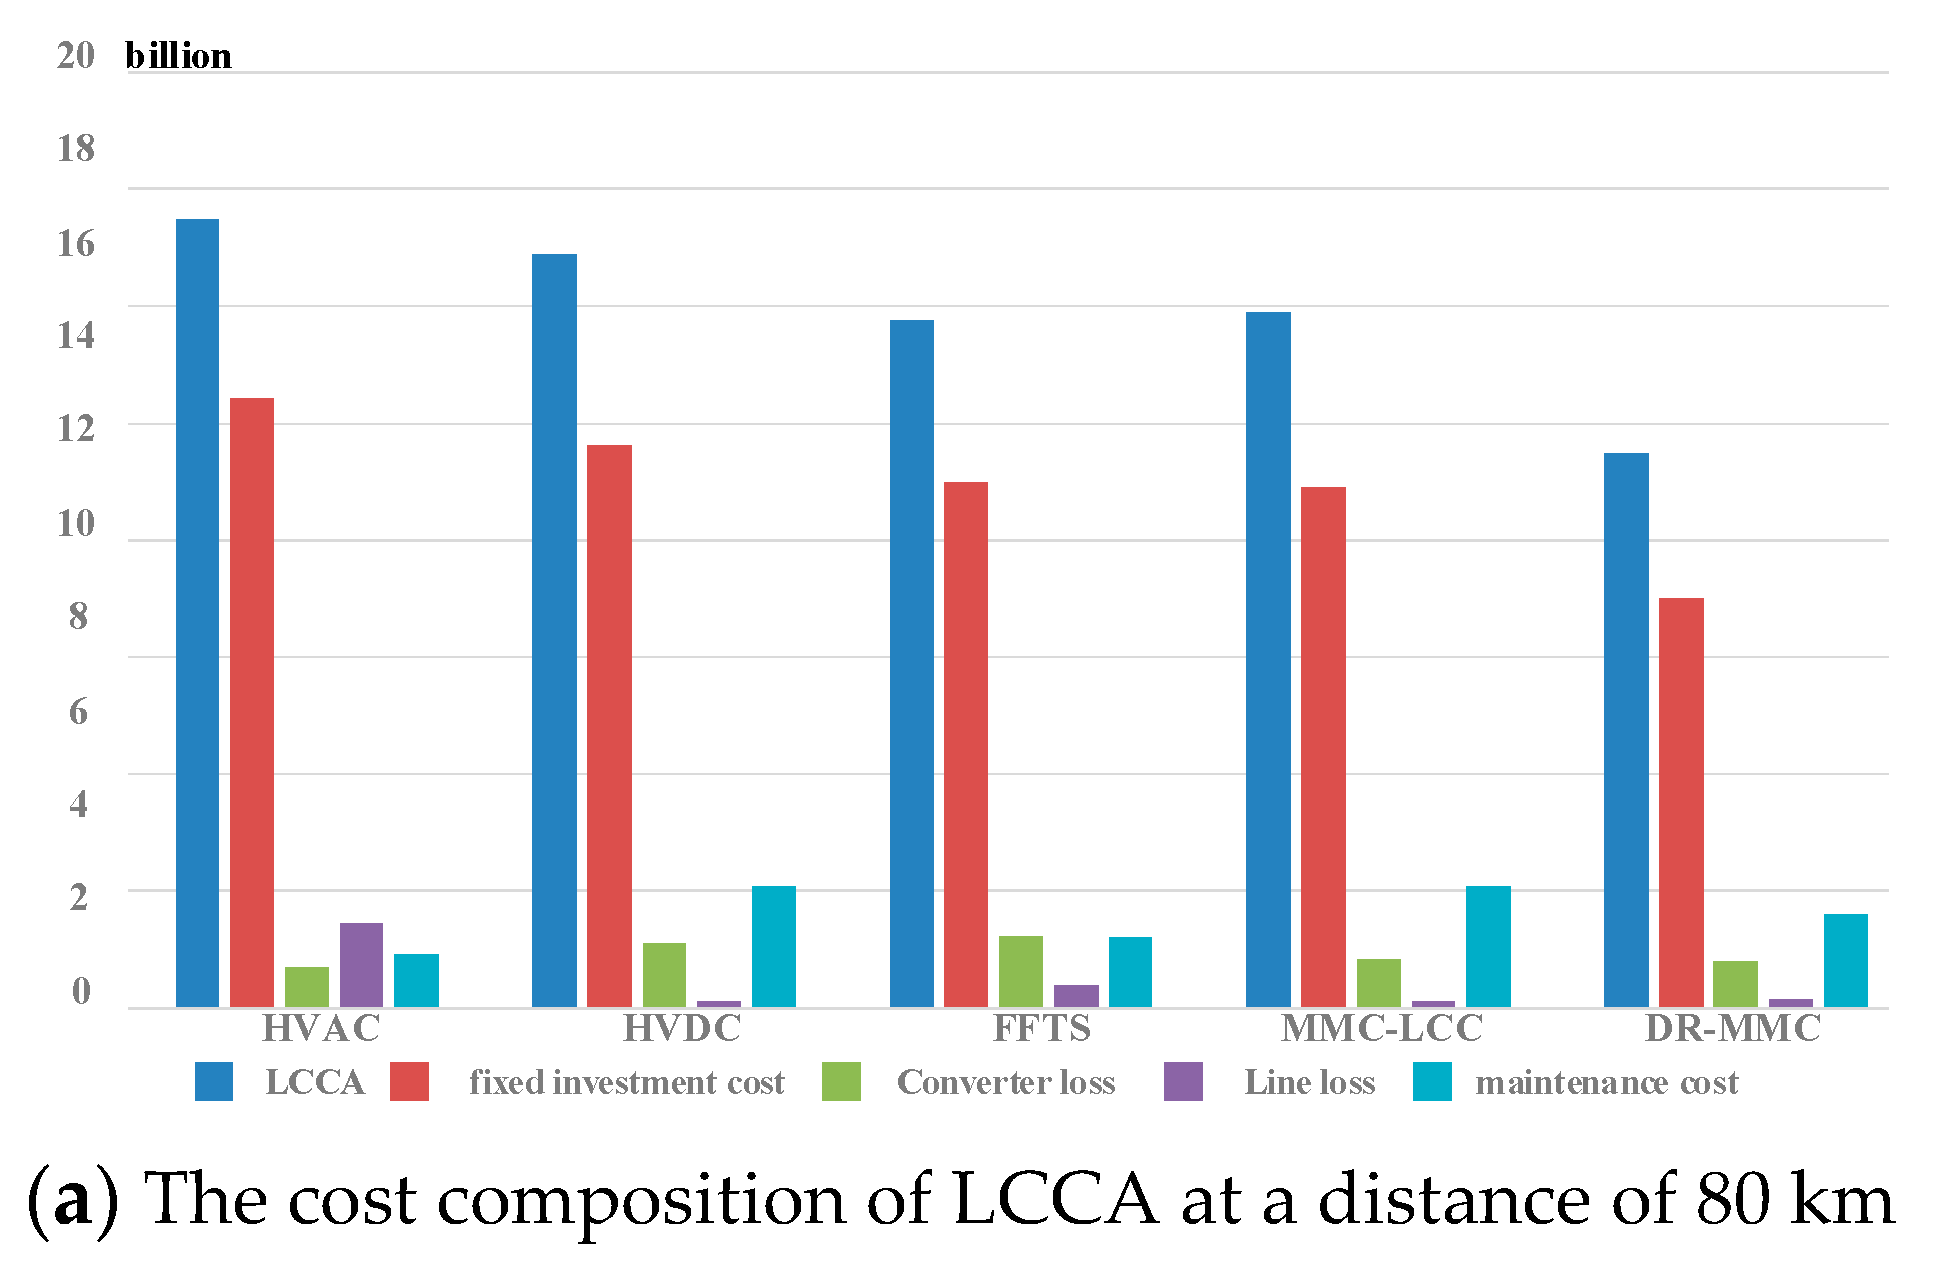
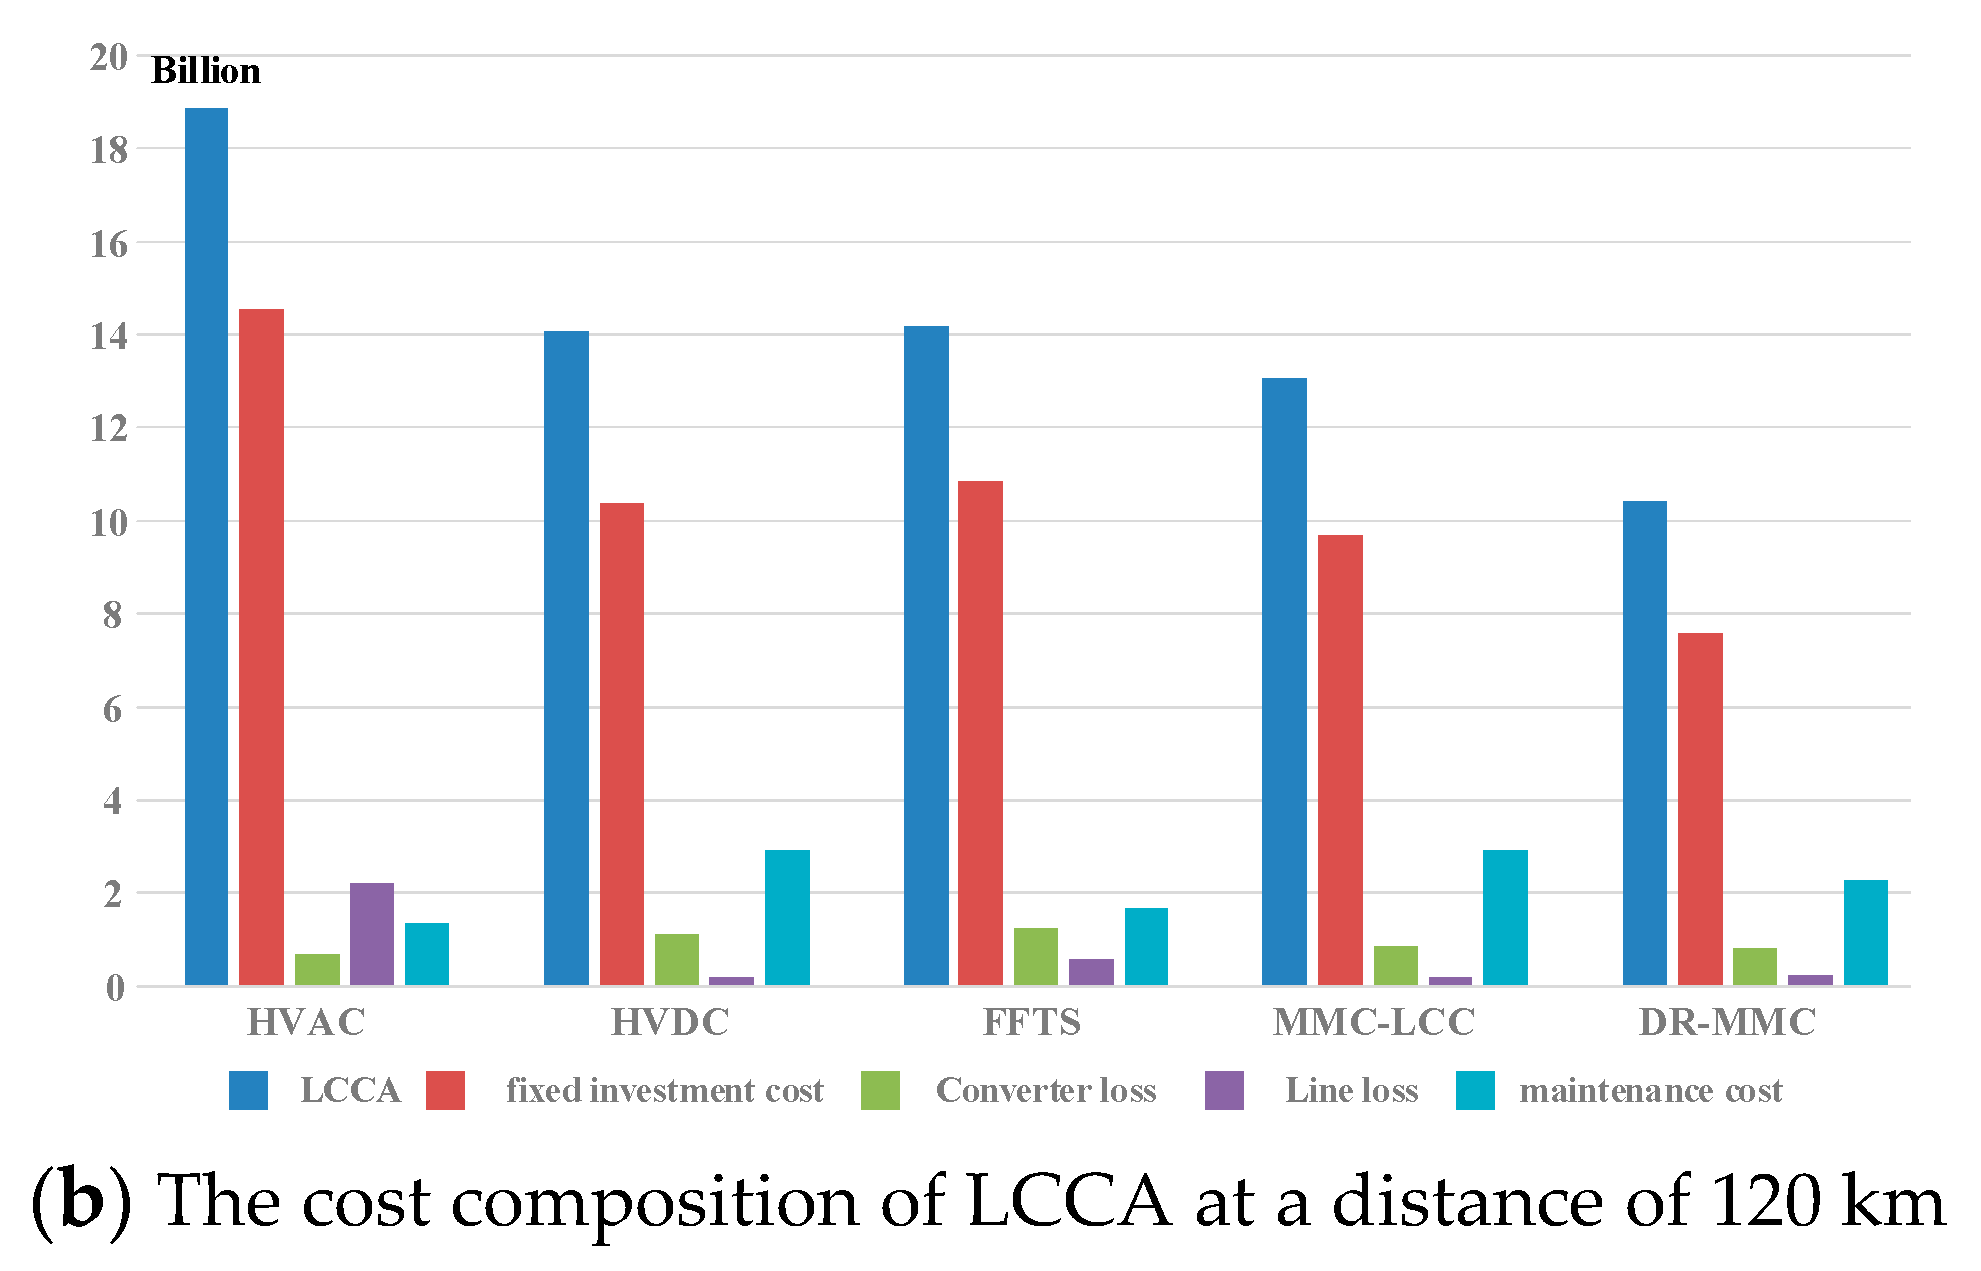
4.2. Analysis of Cost Components of Various Equipments

With the objective of illuminating the economic viability of various transmission systems at varying distances, this paper evaluates the total fixed investment, inclusive of wind turbines, for five distinct delivery schemes at wind power distances of 80 km and 120 km. The composition of these investments is depicted in Figure 5, providing a comprehensive overview of the costs associated with each delivery method.
Observing Figure 5a, it becomes apparent that at a wind farm distance of 120 km, the construction costs of HVAC and VSC-HVDC exhibit comparable patterns. Notably, the economics of the FFTS delivery scheme significantly outperform the preceding two. Additionally, the high cost of the working platform contributes considerably to the economic benefits of the MMC-LCC hybrid delivery approach.
Figure 5b provides a clear order of fixed investment in wind power delivery schemes at a distance of 120 km: FFTS > VSC-HVDC > MMC-LCC > DR-MMC. This information is crucial for understanding the financial implications of each scheme.
As depicted in Figure 6, HVAC and FFTS stand out regarding maintenance cost advantages over DC power transmission, offering more straightforward and convenient booster station maintenance. Regarding loss costs, which encompass line loss and converter loss, the hierarchy is as follows: HVAC > DR-MMC > MMC-LCC > FFTS > VSC-HVDC. Specifically, in terms of line loss, DC lines incur significantly lower losses than AC lines.
Utilizing the previously mentioned variable parameters of offshore distance and installed capacity, this study defines the operational boundaries of the five proposed types of offshore wind power, as illustrated in Figure 7. HVAC emerges as the economically preferable option within the offshore wind power domain (depicted in pink), where an installed capacity of 200 MW and an offshore distance of 50 km are assumed. Conversely, the FFTS scheme demonstrates superior economic viability for consistent offshore distances in scenarios necessitating high-capacity transmission. In contexts characterized by low capacity and medium to long transmission distances (depicted in yellow), adopting flexible DC transmission emerges as an informed choice from both economic and technical perspectives. Moreover, at transmission distances surpassing 130 km (illustrated in orange and blue), the financial feasibility of DC transmission becomes conspicuous for schemes 4 and 5, particularly with the parallel deployment of DR-MMC technology.

5. Conclusions

In the present study, a comprehensive life cycle cost analysis model was implemented. Utilizing a 3.6 GW large wind power base as a case study, the economic viability of five distinct wind power transmission schemes was thoroughly calculated, analyzed, and compared, thereby elucidating their respective economic application ranges.
The findings indicate that the HVAC scheme is economically feasible within a distance range of 80 km, whereas the FFTS scheme excels between approximately 80 and 110 km. Notably, the DR-MMC, which relies on an uncontrolled rectifier diode, outperforms the VSC-HVDC in terms of installed capacity, maintenance cost, and converter pricing. Furthermore, the MMC-LCC scheme boasts a considerable cost advantage in the shore converter segment, though it is prone to the risk of commutation failure.
This paper serves as a valuable reference for policymakers in the offshore wind energy development sector. It offers guidance on operational control, site planning, and regional layout considerations for offshore wind projects. Additionally, it provides crucial data support for the planning, construction, and operation of future offshore wind power transmission projects that employ DR-MMC multi-terminal hybrid DC technology. In doing so, it holds significant theoretical value and practical importance in advancing the offshore wind energy industry.

Author Contributions

Conceptualization, X.J., D.L., H.L., P.X., D.T., P.H., H.M. and B.W.; methodology, X.J., D.L., H.L., P.X., D.T., P.H., H.M. and B.W.; software, X.J., D.L., H.L., P.X., D.T., P.H., H.M. and B.W.; validation, X.J., D.L., H.L., P.X., D.T., P.H., H.M. and B.W.; writing—original draft preparation, X.J., D.L., H.L., P.X., D.T., P.H., H.M. and B.W. All authors have read and agreed to the published version of the manuscript.

Funding

This work was funded by the State Grid Headquarters Science and Technology Project (No. 5400-202122573A-0-5-SF).

Data Availability Statement

The original contributions presented in the study are included in the article, further inquiries can be directed to the corresponding author.

Conflicts of Interest

Author Xiaotong Ji was employed by the company State Grid Hubei Electric Power Co., Ltd. The remaining authors declare that the research was conducted in the absence of any commercial or financial relationships that could be construed as a potential conflict of interest.

References

  1. Yang, L.; Xu, Y.; Sun, H.; Wu, W. Tractable Convex Approximations for Distributionally Robust Joint Chance-Constrained Optimal Power Flow Under Uncertainty. IEEE Trans. Power Syst. 2022, 37, 1927–1941. [Google Scholar] [CrossRef]
  2. Wang, X. Sunshine of the rising sun and bright time—Review and prospect of China’s wind power industry in 2020. Energy 2021, 2, 60–65. [Google Scholar]
  3. Yang, L.; Xu, Y.; Zhou, J.; Sun, H. Distributionally Robust Frequency Constrained Scheduling for an Integrated Electricity-Gas System. IEEE Trans. Smart Grid 2022, 13, 2730–2743. [Google Scholar] [CrossRef]
  4. Bell, K.R.W.; Xu, L.; Houghton, T. Considerations in design of an network. CIGRE Sci. Eng. 2015, 1, 79–92. [Google Scholar]
  5. Chen, M.; She, S.; Liu, X. Economical assessment on redundancy configuration of main transformers for wind farm based on life cycle cost. Autom. Eletr. Power Syst. 2015, 14, 168–174. [Google Scholar]
  6. Li, X.; Liang, S.; Li, Y.; Yao, L.; Huang, R.; Wang, Z. Start-up strategy for DR-MMC paralleled hybrid HVDC integrated with wind power. In Proceedings of the 2020 IEEE 4th Conference on Energy Internet and Energy System Integration (EI2), Wuhan, China, 30 October–1 November 2020; pp. 665–669. [Google Scholar]
  7. Lauria, S.; Schembari, M.; Palone, F. Very long distance connection of gigawatt size wind farms: Extra high-voltage AC versus high-voltage DC cost comparison. IET Renew. Power Gener. 2016, 10, 713–720. [Google Scholar] [CrossRef]
  8. Parker, M.A.; Olimpo, A.L. Cost and losses associated with wind farm collection networks which centralize the turbine power electronic converters. IET Renew. Power Gener. 2013, 7, 390–400. [Google Scholar] [CrossRef]
  9. Zhang, Z.; Guo, J.; Zhu, H.; Ai, Q.; Gao, Y. Optimization analysis of wind grid connecting scheme based on full life cycle cost. Power Syst. Prot. Control 2017, 45, 51–57. [Google Scholar]
  10. Wang, X.; Liu, S.; Song, Z.; Ning, L.; Wang, B.; Lu, M. Technical and economical analysis on wind power system integrated via fractional frequency transmission system. Autom. Electr. Power Syst. 2015, 39, 43–50. [Google Scholar]
  11. Li, X.; Yao, L.; Cheng, F. Economic analysis of multi-type DC system topologies for wind power transmission. J. Glob. Energy Interconnect. 2021, 4, 10. [Google Scholar]
  12. Yang, F.; Zhang, Y.; Ge, X. Analysis of VSC-HVDC technology for off-shore wind power in Germany. Power Grid Clean. Energy 2012, 28, 63–68+73. [Google Scholar]
  13. Tang, W.; Yan, S.; Guo, X.; Shi, S.; Wang, S. Re-rch on technical economy of key equipment of multi-base view wind power base. China Electr. Power 2021, 12, 1–7. [Google Scholar]
  14. Shinoda, K.; Ismail, B.; Bertinato, A.; Torwelle, P.; Garcia, W.R.L.; Van Doorn, J.; Kryezi, F. North Wind Power Hub Feasibility Study: AC and DC Interconnection Comparison (Part III). In Proceedings of the 2022 IEEE International Conference on Renewable Energies and Smart Technologies (REST), Tirana, Albania, 28–29 July 2022; pp. 1–5. [Google Scholar]
  15. Wang, X.; Zhang, X.; Ning, L.; Zhu, W.; Wang, X. Prospect and challenge of frequency division power transmission in wind power grid ap-plication. Electr. Power Eng. Technol. 2017, 36, 15–19. [Google Scholar]
  16. Iván, A.A.; Ruben, P.G.; Blasco-Gimenez, R.; Javier, R.A. Control strategy of a HVDC-Diode Rectifier connected type-4 wind farm. In Proceedings of the 2015 IEEE and International Future Energy Electronics Conference (IFEEC), Taipei, Taiwan, 1–4 November 2015; pp. 1–6. [Google Scholar]
  17. Negra, N.; Todorovic, J.; Ackermann, T. Loss evaluation of HV AC and HVDC transmission solutions for large wind farms. Electr. Power Syst. Res. 2006, 76, 916–927. [Google Scholar] [CrossRef]
  18. Wang, X.; Wei, X.; Meng, Y. Experiment on Grid-Connection Process of Wind Turbines in Fractional Frequency Wind Power System. IEEE Trans. Energy Convers. 2015, 30, 22–31. [Google Scholar] [CrossRef]
  19. Van, E.B.; Van, H.D.; Reza, A.M. Economic comparison of VSC HVDC and HVAC as transmission system for a 300 MW wind farm. Eur. Trans. Electr. Power 2010, 20, 661–671. [Google Scholar]
  20. Hugo, D.; Soares, C.G. Review of the current status, technology and future trends of wind farms. Ocean. Eng. 2020, 209, 107381. [Google Scholar]
  21. Xiang, X.; Merlin, M.C.; Green, T.C. Cost analysis and comparison of HVAC, LFAC and HVDC for wind power connection. In Proceedings of the Iet International Conference on Ac & Dc Power Transmission, IET, Beijing, China, 28–29 May 2016. [Google Scholar]
  22. Xu, J.; Wei, G.; Jin, Y. Connection mode and economic analysis of jiangsu rudong wind power farm. High. Volt. Tech-Neology 2017, 43, 74–81. [Google Scholar]
  23. Huang, M.; Wang, X.; Liu, S. Technical and economic analysis of frequency division transmission application in deep wind power connection. Autom. Electr. Power Syst. 2019, 43, 167–174. [Google Scholar] [CrossRef]
  24. Jovcicd, A. High-Voltage Direct Current Transmission: Converters, Systems and DC Grid; Wiley: Scotland, UK, 2015; pp. 306–307. [Google Scholar]
  25. Liu, S.; Wang, X.; Ning, L. Integrating wind power via fractional frequency transmission system. IEEE Trans. Power Transm. 2017, 32, 1253–1261. [Google Scholar] [CrossRef]
  26. Bresesti, P.; Kling, W.L.; Hendriks, R.L. HVDC connection of wind farms to the transmission system. IEEE Trans. Energy Convers. 2007, 22, 37–43. [Google Scholar] [CrossRef]
  27. Apostolaki-iosifidou, E.; Mccormack, R.; Kempton, W. Transmission design and analysis for large-scale wind energy development. IEEE Trans. Power Syst. J. 2019, 6, 22–31. [Google Scholar] [CrossRef]
  28. Wang, X.; Teng, Y.; Ning, L. Feasibility of integrating large wind farm via fractional frequency transmission system a case study. Int. Trans. Electr. Energy Syst. 2013, 23, 10625–10631. [Google Scholar] [CrossRef]
  29. Ngo, T.; Min, L.; Santoso, S. Steady-state analysis and performance of low frequency AC transmission lines. IEEE Trans. Power Syst. 2016, 31, 3873–3880. [Google Scholar] [CrossRef]
  30. Zhang, Z.; Jin, Y.; Xu, Z. Design of main circuit parameters for modular multilevel matrix converter in LFAC system. IEEE Trans. Circuits Syst. II Express Briefs 2022, 69, 3864–3868. [Google Scholar] [CrossRef]
  31. Cai, R.; Zhang, L.; Cheng, M.; Yang, X.; Ren, D. Technical and economic rerch on AC collector scheme for 66 kV wind power. Glob. Energy Internet 2019, 2, 155–162. [Google Scholar]
Figure 1. Diagram of wind farm and connection point.
Processes 12 01594 g001
Figure 2. Topology of kinds of wind grid integration scheme.
Processes 12 01594 g002
Figure 3. Life cycle cost composition of wind power grid-connected scheme.
Processes 12 01594 g003
Figure 4. LCCA investment cost change chart.
Processes 12 01594 g004
Figure 5. Life cycle cost composition of wind power grid-connected scheme.
Processes 12 01594 g005
Figure 6. Total cost composition of wind power grid-connected scheme LCCA.
Processes 12 01594 g006aProcesses 12 01594 g006b
Figure 7. Five types of offshore wind power are suitable for AC/DC transmission.
Processes 12 01594 g007
Table 1. Comparison of the investment cost of different converter topologies.
ProjectMMCM3CDR
Converter cost2.82.21.6
Filter cost000.18
Total2.82.21.78
Table 2. Cost of converter or booster station.
Grid-TypeConverterOnshore Converter
HVAC(43.9 + 0.40ST) × 1060.32ST × 106
VSC-HVDC(219.5 + 0.97ST) × 1060.715ST × 106
FFTS(43.9 + 0.79ST) × 1060.753ST × 106
MMC-LCC(219.5 + 0.97ST) × 1060.52ST × 106
DR-MMC(80 + 0.53ST) × 1060.715 × 106
Table 3. Breakdown maintenance downtime for different equipment [24,25,26].
Grid-Connected TypeMaintenance Outage t/DayMaintenance Cost/%Average Time to Rectify Faults TE/DayAnnual Failure Probability %/Year
Onshore converterLCC150.5151
MMC150.5151
ConverterMMC301.5302
DR2430241.5
Transformer150.5300.8
Onshore transformer70.2300.8
Low-frequency transformer150.5300.8
Inverter M3C150.5151.2
AC cable10---300.8
DC cable10---300.8
Table 4. Main parameters of IGBT products of ABB companies.
ABB-IGBTVCES(V)IC(A)VCES(V)IC(A)
5SNA1500E3303053300150033001500
5SNA1800E3304003300180033002000
5SNA3000K452300450030004500800
5SJA3000L5203005200300045001200
5SNA1000G650300650010006500750
Table 5. The ratio of converter loss cost for each transmission scheme.
Grid-Connected TypeHVACVSC-HVDCFFTSMMC-LCCDR-MMC
Converter/%0.41.30.131.30.55
Onshore converter/%0.41.31.50.641.3
Disclaimer/Publisher’s Note: The statements, opinions and data contained in all publications are solely those of the individual author(s) and contributor(s) and not of MDPI and/or the editor(s). MDPI and/or the editor(s) disclaim responsibility for any injury to people or property resulting from any ideas, methods, instructions or products referred to in the content.

