
Development of a Value Stream Map to Optimize the Production Process in a Luxury Metal Piece Manufacturing Company


Abstract
1. Introduction
2. Literature Review
2.1. Toyota Production System and Lean Manufacturing
2.1.1. The Origins of Lean
2.1.2. The Eight Wastes
- i.
- Overproduction: Producing more than demand, resulting in excess stock and loss of resources.
- ii.
- Waiting: Time spent waiting, whether for work, orders, or accessories, jeopardizes the flow of value.
- iii.
- Transport: Moving materials between locations consumes time and money.
- iv.
- Over-processing: Doing more than is necessary, generating additional costs and wasting resources.
- v.
- Inventory: Keeping excessive stocks, increasing waiting time and space, and making it difficult to identify problems.
- vi.
- Defects: Inadequate final products or services, resulting in rework and additional costs.
- vii.
- Unnecessary movements: Movements of people or equipment that do not add value, resulting in wasted movement.
- viii.
- Waste of talent and skills: Under-utilization of workers’ skills, resulting in loss of motivation and ideas. This category was initially defined by [11], with the eighth waste being identified as employee underutilization, indicating that people’s skills and capabilities are not properly used.
2.1.3. Lean Tools
2.2. Value Stream Mapping
2.2.1. Historic Evolution
2.2.2. VSM Objectives and Associated KPI
2.2.3. VSM Symbols
- Process or production flow: Shows the flow of materials throughout the production process.
- Communication or information flow: Identifies all communication within the value stream.
- Timeline and distance traveled: Represents the execution time of the process, the total cycle time, and the physical distance traveled by the product or people within the process.
2.2.4. Implementation Method
- Product or Product Family Selection: A product or product family with common processing steps and equipment is chosen. The chosen product family, the number of parts, customer demand, and delivery frequency are documented. Value Stream Mapping involves touring the factory and outlining the processing steps from input to output.
- Drawing the Current State Representation: A map is created representing the current state of the value stream, identifying and mapping each step of the process from raw materials to the final product. This detailed drawing reveals areas of waste, inefficiencies, and bottlenecks. The steps are categorized and associated with metrics such as time, distance, and involvement of people. The process includes gathering customer requirements, detailing the physical flow, mapping the supply of materials, and identifying information flows and push/pull systems
- Value Stream Design (VSD): Once the current state is understood, the desired future state is designed, eliminating inefficiencies and developing an optimized model. This process aims to create a clear and improved vision of the value stream. It explores Takt time, continuous flow, pull systems, production scheduling, and process improvements to optimize operational efficiency and effectively meet customer demands. Strategic questions help to create a production environment aligned with Lean principles, promoting the consistent delivery of value to the customer.Questions include [21]:
- What is the Takt time, considering the available labor time?
- Should you produce for finished goods stock or directly for dispatch?
- Where should you implement continuous flow?
- Where should you introduce pull systems with supermarkets?
- Where should you plan production in the production chain?
- How should you level the production mix in the pulling process?
- What increment of work will be released evenly by the pulling process?
- What process improvements are needed to guarantee the flow of value according to the future state of the project?
- Drawing up a Work Plan to Achieve the Future State: A detailed work plan is defined to implement the proposed improvements, covering the actions needed to move from the current state to the future state, with clearly defined responsibilities and deadlines.
2.2.5. Advantages and Limitations of VSM
3. Case Study
3.1. Selection of the Product Family
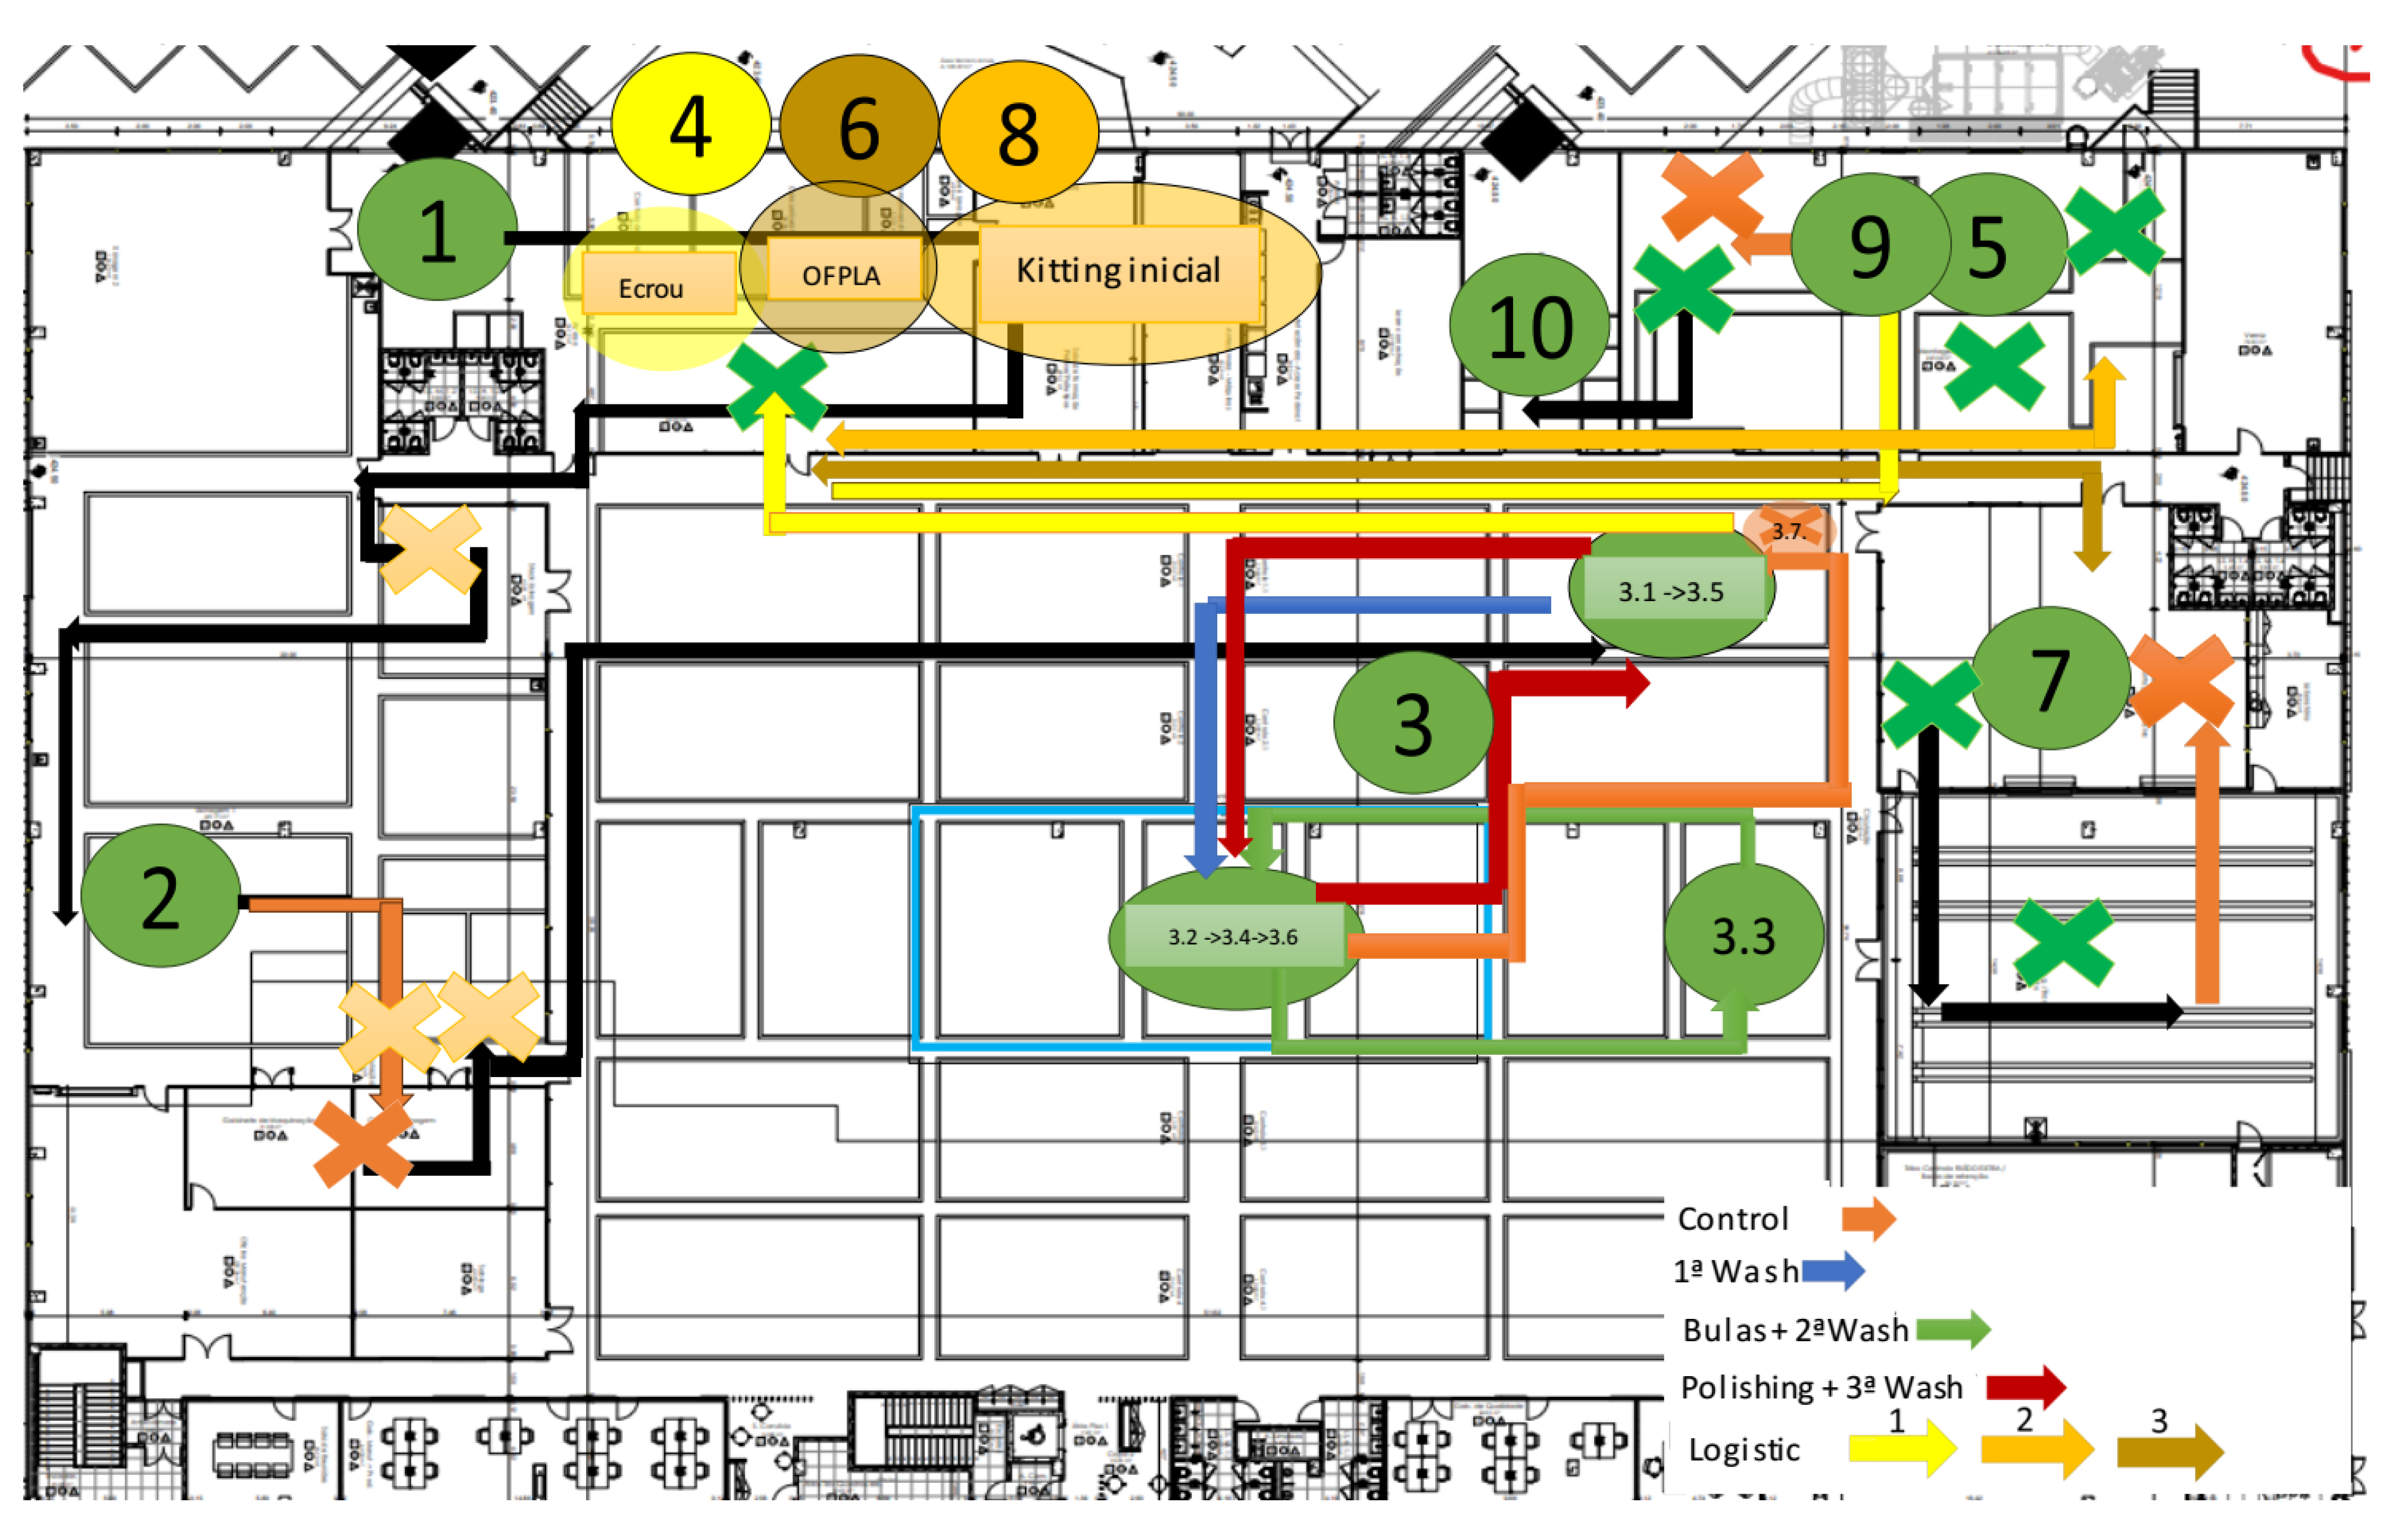
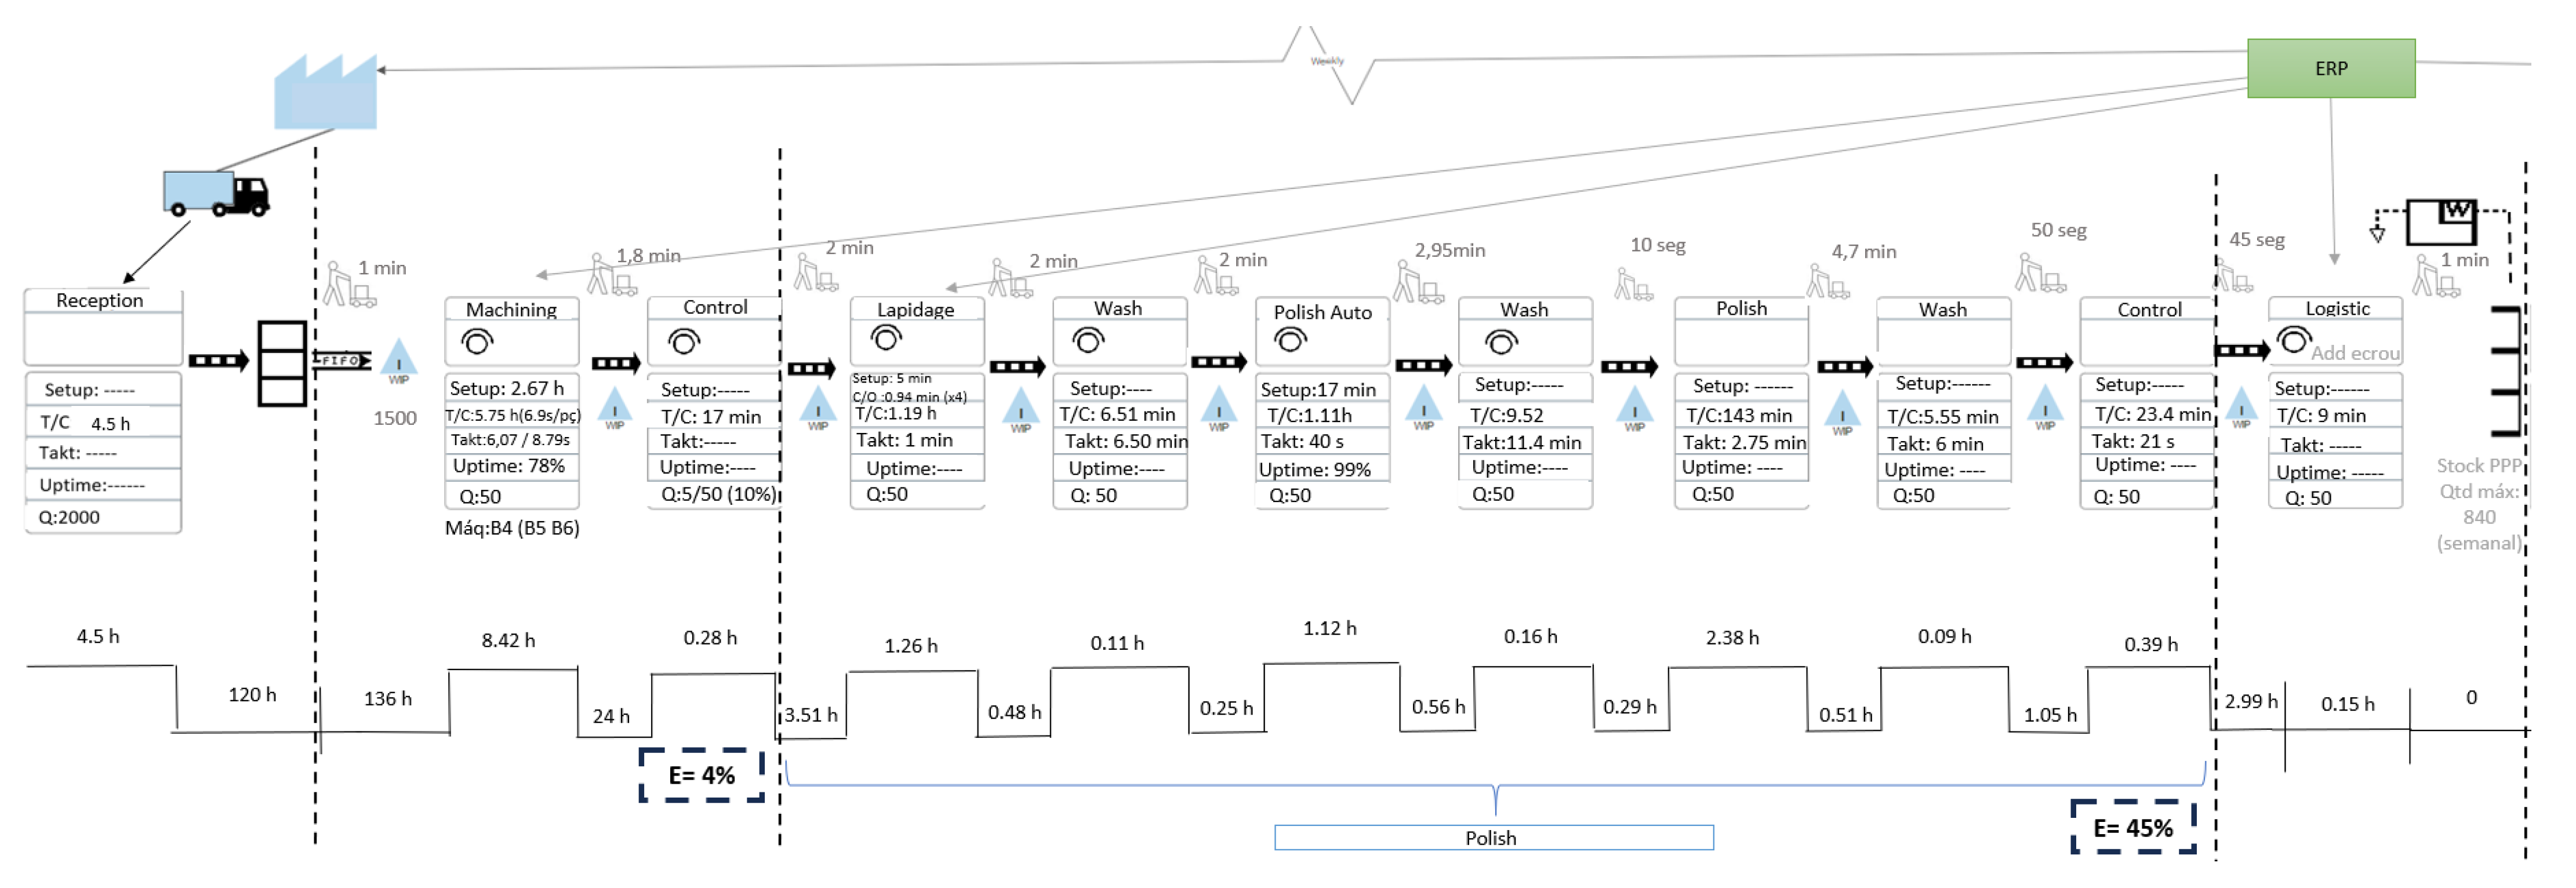
3.2. Productive Process and Flow
3.3. Data Collection and Analysis
3.3.1. Reception
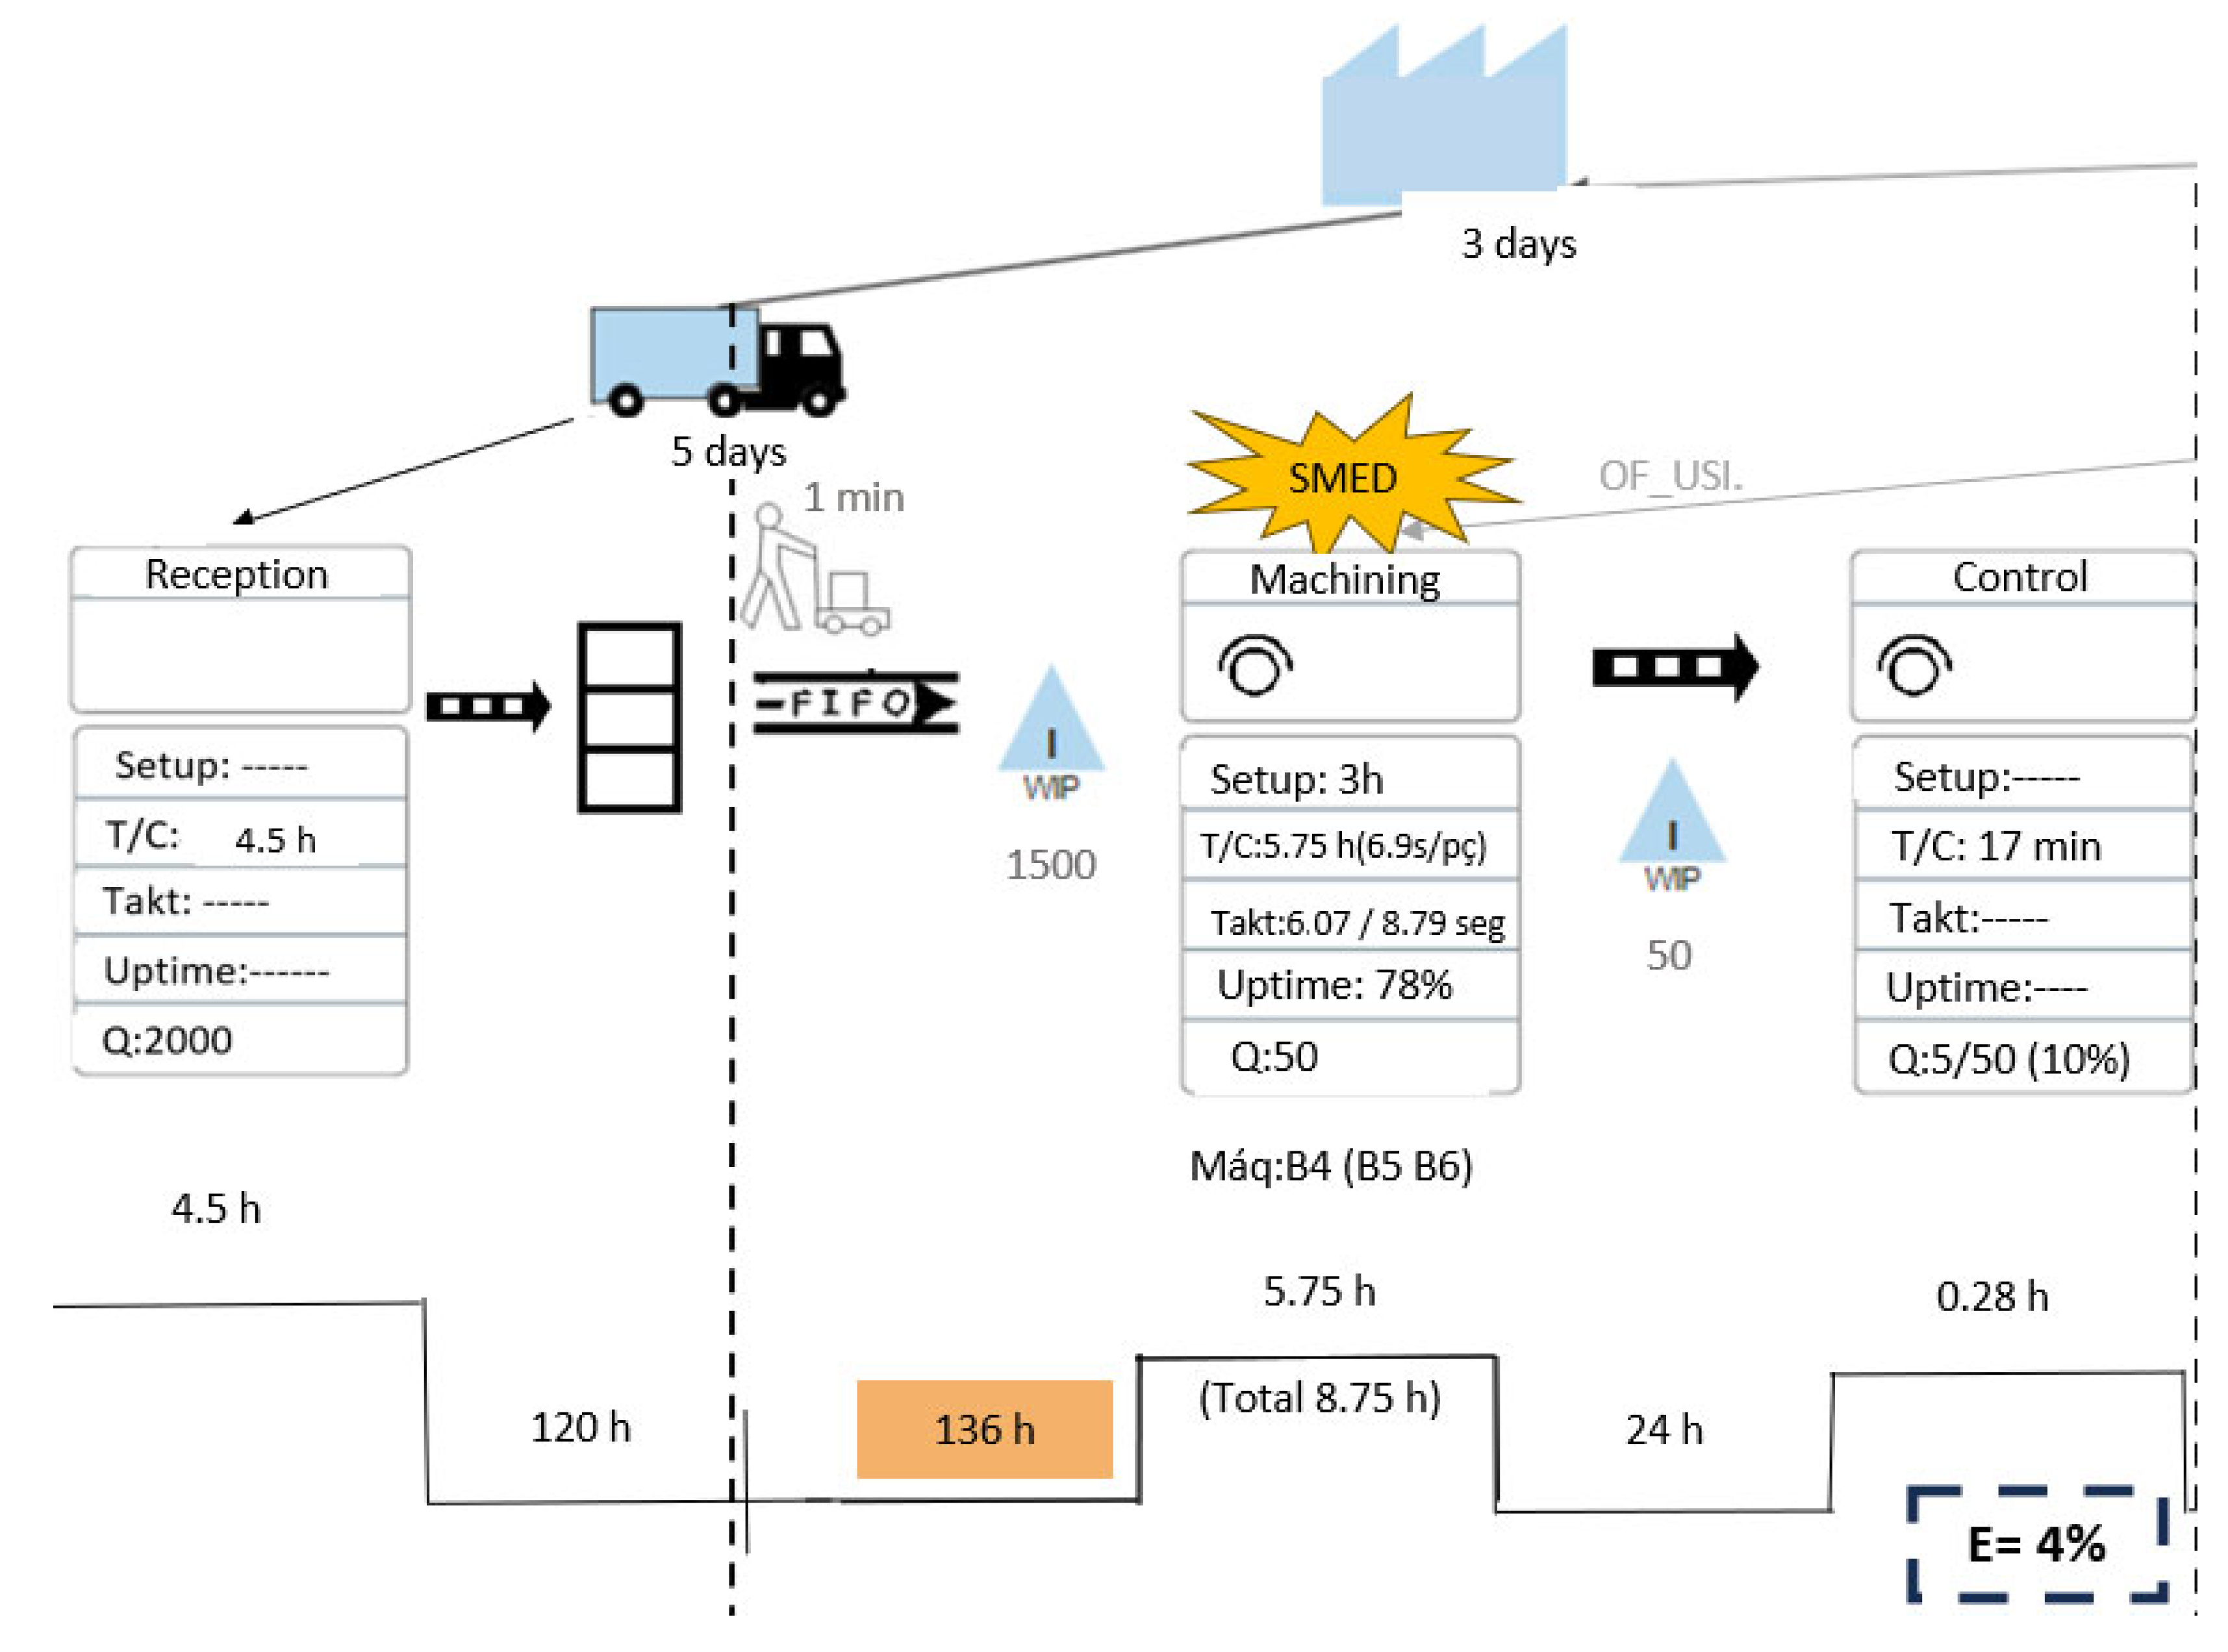
3.3.2. Machining
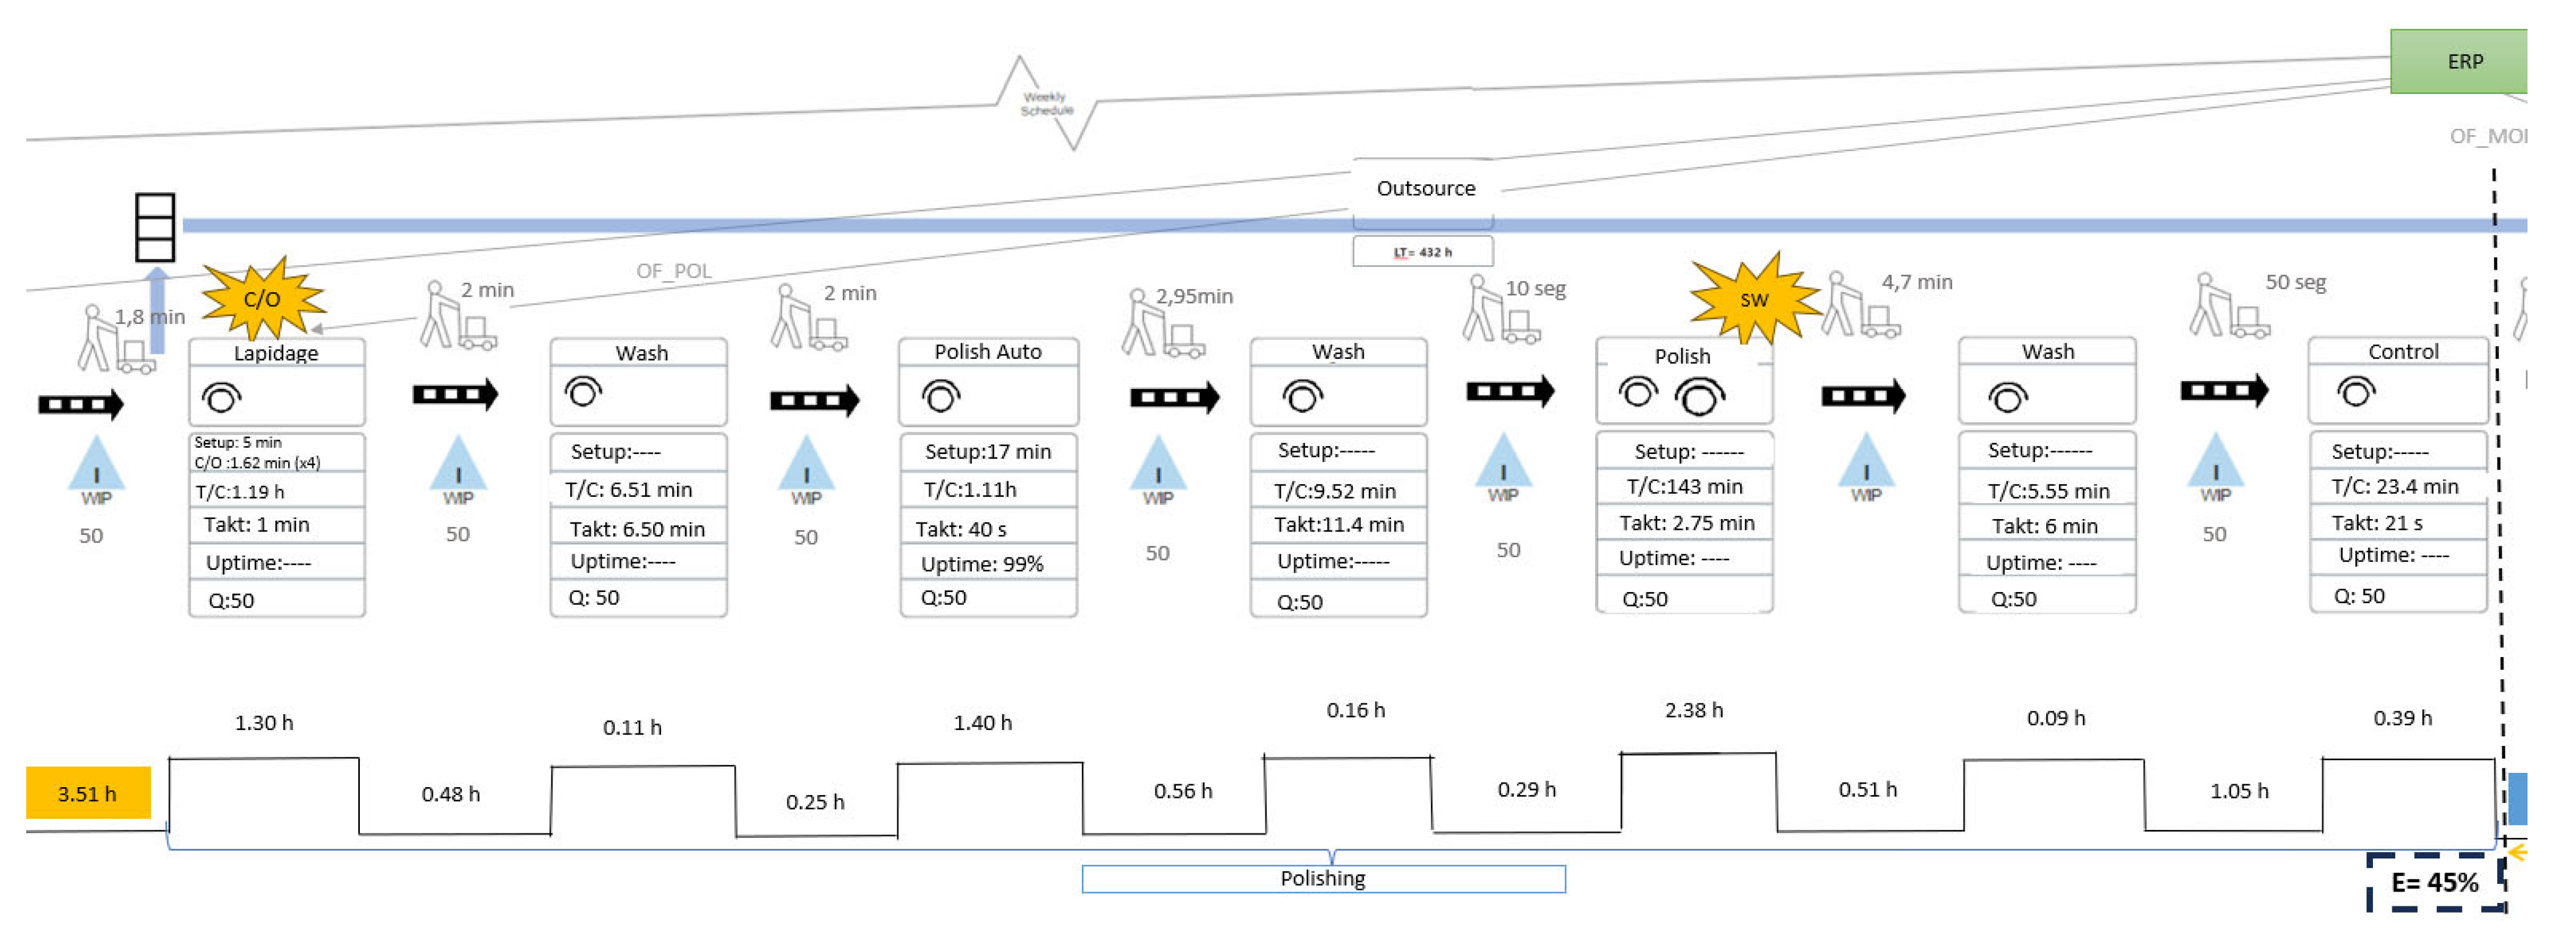
3.3.3. Polishing
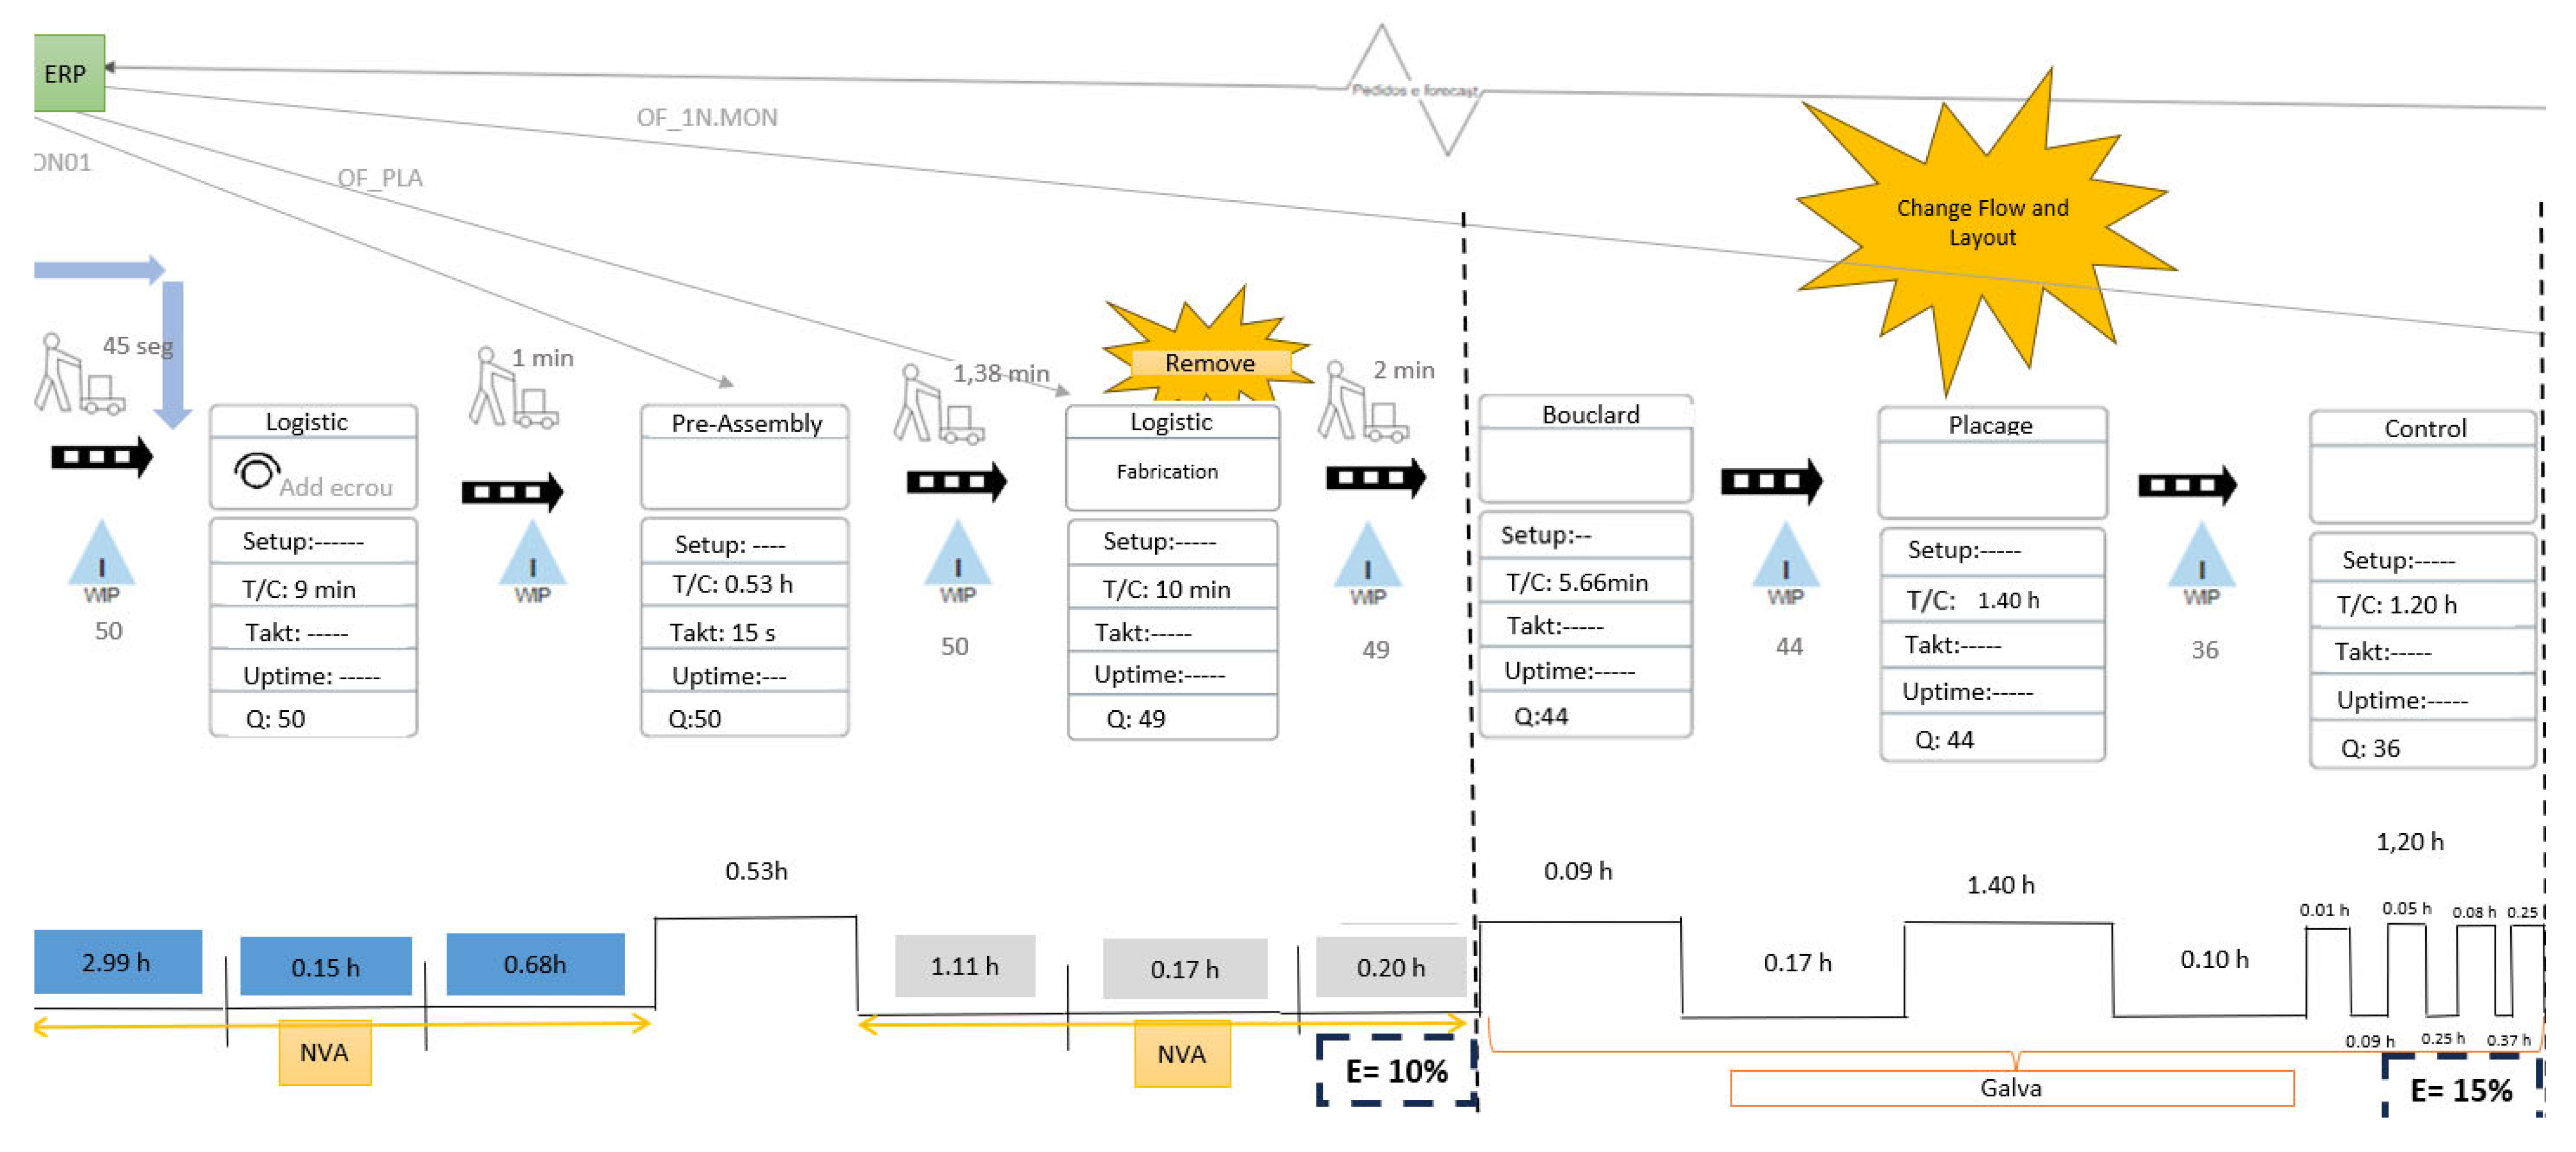
3.3.4. Pre-Assembly
3.3.5. Galvanoplasty
3.3.6. Final Assembly
3.3.7. Shipping
4. Discussion
4.1. Value Stream Mapping Actual State
4.2. Improvements
4.2.1. Machining
4.2.2. Polishing
4.2.3. Assembly and Galvanoplasty
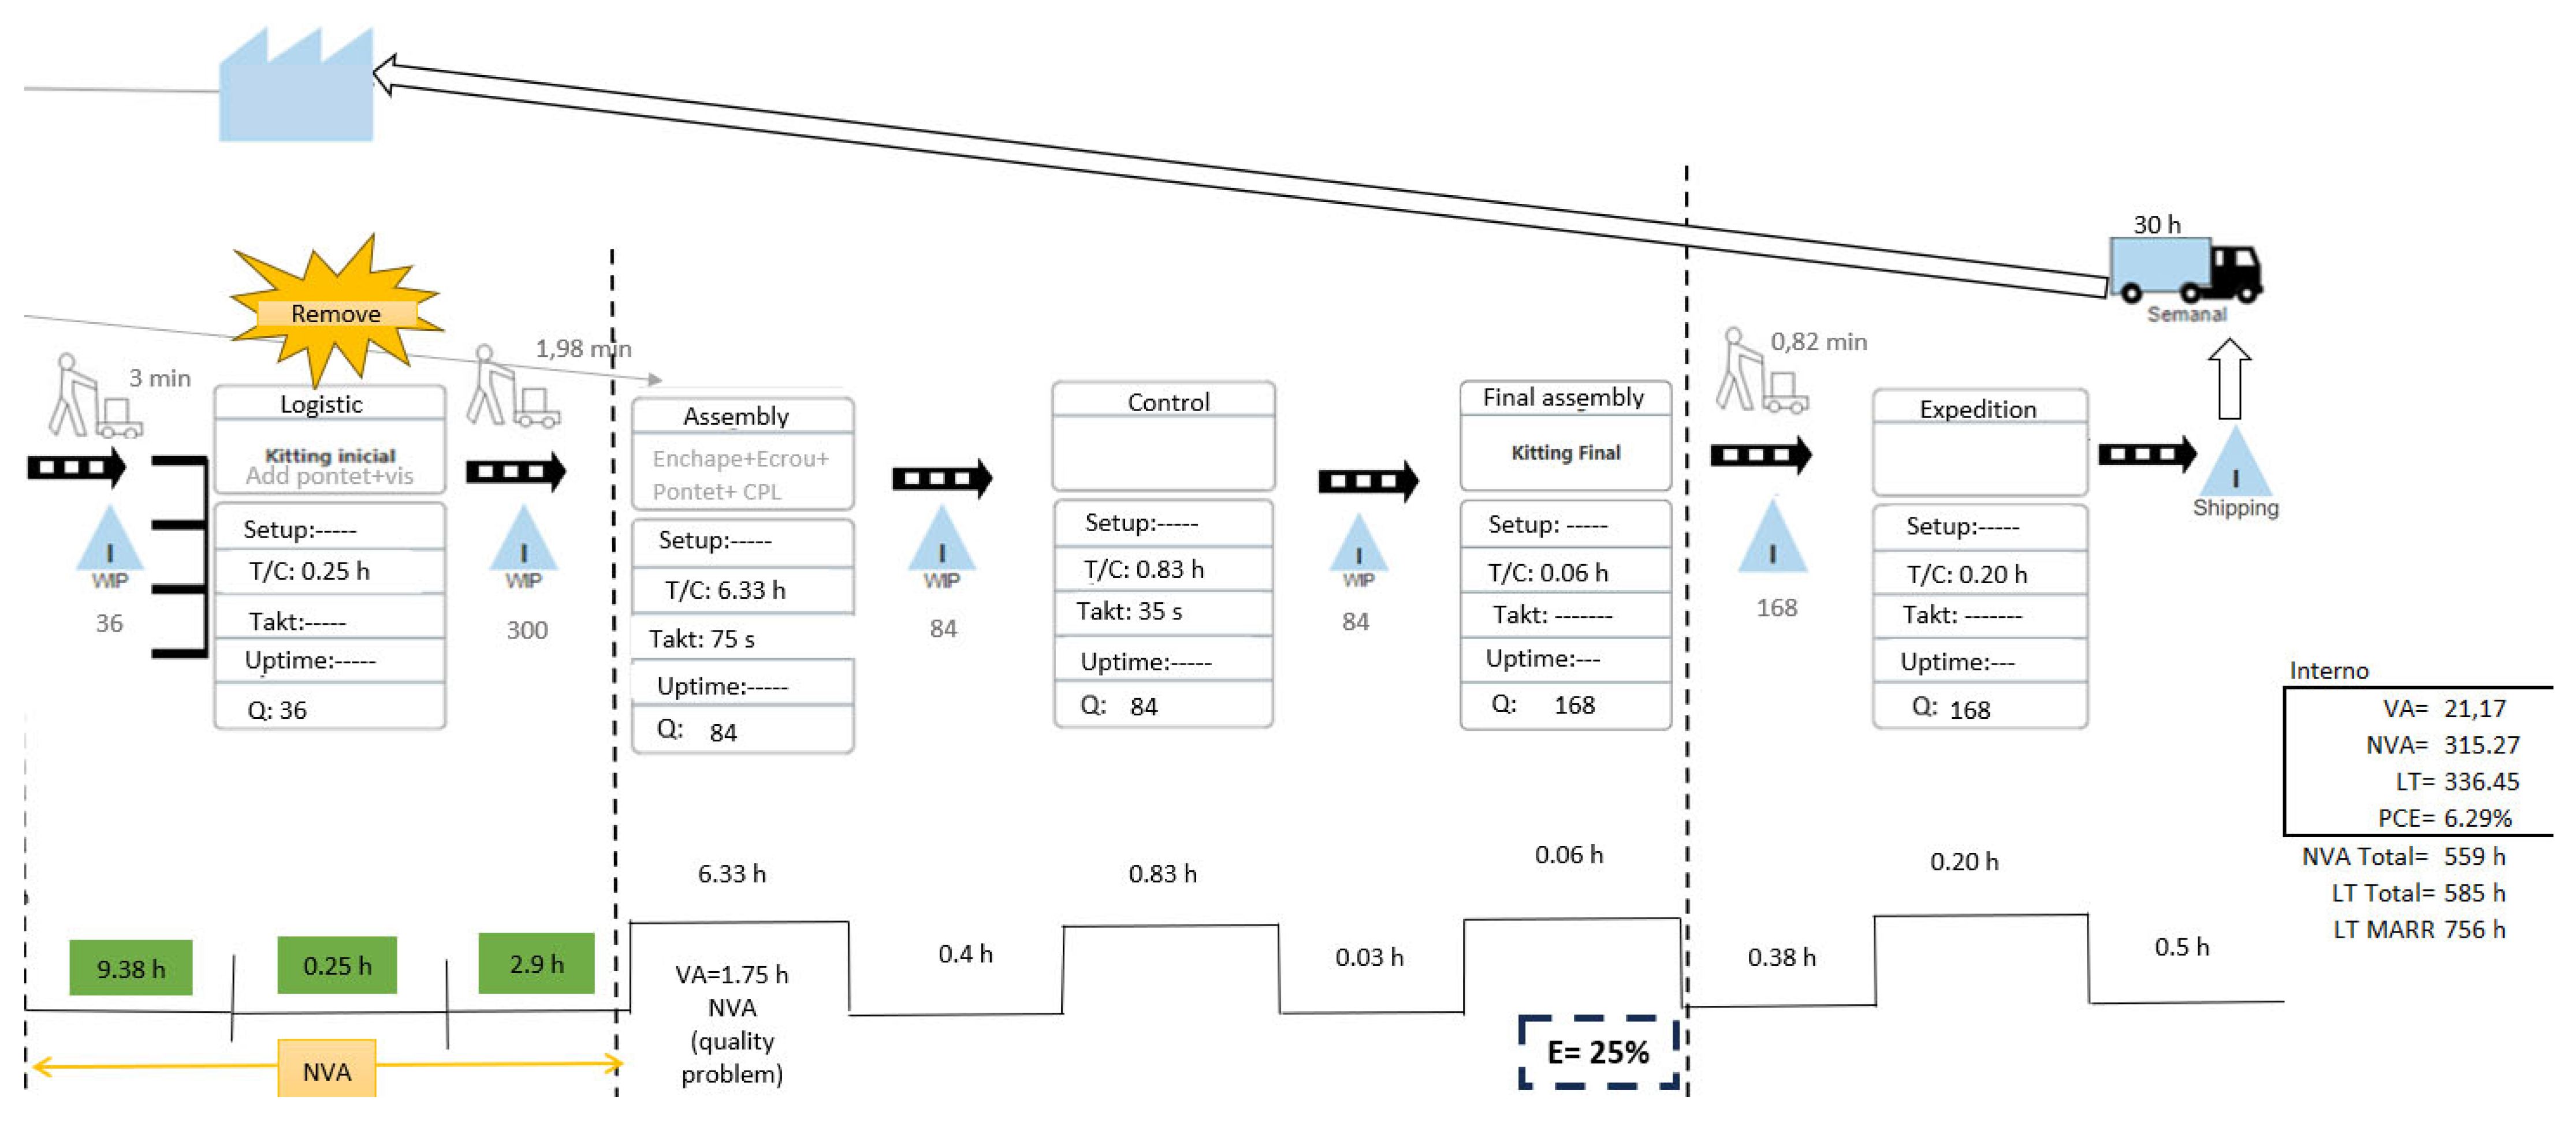
4.3. Future State
- VA = 22.75 h
- NVA = 295.39 h
- LT = 318.14 h
- PCE = 7.15%
5. Conclusions
- SMED reduced setup times by 20 min.
- Self-adhesive sandpaper reduced unnecessary movements by 0.04 h.
- The most significant improvement was the restructuring of the layout and flows, with the creation of component stock, which eliminated approximately 14 h of non-value-added (NVA) time.
Author Contributions
Funding
Data Availability Statement
Conflicts of Interest
References
- Valencia, E.; Garcia, Y.; Santivanez, G.; Castaneda, E. Production Management Model to Reduce Cycle Times Using Lean Manufacturing in a Company in the Metalworking Sector. In Proceedings of the 2022 8th International Conference on Information Management (ICIM 2022), London, UK, 25–27 March 2022; pp. 182–185. [Google Scholar]
- Ohno, T. O Sistema Toyota de Produção-Além da Produção em Larga Escala, 1st ed.; Bookman: Porto Alegre, Brazil, 1997; pp. 1–276. Available online: http://books.google.com.br/books?id=dg4_3tlM8EYC (accessed on 25 May 2024).
- Oliveira, J.; Sá, J.C.; Fernandes, A. Continuous improvement through ‘Lean Tools’: An application in a mechanical company. Procedia Manuf. 2017, 13, 1082–1089. [Google Scholar] [CrossRef]
- De-La-Cruz-Arcela, F.; Martinez-Castillo, J.; Altamirano-Flores, E.; Alvarez-Merino, J. Application of Lean Manufacturing Tools to Reduce Downtime in a Small Metalworking Facility. In Proceedings of the IEEE International Conference on Industrial Engineering and Engineering Management, Macao, China, 15–18 December 2019; pp. 551–555. [Google Scholar]
- Tyagi, S.; Choudhary, A.; Cai, X.; Yang, K. Value stream mapping to reduce the lead-time of a product development process. Int. J. Prod. Econ. 2015, 160, 202–212. [Google Scholar] [CrossRef]
- Dias, A.; Silva, M.T.; Nascimento, P.A.; Gonçalves, L.S.; Nunes, M.L.; Oliveira, P.S.; Fernandes, R. Utilization of the Arena simulation software and Lean improvements in the management of metal surface treatment processes. Procedia Comput. Sci. 2022, 204, 140–147. [Google Scholar] [CrossRef]
- Liker, J.K. The Toyota Way: 14 Management Principles from the World’s Greatest Manufacturer; McGraw-Hill: New York, NY, USA, 2004. [Google Scholar]
- Kumar, N.; Hasan, S.S.; Srivastava, K.; Akhtar, R.; Yadav, R.K.; Choubey, V.K. Lean manufacturing techniques and its implementation: A review. Mater. Today Proc. 2022, 64, 1188–1192. [Google Scholar] [CrossRef]
- Womack, J.P.; Jones, D.T.; Roos, D. The Machine That Changed the World; Macmillan Publishing Company: New York, NY, USA, 1990. [Google Scholar]
- Azevedo, J.; Sá, J.C.; Ferreira, L.; Santos, G.; Lima, V. Improvement of production line in the automotive industry through lean philosophy. Procedia Manuf. 2019, 41, 1023–1030. [Google Scholar] [CrossRef]
- Womack, J.P.; Jones, D.T. Lean Thinking: Banish Waste and Create Wealth in Your Corporation, Revised and Updated; Free Press: New York, NY, USA, 2003. [Google Scholar]
- Perdomo-Verdecia, V.; Sacristán-Díaz, M.; Garrido-Vega, P. Lean management in hotels: Where we are and where we might go. Int. J. Hosp. Manag. 2022, 104, 103250. [Google Scholar] [CrossRef]
- Klein, L.; Tonetto, M.; Avila, L.; Moreira, R. Management of lean waste in a public higher education institution. J. Clean. Prod. 2021, 286, 125386. [Google Scholar] [CrossRef]
- Rahani, A.; Al-Ashraf, M. Production flow analysis through Value Stream Mapping: A lean manufacturing process case study. Procedia Eng. 2012, 41, 1727–1734. [Google Scholar] [CrossRef]
- Proença, A.P.; Gaspar, P.D.; Lima, T.M. Lean optimization techniques for improvement of production flows and logistics management: The case study of a fruits distribution center. Processes 2022, 10, 1384. [Google Scholar] [CrossRef]
- Antoniolli, I.; Guariente, P.; Pereira, T.; Ferreira, L.; Silva, F. Standardization and optimization of an automotive components production line. Procedia Manuf. 2017, 13, 1120–1127. [Google Scholar] [CrossRef]
- Shingo, S. A Study of the Toyota Production System from an Industrial Engineering Viewpoint, Revised ed.; Productivity Press: Cambridge, MA, USA, 1989. [Google Scholar]
- Barnes, R. Motion and Time Study Design and Measurement of Work, 7th ed.; Wiley India Pvt. Limited: New Delhi, India, 2009. [Google Scholar]
- Chua, C.K.; Wong, C.H.; Yeong, W.Y. Quality Management Framework in Additive Manufacturing. In Standards, Quality Control, and Measurement Sciences in 3D Printing and Additive Manufacturing; Kumar, A., Zhang, Y., Eds.; Academic Press: Cambridge, MA, USA, 2017; pp. 213–239. [Google Scholar]
- Silva, D.; Delai, I.; Castro, M.; Ometto, A. Quality tools applied to Cleaner Production programs: A first approach toward a new methodology. J. Clean. Prod. 2013, 47, 174–187. [Google Scholar] [CrossRef]
- Rother, M.; Shook, J. Learning to See: Mapping the Value Stream to Add Value and Eliminate Waste: Working Manual for a Lean Tool; The Lean Enterprise Institute, Inc.: Cambridge, MA, USA, 2003. [Google Scholar]
- Hines, P.; Rich, N. The seven value stream mapping tools. Int. J. Oper. Prod. Manag. 1997, 17, 46–64. [Google Scholar] [CrossRef]
- Brunt, D. From Current State to Future State: Mapping the Steel to Component Supply Chain. Int. J. Logist. Res. Appl. 2000, 3, 259–271. [Google Scholar] [CrossRef]
- Jones, D.; Womack, J. Seeing the Whole: Mapping the Extended Value Stream; Lean Enterprise Institute: Cambridge, MA, USA, 2002. [Google Scholar]
- Lian, Y.H.; Landeghem, H. An Application of Simulation and Value Stream Mapping in Lean Manufacturing. In Proceedings of the 14th European Simulation Symposium, Dresden, Germany, 23–26 October 2002; pp. 300–307. Available online: https://www.scs-europe.net/services/ess2002/PDF/log-11.pdf (accessed on 25 May 2024).
- Braglia, M.; Carmignani, G.; Zammori, F. A new value stream mapping approach for complex production systems. Int. J. Prod. Res. 2006, 44, 3929–3952. [Google Scholar] [CrossRef]
- Lian, Y.H.; Landeghem, H. Analysing the effects of Lean manufacturing using a value stream mapping-based simulation generator. Int. J. Prod. Res. 2007, 45, 3037–3058. [Google Scholar] [CrossRef]
- Clifford, B.; Golmohammadi, D. Using Lean Value Stream Mapping to Align the Work Streams of Two Companies. Ind. Syst. Eng. Manag. 2012, 1, 1–9. [Google Scholar]
- Chen, J.; Li, Y.; Shady, B. From value stream mapping toward a lean/sigma continuous improvement process: An industrial case study. Int. J. Prod. Res. 2010, 48, 1069–1086. [Google Scholar]
- Singh, H.; Bahl, A.; Kumar, A.; Mann, G.S. Materials and Information Flow Analysis and Optimization of Manufacturing Processes in MSMEs by the Application of Value Stream Mapping (VSM) Technique. Mater. Today Proc. 2018, 5, 28420–28426. [Google Scholar]
- Pagliosa, M.; Tortorella, G.; Ferreira, J. Industry 4.0 and Lean Manufacturing: A systematic literature review and future research directions. J. Manuf. Technol. Manag. 2019, 32, 543–569. [Google Scholar] [CrossRef]
- Horsthofer-Rauch, J.; Schumann, M.; Milde, M.; Vernim, S.; Reinhart, G. Digitalized value stream mapping: Review and outlook. Procedia CIRP 2022, 112, 244–249. [Google Scholar] [CrossRef]
- Batwara, A.; Sharma, V.; Makkar, M.; Giallanza, A. Towards smart sustainable development through value stream mapping—A systematic literature review. Heliyon 2023, 9, e15852. [Google Scholar] [CrossRef] [PubMed]
- Kumar, S.; Dhingra, A.; Singh, B. Process improvement through Lean-Kaizen using value stream map: A case study in India. Int. J. Adv. Manuf. Technol. 2018, 96, 2687–2698. [Google Scholar] [CrossRef]
- George, M.L. Lean Six Sigma: Achieve Major Cost, Inventory and Lead Time Reductions in Less Than a Year; McGraw-Hill: New York, NY, USA, 2002; p. 89. [Google Scholar]
- Nash, M.; Poling, S. Mapping the Total Value Stream: A Comprehensive Guide for Production and Transactional Processes; Productivity Press: New York, NY, USA, 2008. [Google Scholar]
- Khaswala, Z.; Irani, S. Value Network Mapping (VNM): Visualization and Analysis of Multiple Flows in Value Stream Maps. In Proceedings of the Lean Management Solutions Conference, St. Louis, MO, USA, 4–5 October 2001; pp. 1–18. Available online: https://lib.asprova.com/images/stories/lean/lean-manufacturing/pdf/Value_Network_Mapping_VNM_.pdf (accessed on 25 May 2024).
- Slomp, J.; Bokhorst, J.A.C.; Germs, R. A lean production control system for high-variety/low-volume environments: A case study implementation. Prod. Plan. Control 2009, 20, 586–595. [Google Scholar] [CrossRef]
- Stamm, M.; Neitzert, T. Value Stream Mapping (VSM) in a Manufacture-To-Order Small and Medium Enterprise. In Proceedings of the 3rd World Conference on Production and Operations Management, Tokyo, Japan; 2008; pp. 1–15. [Google Scholar]
- Dinis-Carvalho, J.; Moreira, F.; Bragança, S.; Costa, E.; Alves, A.; Sousa, R. Waste identification diagrams. Prod. Plan. Control 2015, 26, 235–247. [Google Scholar] [CrossRef]
- Bertolini, M.; Braglia, M.; Marrazzini, L.; Neroni, M. Project Time Deployment: A new lean tool for losses analysis in Engineer-to-Order production environments. Int. J. Prod. Res. 2022, 60, 3129–3146. [Google Scholar] [CrossRef]


| # | Operation | Time (min) | Cumulative Time | Internal | External | Observations |
|---|---|---|---|---|---|---|
| 1 | Check Tools | 6.78 | 6.78 | x | Team Leader | |
| 2 | Removing Tools | 1.20 | 7.98 | x | Team Leader | |
| 3 | Select Tools in the Cabinet | 2.00 | 9.98 | x | Team Leader | |
| 4 | Preparing the tool | 16.00 | 25.98 | x | Team Leader | |
| 5 | Measure Tool | 2.67 | 28.65 | x | Team Leader | |
| 6 | Place Tool | 2.00 | 30.65 | x | Team Leader | |
| 7 | Insert parameters (x,y,z) | 10.13 | 40.78 | x | Team Leader | |
| 8 | Zero point | 11.48 | 52.26 | x | Shift Leader/Tuner | |
| 9 | Insert Program | 7.75 | 60.01 | x | Shift Leader/Tuner | |
| 10 | Make 1st Part-Validation | 58.00 | 118.01 | x | Shift Leader/Tuner | |
| 7–8 | Wait Time | 61.58 | 179.59 | x | Wait for tuner. One part of the process is done by the team leader, another by the tuner or shift leader. This wait is also for the shift change. Tuner busy. | |
| Total | 180 | |||||
Disclaimer/Publisher’s Note: The statements, opinions and data contained in all publications are solely those of the individual author(s) and contributor(s) and not of MDPI and/or the editor(s). MDPI and/or the editor(s) disclaim responsibility for any injury to people or property resulting from any ideas, methods, instructions or products referred to in the content. |
© 2024 by the authors. Licensee MDPI, Basel, Switzerland. This article is an open access article distributed under the terms and conditions of the Creative Commons Attribution (CC BY) license (https://creativecommons.org/licenses/by/4.0/).
Share and Cite
Costa, B.; Varejão, J.; Gaspar, P.D. Development of a Value Stream Map to Optimize the Production Process in a Luxury Metal Piece Manufacturing Company. Processes 2024, 12, 1612. https://doi.org/10.3390/pr12081612
Costa B, Varejão J, Gaspar PD. Development of a Value Stream Map to Optimize the Production Process in a Luxury Metal Piece Manufacturing Company. Processes. 2024; 12(8):1612. https://doi.org/10.3390/pr12081612
Chicago/Turabian StyleCosta, Beatriz, José Varejão, and Pedro Dinis Gaspar. 2024. "Development of a Value Stream Map to Optimize the Production Process in a Luxury Metal Piece Manufacturing Company" Processes 12, no. 8: 1612. https://doi.org/10.3390/pr12081612
APA StyleCosta, B., Varejão, J., & Gaspar, P. D. (2024). Development of a Value Stream Map to Optimize the Production Process in a Luxury Metal Piece Manufacturing Company. Processes, 12(8), 1612. https://doi.org/10.3390/pr12081612