Article

Nutritional and Structural Evaluation of Gluten-Free Flour Mixtures Incorporating Various Oilseed Cakes

RSE “Kazakhstan Institute of Standardization and Metrology”, Mangilik El Ave. 11, Astana 010000, Kazakhstan
*
Author to whom correspondence should be addressed.
Processes 2024, 12(8), 1616; https://doi.org/10.3390/pr12081616
Submission received: 20 June 2024 / Revised: 23 July 2024 / Accepted: 25 July 2024 / Published: 1 August 2024
(This article belongs to the Special Issue Application and Evaluation of Bioactive Compounds in Food Processing)

Abstract

:
This study focuses on the potential of addition of flaxseed, soybean, sunflower, peanut, and pumpkin cakes in gluten-free flour formulations, using rice flour, corn flour, and corn starch. The aim of the article is to investigate the impact of oil cake flour incorporation on the structure and mineral composition of gluten-free mixtures. The control sample (without cake flour) and four experimental samples were prepared. To obtain a gluten-free mixture, the ingredients were dosed and mixed in dry form, namely 50% finely ground white rice, 30% corn starch, 10% corn flour, and 10% oil cake flour. The investigation reveals distinct nutritional profiles, with significant variations in protein, fat, carbohydrate, and calorie content among the different types of cakes. Amino acid composition analysis showcased variations among oil cakes, emphasizing their potential as diverse protein sources. Fatty acid composition revealed caproic acid as the predominant fatty acid. Peanut cake displayed the highest omega-3 content (0.21%), emphasizing its potential health benefits. Pumpkin cake stood out with the highest magnesium (472.63 mg/100 g) and phosphorus (893.69 mg/100 g) content. Flaxseed cake led in calcium (225.92 mg/100 g), while soybean cake excelled in potassium (2549.0 mg/100 g), iron (9.13 mg/100 g), and copper (2.03 mg/100 g) content. X-ray fluorescence and phase analysis confirmed the amorphous nature of gluten-free mixtures with oilseed meal. Electron microscopy results showed that the gluten-free mixtures with cake addition consisted of particles ranging in size from 2.5 to 25 microns. Overall, incorporating oilseed meal flour into gluten-free formulations enhances nutritional value without compromising structural properties, making it a promising ingredient in food production.

Graphical Abstract

1. Introduction

With the growing amount of food industry waste, which is a valuable source of biologically active compounds, the development of new methods of their processing and reuse becomes an urgent task, which will help to solve environmental problems. According to the United States Department of Agriculture (USDA), in the 2022/2023 marketing year, global oilseed production was expected to increase by 2 million tons at once and reach a new record high of 647 million tons, hence a large amount of oilcake would be available [1]. Using these by-products and residues from the oil and fat industry is a practical option to decrease waste and aid in the cost-effective creation of new nutrient-rich products [2].
The main by-product of oil processing is cake, which is extracted from seed oil. Oil cakes are produced by industries in two ways: in the form of granules or flakes obtained after pressing the oil; in the form of powder of a certain dispersibility, obtained by grinding these granules or flakes [3]. Cakes are divided into two categories—edible and inedible. Oilseed cakes, derived from sources such as soybean, peanut, rapeseed, sunflower, coconut, cotton, safflower, and linseed, are by-products of the oil extraction process. These oil cakes possess a high nutritional value, making them suitable for inclusion in both animal and human diets. Additionally, oilseed cakes serve as valuable raw materials for the manufacture of protein concentrates, isolates, and hydrolysates. They also function as substrates in the production of biologically active compounds, surfactants, enzymes, antibiotics, vitamins, pigments, flavorings, and amino acids. Oilseed cakes are potential sources of natural antioxidants [4,5,6,7].
Oilseed cake and subsequently cake flour are valuable sources of gluten-free proteins, which are suitable alternatives to replace animal or other plant-based protein sources because they are easily digestible, non-toxic, and sufficiently nutritious [8,9]. For example, sunflower cake can be used for human consumption. The chemical composition of sunflower cake contains 33.85% protein, 65.42% fat, and 18 different mineral substances [10]. The cake contains more dietary fiber and protein with a balanced amino acid composition compared to sunflower seeds. Cold-pressed sunflower, flax, and pumpkin oil cakes contain 19.9–44.9; 14.4–41.9; and 29.4–53.9% crude protein, respectively [11].
Oilseeds can be incorporated into food products in various forms, including whole, ground, and pressed oil, with their health benefits being significantly influenced by the method of addition [12]. The choice of addition method significantly impacts the rheological properties and overall quality of the enriched foods, particularly affecting their organoleptic acceptability. Furthermore, the oxidative stability of the enriched products is expected to vary depending on the state of the oilseeds at the time of addition [13].
The popularity of gluten-free products in the modern world is constantly growing, not only due to the disease of celiac disease, but also due to the increasing number of people who need to control the gluten content in their diets, as well as following a healthy lifestyle [14,15,16]. In this regard, the development of gluten-free additives for the production of various types of food products is a relevant research topic.
The key novelty of this research lies in its comprehensive analysis and utilizing oilseed cake as a gluten-free protein source in food production, highlighting its high nutritional value, particularly in terms of protein, amino acids, fatty acids, and essential minerals. It demonstrates that oilseed cake flour can significantly enhance the nutritional profile of gluten-free mixtures without altering their structural properties, making it a promising ingredient for nutritionally enriched gluten-free products.
The aim of the article is to study the effect of the introduction of oil cake flour on the structure of a gluten-free mixture, as well as changes in the qualitative and quantitative composition of the mineral content of a gluten-free mixture with the addition of oil cake flour.

2. Materials and Methods

2.1. Materials

Commercial rice flour, corn flour, and corn starch of “GARNEC” brand, produced by “Garnets” LLC (Vladimir city, Russia), were used for experimental studies.
Samples of oil cake were obtained from the experimental department for the production of vegetable oils at the Seifullin Kazakh Agrotechnical Research University (Astana, Kazakhstan). Seeds of soybean, pumpkin, sunflower, peanut, and flax of the 2023 crop year were dried and pressed on a screw oil press. The secondary product of oilseed processing is oil cake, which is mainly used as animal feed.

2.2. Obtaining Gluten-Free Flour

To obtain a gluten-free mixture, the ingredients are dosed and mixed in dry form, namely 50% finely ground white rice, 30% corn starch, 10% corn flour, and 10% oil cake flour. The oil cake flour should be as close as possible to a fineness value of less than 500 microns [17], as this accelerates water absorption. The control sample does not contain oil cake flour (Table 1).

2.3. Study of Oil Cake Microstructure

The microstructure was investigated using an Axiolab 40 polarization microscope with a video camera (Axio Lab. A1, Carl Zeiss, Oberkochen, Germany) [18].

2.4. Electron Microscopy Sub-Micrometer Range

The studies were carried out on a scanning electron microscope (SEM) with an energy-dispersive microanalysis system (without sample preparation). Samples in the form of powders or crushed pieces were put in 28 labeled polyethylene bags. Samples were mounted in brass holders on the slide of a JXA-8230 scanning electron microscope–microanalyzer from JEOL (Tokyo, Japan). Thus, the same experimental conditions for observation and measurement of all samples were created. The mounting corresponded to the positions of the samples in relation to the electron beam as close to perpendicular as possible.
Sample images were captured at an accelerating voltage of 20 kV, an electron beam current much less than 1 nA, and aperture diaphragms No. 3 and No. 4. Such imaging conditions at low magnifications provide accurate observation and registration of particles from microns to hundreds of microns, and at high magnifications—submicron particles. The secondary electron observation and imaging (SEI) mode was used for all sample sections selected for the SEM study. For image comparability and microstructure characterization, 3 micrographs were obtained for each sample at ×40 (over plan), ×1000, and ×3000 magnifications.

2.5. X-ray Fluorescence Semi-Qualitative Structural Analysis

X-ray diffraction (XRD) was performed on an XPERT-PRO PANANALYTICAL diffractometer (PANalytical Company, Almelo, The Netherlands), at room temperature with a copper anti-cathode operating at 40 kV and a 30 mA current, to check whether the structure of the samples was crystalline or amorphous. Diffraction was performed on energized samples spread smoothly on a neutral quartz glass sample holder, exposed to a k-alpha radiation source and scanned between 15° and 100° at 2 theta angles [19].

2.6. X-ray Phase Analysis

X-ray phase analysis (XRF) was performed on the analyzer, Epsilon 3, using a PANalytical metal–ceramic X-ray tube (PANalytical Company, Almelo, The Netherlands) of up to 15 W, a maximum current of 3 mA, and a maximum voltage of 30 kV, with a thin beryllium window, a “sharp” focus, and delivering useful power at the level of a standard 50 W tube, allowing very accurate and deep analysis of all materials. The research was carried out in scanning mode. The instrument determined the presence of all metals in the dry samples. The flour samples were prepared by milling [20].

2.7. Determination of Mineral Content

Mineral composition analysis was conducted using the method described in [21]. Oilseed cake samples (1–2 g) were placed in high-pressure Teflon vessels and ashed in a muffle furnace using a two-step process: 4 h at 400 °C followed by 2 h at 600 °C. The resulting ash (1 g dry weight) underwent acid digestion with 3 mL HNO3 and 2 mL HF in a microwave system (Berghof Speed Wave, Bremen, Germany) at 200 °C for 20 min. Digested samples were then diluted to 10 mL with 1% HNO3.
Element analysis was performed using an ICP-MS system 1.0 (Varian-820 MS, Varian Company, Canberra, Australia). The instrument was calibrated using Var-TS-MS and IV-ICPMS-71A standards (Inorganic Ventures Company, Christiansburg, VA, USA). Sensitivity tuning utilized a diluted Var-TS-MS solution containing 10 µg/L of Ba, Be, Ce, Co, B, Pb, Mg, Tl, and Th. Detector calibration employed IV-ICPMS-71A solutions of Cd, Pb, Cu, and Zn at 10, 50, and 100 µg/L.
ICP-MS operating parameters were as follows: plasma flow 17.5 L/min, auxiliary flow 1.7 L/min, sheath gas 0.2 L/min, nebulizer flow 1.0 L/min, sampling depth 6.5 mm, RF power 1.4 kW, pump rate 5.0 rpm, and stabilization delay 10.0 s. The method was validated using certified reference materials, with discrepancies between certified and measured values below 10%. All analyses were conducted in triplicate, with results expressed as mg/100 g of sample.

2.8. Determination of Amino Acid Content

The method is based on sample decomposition by acid or (for tryptophan only) alkaline hydrolysis with the conversion of amino acids into free forms, obtaining Phenylthiocarbamyl (PTC) derivatives, and their further separation and quantification by capillary electrophoresis (CE). Detection is performed in the UV spectral range at a wavelength of 254 nm. For the modifications “Kapel-105/105M/205” it is possible to carry out direct quantitative determination of tryptophan without obtaining a PTC-derivative, registering absorbance at a wavelength of 219 nm [22]. A detailed description is presented in Supplementary File.

2.9. Determination of Fatty Acid Content

This was quantified using a gas chromatograph combined with mass spectrometry according to GOST R 55483-2013 [23]. A detailed description is presented in the Supplementary File.

2.10. Determination of Chemical Composition

The chemical composition of cedar cake was analyzed using standard instrumental methods of research. For protein determination using the Kjeldahl method, 2–4 g samples of press cake are selected. According to the Kjeldahl method, prior to analysis, the sample is weighed and homogenized, and catalysts are added. The amount of concentrated sulfuric acid added for mineralization is determined based on the principle that 4 cm3 of concentrated sulfuric acid is required for each gram of soluble dry matter in the sample [24].
For mineralization, the sample is heated with sulfuric acid to a temperature of 360–450 °C in the presence of catalysts. The resulting ammonium sulfate is then treated with concentrated alkali, distilling it into a receiving flask containing a precise amount of boric acid. Ammonia is distilled into the receiving flask with a reagent that binds it into a labile complex.
Mineralization was conducted using a Drawell KDN-08D digester (Chongqing Drawell Instrument Co., Ltd., Chongqing, China), in 300 mL digestion tubes. Distillation was performed using an automatic Kjeldahl apparatus (model ATN-300, BonninTech, Wuhan, China). Titration of the obtained distillate was carried out manually using sulfuric or nitric acid.
The mass fraction of protein X, %, was calculated using the following Formula (1):
X = 0.0014 · ( V V 0 ) · K · 100 m · 6.25
where 0.0014—mass of nitrogen equivalent to 1 cm3 of hydrochloric acid with a concentration of exactly 0.1 mol/dm3, g/cm3;
V—volume of hydrochloric acid solution (concentration exactly 0.1 mol/dm3) used for titration, cm3;
Vo—volume of hydrochloric acid solution (concentration exactly 0.1 mol/dm3) used for titration in the blank determination, cm3;
K—correction factor for the concentration of hydrochloric acid solution;
100—factor for conversion to percentage;
6.25—factor for converting nitrogen mass fraction to protein;
m—mass of the sample, g.
The result of the analysis was taken as the average value of three parallel measurements, rounded to two decimal places.
The mass fraction of moisture was determined according to GOST 54705-2011 [25]. A sample of the product weighing 5 g is placed in a pre-dried (at 103 ± 2 °C) metal weighing dish of constant mass and weighed to the third decimal place. The sample is spread in a thin layer across the bottom of the dish. The uncovered dish containing the sample and its lid are then placed in a drying oven and dehydrated for 2 h at a temperature of 103 ± 2 °C. Subsequently, the dish is covered with its lid, allowed to cool in a desiccator for 40 min, and then weighed to the third decimal place. Subsequent weighings are conducted at 30 min intervals of additional drying. The mass of the sample is considered constant when the difference between two consecutive weighings does not exceed 0.005 g.
The mass fraction of moisture, W, %, is calculated by the Formula (2):
W = ( m 1 m 2 ) · 100 m 1 m
where m1—mass of the weighing dish with the sample before drying, g;
m2—mass of the weighing dish with the sample after drying, g;
m—mass of the empty weighing dish, g.
Fat content was determined using the Soxhlet extraction method. Samples of oilseed cake (5 g, mass m) were dried and placed in cellulose thimbles for extraction. The extraction was performed using petroleum ether as the solvent in a Soxhlet apparatus for 6 h. After extraction, the solvent was evaporated, and the extraction flasks with the extracted fat were dried to constant weight in an oven at 103 ± 2 °C. The mass of the empty extraction flask (m1) and the flask with extracted fat (m2) were recorded.
The mass fraction of fat (X) was calculated as a percentage using the Formula (3):
X = ( m 2 m 1 ) · 100 m
where m2—the mass of the extraction flask with fat, g;
m1—the mass of the empty extraction flask, g;
m—the initial mass of the sample, g.
The mass fraction of ash was determined according to GOST 13979.6-69 [26].
A sample of approximately 5 g, weighed on a second-class precision balance, is incinerated to complete ashing in a crucible at a temperature of 600–700 °C for 2–3 h. The ash content as a mass fraction X, (%), is calculated using the following Formula (4):
X = ( m 1 m 2 ) · 100 m m 2
where m—mass of the crucible with the sample before ashing, g;
m1—mass of the crucible with ash, g;
m2—mass of the empty crucible, g.

2.11. Statistics

The results of the measurements were analyzed using Excel 2007 (Microsoft, Washington, DC, USA). The differences between the samples were evaluated using a one-way ANOVA. A p-value < 0.05 was considered statistically significant. Data are presented as mean values ± standard deviation (SD).

3. Results and Discussion

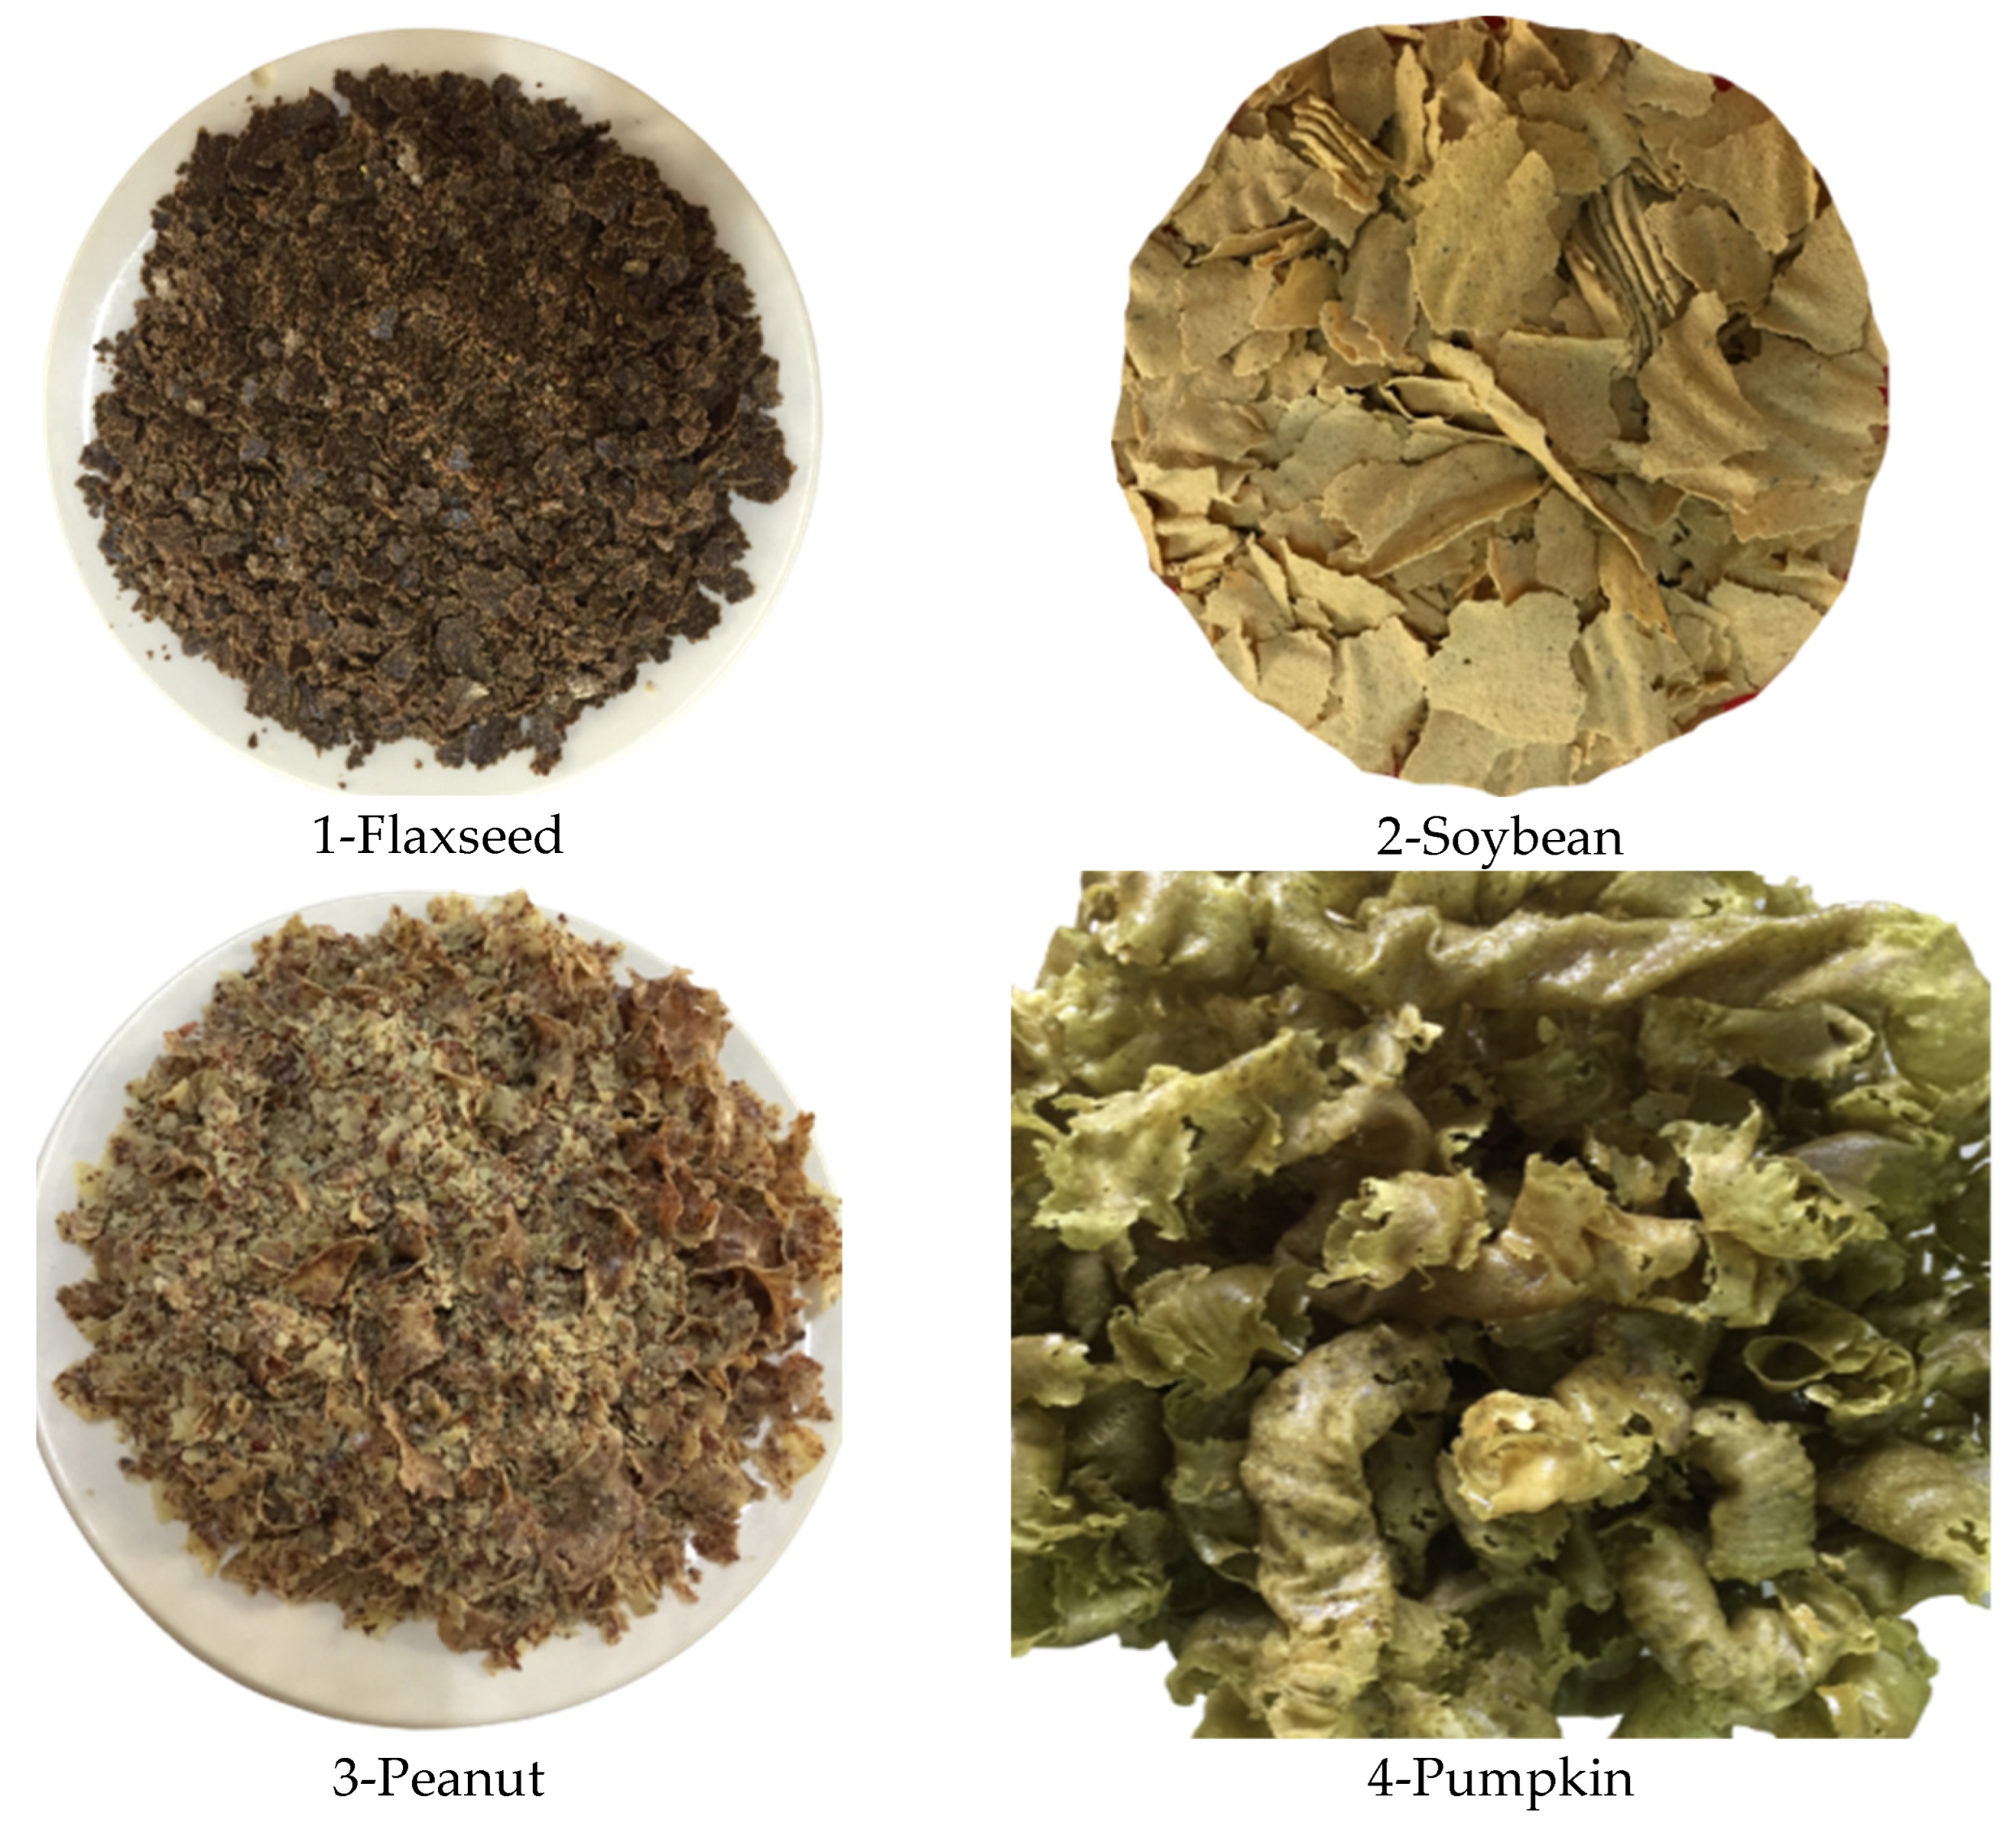
3.1. Organoleptic Analysis of Oil Cakes

Research on the organoleptic quality indicators of the obtained cakes from flax, soybean, pumpkin and peanut seeds was carried out (Table 2). Samples of the studied cake samples are presented in Figure 1: sample No. 1—flax seed cake; sample No. 2—soybean seed cake; sample No. 3—peanut seed cake; and sample No. 4—pumpkin seed cake.

3.2. Nutritional Profile of Oil Cake

The investigation into the chemical composition of various oilseed cakes—flaxseed, soybean, sunflower, peanut, and pumpkin—revealed distinct nutritional profiles (Table 3). The study found that the protein content of the cakes varied, with flaxseed cake having the highest protein content at 34.4%, followed by soybean cake at 32.6%, sunflower cake at 32.5%, peanut cake at 29.6%, and pumpkin cake at 37.5%. The fat content of the cakes also differed, with flaxseed cake having the lowest fat content at 25.4%, and pumpkin cake having the highest fat content at 25.5%.
Soybean cake showcased the highest carbohydrate content at 35.9%, followed by sunflower cake (30.6%) and pumpkin cake (23%). Flaxseed and peanut cakes presented lower carbohydrate levels (12% and 18%, respectively).
Overall, the study found that the chemical composition of the different types of cakes varied significantly, with the protein, fat, carbohydrate, and calorie content differing for each type of cake.
Our flaxseed oil cake protein content (34.4 g/100 g) falls within the range reported by Ogunronbi et al. (2011) [27] (29.8–35.4 g/100 g) but exceeds that reported by Kaur et al. (2021) [28] (26.59 g/100 g) and Mannucci et al. (2019) [29] (30.4 g/100 g). Differences may be attributable to flaxseed variety, oil extraction methods, or analysis techniques.
Our investigation into pumpkin cake composition revealed 37.5% protein, 23.0% carbohydrates, and 25.5% fat. In comparison, Aidyn et al. (2023) [30] found slightly higher protein (39.35%), lower carbohydrates (7.55%), and moderate fat content (16.68%). Budžaki et al. (2018) [31] reported a protein content of 38.27% in pumpkin oil cake, aligning closely with our results. Vershinina et al. (2010) [32] identified fat (10.3%), protein (34%), fiber (16.9%), minerals (6.8%), and sugars (23.1%) in pumpkin oil cake, presenting a different nutritional profile. Khramova et al. (2013) [33] reported distinct values with 31% protein, 20.9% fat, 5.2% ash, and 20% fiber in pumpkin cake. Notably, Nourmohammadi et al. (2017) [34] reported exceptionally high protein content (48.6%) along with 8.9% fat, 6.2% moisture, and 7.1% ash in pumpkin oil cake. Discrepancies in results may arise from variations in pumpkin varieties, processing methods, or analytical techniques. Our findings contribute to the diverse understanding of pumpkin cake composition and emphasize the need for comprehensive assessments considering multiple research sources.

3.3. Amino Acid Composition of Oil Cake

The values of the amino acid composition of the tested oil cake samples are shown in Table 4. The table shows the amino acid composition of four different types of oil cake: flaxseed cake, soybean cake, sunflower cake, and peanut cake. The highest content of amino acids in these oil cakes is found for proline, which is present in the highest amount in peanut cake, with 2.451 g per 100 g of product. The lowest content of amino acids is found for glycine, which is present in the lowest amount in flaxseed cake, with 1.152 g per 100 g of product. Other amino acids with high content in these oil cakes include alanine, which is present in the highest amount in sunflower cake, with 1.590 g per 100 g of product, and threonine, which is present in the highest amount in soybean cake, with 1.008 g per 100 g of product (Table 4). Pumpkin cake has a high content of arginine, phenylalanine, and methionine, making it a potential protein source for those with specific amino acid needs. Soybean cake boasts the highest lysine content but falls short in methionine and valine. Flaxseed cake stands out in threonine, serine, and valine but has the lowest histidine and arginine levels. Peanut cake shows remarkable strength in tyrosine, proline, and glycine but lacks threonine and methionine. Overall, the amino acid composition of these oil cakes varies significantly, with different types of oil cakes having different levels of different amino acids.
The highest amino acid ratio in all types of the studied cakes is for the amino acids leucine+isoleucine, which are necessary for hemoglobin synthesis.

3.4. Fatty Acid Composition of Oil Cake

The fatty acid composition of the cakes was studied. The composition of the fatty acids (FAs) of flax, soybean, peanut, and pumpkin seed cakes is shown in Table 5. The results revealed that caproic acid accounted for more than 97% of all fatty acids detected in the different types of cakes. The content of butyric acid in the different types of oil cake was slightly more than 2%.
The fatty acid composition of the different types of oilseed cakes, including flaxseed, soybean, sunflower, peanut, and pumpkin cakes, was investigated. The content of caproic acid was high in all types of cakes, ranging from 97.5% to 97.73%. Caproic acid, present in substantial amounts across all the oil cakes, is a medium-chain fatty acid known for its potential antimicrobial and antibacterial properties. It is associated with improved digestion and has been linked to positive effects on gut health [35,36]. Butyric acid content was also similar across all types of cakes, ranging from 2.15% to 2.25%. Butyric acid is crucial for promoting gut health and may contribute to anti-inflammatory and anti-cancer effects. It serves as a preferred energy source for intestinal cells [37]. Oleic acid, although present in relatively small amounts, is a monounsaturated fatty acid associated with cardiovascular health. It may contribute to reducing bad cholesterol levels and improving overall heart health [38].
Peanut cake had the highest omega-3 content (0.21%), while flaxseed cake had the lowest (0.0011%). The positive effect of omega-3 fatty acids on human health is well established, including reducing the risk of heart disease, stroke, and inflammation. Omega-3 fatty acids are essential for brain health and may play a role in preventing chronic diseases [39].

3.5. Mineral Composition of Oil Cake

Minerals are inorganic nutrients necessary for the maintenance of vital physical and chemical processes [40]. They can be divided into macronutrients, potassium, phosphorus, calcium, sodium, and chloride, and micronutrients: iron, copper, zinc, molybdenum, chromium, manganese, copper, and selenium.
The mineral composition of oil cake is equally important, as minerals play crucial roles in various physiological processes. This study aimed to compare the mineral composition of different types of oilseed cakes, providing valuable insights into their nutritional value. The mineral content of each cake was analyzed, revealing variations in magnesium, calcium, potassium, iron, phosphorus, zinc, sodium, and copper content (Table 6). Among the minerals analyzed, magnesium content displayed considerable differences across the different types of oilseed cakes. Pumpkin cake exhibited the highest magnesium content (472.63 mg/100 g) and phosphorus content (893.69 mg/100 g). Calcium content also varied significantly among the different types of oilseed cakes. Flaxseed cake exhibited the highest calcium content (225.92 mg/100 g), followed by soybean cake (214.71 mg/100 g), peanut cake (101.16 mg/100 g), and pumpkin cake (67.81 mg/100 g). Soybean cake displayed the highest potassium content (2549.0 mg/100 g), iron content (9.13 mg/100 g), and copper content (2.03 mg/100 g). Potassium is an essential mineral involved in maintaining fluid balance, nerve function, and muscle contractions [41]. The high potassium content in soybean cake suggests its potential as a valuable source of this mineral. Phosphorus content also varied significantly across the different types of oilseed cakes. Pumpkin cake exhibited the highest phosphorus content (893.69 mg/100 g), followed by flaxseed cake (672.31 mg/100 g), soybean cake (638.97 mg/100 g), and peanut cake (428.27 mg/100 g). Pumpkin cake exhibited the highest zinc content (6.74 mg/100 g), followed by flaxseed cake (5.63 mg/100 g), peanut cake (4.39 mg/100 g), and soybean cake (3.01 mg/100 g). Zinc is involved in numerous enzymatic reactions and plays a critical role in immune function and wound healing [42]. The relatively high zinc content in pumpkin cake suggests its potential as a dietary source of this essential mineral.
Comparative analysis with Petraru et al. (2021) [43] revealed substantial differences in calcium content, with sunflower cake displaying lower levels (152.21 mg/100 g). Discrepancies with Kolláthová et al. (2019) [44] were observed, especially regarding calcium content, where our results were notably lower for both flaxseed (225.92 mg/100 g) and soybean cakes (214.71 mg/100 g) compared to their findings (flaxseed: 361 mg/100 g, soybean: 349 mg/100 g). These variations may arise from differences in plant varieties, geographical locations, or analytical methods employed.
In terms of phosphorus, Kolláthová et al. (2019) reported higher levels in flaxseed cake (952 mg/100 g) and lower levels in soybean cake (608 mg/100 g) compared to our results. The iron content reported by Kolláthová et al. (2019) aligns with our findings for both flaxseed (5.95 mg/100 g) and soybean cakes (7.18 mg/100 g). However, notable discrepancies were observed in copper content, where our results were substantially lower for both flaxseed (1.01 mg/100 g) and soybean cakes (2.03 mg/100 g) compared to Kolláthová et al.’s (2019) findings (flaxseed: 1.42 mg/100 g, soybean: 1.32 mg/100 g).

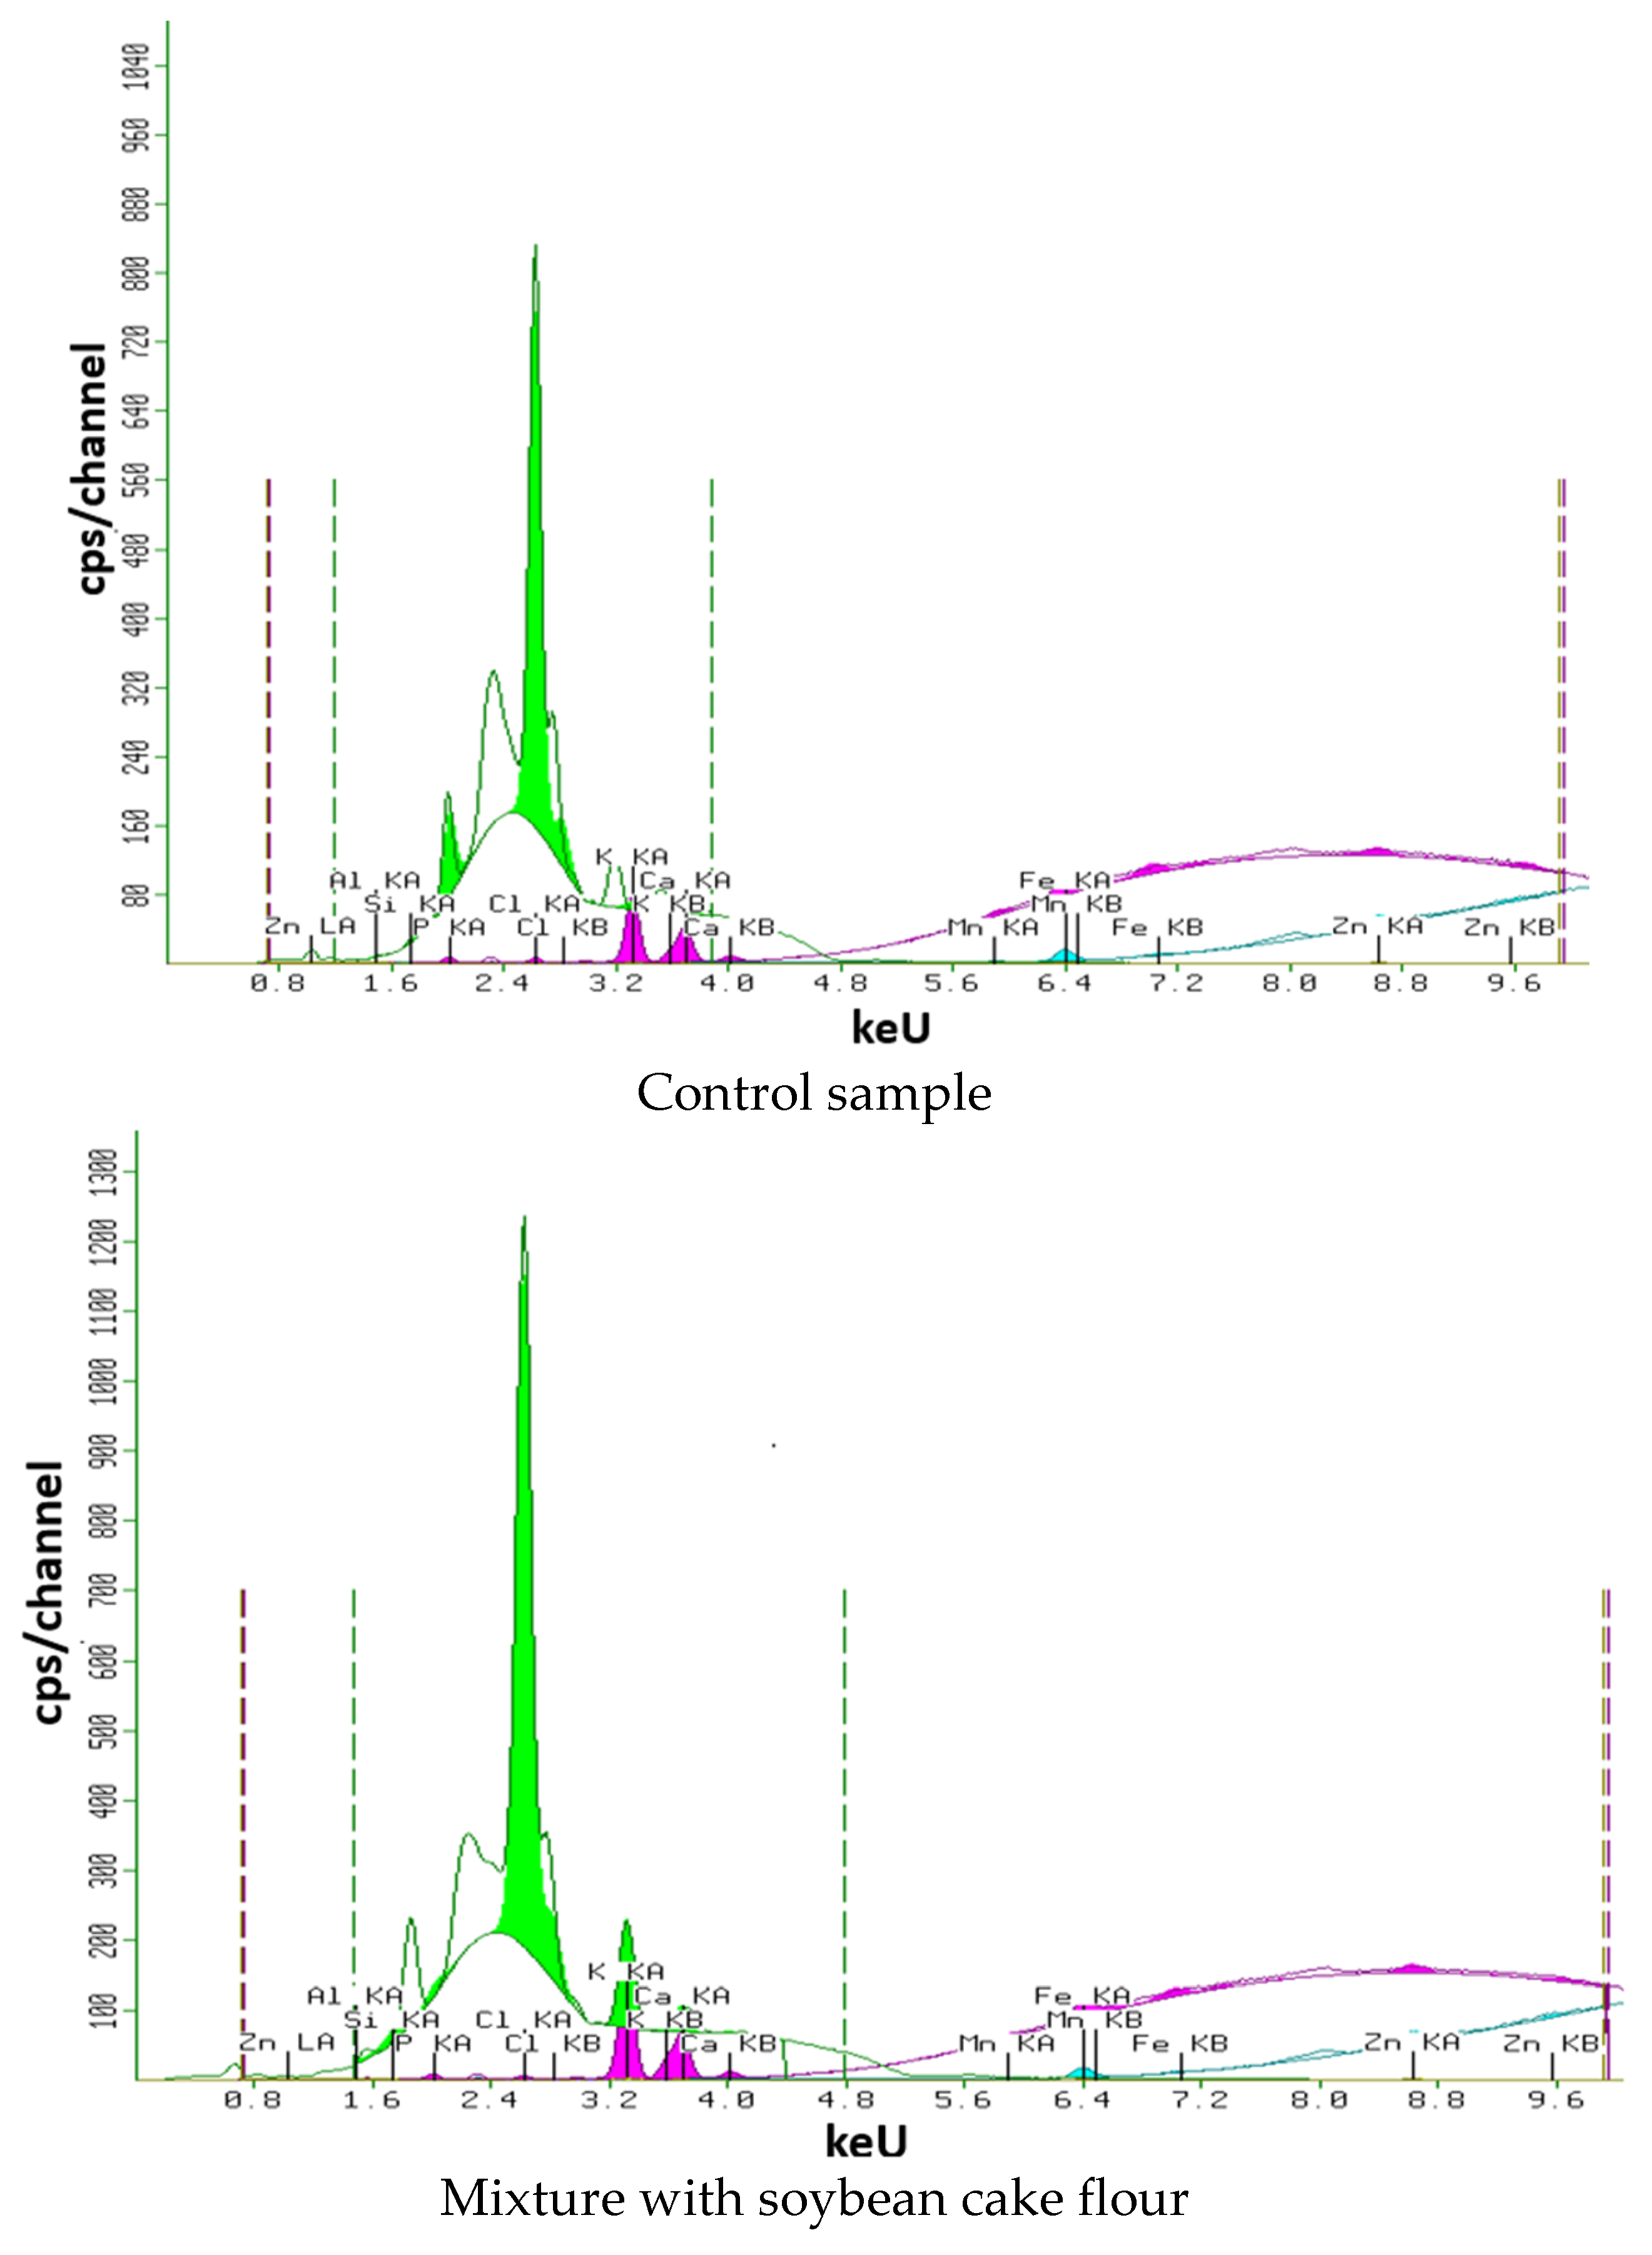
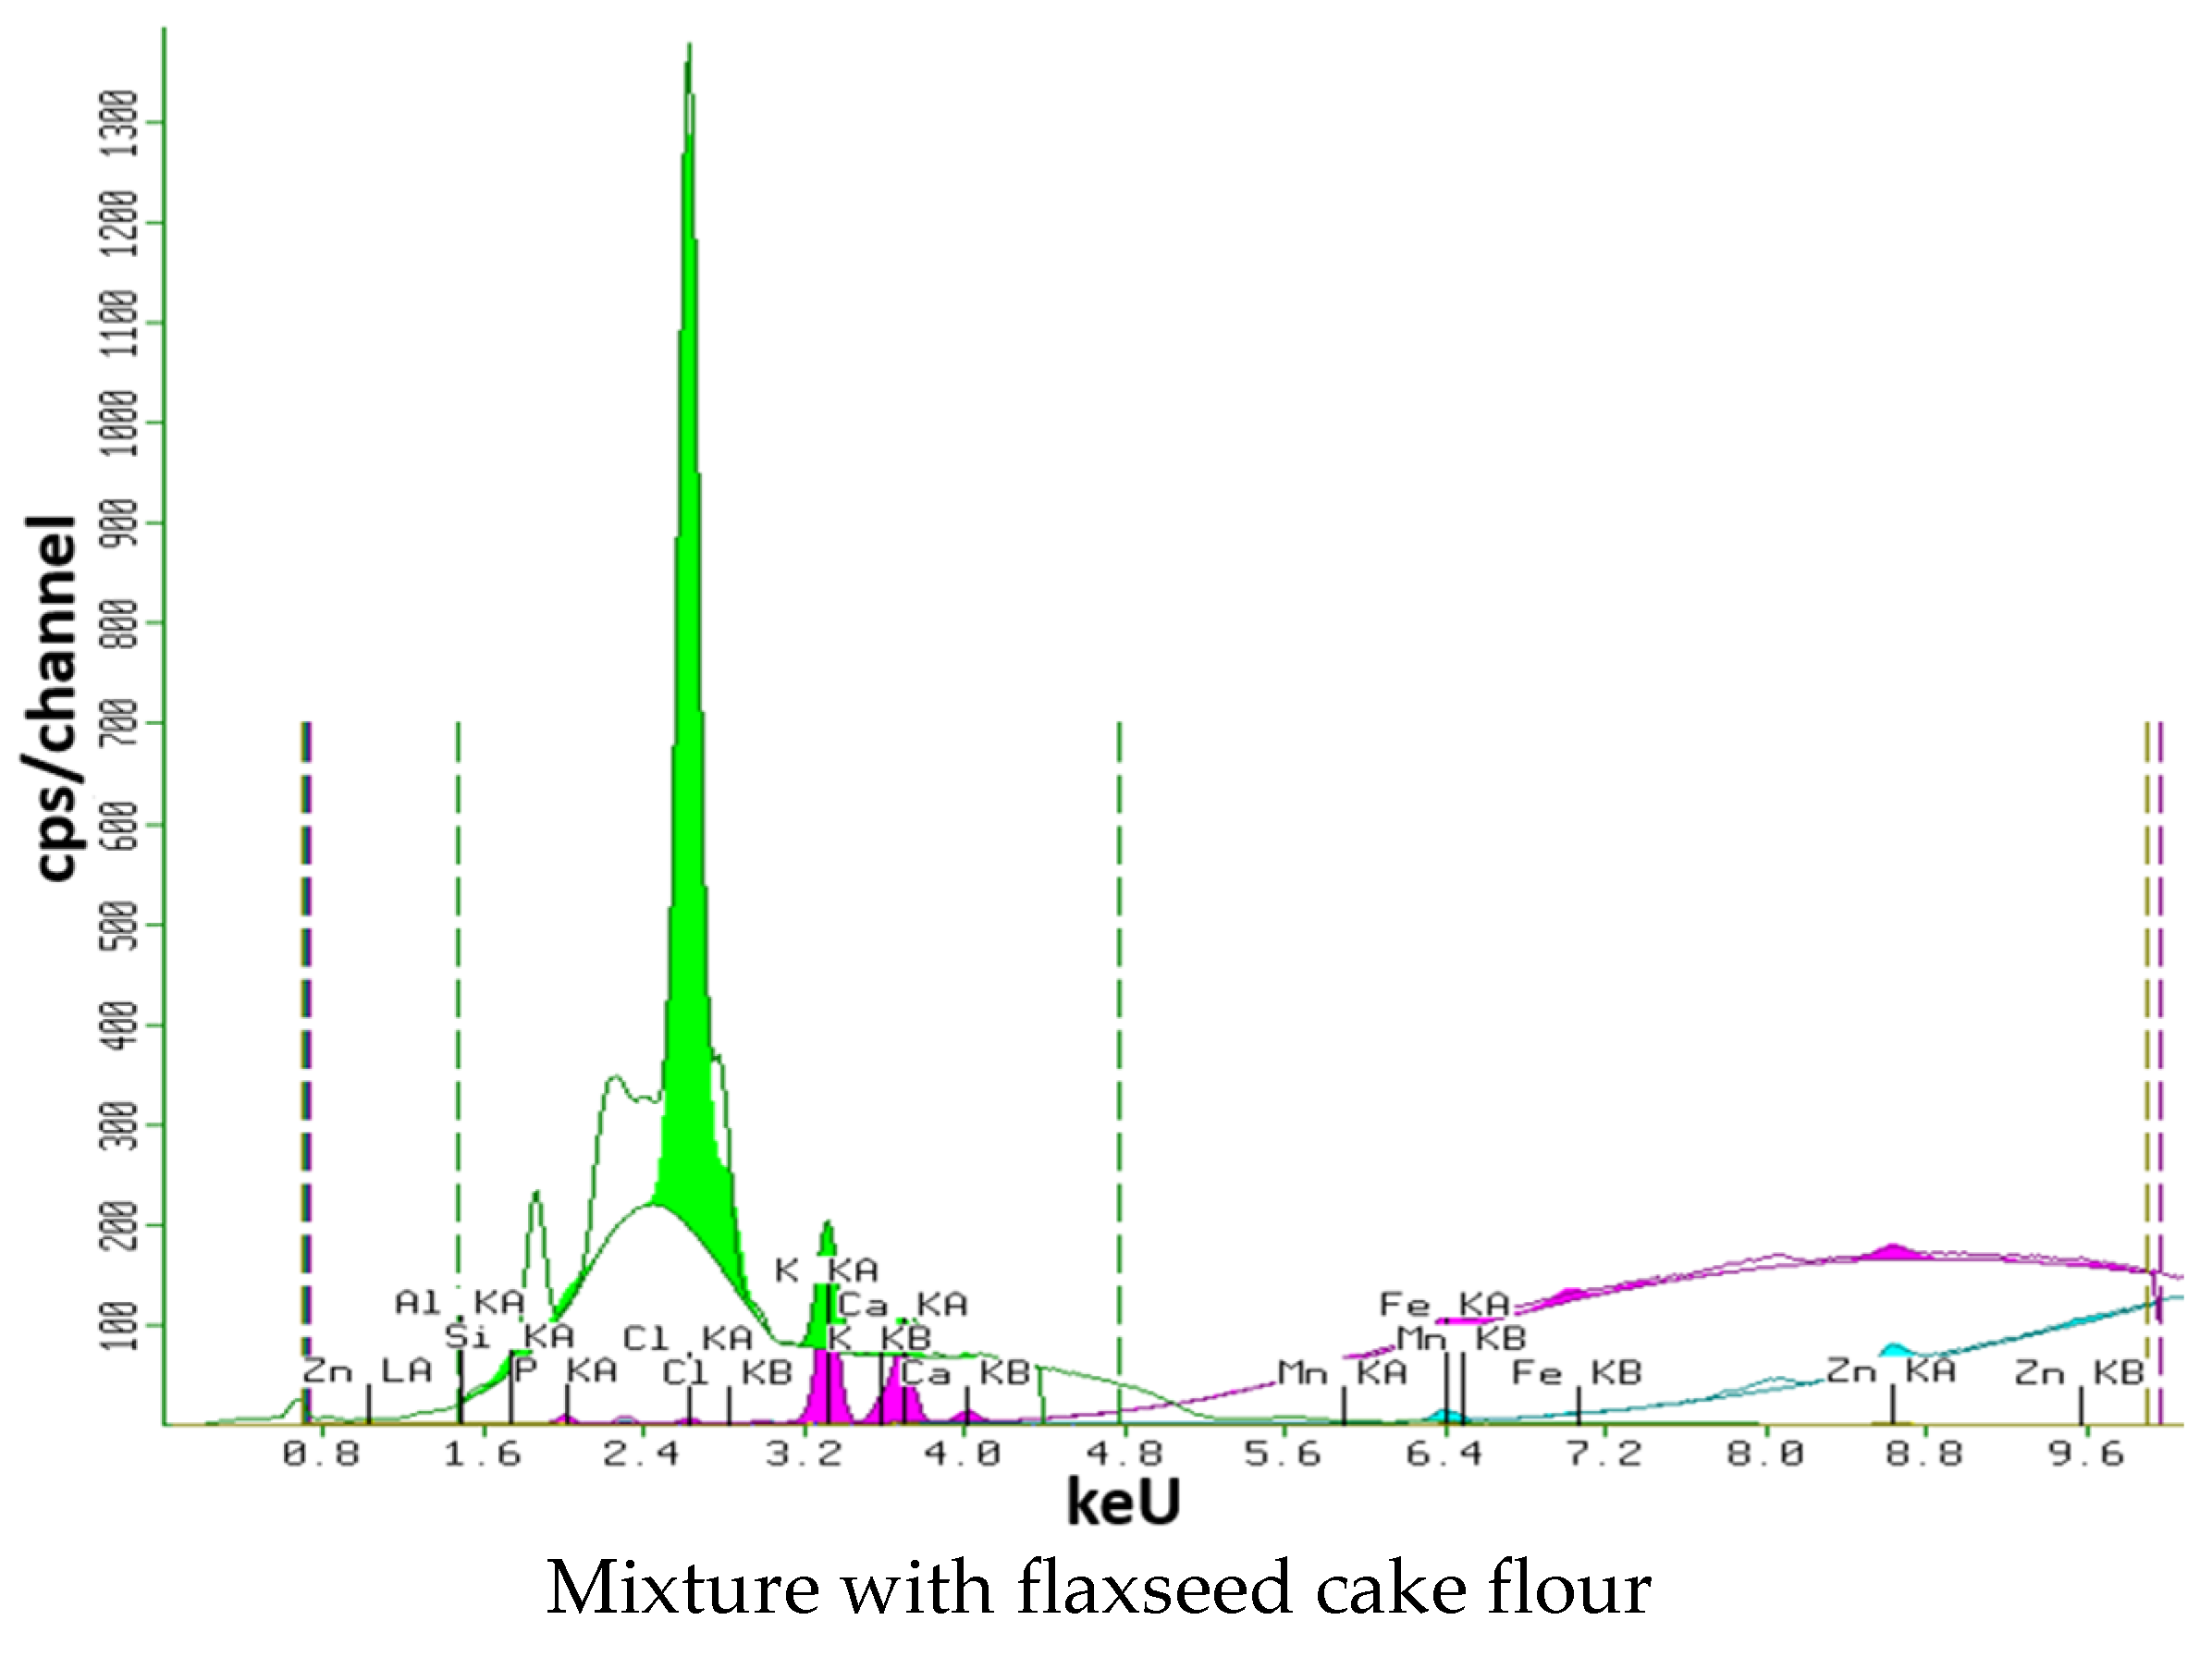
3.6. X-ray Fluorescence Analysis

The structural characteristics and chemical composition of gluten-free mixtures with the addition of oilseed cake flour depend on the quality of the oilseeds, methods and modes of preparation for pressing, pressing method and equipment, as well as microstructure. Figure 2 shows the result of the X-ray fluorescence analysis of the composition of gluten-free mixtures with the addition of oilseed cake flour.
The diffractogram in Figure 2 shows that the main part of the various gluten-free mixtures is amorphous; however, the presence of a small amount of monoclinic crystalline lattice lines with Miller indices equal to (−101), (004), and (−122) was detected from the diffractogram lines within = 10–30°. Obviously, this is due to the microstructure of the oilseed cake flour. Its degree of crystallinity is 27%, 30%, 30%, 28%, 25%, and 24%, that is, it is clearly visible that 70–80% of the composition of these gluten-free mixtures is amorphous. The structure of oil cake flour is amorphous, as it is made up of particles lacking a specific shape and order. Maintaining the amorphous structure in gluten-free mixtures is crucial because it ensures the desired texture, stability, and processing characteristics of the final product.

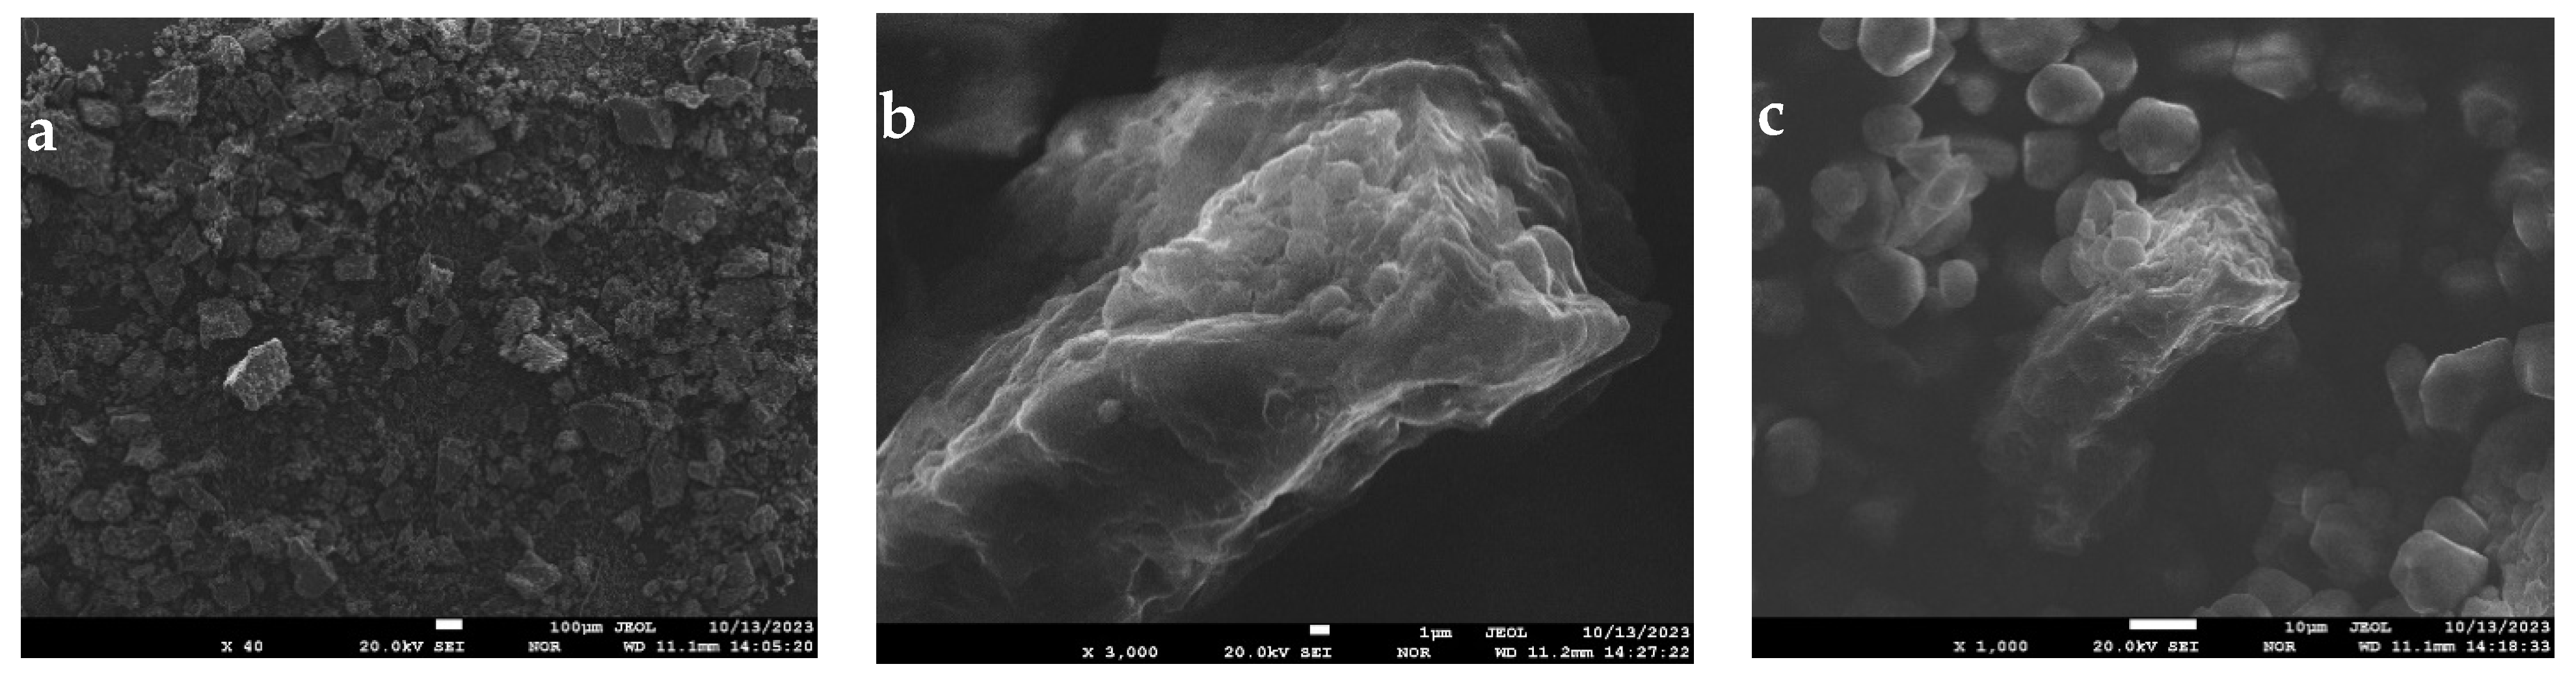
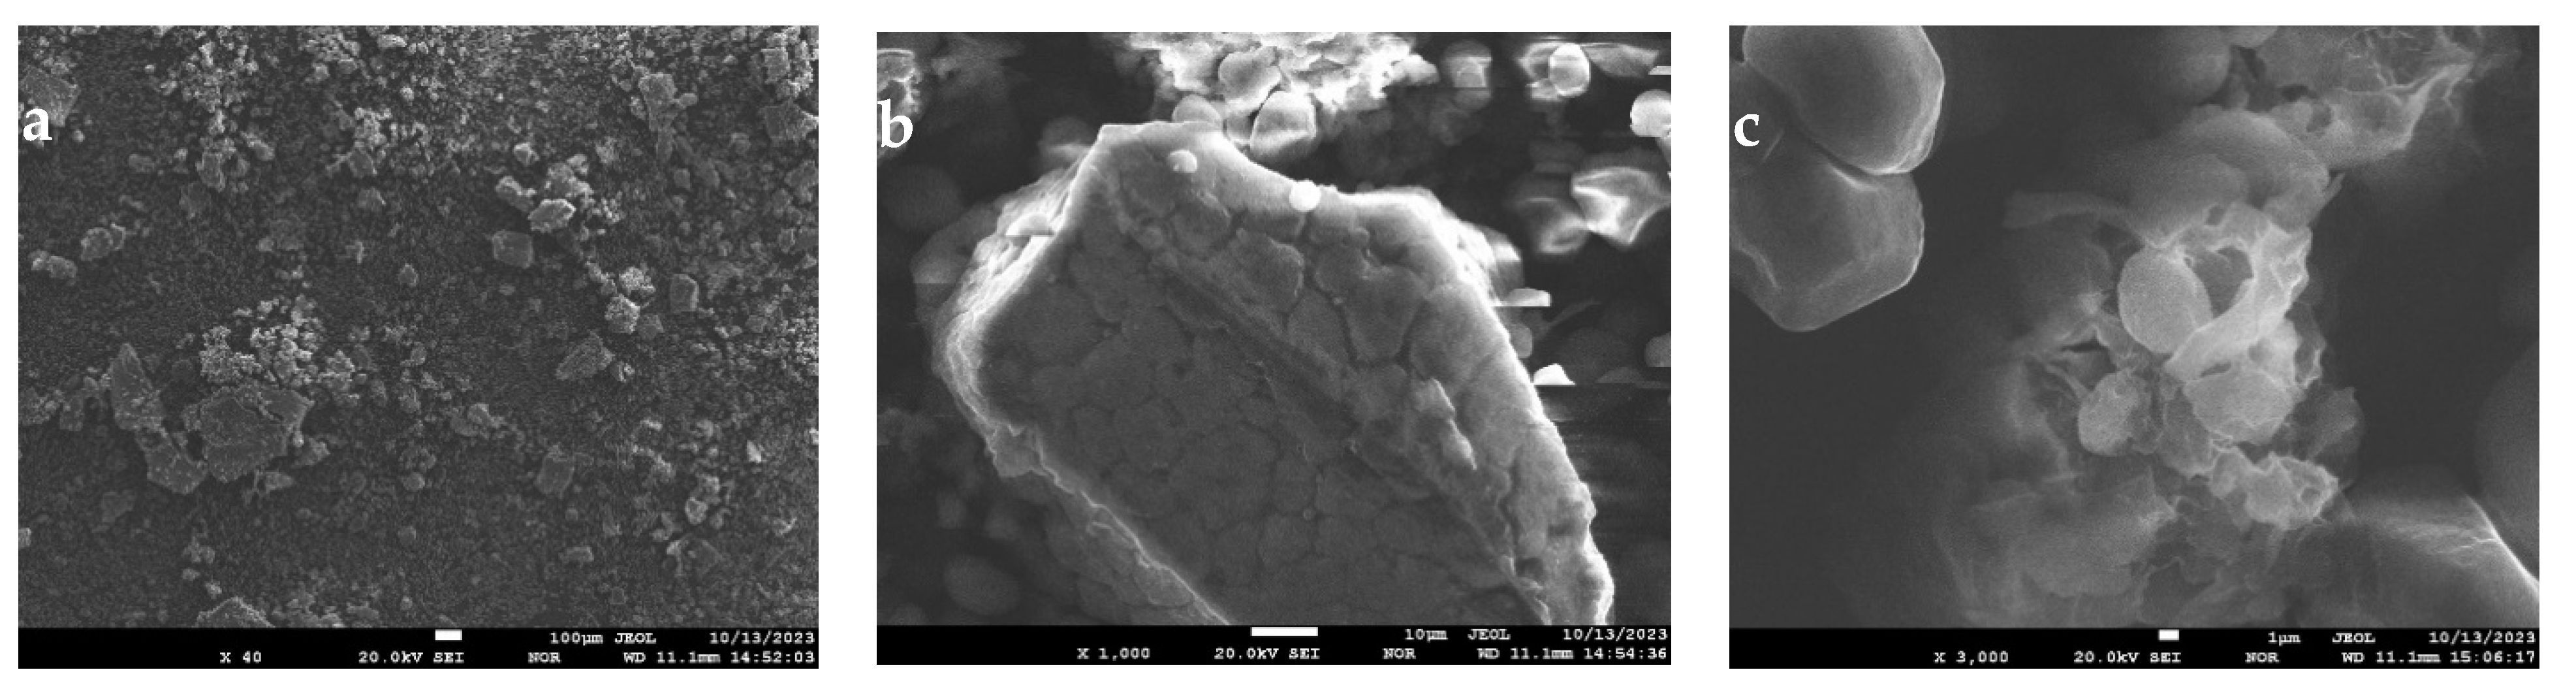
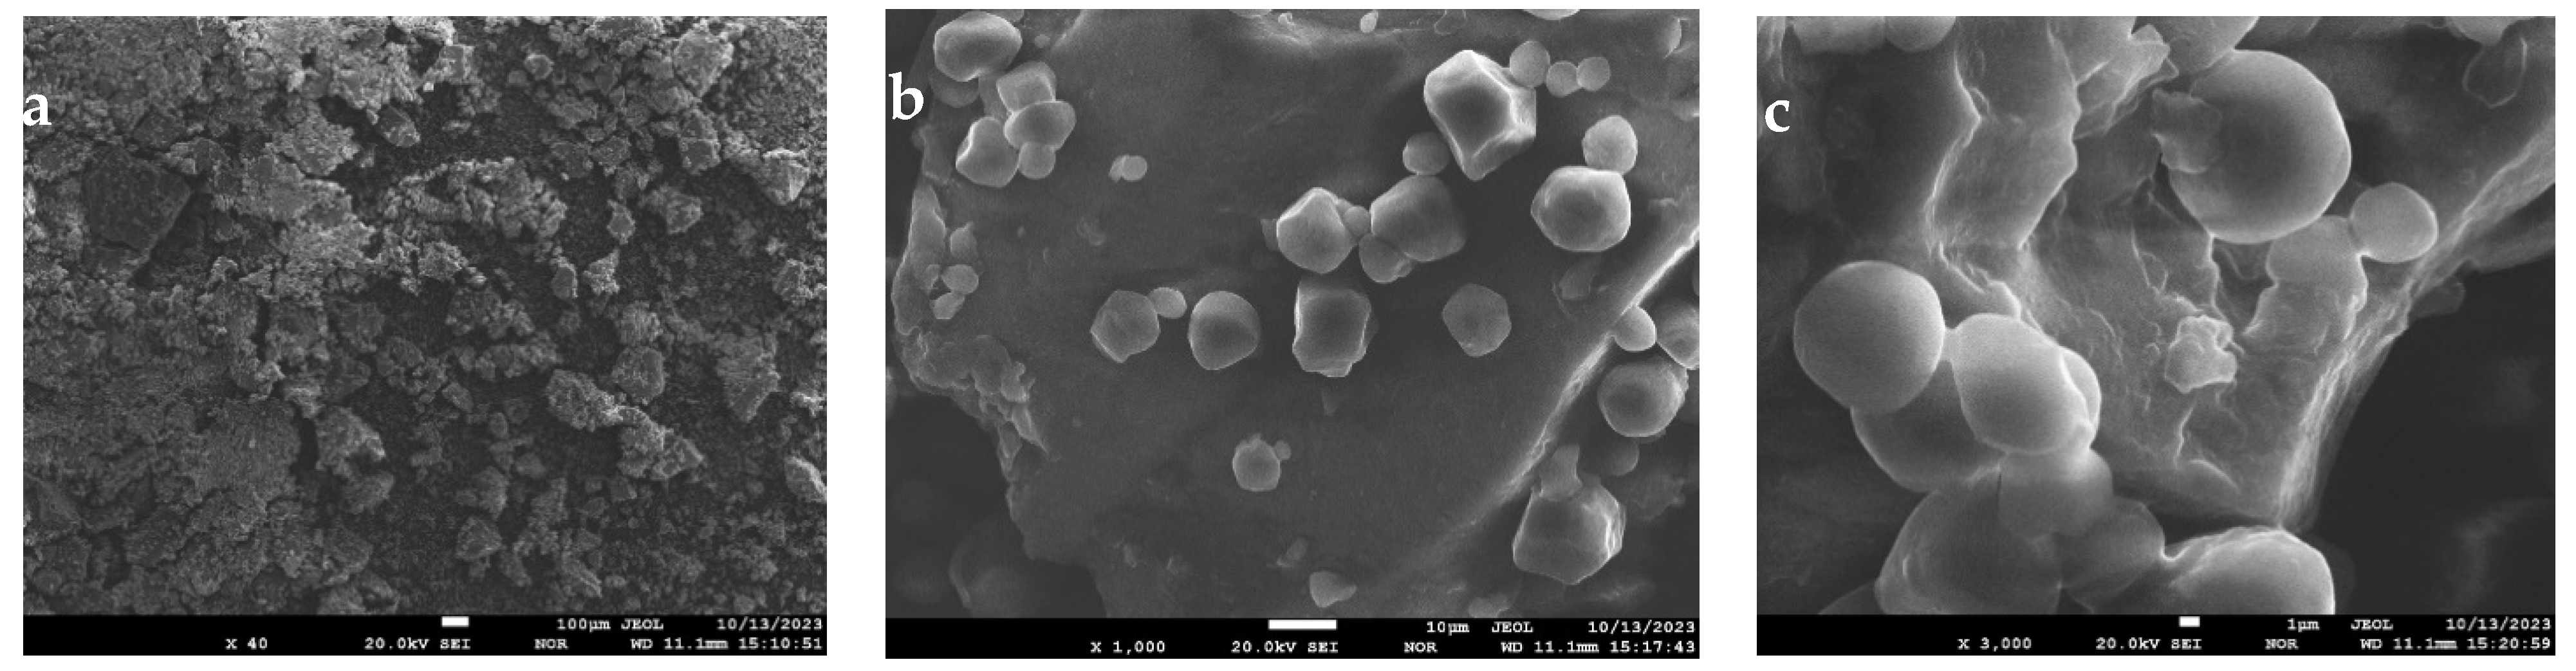
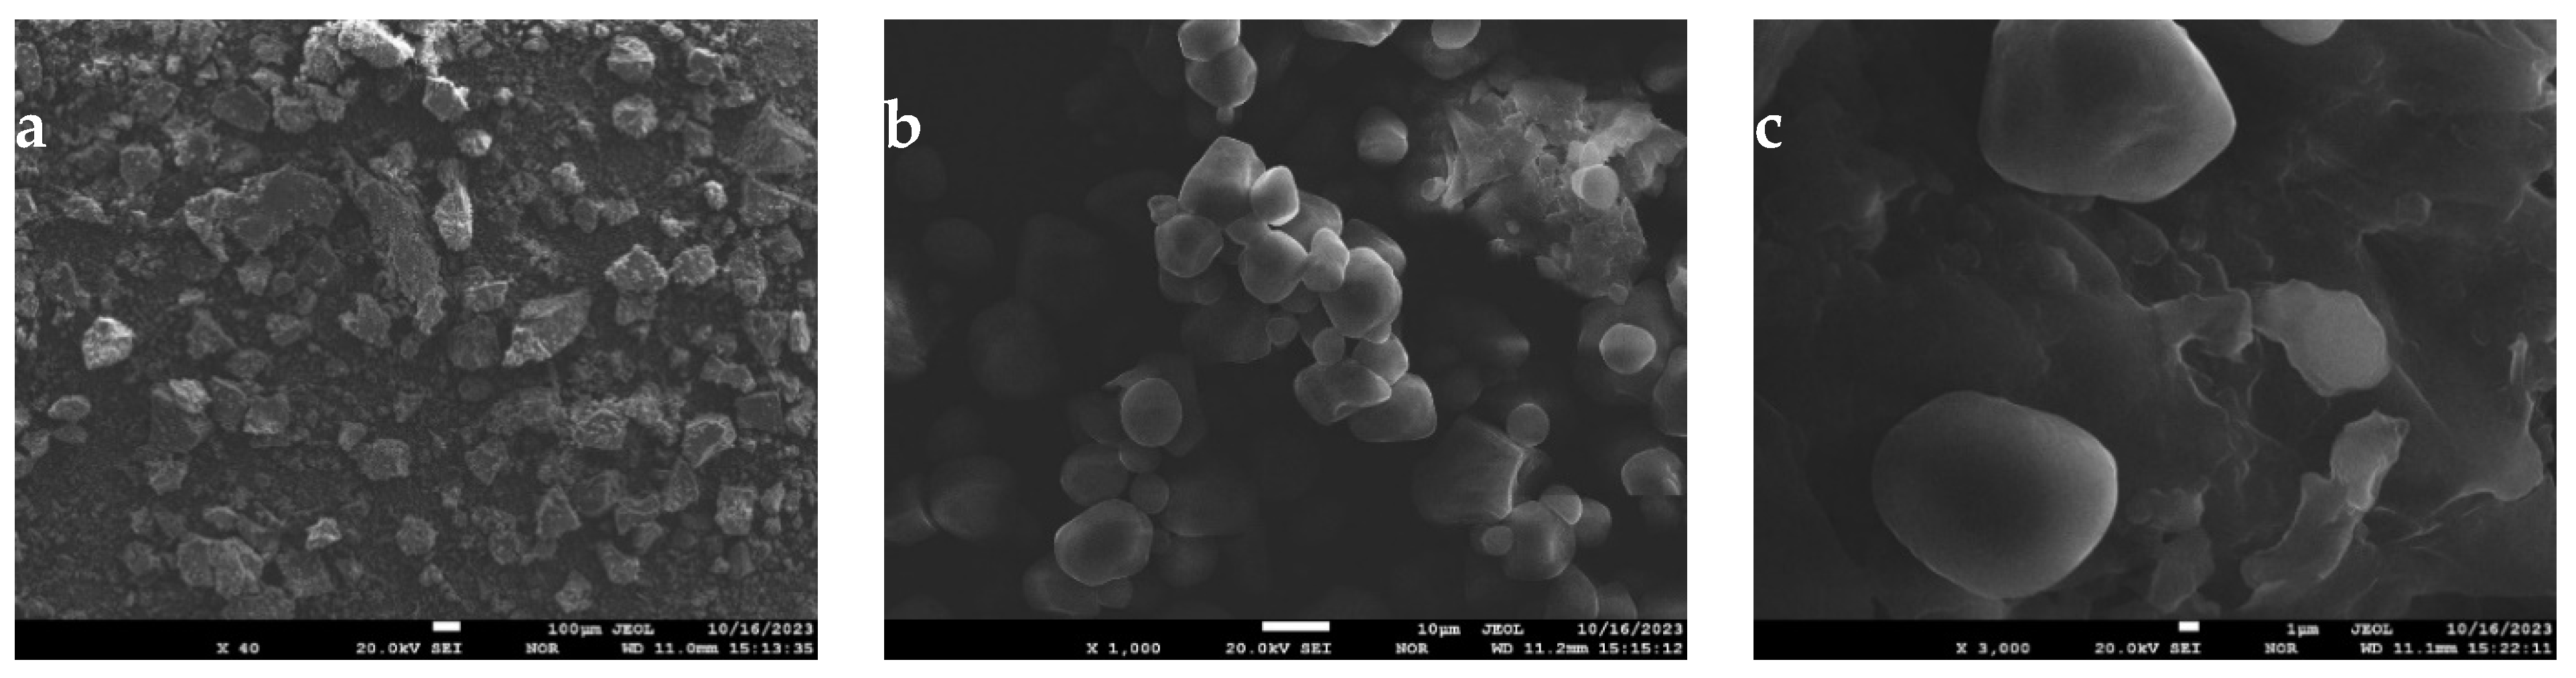
3.7. Electron Microscopy

3.7.1. Gluten-Free Mixture (Control Sample)

The sample is a powder that consists of two ensembles of particles: large (up to 0.4 mm) and small—with sizes from 3 to 20 microns. The large particles have signs of a brittle fracture in the form of smooth surfaces and even edges. At the same time, the small particles have a smoothed surface and create areas of adhesion between themselves, and a moderate number of pits around 1 micron in diameter are observed on their surface (Figure 3).

3.7.2. Soy Cake Flour Mixture

The sample is a powder that consists of two ensembles of particles: large (up to 0.5 mm) and small—with sizes from 2.5 to 20 microns. The large particles have signs of a brittle fracture in the form of smooth surfaces and even edges. At the same time, the small particles have a smoothed surface and create areas of adhesion between themselves (Figure 4).

3.7.3. Pumpkin Cake Flour Mixture

The sample is a powder that consists of two ensembles of particles: large (up to 0.45 mm) and small—with sizes from 5 to 25 microns. The large particles have signs of a brittle fracture in the form of smooth surfaces and even edges. At the same time, the small particles have a smoothed surface, create areas of adhesion between themselves, and on their surface, a moderate number of pits around 1 micron in diameter are sometimes observed (Figure 5).

3.7.4. Sunflower Cake Flour Mixture

The sample is a powder that consists of two ensembles of particles: large (up to 0.6 mm) and small—with sizes from 4 to 16 microns. The large particles have signs of a brittle fracture in the form of smooth surfaces and even edges. At the same time, the small particles have a smoothed surface and are often agglomerated. The fine structure of the small particles is characterized by the presence of finer (around 3 microns) particles linked together (Figure 6).

3.7.5. Peanut Cake Flour Mixture

The sample is a powder that consists of two ensembles of particles: large (up to 0.4 mm) and small—with sizes from 2.5 to 20 microns. The large particles have signs of a brittle fracture in the form of smooth surfaces and even edges. At the same time, the small particles have a smoothed surface and create areas of adhesion between themselves (Figure 7).

3.7.6. Flaxseed Cake Flour Mixture

The sample is a powder that consists of two ensembles of particles: large (up to 0.6 mm) and small—with sizes from 2.5 to 22 microns. The large particles have signs of a brittle fracture in the form of smooth surfaces and even edges. At the same time, the small particles have a smoothed surface and create areas of adhesion between themselves (Figure 8).
The microscopy results showed that the ground-to-flour size of oilseed meal in a gluten-free mixture has a structure corresponding to the control sample and can be used as an ingredient in food production.

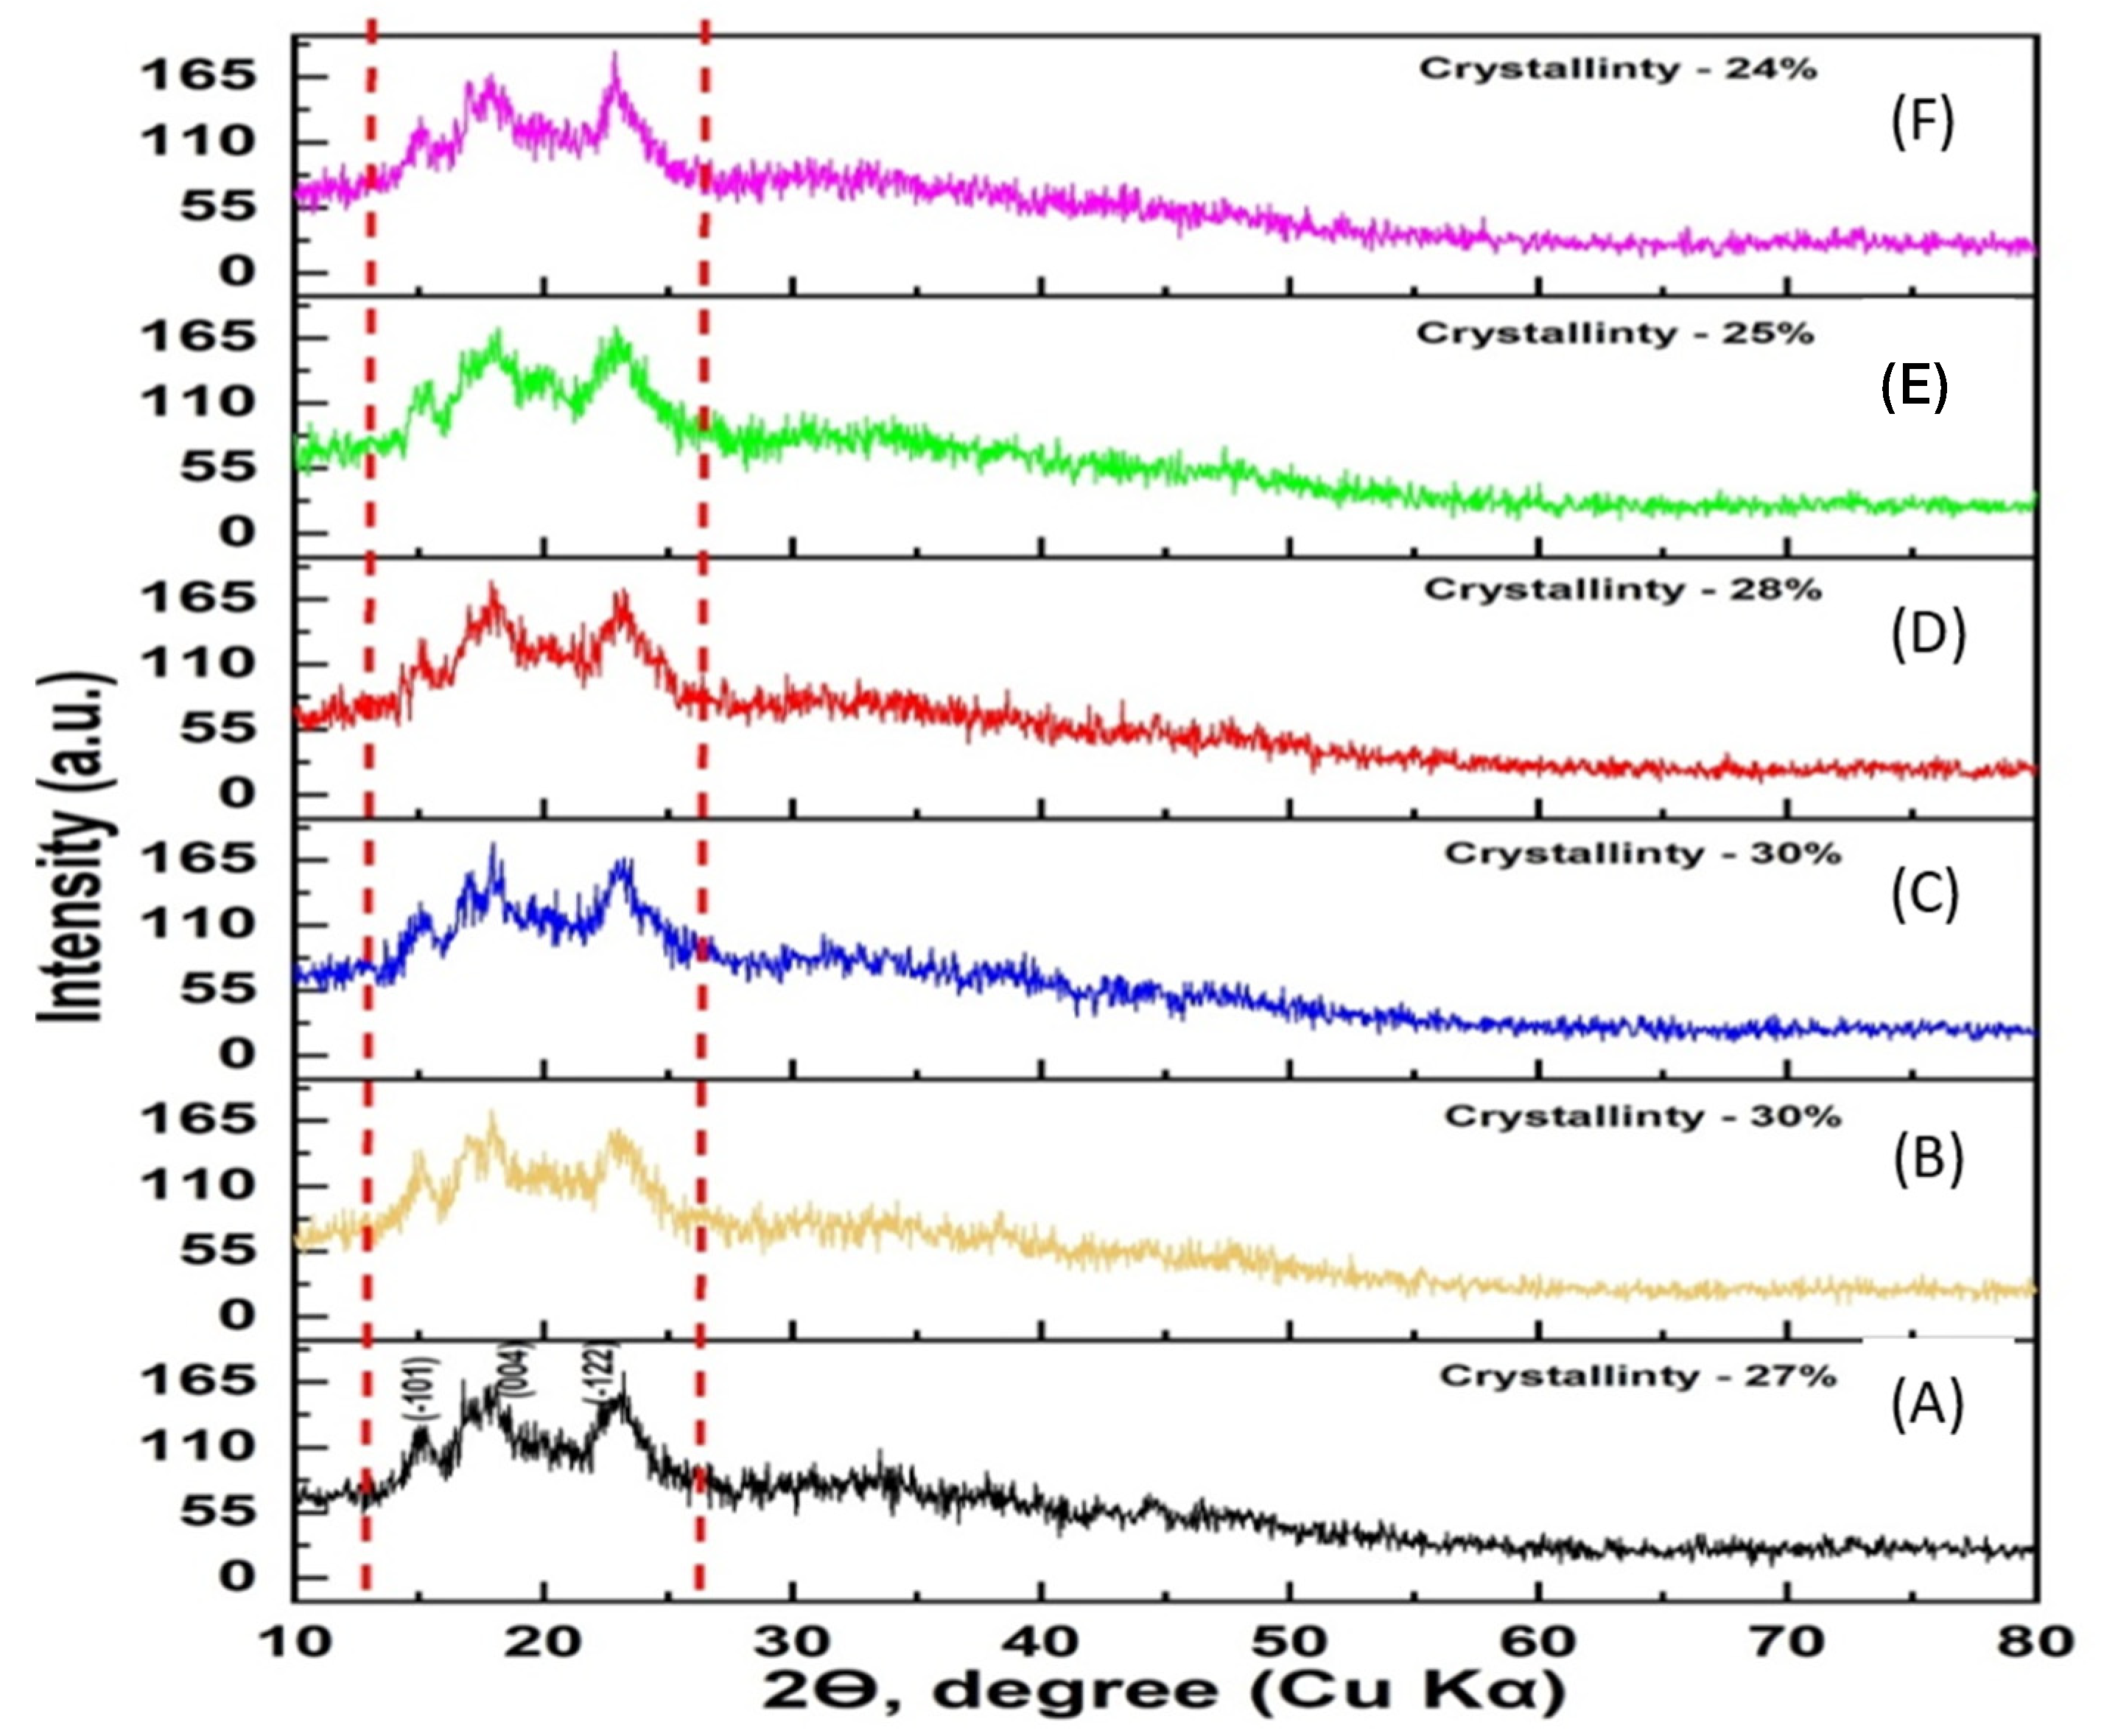
3.8. X-ray Phase Analysis

XRD is designed for high-precision and reproducible analysis of the chemical composition of the sample under study and allows for determining elements from sodium to uranium and determining the concentration of these elements in a wide range from fractions of ppm to 100% [45,46]. The results of the X-ray phase analysis of the composition of a gluten-free mixture are presented in Table 7.
As can be seen from Table 7, the gluten-free mixtures with the addition of oilseed meal exceed the control sample in terms of the content of potassium, calcium, silicon, manganese, and zinc. Thus, soy flour has the highest content of potassium (1.017%) and iron (0.033%) compared to 0.527% and 0.029%, respectively. In flaxseed flour, the calcium content is 0.53%, which is almost twice as high as the control. The presence of aluminum is due to the presence of rice flour in the mixture.
The results of the X-ray fluorescence analysis studies of forty-six soybean samples showed that there were some differences among the trace element contents, reflecting the difference in their geographical origin. In [47], 23 oilseed samples were grown in different locations in Japan, and the remaining 23 samples were imported into Japan. Statistical analysis showed that the concentrations of eight elements (Mg, P, Cl, K, Mn, Cu, Br, and Ba) were good parameters for constructing the discriminant function of geographical origin. The results demonstrate that XRF is useful as a fast and simple tool for analyzing the origin of agricultural products.
The researchers in [48] quantified, compared, and analyzed some different chemical elements in brown and golden flax seeds using XRF. This method is versatile, fast, and non-destructive, allowing researchers to recognize some chemical elements and quantify them in real time and reach detection limits as low as 0.002% (20 parts per million). The results indicate that potassium, calcium, zinc, manganese, iron, and bromine contents are present in flaxseed, as expected compared to the TACO (Brazilian Table of Nutritional Composition).
The results of the mineral composition of pumpkin seed meal using XRF spectroscopy showed that it contains a significant amount of minerals, with potassium content being the highest (102.40–147.65 mg/100 g) and manganese content (0.00–0.07 mg/100 g) being the lowest [49].
X-ray spectra of samples of gluten-free mixtures with the addition of oilseed meal are shown in Figure 9.
As can be seen from Figure 9, the gluten-free mixture with the addition of oilseed meal has a similar content of the studied elements. The iron content is approximately the same in all samples, from 0.033 to 0.025%, due to the addition of corn flour (Fe = 0.032%) to the control recipe. The addition of various types of oilseed meals does not significantly affect the iron content. In the control sample, the highest phosphorus content is 0.384%, which is explained by the addition of rice flour (p = 0.400%).
The use of oilseed meal in the composition of a gluten-free mixture allows the enrichment of the food product with the necessary macro- and microelements, does not change the structure of the gluten-free mixture, and can be used as an ingredient in food production.

4. Conclusions

Based on the studies conducted, it can be concluded that oilseed cake flour in the composition of a gluten-free mixture does not affect its structural properties—the mixture is 70–80% amorphous in structure; it enriches the mixture with such elements as potassium, calcium, silicon, manganese, and zinc. The mixture with soy flour contains the highest amount of potassium and iron. The mixture with flaxseed flour is enriched with calcium by almost two times. The oilseed cake flour has a corresponding similar structure and can be used as an ingredient in food production. The results of this study show that oilseed meal flour is a promising ingredient for gluten-free products. It can be used to improve the nutritional value of these products, without affecting their structural properties.

Supplementary Materials

The following supporting information can be downloaded at: https://www.mdpi.com/article/10.3390/pr12081616/s1.

Author Contributions

Conceptualization, Z.S.; data curation, G.K.; formal analysis, M.S. and G.K.; investigation, Z.S. and N.K.; methodology, Z.S.; project administration, N.M.; resources, N.K.; validation, M.S.; writing—original draft, N.M. and G.K.; writing—review and editing, M.S. and N.K. All authors have read and agreed to the published version of the manuscript.

Funding

The article was written within the framework of the scientific and technical program of program-targeted financing of Ministry of Trade and Integration of Republic of Kazakhstan: IRN BR12967830 “Development of technical regulation tools to improve efficiency, safety, resource saving of food production and environmentally friendly packaging”.

Data Availability Statement

All data are contained within the manuscript.

Acknowledgments

RSE “Kazakhstan Institute of Standardization and Metrology” of the Committee of Technical Regulation and Metrology of the Ministry of Trade and Integration of RK expresses its gratitude to the staff of the Kazakh Research Institute of Processing and Food Industry of the Ministry of Agriculture of RK in Astana for the support during the implementation of the Project. Spectroscopic methods of analysis of gluten-free mixtures were carried out at the Scientific Center of Composite Materials (Almaty, Kazakhstan).

Conflicts of Interest

The authors declare no conflicts of interest.

References

  1. USDA Forecasts 2M Tonnes Rise in Global 2022/23 Oilseed Production to 657M Tonnes. Published 24 October 2022. Available online: https://www.ofimagazine.com/news/usda-forecasts-2m-tonnes-rise-in-global-2022-23-oilseed-production-to-657m-tonnes (accessed on 18 July 2024).
  2. Sarwar, F.; Qadri, N.A.; Moghal, S. The role of oilseeds nutrition in human health: A critical review. J. Cereals Oilseeds 2013, 4, 97–100. [Google Scholar] [CrossRef]
  3. Gupta, A.; Sharma, R.; Sharma, S.; Singh, B. Oilseed as potential functional food Ingredient. In Trends & Prospects in Food Technology, Processing and Preservation, 1st ed.; Prodyut Kumar, P., Mahawar, M.K., Abobatta, W., Panja, P., Eds.; Today and Tomorrow’s Printers and Publishers: New Delhi, India, 2018; pp. 25–58. [Google Scholar]
  4. Rakita, S.; Kokić, B.; Manoni, M.; Mazzoleni, S.; Lin, P.; Luciano, A.; Ottoboni, M.; Cheli, F.; Pinotti, L. Cold-Pressed Oilseed Cakes as Alternative and Sustainable Feed Ingredients: A Review. Foods 2023, 12, 432. [Google Scholar] [CrossRef] [PubMed]
  5. Bárta, J.; Bártová, V.; Jarošová, M.; Švajner, J.; Smetana, P.; Kadlec, J.; Filip, V.; Kyselka, J.; Berčíková, M.; Zdráhal, Z.; et al. Oilseed Cake Flour Composition, Functional Properties and Antioxidant Potential as Effects of Sieving and Species Differences. Foods 2021, 10, 2766. [Google Scholar] [CrossRef]
  6. Teh, S.-S.; Morlock, G.E. Analysis of Bioactive Components of Oilseed Cakes by High-Performance Thin-Layer Chromatography-(Bio)assay Combined with Mass Spectrometry. Chromatography 2015, 2, 125–140. [Google Scholar] [CrossRef]
  7. Terpinc, P.; Čeh, B.; Ulrih, N.; Abramovič, H. Studies of the correlation between antioxidant properties and the total phenolic content of different oil cake extracts. Ind. Crops Prod. 2012, 39, 210–217. [Google Scholar] [CrossRef]
  8. The, S.S.; Bekhit, A.E. Utilization of oilseed cakes for human nutrition and health benefits. In Agricultural Biomass Based Potential Materials; Hakeem, K.R., Jawaid, M., Alothman, O.Y., Eds.; Springer International Publishing: Cham, Switzerland, 2015; pp. 191–229. [Google Scholar] [CrossRef]
  9. Zając, M.; Guzik, P.; Kulawik, P.; Tkaczewska, J.; Florkiewicz, A.; Migdal, W. The quality of pork loaves with the addition of hemp seeds, de-hulled hemp seeds, hemp protein and hemp flour. LWT-Food Sci. Technol. 2019, 105, 190–199. [Google Scholar] [CrossRef]
  10. Muhammad Anjum, F.; Nadeem, M.; Issa Khan, M.; Hussain, S. Nutritional and therapeutic potential of sunflower seeds: A review. Br. Food J. 2012, 114, 544–552. [Google Scholar] [CrossRef]
  11. Ancuţa, P.; Sonia, A. Oil press-cakes and meals valorization through circular economy approaches. Appl. Sci. 2020, 10, 7432. [Google Scholar] [CrossRef]
  12. Kuijsten, A.; Arts, I.C.W.; Van’t Veer, P.; Hollman, P.C.H. The relative bioavailability of enterolignans in humans is enhanced by milling and crushing of flaxseed. J. Nutr. 2005, 135, 2812–2816. [Google Scholar] [CrossRef]
  13. Edel, A.L.; Aliani, M.; Pierce, G.N. Stability of bioactives in flaxseed and flaxseed-fortified foods. Food Res. Int. 2015, 77, 140–155. [Google Scholar] [CrossRef]
  14. Kaur, S.; Kumar, K.; Singh, L.; Sharanagat, V.S.; Nema, P.K.; Mishra, V.; Bhushan, B. Gluten-free grains: Importance, processing and its effect on quality of gluten-free products. Crit. Rev. Food Sci. Nutr. 2022, 64, 1988–2015. [Google Scholar] [CrossRef] [PubMed]
  15. Bouasla, A.; Wójtowicz, A.; Zidoune, M.N. Gluten-free precooked rice pasta enriched with legumes flours: Physical properties, texture, sensory attributes and microstructure. LWT 2017, 75, 569–577. [Google Scholar] [CrossRef]
  16. Sajid Mushtaq, B.; Zhang, W.; Al-Ansi, W.; Ul Haq, F.; Rehman, A.; Omer, R.; Mahmood Khan, I.; Niazi, S.; Ahmad, A.; Ali Mahdi, A.; et al. A Critical Review on the Development, Physicochemical Variations and Technical Concerns of Gluten Free Extrudates in Food Systems. Food Rev. Int. 2021, 39, 2806–2834. [Google Scholar] [CrossRef]
  17. Pashchenko, L.P.; Zharkova, I.M. Rational Use of Vegetable Protein-Containing Raw Materials in Bread Technology; FGUP IPF “Voronezh”: Voronezh, Russia, 2003. [Google Scholar]
  18. Murphy, D.B.; Davidson, M.W. Fundamentals of Light Microscopy and Electronic Imaging; John Wiley & Sons: Hoboken, NJ, USA, 2012. [Google Scholar] [CrossRef]
  19. Garcia-Garcia, F.J.; Tang, Y.; Gotor, F.J.; Sayagués, M.J. Development by Mechanochemistry of La0.8Sr0.2Ga0.8Mg0.2O2.8 Electrolyte for SOFCs. Materials 2020, 13, 1366. [Google Scholar] [CrossRef] [PubMed]
  20. Watson, J.G.; Chow, J.C.; Frazier, C.A. Chapter 2: X-ray Fluorescence Analysis of Ambient Air Samples. In Elemental Analysis of Airborne Particles; Landsberger, S., Creatchman, M., Eds.; Gordon and Breach Science: Amsterdam, The Netherlands, 1999; Volume 1. [Google Scholar]
  21. Yessimbekov, Z.; Kakimov, A.; Caporaso, N.; Suychinov, A.; Kabdylzhar, B.; Shariati, M.A.; Baikadamova, A.; Domínguez, R.; Lorenzo, J.M. Use of Meat-Bone Paste to Develop Calcium-Enriched Liver Pâté. Foods 2021, 10, 2042. [Google Scholar] [CrossRef] [PubMed]
  22. GOST R 55569-2013; Fodders, Mixed Fodders, Mixed Fodder Raw Materials. Determination of Proteinogenic Amino Acids by Capillary Electrophoresis. Standardinform: Moscow, Russia, 2014; 18p.
  23. GOST R 55483-2013; Meat and Meat Products. Determination of Fatty Acid Composition by Gas Chromatography: Introduced for the First Time: Date of Introduction 1 July 2014; Developed by V.M. Gorbatov VNIIMP of Rosselkhozakademia. Standardinform: Moscow, Russia, 2014; 16p.
  24. Zauer, E.A.; Ershov, A.B. Modern analyzers for the determination of nitrogen by the Kjeldahl method. Anal. Control 2019, 23, 168–192. [Google Scholar] [CrossRef]
  25. GOST R 54705-2011; Cakes, Meal and Mustard Powder. Method for Determining the Mass Fraction of Moisture and Volatile Substances. Izd vo Standards: Moscow, Russia, 2011; 8p.
  26. GOST 13979.6-69; Cakes, Meal and Mustard Powder. Method for Determination of Ash. Izd vo Standards: Moscow, Russia, 1969; 3p.
  27. Ogunronbi, O.; Jooste, P.J.; Abu, J.O.; Van der Merwe, B. Chemical composition, storage stability and effect of cold-pressed flaxseed oil cake inclusion on bread quality. J. Food Process. Preserv. 2011, 35, 64–79. [Google Scholar] [CrossRef]
  28. Kaur, M.; Singh, B.; Kaur, A.; Singh, N. Proximate, mineral, amino acid composition, phenolic profile, antioxidant and functional properties of oilseed cakes. Int. J. Food Sci. Technol. 2021, 56, 6732–6741. [Google Scholar] [CrossRef]
  29. Mannucci, A.; Castagna, A.; Santin, M.; Serra, A.; Mele, M.; Ranieri, A. Quality of flaxseed oil cake under different storage conditions. LWT 2019, 104, 84–90. [Google Scholar] [CrossRef]
  30. Aydin, E.; Turgut, S.S.; Aydin, S.; Cevik, S.; Ozcelik, A.; Aksu, M.; Ozcelik, M.M.; Ozkan, G. A New Approach for the Development and Optimization of Gluten-Free Noodles Using Flours from Byproducts of Cold-Pressed Okra and Pumpkin Seeds. Foods 2023, 12, 2018. [Google Scholar] [CrossRef]
  31. Budžaki, S.; Strelec, I.; Krnić, M.; Alilović, K.; Tišma, M.; Zelić, B. Proximate analysis of cold-press oil cakes after biological treatment with Trametes versicolor and Humicola grisea. Eng. Life Sci. 2018, 18, 924–931. [Google Scholar] [CrossRef] [PubMed]
  32. Vershinina, O.; Derevenko, V.; Milovanova, E. Production of bread of increased nutritional value enriched with pumpkin cake. Khleboprodukty 2010, 11, 42–43. (In Russian) [Google Scholar]
  33. Khramova, V.N.; Proskurina, O.Y.; Dolgova, V.A. Development of products of functional purpose using regional raw materials. Izv. Nizhnevolzhskogo Agrouniversitetskogo Kompleks. Nauka Vyss. Vocat. Obraz. 2013, 2, 164–168. [Google Scholar]
  34. Nourmohammadi, E.; SadeghiMahoonak, A.; Alami, M.; Ghorbani, M. Amino acid composition and antioxidative properties of hydrolysed pumpkin (Cucurbita pepo L.) oil cake protein. Int. J. Food Prop. 2017, 20, 3244–3255. [Google Scholar] [CrossRef]
  35. Murzyn, A.; Krasowska, A.; Stefanowicz, P.; Dziadkowiec, D.; Łukaszewicz, M. Capric Acid Secreted by S. boulardii Inhibits C. albicans Filamentous Growth, Adhesion and Biofilm Formation. PLoS ONE 2010, 5, e12050. [Google Scholar] [CrossRef] [PubMed]
  36. Huang, C.B.; Alimova, Y.; Myers, T.M.; Ebersole, J.L. Short- and medium-chain fatty acids exhibit antimicrobial activity for oral microorganisms. Arch. Oral Biol. 2011, 56, 650–654. [Google Scholar] [CrossRef]
  37. Tan, J.; McKenzie, C.; Potamitis, M.; Thorburn, A.N.; Mackay, C.R.; Macia, L. The Role of Short-Chain Fatty Acids in Health and Disease. In Advances in Immunology; Elsevier: Amsterdam, The Netherlands, 2014; pp. 91–119. [Google Scholar] [CrossRef]
  38. Balta, I.; Stef, L.; Pet, I.; Iancu, T.; Stef, D.; Corcionivoschi, N. Essential Fatty Acids as Biomedicines in Cardiac Health. Biomedicines 2021, 9, 1466. [Google Scholar] [CrossRef]
  39. Dighriri, I.M.; Alsubaie, A.M.; Hakami, F.M.; Hamithi, D.M.; Alshekh, M.M.; Khobrani, F.A.; Dalak, F.E.; Hakami, A.A.; Alsueaadi, E.H.; Alsaawi, L.S.; et al. Effects of Omega-3 Polyunsaturated Fatty Acids on Brain Functions: A Systematic Review. Cureus 2022, 14, e30091. [Google Scholar] [CrossRef]
  40. Ali, A.A.H. Overview of the vital roles of macro minerals in the human body. J. Trace Elem. Miner. 2023, 4, 100076. [Google Scholar] [CrossRef]
  41. Karppanen, H.; Karppanen, P.; Mervaala, E. Why and how to implement sodium, potassium, calcium, and magnesium changes in food items and diets? J. Hum. Hypertens. 2005, 19 (Suppl. S3), S10–S19. [Google Scholar] [CrossRef]
  42. Huang, L.; Drake, V.J.; Ho, E. Zinc. Adv. Nutr. 2015, 6, 224–226. [Google Scholar] [CrossRef]
  43. Petraru, A.; Ursachi, F.; Amariei, S. Nutritional Characteristics Assessment of Sunflower Seeds, Oil and Cake. Perspective of Using Sunflower Oil cakes as a Functional Ingredient. Plants 2021, 10, 2487. [Google Scholar] [CrossRef]
  44. Kolláthová, R.; Varga, B.; Ivanišová, E.; Bíro, D.; Rolinec, M.; Juráček, M.; Šimko, M.; Gálik, B. Mineral Profile Analysis of Oilseeds and Their By-Products As Feeding Sources for Animal Nutrition. Slovak J. Anim. Sci 2019, 52, 9–15. [Google Scholar]
  45. Ali, M.E.; Das, R.; Eaqub, A.; Bee, S.; Hamid, A. Current Applications of X-ray Powder. Rev. Adv. Mater. Sci 2014, 38, 95–109. [Google Scholar]
  46. Fatimah, S.; Ragadhita, R.; Husaeni, D.F.A.; Nandiyanto, A.B.D. How to Calculate Crystallite Size from X-ray Diffraction (XRD) using Scherrer Method. ASEAN J. Sci. Eng. 2021, 2, 65–76. [Google Scholar] [CrossRef]
  47. Otaka, A.; Hokura, A.; Nakai, I. Determination of trace elements in soybean by X-ray fluorescence analysis and its application to identification of their production areas. Food Chem. 2014, 147, 318–326. [Google Scholar] [CrossRef]
  48. de Oliveira, M.L.; Oliveira, A.C.S.; Arthur, V.; Almeida, E. Evaluation of brown and golden flaxseed (Linum usitatissimum L.) by EDXRF. In Proceedings of the International Nuclear Atlantic Conference—INAC, Belo Horizonte, Brazil, 24–28 October 2011; Available online: https://repositorio-api.ipen.br/server/api/core/bitstreams/68e383fb-abaf-403e-b7cc-83650f9e7164/content (accessed on 18 July 2024).
  49. Akintade, A.O.; Awolu, O.O.; Ifesan, B.O. Nutritional Evaluation of Fermented, Germinated and Roasted Pumpkin (Cucurbita maxima) Seed Flour. Acta Univ. Cibiniensis Ser. E Food Technol. 2019, 23, 179–186. [Google Scholar] [CrossRef]
Figure 1. Visual appearance of the samples of oil cakes.
Processes 12 01616 g001
Figure 2. X-ray fluorescence analysis of gluten-free mixture: (A) control sample; (B) mixture with soybean cake, (C) mixture with pumpkin cake; (D) mixture with sunflower cake; (E) mixture with peanut cake; and (F) mixture with flaxseed cake.
Processes 12 01616 g002
Figure 3. Gluten-free mixture (control sample)—electron microscopic image (magnification ratio: (a) ×40; (b) ×1000; and (c) ×3000).
Processes 12 01616 g003
Figure 4. Gluten-free mixture with soybean cake—electron microscopic image (magnification ratio: (a) ×40; (b) ×1000; and (c) ×3000).
Processes 12 01616 g004
Figure 5. Gluten-free mixture with pumpkin cake—electron microscopic image (magnification ratio: (a) ×40; (b) ×1000; and (c) ×3000).
Processes 12 01616 g005
Figure 6. Gluten-free mixture with sunflower cake—electron microscopic image (magnification ratio: (a) ×40; (b) ×1000; and (c) ×3000).
Processes 12 01616 g006
Figure 7. Gluten-free mixture with peanut cake—electron microscopic image (magnification ratio: (a) ×40; (b) ×1000; and (c) ×3000).
Processes 12 01616 g007
Figure 8. Gluten-free mixture with flaxseed cake—electron microscopic image (magnification ratio: (a) ×40; (b) ×1000; and (c) ×3000).
Processes 12 01616 g008
Figure 9. X-ray spectra of gluten-free mixture samples.
Processes 12 01616 g009aProcesses 12 01616 g009bProcesses 12 01616 g009c
Table 1. Formulation of gluten-free flour, %.
IngredientControlSample 1Sample 2Sample 3Sample 4Sample 5
Rice flour505050505050
Corn flour101010101010
Corn starch403030303030
Pumpkin cake flour-10----
Soybean cake flour--10---
Flax cake flour---10--
Sunflower cake flour----10-
Peanut cake flour-----10
Table 2. Organoleptic quality indicators of the tested cake samples.
Name of IndicatorsOil Cake Type
FlaxseedSoybeanPumpkinPeanutSunflower
AppearanceFree of foreign inclusions and impurities that are visually visible
ColorPowder of dark brown colorYellow colored powderYellow-green colored powderPowder of light brown color with red specksPowder of gray color
OdorProper for the respective type of oilseed raw material without extraneous odor (musty, moldy, burning, etc.)
TasteProper for the respective type of oilseed raw material, without rancid and other foreign flavors
Metallomagnetic impurity, mg per 1 kg of oil cake, not more than<0.01 mg
ConsistencyBulk, homogeneous
Other foreign impurities<0.01 mg
Pest (barn weevil, rice weevil, grain weevil, grain borer, pinworm, mealybug, mite, and others) infestation or evidence of infestation<1.5–2.0 mm
Table 3. Nutritional value and caloric index of oil cakes.
Oil Cake TypeContent, %Calories,
Kcal
ProteinFatCarbohydrates
Flaxseed34.4 ± 0.67 b25.4 ± 0.42 c12.0 ± 0.21 a464.2
Soybean32.6 ± 0.48 b18.8 ± 0.28 a35.9 ± 0.64 e443.2
Sunflower32.5 ± 0.31 b20.2 ± 0.33 b30.6 ± 0.38 d434.2
Peanut29.6 ± 0.39 a25.6 ± 0.35 c18.0 ± 0.32 b420.8
Pumpkin37.5 ± 0.42 c25.5 ± 0.44 c23.0 ± 0.21 c471.5
a–e within the same column, different lowercase letters mean significant differences among different samples of oil cakes (p < 0.05).
Table 4. Amino acid composition of oil cake samples.
Amino AcidOil Cake Samples
FlaxseedSoybeanPeanutPumpkin
Content, in g per 100 g of Product
Arginine4.765 ± 1.906 d1.786 ± 0.714 a3.644 ± 1.457 b4.409 ± 1.764 c
Lysine1.400 ± 0.476 b2.017 ± 0.686 c1.358 ± 0.462 b1.146 ± 0.390 a
Tyrosine0.834 ± 0.250 a1.152 ± 0.346 b1.789 ± 0.537 c1.764 ± 0.529 c
Phenylalanine1.787 ± 0.536 a1.729 ± 0.519 a2.418 ± 0.725 b2.763 ± 0.829 c
Histidine0.476 ± 0.238 a0.778 ± 0.389 b0.894 ± 0.447 c0.882 ± 0.441 c
Leucine+isoleucine2.144 ± 0.557 a2.132 ± 0.554 a2.318 ± 0.603 b2.675 ± 0.695 c
Methionine0.506 ± 0.172 c0.248 ± 0.084 a0.321 ± 0.109 b0.882 ± 0.300 d
Valine2.412 ± 0.965 d1.441 ± 0.576 a1.954 ± 0.782 b2.087 ± 0.835 c
Proline1.817 ± 0.472 a2.132 ± 0.554 b2.451 ± 0.637 c2.352 ± 0.611 c
Threonine1.459 ± 0.584 c1.008 ± 0.403 b0.861 ± 0.344 a1.029 ± 0.412 b
Serine1.817 ± 0.472 c1.268 ± 0.330 a1.722 ± 0.448 c1.529 ± 0.397 b
Alanine1.995 ± 0.519 c1.210 ± 0.315 a1.590 ± 0.413 b1.617 ± 0.420 b
Glycine2.233 ± 0.759 c1.152 ± 0.392 a2.484 ± 0.845 d1.940 ± 0.660 b
a–d within the same row, different lowercase letters mean significant differences among different samples of oil cakes (p < 0.05).
Table 5. Fatty acid composition of oil cake samples, g per 100 g of product.
#Fatty AcidThe Chemical Formula of Fatty AcidsOil Cake Samples
FlaxseedSoybeanPeanutPumpkin
Saturated fatty acids
1Butyric acidC4H8O22.22 ± 0.04 a2.20 ± 0.02 a2.25 ± 0.03 a2.15 ± 0.02 a
2Caprylic acidC6H12O297.5 ± 1.42 a97.65 ± 1.86 a97.51 ± 1.06 a97.73 ± 1.55 a
3Capric acidC10H20O20.001 ± 0.000 and0.006 ± 0.000 c0.0023 ± 0.000 c
4Myristic acidC14H28O20.011 ± 0.000 c0.006 ± 0.000 and0.009 ± 0.000 b
5Palmitic acidC16H32O20.001 ± 0.000 a0.001 ± 0.000 a0.002 ± 0.000 b0.005 ± 0.000 c
6Stearic acidC18H36O20.240 ± 0.005 b0.004 ± 0.000 a0.004 ± 0.000 and
7Behenic acidC22H44O2ndnd0.004 ± 0.000nd
Total SFA 99.972899.861699.77699.89649
Monounsaturated fatty acids
1Palmitoleic acidC16H30O20.0003 ± 0.000 a0.0004 ± 0.000 b0.0008 ± 0.000 cnd
2Oleic acidC18H34O20.0024 ± 0.000 b0.0024 ± 0.000 b0.0025 ± 0.000 b0.0007 ± 0.000 a
3Nervonic acidC24H46O20.0038 ± 0.000 c0.0030 ± 0.000 a0.0039 ± 0.000 c0.0032 ± 0.000 b
Total MUFA 0.006480.00580.00720.0039
Polyunsaturated fatty acids
1Eicosapentaenoic acid (Timnodonic acid, Omega-3)C20H30O20.0011 ± 0.000 a0.128 ± 0.002 c0.210 ± 0.003 d0.095 ± 0.001 b
Total PUFA 0.00110.1280.210.095
a–d within the same row, different lowercase letters mean significant differences among different samples of oil cakes (p < 0.05). nd—not detected.
Table 6. Mineral composition of oil cakes, mg/100 g.
MineralOil Cake Samples
FlaxseedSoybeanPeanutPumpkin
Potassium, K831.43 ± 16.63 a2549.0 ± 5.1 d982.17 ± 19.64 c897.55 ± 17.95 b
Magnesium, Mg347.29 ± 6.95 c286.30 ± 5.73 b215.42 ± 4.31 a472.63 ± 9.45 d
Calcium, Ca225.92 ± 4.50 c214.71 ± 4.29 c101.16 ± 2.02 b67.81 ± 1.36 a
Sodium, Na41.30 ± 0.83 b7.82 ± 0.16 a48.14 ± 0.96 cn/d
Phosphorus, P672.31 ± 13.44 c638.97 ± 12.78 b428.27 ± 8.56 a893.69 ± 17.87 d
Iron, Fe5.37 ± 0.11 a9.13 ± 0.18 c9.12 ± 0.18 c7.43 ± 0.15 b
Copper, Cu1.01 ± 0.02 a2.03 ± 0.04 d1.38 ± 0.03 b1.85 ± 0.04 c
Zinc, Zn5.63 ± 0.11 c3.01 ± 0.06 a4.39 ± 0.09 b6.74 ± 0.13 d
a–d within the same row, different lowercase letters mean significant differences among different samples of oil cakes (p < 0.05). n/d—not detected.
Table 7. Result of XRD of gluten-free mixture with the addition of oil cake flour, %.
SamplePClKCaFeSiMnZnAl
Control sample0.384 ± 0.004 c0.095 ± 0.002 c0.527 ± 0.008 a0.281 ± 0.004 a0.029 ± 0.001 c0.028 ± 0.001 a0.004 ± 0.000 a0.006 ± 0.000 a0.013 ± 0.000 a
Mixture with soybean cake flour0.088 ± 0.001 b0.078 ± 0.001 b1.017 ± 0.011 d0.458 ± 0.008 c0.033 ± 0.001 d0.178 ± 0.003 c0.007 ± 0.000 b0.011 ± 0.000 b0.107 ± 0.002 d
Mixture with pumpkin cake flour0.073 ± 0.001 a0.071 ± 0.001 a0.701 ± 0.012 b0.373 ± 0.006 b0.027 ± 0.001 bn/d0.010 ± 0.001 d0.019 ± 0.001 e0.052 ± 0.000 c
Mixture with sunflower cake flour0.090 ± 0.002 b0.081 ± 0.001 b0.807 ± 0.016 c0.400 ± 0.008 b0.025 ± 0.001 a0.176 ± 0.003 c0.007 ± 0.000 b0.015 ± 0.000 c0.102 ± 0.001 d
Mixture with peanut cake flour0.080 ± 0.001 b0.080 ± 0.001 b0.845 ± 0.009 c0.380 ± 0.005 b0.030 ± 0.001 c0.153 ± 0.003 b0.008 ± 0.000 c0.018 ± 0.000 d0.112 ± 0.001 de
Mixture with flaxseed cake flour0.080 ± 0.001 b0.074 ± 0.001 a0.837 ± 0.009 c0.530 ± 0.009 d0.025 ± 0.001 a0.160 ± 0.003 b0.008 ± 0.000 c0.017 ± 0.000 d0.040 ± 0.000 b
a–e within the same column, different lowercase letters mean significant differences among different samples of gluten-free mixtures (p < 0.05). n/d—not detected.
Disclaimer/Publisher’s Note: The statements, opinions and data contained in all publications are solely those of the individual author(s) and contributor(s) and not of MDPI and/or the editor(s). MDPI and/or the editor(s) disclaim responsibility for any injury to people or property resulting from any ideas, methods, instructions or products referred to in the content.

