Article

Dynamics of Lagrangian Sensor Particles: The Effect of Non-Homogeneous Mass Distribution

by
Ryan Rautenbach
1,*,
Sebastian Hofmann
1,
Lukas Buntkiel
2,
Jan Schäfer
2,
Sebastian Felix Reinecke
2,
Marko Hoffmann
1,
Uwe Hampel
2,3 and
Michael Schlüter
1
1
Institute of Multiphase Flows, Hamburg University of Technology, Eißendorfer Straße 38, 21073 Hamburg, Germany
2
Institute of Fluid Dynamics, Experimental Thermal Fluid Dynamics, Helmholtz Zentrum Dresden-Rossendorf, Bautzner Landstraße 400, 0132 Dresden, Germany
3
Chair of Imaging Techniques in Energy and Process Engineering, Dresden University of Technology, 01069 Dresden, Germany
*
Author to whom correspondence should be addressed.
Processes 2024, 12(8), 1617; https://doi.org/10.3390/pr12081617
Submission received: 29 May 2024 / Revised: 12 July 2024 / Accepted: 25 July 2024 / Published: 1 August 2024

Abstract

:
The growing demand for bio-pharmaceuticals necessitates improved methods for the characterization of stirred tank reactors (STRs) and their mixing heterogeneities. Traditional Eulerian measurement approaches fall short, culminating in the use of Lagrangian Sensor Particles (LSPs) to map large-scale STRs and track the lifelines of microorganisms such as Chinese Hamster Ovary cells. This study investigates the hydrodynamic characteristics of LSPs, specifically examining the effects that the size and position of the Center of Mass (CoM) have on their flow-following capabilities. Two Lagrangian Particle (LP) designs are evaluated, one with the CoM and a Geometric Center aligned, and another with a shifted CoM. The experimental study is conducted in a rectangular vessel filled with deionized water featuring a stationary circular flow. Off-center LPs exhibit higher velocities, an increased number of floor contacts, and moreover, a less homogeneous particle probability of presence within the vessel compared to LPs with CoM and Geometric Center aligned. Lattice Boltzmann Large Eddy Simulations provide complementary undisturbed fluid velocity data for the calculation of the Stokes number S t . Building upon these findings, differences in the Stokes number S t between the two LP variants of Δ S t = 0.01 (25 mm LP) and Δ S t = 0.13 (40 mm LP) are calculated, highlighting the difference in flow behavior. Furthermore, this study offers a more representative calculation of particle response time approach, as the traditional Stokes number definition does not account for non-homogeneous particles, resulting in an alternative Stokes number ( Δ S t alt = 0.84 (25 mm LP) and Δ S t alt = 2.72 (40 mm LP)). This study contributes to the improved characterization of STRs through the use of Lagrangian Sensor Particles. Results highlight the implications the internal mass distribution has on LSP design, offering crucial considerations for researchers in the field.

1. Introduction

In recent years, Lagrangian Sensor Particles (LSPs) have emerged as a promising tool for studying fluid dynamics and flow in industrial-scale stirred tank reactors (STRs) [1,2,3]. LSPs are autonomous flow-tracking devices equipped with internal sensors to monitor and analyze the flow properties and characteristics. Incorporating Lagrangian measurements, instead of Eulerian methods, for the determination of mixing heterogeneities occurring in industrial-sized STRs can enhance the respective characterization [4,5]. The use of LSPs in bioreactors can provide crucial insights and expand the possibilities for the detection and characterization of mixing heterogeneities and anomalies regarding the process conditions in bioreactors. One reason for this is that LSPs are not spatially restrained as wall-mounted probes are, shown by various groups [6,7,8,9,10,11,12,13,14,15,16]. This curbs the need for acrylic glass reactors, which through decolorization methods visualize heterogeneities and mixing anomalies [17,18,19,20,21,22,23,24], presenting not only improved design and optimization strategies for STRs but also providing insights for the scale-down of industrial reactors. This is achieved by characterizing large-scale effects, such as concentration and mixing heterogeneities through spatiotemporal resolution of the reactor [1,16,25].
Various research groups aim to harness the advantages that the Lagrangian approach of LSPs has over traditional Eulerian methods. It is through their freedom of movement that the Lagrangian approach sets itself apart from the Eulerian method [2,9,10]. Various groups advanced the research with sensors varying over sizes from as small as 7.9 mm to 60 mm in diameter, which is contingent on the instrumentation and intended purpose. Depending on the respective group, measurement interests vary from a solely process parametric interest [6,7,8] to a parameter interest but in relation to fluid flow behavior [9,10,11,12,13,14,15].
The most notable group is that of Reinecke and Buntkiel et al., who developed multiple LSPs of various sizes (40 mm, 45 mm and 90 mm) [3,9,15,26]. The equipped sensors vary based on the specific generation with the newest generation being equipped with an inertial measurement unit and a pressure sensor at 40 mm diameter. This specific LSP was utilized in investigations regarding the fluid dynamics and compartmentalization of large-scale STRs at a scale of 15 m 3 [15,16].
With adequate ability to follow and stay suspended within the fluid flow in an industrial STR, the LSP would be able to mimic the lifeline of a Chinese Hamster Ovary (CHO) cell [4,5]. Previous research focuses on exploring the influence particle size has on flow-following capabilities, such as the study by Hofmann et al. [27]. The positioning of the Center of Mass is an additional characteristic that carries implications for the ability of LSPs to follow the fluid flow. In particular, research by Will and Krug [28,29] highlights, the effect the Moment of Inertia (MoI) has on the flow-following capabilities of particles, which varies based on the distribution of internal mass [28,29]. Furthermore, their work calls for the expanded study on particle behavior in turbulent flows, the influence particle rotational dynamics has and how these findings affect practical applications such as the use of LSPs.
To complement past research efforts in this area and to further characterize the flow-following characteristics of LSPs, an experimental investigation is conducted on the influence the position of the Center of Mass has on their flow-following capabilities. This is achieved by studying the two variations of the position of Center of Mass (CoM) with the one position mimicking a homogeneously distributed LSP, while the other mimics a realistic LSP [15,26,30] with the position of CoM in relation to the Geometric Center of the sphere. Due to equipped sensors, the internal mass is generally non-homogeneously distributed, which could have relevant implications regarding the design and conceptualization of LSPs. Consequently, the use and applicability of the Stokes number is studied specifically with regard to non-homogeneous particles, as the Stokes number definition does not discriminate between homogeneous and non-homogeneous spherical particles. As the current level of miniaturization of the respective electronic components used in LSPs has not adequately progressed, the internal mass distribution in addition to the general size constraints are relevant to the applicability of LSPs [16,27].

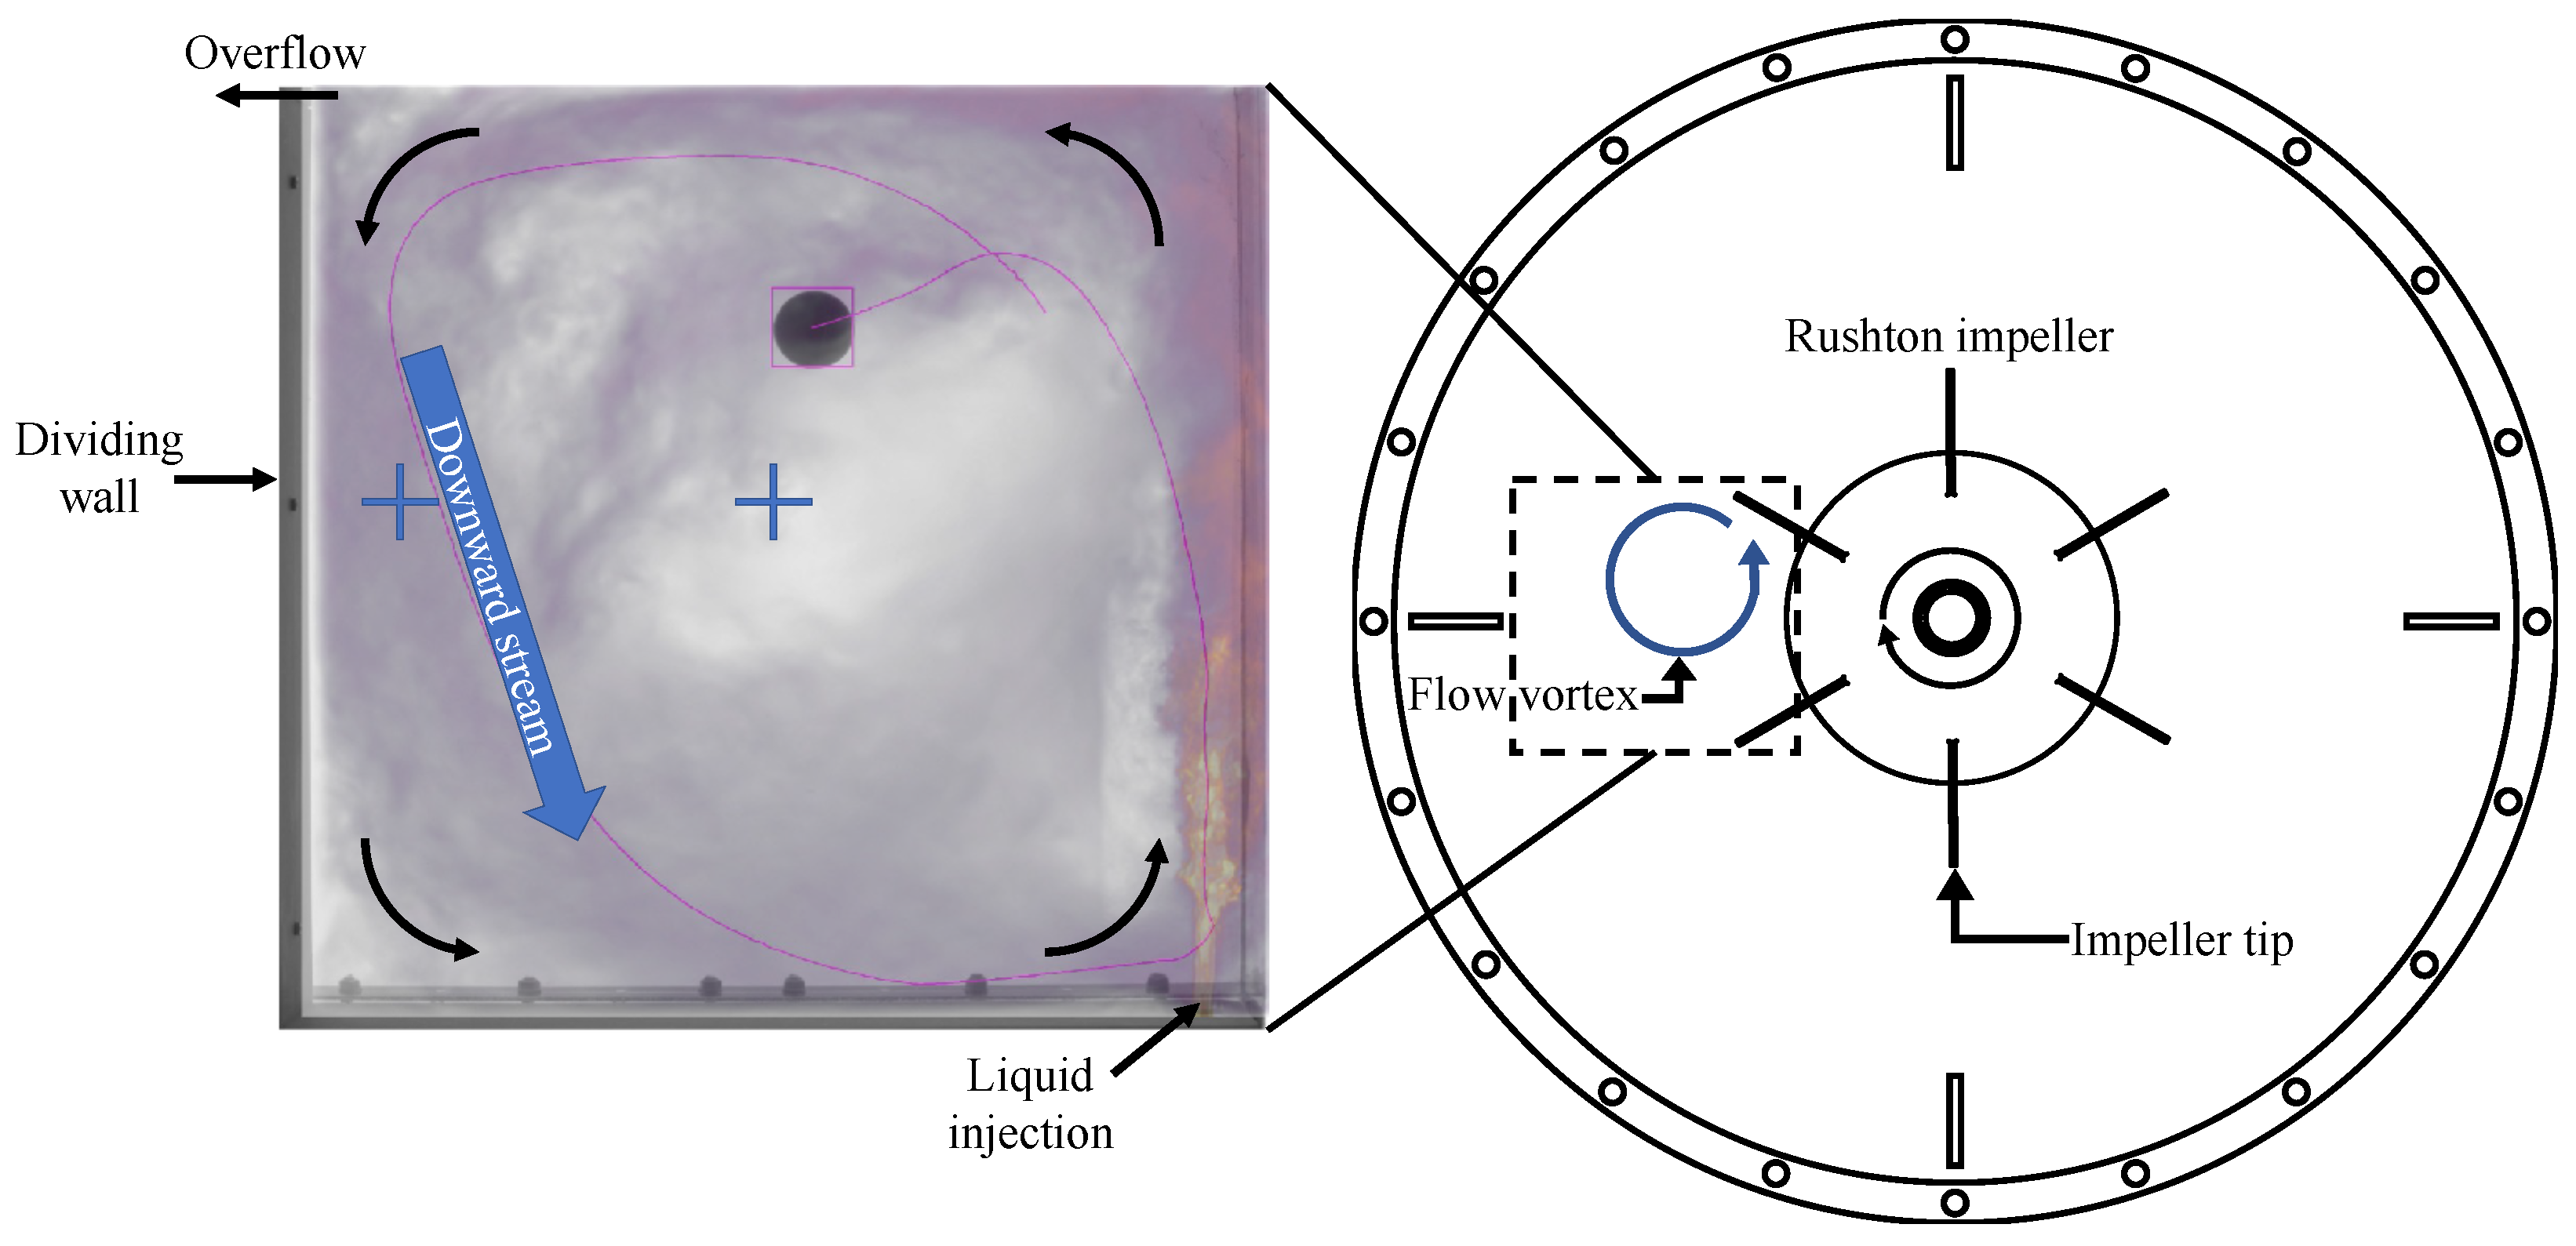
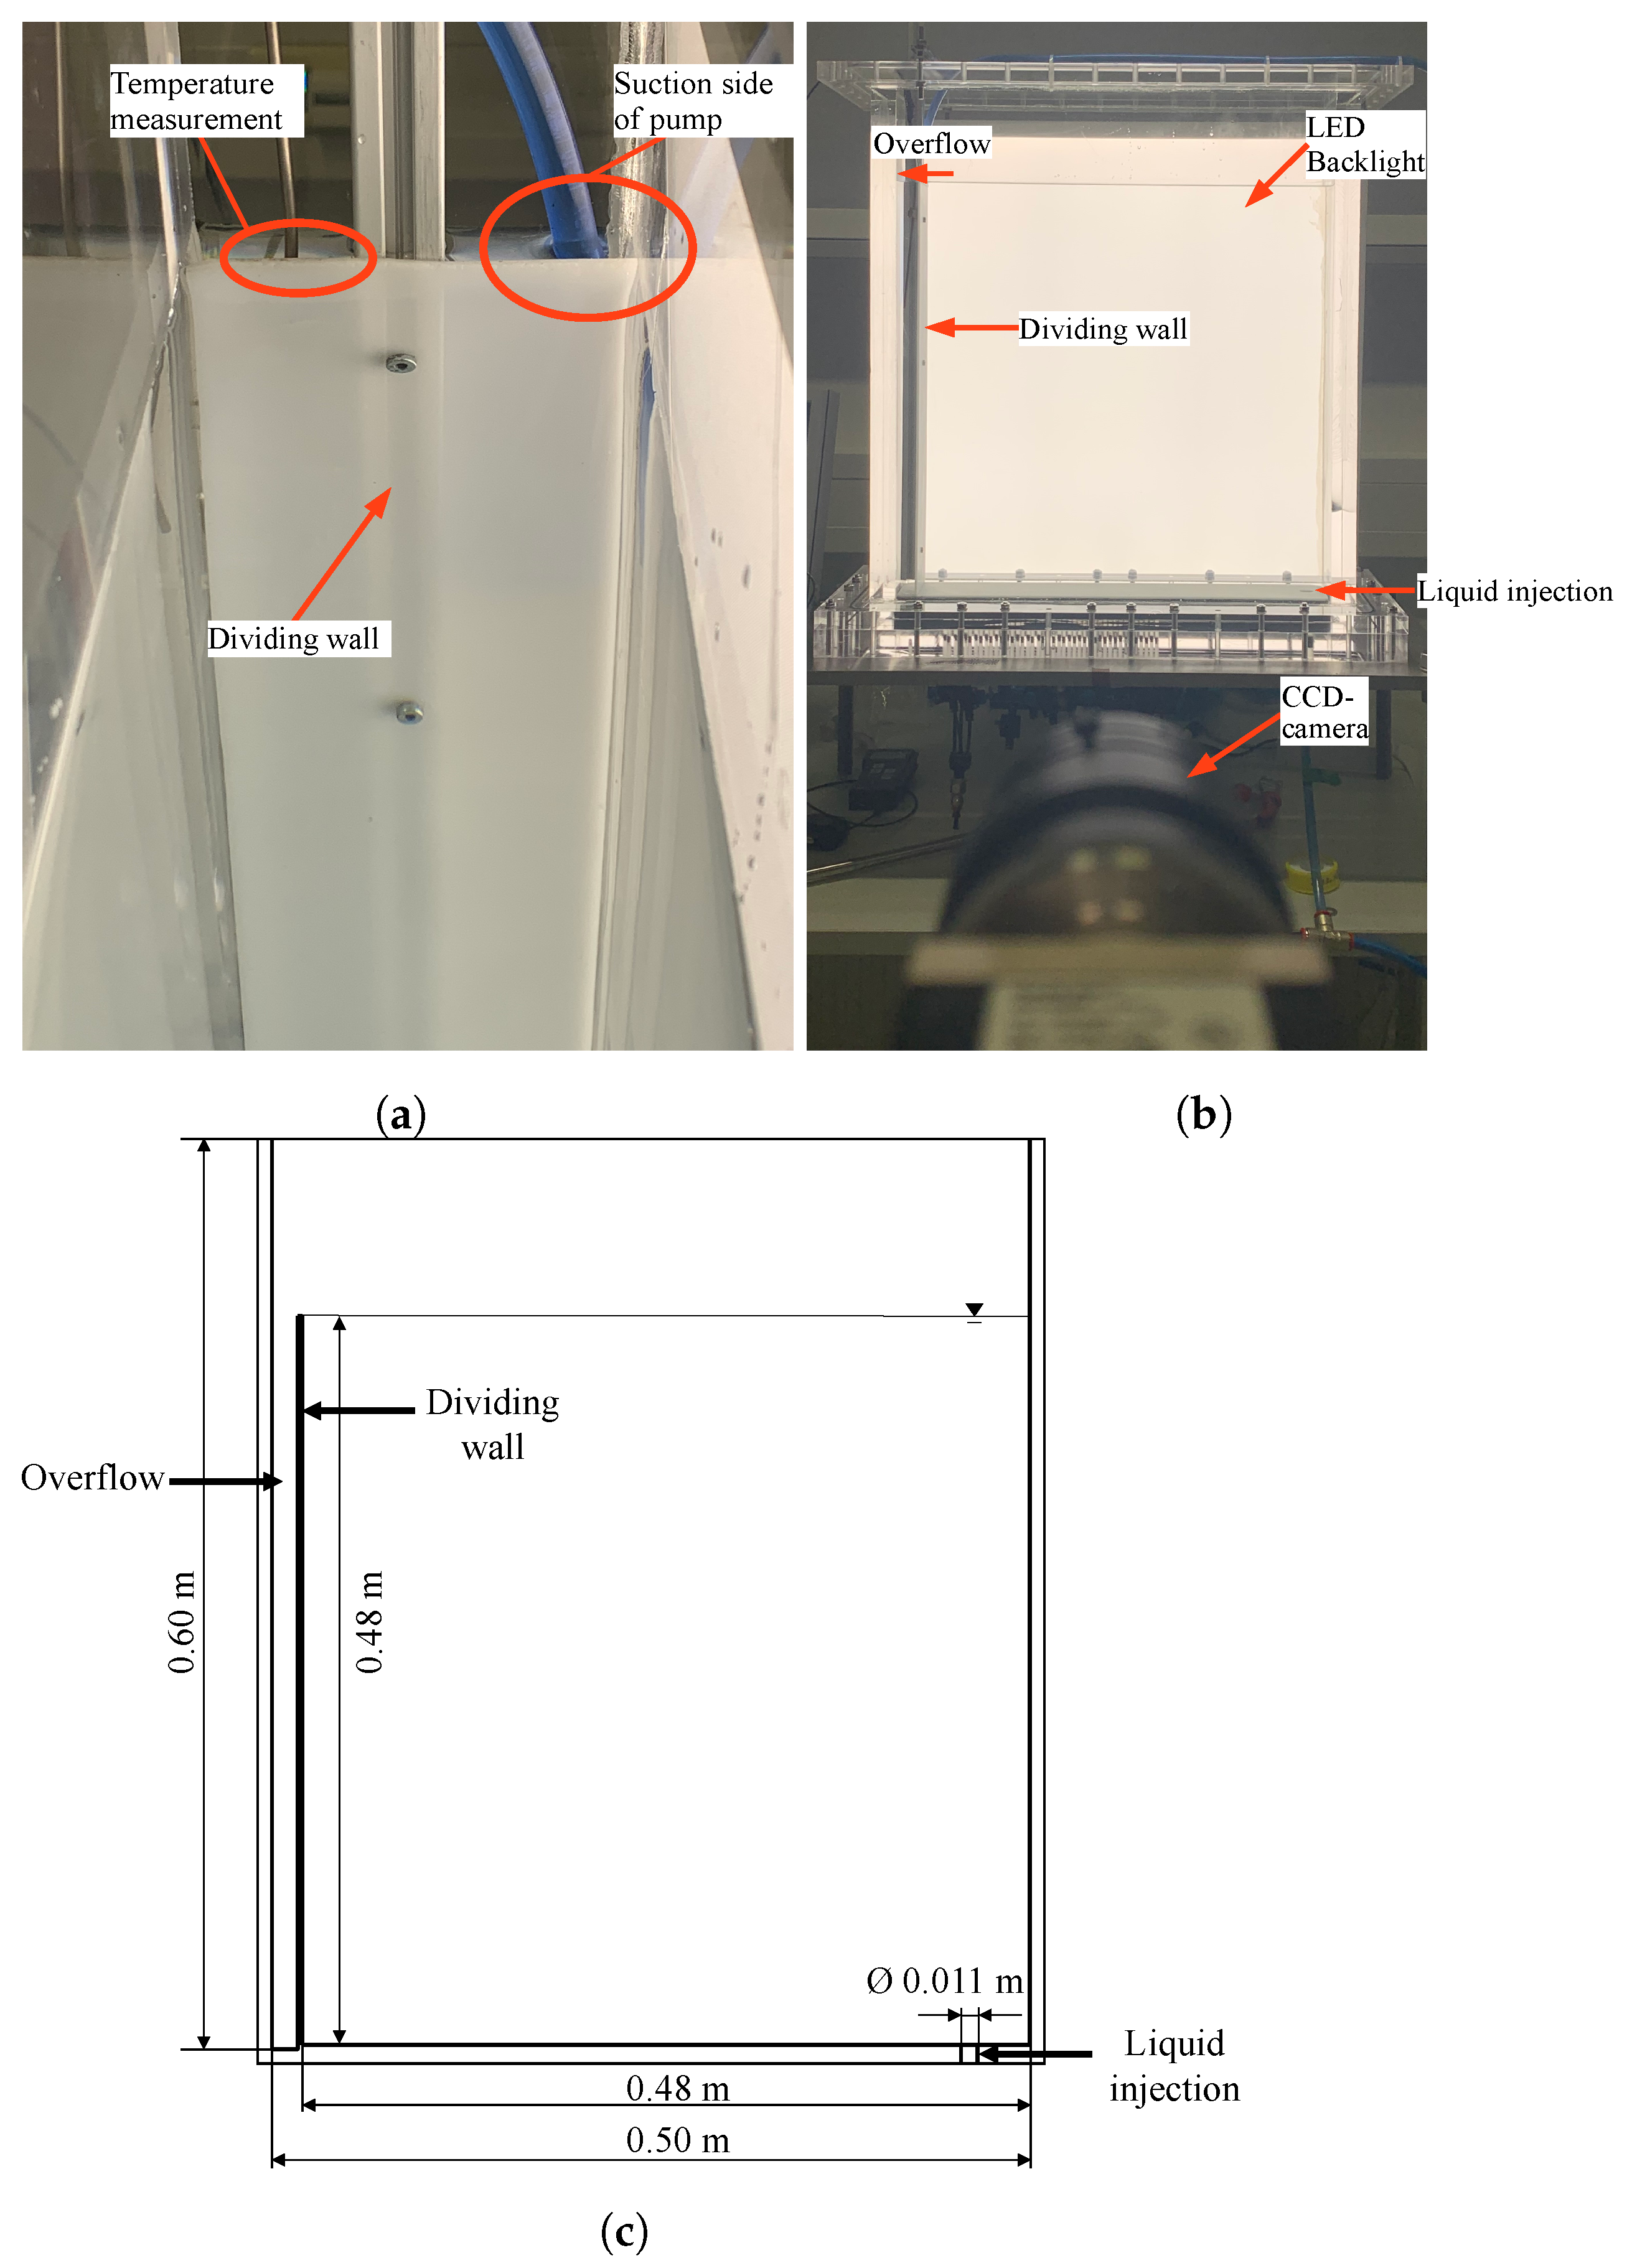
2. Materials and Methods

In this section, the experimental vessel and Lagrangian Particle (LP) designs are presented. Additionally, the experimental procedure and method of capturing the experiment via CCD camera and progression is highlighted, which is followed by an introduction of the automated experimental evaluation via OpenCV. Furthermore, the Stokes number S t and particle Reynolds Number R e p are derived for the respective case based on previous studies regarding LSPs.

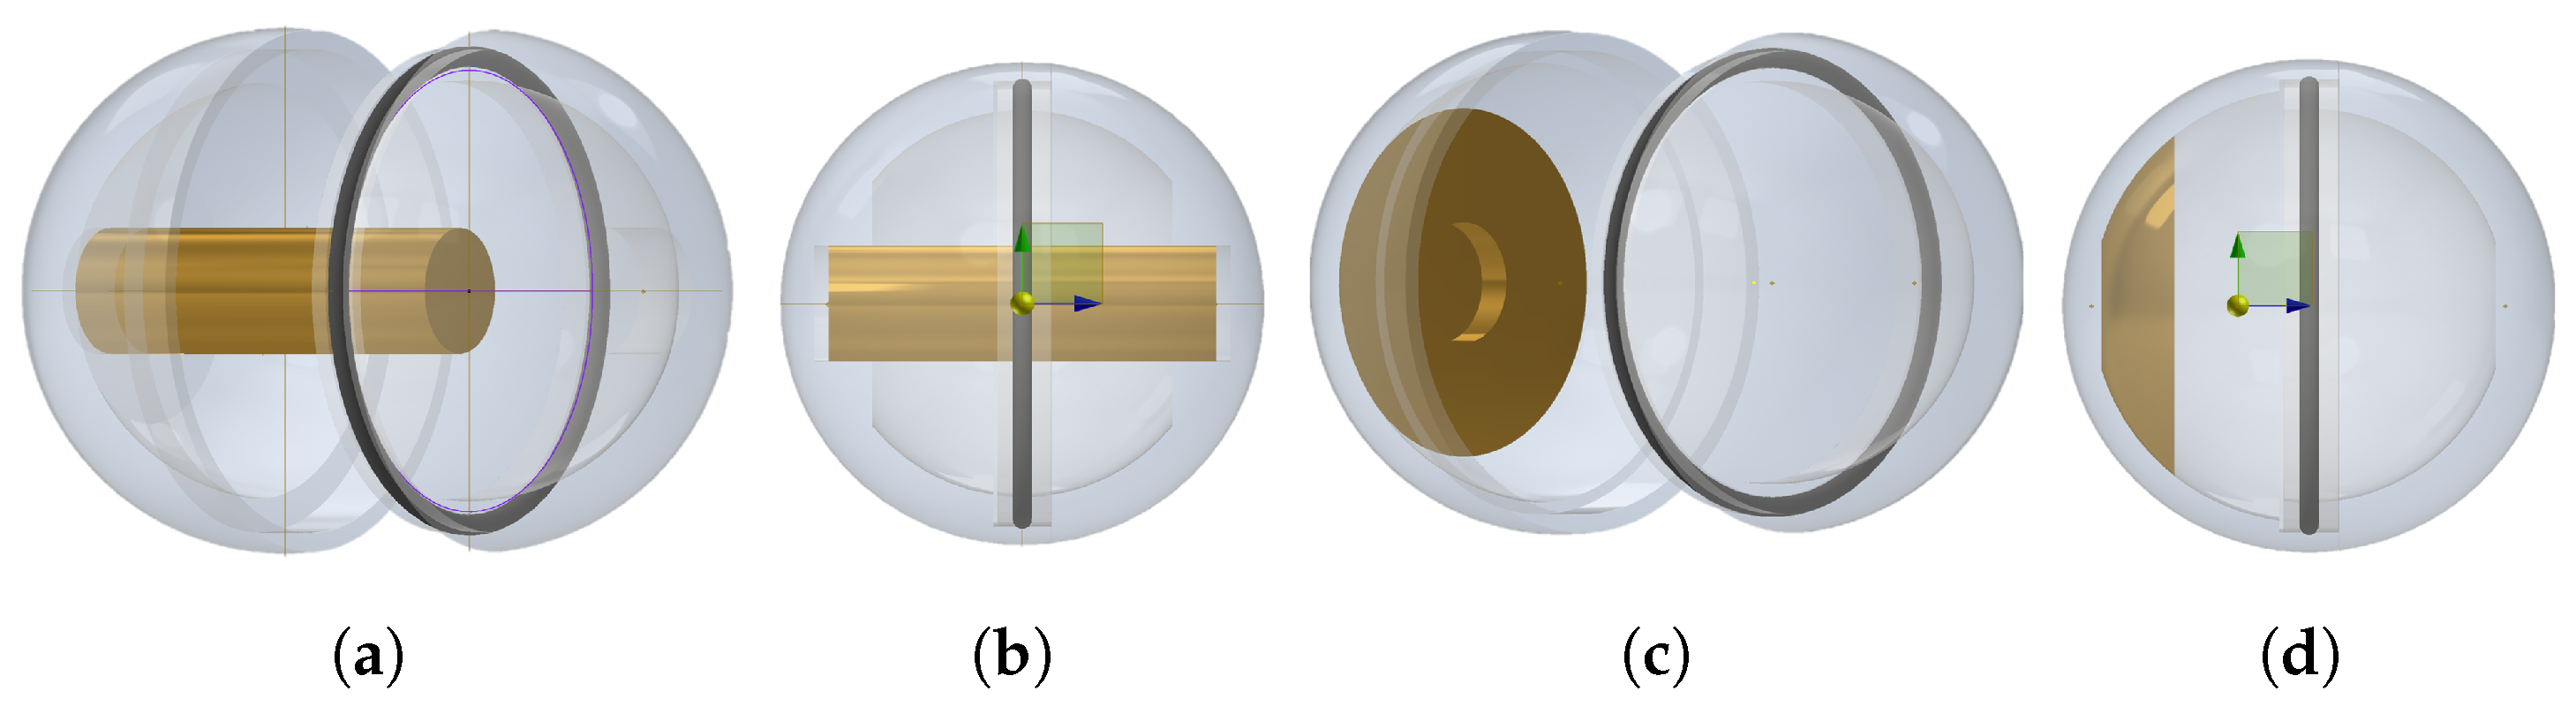
2.1. Lagrangian Sensor Particles

The LSP inspiring the experiments in this study has a housing unit made from Polyamide P4000, Ultimaker, Utrecht Netherlands which is 3D printed using a selective laser sintering printer, as seen in Figure 1, and chemically treated in order to have a smoother surface and seal microperforations. The two half-shells are attached to one another by a threaded rod in the center, which allows for the density of the LSP to be altered through the variation of the LSPs’ volume [15,16]. The sensor is sealed by a nitrile rubber (NBR) O-ring between the two half shells and has a diameter of 40 mm [15,16].
It is important to note that the LSP designs shown in Figure 1 do not have an even distribution of the mass within the housing unit. Various internals are installed in the housing, all of which carry different densities, ultimately leading to the CoM being shifted out of alignment with the GeoC of the housing unit.

2.2. Lagrangian Particles

In order to investigate the flow-following capabilities and hydrodynamic characteristics of an LSP, LPs without any electronics but featuring a well-defined shape and Center of Mass are used. Two different LPs are studied, one being an LP with the Center of Mass (CoM) and Geometric Center (GeoC) of the particle in the same position, and the other being an LP with the CoM and GeoC set at a specific distance to each other. A further aspect is taken into account, by investigating the shift for two different sized LPs (25 mm and 40 mm diameter)
The LPs consist of two half-shells that are sealed with an NBR O-ring and made from poly-methyl methacrylate (PMMA). The density of the LPs is varied through the internal weight, fine tuning the LPs to be nearly neutrally buoyant, as described in Section 2.3. The majority share of the mass originates from the brass inserts, which serve as weights to alter the position of CoM (Figure 2).
One design of the LPs has the Center of Mass positioned in the center of the equator within the LP, which is highlighted by the Center of Mass symbol (Figure 2b), while the other LP has a shifted CoM (Figure 2d), with the brass insert fixed to one shell half. The LPs with respective brass inserts and O-rings are shown in Figure 3. The position and distance of the shifted CoM is set at the maximum distance from the GeoC in relation to production capabilities regarding the wall thickness and brass insert. Regarding size, diameters of 25 mm and 40 mm are chosen for the LPs. The size of the 40 mm LP is selected on the basis of the LSP design shown in Figure 1 from Buntkiel et al. [15], while the 25 mm LP is selected based on previous research by Zimmermann et al. [30].
The specifications and design points for the four LPs without internal sensors are listed in Table 1. Here, the equatorial LP with CoM and GeoC overlapping is denoted as “EQ”, which is followed by the respective size, and the other LP with a shifted CoM from the GeoC is denoted as “OF”.

2.3. Buoyancy Calibration of Lagrangian Particles

The calibration of the LPs is a critical aspect of the validity of the investigations, as the LPs should ideally be near neutrally buoyant. The particles are continuously suspended in deionized water during the investigations; therefore, the target density is that of deionized water (T = 25 ° C, ρ f = 996.9 ± 1 k g m 3 ).
To achieve this, two jugs of 2 L deionized water were prepared (T = 25 ° C). In one jug, a certain amount of Potassium Chloride (KCL) was added, leading to a solution with a density of 1000 ± 1 k g m 3 (measured by an Anton Paar DMA 35). Suspended in the 1000 ± 1 k g m 3 solution, the LPs should float to the top. In turn, when the same LP is suspended in the jug with only deionized water, it should sink very slowly and ideally be suspended in the solution for a prolonged period. Consequently, the LP is calibrated within a window of Δ ρ = 3.1 ± 1 k g m 3 .
The calibration is achieved by adding small amounts of tin weights and further fine-tuned by pressing the housing units closer together or leaving the units less compact. After each experimental run, the calibration was checked and if necessary adjusted with regard to how compact the housing units were.

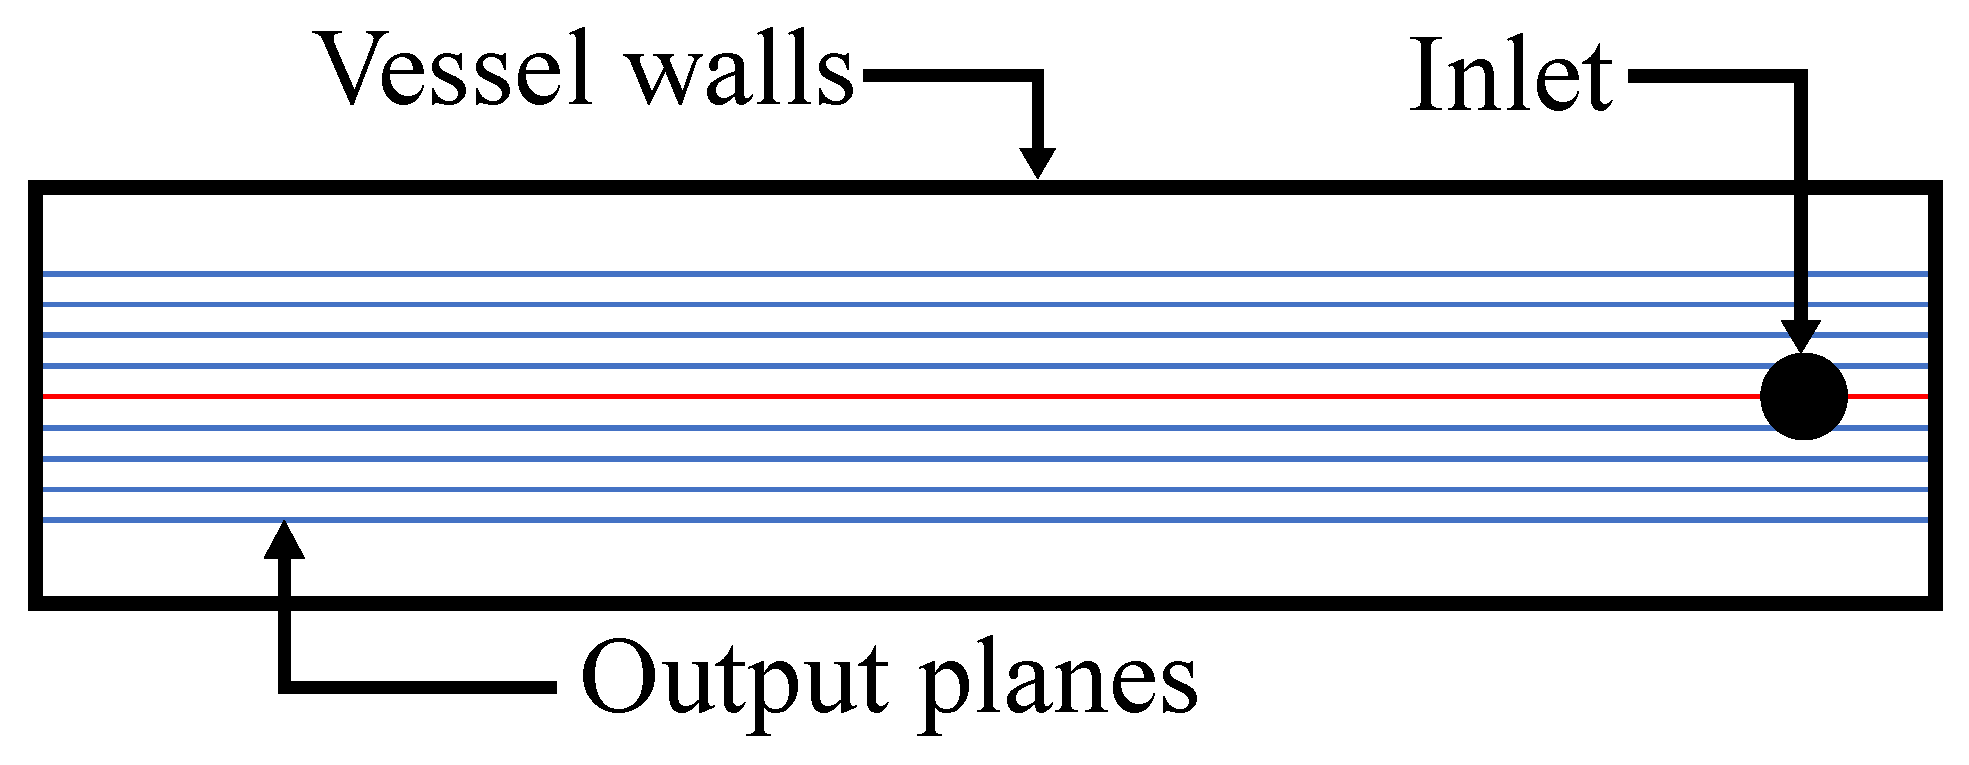
2.4. Experimental Procedure and Measurement of Flow-Following Capabilities

To mimic the flow field behind a Rushton turbine impeller, an experimental setup using a rectangular tank made of acrylic glass is used, as depicted in Figure 4 and Figure 5. Figure 4 illustrates the flow from a spinning Rushton impeller, highlighting the idea behind the circular flow field within the experimental vessel, relating the tip speeds to the respective inlet velocity. The overall dimensions of the tank filled with deionized water are 50 cm × 60 cm × 10 cm (width × height × depth). To create a defined flow field, the liquid is injected through an 11 mm inlet located at the bottom right of the vessel floor (see Figure 5b,c). A dividing plate is positioned close to the left vessel wall to separate the pump suction and to keep the flow field close to undisturbed. Consequently, a circular flow field is formed (see Figure 4) with a vortex developing at the center of the square vessel. The temperature of the deionized water in the vessel is monitored throughout the experiment by a temperature sensor as shown in Figure 5a, and a CCD camera is set up to track the trajectories of the LPs.
The inlet is connected to a rotary pump from Leroy Somer, Angoulême, France (VMA31M055) equipped with a pump head from ZUWA, Laufen, Germany (Combistar 2000-A). The pump has a volume flow of up to 0.5 L s   1 . On the basis of the respective inlet and positioning of the suction side of the pump behind the dividing wall, the flow field established within the vessel is regarded as stationary.
The vessel is further equipped with an LED panel to provide diffuse backlight (see Figure 5b) to ensure a good visibility of the LP for the entirety of the vessel.
Three release positions are used as points of origin, one being in the downward stream on the left of the vessel (marked by the blue cross on the left), another at the center of the stationary flow indicated by the second blue cross in Figure 5c, and the final at a random position in the vessel. For the latter, the LP is suspended within the flow field, and once sufficient time has passed and the LP is unencumbered by outside forces, an experimental run is started from random positions within the stationary flow field. The initial release is introduced by a streamlined claw which can hold and release an LP, allowing for an even release with a negligible level of momentum (See Figure 6). However, the substantial duration of the individual experiments circumvents any influence the release of the LP has.
The experiments are conducted with the release of the different LPs at reproducible positions in the vessel with only one LP being recorded at a time. The three inlet velocities v inlet ( v inlet = 0.77 m s   1 , 1.11 m s   1 and 1.80 m s   1 ) for the investigation were predetermined to correspond to three distinct impeller tip speeds v tip observed in a large-scale industrial STR [16,22]. The respective inlet velocity for the 11 mm inlet is calculated.
The particle Reynolds number R e p
R e p = ρ f · d p · u f u p 2 μ f = inertial force viscous force .
is calculated for the different LPs. R e p allocates a Reynolds number corresponding to the particle density ρ f , diameter D and fluid viscosity μ f , while the velocity is the difference between the respective fluid velocity u f and the relative particle velocity u p . Following the second Euclidean norm in Equation (1), differences are related to the coordinate-based differences in the vessel, with horizontal and vertical velocity differences of the fluid to the particle correlated respectively [27]. The inlet flow is turbulent for all set points. In Table 2, the different LP variants and experiments are listed. For simplicity, the results are mainly presented for the more relevant LP size of 40 mm due to the work of Buntkiel et al. [15], Hofmann et al. [16], and Bisgaard et al. [14].

3. Experimental Evaluation and Tracking

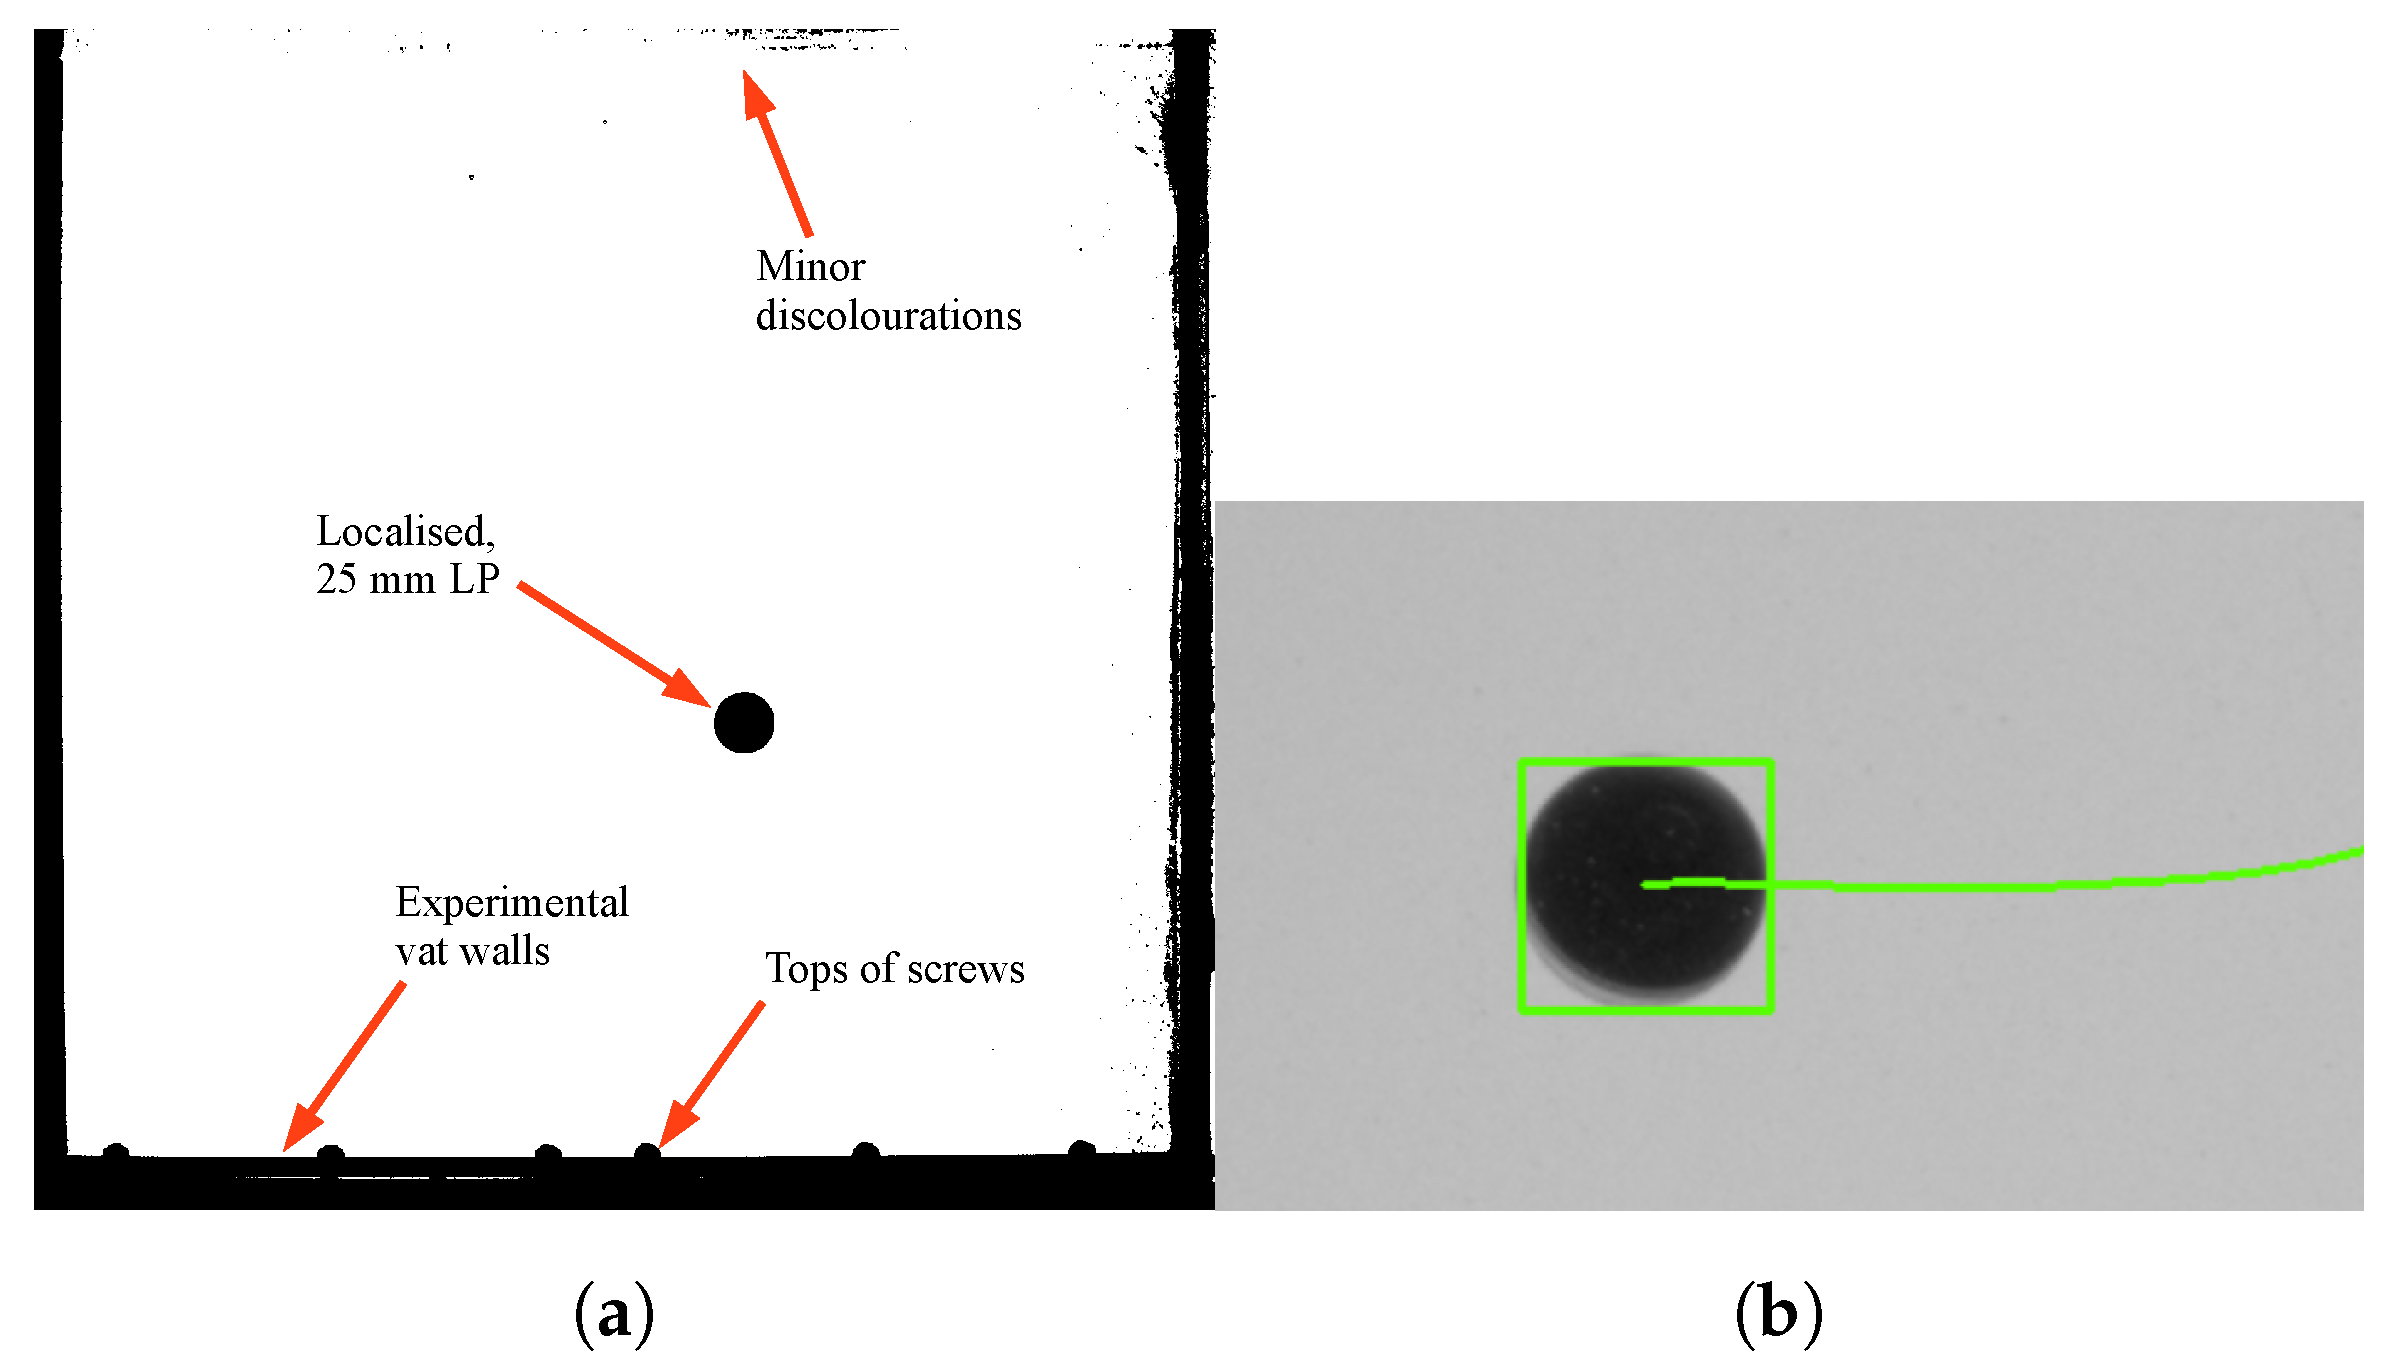
3.1. Camera and Capture Setup

The trajectory of an LP is captured by a CCD-camera (Basler acA4096-40uc, Ahrensburg, Germany) set at an approximate distance of 230 cm from the vessel (see Figure 5b). The camera is placed perpendicular and centrally in front of the vessel. One recording lasted 300 s , and the frame rate was set to 20 frames per second (fps). The captures acquired are stored for later evaluation with the open-source computer vision software of OpenCV.

3.2. Tracking via OpenCV

A tracking algorithm based on OpenCV is used to quantify the flow trajectory P(t) of an LP, allowing for later analyses—in particular, the evaluations regarding the ability of the respective LP to stay suspended within the stationary flow field. Due to the variation in size of the two LPs (25 mm and 40 mm), slight alterations to the tracking are made for the algorithm to accurately recognize and then track the LP. Calibration of the pixel to mm size is established using the open source software ImageJ (1.53t). The codes utilized and developed in this study are available via GitLab or the DARUS repository of the University of Stuttgart [31]. The trajectory of the LP P(t) is composed of the time-dependent path of the horizontal and vertical position p x , p y and velocity v x , v y
P ( t ) = [ p x , p y , v x , v y ] ( t ) .
The velocity u i components were calculated by the numerical differentiation of p i .
An example of how the captured images pertain to the trajectory of an LP is given in Figure 7b. The LP is recognized by the tracker, allowing the algorithm to ascertain and allocate the respective position p i (t).
The code utilizes the CSRT tracker, which stands for Channel and Spatial Reliability Tracker and was developed by Lukežič et al. [32]. The tracker is designed to efficiently track a region of interest (RoI) as it undergoes temporal changes, specifically in scenarios with lower frame rates such as at 20 fps. To begin the tracking, the target is localized and outlined as seen in Figure 7b, after which the programmed model will track the target and provide the results of the tracking and progress of the pathline. The targeting of the specific particle RoI is eased and made reproducible by adding an initial template matching to the tracking. A monochromatic filter is applied to the initial image (Figure 7) for a clear identification of the RoI. Tracking is not conducted with the respective filter but based on the full RGB values of the identified RoI in Figure 7b. In Figure 7a, the vessel walls, along with small discolorations indicating the target RoI, can be seen as dark spots in the binary threshold. This allows the code to locate the RoI based on the pixel size. After localization, the program continues at the original threshold as seen in Figure 7b with tracking via the CSRT tracker.

4. Lattice Boltzmann Simulations of Undisturbed Fluid Flow

To determine the undisturbed fluid flow field, a simulation is conducted in M-Star CFD 3.6.13 (M-Star Simulations, LLC, Ellicott City, MD, USA), which utilizes a Boltzmann solver, numerically solving the Boltzmann equation
f t + ζ T x f + F ext T ζ f = Ω ( f )
spatiotemporally for a D3Q19 set of velocity vectors, referring to a three-dimensional Lattice Boltzmann model with 19 discrete velocity vectors. The lattice model is illustrated in Figure 8, showing the respective interconnected lattice points [33].
The Boltzmann equation consists of the time derivative of f, representing how the distribution of particles with certain velocities changes, ζ , which represents the velocities that particles can have based on the model, and F ext denoting the external forces acting on the particles of the D3Q19 discretised model. The right side of the equation is made up by the collision parameter Ω ( f ) , for which the Bhatnagar–Gross–Krook
Ω ( f ) = 1 τ · f f eq
parameter is used [34,35,36], which simplifies the complex interactions between particles to a single relaxation time toward equilibrium. Hereby, τ represents the collision time constant, quantifying the time between particle collisions. This is followed by f eq , which denotes the equilibrium particle distribution. Coupled with the D3Q19 velocity basis, the solution for the Boltzmann equation
f i x + c i Δ t , t + Δ t = f i ( x , t ) + Δ t Ω i ( x , t )
is achieved [34,35,36].
The experimental vessel is recreated in M-Star with the respective inlet size and corresponding outlet. Hereby, there is already a slight deviation from the experiment. For the simulation, an outlet set to outflow conditions is created and located toward the top left corner. The inlet and outlet have a diameter of 11 mm and a length of 5 cm to ensure representative conditions when entering and exiting the vessel. In the physical experiment, a dividing wall with overflow is used; however, this was not possible to adequately simulate, resulting in the deviation between the simulation and experimental setup. Along the top of the vat, a free surface is implemented as in the physical experiments; for the remaining walls, no-slip conditions are set. The specific inlet velocity investigated in the simulation is that of an inlet velocity of 1.11 m s   1 . The simulation run time is set to 80 s with a lattice resolution of 350 lattice points for the horizontal and vertical axes and 77 lattice points along the third axis, amounting to roughly 9.5 Million lattice points. This equates to a lattice point distance of roughly 0.15 cm in the 48 cm sized square vat, while the Courant number was set to 0.05. For the resulting velocity field, a single steady-state condition of the flow field was taken into account, defining the present velocity field within the vessel.
The simulation is used to determine the mean local undisturbed flow field. This is then used in the calculation of the relative velocity between the flow field and particle. The use of the simulation establishes an equal one-way coupled basis, which is applied to the two LP variants, reducing the differences in particle dynamics to those related to the internal mass distribution.

5. Calculation and Characterization of Flow-Following Capabilities

Dimensionless numbers are used for the eased characterization, understanding and prediction of systems regardless of the system scale [37,38].
In the description of particles within a flow field, the flow-following capabilities are quantified by the Stokes number. The Stokes number is rooted in the equation of motion (Equation (6)) given by Maxey and Riley [39] as
F vertical = g · V p ( ρ p ρ f ) ,
A solution of the equation was proposed by Birch and Martin [40] and highlights the influence tangential velocity and radial velocity have on particle dynamics. It is important to note that the results assume that the particles are not rotating and do not account for non-homogeneous particles.
When applied to a particle, the Stokes number represents a value for how well it is able to follow the ideal trajectory; however, the calculation is limited to the tangential movement of a particle. The Stokes number gives a ratio between the response time of the particle τ p , also known as the momentum response or relaxation time, and the characteristic time of the flow field around the particle τ f [41,42].
S t = τ p τ f = response time of particle characteristic time of fluid flow
The description of the flow-following capabilities via the Stokes number becomes especially important in the case of LSPs, as they are some magnitudes larger than a fluid particle or a cell. Therefore, the quantification of the ability of a particle to follow the flow is paramount. With increasing particle size and density, the inertia of the particle in the flow field increases, as the finite time required by a particle to respond to a change in the flow field increases [41,42].
According to the definition of the Stokes number in Equation (7), the assumptions are made that for low Stokes numbers ( S t ≪ 1) [43], the time a particle requires to adjust to changes in the fluid velocity is much faster than that at which a change in the fluid velocity will occur. The flow-following capability of the particle is thereby very high. On the contrary, in case of very large Stoke numbers ( S t ≫ 1) [43], the flow-following capability of the particle is limited, as the time required to respond to changes in the velocity of the flow is very high [9]. Generally, a Stokes number ( S t < 0.1) is regarded as an adequate representation of the fluid flow via a particle. This, however, is contingent on the applied characteristic length scale [37,44].
For a spherical particle of the diameter d p , the response time of the particle τ p is defined by Crowe [43] as
τ p = ρ p · d p 2 μ f · 18 · 24 C D · R e p .
The particle response time here is limited to only account for tangential trajectories. Further work by Bluemink et al. [45] and Saffman [46] highlights the influence that rotational and lift forces have on particles dynamics. For the present work, Equation (8) is used based on the the publications by Reinecke et al. [9] and Hofmann et al. [27].
The drag coefficient for a spherical particle depends on the respective particle Reynolds number and is calculable for Reynolds numbers R e p < 2.6 · 10 5 [47] as
C D = 24 R e p · ( 1 + 0.173 · R e p 0.657 ) + 0.413 1 + 16300 · R e p 1.09 .
Hence, to minimize the momentum response time, the particle diameter should be kept small. Furthermore, in relation to the equation of motion by Maxey and Riley, it is beneficial to have the particle and fluid velocity, along with the LSP density, closely match that of the surrounding fluid. The goal is lowering the Stokes number, potentially resulting in more closely neutrally buoyant particles. Such particles are affected by the gravitational force in a manner similar to that of the surrounding fluid. This concept aligns with the principle of the Archimedes number A r [27,41].
The characteristic time for the flow field, on the other hand, also known as the eddy turnover time,
τ f = L char u 2
is calculated according to the characteristic length scale L char and the velocity of the bulk fluid u. For the specific case of LSPs, a variation of the equation pertaining to an STR is first suggested by Reinecke et al. [9] as
τ f = d imp v tip .
The characteristic time is thereby contingent on the impeller diameter d imp and the tip speed of the corresponding impeller in an STR [9,27], which is defined as
v tip = f rot · d imp · π .
From these two equations, the characteristic time for the flow field in an STR is defined as
τ f = 1 f rot · π .
Therefore, it is inversely proportionate to the rotational speed of the impeller.
Equation (11) states that the tip speed and the diameter of an impeller are the relevant factors in the characteristic time for the flow field. In the current setup, however, no impeller is implemented. It is for this reason that the Stokes number must be characterized by other values.
In this case, the fluid velocity is calculated based on simulated data and reduced to the 2D flow velocities along the horizontal and vertical axis of the vessel. The respective Stokes number is calculated for a 10 × 10 heatmap, combining the simulated and experimental data. Therefore, the characteristic time of the flow for the Stokes number is calculated as
τ f = L char ,   vessel u f 2 .
The characteristic length of the experimental vessel is set as the depth of the vessel, L char ,   vessel = 0.1 m. This approach follows the work by Ouellette et al. [41] and Hofmann et al. [27]. However, as the given setup does not have a specific Taylor length scale to define the characteristic length, the Stokes number is further calculable based on other approaches such as that by Zlokarnik [48]. In this approach, the characteristic length is defined as the same order as the largest turbulence generator, which in the current case, where no stirrer is implemented, equates to the largest diameter of the vessel L char ,   vessel   Zlo = 0.48 m.
In this study, the particle Reynolds number and Stokes number are calculated based on experimental and simulated velocity data in the vessel. This approach follows the calculation of the Stokes number for an LSP, by means of the second norm, to calculate the velocity based on the individual one-dimensional flow velocities with respect to the 3D vessel [27]. Due to the experimental setup, only two-dimensional velocities of the LSPs can be obtained, disregarding the possibility of depth velocity from the perspective of the camera. To better describe the particle Reynolds and Stokes numbers throughout the vessel, a 10 × 10 heatmap at a bin spacing of 4.8 cm is used to analyze the results. This grid model is used for all the respective 2D analyses.
The simulated velocity field results are limited to the two-dimensional planes. To capture variations in velocity across the depth of the vessel, nine evenly spaced output planes are used. On each of the planes, the velocity vectors, located at the respective lattice grid points of the simulation, are recorded. The central plane highlighted as the red plane in Figure 9 showing the top–down view of the vessel is located at the midpoint of the inlet. There are four further planes positioned both in front and behind of the middle plane from the perspective of the CCD camera in Figure 5, each spaced 5 mm apart (see Figure 9). This arrangement covers a total depth of 4 cm, corresponding to the largest LP diameter used in this study. By stacking the planes depth-wise, a simplified three-dimensional velocity grid analysis is facilitated, addressing the limitations of 2D analysis of a inherently 3D issue.

6. Experimental Results

In this study, four variations of Lagrangian Particles (LPs) are examined regarding the size ( d p = 25 mm and 40 mm) and position of the Center of Mass (CoM) in relation to the Geometric Center (GeoC) with CoM shifts of l off = 3.6 mm and 6.5 mm, respectively. The LPs are tested with respect to their flow-following capabilities and hydrodynamic characteristics at conditions of neutral buoyancy in deionized water ( ρ f = 996.9 ± 1 k g m 3 ). Neutrally buoyant LPs ( Δ ρ = 3.1 ± 1 k g m 3 ) are individually subjected to a total of two hours of repeated measurement runs in an acrylic glass vessel at three different set points of distinct flow rates for the inlet stream ( v inlet = 0.77 m s   1 , 1.11 m s   1 and 1.80 m s   1 ). The set points are selected based on matching the inlet stream velocity v inlet to distinct impeller tip speeds v tip of an industrial STR [16,22] (see Figure 4). The hydrodynamic characteristic results are further supported by Lattice Boltzmann Large Eddie Simulations, which provide the simulated velocity flow field. For simplicity of the Discussion and Results sections, local analyses of the LPs are limited to the results of the 40 mm LP due to the work by Buntkiel et al. and Bisgaard et al. [14,15,16].
The particle probability of presence is evaluated in two-dimensional form as heatmaps. Furthermore, the results in the form of the exhibited particle velocity ( u ¯ p ) are quantified and analyzed for the LP variations at equal flow conditions. Two-dimensional (2D) scatter plots depict the differences in hydrodynamic characteristics, which is followed by the quantitative study of the frequency of the respective LPs to fall out of the streamline of the flow. Positional and velocity related results are combined with the simulated data, culminating in the results demonstrating the differences of the LP with regard to the Stokes number. The culmination of experimental and simulated results is routed in the calculation of the velocity for the particle Reynolds and Stokes numbers, which require the particle velocity ( u ¯ p ) and the undisturbed fluid flow velocity ( u ¯ f ) to be accounted for.
Ultimately, the results of each LP design are compared to their respective counterpart LPs with varied positions of the CoM. Furthermore, distinctions related to particle size are presented. Reasonings for differences are highlighted and explored in the results regarding the flow-following capabilities and hydrodynamic characteristics.
For the comparison between the two LP variants, the relative velocity of the LP to the simulated fluid velocity is determined. For clarity and visualization of the two-dimensional fluid field, the simulated fluid velocity field and stream plot are shown in Figure 10. The plot highlights the inlet to the bottom right of the figures and also illustrates the circular flow pattern present in the vessel. The length of the arrows in Figure 10a correspond to the velocity present at the respective point in the vessel.

6.1. Evaluation of Flow Suspension Capability

In accordance with the recording settings, the algorithm and post-evaluation process generate visual representations of pathlines. Hereby, the path is determined based on the position of the LP in relation to the set pixels within the vessel. The velocity is then derived for each respective position in where the LP is recorded and determined based on the time progressed between the frames (f = 20 Hz). These pathlines are displayed in the scatter plots with a color bar on the right side indicating the exhibited particle velocity. Two exemplary scatter plots for the EQ-40 and OF-40 LP are shown in Figure 11a,b, respectively. The stream plot of the simulated velocity field from Figure 10b is superimposed. From the overlay of the measured LP pathlines as scatter plots and the stream plot, a good agreement of the fluid flow from the simulation can be seen. The applied color palette of the scatter plot is equalized between the LP variants to the highest velocity observed during the experimental evaluation. The plots are graphed based on the normalized vessel coordinates, specifically along the x-axis (horizontal) and y-axis (vertical). This allows for a clearer visualization of the spatial distribution of the pathlines within the vessel. A further aspect accounted for in the following section is the amount of times the respective LP comes in contact with the vessel floor. The off-center LP makes significantly more contact with the vessel floor and demonstrates higher velocities, particularly prior to the floor contacts, compared to its equatorial counterpart. This observation is effectively illustrated by depicting the experimental pathlines followed by each LP. In the following, the pathline of a single 300 s experiment ( v inlet = 1.11 m s   1 ) is shown for each 40 mm LP variant. Each figure also has a gray LP superimposed on the pathline to aid in the illustration. The equatorial LP is more likely to change direction, especially from downward to horizontal flow, by turning kinetic energy into rotational energy, which slows its descent. Moreover, the equatorial LP avoids contact with the vessel floor more often, especially when there are strong velocity differences at its poles, causing the LP to rise away from the vessel floor.
As visible in Figure 11a,b, the ability of the off-center LP to stay suspended within the fluid flow is compromised due to the shifted CoM. For this reason, the contact points of the LPs in the experiments are analyzed to quantify how frequently an LP falls out of the flow and whether there is a correlation between the dropping out of the flow and the respective LP type. Illustrated by the pathlines in Figure 11b, it becomes clear that for most circulations, the off-center LP has contact with the floor, meaning the LP could not adequately engage in a change in direction, leading to contacts with the floor of the vessel. Furthermore, a notable difference is that the equatorial LP follows several small slow circulations in the center of the vortex, while the off-center LP is not able to follow the slower flow fields in the central vortex of the vessel. These exemplary results highlight the difference in the ability to stay suspended within the fluid flow. Particularly in the downward-flow region to the left of the vessel, the velocity of the LPs is higher in the case of the off-center LP. The findings are further quantified and set in relation in Table 3, giving the results a quantitative relation as opposed to solely visual analysis.
The evaluation of the ability to stay suspended within the flow is determined by the first point of contact between the vessel and the LP; later contacts or bouncing of the LP is not taken into account. In addition to the absolute value pertaining to the hits on the vessel floor, the average velocity with respect to the moment before contact with the vessel floor, as well as the total number of circulations and the respective ratio of hits per circulation, are given Table 3. The uncertainties of the respective values are calculated based on the variation over the 24 individual experiments (each 300 s) while at equal conditions. More specifically, in the case of the velocity, the uncertainty pertains to the amount of hits and the respective velocity of the pathlines prior to contact.
Significant to the findings listed in Table 3 are the total amount of hits with the floor, which extends the previous point, in that the total amount of hits for the off-center LP are significantly higher than those for the equatorial LP. The greatest difference in contact points occurs for an inlet velocity of v inlet = 1.11 m s   1 . The off-center LP has up to three times the amount of contacts compared to the equatorial LP. For the remaining two inlet velocities, the difference is slightly lower at just above two times the amount hits for the OF-40 LP over the equatorial one. The lowest amount of contacts in relation to circulations for both LPs is noted for the highest set point at v inlet = 1.80 m s   1 . While in the opposite case of the flow, at the lowest inlet velocity v inlet = 0.77 m s   1 , the velocity gradients in the vessel are lower, leading to difficulties in slowing the LP in its downward trajectory and engaging in a change in direction, particularly in the case of the off-center LP.
The calculated velocity of the LPs before the point of contact highlights the previous assumptions that the OF-40 LP has difficulties staying suspended in the flow due to being 10 to 14% faster in the downward trajectory before contact with the floor compared to the equatorial LP.
In terms of a difference in total circulations, the two LPs yield similar results. Nevertheless, a ratio circumvents any bias to an increased amount of circulations.
The phenomenon of the equatorial LP engaging in a rotation, which leads to a reduction in velocity, was observed. It can be found in the quantitative results of the velocity prior to contact with the vessel floor as well as in the general velocity throughout the vessel. The ability to rotate along the LPs’ horizontal axis results in the reduction of velocity, as the energy is translated into rotational energy. The ability to rotate could carry certain implications for LSPs regarding the representation of eddies in highly turbulent regimes.
To support these findings, the hits-per-circulation ratio is calculated, which indicates the probability that an LP will come in contact with the vessel floor. The ratio shows that the off-center LP for all inlet velocity set points comes in contact with the floor at least twice as many times as the equatorial LP. The ratio further supports the findings, highlighting the greater ability of the equatorial LP to stay suspended within the flow field and engage in a meaningful change in direction. The hit-to-circulation ratio underlines the difference in hydrodynamic characteristics and flow-following capabilities of the two LP variants. While at close to equal amount of circulations, the off-center LP has significantly more hits, as well as shows an increased downward flow velocity, which is due to the inability to adequately slow and change direction.
With regard to the smaller 25 mm LP, the results are similar in that the differences are prevalent and significant values such as the contacts per circulation are close to twice as high for the off-center LP as is the case for the larger 40 mm LP. Furthermore, the total amount of circulations is close to the same for the variants. However, the velocity prior to impact for the smaller 25 mm LP is dissimilar to the differences seen for the larger 40 mm LP, as the differences are non-existent or very minimal. Nevertheless, under equal conditions where the particle velocity is similar, the off-center LP shows more contacts with the vessel floor.

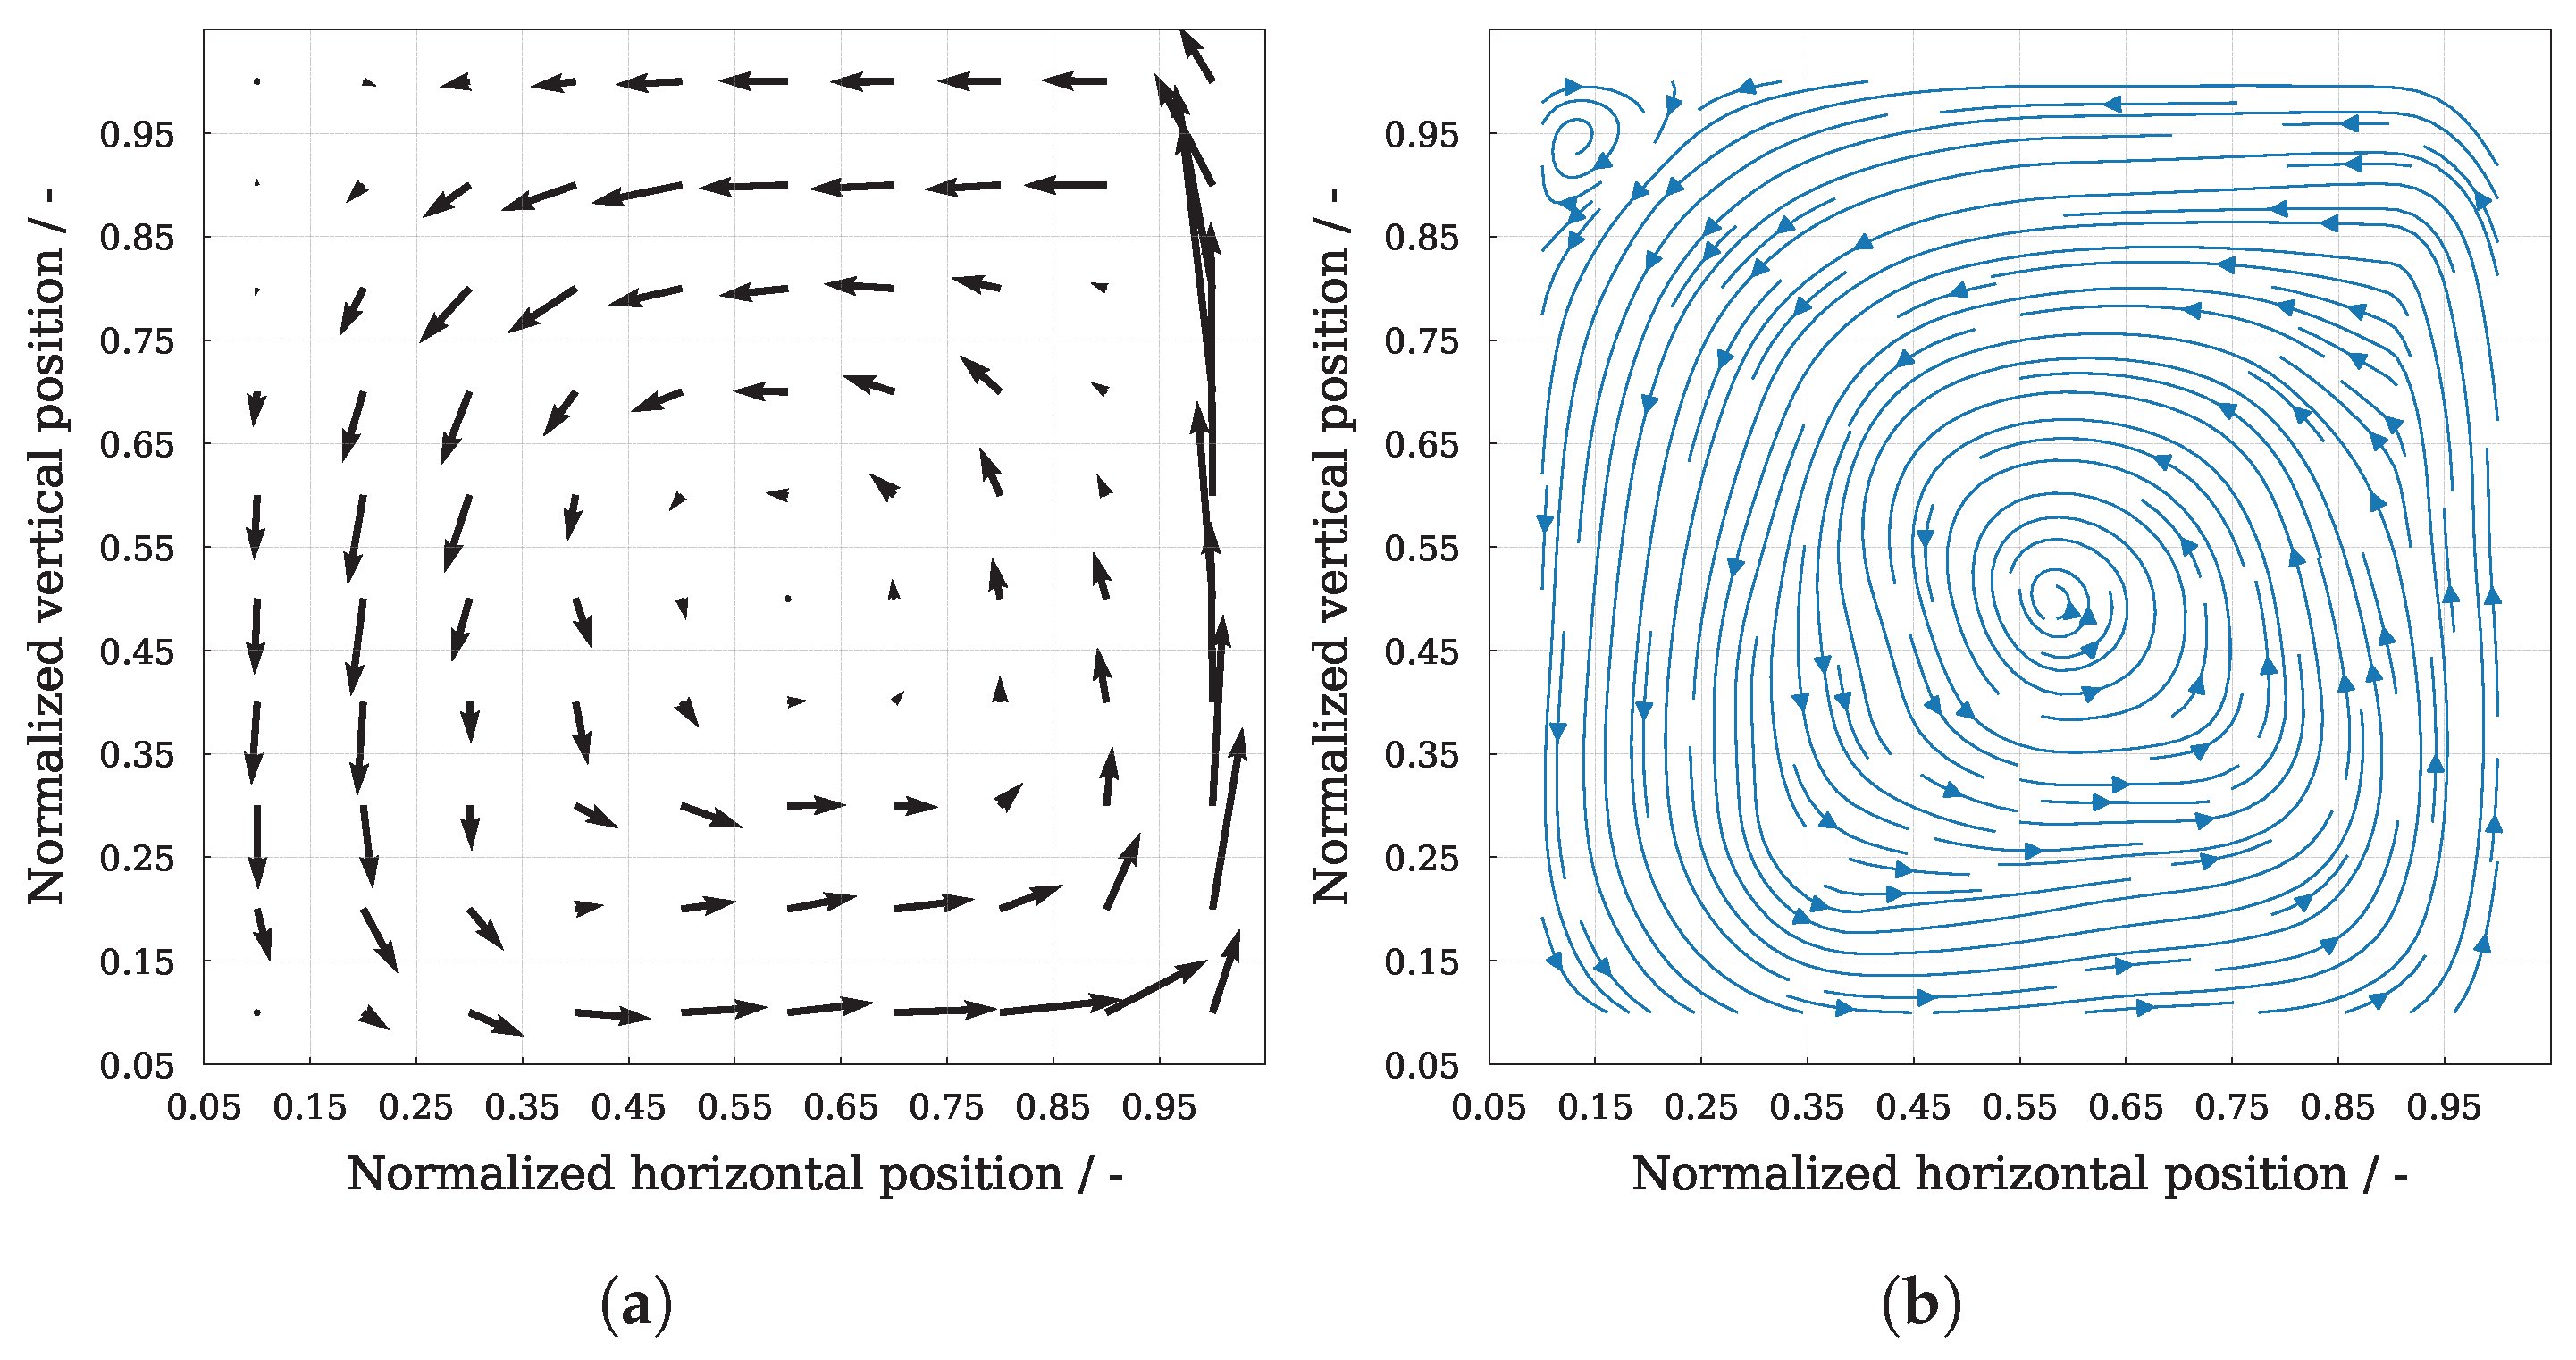
6.2. Two-Dimensional Probability of Presence

The results of the two-dimensional depiction of the results in Figure 12a,b, show the distribution within the vessel. In each figure, a 10 by 10 heatmap is shown, illustrating the probability of presence distribution in relation to the normalized coordinates of the reactor vessel along the x and y axes. The respective axes relate to the horizontal (x-axis) and vertical (y-axis) vessel coordinates. The analysis thereby allocates a grid across the reactor vessel, giving a probability for each respective grid point within the 10 by 10 grid system. Results show how the equatorial LP is able to stay suspended within the center of the vessel where the vortex with a slower fluid flow is present. The heatmaps for one LP variant are normalized based on the highest probability between two variants. This allows for better comparability between the two LP variants at the respective size (40 mm). The probability color scale is given as a color bar on the side of the individual heatmaps in Figure 12a,b. From the heatmaps, there is prominent drop in the OF-40 particles’ probability of presence toward the center of the vessel compared to the equatorial LP. This is reflected by the area in deep blue coloration denoting a low probability in Figure 12b of the off-center LP. A higher probability can be seen in the distribution within the vessel along the far right of Figure 12a,b, particularly for the off-center LP due to the inlet being located on the vessel floor below at the normalized position of x = 0.9. The effect of the difference in hydrodynamic characteristics is visible as the equatorial LP rises more frequently already before the strong and high velocities at the inlet, while the off-center LP cannot translate lower velocities as readily and requires the strong momentum closer to the vessel inlet. These results highlight the difference in hydrodynamic characteristics based on the position of the CoM relative to the GeoC at the distinctive inlet velocities.

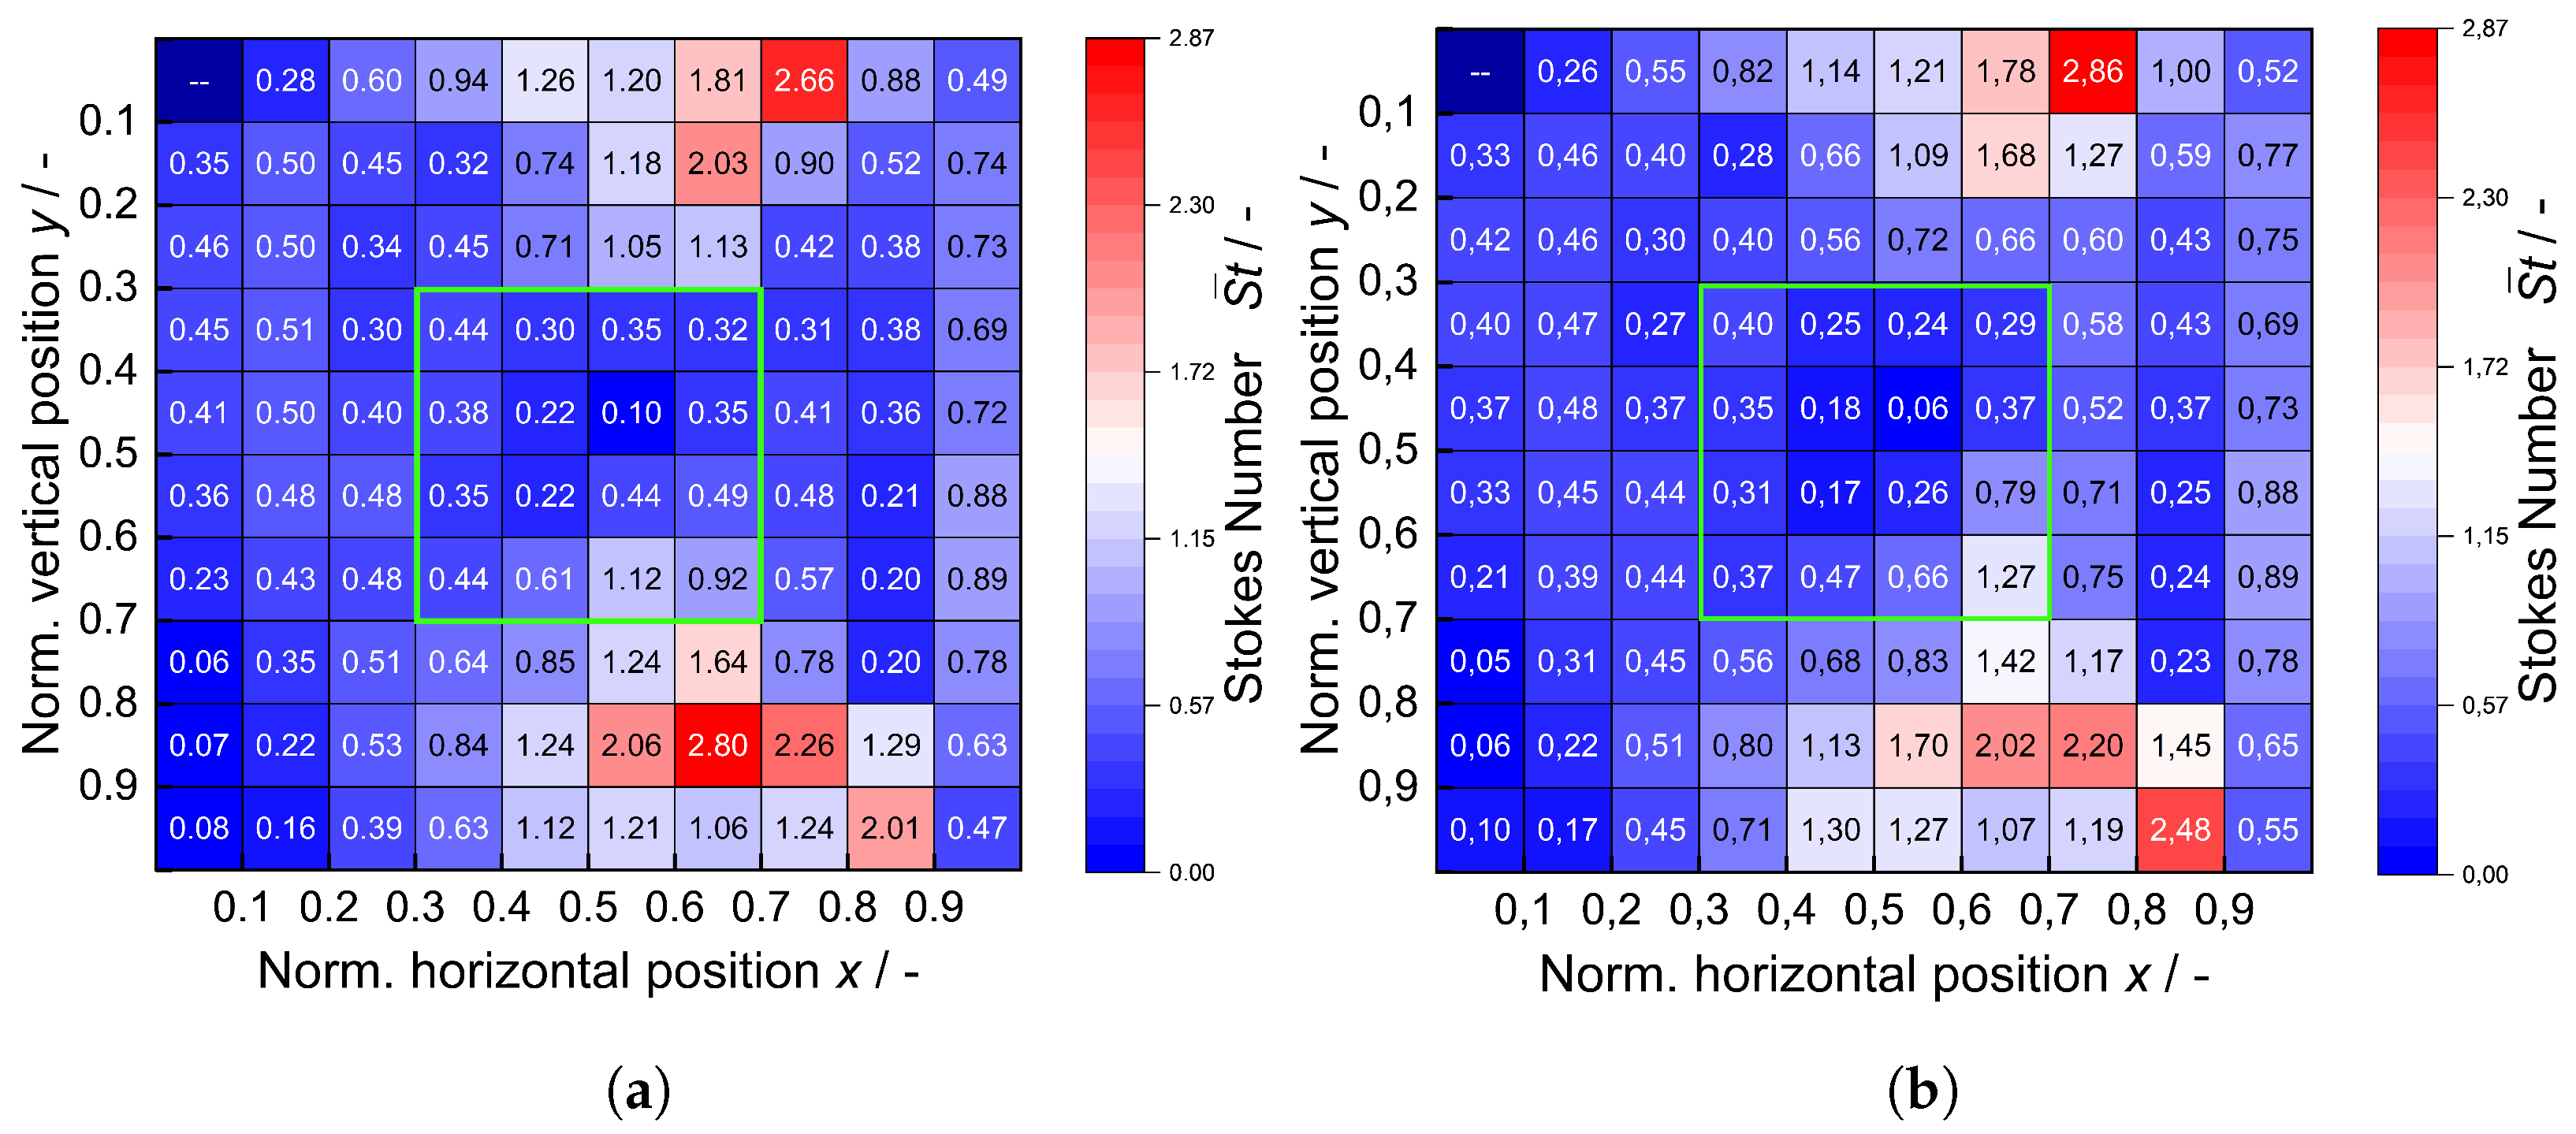
6.3. Stokes Number Grid

In connection with the characterization and flow-following capabilities of LPs, the Stokes number can provide an approach to the quantification of these characteristics and parameters.
The Stokes number is given in the form of the previously introduced 10 × 10 grids. Based on the positional data obtained in the previous sections showing the already significant difference in hydrodynamic characteristics and flow-following capabilities of the different LPs, the Stokes number for the two LP variations should also reflect the differences. However, this is not the case as shown in Figure 13a,b, which pertains to the EQ-40 and OF-40 LPs at v inlet = 1.11 m s   1 .
A crucial aspect influencing the Stokes number is the particle Reynolds number, which is calculated based on the relative velocity between the undisturbed flow field and the respective particle. This is the case for the given Figure 13a,b. The results show how both LPs have areas in the vessel in which the flow-following capabilities are better and areas where they struggle to follow the fluid flow. However, the difference in Stokes number between the two LPs appears minor and would not warrant any concrete characterizations. Considering the application of the Stokes number and based on the previously presented results, this should not be the case; instead, there should be a more apparent difference.
The significant areas based on the flow for both LP variations are the horizontal and vertical flows, where notable differences are apparent. Generally, for ideal flow-followers, the Stokes number should be smaller than 0.1 [37]. Certain regions within the vessel, particularly slower flowing areas, exhibit favorable flow-following hydrodynamic characteristics.
The 40 mm LPs indicate low Stokes numbers, aligning with near flow-following behavior assumptions. However, due to size constraints and higher Stokes numbers, the title of true flow-follower is not applicable. The off-center Stokes number grid shows similar results, yet it fails to adequately reflect the LPs’ reduced ability to follow the fluid flow and in particular the downward flow trajectory compared to the equatorial counterpart.
In the 4 × 4 center grid region of the vessel indicated in Figure 13 by the green bounding box, the flows characteristic time is higher due to a lower velocity compared to the rest of the vessel, resulting in low Stokes numbers for both LPs. A closer examination of the Stokes number values, particularly in the center flow region, exhibits a larger disparity between the LPs, revealing the anticipated variation in Stokes number. For overall smaller Stokes numbers, where the characteristic time of the fluid is large, these slight differences are less noticeable, as the characteristic time of the flow itself is found in the denominator. Due to the low values, minor differences become more significant than in regions with higher Stokes numbers. The difference in Stokes number between the LP variants can reach up to approximately 40% in the center flow field. However, these differences go unnoticed and may not accurately represent the true distinctions between the variants due to the visualization using an equal color palette between the two LP grids. It is also important to note that the off-center LP may have less reliable Stokes numbers around the center flow due to a lower residence density, as shown in Figure 12.
Noticeable are the higher Stokes number regions that are also highlighted through their white to red coloration. These results are indicative of the LP characteristics when suspended within the fluid flow in relation to the position of the CoM. The increased Stokes numbers are a result of stronger changes in velocity occurring in the respective areas: a deceleration when reaching the top of the vessel and an acceleration in the bottom area of the vessel leading up to the inlet. Furthermore, the top and bottom central regions with elevated Stokes numbers around the top and bottom of the vessel are influenced by the significant change in flow angle. Hence, the highlighted regions in the vessel are more prominent for the equatorial and off-center LPs. When the LP reaches a switch between vertical and horizontal flow, the momentum in relation to the MoI of the LP varies drastically, as the flow will change from a vertical to a horizontal flow. The momentum related to the translation from the experienced flow will vary based on the fluid flow angle in relation to the LP. This effect has an impact on the flow-following characteristics of the LPs. The impact is due to the CoM of the off-center LP sitting much lower than that of the equatorial LP, leading to a drastic change in the behavior and hydrodynamic characteristics. Furthermore, the harsher changes between vertical and horizontal flow along the right sides of the vessel are captured by the Stokes number for both variants. As a result of the inlet being located on the respective side, the velocity gradients are greater than on the opposing left side. This leads to a fairly sharp change in the Stokes number. The areas of this change are further highlighted in Figure 14. Here, four sections of the vessel are numbered, indicating the change in direction of the flow.
Numbers 1 and 3 highlight the change from a predominantly horizontal to vertical flow, while numbers 2 and 4 highlight the change from vertical to horizontal flow. To highlight the fluid flow, the stream plot from Figure 10b is given as an overlay of the short LP pathline. Within these respective regions, the differences in the Stokes number between the two LP variants are minimal, which should not be the case based on the previously highlighted differences. Above the inlet, on the other hand, similar Stokes numbers can be expected, as the deviation of the CoM in relation to GeoC from the perspective of the flow is minimal when comparing the two LPs.
Concerning the definition of the fluid’s characteristic length, following the method proposed by Zlokarnik [48] and choosing the maximum flow diameter of 0.48 m , the differences among the LPs remain consistent for the approaches of both Zlokarnik et al. [48] and Hofmann et al. [27]. This occurs due to the characteristic length; in the context of comparing LPs, functions act merely as a scaling factor, effectively increasing the numerator in the calculation of the characteristic time of flow.
To address these discrepancies in the representation of the flow-following capabilities by means of the Stokes number, the following section proposes an approach incorporating the shift in the CoM from the GeoC into the calculation of the Stokes number. As shown in the results based on the approach of Hofmann et al. [27] through Equation (8), this approach for the response time of the particle for the Stokes number is insufficient in the characterization of particles of a non-homogeneous nature.

6.4. Alternative Stokes Number Approach

In order to better account for the change in hydrodynamic capabilities and flow-following behavior based on the shift in CoM, the response time of the particle used in the Stokes number as given in Equation (8) is insufficient for applications with non-homogeneous particles.
While the equatorial LP can undoubtedly stay suspended for prolonged periods and equally follow the respective flow, the off-center LP cannot. Therefore, a strong difference in the Stokes number should be noticeable, making the quantification of the variation in hydrodynamic characteristics as a result of a shifted CoM within an LP in relation to a dimensionless number necessary. To this end, the response time of the particle τ p is expanded by incorporating the respective shift, based on the distance of CoM from GeoC, which is then set in relation to the radius of the LP. In Figure 15, the connection between the two lengths making up the shift factor is illustrated.
The proposed shift factor is modeled after the relationship that two levers have to one another, which in this case pertains to the two theoretical levers that are present with regard to the position of the CoM as the fulcrum. The shift factor can similarly be equated to the metacentric height of a ship [49]. The length r p pertains to the particle radius, while the length r shift is based on the distance of the CoM to the GeoC. The shift r * is then given by
r * = r p r shift r p + r shift = ^ s h o r t l e v e r l o n g l e v e r
and thus non-dimensional. Furthermore, with the proposed definition of the shift factor, homogeneous particles are not affected, as the s h o r t and l o n g l e v e r are equal. The shift factor is incorporated in the denominator of the characteristic response time of the particle, leading to the alternative particle response time
τ p , shift = ρ p μ f · 18 · 24 C D · R e p · d p 2 ( r * ) 2 .
The characteristic length d p implemented in the response time of the particle τ p , i is raised to the power of two. Since the proposed shift factor is related to the characteristic length of the particle, the shift factor is raised to the power of two as well. The direction of the shifted CoM is irrelevant to the equation, as in a fluid bed without any flow present, a particle or LP with a shifted CoM always aligns itself with the CoM below the GeoC. The shift values for the respective off-center and equatorial LPs are listed in Table 4 below.
The results of the modified Stokes number grid for LPs are given in Figure 16 and compared to the respective equatorial LP for the 40 mm LPs at v inlet = 1.11 m s   1 .
With the proposed Stokes number approach, the Stokes number grid is different compared to the previous approach. The new approach incorporates the influence that the shift in the CoM has on the hydrodynamic characteristics. The range of the off-center LP Stokes number grid is greater than that of the equatorial LP, which from the current perspective hovers around a value closer to S t < 0.1 with only slight deviations around the upper and lower boundaries. At these respective boundaries, particularly the off-center LPs have been shown to have difficulties staying suspended within the flow. It is in the center and the downward flow that the differences are significant. Furthermore, the Stokes numbers for the downward trajectories are more representative of the positional and local velocity data in connection to the momentum and MoI. Additionally, the range of the Stokes number pertaining to the off-center LP is greater than that of the equatorial LP. More specifically, the Stokes number range for the off-center LP ranges from 0 to 11, while the equatorial LP ranges from 0 to around 3. The more representative difference in Stokes number for the two LPs is solely a result of the very minor differences and the proposed correction factor for the Stokes number. These results are not limited to the larger 40 mm LP but are also reflected in the results pertaining to the 25 mm LP. Here, the differences between the respective LPs are of the same magnitude with respect to range throughout the grid.
The minor difference in Stokes number for the center flow area persists. Therefore, through the alternative approach, the difference is increased to a more reflective difference of up to around three times the previous one, indicating an improvement in the representativeness of the Stokes number for the case of an off-center LP. In particular, this is seen for the center flow and transitional flow with a change between vertical and horizontal flow, for it is in these areas where the greatest differences in positional results are documented. This correctional factor is, however, a constant correction and adjusts all grid points by the same factor. An increased scale factor based on the general velocity and direction of flow in relation to the off-center LP would be beneficial to better characterize the local variations instead of a blanket scaling factor.
In an attempt to characterize the Stokes number grid with one single scalar value, a weighted average of the respective grids is calculated. The average value is thereby calculated based on the Stokes number while accounting for the amount of counts within the respective grid point in the 10 × 10 grid with regard to the Stokes number in the grid point. The results are indicative of the differences shown between the LPs and are listed in Table 5. The approach (Equation (8)) for the Stokes number is classified as S t , while the proposed alternative approach is denoted as S t alt with the alternative approach following Equation (16).
In the weighted averages, the difference in the Stokes number is evident. From the Stokes number approach followed by Hofmann et al. [27], a slight difference in the Stokes number is already noticeable. This is the case for both LP sizes, the 25 mm and 40 mm, where the difference in Stokes numbers is calculated as Δ S t = 0.01 and Δ S t = 0.13, respectively. Hence, the minor differences seen in the Stokes number grid (see Figure 13a,b) are better accounted for by not only highlighting the local Stokes number values in a grid but also weighing the respective values based on the total counts.
In addition, the weighted difference for the proposed alternative approach is calculated. By incorporating the shift factor (Equation (15)), the difference is better highlighted and characterized as a more representative difference not only in the respective grid but in the scalar value. The difference in the proposed approach between the two LP variations equates to a difference of Δ S t alt = 0.84 for the 25 mm LP and a difference of Δ S t alt = 2.72 for the 40 mm LPs.
With the proposed Stokes number approach, the proven hydrodynamic characteristic differences between the equatorial and off-center LPs are better represented and quantified while still respecting the physical characteristics of the dimensionless number and experimental data. With the correction, certain areas, such as the transition area from a vertical to horizontal flow and in particular the center flow, are better highlighted. In the center flow, the correction leads to the off-center LPs having a Stokes number closer to 1.0 and overall higher value than that of the respective equatorial grid points. This better reflects the results of the positional data in the Stokes number, where the differences between the two LP variations are originally only visible in a limited manner.
Similarly to the results, which are an improvement with regard to representativeness of the Stokes number and positional results, further specifications of the approach would be advantageous. As shown in the results, the characteristics are strongly contingent on the direction of the flow in relation to the direction of the movement of the LP, which affects the relation of momentum to MoI based on the respective position of the CoM. This is specifically important to the off-center LP where, due to the off-set, the direction of flow becomes increasingly relevant to the hydrodynamic characteristics. For this reason, a more localized correction based on the direction of the fluid velocity would likely prove beneficial to the accurate representation of the Stokes number with regard to off-center LPs compared to equatorial ones, allowing for a correction to make results of such nature more comparable. This can be aided by CFD simulations of the fluid velocities in the respective vessel. However, for very large vessels, this can lead to computational difficulties.

7. Conclusions

The results presented here pertain to the study of the effects and implications the position of the Center of Mass (CoM) in relation to the Geometric Center (GeoC) have on the hydrodynamic characteristics and flow-following capabilities of Lagrangian Particles (LPs) ( d p = 25 mm and 40 mm). These investigations are conducted to provide a deeper understanding of the constraints regarding Lagrangian Sensor Particles (LSPs).
LPs of the same size exhibit minor differences in velocity; differences mainly occur in areas where strong alterations in the direction of flow in relation to the LP are present. Differences in velocity are relevant to the Stokes and particle Reynolds number, as this would be the only origin of difference in a quantitative value regarding the flow-following capabilities. The probability of presence results shows that the flow-following capabilities and hydrodynamic characteristics change considerably when comparing an off-center LP to an equatorial LP. The difference is further cemented by the ability of the equatorial LP to stay suspended within the stationary flow, while the off-center LP struggles at equal conditions. The equatorial LPs show a more homogeneous residence distribution within the vessel.
The differences highlighted in this study are reduced to the ability of the equatorial LP to rotate along its horizontal axis. The direction of fluid flow is paramount to this, as changes in the flow highlighted by the numbered regions in Figure 14 in relation to the LP lead to a variation of the momentum in relation to the Moment of Inertia based on the direction of flow to the position of CoM. When transferred to LSPs, the representation of eddies in the more turbulent regimes of an STR by LSPs is questionable based on the differences exhibited by the LPs in relation to the position of CoM. Rotation over the vertical axis is not impeded by this finding.
In the approach by Hofmann et al. [27] of calculating the Stokes number, difficulties emerged to adequately represent the differences in Stokes number based on the position of the CoM. Consequently, the presented study suggests and applies an approach to adequately represent the differences in flow-following capabilities and hydrodynamic characteristics of LPs with regard to their position of CoM. The approach adjusts the Stokes number of the respective LP by incorporating the change in LP characteristics based on the severity in shift of the position of the CoM in relation to the GeoC, which is similar to how ships are required to consider the metacentric height. This allows for the characterization of the flow-following capabilities based not only on the diameter, velocity and density of LPs but also on the position of the CoM. The differences in hydrodynamic characteristics and applicability of the proposed approach are further supported by the calculation of weighted averages of the Stokes number, pertaining to the Stokes number grid for the entire vessel. With minor differences of Δ S t = 0.01 for the 25 mm and Δ S t = 0.13 for the 40 mm LP recorded, the alternative approach presents a more reflective difference of Δ S t alt = 0.84 for the 25 mm and Δ S t alt = 2.72 for the 40 mm LP.
To this end, the results highlight the difference in hydrodynamic characteristics and flow-following characteristics based on the position of the CoM in relation to the GeoC.

Author Contributions

Conceptualization, R.R.; Methodology, R.R. and L.B.; Software, R.R. and J.S.; Formal analysis, R.R.; Investigation, R.R.; Writing—original draft, R.R.; Writing—review and editing, R.R., S.H., L.B., S.F.R., M.H., U.H. and M.S.; Visualization, R.R., L.B. and J.S.; Supervision, S.H., L.B., S.F.R., M.H., U.H. and M.S.; Project administration, M.H.; Funding acquisition, M.H. and M.S. All authors have read and agreed to the published version of the manuscript.

Funding

Funded by the Deutsche Forschungsgemeinschaft (DFG, German Research Foundation)—427899833. Parts of the HZDR’s work have been funded by the BMEL in the project SensOMix (FKZ 2219NR390), the project Neobio (FKZ 22032618), and from the Impulse and Networking fund of the Helmholtz Association within the framework of the Clean Water Technology Lab—A Helmholtz Innovation Lab (HIL-A02).

Data Availability Statement

The original contributions presented in the study are included in the article, further inquiries can be directed to the corresponding author or be retrieved from the DARUS repository of the University of Stuttgart [31].

Acknowledgments

The authors would like to thank Christian Kühne, Marc Maly and Christian Weiland for their valuable insights.

Conflicts of Interest

The authors declare no conflicts of interest. The funders had no role in the design of the study; in the collection, analyses, or interpretation of data; in the writing of the manuscript; or in the decision to publish the results.

References

  1. Haringa, C.; Deshmukh, A.T.; Mudde, R.F.; Noorman, H.J. Euler-Lagrange analysis towards representative down-scaling of a 22 m3 aerobic S. cerevisiae fermentation. Chem. Eng. Sci. 2017, 170, 653–669. [Google Scholar] [CrossRef]
  2. Bisgaard, J.; Muldbak, M.; Cornelissen, S.; Tajsoleiman, T.; Huusom, J.K.; Rasmussen, T.; Gernaey, K.V. Flow-following sensor devices: A tool for bridging data and model predictions in large-scale fermentations. Comput. Struct. Biotechnol. J. 2020, 18, 2908–2919. [Google Scholar] [CrossRef] [PubMed]
  3. Reinecke, S.F.; Hampel, U. Instrumented flow-following sensor particles with magnetic position detection and buoyancy control. J. Sens. Sens. Syst. 2016, 5, 213–220. [Google Scholar] [CrossRef]
  4. Lapin, A.; Müller, D.; Reuss, M. Dynamic Behavior of Microbial Populations in Stirred Bioreactors Simulated with Euler-Lagrange Methods: Traveling along the Lifelines of Single Cells. Ind. Eng. Chem. Res. 2004, 43, 4647–4656. [Google Scholar] [CrossRef]
  5. Blöbaum, L.; Haringa, C.; Grünberger, A. Microbial lifelines in bioprocesses: From concept to application. Biotechnol. Adv. 2023, 62, 108071. [Google Scholar] [CrossRef] [PubMed]
  6. Stine, J.M.; Beardslee, L.A.; Sathyam, R.M.; Bentley, W.E.; Ghodssi, R. Electrochemical Dissolved Oxygen Sensor-Integrated Platform for Wireless In Situ Bioprocess Monitoring. Sens. Actuators Chem. 2020, 320, 128381. [Google Scholar] [CrossRef]
  7. Todtenberg, N.; Klatt, J.; Schmitz-Hertzberg, S.T.; Jorde, F.; Schmalz, K. Wireless sensor capsule for bioreactors. In Proceedings of the 2013 IEEE MTT-S International Microwave Workshop Series on RF and Wireless Technologies for Biomedical and Healthcare Applications, IMWS-BIO 2013, Singapore, 9–11 December 2013. [Google Scholar] [CrossRef]
  8. Todtenberg, N.; Schmitz-Hertzberg, S.T.; Schmalz, K.; Klatt, J.; Jorde, F.; Jüttner, B.; Kraemer, R. Autonomous sensor capsule for usage in bioreactors. IEEE Sens. J. 2015, 15, 4093–4102. [Google Scholar] [CrossRef]
  9. Reinecke, S.; Deutschmann, A.; Jobst, K.; Kryk, H.; Friedrich, E.; Hampel, U. Flow following sensor particles-Validation and macro-mixing analysis in a stirred fermentation vessel with a highly viscous substrate. Biochem. Eng. J. 2012, 69, 159–171. [Google Scholar] [CrossRef]
  10. Reinecke, S.F.; Buntkiel, L.; Kipping, R.; Hampel, U. Process characterization in industrial vessels by flow-following sensor particles. Meas. Sci. Technol. 2022, 33, 12. [Google Scholar] [CrossRef]
  11. Duisterwinkel, E.; Demi, L.; Dubbelman, G.; Talnishnikh, E.; Wörtche, H.J.; Bergmans, J.W. Environment mapping and localization with an uncontrolled swarm of ultrasound sensor motes. Proc. Meet. Acoust. 2014, 20, 30001. [Google Scholar]
  12. Duisterwinkel, E.H.; Talnishnikh, E.; Krijnders, D.; Wortche, H.J. Sensor Motes for the Exploration and Monitoring of Operational Pipelines. IEEE Trans. Instrum. Meas. 2018, 67, 655–666. [Google Scholar] [CrossRef]
  13. Duisterwinkel, E.H.; Dubbelman, G.; Talnishnikh, E.; Bergmans, J.J.; Wortche, H.J.; Linnartz, J.P.M. Go-With-the-Flow Swarm Sensing in Inaccessible Viscous Media. IEEE Sens. J. 2020, 20, 4442–4452. [Google Scholar] [CrossRef]
  14. Bisgaard, J.; Zahn, J.A.; Tajsoleiman, T.; Rasmussen, T.; Huusom, J.K.; Gernaey, K.V. Data-based dynamic compartment model: Modeling of E. coli fed-batch fermentation in a 600 m3bubble column. J. Ind. Microbiol. Biotechnol. 2022, 49, kuac021. [Google Scholar] [CrossRef] [PubMed]
  15. Buntkiel, L.; Ma, Y.; Reinecke, S.F.; Hampel, U. Orientation resolved measurements of accelerations with sensor particles in bioreactors. Tech. Mess. 2023, 90, 835–845. [Google Scholar] [CrossRef]
  16. Hofmann, S.; Buntkiel, L.; Rautenbach, R.; Gaugler, L.; Ma, Y.; Haase, I.; Fitschen, J.; Wucherpfennig, T.; Reinecke, S.F.; Hoffmann, M.; et al. Experimental Analysis of Lifelines in a 15,000 L Bioreactor by Means of Lagrangian Sensor Particles. Chem. Eng. Res. Des. 2024, 205, 695–712. [Google Scholar] [CrossRef]
  17. Ascanio, G. Mixing time in stirred vessels: A review of experimental techniques. Chin. J. Chem. Eng. 2015, 23, 1065–1076. [Google Scholar] [CrossRef]
  18. Edwards, M.F.; Baker, M.R.; Godfrey, J.C. Chapter 8—Mixing of liquids in stirred tanks. In Mixing in the Process Industries; Harnby, N., Edwards, M.F., Nienow, A.W., Eds.; Butterworth-Heinemann: Oxford, UK, 1992; pp. 137–158. [Google Scholar] [CrossRef]
  19. Ascanio, G.; Brito-Bazán, M.; Fuente, E.B.D.L.; Carreau, P.J.; Tanguy, P.A. Unconventional Configuration Studies to Improve Mixing Times in Stirred Tanks. Can. J. Chem. Eng. 2002, 80, 558–565. [Google Scholar] [CrossRef]
  20. Carreau, P.J.; Patterson, I.; Yap, C.Y. Mixing of viscoelastic fluids with helical-ribbon agitators. I—Mixing time and flow patterns. Can. J. Chem. Eng. 1976, 54, 135–142. [Google Scholar] [CrossRef]
  21. Hoogendoorn, C.; den Hartog, A. Model studies on mixers in the viscous flow region. Chem. Eng. Sci. 1967, 22, 1689–1699. [Google Scholar] [CrossRef]
  22. Rosseburg, A.; Fitschen, J.; Wutz, J.; Wucherpfennig, T.; Schlüter, M. Hydrodynamic inhomogeneities in large scale stirred tanks—Influence on mixing time. Chem. Eng. Sci. 2018, 188, 208–220. [Google Scholar] [CrossRef]
  23. Kraume, M.; Zehner, P. Experience with Experimental Standards for Measurements of Various Parameters in Stirred Tanks: A Comparative Test. Chem. Eng. Res. Des. 2001, 79, 811–818. [Google Scholar] [CrossRef]
  24. Espinosa-Solares, T.; Fuente, E.B.D.L.; Tecante, A.; Medina-Torres, L.; Tanguy, P.A. Mixing Time in Rheologically Evolving Model Fluids by Hybrid Dual Mixing Systems. Chem. Eng. Res. Des. 2002, 80, 817–823. [Google Scholar] [CrossRef]
  25. Gaugler, L.; Mast, Y.; Fitschen, J.; Hofmann, S.; Schlüter, M.; Takors, R. Scaling-down biopharmaceutical production processes via a single multi-compartment bioreactor (SMCB). Eng. Life Sci. 2022, 23, e2100161. [Google Scholar] [CrossRef] [PubMed]
  26. Buntkiel, L.; Heller, A.; Budelmann, C.; Reinecke, S.; Hampel, U. 2.2—Mit UWB-Lokalisierung gekoppelte inertiale Lage- und Bewegungsverfolgung für instrumentierte Strömungsfolger. In Proceedings of the 15. Dresdner Sensor-Symposium 2021, Dresden, Germany, 6–8 December 2021; pp. 22–27. [Google Scholar] [CrossRef]
  27. Hofmann, S.; Weiland, C.; Fitschen, J.; von Kameke, A.; Hoffmann, M.; Schlüter, M. Lagrangian sensors in a stirred tank reactor: Comparing trajectories from 4D-Particle Tracking Velocimetry and Lattice-Boltzmann simulations. Chem. Eng. J. 2022, 449. [Google Scholar] [CrossRef]
  28. Will, J.B.; Krug, D. Dynamics of freely rising spheres: The effect of moment of inertia. J. Fluid Mech. 2021, 927, A7. [Google Scholar] [CrossRef]
  29. Will, J.B.; Krug, D. Rising and Sinking in Resonance: Mass Distribution Critically Affects Buoyancy-Driven Spheres via Rotational Dynamics. Phys. Rev. Lett. 2021, 126, 174502. [Google Scholar] [CrossRef] [PubMed]
  30. Zimmermann, R.; Fiabane, L.; Gasteuil, Y.; Volk, R.; Pinton, J.F. Characterizing flows with an instrumented particle measuring Lagrangian accelerations. New J. Phys. 2013, 15, 015018. [Google Scholar] [CrossRef]
  31. Rautenbach, R.; Buntkiel, L.; Schäfer, J.; Hofmann, S. Processes Data and Code for Dynamics of Lagrangian Sensor Particles; DARUS Repository of the University of Stuttgart; DaRUS: Stuttgart, Germany, 2024. [Google Scholar] [CrossRef]
  32. Lukežič, A.; Vojíř, T.; Luka, L.; Zajc, L.; Matas, J.; Kristan, M. Discriminative Correlation Filter with Channel and Spatial Reliability. In Proceedings of the IEEE Conference on Computer Vision and Pattern Recognition (CVPR), Honolulu, HI, USA, 21–26 July 2017. [Google Scholar]
  33. M-Star. Theory and Implementation—M-Star CFD Documentation. Available online: https://docs.mstarcfd.com/ (accessed on 27 November 2022).
  34. Krüger, T.; Kusumaatmaja, H.; Kuzmin, A.; Shardt, O.; Silva, G.; Viggen, E.M. The Lattice Boltzmann Equation. In The Lattice Boltzmann Method: Principles and Practice; Springer International Publishing: Cham, Switzerland, 2017; pp. 61–104. [Google Scholar] [CrossRef]
  35. Guo, Z.; Shu, C. Lattice Boltzmann Method and Its Applications in Engineering; World Scientific: Singapore, 2013; Volume 3. [Google Scholar] [CrossRef]
  36. Mohamad, A.A. Lattice Boltzmann Method; Springer: London, UK, 2019. [Google Scholar] [CrossRef]
  37. Tropea, C. Springer Handbook of Experimental Fluid Mechanics; Springer: Berlin/Heidelberg, Germany, 2007. [Google Scholar] [CrossRef]
  38. Ruzicka, M.C. On dimensionless numbers. Chem. Eng. Res. Des. 2008, 86, 835–868. [Google Scholar] [CrossRef]
  39. Maxey, M.R.; Riley, J.J. Equation of motion for a small rigid sphere in a nonuniform flow. Phys. Fluids 1983, 26, 883–889. [Google Scholar] [CrossRef]
  40. Birch, D.M.; Martin, N. Tracer particle momentum effects in vortex flows. J. Fluid Mech. 2013, 723, 665–691. [Google Scholar] [CrossRef]
  41. Ouellette, N.T.; O’malley, P.J.J.; Gollub, J.P. Transport of Finite-Sized Particles in Chaotic Flow. Phys. Rev. Lett. 2008, 101, 174504. [Google Scholar] [CrossRef] [PubMed]
  42. Israel, R.; Rosner, D.E. Use of a Generalized Stokes Number to Determine the Aerodynamic Capture Efficiency of Non-Stokesian Particles from a Compressible Gas Flow. Aerosol Sci. Technol. 1982, 2, 45–51. [Google Scholar] [CrossRef]
  43. Crowe, C.T. Multiphase Flows with Droplets and Particles; CRC Press: Boca Raton, FL, USA, 2012. [Google Scholar]
  44. Fangary, Y.S.; Barigou, M.; Seville, J.P.; Parker, D.J. Fluid trajectories in a stirred vessel of non-newtonian liquid using positron emission particle tracking. Chem. Eng. Sci. 2000, 55, 5969–5979. [Google Scholar] [CrossRef]
  45. Bluemink, J.J.; Lohse, D.; Prosperetti, A.; Wijngaarden, L.V. Drag and lift forces on particles in a rotating flow. J. Fluid Mech. 2010, 643, 1–31. [Google Scholar] [CrossRef]
  46. Saffman, P.G. The lift on a small sphere in a slow shear flow. J. Fluid Mech. 1965, 22, 385–400. [Google Scholar] [CrossRef]
  47. Haider, A.; Levenspiel, O. Drag coefficient and terminal velocity of spherical and nonspherical particles. Powder Technol. 1989, 58, 63–70. [Google Scholar] [CrossRef]
  48. Zlokarnik, M. Stirring: Theory and Practice; Wiley-VCH: Hoboken, NJ, USA, 2001; 362p. [Google Scholar]
  49. Lewis, E.V. Principles of Naval Architecture; The Society of Naval Architects and Marine Engineering: Alexandria, VA, USA, 1988; Volume 1. [Google Scholar]
Figure 1. LSP design by [15] used as inspiration for this work. With the LSP almost shut (left), the threaded rod visible in the upper half shell (center), and the internal sensors and circuit boards as well as power source (right).
Processes 12 01617 g001
Figure 2. Computer-Aided Design of LPs with internal brass weights. (a) Equatorial design from side on. (b) Equatorial design with CoM symbol. (c) Off-center design from side on. (d) Off-center design with CoM symbol.
Processes 12 01617 g002
Figure 3. LSP design for tracking of flow-following capabilities in a vessel used in this study. With 25 mm equatorial LP and respective cylindrical brass insert (top left). The 40 mm off-center LP with respective brass insert shifting the CoM (top right). Closed 25 mm equatorial and 40 mm off-center LP (bottom).
Processes 12 01617 g003
Figure 4. Illustration of how the flow is qualitatively replicated in the experimental vessel with an example of OpenCV code localizing and tracking an LP with the simulated velocity field as overlay and the respective Lagrangian Particle release points marked as blue crosses; illustration of the flow profile based on a Rushton turbine impeller, relating the impeller tip velocity v tip to the inlet velocity v inlet of the circular flow field generated in the experimental vessel.
Processes 12 01617 g004
Figure 5. Overall experimental setup for investigation of the flow-following capabilities with (a) the vertical dividing wall, (b) the camera and vessel setup, and the (c) schematic drawing of the vessel.
Processes 12 01617 g005
Figure 6. Clasping and release of a 25 mm LP.
Processes 12 01617 g006
Figure 7. (a) Initial image with binary filter applied used for the automated localization of 25 mm LP. (b) Example of OpenCV code localizing and tracking an LP. The green box represents the RoI that is recognized via the initial template matching based on the target pixel size.
Processes 12 01617 g007
Figure 8. Illustration of the D3Q19 lattice structure.
Processes 12 01617 g008
Figure 9. Illustration of the output planes from the simulation, in relation to inlet and vessel walls based on a top–down view of the vessel. For the calculation of the Stokes and Reynolds number, requiring the undisturbed fluid flow velocity field.
Processes 12 01617 g009
Figure 10. Visualization of the simulated velocity field as (a) velocity field with vectors and (b) streamlines of the flow at an inlet velocity of v inlet = 1.11 m s   1 .
Processes 12 01617 g010
Figure 11. Comparison of exemplary scatter plots for (a) EQ-40 and (b) OF-40, showing the normalized velocity as a result of the pathline and position with respect to the pathline throughout the vessel, with a gray LP superimposed for illustration purposes, at an inlet velocity of v inlet = 1.11 m s   1 .
Processes 12 01617 g011
Figure 12. Two-dimensional probability of presence of the equatorial (a) and off-center (b) 40 mm LP at an inlet velocity of v inlet = 1.11 m s   1 .
Processes 12 01617 g012
Figure 13. Stokes number grid based on proposed Stokes number approach by Hofmann et al. [27] incorporating the simulated and experimental velocity for the (a) EQ-40 and (b) OF-40 LP at v inlet = 1.11 m s   1 with a green bounding box to highlight the inner 4 × 4 grid points.
Processes 12 01617 g013
Figure 14. Numbering of areas in which a change in the direction of flow occurs at an inlet velocity of v inlet = 1.11 m s   1 . The numbering follows the counter-clockwise flow from the inlet over the respective vessel corners. The image consists of a short exemplary pathline of an LP (EQ-40) with the simulated stream plot as overlay.
Processes 12 01617 g014
Figure 15. Illustration of the proposed shift factor based on the particle radius r p and radial distance from Geometric Center to the position of the Center of Mass (CoM), allowing for consideration of the position of CoM in the Stokes number.
Processes 12 01617 g015
Figure 16. Stokes number grid, based on the proposed Stokes number approach for the inclusion of the shifted CoM, incorporating the simulated and experimental velocity for the (a) EQ-40 and (b) OF-40 LP at v inlet = 1.11 m s   1 .
Processes 12 01617 g016
Table 1. Specifications of investigated Lagrangian Particles.
LP NameDiameter d p /mmInternalsPosition of Center of Mass
EQ-2525Centered cylindrical brass weightCenter of sphere (equatorial)
OF-2525Off-center brass weight3.6 mm offset from Center of sphere
EQ-4040Centered cylindrical brass weightCenter of sphere (equatorial)
OF-4040Off-center brass weight6.5 mm offset from Center of sphere
Table 2. Experimental flow field set points for investigations of LPs.
LP NameInlet Velocity vinlet/m s−1Total Runs nruns/-Duration of Run trun/s
0.7724300
OF-251.1124300
1.8024300
0.7724300
EQ-251.1124300
1.8024300
0.7724300
OF-401.1124300
1.8024300
0.7724300
EQ-401.1124300
1.8024300
Table 3. Quantification of floor hits, prior velocity and total circulations of 40 mm LPs at 0.77, 1.11 and 1.80 m s   1 .
Inlet velocityLP Name0.771.111.80
v inlet / m s   1
LP velocity EQ-255.3 ± 0.17.1 ± 0.38.6 ± 0.3
u ¯ p , mag /cm s   1 OF-255.2 ± 0.17.1 ± 0.19.1 ± 0.2
Total circulationsEQ-25273395538
n circ /-OF-25266407565
Total hitsEQ-251003081
n hit /-OF-25137152177
Contacts per circulationsEQ-250.360.080.15
x hit /-OF-250.520.370.31
LP velocityEQ-404.6 ± 0.16.2 ± 0.28.2 ± 0.3
u ¯ p , mag /cm s   1 OF-405.2 ±  0.17.1 ± 0.18.9 ± 0.2
Total circulationsEQ-40273370534
n circ /-OF-40280392525
Total hitsEQ-40868271
n hit /-OF-40185230163
Contacts per circulationsEQ-400.310.220.13
x hit /-OF-400.660.590.31
Table 4. Shift factors r * of equatorial (EQ) and off-center (OF) Lagrangian Particles (LPs).
LP NameLP Radius r p /mmCoM Shift r shift /mmCoM Shift r shift /%Shift Factor r * /-
EQ-2512.500.000.001.00
OF-2512.503.6128.890.55
EQ-4020.000.000.001.00
OF-4020.006.5032.500.51
Table 5. Weighted Stokes numbers, based on Hofmann et al. [27] S t and proposed alternative approach S t alt , which incorporates the shifted CoM.
LP NameStokes Number St /-Proposed Stokes Number St alt /-Difference in Stokes Number Δ St /-Difference in Alternative Stokes Number Δ St alt /-
EQ-250.330.330.010.84
OF-250.341.17
EQ-400.780.780.132.72
OF-400.913.50
Disclaimer/Publisher’s Note: The statements, opinions and data contained in all publications are solely those of the individual author(s) and contributor(s) and not of MDPI and/or the editor(s). MDPI and/or the editor(s) disclaim responsibility for any injury to people or property resulting from any ideas, methods, instructions or products referred to in the content.

