Abstract
System failure in large-scale electrolyzer and fuel cell installations may cause the formation of explosive H2–air–steam mixtures. Detonation properties (e.g., detonation cell size) and flame dynamics features (e.g., flame acceleration, runup distance, and deflagration-to-detonation transition “DDT”) of these mixtures were investigated experimentally and numerically to gain a more in-depth understanding of the hazards of H2–air–steam under conditions pertinent to PEM-based electrolyzers and fuel cells (temperatures between 50 °C and 80 °C and pressures between 20 and 40 bar). While our results confirm the findings of previous studies in terms of the cooling effects of steam on detonation, we found that operating pressures between 20 and 40 bar counteract the effect of steam, making the H2–air–steam mixture more detonable. This is particularly evident from the experimental data on detonation cell size and runup distance at pressures greater than 20 bar.
1. Introduction
Green hydrogen will play a crucial role in supporting the transition to a decarbonized global economy. Hydrogen has been used safely by the industry for over half a century, and its utilization will only grow over the coming decades [1,2,3]. However, while hazards associated with hydrogen utilization in the established industry sectors (e.g., oil refining, petrochemical, steel, and fertilizer production) are well understood [4,5,6,7,8,9,10], this knowledge may not be sufficient to develop engineering controls for mitigating the risks of producing, transporting, and using hydrogen in new energy systems such as electrolyzers and fuel cells. For example, stack rupture or pinhole leaks may result in loss of cooling (i.e., overheating), in turn, enabling H2, O2, and steam to mix. If this explosive gas mixture leaks into the containment building(s) and ignites, it could potentially cause catastrophic damage in terms of loss of property and human life. Interestingly, the open literature [4] suggests that steam reduces the detonable range of hydrogen, although most of the previous studies were carried out at temperatures and pressures that were not consistent with those of electrolyzers and fuel cells. Therefore, the actual impact of steam in scenarios like that described above is not well understood, partly due to lack of relevant data. The present paper attempts to narrow down this knowledge gap, given the scarcity of data related to initial pressures greater than 3 bar. The novel features of the work presented are (i) pilot-scale experimentation under conditions pertinent to large-scale electrolyzer and fuel cell installations, i.e., temperatures between 50 °C and 80 °C and pressures between 20 and 40 bar; (ii) a combined experimental, theoretical, computational, and data mining approach to the analysis of experimental data; and (iii) collection of a wealth of experimental data for H2–air–steam mixtures at initial pressures between 20 and 40 bar, exceeding previous studies that primarily focused on pressures lower than 3 bar.
2. Materials and Methods
2.1. Experimental
The experimental setup used in this study was the University of Newcastle’s (Australia) large-scale detonation tube facility shown in Figure 1 [11,12,13]. This state-of-the-art facility consists of a 30-m-long tubular explosion vessel with an inner diameter of 456 mm and a thickness of 26.7 mm. The detonation tube, which is open at one end, is constructed of 11 mild steel (Schedule 80) segments joined together by flanges and high-strength fasteners. The detonation tube is equipped with a gas control manifold to precisely create test mixtures of fuel, oxidizer, and diluents (if needed). The manifold consists of a gas mixer system, a vacuum system, a purge (blowing) system, primary and secondary chamber circulation systems, DRAEGER gas monitors, dust injection ports, a 50 mJ chemical igniter plug, a pyrometer, a high-speed camera, instrumentation, and data acquisition systems, as shown schematically in Figure 1c. The detonation tube is designed to measure pressure rise, light intensity, temperature, and the velocity of homogeneous and heterogeneous gas mixtures under conditions pertinent to flaming combustion, deflagration, and full detonation.
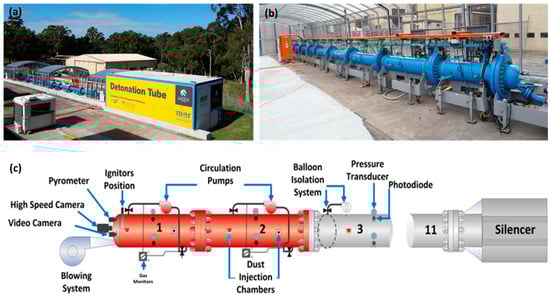
Figure 1.
University of Newcastle’s detonation tube: (a) far field image, (b) closeup image, and (c) key components [11].
In terms of diagnostics, the detonation tube is fitted with 33 pressure transducers (ATM.ECO/EX2.9911.0105.11.U) to map the location of the shock front in deflagration/detonation cases and 33 photodiodes (Thorlabs DET10A) to locate the edge of the flame front at any point in time. The pressure transducers and photodiodes are distributed across all 11 segments of the detonation tube (three of each per segment) and have been arranged so that, on the circumference of the tube, each sensor is a 60-degree arc away from the nearest sensor. Pressure and photodiode data were collected at a sampling rate of 250,000 samples/s (250 kHz), typically for a duration of 8000 ms. Given the importance of the detonation cell size in determining the flame dynamics of hydrogen mixtures, the detonation tube was fitted with sooted foil panels along its axis for recording the detonation cell shape and size (measurement uncertainty of ±2%). The characteristic dimensions of the resultant patterns were empirically related to the initiation energy and critical tube diameter.
The experimental procedure for a typical experiment was relatively straightforward and consisted of several steps. At the beginning, the first two segments of the tube were isolated from the rest of the tube and used as a mixing chamber for preparation of the desired mixture composition. The isolation of the two segments was achieved using an industrial balloon inflated with compressed air. The desired quantities of hydrogen and steam (from a steam generator) were then injected into the isolated segments of the tube, respectively. The content of these segments was then circulated between them for several minutes using the circulation system. This task was carried out to achieve a homogeneous mixture.
The final gas composition was set and monitored by the method of partial pressures, whereby the partial pressure of each gaseous constituent (i.e., volumetric concentration) was determined from measurements of the final pressure in the isolated segments by pressure transducers and the number of moles of individual gaseous constituents (determined from mass flow controller data during the filling process). In this method, the accuracy of the mixture composition is largely dependent on the accuracy of the pressure transducers. The pressure transducers used in this study had a range of 0 to 50 bar, with an accuracy of 0.25% of the full scale (~12.7 kPa). For a typical 10% hydrogen mixture, the uncertainty in the hydrogen concentration was ±0.15%.
Once the desired composition was achieved, the chemical ignitor was activated to initiate the combustion process. Depending on the operating conditions (particularly the hydrogen content of the mixture), this initially resulted in flaming combustion or deflagration (note: direct initiation of full detonation was very unlikely, because it required a high energy ignition source such as a solid explosive that was not present in our system). The initial entity (i.e., either a flame or a deflagration front) was then allowed to pass through the isolation system and fully develop as it traveled through the entire length of the tube (note: depending on the critical runup distance, in some cases, the initial entity transitioned to full detonation as it traveled along the length of the tube).
Meanwhile, the characteristics/properties of the released entity were continuously measured/monitored by the diagnostic devices described earlier. To ensure steady-state propagation of the detonation wave (i.e., propagation at a constant velocity very close to the Chapman–Jouguet velocity), the combustible H2–air gas mixture was ignited at the front end of the detonation tube while sooted foil measurements were carried out at the opposite end. This approach resulted in less than a 2% difference between the experimental and the theoretical Chapman–Jouguet velocities.
The following experimental campaign involving 8 cases (Table 1) and 123 experimental sets (each comprising 2 million data points) was conducted over 12 months to achieve the broad objectives of the project. The selected initial temperatures (up to 650 K) and initial pressures (up to 40 bar) were compatible with the operating conditions of typical large-scale electrolyzer and fuel cell installations. The experiments associated with high initial pressures (20–40 bar) are significant given the scarcity of H2–air–steam data related to initial pressures greater than 3 bar. The initial high pressures between 20 and 40 bar were set by injecting adequate quantities of gaseous constituents into the two isolated segments so that the overall pressure could reach the desired level. For high initial temperatures, we made use of a dedicated heating system comprising (i) a 1-m-long coiled tubing section sandwiched by a cylindrical ceramic heater and (ii) heating tapes wrapped around the two isolated segments of the detonation tube. With this arrangement, we could heat up the gas mixture to 650 K with ±9 K spatial uniformity within a 2-h timeframe.

Table 1.
Experimental test matrix.
2.2. Data Mining
The aim of this component of the study was to use data mining for analysis of the relationship between various operating variables in the detonation tube and the contribution of each variable to the overall outcome under flaming combustion, deflagration, DDT, and full detonation. In total, 123 datasets, each comprising over 2 million data points, were used in data mining.
Developing and applying data mining algorithms demand robust software tools capable of handling various challenges, including big data and specialized fields. In this study, both “Python (V 3.12)” and “Weka (V 3.9.5)” were employed for distinct purposes [14,15,16]. Python was mainly employed for tasks such as preparing data and creating visual representations due to its wide range of built-in libraries and its capability to handle large datasets efficiently. Furthermore, Python was also employed for predicting the maximum velocity through regression analysis. On the other hand, Weka was focused on classification analysis, specifically predicting critical values for maximum pressure and maximum velocity, as well as predicting the corresponding section for maximum pressure values. The utilization of Python and Weka allowed for efficient and effective data analysis, accommodating the specific requirements of the research tasks. The availability of standard libraries in Python and the versatile functionalities of Weka contributed to the successful execution of the data mining tasks.
2.3. Theoretical
Detonation cell sizes were predicted using Gavrikov’s chemical kinetic model [17] with thermodynamic parameters from the STANJAN code (V 3.7) [18] and laminar burning velocities and flame thickness from the FP code [19]. Gavrikov’s model, inspired by the classic ZND (Zel’dovich–Neumann–Döring) detonation model, provides detailed calculations of the detonation cell size by assuming that, initially, an infinitesimally thin shock wave compresses the explosive gas mixture into the so-called von Neumann spike (the onset of exothermic chemical reactions). This is followed by the Chapman–Jouguet state and the backward expansion of detonation products once the exothermic reactions begin diminishing.
2.4. Computational Fluid Dynamics Modeling
The CFD modeling was carried out to numerically assess the gas flow and the propagation dynamics of the pressure waves and flame front through the detonation tube. To this end, a partially premixed combustion model that involves no adjustable parameters has been developed based on the Flamelet Generated Manifold (FGM) model [20,21] to simulate the explosion of gaseous mixtures. The details, which have been presented in our previous work [11,13], are provided in Appendix A.
3. Results and Discussion
3.1. Key Findings
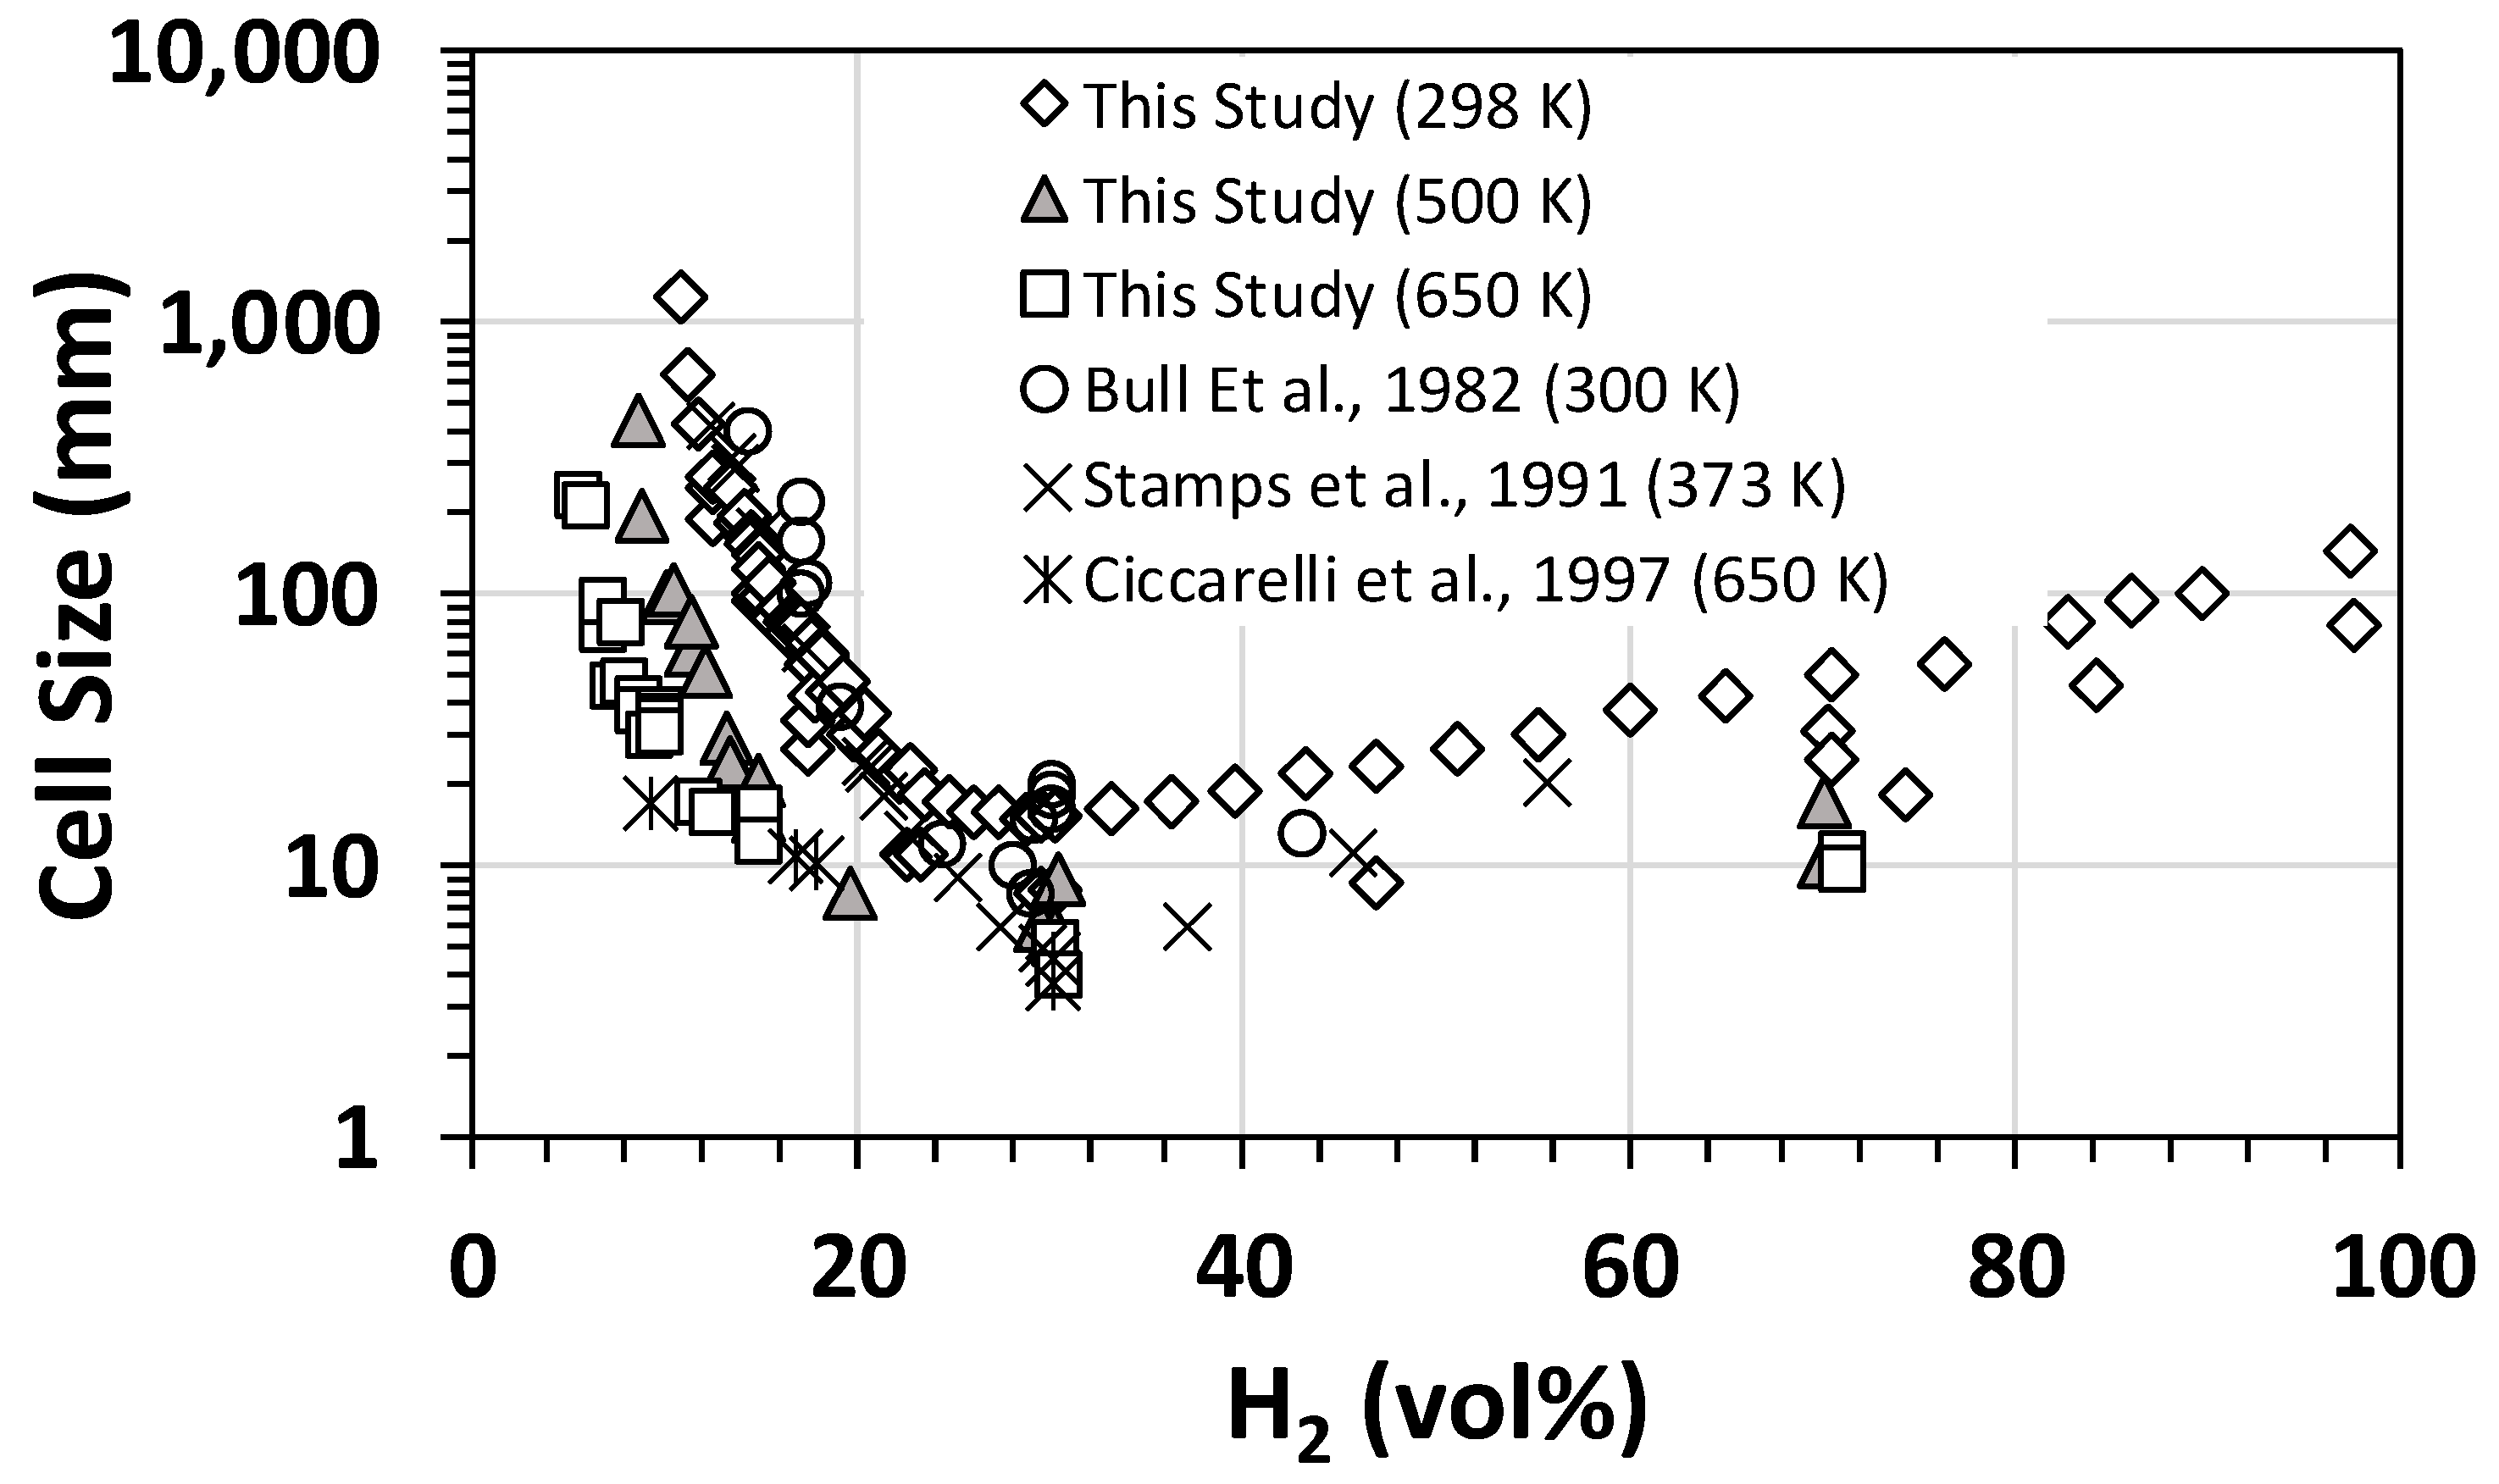
The flame properties and detonation parameters, such as the expansion ratio, speed of sound in products, Chapman–Jouguet velocity, Chapman–Jouguet pressure, and von Neumann peak overpressure, were calculated using the theoretical tools outlined earlier in Section 2.3. Some of the calculated results were used for comparison with the experimental data (please refer to the proceeding sections). The detonation experiments were initially performed at 298 K and 1 bar initial conditions for various H2–air mixtures to benchmark/validate experimental measurements against the data reported in the open literature, in turn refining the operating procedures (if needed) by adjusting the data acquisition protocols and instrumentation. A typical comparison for cell size data corresponding to H2–air mixtures at different initial temperatures and 1 bar initial conditions is shown in Figure 2, illustrating typical “U”-shaped curves. Comparison of the two sets of data demonstrated good agreement with previous experimental data reported in the open literature, validating our experimental methods and techniques.

Figure 2.
Benchmarking of the measured detonation cell size against the literature data [22,23,24] for hydrogen–air mixtures at different initial temperatures and 1 bar (initial pressure).
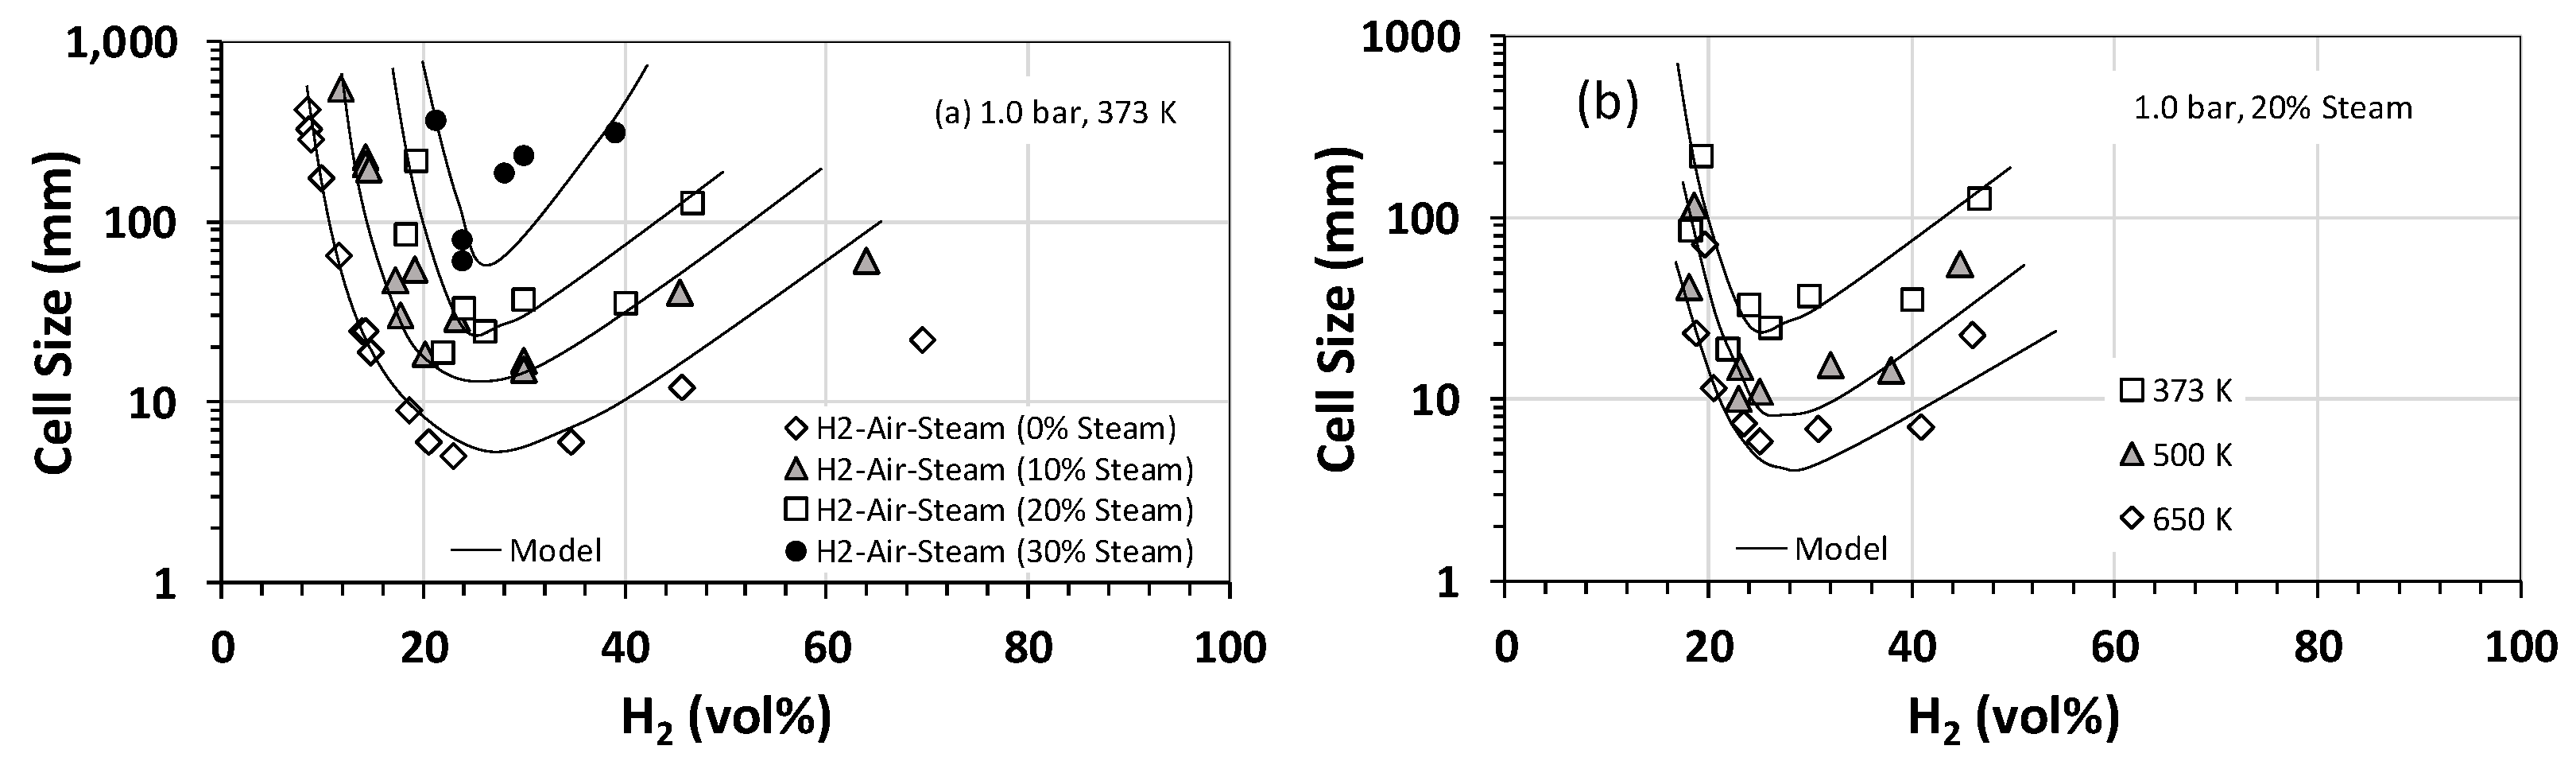
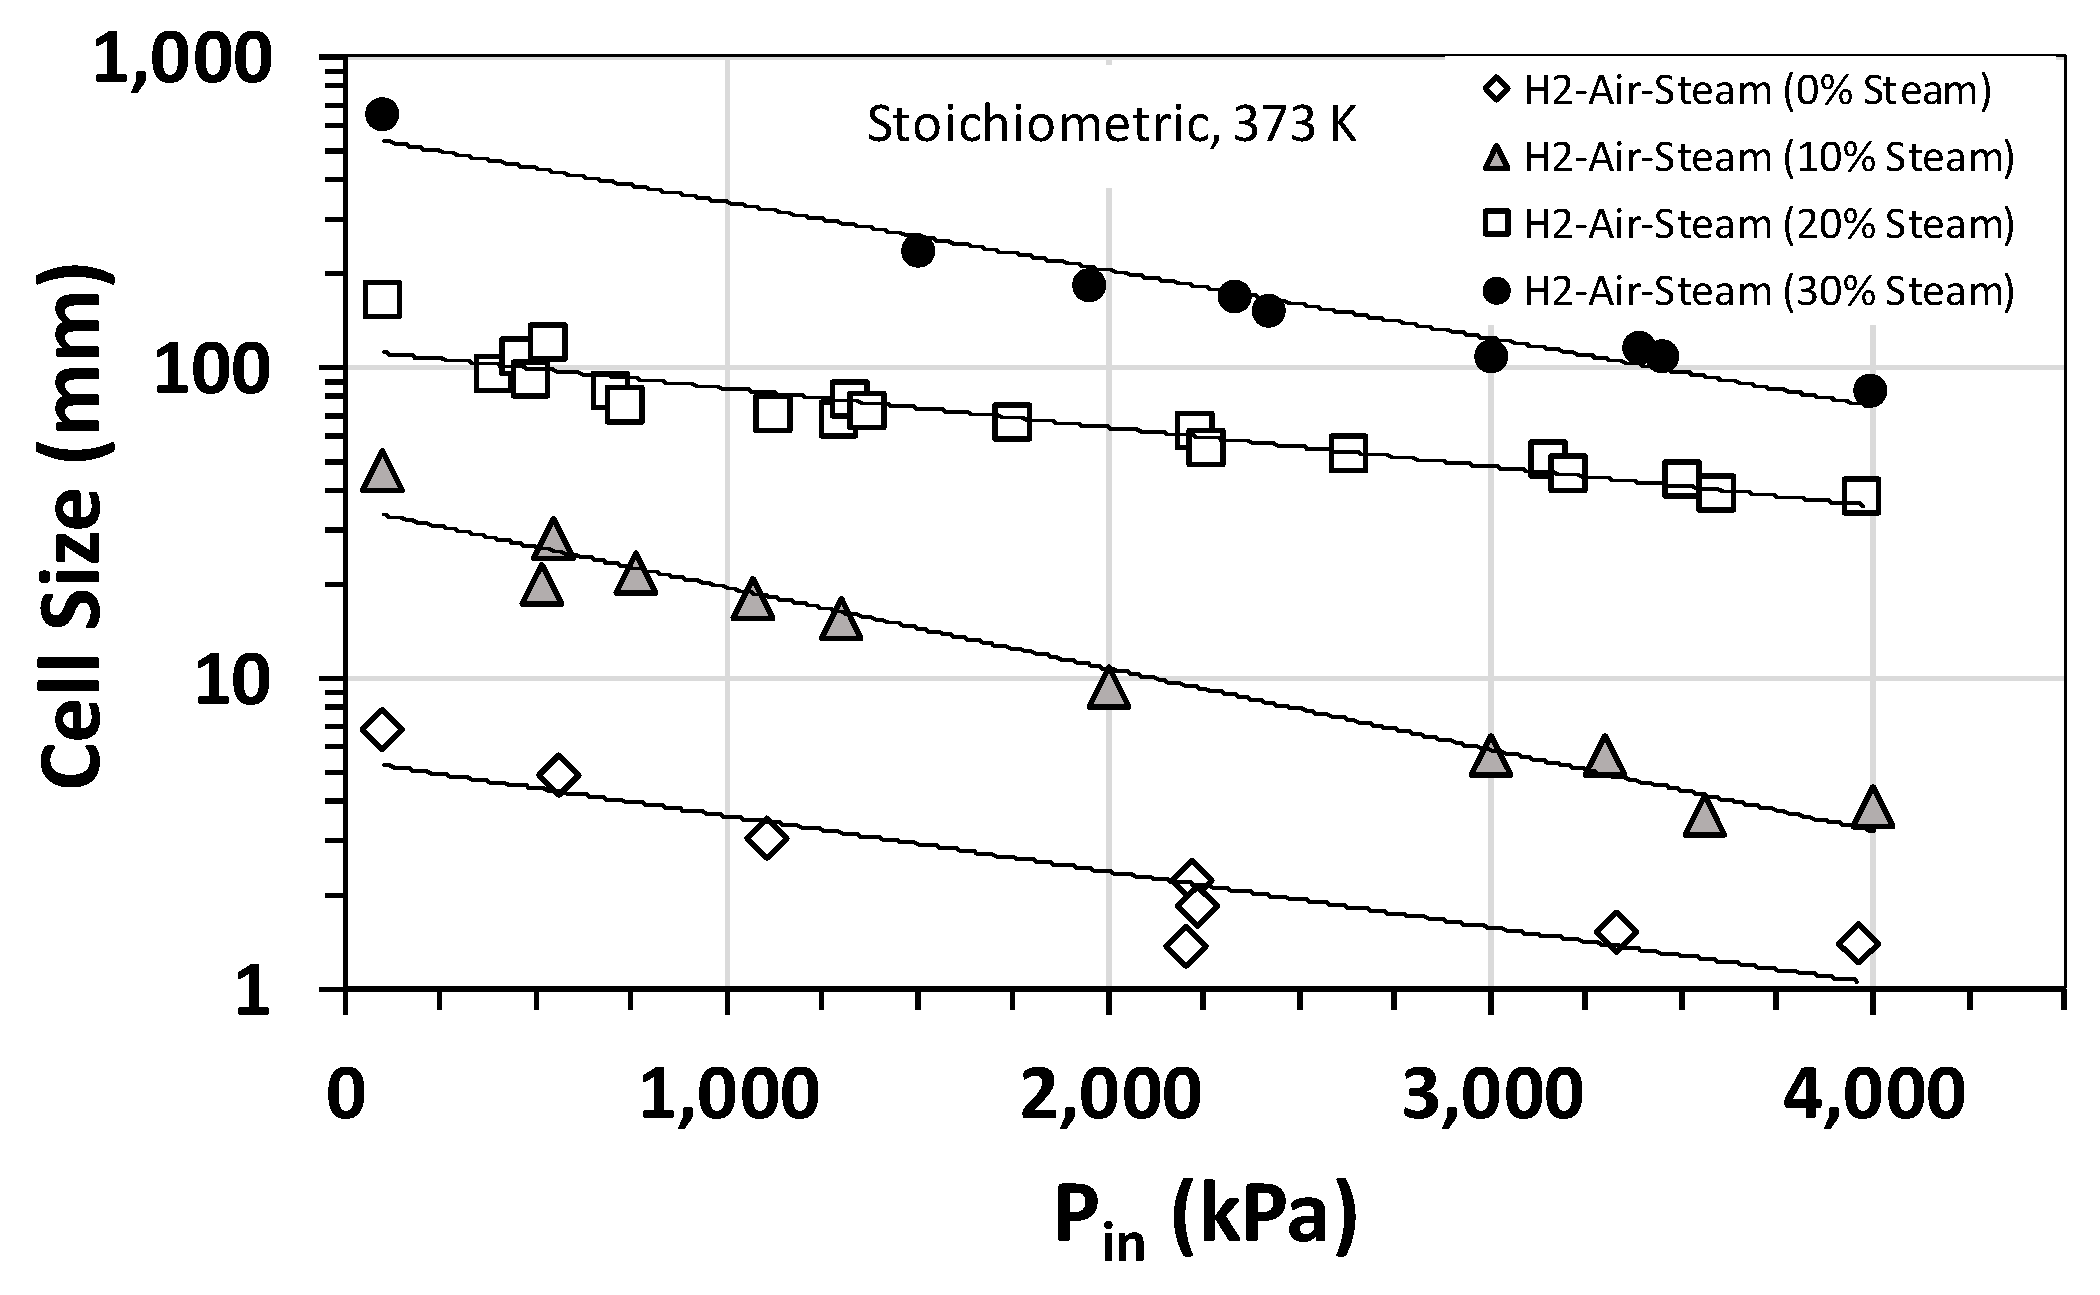
Effect of steam on the detonation cell size was also studied, and Figure 3a summarizes the results for H2–air–steam mixtures at an initial temperature and pressure of 373 K and 1 bar (roughly steam saturation conditions) for hydrogen concentrations between 0 and 70 vol% and steam fractions of 10 vol% to 30 vol%. Also, plotted in Figure 3 is the calculated cell size using Gavrikov’s model [17]. The model predicts well the general trend in the experimental data, especially for H2 concentrations between 25 vol% and 50 vol%. However, outside this range, the model predictions deviate from the experimental data. As is expected, both experimental data and modeling predictions show that increasing the steam fraction increases the cell size and, therefore, decreases the detonability of the mixture. This is largely due to the high heat capacity of steam and thus its cooling effect on the post-shock mixture. Interestingly, based on our experimental data shown in Figure 3b, the cooling effect of steam becomes less prominent if the initial temperature of the mixture is raised to the superheated range for steam (e.g., 500–650 K). A similar behavior is observed when the initial pressure is increased. Figure 4 shows the variation in detonation cell size as a function of the initial pressure for stoichiometric H2–air–steam mixtures at several different steam fractions. As is evident, for a given steam fraction, the detonation cell size has an inverse relationship with the initial pressure over the range of pressures of interest (17 to 30 bar). This is likely because an increase in the initial pressure limits the quenching effect of steam on the chemical reactions involved. The implication of this finding is quite important for large-scale PEM-based electrolyzer and fuel cell installations, which typically operate at pressures between 17 and 30 bar. It implies that the operating pressures in such systems could potentially counteract the quenching/cooling effectiveness of steam as a diluent and, thus, increase the detonability of the mixture by lowering the detonation cell size.
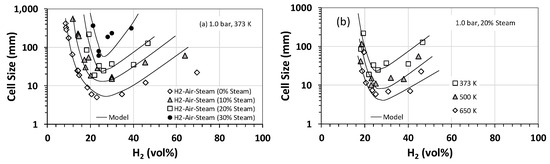
Figure 3.
Detonation cell sizes for hydrogen–air–steam mixtures as a function of the hydrogen concentration: (a) at an initial temperature and pressure of 373 K and 1 bar for various steam volumetric fractions and (b) at an initial pressure of 1 bar and 20 vol% steam for various initial temperatures. Solid lines represent predictions by Gavrikov’s model [17].
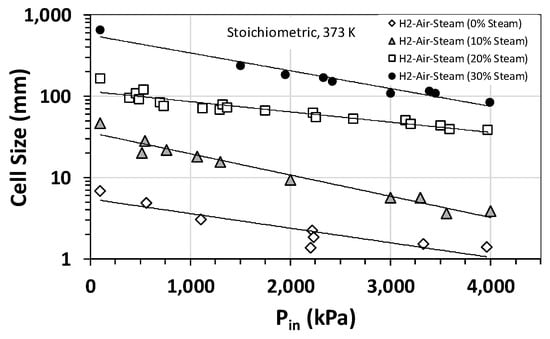
Figure 4.
Detonation cell sizes for stoichiometric hydrogen–air–steam mixtures at an initial temperature of 373 K as a function of the initial pressure and steam fraction.
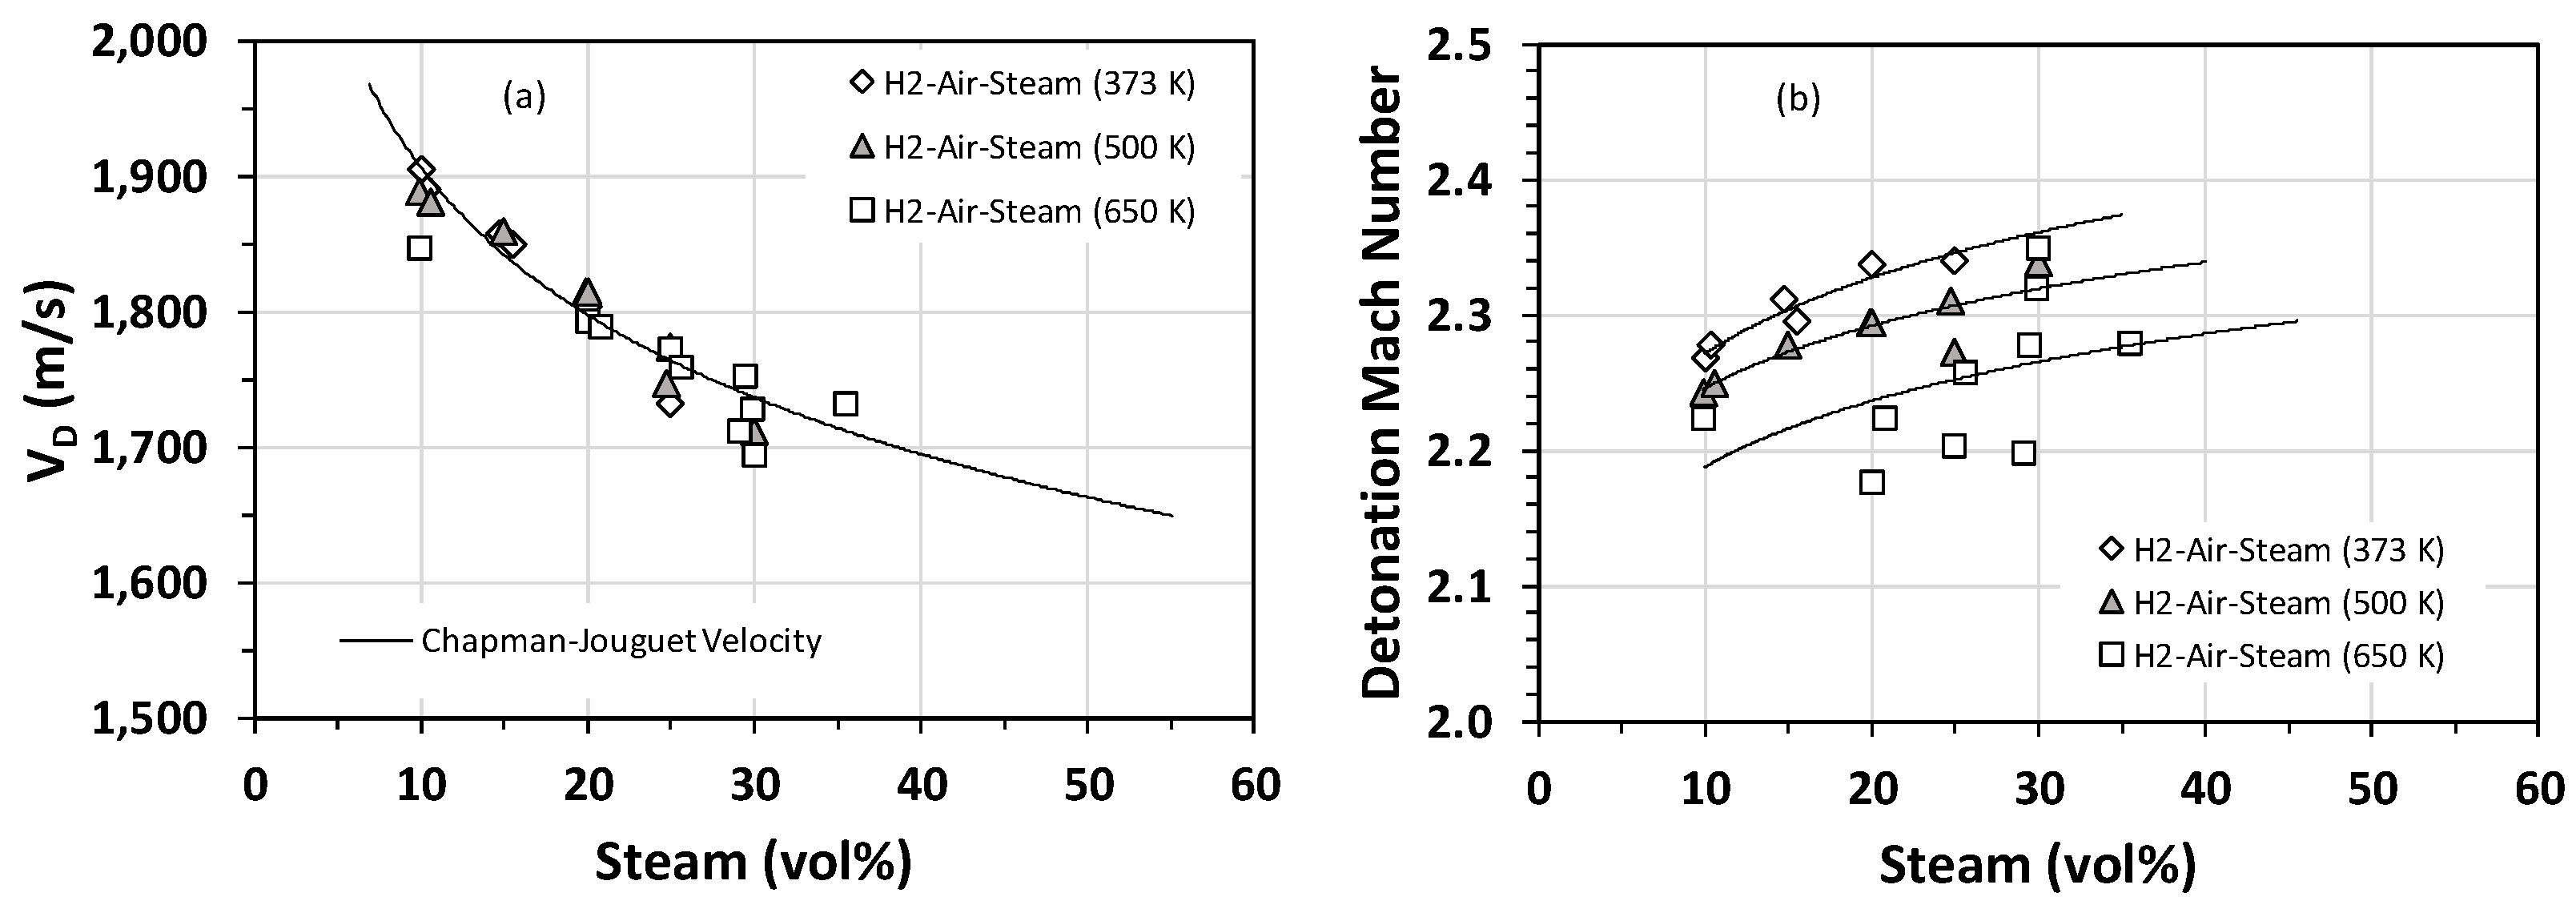
In addition to cell size measurements, the average detonation velocity (VD) and the flame speed just prior to DDT were also measured in a series of experiments for H2–air–steam mixtures. The flame speed data were converted to the flame Mach number by normalizing the flame speed by the sonic velocity in the uncompressed gas mixture. The comparison of the average detonation velocity with the theoretical Chapman–Jouguet velocity is shown in Figure 5a. There seems to be an inverse relationship between the average detonation velocity and the mole fraction of steam (Figure 5a). In other words, steam decelerates the detonation wave and, hence, lowers the detonability of the mixture. As can be seen from Figure 5a, at steam concentrations greater than 20 vol%, the discrepancy between experimental data and modeling predictions is higher than that corresponding to steam concentrations smaller than 20 vol%. In particular, the detonation velocity measured for H2–air–steam at 650 K is largely below the theoretical prediction. However, as noted earlier, the detonation cell for H2–air at 650 K is very small, and hence, losses at the wall cannot account for the observed discrepancy. Therefore, the only plausible explanation for this discrepancy is that the true hydrogen concentration is not what is reflected from the experimental test matrix. This could happen if some of the hydrogen oxidizes during the ignition delay phase (the time interval between the end of the vessel fill and ignition). Our estimate, which is consistent with the values reported by others [23,24], is about a 2% reduction in the H2 concentration for the 650-K case.
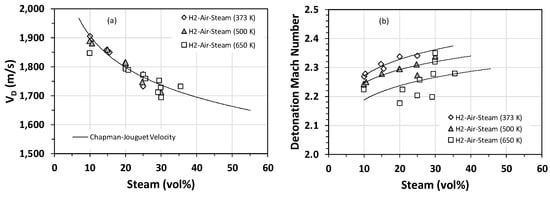
Figure 5.
Stoichiometric H2–air–steam mixtures (i.e., H2 concentration of 22.8 vol%) at an initial pressure of 1 bar and initial temperatures of 373 K, 500 K, and 650 K: (a) comparison of the theoretical Chapman–Jouguet velocity with the experimentally measured detonation velocity; (b) flame Mach number.
The flame Mach number as a function of the steam mole fraction is shown in Figure 5b. In general, higher steam contents correspond to higher Mach numbers, implying that triggering a DDT in mixtures containing a high steam content is less probable. Most of the flame Mach numbers are within the range of 2.2 to 2.4 and correspond to steam mole fractions between 10% and 30%. This range of Mach numbers rules out turbulence as the dominant mechanism for the initiation of DDT, given that the maximum turbulent fluctuation velocity is the sonic velocity (i.e., Mach Number~1). Therefore, the initiation of DDT must be caused by the “shock-focusing” phenomenon that results from the reflection of the leading shock off the detonation tube walls.
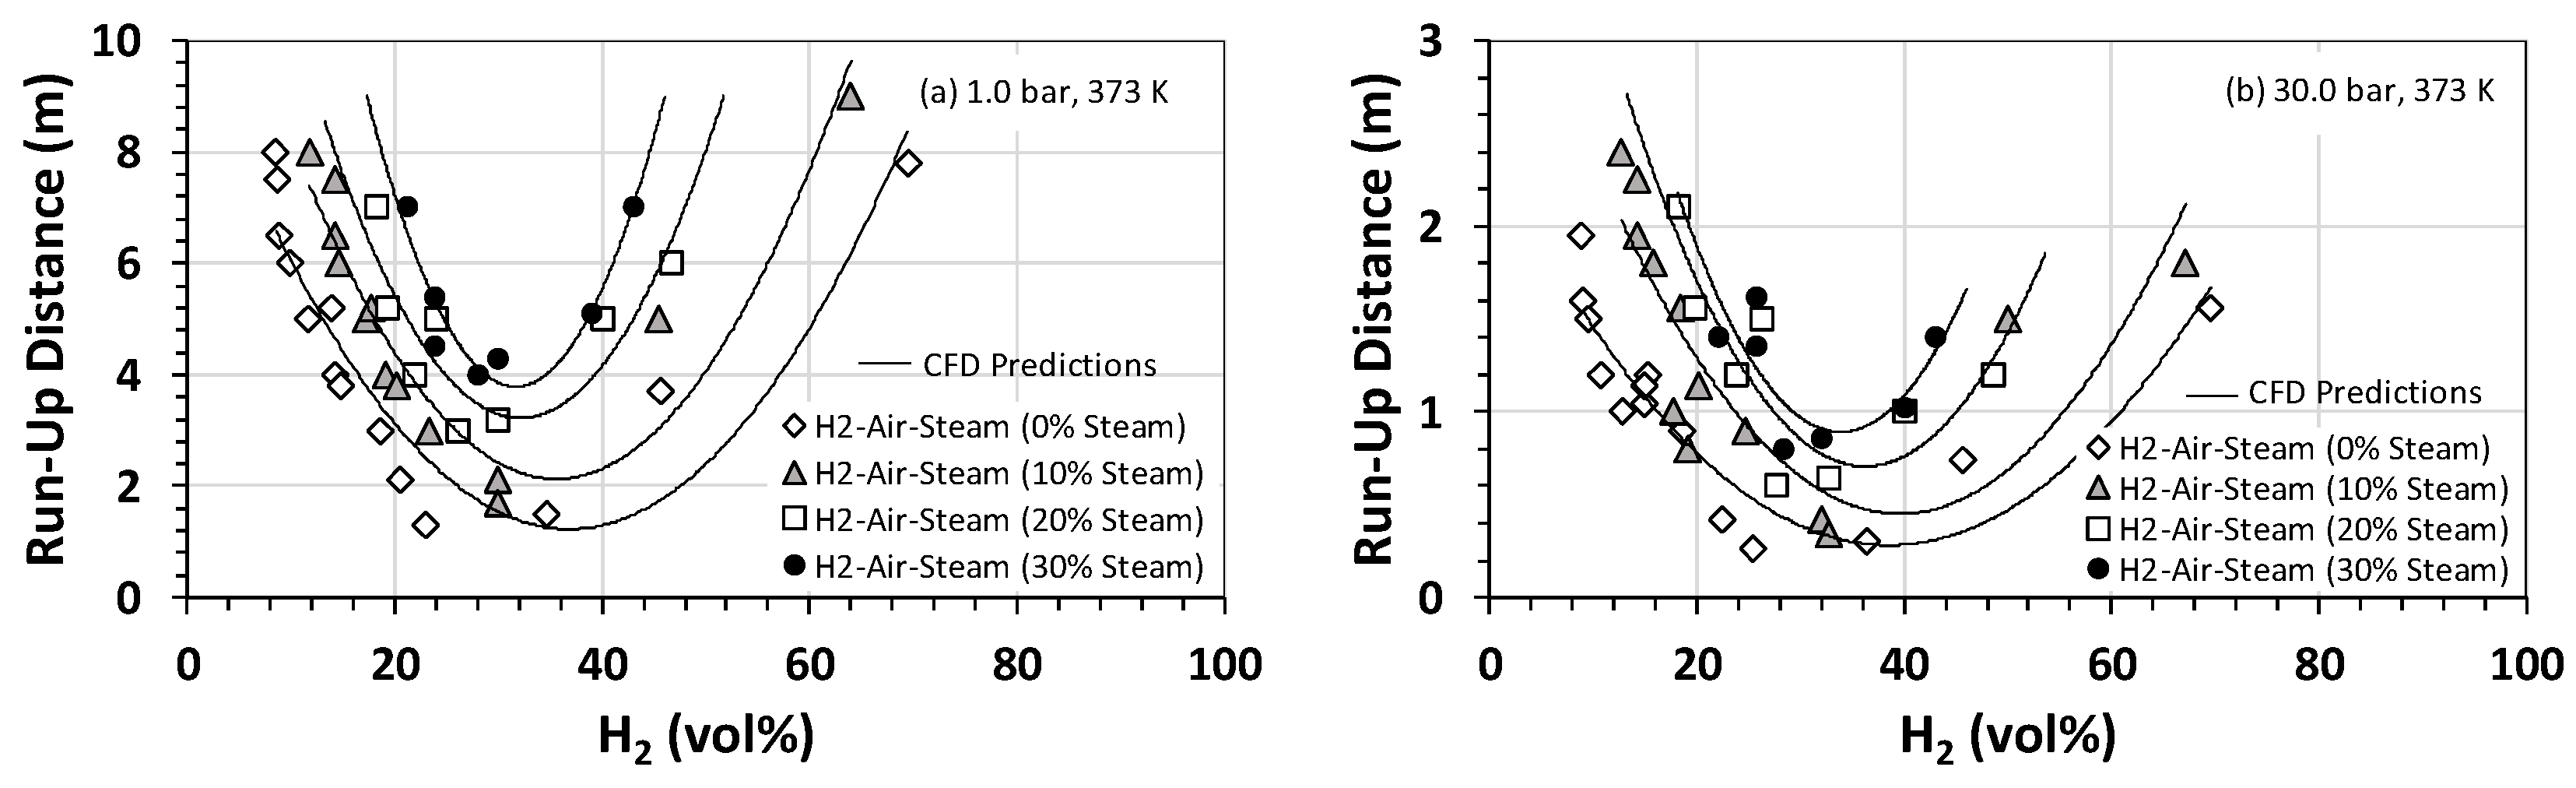
One of the key detonation characteristics determined in this study was the so-called “runup distance”. This detonation characteristic, which is not an intrinsic property of the gas mixture, is defined as the distance between the ignition point and the location of the onset of detonation (characterized by a rapid pressure rise), which can be determined from the pressure measurements at different axial locations in the tube. Given the non-intrinsic nature of the runup distance, it depends on the size, shape, and configuration of the detonation tube. As such, the runup distance is an indication of how sensitive the gas mixture is to flame acceleration and DDT. In this study, the runup distance was determined through a combination of the experimental measurements and CFD modeling. The CFD modeling was used to determine the location of the flame front and pressure wave as a function of time and space. A comparison of the CFD predictions and experimental measurements of the overpressure along the axial axis of the tube allowed us to pinpoint the location of the onset of detonation and, subsequently, determine the runup distance. A typical representation of CFD predictions superimposed on the experimentally measured time series of detonation pressure is shown in Figure 6.
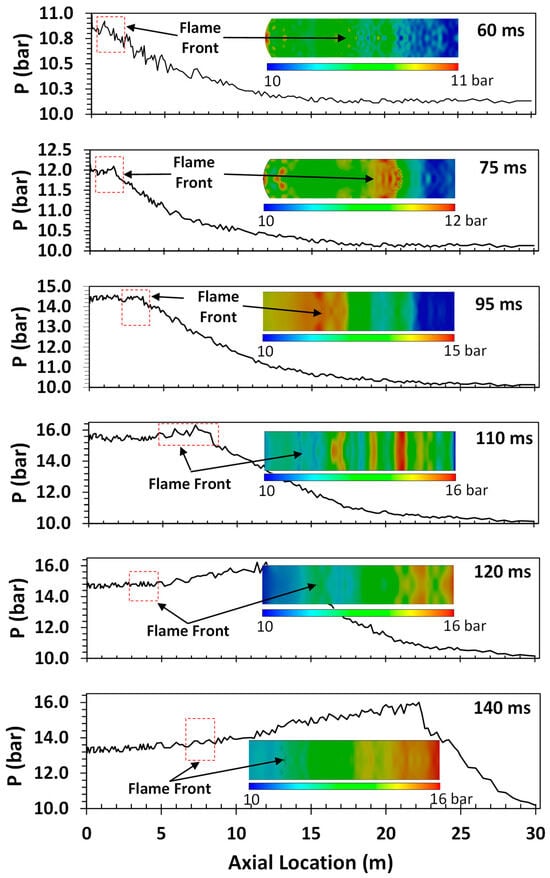
Figure 6.
A typical CFD prediction superimposed on the pressure time series for H2–air mixtures at an initial pressure and temperature of 1 bar and 298 K, respectively.
The U-shaped trend suggests that, for a given fuel/oxidizer mixture, the runup distance and laminar burning velocity are inversely proportional (Figure 7). No DDT (and, hence, runup distance) was observed (this work) for mixtures of greater than 40% steam by volume. Similarly, no runup distance or DDT was observed for mixtures containing less than 15% or more than 72% hydrogen (this work). At both initial pressures, the shortest runup distance for all steam fractions corresponded to a hydrogen mole fraction of ~30 vol%, which is the stoichiometric concentration of hydrogen if detonated in the air. Like the results presented in Figure 4, the initial pressure has a significant impact on the runup distance, with values corresponding to the 30-bar case typically 70% to 75% smaller than their counterparts at 1 bar. Of these, the smallest value is 0.3 m, corresponding to the 30-bar case at a steam fraction of zero. This implies that, for this mixture under the prevailing operational conditions, it takes only 0.3 m for a deflagration wave to convert to a fully-fledged detonation event.

Figure 7.
Runup distance for H2–air–steam mixtures at an initial temperature of 373 K as a function of the hydrogen concentration and steam volume fraction at initial pressures of (a) 1 bar and (b) 30 bar.
3.2. Practical Implications
Determination of the detonation cell size, detonation velocity, and runup distance as a function of the steam and hydrogen concentration are crucial in both the design and safety protection of large-scale electrolyzer and fuel cell installations. Examples of potential scenarios are:
- Determination of safe distances between equipment and buildings in large-scale electrolyzer and fuel cell installations.
- Determination of critical conditions for detonation propagation in partially confined geometries, such as those typically found within the internal structures of electrolyzers and fuel cells. Through an iterative process, this information might be used to inform the design of electrolyzers and fuel cells.
- Vent sizing for low-strength (p ≤ 20 bar) equipment (e.g., vent design for the reduction of deflagration overpressure in low-pressure fuel cells).
- Evaluating the positive and negative impacts of steam condensation on safety features of electrolyzer plants (positive impact: promotion of hydrogen venting due to release of the condensation heat; negative: increase in the concentration of hydrogen due to the removal of steam).
- Assessing the consequences of catastrophic failures of hydrogen storage tanks, thereby the rapid release of appreciable quantities of flammable hydrogen.
3.3. Future Directions
From our viewpoint, there must be an emphasis/focus on the following topics if a greater and deeper understanding of the detonation of H2–air–steam mixtures in large-scale electrolyzer and fuel cell installations is desired:
- A database of hydrogen spontaneous ignition for typical release scenarios similar to that available for hydrocarbon fuels.
- Flame acceleration and DDT in semi-confined to open geometries.
- Vent sizing methodology for high-pressure releases in confined spaces and the impact of vent cover inertia on the deflagration dynamics.
- Effect of obstructions on flame dynamics (acceleration/deceleration) and DDT.
- Effect of the hydrogen concentration gradient and stratification on flame dynamics (acceleration/deceleration) and DDT for different confinements.
- Acoustic, parametric, Rayleigh–Taylor, Kelvin–Helmholtz, Richtmyer–Meshkov, and Landau–Darrieus flame instabilities and their effects on the flame dynamics, including scaling conditions.
4. Conclusions
- Benchmarking of the key detonation properties (e.g., cell size) measured using the University of Newcastle’s detonation tube demonstrated good agreement with the relevant data reported in the open literature. This agreement validates the experimental techniques employed in the work reported here.
- Multiple measurements made under identical conditions indicate good reproducibility of the measured data.
- The experimental data presented in this paper provide clear evidence that the effect of increasing the initial pressure of H2–air–steam mixtures over the range of pressures of interest (20–40 bar) is to limit the cooling effect of steam on the post-shock mixture. This, in turn, decreases the cell size and runup distance and, hence, increases the likelihood of detonation in PEM-based electrolyzer and fuel cell installations.
- The measured runup distances were inversely proportional to the laminar burning velocities of the mixtures.
- For detonation Mach numbers greater than 2.5, DDT for H2–air–steam mixtures did not occur.
- Flame acceleration and runup distances of H2–air–steam mixtures were found to be greater than those of H2–air mixtures.
Author Contributions
Conceptualization, B.M.; Software, S.N.; Formal analysis, B.M., J.Z. and S.N.; Investigation, B.M., J.Z. and S.N.; Resources, H.S.; Data curation, J.Z. and H.S.; Writing—original draft, B.M.; Writing—review & editing, B.M. and J.Z.; Supervision, B.M.; Project administration, B.M.; Funding acquisition, B.M. All authors have read and agreed to the published version of the manuscript.
Funding
This research received no external funding. The authors wish to acknowledge the financial support of the University of Newcastle (Australia).
Data Availability Statement
The datasets presented in this article are not readily available because the data are part of an ongoing study. Requests to access the datasets should be directed to Laureate Professor Behdad Moghtaderi (The University of Newcastle, Australia).
Acknowledgments
The authors wish to acknowledge the in-kind support provided by the Australian mining industry throughout this project.
Conflicts of Interest
The authors declare no conflicts of interest.
Glossary
| Symbols | |
| reaction progress variable, - | |
| th species specific heat at constant pressure, J/(kg·K) | |
| local sound speed, m/s | |
| effective diffusivity coefficient, m2/s | |
| turbulent diffusivity, m2/s | |
| mixture fraction, - | |
| maximum slope of temperature profile across the flame front, K/m | |
| enthalpy, J | |
| k | turbulence kinetic energy, m2/s2 |
| flame thickness, m | |
| reactant mass at the stoichiometric condition, kg | |
| pressure, Pa | |
| joint PDF of reaction progress (c) and mixture fraction (f), - | |
| Prandtl number, - | |
| heat released from stochiometric methane combustion, J | |
| radial position inside DT, m | |
| radius of DT, m | |
| local position along the DT centerline, m | |
| flamelet source term, 1/s | |
| Finite rate flamelet source term from the flamelet library, 1/s | |
| time, s | |
| temperature, K | |
| auto-ignition temperature of methane, K | |
| spatial density weighted velocity, m/s | |
| velocity, m/s | |
| mole fraction, - | |
| molar mass, kg/mol | |
| mass fraction, - | |
| Reynolds averaged un-normalized progress variable, - | |
| Greek letters | |
| constants, zero for reactants and unity for a few product species, - | |
| ratio of specific heat for methane, - | |
| turbulence dissipation rate, m2/s3 | |
| pressure drop, Pa | |
| distance between burnt and unburnt gases boundaries, m | |
| gas thermal expansion coefficient, - | |
| thermal conductivity, W/(m·K) | |
| turbulent viscosity, kg/(m·s) | |
| viscous diffusion rate (kinematic viscosity), m2/s | |
| density, kg/m3 | |
| scaled growth rate of flame acceleration, - | |
| relative humidity, - | |
| scalar dissipation rate, 1/s | |
| prescribed maximum scalar dissipation within the premixed flamelet, 1/s | |
| reaction rate of the progress variable , mol/(s·m3) | |
| molar production rate of species k, mol/(s·m3) | |
| Subscripts or superscripts | |
| b | burnt mixture |
| def | deflagration |
| eq | chemical equilibrium |
| f | flame |
| FT | flame tip |
| L | laminar |
| i | the ith species |
| u | unburnt mixture |
| sto | stoichiometric |
Appendix A. The CFD Model
- (a)
- Combustion Modeling
In FGM, a look-up table is generated for the probability distribution function (PDF) based on the mixture fraction (f) and reaction progress variable (c), which is defined as a normalized sum of the product species mass fractions:
The governing equations for the species mass fraction and temperature can then be transformed from the physical space to the reaction progress space:
where the scalar dissipation rate is defined as
and is modeled using Equation (A5) for premixed combustion and Equation (A6) for partially premixed combustion, for which premixed laminar flamelets are generated over a range of mixture fractions:
In the above approach, the only input required to the premixed flamelet generator is the scalar dissipation at the stoichiometric mixture fraction, . In this study, a value of 1000/s was used, which corresponds to unstrained physical space flamelets for hydrogen flames at the standard temperature and pressure.
The transport equation expressed in terms of the Reynolds averaged progress variable, reads
where the mean source term, , which is specifically used in determining the position of the turbulent flame, is modeled using
- (b)
- Numerical Details
- GRI-Mech 3.0 is used for flamelet generation.
- Flamelets are generated for a pressure of 1 atm, although the impact of pressure change on different quantities is considered.
- A 64 × 64 grid point resolution is employed in the mixture fraction and progress variable space.
- A transient, 2D, axisymmetric model is employed (ANSYS Fluent 18.2) to simulate the experimental data collected from the detonation tube tests. Such 2D models have shown in the past that they are capable of capturing the most important properties of 3D flows.
- The unsteady RANS (URANS) approach is employed to model the transient pressure field variation, as well as the flame propagation. Computationally, URANS is reasonably accurate but, importantly, is the cheapest model.
- The standard k-ε model with standard log-law wall functions is used for turbulence modeling.
- Pressure–velocity coupling is enforced using the SIMPLE algorithm.
- Gradients are modeled using the least squared cell-based method, and all convective terms are represented using the bounded second order upwind (SOU) scheme.
- Based on a series of sensitivity analyses, a 5-mm mesh was used in the construction of the computational grid with a 300,000 elements count, resulting in a convective Courant number below 0.1.
- A time step of 10 µs was used.
- Transient terms are modeled using the bounded second order implicit scheme.
- As far as boundary conditions are concerned, all walls are treated as no slip and adiabatic given the extremely short time scale available for heat exchange. The exit pressure is assumed to be atmospheric pressure, and the shock wave formed at the exit is represented by a reflecting boundary condition.
- As far as the initial conditions are concerned, the gas mixture is assumed to be stationary and at the standard ambient temperature and pressure at the start of the computations.
- The initial values of the turbulence kinetic energy (k) and turbulence energy dissipation rate (ε) are set at k = 0.001 m2/s2 and ε = 0.001 m2/s3 based on some preliminary numerical tests. The above figures are used for all simulations conducted as part of this study.
- To start the reaction, the progress variable is set to 1 in a couple of computational cells around the ignition point at time zero.
References
- Blay-Roger, R.; Bach, W.; Bobadilla, L.F.; Reina, T.R.; Odriozola, J.A.; Amils, R.; Blay, V. Natural hydrogen in the energy transition: Fundamentals, promise, and enigmas. Renew. Sustain. Energy Rev. 2024, 189 Pt A, 113888. [Google Scholar] [CrossRef]
- International Renewable Energy Agency (IRENA). Hydrogen: Overview [Internet]. Available online: https://www.irena.org/Energy-Transition/Technology/Hydrogen (accessed on 30 March 2024).
- International Energy Agency. Global Energy Review 2021. Available online: https://www.iea.org/reports/global-energy-review-2021 (accessed on 12 November 2023).
- Jiang, Z.; Teng, H. Gaseous Detonation Physics and Its Universal Framework Theory; Springer: Berlin/Heidelberg, Germany, 2022; ISSN 2197-9529. [Google Scholar]
- Vollmer, K.; Ettner, F.; Sattelmayer, T. Deflagration-to-detonation transition in hydrogen/air mixtures with a concentration gradient. Combust. Sci. Technol. 2012, 184, 1903–1915. [Google Scholar] [CrossRef]
- Katzy, P.; Hasslberger, J.; Boeck, L.R.; Sattelmayer, T. The effect of intrinsic instabilities on effective flame speeds in under-resolved simulations of lean hydrogen-air flames. J. Nucl. Eng. Radiat. Sci. 2017, 3, 041015. [Google Scholar] [CrossRef]
- Ciccarelli, G.; Dorofeev, S. Flame acceleration and transition to detonation in ducts. Prog. Energy Combust. Sci. 2008, 34, 499–550. [Google Scholar] [CrossRef]
- Heilbronn, D.; Barfuss, C.; Sattelmayer, T. Influence of geometry on flame acceleration and DDT in h2-CO-air mixtures in a partially obstructed channel. In Proceedings of the 13th International Symposium on Hazards, Prevention, and Mitigation of Industrial Explosions, Braunschweig, Germany, 27–31 July 2020. [Google Scholar]
- Veser, A.; Stern, G.; Grune, J.; Breitung, W.; Burgeth, W. Co-H2-Air Combustion Tests in the fzk-7m-Tube; Technical Report; Institut fur Kern- und Energietechnik: Eggenstein-Leopoldshafen, Germany, 2002. [Google Scholar]
- Kumar, G.; Koroll, M.; Heitsch, E. Studer, Report: Carbon Monoxide-Hydrogen Combustion Characteristics in Severe Accident Containment Conditions; Report No. NEA/CSNI; Organisation for Economic Co-operation and Development: Paris, France, 2000. [Google Scholar]
- Peng, Z.; Zanganeh, J.; Moghtaderi, B. Influence of Gradually Inflated Obstructions on Flame Propagation in a Tube Closed at One End. Fire 2023, 6, 154. [Google Scholar] [CrossRef]
- Shirzaei, M.; Zanganeh, J.; Moghtaderi, B. Obstacle Impacts on Methane-Air Flame Propagation Properties in Straight Pipes. Fire 2023, 6, 167. [Google Scholar] [CrossRef]
- Peng, Z.; Zanganeh, J.; Ingle, R.; Nakod, P.; Fletcher, D.F.; Moghtaderi, B. CFD Investigation of Flame and Pressure Wave Propagation through Variable Concentration Methane-Air Mixtures in a Tube Closed at One End. Combust. Sci. Technol. 2021, 193, 1203–1230. [Google Scholar] [CrossRef]
- Witten, I.H.; Frank, E.; Hall, M.A. Data Mining: Practical Machine Learning Tools and Techniques, 3rd ed.; Morgan Kaufmann: Burlington, MA, USA, 2011. [Google Scholar]
- Holmes, G.; Donkin, A.; Witten, I.H. Weka: A machine learning workbench. In Proceedings of the ANZIIS’94-Australian New Zealand Intelligent Information Systems Conference, Brisbane, QLD, Australia, 29 November–2 December 1994. [Google Scholar]
- Patel, P.S.; Desai, S. A comparative study on data mining tools. Int. J. Adv. Trends Comput. Sci. Eng. 2015, 4, 28–30. [Google Scholar]
- Gavrikov, A.I.; Efimenko, A.A.; Dorofeev, S.B. Detonation cell size predictions from detailed chemical kinetic calculations. Combust. Flame 2000, 120, 19–33. [Google Scholar] [CrossRef]
- Reynolds, W.C. The Element Potential Method for Chemical Equilibrium Analysis: Implementation in the Interactive Program; STANJAN Version Three; Department of Mechanical Engineering, Stanford University: Palo Alto, CA, USA, 1986. [Google Scholar]
- Gavrikov, A.I.; Bezmelnitsyn, A.V.; Leliakin, A.L.; Dorofeev, S.B. Extraction of basic flame properties from laminar flame speed calculations. In Proceedings of the 18th International Colloquium on the Dynamics of Explosions and Reactive Systems, Seattle, WA, USA, 29 July–3 August 2001; University of Washington: Seattle, WA USA, 2001; pp. 114/1–114/5, ISBN 0-9711740-0-8. [Google Scholar]
- Van Oijen, J.A.; De Goey, L.P.H. Modelling of premixed laminar flames using Flamelet-Generated Manifolds. Combust. Sci. Technol. 2000, 161, 113–137. [Google Scholar] [CrossRef]
- Van Oijen, J.A.; De Goey, L.P.H. Modelling of premixed counter-flow flames using the flamelet-generated manifold method. Combust. Theory Model. 2002, 6, 463–478. [Google Scholar] [CrossRef]
- Bull, D.C.; Elsworth, J.E.; Shuff, P.J.; Metcalfe, E. Detonation Cell Structures in Fuel/Air Mixtures. Combust. Flame 1982, 45, 7–22. [Google Scholar] [CrossRef]
- Stamps, D.W.; Benedick, W.B.; Tieszen, S.R. Hydrogen-Air-Diluent Detonation Study for Nuclear Reactor Safety Analyses; Sandia National Laboratories Report No SAND89-2398, NUREG/CR-5525; Nuclear Regulatory Commission: Washington, DC, USA; Div. of Systems Research, Sandia National Lab. (SNL-NM): Albuquerque, NM, USA, 1991. [Google Scholar]
- Ciccarelli, G.; Ginsberg, T.; Boccio, J.; Finfrock, C.; Gerlach, L.; Tagawa, H.; Malliakos, A. Detonation Cell Size Measurements in High-Temperature Hydrogen-Air-Steam Mixtures at BNL High-Temperature Combustion Facility; Brookhaven National Laboratory Report No NUREG/CR-6391, BNL-NUREG-52482; US Nuclear Regulatory Commission (NRC): Washington, DC, USA; Div. of Systems Technology, Brookhaven National Lab. (BNL): Upton, NY, USA; Nuclear Power Engineering Corp.: Tokyo, Japan, 1997. [Google Scholar]


Disclaimer/Publisher’s Note: The statements, opinions and data contained in all publications are solely those of the individual author(s) and contributor(s) and not of MDPI and/or the editor(s). MDPI and/or the editor(s) disclaim responsibility for any injury to people or property resulting from any ideas, methods, instructions or products referred to in the content. |
© 2024 by the authors. Licensee MDPI, Basel, Switzerland. This article is an open access article distributed under the terms and conditions of the Creative Commons Attribution (CC BY) license (https://creativecommons.org/licenses/by/4.0/).