Article

Evaluation and Simulation Study of Rock Drillability Grades in the Tazhong-Tabei Block

by
Tianhui Cheng
1,
Guolun Li
1,
Yarong Wang
1,
Hailong Qin
1,
Qiang Fu
1,
Wei Cheng
2,3,* and
Liang Zhu
3
1
Korla Branch, Bohai Drilling Engineering Company Limited, China National Petroleum Corporation, Korla 841003, China
2
School of Mechanical Engineering, Jingchu University of Technology, No. 33 Xiangshan Avenue, Jingmen 448000, China
3
School of Petroleum Engineering, Yangtze University, Wuhan 430100, China
*
Author to whom correspondence should be addressed.
Processes 2024, 12(8), 1626; https://doi.org/10.3390/pr12081626
Submission received: 3 July 2024 / Revised: 21 July 2024 / Accepted: 30 July 2024 / Published: 2 August 2024
(This article belongs to the Section Energy Systems)

Abstract

:
In response to the unclear rock properties of the formations in the Tazhong-Tabei block of the Tarim Basin and the difficulties in selecting drill bits, indoor rock drillability tests were conducted under high temperature and high-pressure conditions. The tests analyzed the changes in the drillability grade values of roller cone bits and PDC bits under the coupling effects of confining pressure and temperature. The research indicates that the drillability grade values of the rocks in this formation range between 4 and 6. Additionally, the drillability grade values of PDC bits are lower than those of roller cone bits. As confining pressure increases, the drillability grade values of the rocks also increase significantly when the confining pressure exceeds 30 MPa. Conversely, as the temperature rises, the drillability grade values of the rocks decrease substantially when the temperature exceeds 140 °C. A drillability analysis model for roller cone bits and PDC bits was established using finite element simulation software. The simulated drillability grade values of the rocks showed a discrepancy of less than 10% compared to the indoor test data, proving the accuracy and reliability of the indoor test data. Based on the rock drillability test results, the use of PDC bits is recommended for this formation. The optimized PDC bits successfully drilled through the target formation. These research findings are of guiding significance for accurately understanding the physical and mechanical properties of the formation rocks in the Tazhong-Tabei block and for the optimal selection of drill bits for this area.

1. Introduction

As the exploration and development of oil and gas resources continue to deepen, the difficulty of discovering these resources is increasing. Globally, oil and gas exploration and development are gradually shifting from shallow and medium depths to deep and ultra-deep layers [1]. In China, deep and ultra-deep oil and gas resources have significant potential, accounting for 35% of the nation’s total oil and gas resources, making them an important area for increasing reserves and production [2]. Compared to shallow and medium-depth wells, ultra-deep well engineering faces more technical challenges due to complex geological conditions. Understanding the characteristics of formation rocks is essential for the efficient development of ultra-deep oil and gas resources.
The Tarim Basin, located in southern Xinjiang, China, is the world’s largest inland basin. The Tazhong-Tabei block, a primary structural unit of the Tarim Basin, borders the Kuqa depression to the north and the Manjiaer depression to the south. The Permian strata in this block are complex, primarily consisting of heterogeneous conglomerates with high hardness and poor drillability. The exploratory well Aman-3 in this block has a final drilling depth of 8296 m, with the Permian strata being 836 m thick. A total of 12 PDC bits were used to drill through, with an average drilling speed of only 0.94 m/h. Severe bit sticking occurred during drilling, posing the greatest challenge to increasing drilling speed. The primary reason for this is the insufficient compatibility between the selected PDC and roller cone bits and the formation properties. To address this issue, further research on the rock properties of the deep formations in this block is needed.
Rock drillability is an indicator of a formation rock’s ability to resist bit penetration. It depends not only on the rock’s physical and mechanical properties but also on the type and specific parameters of the bit [3]. It is a comprehensive indicator in rock fragmentation studies and is crucial for determining drilling parameters, optimizing bit selection, accurately predicting drilling outcomes, and setting drilling work quotas [4]. In recent years, many experts and engineers domestically and internationally have conducted extensive research on the drillability of formation rocks in different blocks, accumulating valuable experience for efficient oil and gas exploration and development.
Yang Guan and others tested the drillability grade of mudstone from the Yingqiong Basin in the northern South China Sea using an indoor high-temperature and high-pressure rock drillability testing device. The study showed that with increasing confining pressure, the plasticity of the mudstone increased, and the drillability grade also increased [5]. Nian Peng and colleagues tested the drillability grade of the Ziliujing Formation in the Sichuan Basin, China, through micro-drilling experiments. Their research indicated that the drillability grade of the Ziliujing conglomerate was poor, with a grade of 9 (IX) and a hardness of 3 [6]. Xu Xiaofeng et al. conducted drillability tests on PDC and roller cone bits for rocks in the Jidong Oilfield, characterized by strong heterogeneity and high hardness. The results showed that the drillability grades for PDC bits ranged from 6 to 10, while those for roller cone bits ranged from 7 to 10, providing a basis for bit selection in different formations [7]. Hui Zhang used PDC micro-drilling to test the drillability of shale at different bedding angles, finding that the drillability grade increased with the bedding angle, reaching a maximum at 60°, and showing little change thereafter [8]. Gao Li’s experiments on sandstone and mudstone drillability, along with tests on compressive strength and Poisson’s ratio under different confining pressures, concluded that both parameters were positively correlated with the drillability grade [9]. Li Zhonghui used indoor test results and rock acoustic time differences for linear regression, developing a drillability grade calculation model that aids in PDC bit optimization [10]. Ji Hui conducted drillability tests on rock samples from the Zhujiang Formation in the South China Sea under high-temperature and high-pressure conditions, comparing the differences under single and coupled temperature and pressure effects, and established a calculation model for drillability grade considering these factors [11]. Li Qian developed a nonlinear multiple regression model to predict rock drillability based on indoor core micro-drilling data and used various artificial neural network methods for prediction [12].
Despite the various methods and approaches to studying rock drillability, research on the drillability grade of ultra-deep well rocks under the coupling effects of high temperature and high pressure is relatively limited. Therefore, it is necessary to conduct studies on the drillability of ultra-deep well formation rocks to guide field production practices. There are many ways to study the drillability grade of rocks, most of which still rely on indoor rock drillability tests [13]. Due to the impact of high temperature and high pressure at the well bottom, rock drillability data obtained through indoor tests without confining pressure and high-temperature conditions often deviate from the actual results at the well bottom. This paper aims to obtain the drillability grade of rocks from the Tazhong-Tabei block in the Tarim Basin through indoor tests and to compare the finite element simulation results with the test results to verify the accuracy of the drillability grade. By conducting laboratory tests and simulation analyses, the drillability grades of the formation rocks in the Tazhong-Tabei blocks were studied, providing technical guidance for the optimal selection of drill bits for the corresponding formations.

2. Indoor Rock Drillability Test

The micro-drilling method (micro-drill penetration rate testing method) is the fundamental approach for determining rock drillability grade values [14]. The data obtained is more accurate and has higher credibility, making it the standardized method in the oil and gas industry in China. The test needs to comply with the industry standard “Method for Determining and Grading Rock Drillability” (SY/T 5426-2016) [15] and uses simulated micro-drills to perform drilling tests on core samples according to specific procedures. The goal is to determine the drillability grade values of rocks for both roller cone bits and PDC bits under indoor conditions. During the test, the main shaft rotation speed of the drill is set to 55 r/min, and the applied force on the roller cone micro-drill is 1000 N. For the PDC micro-drill, the applied force is set in three levels: 500 N, 1000 N, and 2000 N, chosen based on the actual condition of the rock. The rock drillability grading table is shown in Table 1. Where K d represents K r d and K p d , the drillability grade values are obtained by measuring the time it takes for the micro-drill to penetrate a specific depth in the core under certain weight and rotation speed conditions [16], as indicated by Formulas (1) and (2).
Roller   cone   bit   drillability   grade   value :   K r d = l o g 2 t R
PDC   bit   drillability   grade   value :   K p d = l o g 2 t P + G i
where K r d and K p d are the drillability grade values for roller cone and PDC bits, respectively, dimensionless; t R and t P are the average drilling times for roller cone and PDC bits, respectively, in seconds; G i is the equivalent conversion grade value, which is the number of weight levels (first level = 1; second level = 2; third level = 3).

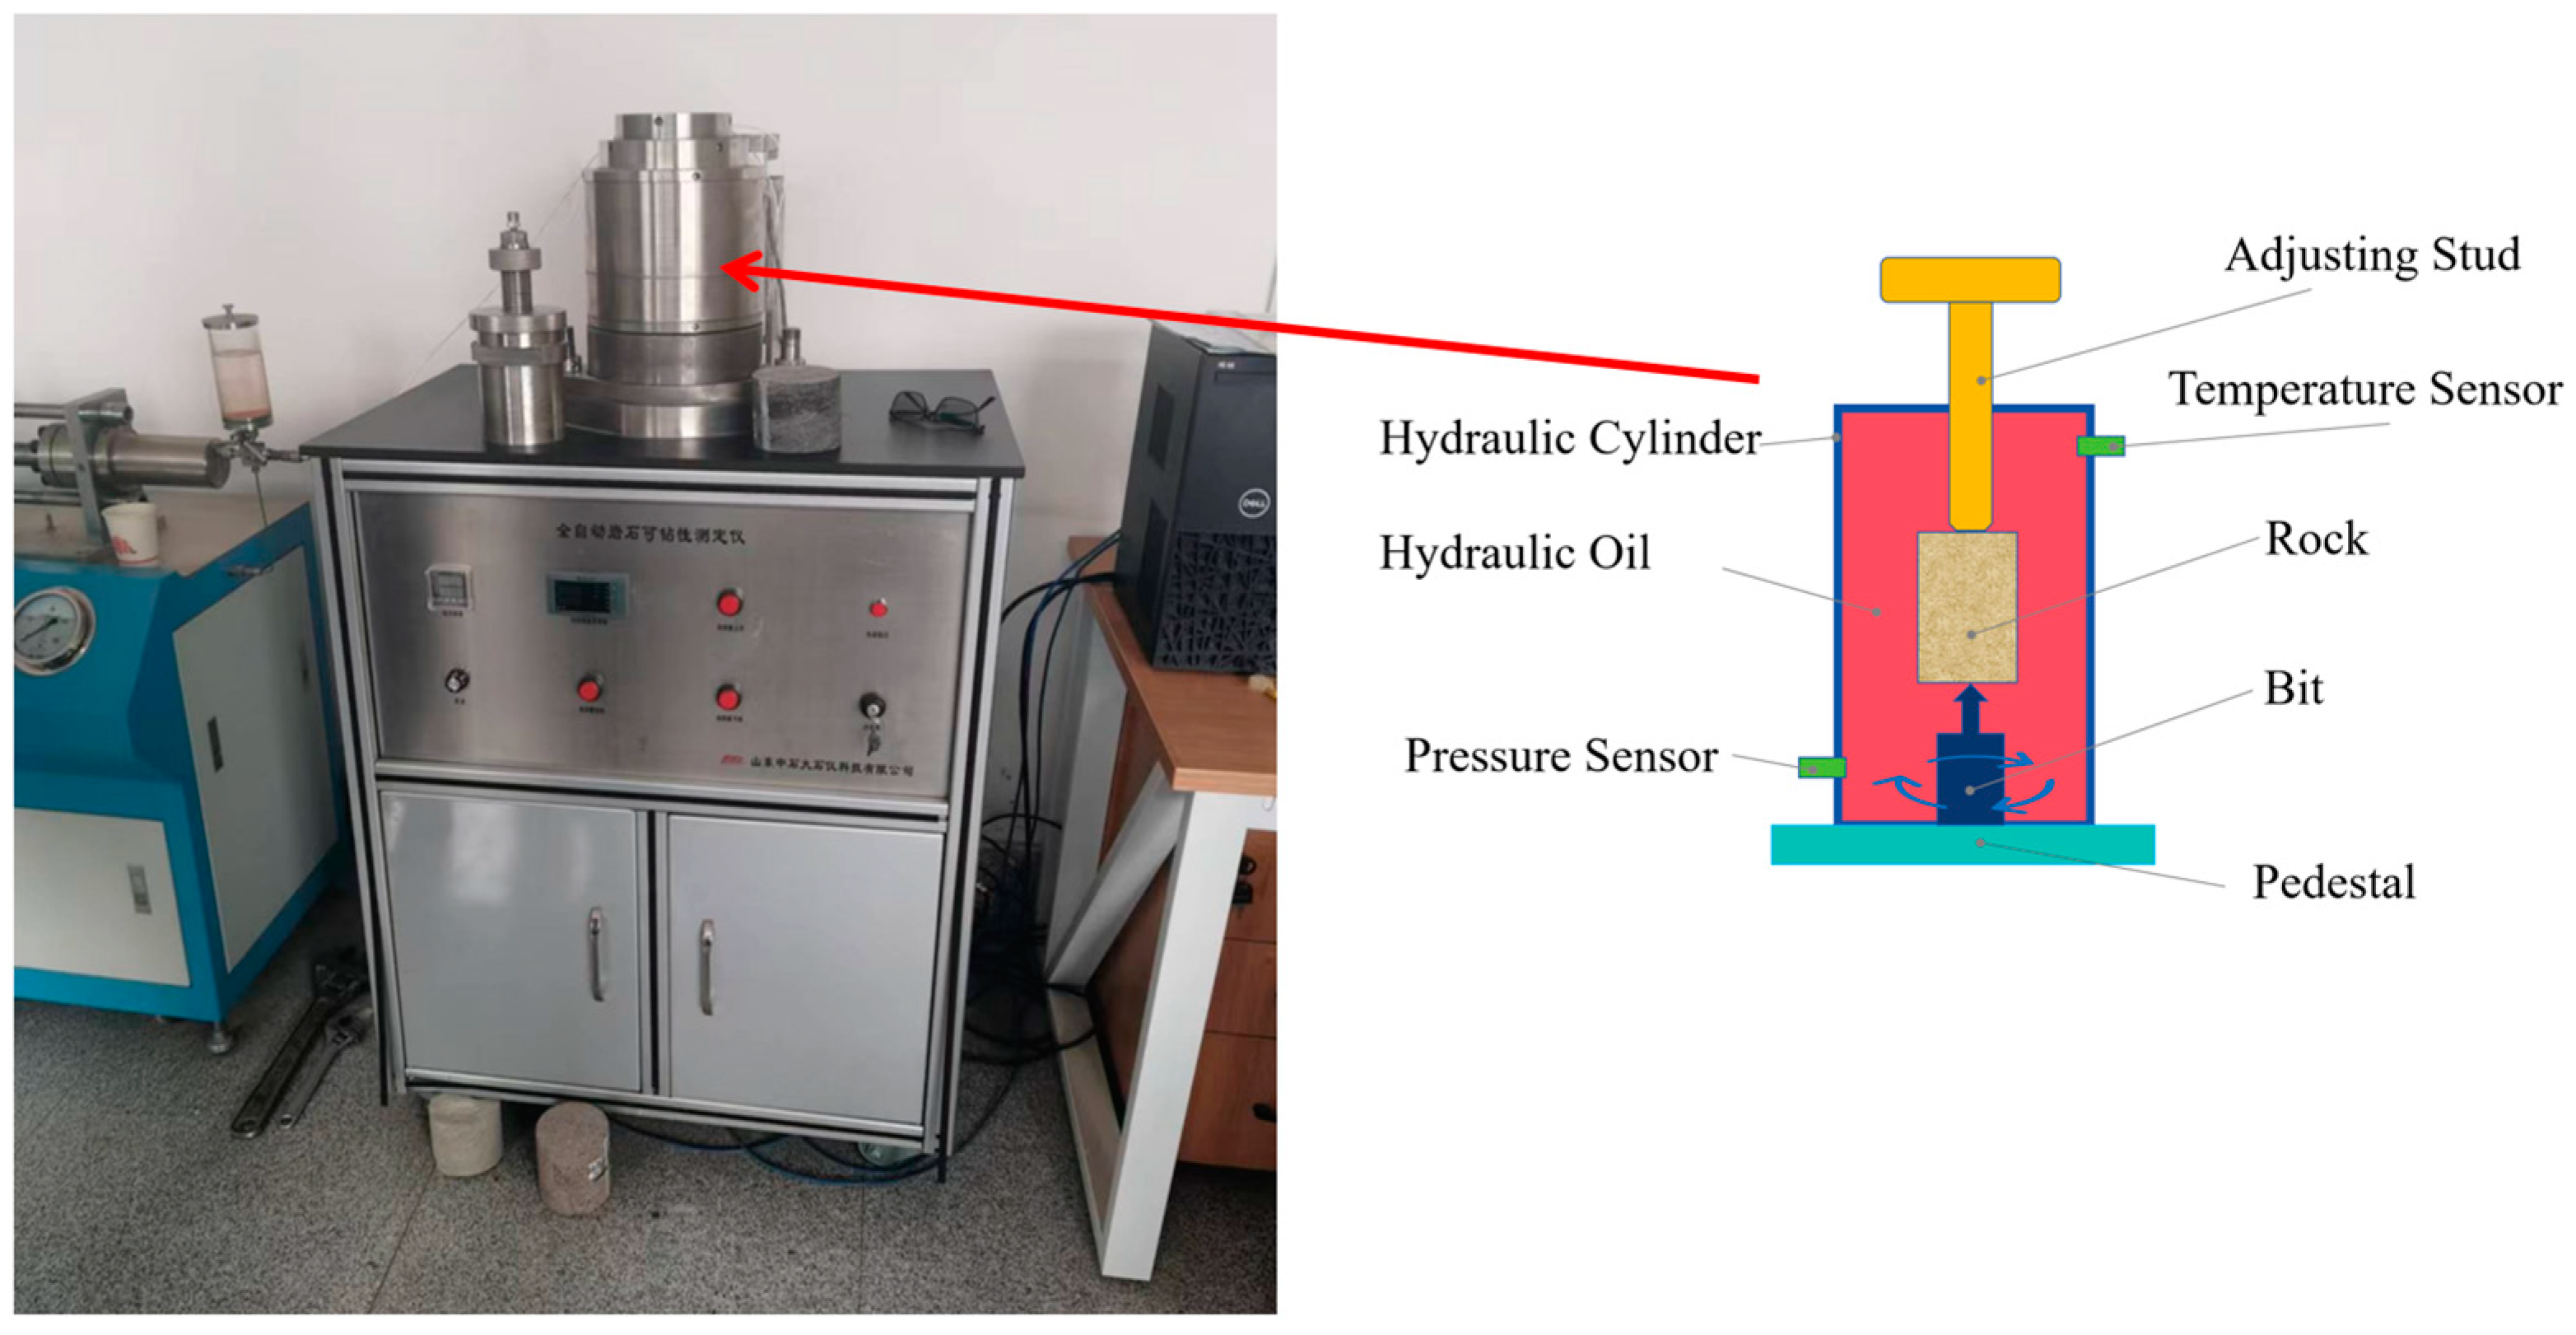
2.1. High-Temperature and High-Pressure Rock Drillability Testing Equipment

The test utilizes a high-temperature and high-pressure fully automatic rock drillability tester to measure rock drillability. A schematic diagram of the test equipment structure is shown in Figure 1. The equipment includes a temperature control module, a hydraulic control module, a core clamping module, and a data acquisition module. The temperature control range is from 0 to 200 °C, and the confining pressure control range is from 0 to 100 MPa. Unlike conventional simulated drillability tests where the bit drills downwards, this experimental setup uses an upward drilling method. This facilitates the removal of rock cuttings, which are collected in a rock cuttings collection bucket at the bottom of the bit.

2.2. Rock Drillability Test under Well Bottom Temperature and Pressure Conditions

The experimental samples were processed into cylindrical shapes with a diameter of 100 mm and a height of 80 mm. Both ends of the samples were ground flat, and no visible cracks were observed. The samples were taken from the Permian strata, the main target layer in the Tazhong-Tabei block. There was a total of 36 core samples with a depth range from 3872 to 4155 m. Based on the temperature and pressure gradients of the formation, the temperature at this depth was calculated to be 120 °C, with a Confining Pressure (CP) of 35 MPa. To investigate the effects of temperature and pressure on rock drillability, 36 sets of indoor drillability tests were conducted. The specific operational procedures were as follows: installing the core samples, pumping to the predetermined confining pressure, heating the hydraulic oil to the predetermined temperature, and drilling under specified pressures. After the tests were completed, data including temperature, confining pressure, drillability grade values, and other experimental data were recorded and processed using computer data processing software. The results of the tests are shown in Table 2.
Analyzing the test results of the 36 groups of rock drillability levels mentioned above, it is evident that the bottom hole pressure and temperature have a significant impact on the rock drillability levels. From the data in the table, it can be seen that the drillability levels obtained through indoor tests, which often neglect bottom hole pressure and temperature, deviate greatly from actual conditions in engineering practices, leading to often inaccurate results. Therefore, it is crucial to conduct experiments to determine the extreme rock drillability under bottom hole pressure conditions to guide engineering practices.
Figure 2 shows the analysis results of rock drillability levels under different confining pressures. It is apparent that with increasing confining pressure, the rock drillability generally increases. Additionally, the drillability level of roller cone bits (toothed bits) is higher than that of PDC (Polycrystalline Diamond Compact) bits. This is because increasing confining pressure enhances the plasticity of rocks, thereby increasing drillability levels. In contrast, PDC bits primarily break rocks through the shear and scraping actions of the PDC teeth, which are more effective in plastic formations. According to the test results, when the confining pressure exceeds 30 MPa, there is a significant increase in rock drillability levels. Given that the confining pressure of the rock layer in this case is 35 MPa, the influence of confining pressure on drillability must be considered.
Figure 3 depicts the analysis results of rock drillability levels at different temperatures. As indicated by the graph, the drillability level of rocks decreases with increasing temperature. This is because as the temperature rises, the cohesive strength of crystalline units within the rock decreases, causing fractures and dislocations between mineral grains. This process promotes the development of new pores and cracks within the rock core [17], thereby establishing a critical temperature at which micro-cracking in the rock occurs [18]. From the graph, it can be observed that this critical temperature is approximately 140 °C.
Figure 4 illustrates the analysis results of rock drillability levels under coupled effects of confining pressure (CP) and temperature. Under coupled temperature and confining pressure conditions, the graph indicates that confining pressure has a greater impact on rock drillability compared to temperature. When the temperature exceeds 140 °C, the difference in drillability levels compared to the single factor of confining pressure becomes significant. Therefore, when the temperature is below the critical temperature, consideration of coupled temperature and pressure conditions may not be necessary; instead, only the influence of confining pressure on drillability needs to be considered. However, when the temperature exceeds the critical temperature, the combined effects of temperature and confining pressure on drillability must be taken into account.
Figure 5 shows the pit patterns from drillability tests of PDC (Polycrystalline Diamond Compact) and roller cone bits. From the figure, it is evident that PDC bits exhibit a continuous shearing action during rock fragmentation, whereas roller cone bits transition from point contact to face contact with the rock upon rotation, resulting in intermittent pit patterns. This discontinuous interaction between roller cone bits and the rock leads to intermittent pit formation.

3. Simulation of Rock Drillability

3.1. Model Assumptions

To facilitate numerical simulation, the following assumptions are made for the finite element model [19]:
(1)
Due to the hardness difference between PDC teeth, roller cone teeth, and rock, wear and deformation of the PDC teeth and roller cone teeth during rock breaking are ignored, treating them as rigid bodies.
(2)
The influence of drilling fluid on the simulation process is neglected.
(3)
The cutting teeth and rock are considered isotropic, homogeneous materials.
(4)
The influence of rock porosity and texture on the rock breaking process is ignored.

3.2. Rock Failure Criterion

Selecting an appropriate rock failure model is key to accurately simulating rock breaking by the drill bit. Currently, the commonly used criteria both domestically and internationally are the Mohr–Coulomb (M–C) and Drucker–Prager (D–P) criteria. The D–P criterion comprehensively considers the yield stress and shear stress-induced expansion of the rock. Therefore, the modified linear Drucker–Prager (hereinafter referred to as D–P) plastic model is chosen for the rock. This model regards deviatoric stress as the main cause of material failure and simultaneously reflects the impact of volumetric stress on material strength. The model can be represented by the following Equations (3)–(7) [20].
ρ I 1 + J 2 K = 0
I 1 = σ 1 + σ 2 + σ 3
J 2 = 1 6 σ 1 σ 2 2 + σ 2 σ 3 2 + σ 1 σ 3 2
ρ = 2 sin 3 ( 3 sin )
K = 6 e cos 3 ( 3 sin )
In the formulas: ρ and K are experimental constants related to the internal friction angle and cohesion of the rock e , the units are degrees ° and MPa, respectively. I 1 is the first invariant of stress deviators, measured in MPa. J 2 is the second invariant of stress deviators, measured in MPa. σ 1 , σ 2 , σ 3 are the first, second, and third principal stresses, respectively, measured in MPa.
When the plastic stress of the rock exceeds its critical value, damage begins to occur. The impact of the already failed elements on the rock-breaking process is neglected. The plastic strain criterion for the rock is represented by Equation (8).
ε l ε f r l
In the formula, ε l is the equivalent plastic strain of the rock, ε f r l is the equivalent plastic strain at which rock failure occurs.

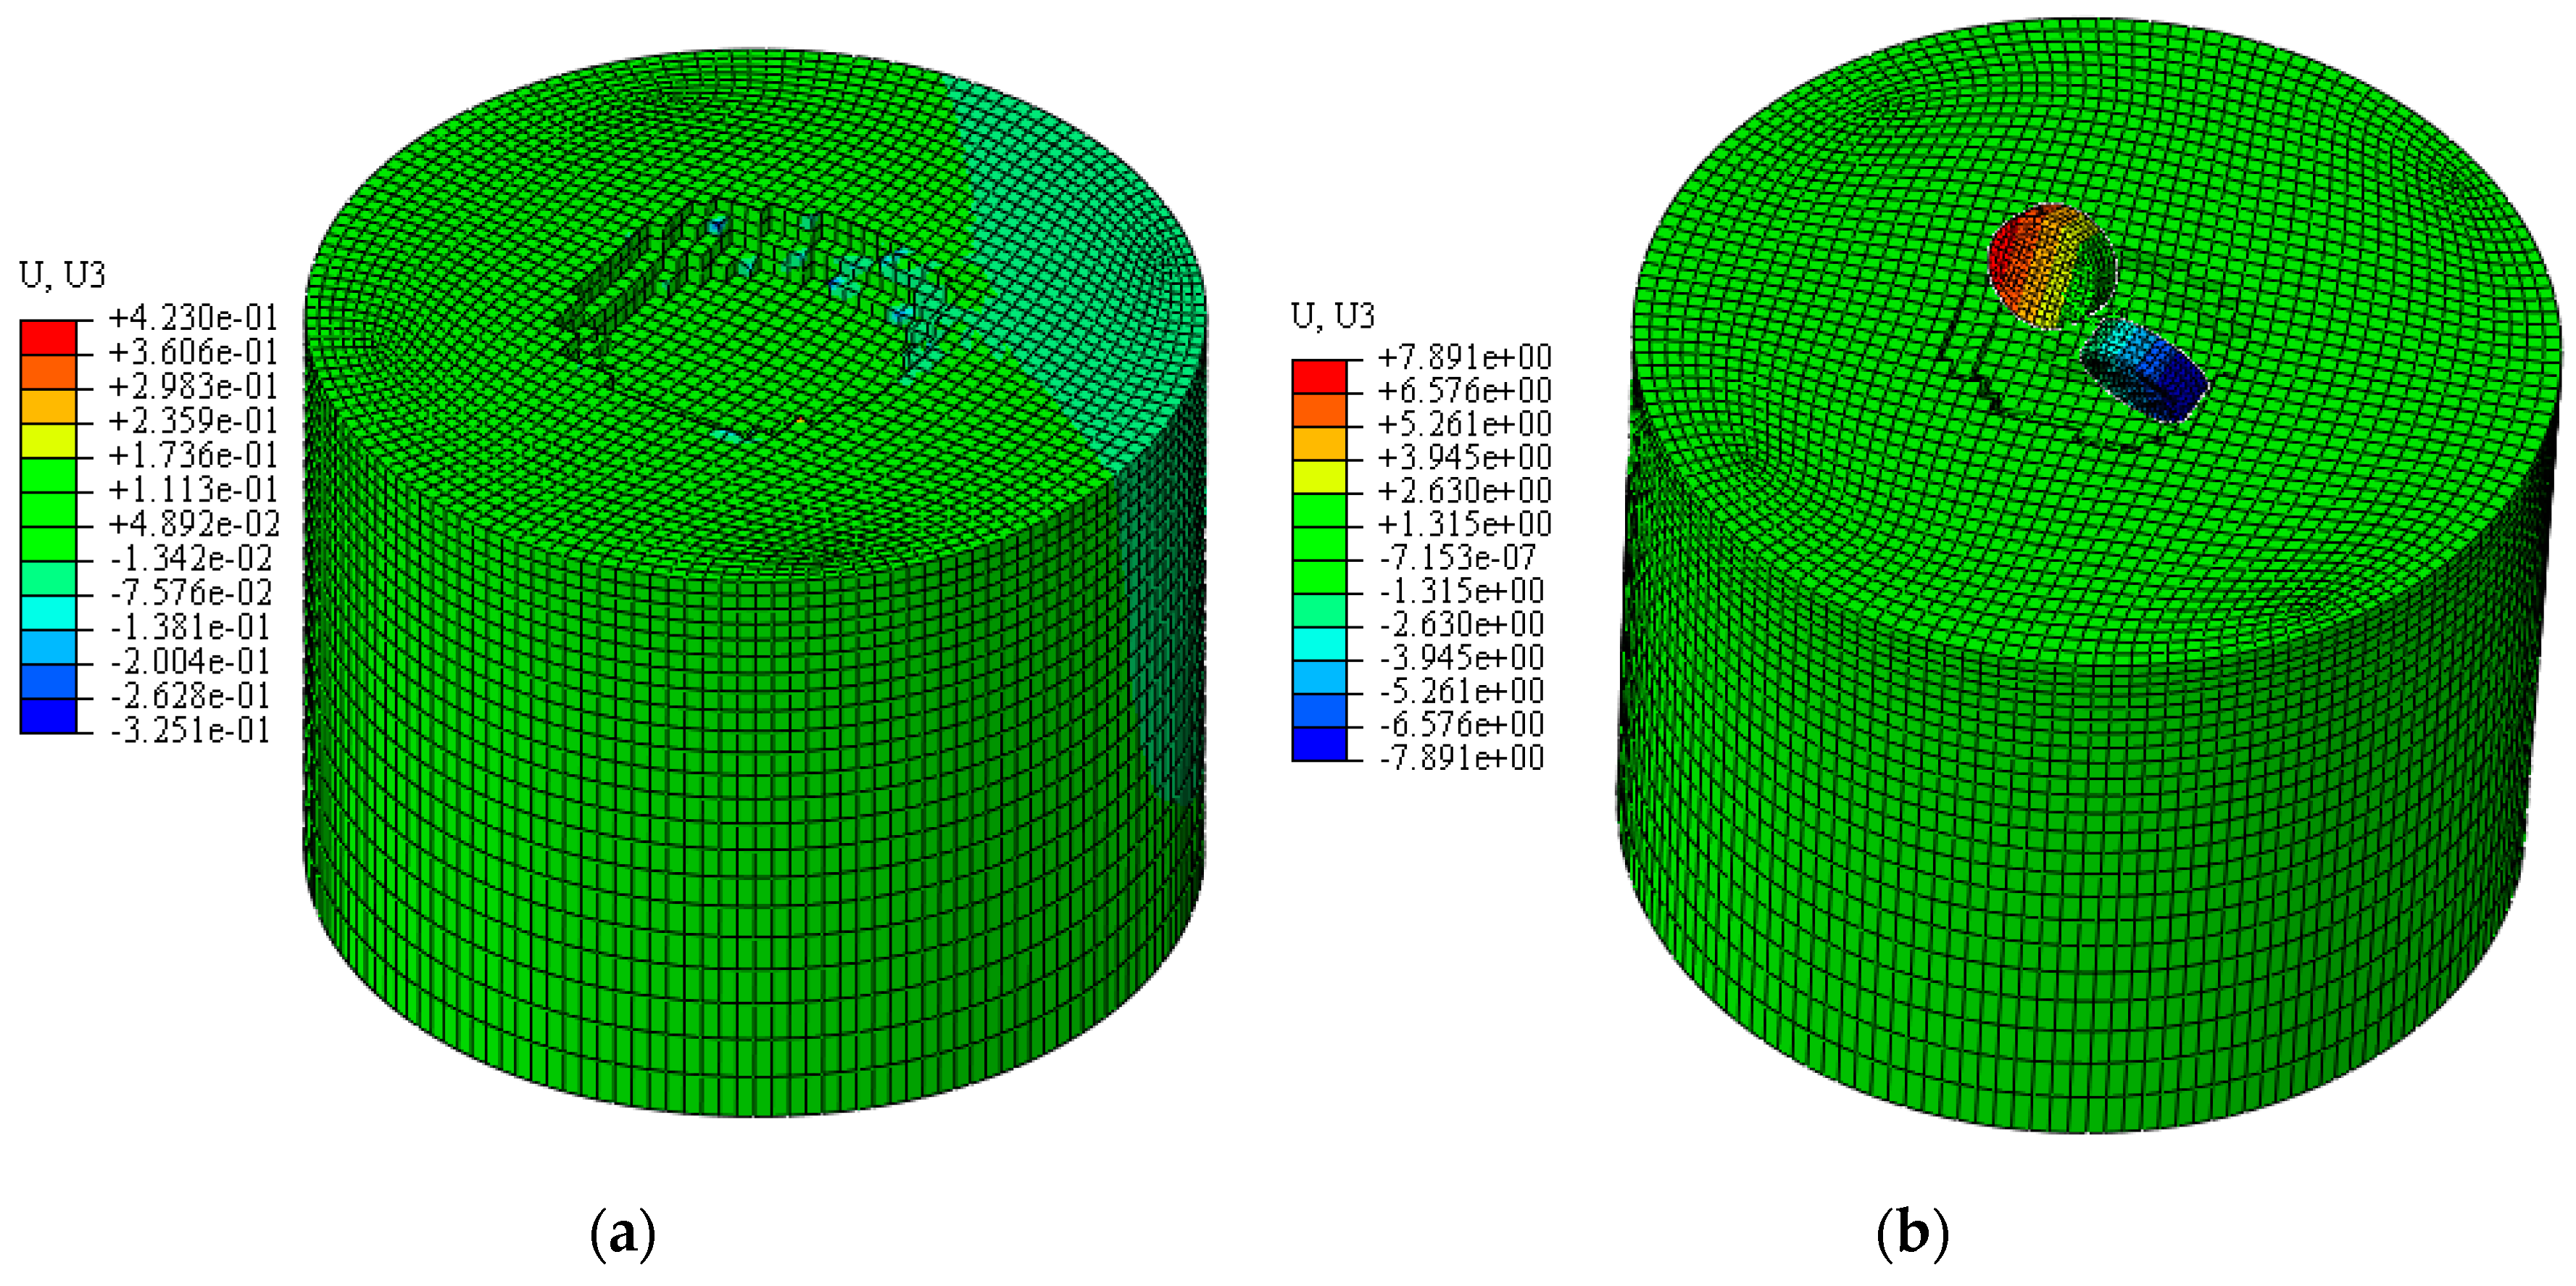
3.3. Finite Element Simulation Model

Using Solidworks, a three-dimensional model of the PDC micro-drill and the roller cone drill bit micro-drill model are created. These models are saved in .step format and imported into the Abaqus (v2022) finite element simulation software, where they are assembled with a three-dimensional rock model, as shown in Figure 6. To accurately determine the rock’s roller cone drill bit ROP (Rate of Penetration) and PDC drill bit ROP, parameters are set according to standards relevant to laboratory tests, with specific material parameters detailed in Table 3, the physical and mechanical parameters of the conglomerate-bearing sandstone were obtained through indoor uniaxial and triaxial tests. In this simulation, the main shaft rotation speed of the drill bit is set to 55 r/min. A drilling pressure of 1000 N is applied to the tricone micro drill, while a drilling pressure of 500 N is applied to the PDC micro drill. For the roller cone drill bit, the total time required from initial contact with the rock to drilling to 2.4 mm depth needs to be obtained. For the PDC micro-drill bit, the total time required from initial contact with the rock to drilling to 3 mm depth needs to be determined. Subsequently, Formulas (1) and (2) are used to calculate their respective ROP values.
Under drilling pressure and rotation speed, the teeth of the drill bit interact with the formation. The rock experiences stresses such as drilling pressure, frictional forces, and shear forces. When the stress on a rock unit exceeds its yield stress, the rock undergoes plastic deformation. As plastic deformation increases beyond the rock’s ultimate strength, the rock unit starts to fail, leading to detachment from the rock body. When the temperature increases, the bonding force between rock units decreases due to expansion, making it easier for the units to detach from the rock body under the action of shear force. Figure 7 shows the tooth marks on the rock surface after drilling with the micro drill bit, consistent with the laboratory test results shown in Figure 5. Table 4 presents the drilling effectiveness values obtained through finite element simulation for the micro roller cone bit and micro PDC bit.

3.4. Comparison of Simulation Results with Experimental Results

According to the data in Table 4: (1) When the temperature is fixed at 120 °C, with the increase in confining pressure, the drillability grades of the roller cone bit and PDC bit obtained through finite element simulation both increase. The drillability grades of the roller cone bit range between 5 and 7, and those of the PDC bit range between 4 and 7. (2) When the confining pressure is fixed at 30 MPa, with the increase in temperature, the drillability grades of the roller cone bit and PDC bit obtained through finite element simulation both increase. The drillability grades of the roller cone bit range between 4 and 6, and those of the PDC bit range between 4 and 5.
By comparing the simulation results with laboratory test results, it can be found that the drillability grades of the roller cone bit and PDC bit obtained through simulation are consistent with the laboratory test results. The error between the laboratory results and the simulation results is within 10%. Overall, the simulation results can meet the needs of field engineering practice and provide guidance for the selection of drill bits on site.

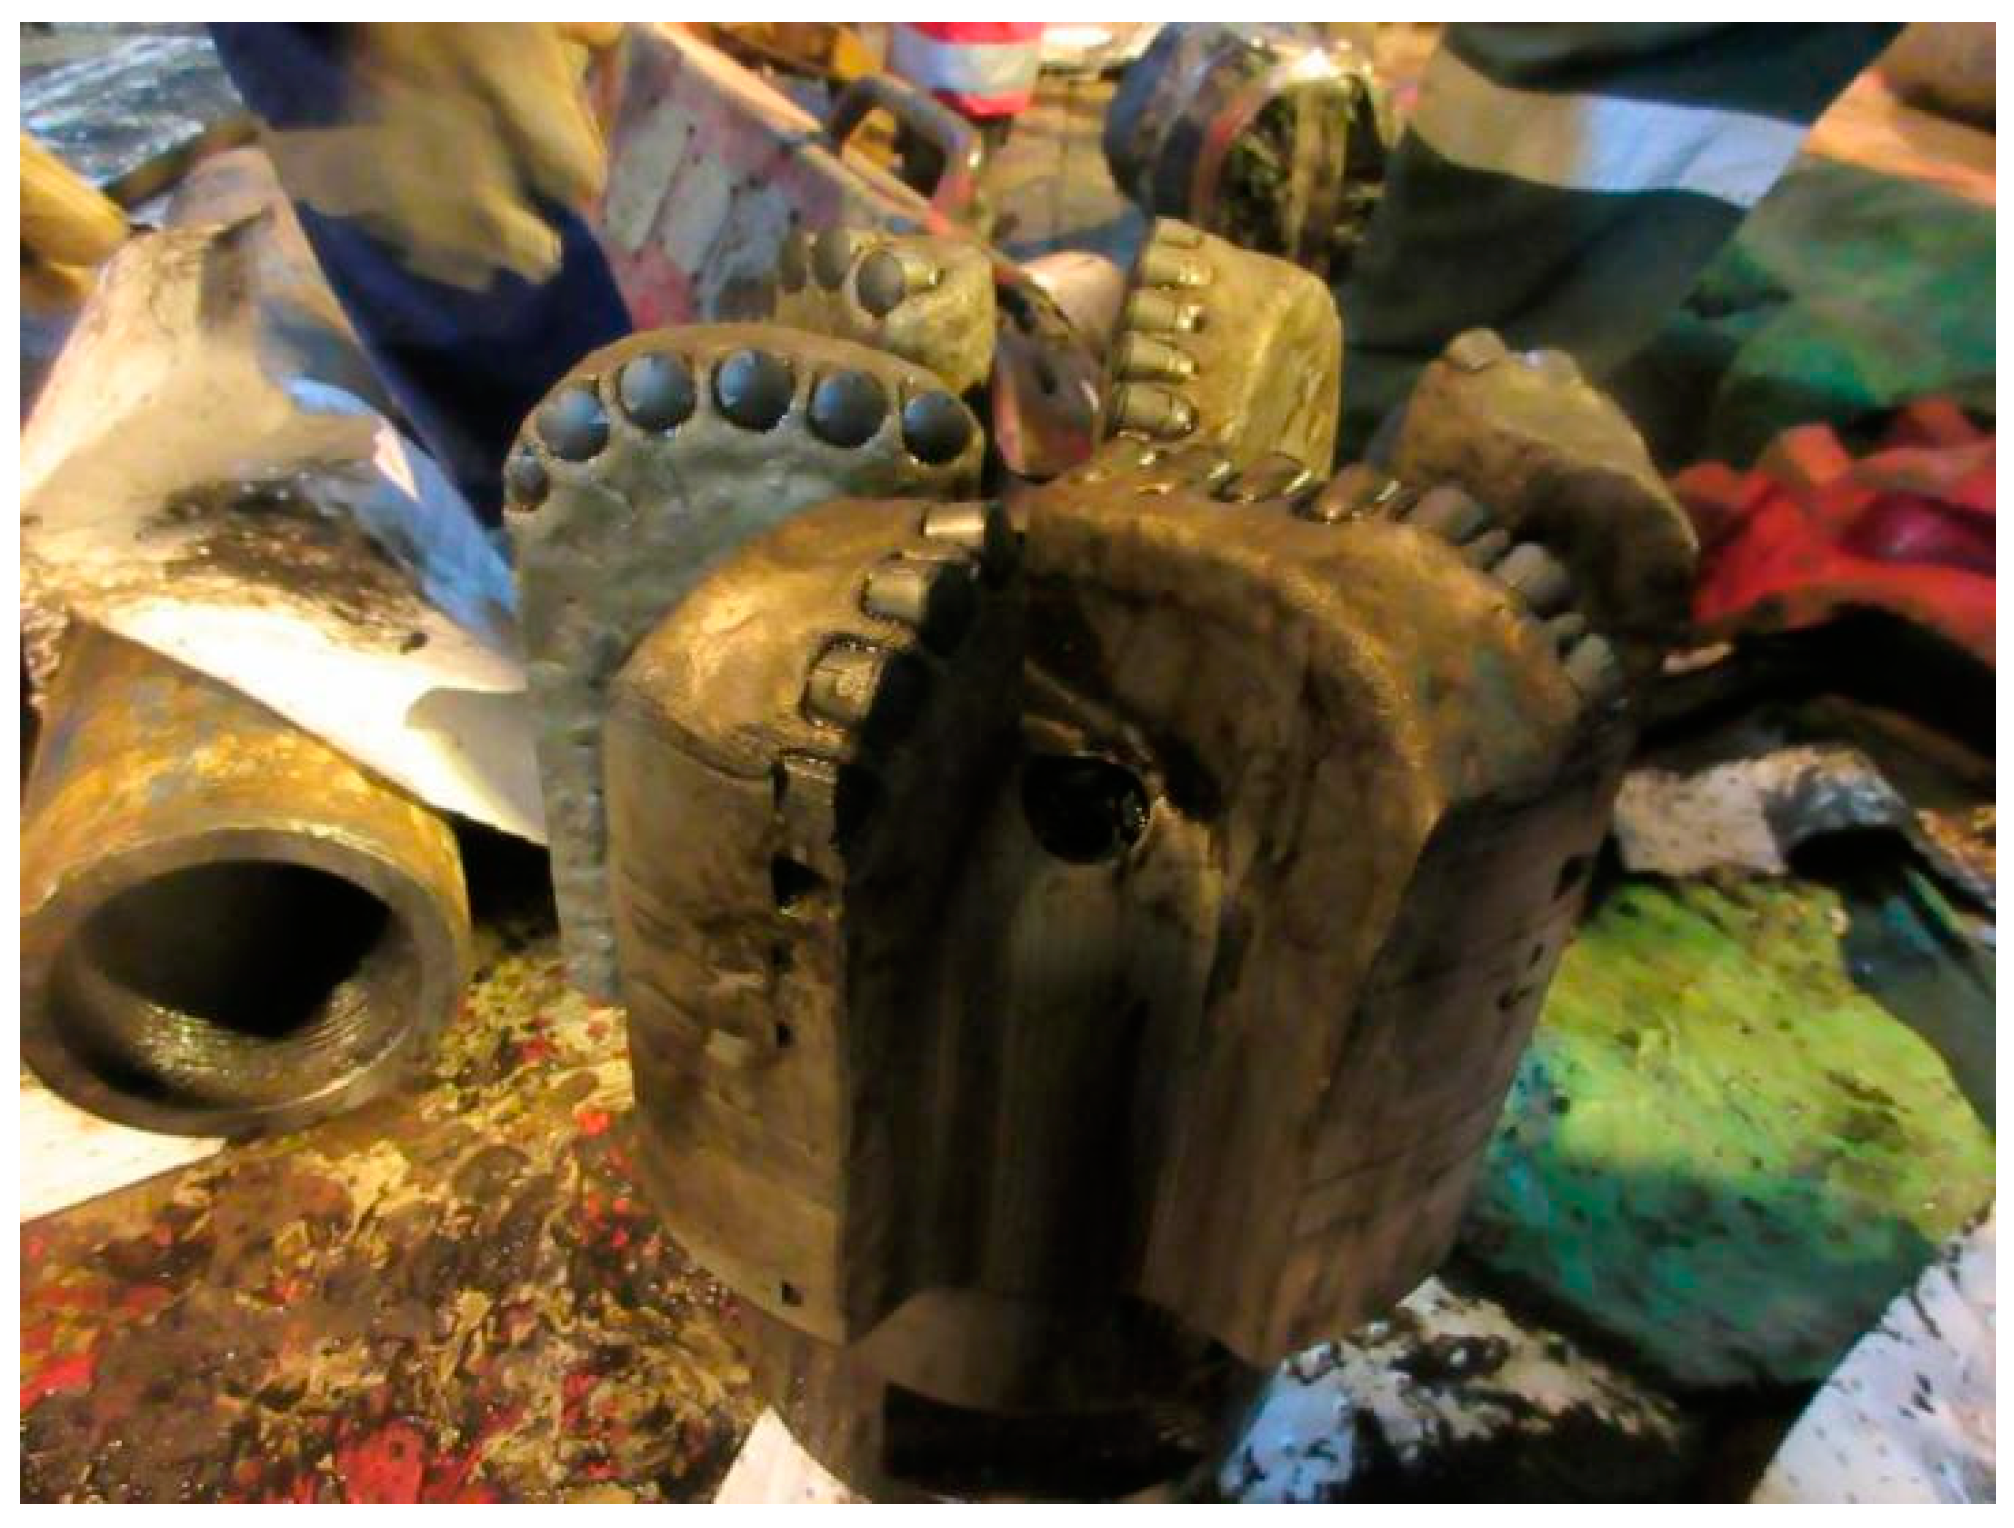
4. Field Application

The selection of the drill bit is the most crucial step in the drilling process. Choosing the appropriate bit can not only increase the rate of penetration (ROP) and reduce the likelihood of drilling accidents but also lower production costs [22]. The strata of the Tazhong-Tabei block, from top to bottom, mainly consist of the Quaternary of the Cenozoic, Neogene, Paleogene, Mesozoic, Cretaceous, Jurassic, Triassic, and the Paleozoic Permian, Carboniferous, Devonian, Silurian, and Ordovician. The Neogene to Triassic layers are primarily composed of siltstone and sandstone. The Permian contains a large amount of conglomerate with steep inclinations, making the drilling process prone to deviation. The conglomerate-bearing sandstone requires high wear resistance from the drill bit.
Based on the above analysis, it was found that the drilling capability values of the roller cone bit and PDC bit at this layer of the Permian system range between 40 and 46. Additionally, the drilling capability value of the PDC bit is lower than that of the roller cone bit. To improve drilling efficiency and reduce drilling costs, it is recommended to use the PDC bit. The PDC bit after drilling out of the well is shown in Figure 8. This bit successfully drilled through the target formation using only 9 bits, achieving a mechanical drilling speed of 2.38 m/h, thus achieving the expected drilling results.

5. Conclusions

(1)
The drilling feasibility of Permian core samples from the Taizhong-Taibei block under high temperature and pressure conditions was analyzed through indoor drilling feasibility tests. The drilling feasibility values of both roller cone bits and PDC bits ranged between 46, with PDC bits showing lower values compared to roller cone bits.
(2)
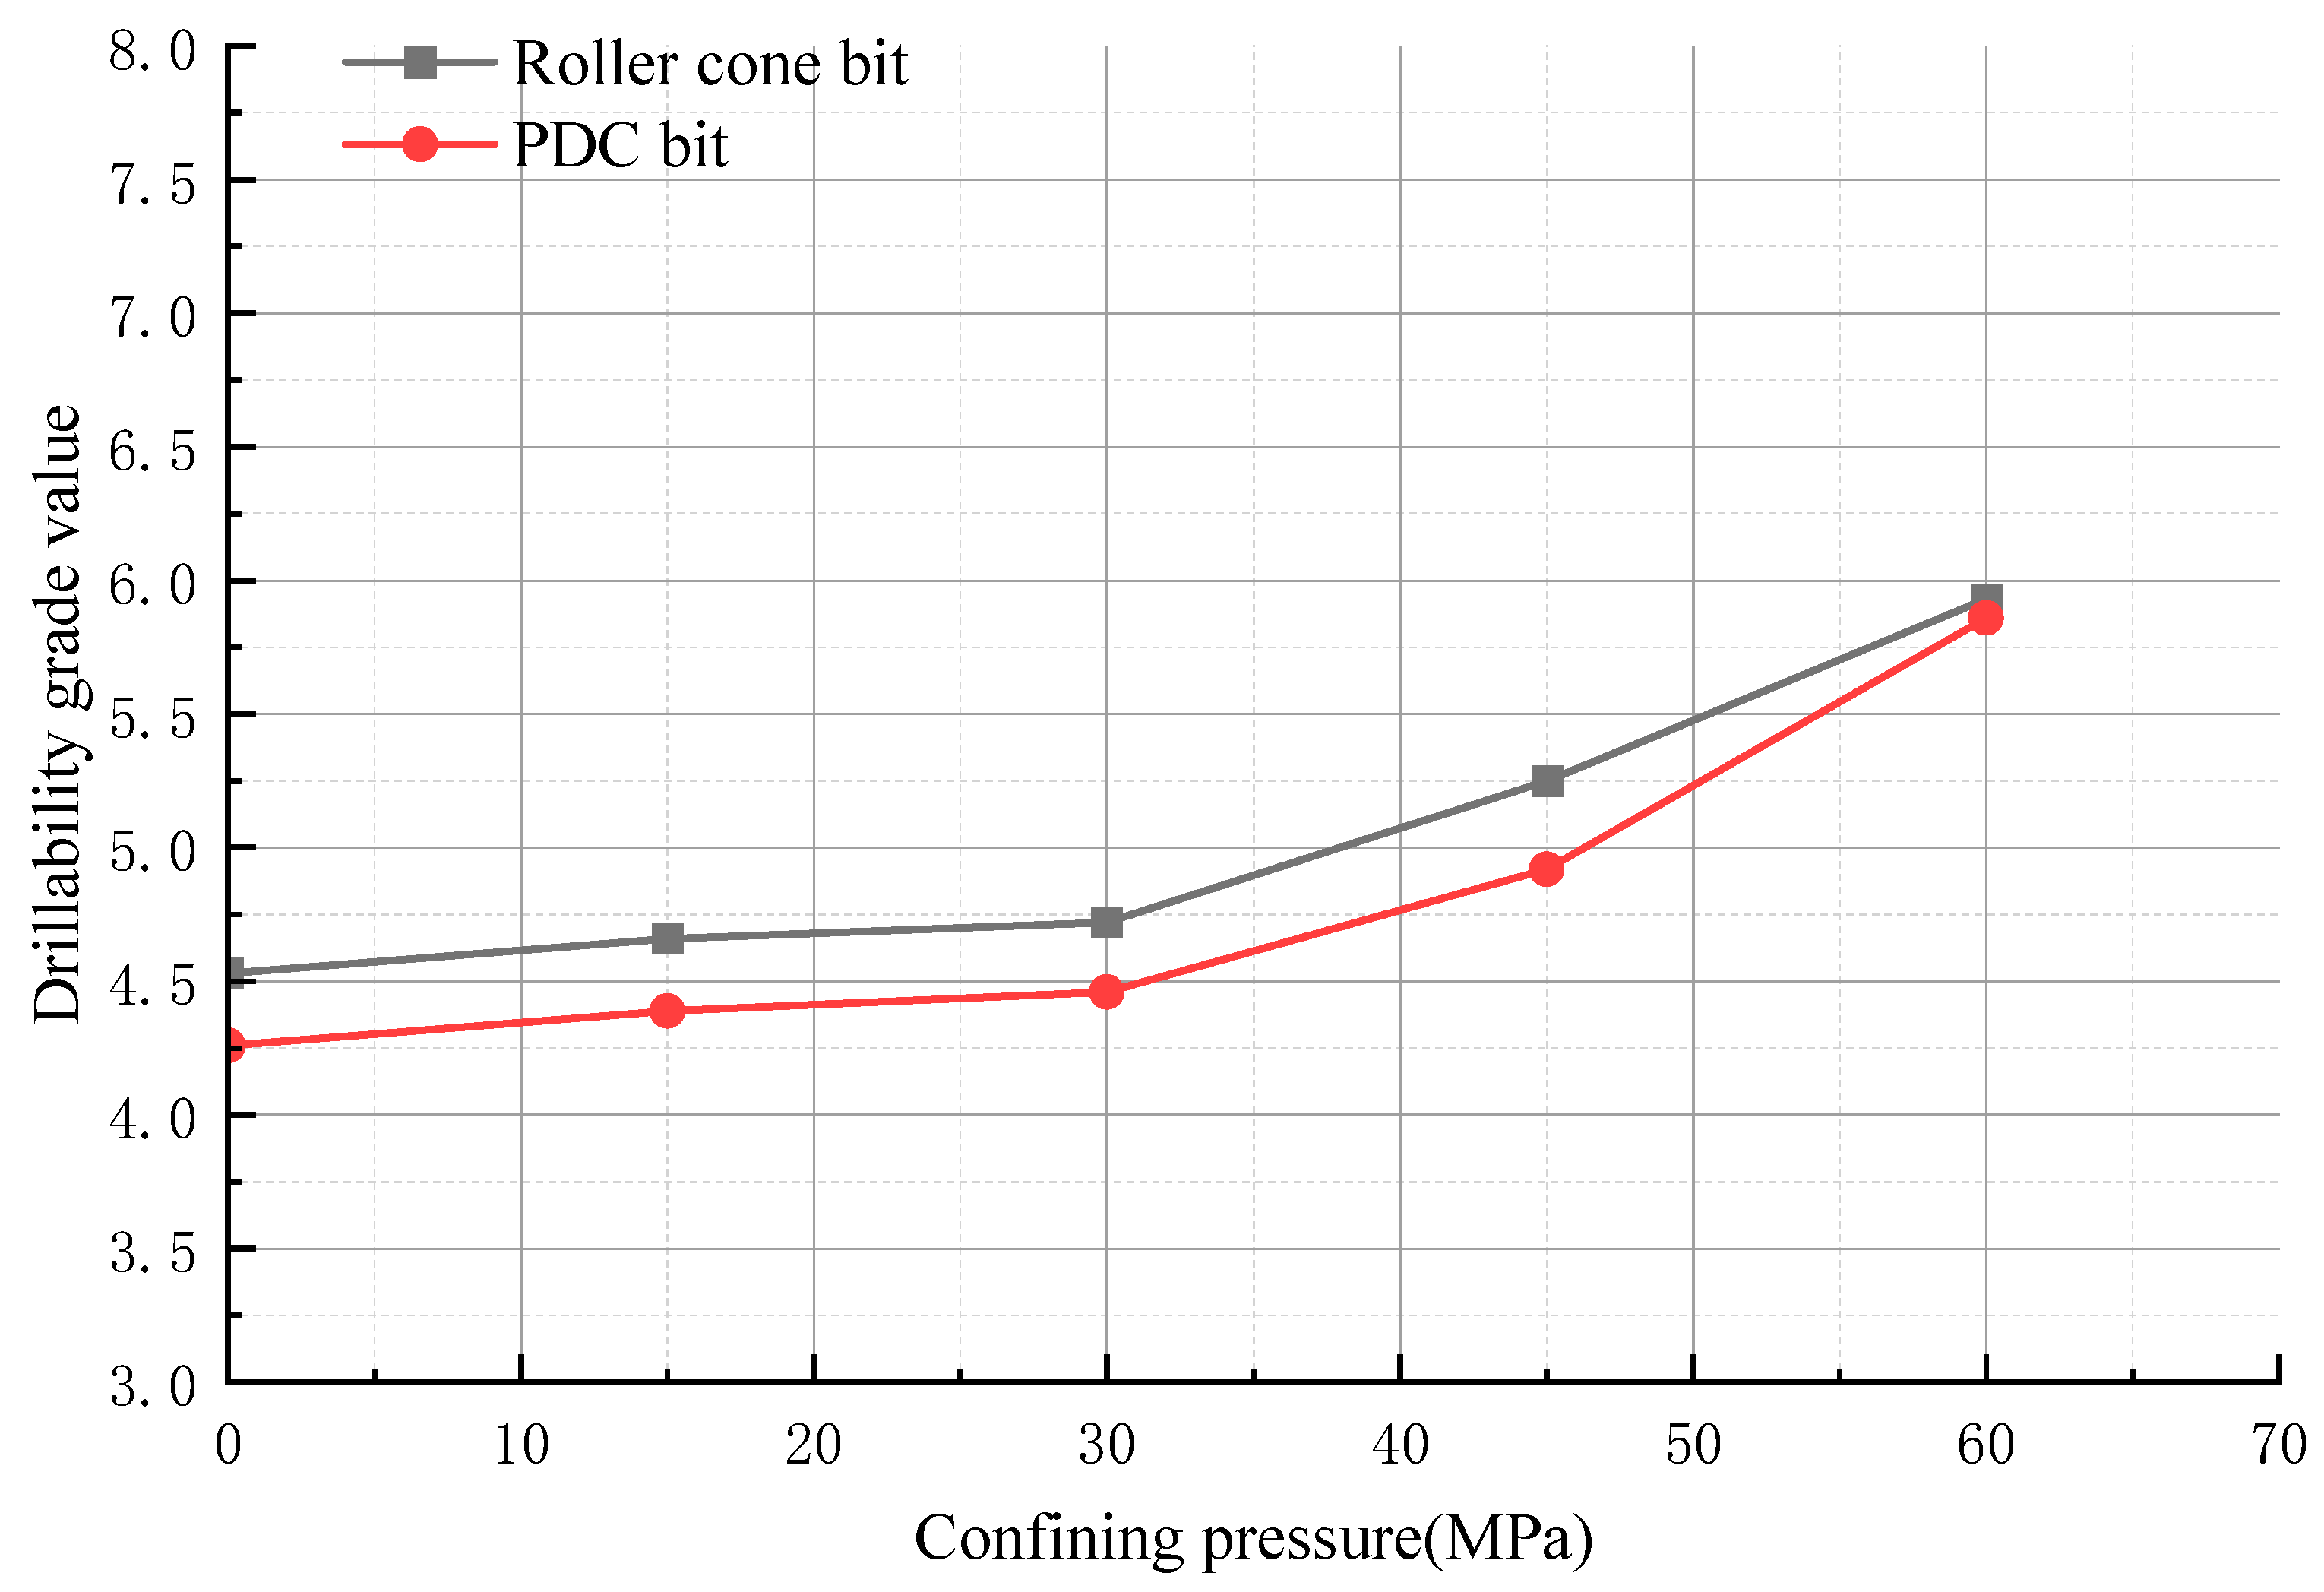
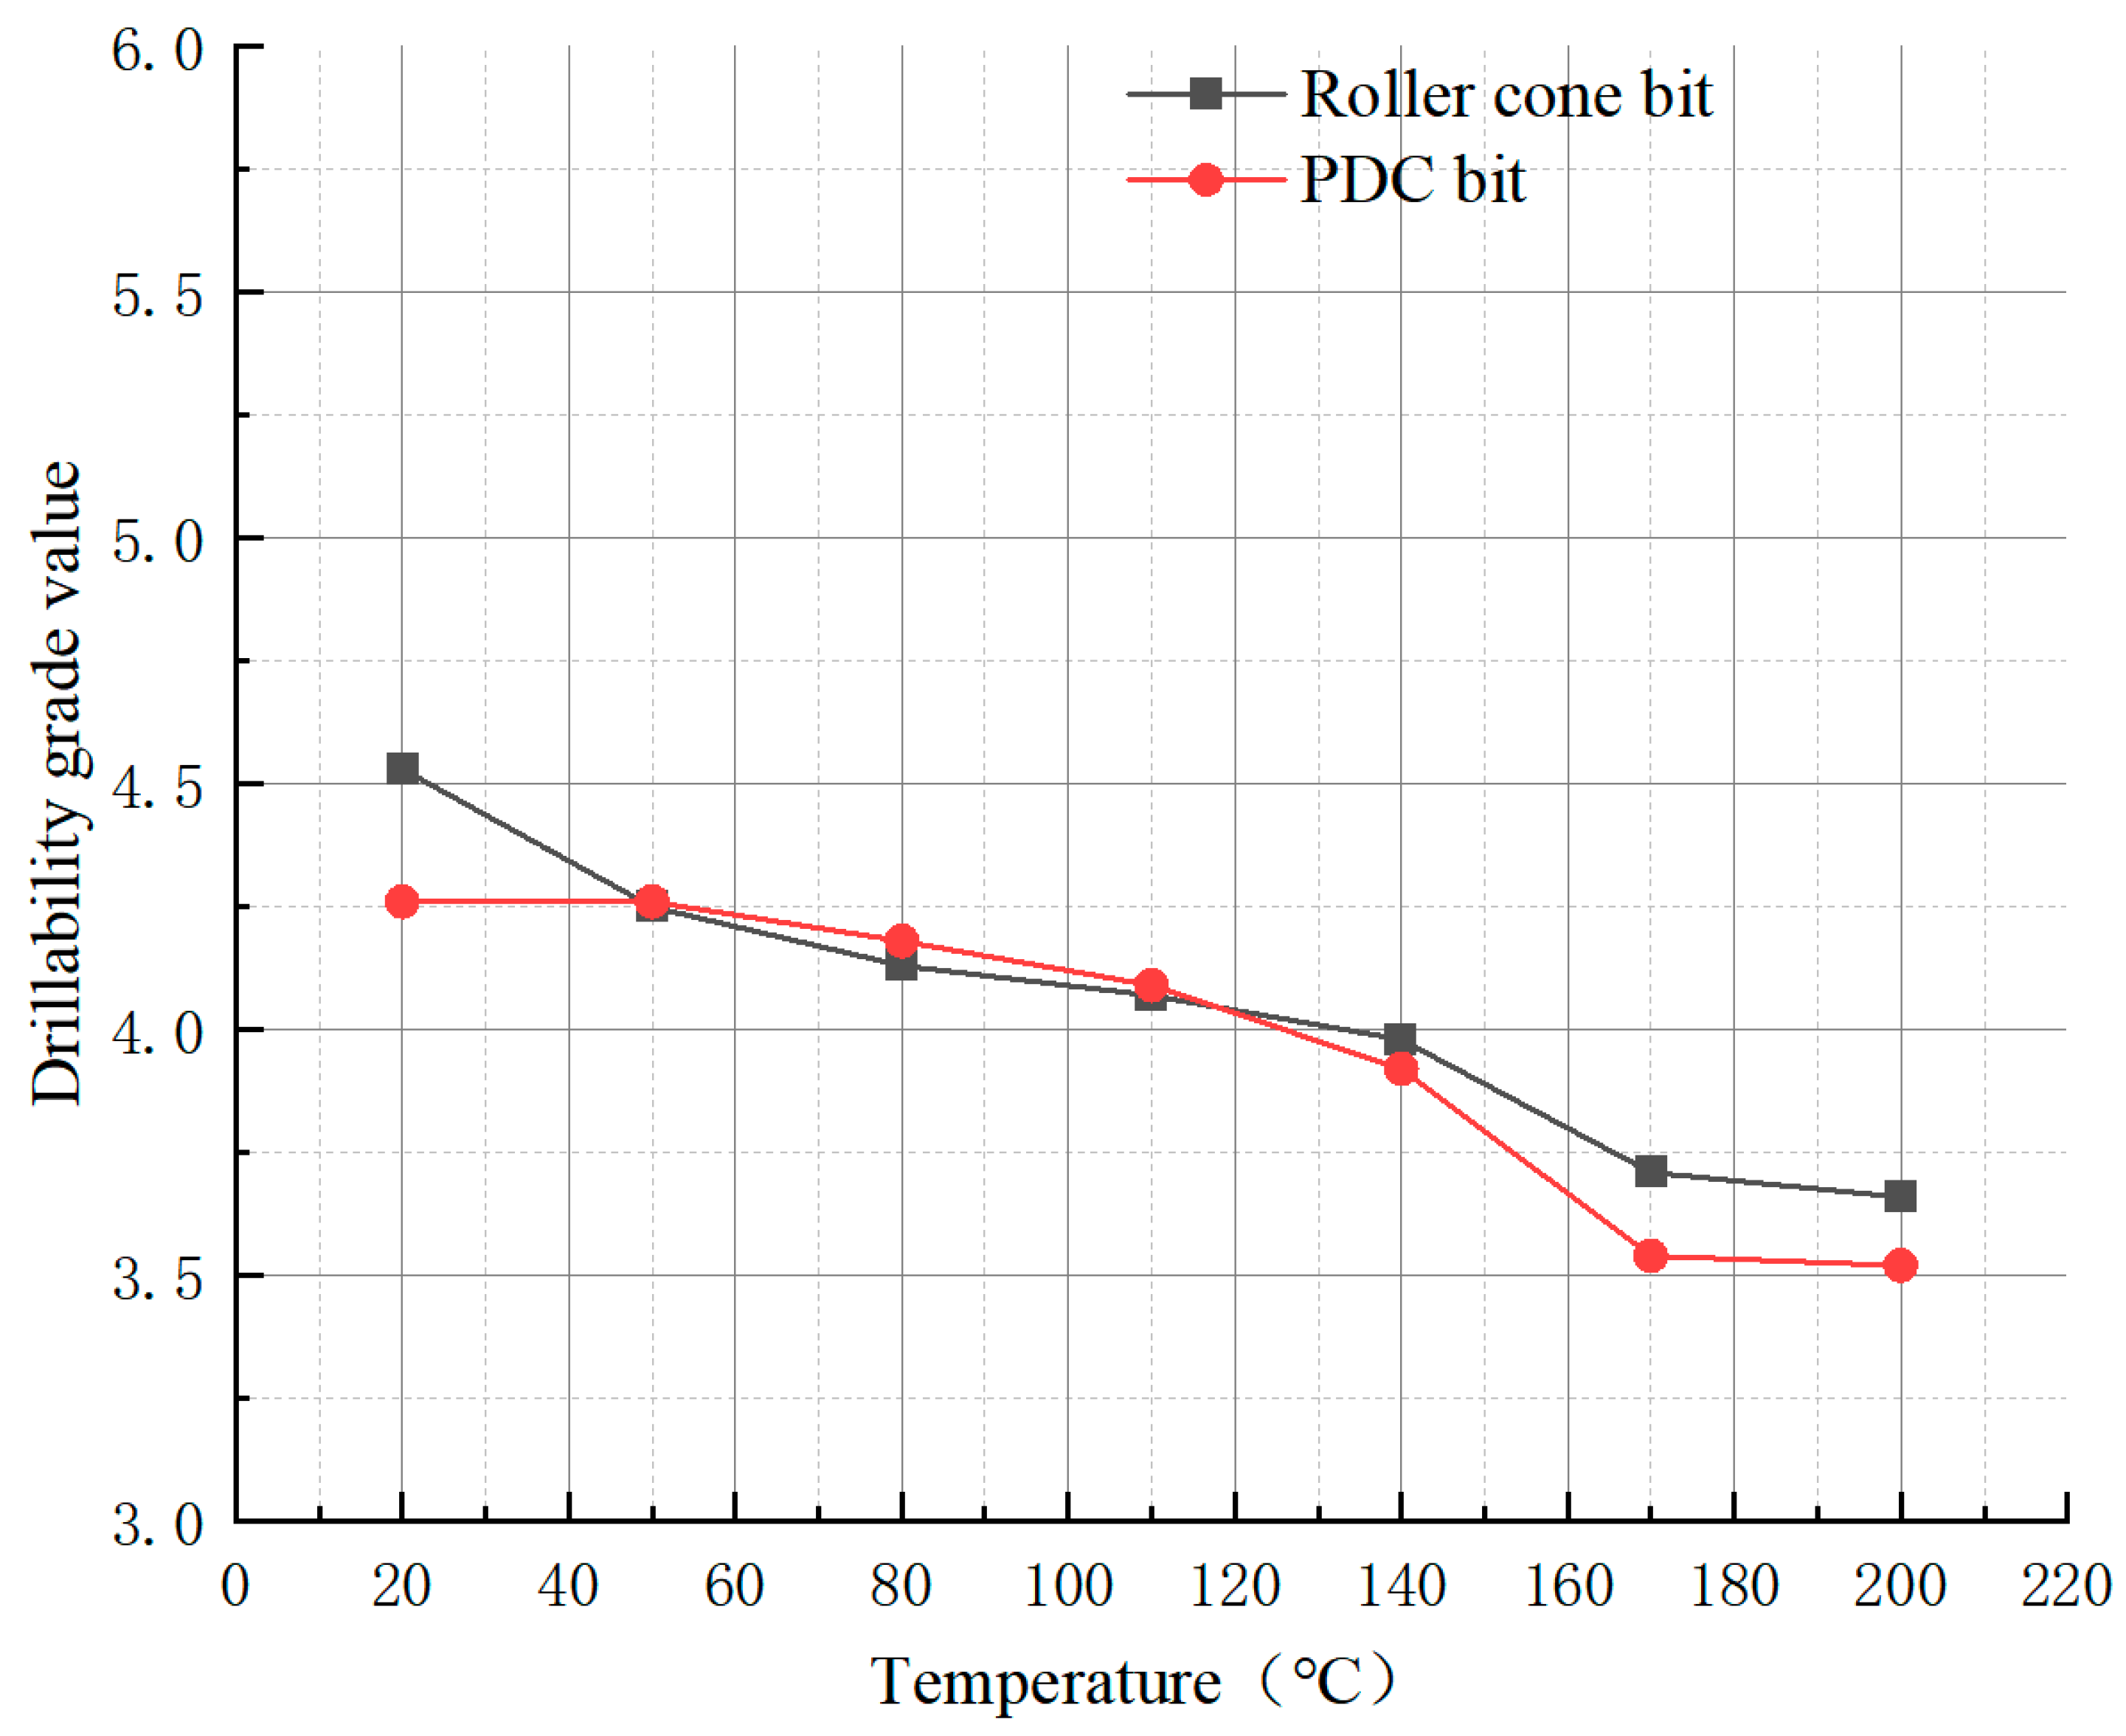
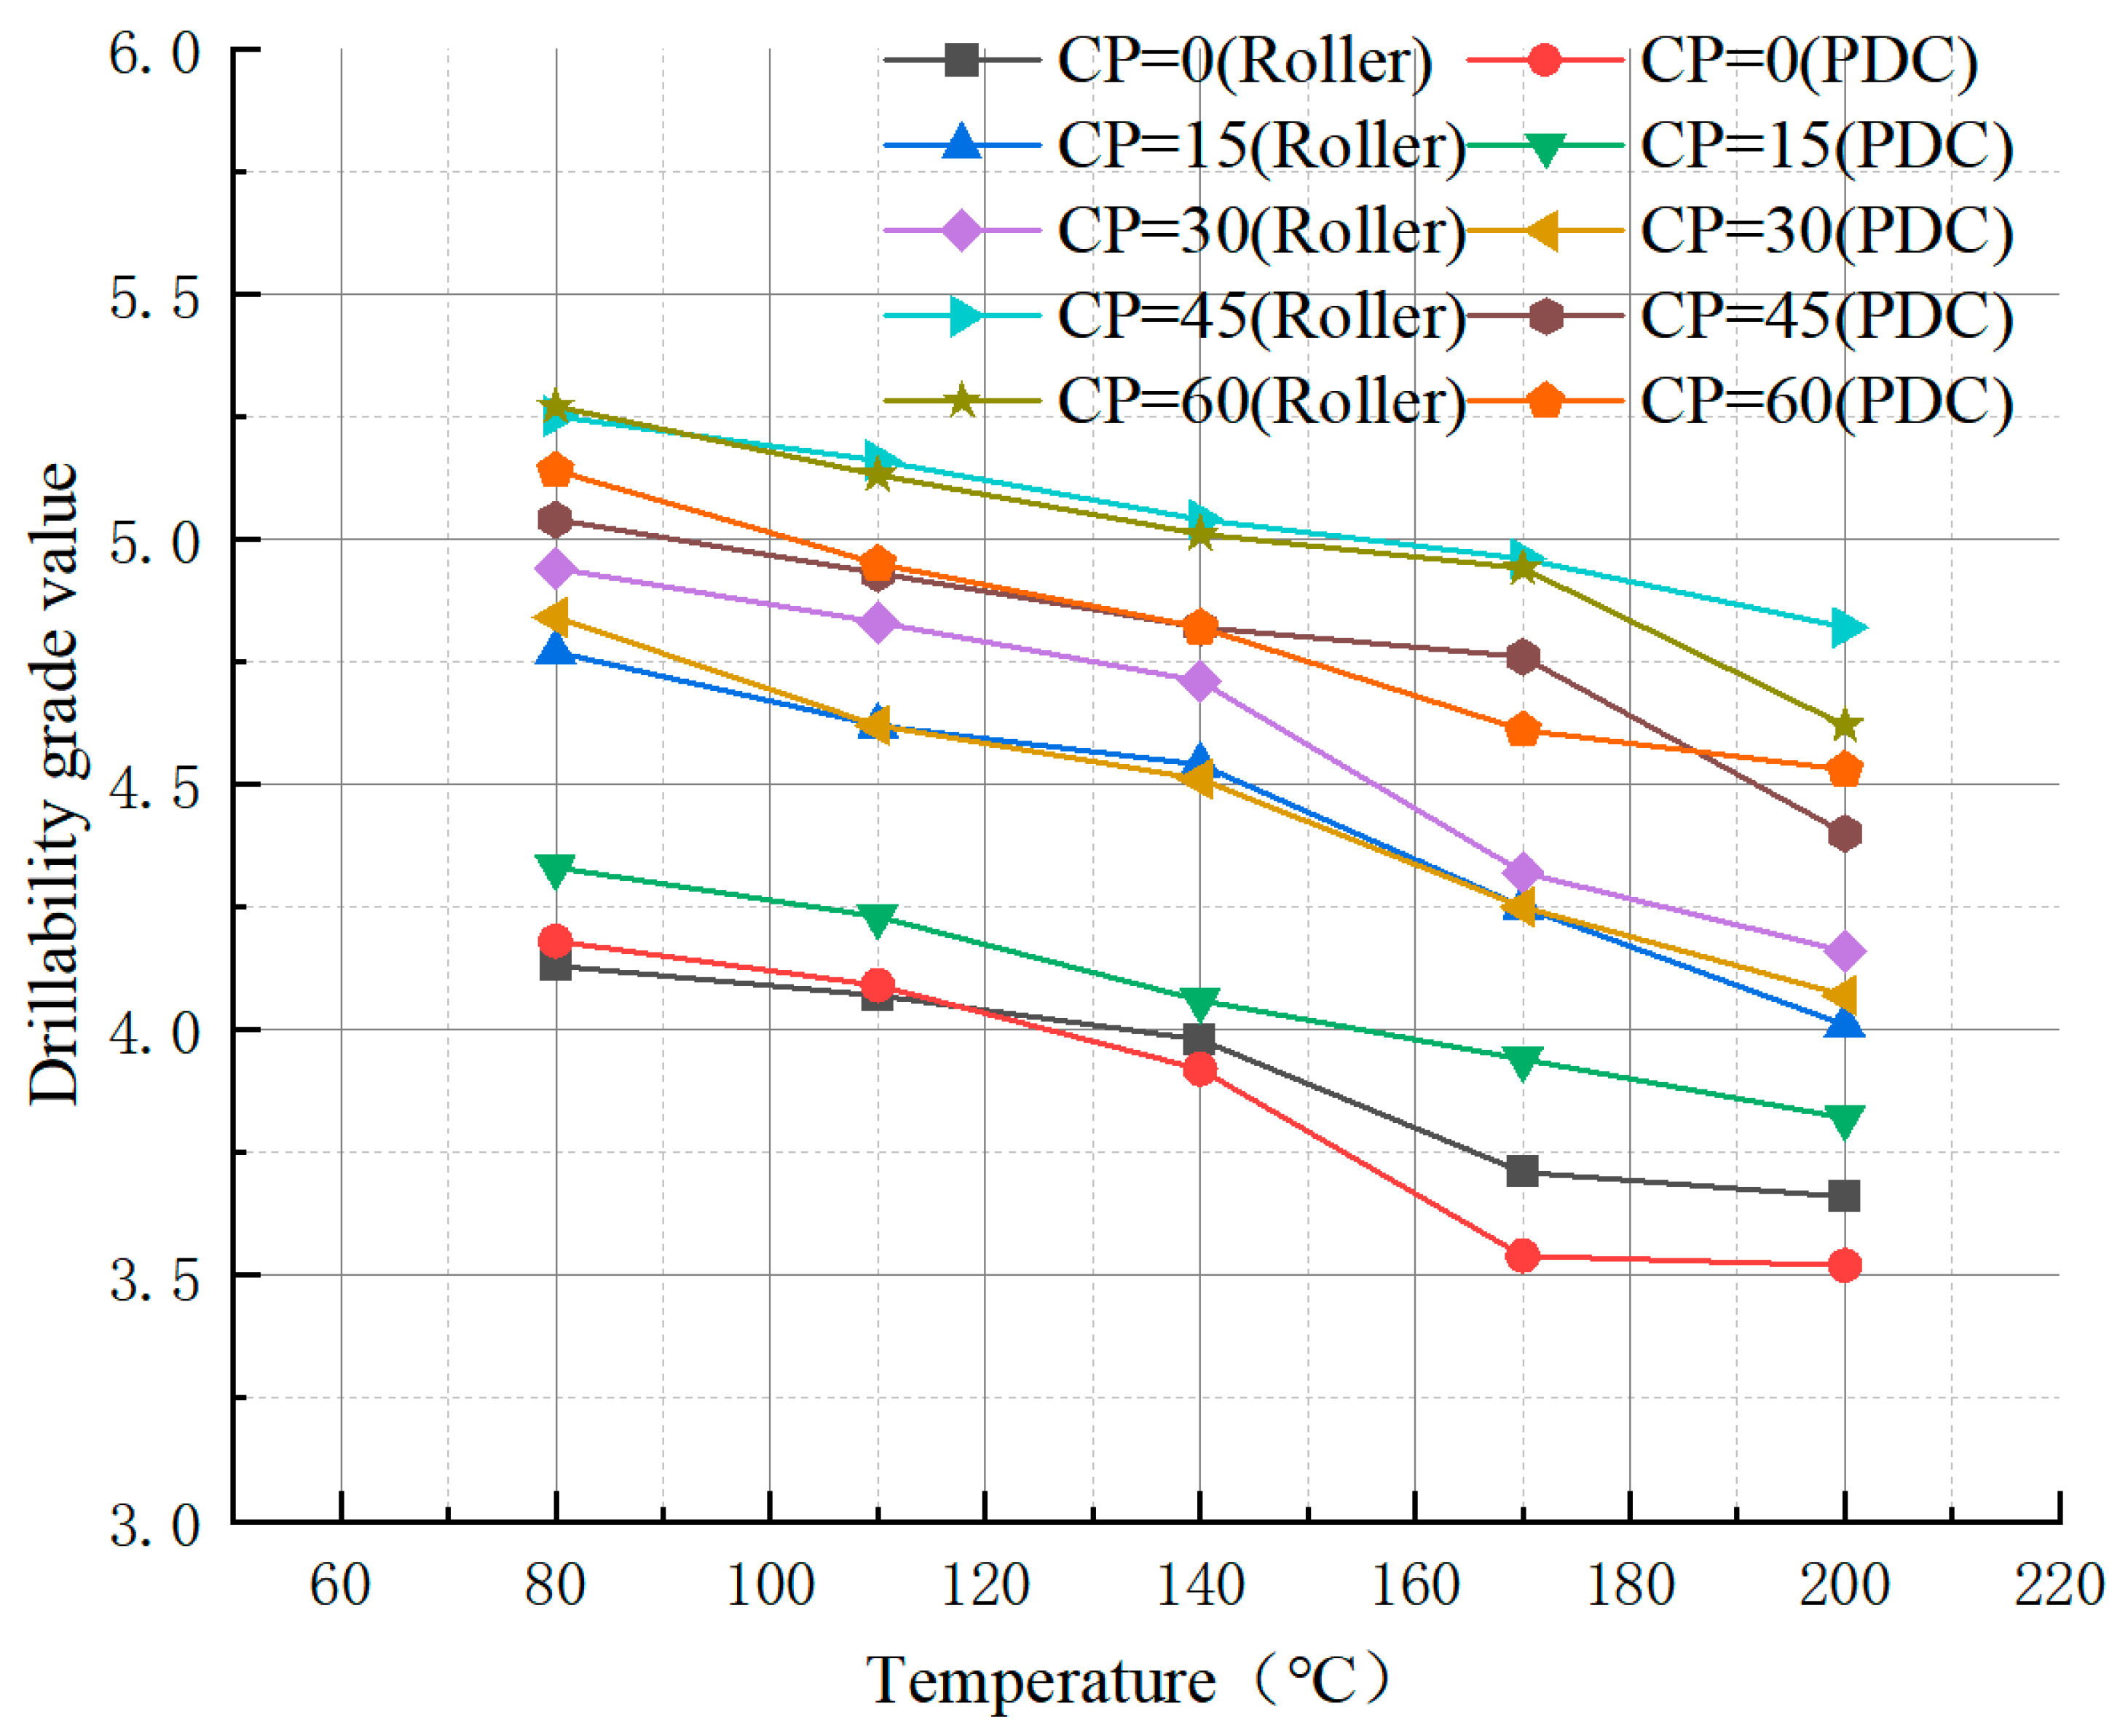
Indoor tests and simulation analysis revealed that with increasing confining pressure, the drilling feasibility values of rocks increased. In particular, after the confining pressure increased to 30 MPa, the drilling feasibility values of rocks significantly increased. As the temperature rose, however, the drilling feasibility values of rocks decreased, and beyond 140 °C, the values decreased markedly.
(3)
Finite element simulation calculated the drilling feasibility values of rocks under high temperature and pressure conditions, showing an error of less than 10% compared to indoor drilling feasibility test results. This indicates the accuracy and reliability of indoor experimental data in guiding field production practices.
(4)
Based on the drilling feasibility test results of rocks, it is recommended to use PDC bits at this layer. The selected PDC bits successfully drilled through the target layer using only 9 bits, achieving a mechanical drilling speed of 2.38 m/h per bit, which is 2.4 times higher than previous rates, meeting the expected performance.

Author Contributions

Conceptualization, T.C.; Methodology, G.L.; Software, L.Z.; Investigation, Y.W. and H.Q.; Data curation, Q.F.; Writing—original draft, W.C. All authors have read and agreed to the published version of the manuscript.

Funding

This research received no external funding.

Data Availability Statement

The original contributions presented in the study are included in the article, further inquiries can be directed to the corresponding author.

Conflicts of Interest

Authors Tianhui Cheng, Guolun Li, Yarong Wang, Hailong Qin, Qiang Fu were employed by the Korla Branch, Bohai Drilling Engineering Company Limited. The remaining authors declare that the research was conducted in the absence of any commercial or financial relationships that could be construed as a potential conflict of interest. The company had no role in the design of the study; in the collection, analyses, or interpretation of data; in the writing of the manuscript, or in the decision to publish the results.

References

  1. Liu, G.; Zha, C.; Chen, T.; Wang, W. Several key issues in safe and efficient development of deep and ultra-deep oil and gas and corresponding new solutions. Pet. Drill. Tech. 2024, 52, 24–30. [Google Scholar]
  2. Gao, D.; Huang, W. Research and development suggestions on theory and techniques in ultra-deep well engineering. Pet. Drill. Tech. 2024, 52, 1–11. [Google Scholar]
  3. Mensa-Wilmot, G.; Calhoun, B.; Perrin, V.P. Formation drillability-definition, quantification and contributions to bit performance evaluation. In SPE/IADC Middle East Drilling Technology Conference and Exhibition; SPE: Richardson, TX, USA, 1999; p. SPE-57558-MS. [Google Scholar]
  4. Wei, S.; Meng, Y.; Shi, X.; Tang, H.L. The experiment of Rock drillability and Simulation Research under the Condition of Bottom Hole Pressure. Sci. Technol. Eng. 2016, 16, 271–274. [Google Scholar]
  5. Guan, Y.; Zhu, H.; Liu, Q.; Luo, M.; Zhang, C.; Dai, X.; Wei, W.; Deng, X. A new model for evaluating rock drillability considering the rock plasticity and chip hold down effect caused by hydrostatic column pressure under high confining pressure. Geoenergy Sci. Eng. 2023, 227, 211806. [Google Scholar] [CrossRef]
  6. Peng, N.; Ma, T.; Zhu, G.; Su, Q. Anti-drilling ability of Ziliujing conglomerate formation in Western Sichuan Basin of China. Petroleum 2023, 9, 41–52. [Google Scholar] [CrossRef]
  7. Xiaofeng, X.; Wei, S.; Kuanliang, Z.; Changhao, W.; Yan, Z.; Yunfeng, L.; Shibin, L. PDC bit optimization scheme for tight oil reservoirs in the Jidong Oilfield based on rock anti-drilling characteristics. J. Pet. Explor. Prod. Technol. 2022, 12, 2869–2881. [Google Scholar] [CrossRef]
  8. Zhang, H.; Zhao, M.K.; Song, Z.; Miao, X.; Wang, S.; Gao, D.L. Quantitative Prediction of Rock Drillability in Various Drilling Directions in Shale Formation. In Proceedings of the 2017 International Conference on Energy, Power and Environmental Engineering (ICEPEE2017), Shanghai, China, 23–24 April 2017; College of Petroleum Engineering, China University of Petroleum: Qingdao, China; Sinopec Chongqing Fuling Shale Gas Exploration and Development Company: Chongqing, China, 2017; Volume 7. [Google Scholar]
  9. Li, G.; Yang, M.; Meng, Y.; Liu, H.; Han, L.; Zhou, F.; Zhang, H. The assessment of correlation between rock drillability and mechanical properties in the laboratory and in the field under different pressure conditions. J. Nat. Gas Sci. Eng. 2016, 30, 405–413. [Google Scholar] [CrossRef]
  10. Li, Z.; Fang, M.; Yang, K.; Lou, Y.; You, Y. A new method for defining the rock drilling resistance: Five-parameter method. Oil Drill. Prod. Technol. 2018, 40, 412–416. [Google Scholar]
  11. Ji, H.; Zhu, L.; Lou, Y. Evaluation and application of rock drillability of deep thermobaric strata in the South China Sea. Sci. Technol. Eng. 2022, 22, 14707–14713. [Google Scholar]
  12. Li, Q.; Zhang, H.S.; Qiu, K. Research on the rock drillability prediction methods ol deep strata in the East China Sea. China Offshore Oil Gas 2020, 32, 126–133. [Google Scholar]
  13. Kahraman, S.; Alber, M. Estimating unconfined compressive strength and elastic modulus of a fault breccia mixture of weak blocks and strong matrix. Int. J. Rock Mech. Min. Sci. 2006, 43, 1277–1287. [Google Scholar] [CrossRef]
  14. Yang, Y.X.; Gao, X.; Chen, H. A new method for measuring and grading of PDC bit rock drillability. Chin. J. Undergr. Space Eng. 2019, 15, 811–819. [Google Scholar]
  15. SY/T 5426-2016; The Rock Drillability Testing and Grading Method for Oil and Gas Well Drilling Engineering. Nation Energy Administration: Beijing, China, 2016. (In Chinese)
  16. Ma, X.; Cheng, W.; Zhu, L. Study and Application of Rock Drilling Resistance Characteristics in the Jiyang Depression Formation. Processes 2024, 12, 952. [Google Scholar] [CrossRef]
  17. Jin, P.; Hu, Y.; Shao, J.; Liu, Z.; Feng, G.; Song, S. Influence of temperature on the structure of pore–fracture of sandstone. Rock Mech. Rock Eng. 2020, 53, 1–12. [Google Scholar] [CrossRef]
  18. Xiong, J.; Zhu, M.; Li, W.; Wei, J.; Liu, X.; Liang, L.; Lin, S. Evolution law of physical properties of rocks with different lithologies under high temperature. Nat. Gas Ind. 2023, 43, 14–24. [Google Scholar]
  19. Liu, J.; Zheng, H.; Kuang, Y.; Xie, H.; Qin, C. 3D numerical simulation of rock cutting of an innovative non-planar face PDC cutter and experimental verification. Appl. Sci. 2019, 9, 4372. [Google Scholar] [CrossRef]
  20. Liu, W.; Luo, Y.; Zhu, X.; Yang, F. The ductile–brittle failure mode transition of hard brittle rock cutting—New insights from numerical simulation. Geomech. Geophys. Geo-Energy Geo-Resour. 2022, 8, 129. [Google Scholar] [CrossRef]
  21. Zhao, Y.; Zhang, C.; Zhang, Z.; Gao, K.; Li, J.; Xie, X. The rock breaking mechanism analysis of axial ultra-high frequency vibration assisted drilling by single PDC cutter. J. Pet. Sci. Eng. 2021, 205, 108859. [Google Scholar] [CrossRef]
  22. Liu, W.; Zhu, X.; Li, B. The rock breaking mechanism analysis of rotary percussive cutting by single PDC cutter. Arab. J. Geosci. 2018, 11, 192. [Google Scholar] [CrossRef]
Figure 1. High-temperature high-pressure rock drillability equipment.
Processes 12 01626 g001
Figure 2. Drillability Levels of Rocks under Different Confining Pressures.
Processes 12 01626 g002
Figure 3. Drillability Levels of Rocks at Different Temperatures.
Processes 12 01626 g003
Figure 4. Drillability Levels of Rocks Under Coupled Temperature and Pressure Effects.
Processes 12 01626 g004
Figure 5. Drill Pit Images from Drillability Tests with PDC Microdrill and Roller Cone Microdrill.
Processes 12 01626 g005
Figure 6. Micro-drilling rock-breaking model: (a) PDC Micro-drillability Rock Breaking Model; (b) Toothed Wheel Micro-drillability Rock Breaking Model.
Processes 12 01626 g006
Figure 7. Micro-drilling rock pit pattern: (a) PDC micro-drill; (b) Roller micro-drill.
Processes 12 01626 g007
Figure 8. The schematic diagram of the PDC bit after coming out of the well.
Processes 12 01626 g008
Table 1. Rock Drillability Grading Table [15].
NumberGrade K d Drilling Time t, sClassification
Roller BitPDC Bit
FirstSecondThird
1I K d < 2t < 22t < 22 I (Soft)
2II2 ≤ K d < 322 ≤ t < 2322 ≤ t < 23
3III3 ≤ K d < 423 ≤ t < 2423 ≤ t < 2422 ≤ t < 23
4IV4 ≤ K d <524 ≤ t < 2524 ≤ t < 2523 ≤ t < 24
5V5 ≤ K d <625 ≤ t < 2625 ≤ t < 2624 ≤ t < 2522 ≤ t < 23II (Medium)
6VI6 ≤ K d < 726 ≤ t < 2726 ≤ t < 2725 ≤ t < 2623 ≤ t < 24
7VII7 ≤ K d < 827 ≤ t < 28 26 ≤ t < 2724 ≤ t < 25
8VIII8 ≤ K d < 928 ≤ t < 29 25 ≤ t < 26III (Hard)
9IX9 ≤ K d < 1029 ≤ t < 210 26 ≤ t < 27
10X K d ≥ 10210 ≤ t < 211
Table 2. Rock Drillability Grade Value Test Results.
NumberDepth/mTemperature (°C)CP (MPa) K r d K p d
13872 ~ 38902004.534.26
220154.664.39
320304.724.46
420455.254.92
520605.935.86
73905 ~ 39205004.254.26
88004.134.18
911004.074.09
1014003.983.92
1117003.713.54
1220003.663.52
133950 ~ 397050155.014.68
1480154.774.33
15110154.624.23
16140154.544.06
17170154.253.94
18200154.013.82
193985 ~ 400550305.325.01
2080304.944.84
21110304.834.62
22140304.714.51
23170304.324.25
24200304.164.07
254020 ~ 403550455.405.06
2680455.255.04
27110455.164.93
28140455.044.82
29170455.274.76
30200454.824.40
314080 ~ 409550605.485.25
3280605.275.14
33110605.134.95
34140605.014.82
35170604.944.61
36200604.624.53
Table 3. Physical and mechanical parameters of each material in the model [21].
MaterialDensity (g/cm3)Elastic
Modulus/GPa
Poisson’s RatioCompressive Strength/MPaInternal Friction Angle (°)
PDC3.548900.077--
Glutenite2.4529.20.2468.143.25
Table 4. Simulation Results of Micro Roller Cone Bit and Micro PDC Bit Drilling Capability.
NumberCP/MPaTemperature/℃ t R /s K r d Test ValueError Rate (%) t P /s K p d Test ValueError Rate (%)
1012038.325.264.926.91114.464.643.88
21512044.025.464.989.649.784.294.586.33
33012065.346.035.637.1013.934.805.238.22
44512076.116.255.847.0234.786.125.864.44
56012081.016.345.976.2047.186.566.146.84
63014062.68 5.124.718.84 13.55 4.764.515.54
73017056.494.654.329.18 8.57 4.104.253.54
83020043.714.554.165.97 6.32 4.014.071.47
Disclaimer/Publisher’s Note: The statements, opinions and data contained in all publications are solely those of the individual author(s) and contributor(s) and not of MDPI and/or the editor(s). MDPI and/or the editor(s) disclaim responsibility for any injury to people or property resulting from any ideas, methods, instructions or products referred to in the content.

