Article

Study on the Structural Characteristics of Bulb Tubular Pumps Based on Fluid–Structure Interaction

1
Research Center of Fluid Machinery Engineering and Technology, Jiangsu University, Zhenjiang 212013, China
2
Power China Guiyang Engineering Corporation Limited, Guiyang 550081, China
3
General Irrigation Canal Management Office of Jiangsu Province, Huai’an 223001, China
4
Engineering Research Center of High-Efficiency and Energy-Saving Large Axial Flow Pumping Station, Yangzhou University, Yangzhou 225009, China
5
Department of Energy and Power Engineering, Tsinghua University, Beijing 100084, China
*
Author to whom correspondence should be addressed.
Processes 2024, 12(8), 1641; https://doi.org/10.3390/pr12081641
Submission received: 19 June 2024 / Revised: 25 July 2024 / Accepted: 2 August 2024 / Published: 4 August 2024

Abstract

:
As a special type of through-flow device, bulb turbine pumps have been widely used in the Eastern Route of the South-to-North Water Diversion Project due to their compact structure, flexible installation process, easy maintenance, high efficiency, and strong adaptability. Therefore, structural improvements to enhance their safety and stability through fluid–structure interaction analysis have significant engineering value. This paper conducts static and transient fluid–structure interaction analyses of the bulb turbine pump structure. The results show that the rotor structure experiences the greatest deformation under low-flow conditions, with maximum deformation (2.13 mm) occurring at the leading edge of the impeller inlet and decreasing radially along a gradient distribution. The damping effect of water changes the mode shapes of the rotor structure, and although the vibration modes under wet conditions are similar to those in the air, the frequencies decrease to varying degrees. In transient analyses under different conditions, the total deformation of the rotor system is greater than in static analyses, showing significant regularity. Under low-flow conditions, the deformation of the pressure surface at the inlet and outlet of the blade tip is greater than that of the suction surface, with a maximum total deformation of 3.656 mm. The maximum total deformation under design flow is 3.337 mm; under high flow, it is 2.646 mm. The total deformation of the casing mainly occurs on both sides of the internal bulb body bottom support, with a maximum deformation of 2.0355 mm and an equivalent stress maximum of 44.848 MPa. The equivalent stress and total deformation distribution of the support structure are similar, located at the top support and trailing edge, with a maximum value of 22.94 MPa at the trailing edge. The research results provide technical references and theoretical foundations for the structural optimization of bulb turbine pumps.

1. Introduction

The South-to-North Water Diversion Project is a strategic inter-basin initiative being implemented in China to alleviate water shortages in the northern regions. It is also one of the largest water diversion projects in the world. Bulb turbine pumps are used extensively in this project due to their high flow rates, low head, high efficiency, and high reliability. The project consists of three main water diversion routes: the Eastern, Central, and Western routes. With the advancement of Eastern Route phase two, higher standards of reliability are required for the bulb turbine pumps to meet the demands of long-distance and large-scale water transfer. As a special type of axial flow pump, bulb turbine pumps encounter various loads during operation [1] that can cause structural vibrations or damage, seriously threatening the safety and stability of the device [2]. The rotor is the core component of the pump, but stress and impact loads may cause blade deformation or cracking [3,4,5]. The internal support structure of the bulb body is also susceptible to damage from loads due to its unique design. Consequently, the structural strength of bulb turbine pumps has garnered increasing attention from professionals in the field.
In recent years, the combination of Computational Fluid Dynamics (CFD) and Finite Element Analysis (FEA) has provided a fast and precise solution for analyzing the structural characteristics of pump devices [6]. Shi et al. [7] compared the structural strength and modal characteristics of tubular pumps and axial pumps using fluid–structure interaction (FSI) methods, finding that the blade deformation and equivalent stress distribution trends in tubular pumps were generally consistent under different flow conditions but decreased with increasing flow. Tubular pumps had lower natural frequencies compared to axial pumps. Pei et al. [8] conducted a quantitative analysis of the deformation and stress distribution of axial pump impellers using FSI methods, discovering that maximum equivalent stress and total deformation significantly decreased as the flow increased and head decreased. Kan et al. [9] performed a comprehensive analysis of the dynamic stress characteristics of axial flow pump impeller blades using FSI methods, identifying maximum dynamic stress at the joint between the blade suction side root and the shaft. Considering gravity, blade dynamic stress fluctuated within a rotation cycle, with a greater relative fluctuation amplitude at the middle of the leading edge. Using FSI methods, Zhang et al. [10] carried out quantitative experiments on the fluid pressure pulsation and structural vibration characteristics of axial pumps and found that fluid pressure pulsation and structural vibration exhibited consistent time and frequency patterns at the same positions. Meng et al. [11] analyzed the fluid–structure interaction of reversible axial flow pump impellers in unstable regions using FSI, showing that maximum equivalent stress and total deformation under forward and reverse rotations were related to flow rates, thereby providing guidance for structural design and stability performance. Zhao et al. [12] explored the vibration and fluid-induced dynamic characteristics of mixed-flow pumps under FSI, revealing that the guide vane area experienced the highest stress and most severe deformation, with periodic variations in blade deformation and equivalent stress. Shi et al. [13] investigated axial flow pumps using numerical simulation and FSI calculations, finding that blade angle deviation increased the maximum equivalent stress and deformation of the impeller, particularly under high-flow conditions, with minimal impact on the natural modal vibration frequency. Wang et al. [14] conducted FSI analysis on vertical axial flow pumps, finding maximum effective stress at the front edge near the hub and lower stress at the trailing edge and tip. Li et al. [15] studied the structural strength and fatigue life of large vertical axial flow pump rotor systems under all operating conditions, showing that blade deformation and equivalent stress were generally higher in turbine mode than in pump mode. Using bidirectional FSI methods, Bai et al. [16] simulated the dynamic stress distribution of axial flow pumps under forward and reverse operations; they also conducted fatigue characteristic analysis and found consistent fatigue damage and stress distribution, with the most severe damage occurring at stress concentration points. Zang et al. [17] revealed that dynamic–static interference between the rotor and stator caused periodic equivalent stress on the blades, with the number of peaks and troughs matching the number of impeller blades within a rotation cycle. Trivedi et al. [18] analyzed the fluid excitation and rotor natural frequency of turbines under two operating states, attributing structural responses to the combined effects of material properties, fluid damping, and natural frequency. Hu et al. [19] accurately calculated the stress distribution patterns of mixed-flow pumps under various conditions using FSI, providing references for load analysis and the structural optimization of devices.
Based on the aforementioned content, current fluid–structure interaction (FSI) analyses primarily focus on rotor systems within pumps, particularly axial flow pumps. Given the stringent requirements of the South-to-North Water Diversion Project for bulb turbine pumps, conducting FSI analyses on these pumps can elucidate the relationship between fluid forces and structural responses, predict potential stresses and deformations under various operating conditions, and ensure the safe and reliable operation of the devices. Therefore, this paper employs finite element analysis and FSI calculations to study the response patterns and mechanical characteristics of the rotor system, outer casing, and internal supports, thereby providing a theoretical basis for vibration reduction, noise reduction, and the structural optimization of the devices.

2. Materials and Methods

2.1. Numerical Calculation Methods

2.1.1. Flow Control Equations and Turbulence Model

With the significant enhancement of computational power and the increasing maturity of Computational Fluid Dynamics (CFD) technology, three-dimensional CFD simulations have become the mainstream numerical method used in the pump field. These simulations can accurately model the complex flow phenomena within pumps. The governing equations of fluid flow are the core equations in fluid mechanics. For incompressible, Newtonian fluids, the governing equations typically include the continuity equation, the Navier–Stokes equations, and the energy equation.
The continuity equation describes the principle of mass conservation for the fluid [20]. For incompressible fluids, the continuity equation can be expressed as follows:
ρ t + ( ρ u ) x + ( ρ v ) y + ( ρ w ) z = 0 ,
where ρ is the fluid density; t is time; and u ,   v ,   w represents the components of the velocity vector in the respective directions.
For incompressible, Newtonian fluids, the energy equation is usually expressed as the temperature equation, which describes the variation in fluid temperature over time and space:
ρ c p ( T t + u T ) = k 2 T + ϕ ,
where ρ is the fluid density, C p is the specific heat capacity of the fluid, T is the fluid temperature, t is time, u is the velocity vector, ∇ is the gradient operator, k is the thermal conductivity, and ϕ is the heat generated due to viscous dissipation.
Turbulence models are mathematical models used to simulate and predict turbulent flows. Due to the complexity and randomness of turbulence, directly solving the Navier–Stokes equations for fluid motion requires significant computational resources. Therefore, turbulence models are commonly used in engineering applications to approximate turbulence effects. The main turbulence models include the standard k ε turbulence model, the RNG   k ε model, and the Reynolds Stress Model (RSM).
The SST   k ω turbulence model combines the advantages of the standard k ε model and the RNG   k ε model, improving the accuracy of predictions for different flow characteristics, especially when dealing with near-wall flows and flow separation [21]. The transport equations for turbulent kinetic energy and the specific dissipation rate are as follows:
( ρ k ) t + ( ρ k u i ) x i = P k β * ρ k ω + x j [ ( μ + σ k μ t ) k x j ] ,
( ρ ω ) t + ( ρ ω μ i ) z i = α ω k P k β ρ ω 2 + z j [ ( μ + σ ω μ t ) ω x j ] , + 2 ( 1 F 1 ) ρ σ ω 2 1 ω k x j ω x j ,
where P k is the turbulence production term, μ t is the turbulent viscosity, α ,   β ,   β ,   σ k ,   σ ω ,   σ ω 2 are model constants, and F1 is a blending function.

2.1.2. Finite Element Analysis and Fluid Structure Coupling Theory

Finite element analysis (FEA) is widely used in engineering to simulate and predict physical phenomena. This technique breaks down complex entities or systems into smaller, simpler parts (called “finite elements”) that form an interconnected mesh, simplifying the computation and analysis process. In pump design, FEA is used to assess structural strength and durability. Fatigue analysis using finite elements can predict the lifespan of critical components and help plan maintenance strategies to prevent unexpected failures.
Fluid–structure interaction (FSI) describes the phenomena and computational methods for interactions between fluids and structures. In many engineering applications, the interaction between fluid dynamics and structural responses is crucial for the system’s performance and safety [22]. FSI analysis allows for the simultaneous consideration of fluid mechanics and structural mechanics behavior, supporting more precise and comprehensive engineering design and analysis. FSI can be categorized into two forms: One-way FSI is suitable for situations where the structure’s influence on the flow field is negligible. In this analysis, Computational Fluid Dynamics (CFD) first simulates the flow field around a fixed structure, calculating fluid dynamics parameters such as velocity and pressure distribution. These parameters are then input as external loads into FEA to calculate the structure’s stress, strain, and displacement [23]. Two-way FSI concerns the interaction between the structure and the fluid, especially when the structural response significantly impacts the flow field. In this method, CFD and FEA alternate, forming an iterative solving process. CFD first simulates the forces exerted by the fluid on the structure, then FEA assesses the deformation and stress caused by these forces. The structural deformation data are then fed back into the CFD model to adjust and update the flow field calculations. This analysis method is particularly suitable for cases where structural deformation significantly affects the flow field.
In the mechanical analysis module of Workbench, the equivalent stress usually refers to the Von Mises stress. This is a theory used to predict the yield of materials under complex stress conditions and is a key indicator for evaluating material strength and failure. The definition of equivalent stress is as follows:
σ v = 1 2 [ ( σ 1 σ 2 ) 2 + ( σ 2 σ 3 ) 2 + ( σ 3 σ 1 ) 2 ]
where σ 1 , σ 2 , σ 3 are the principal stresses of the material in three principal directions.

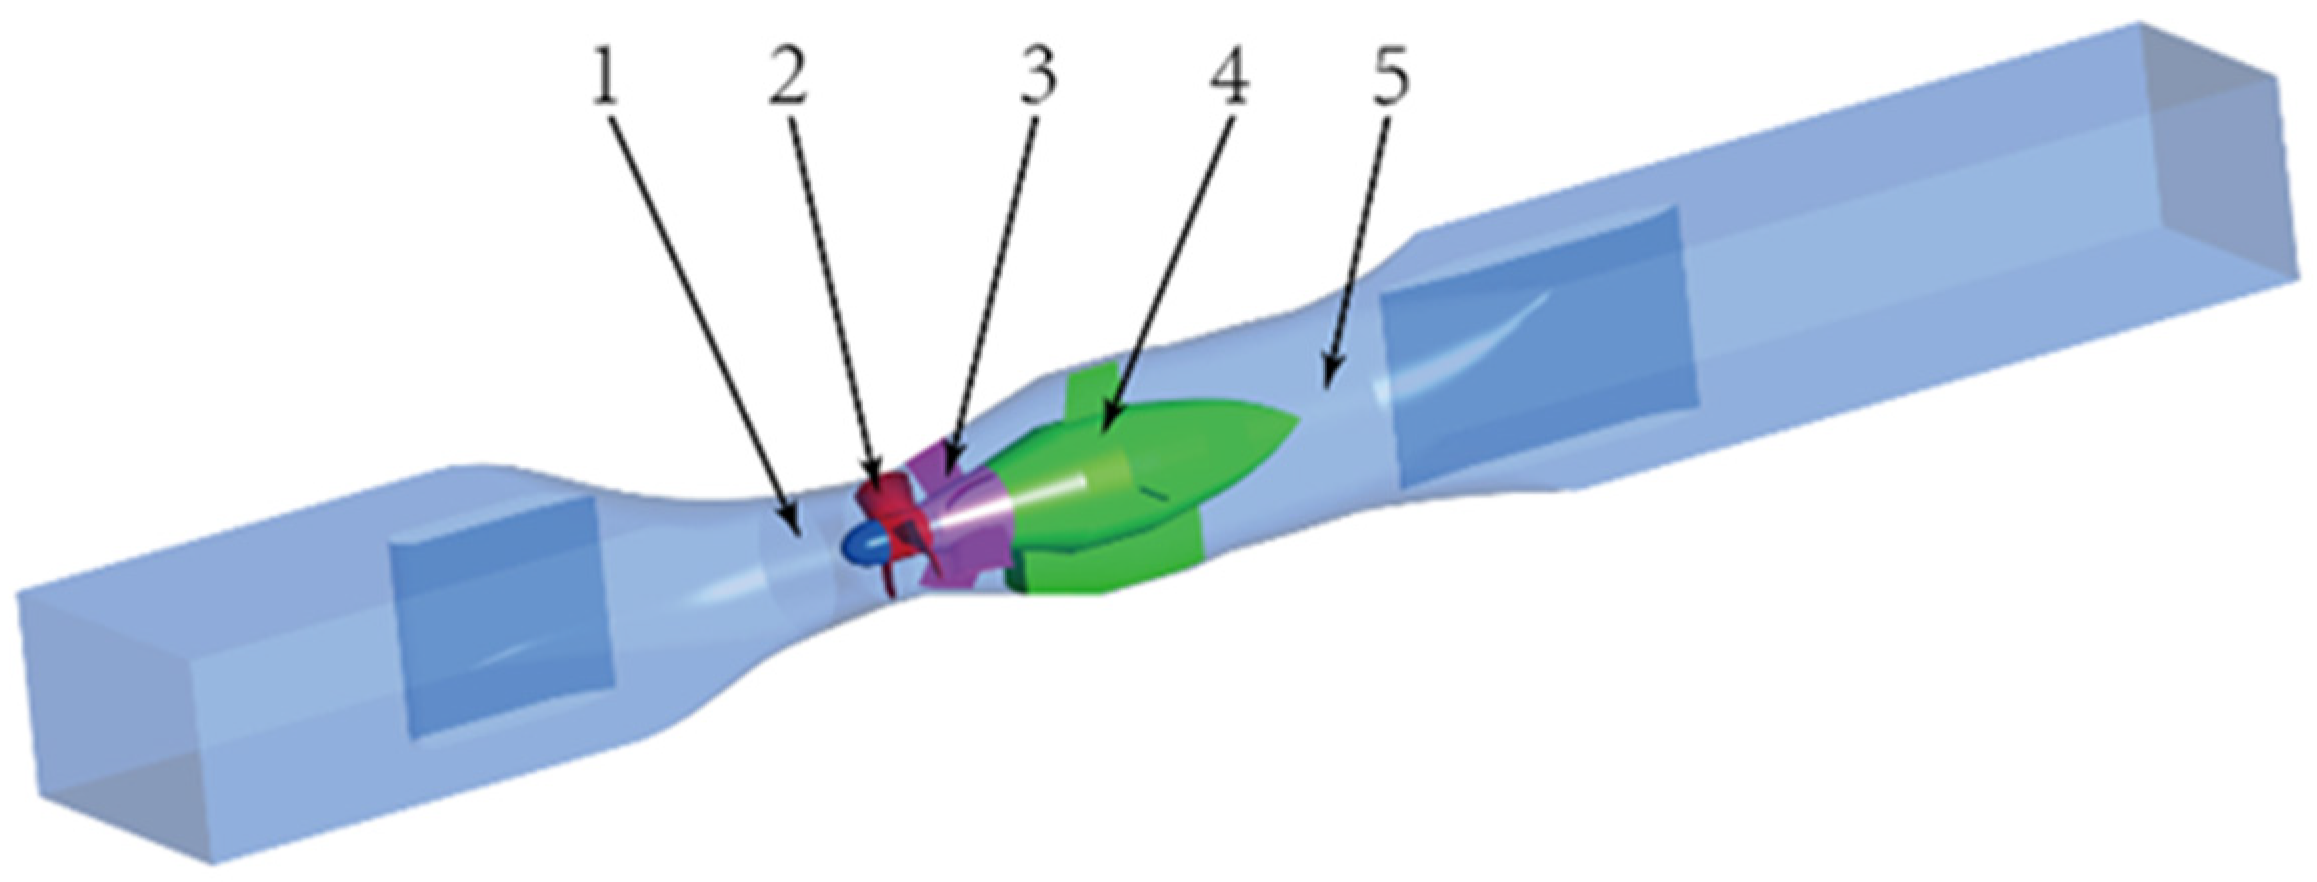
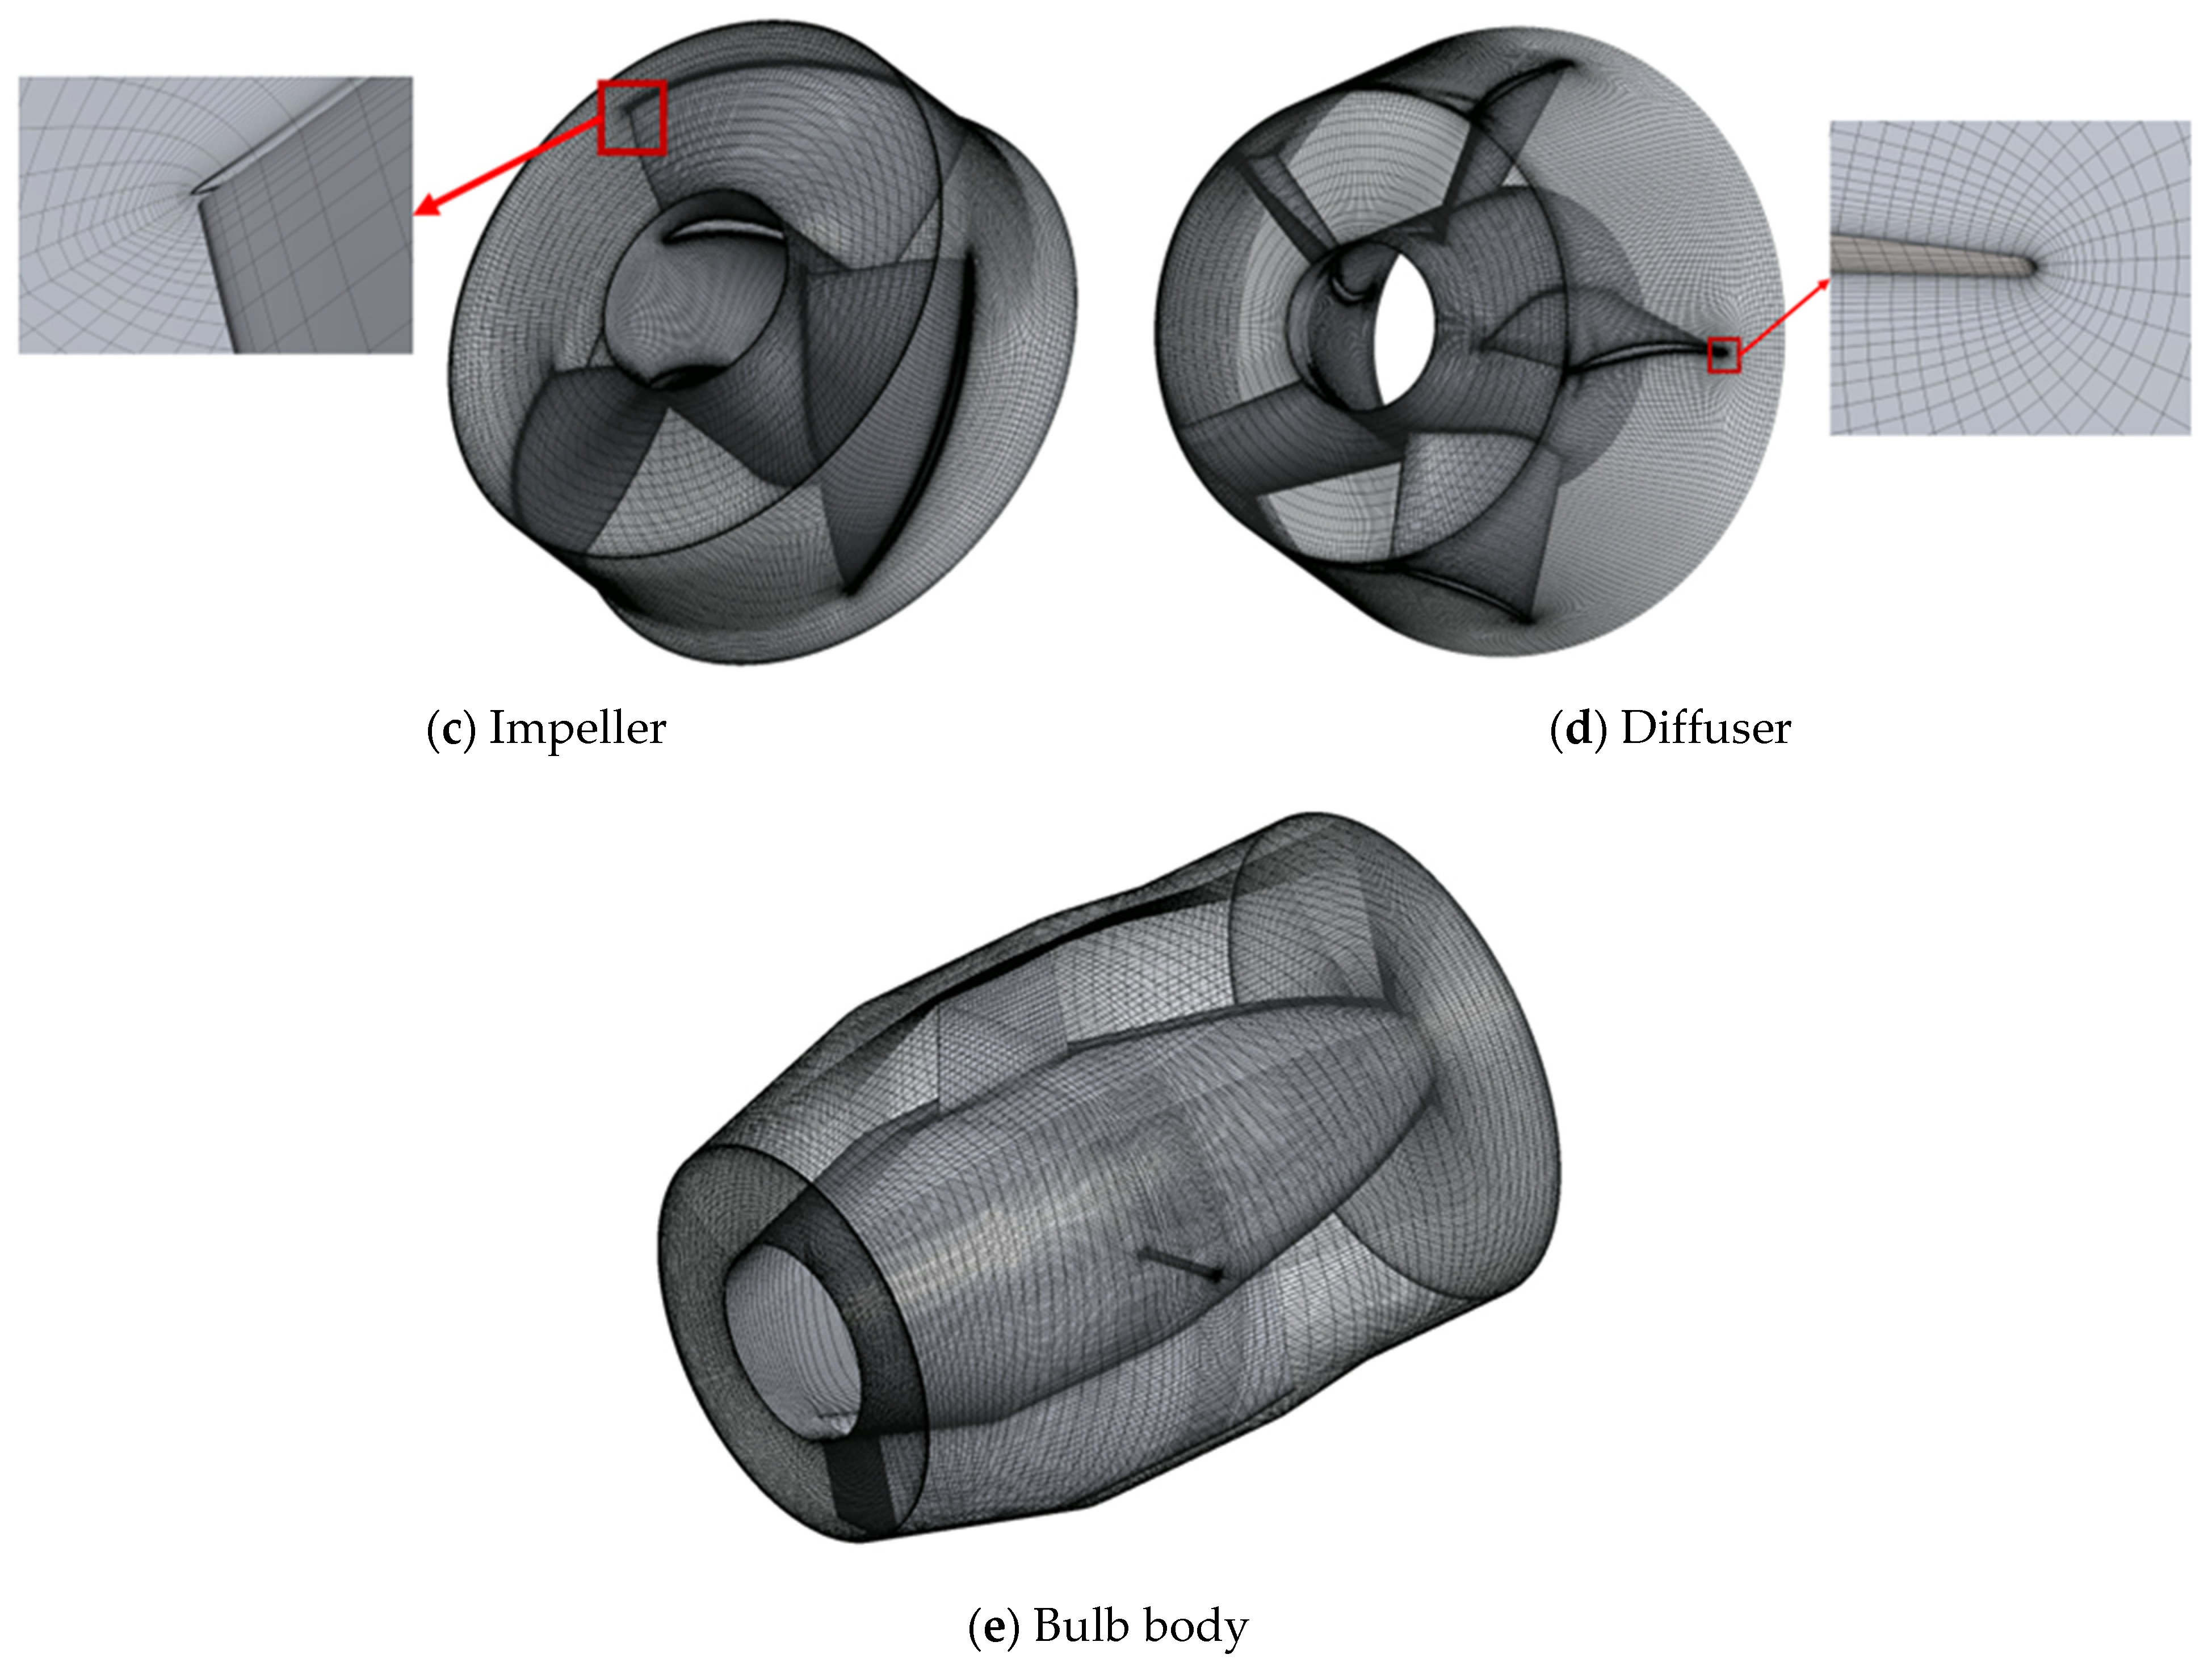
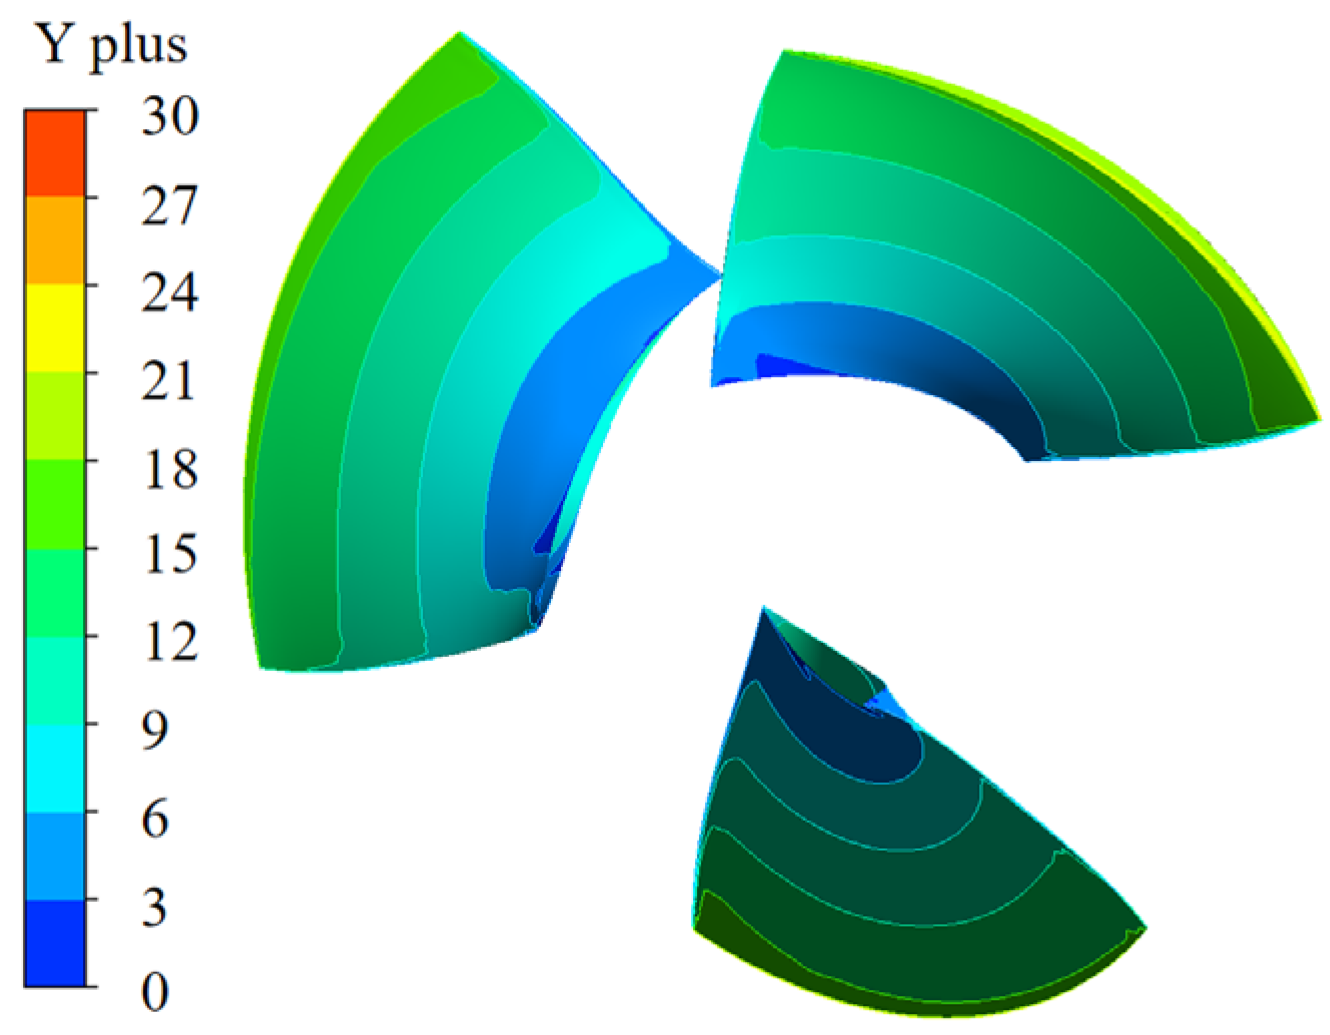
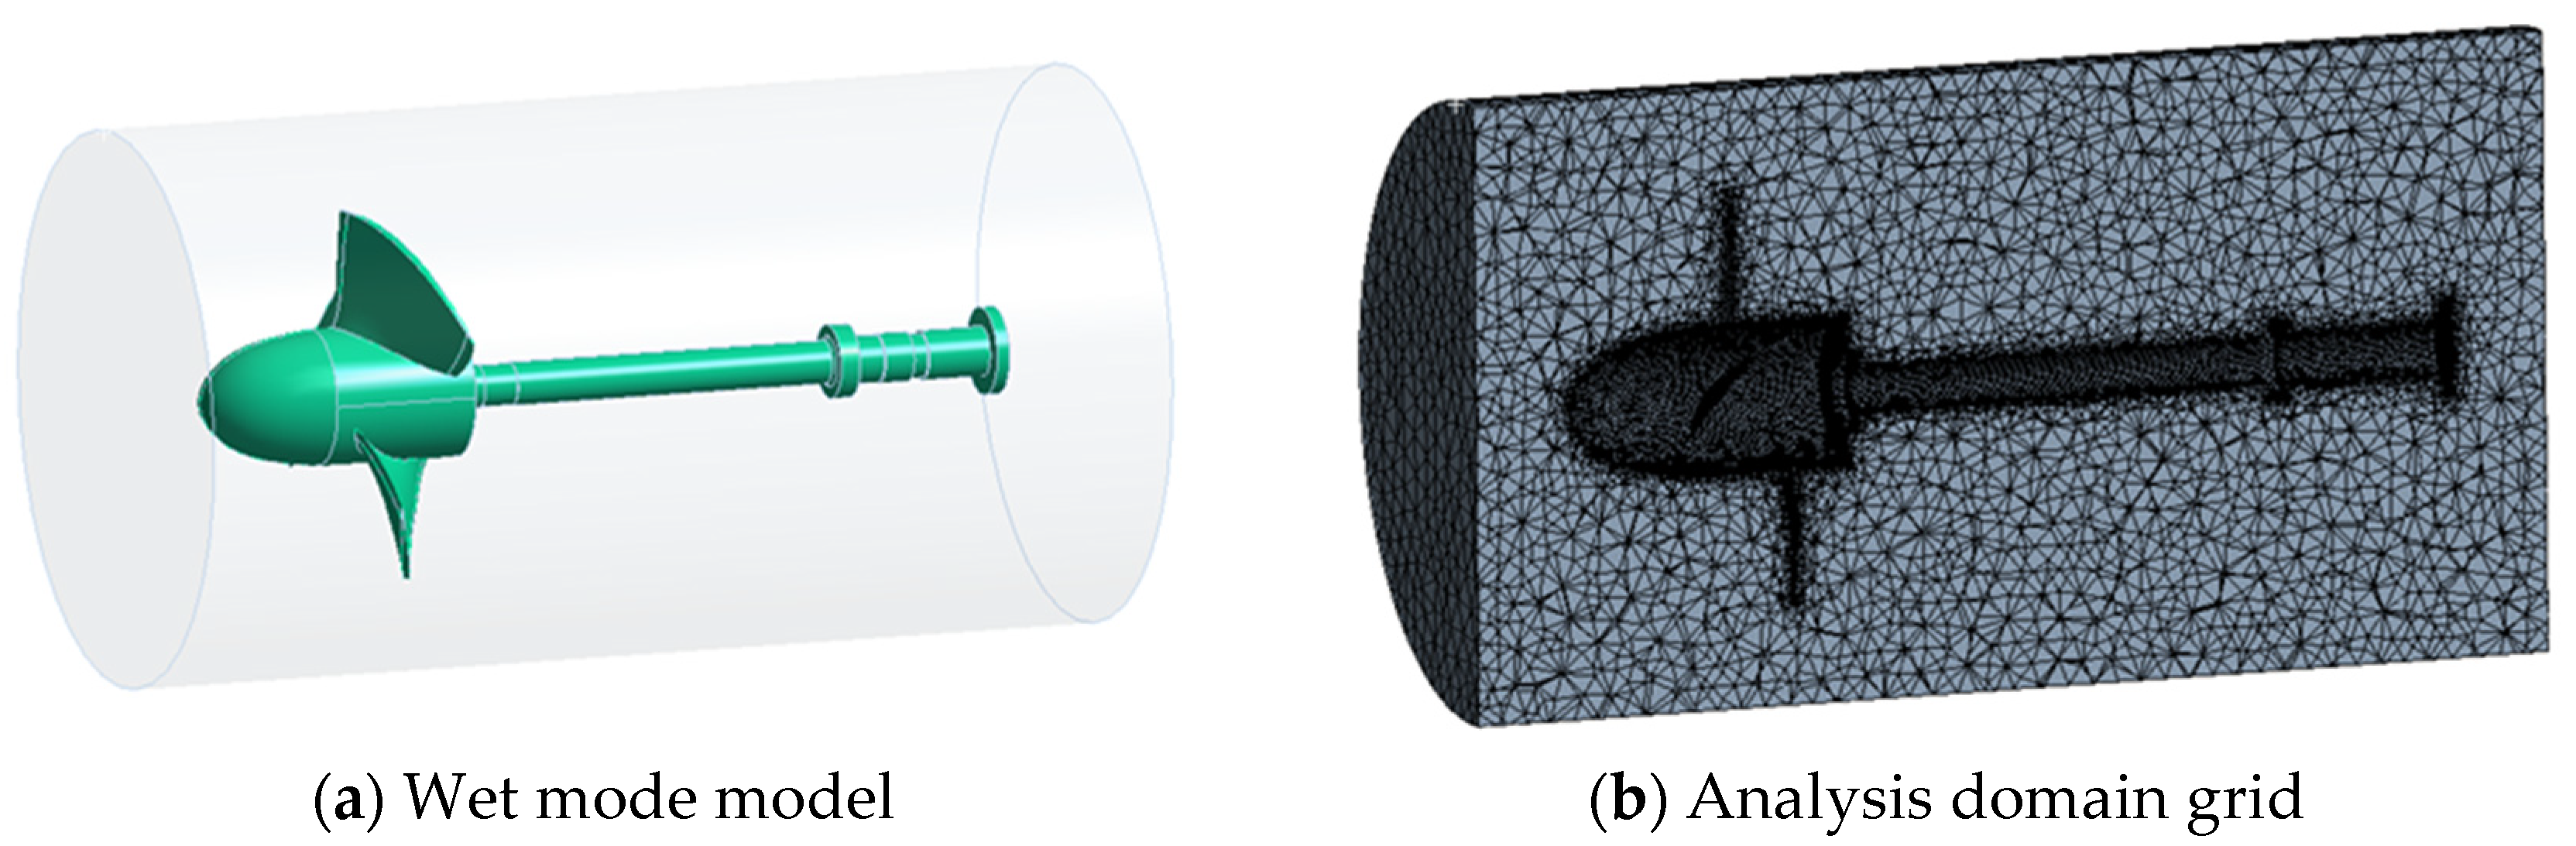
2.2. Model and Mesh Generation

This paper takes the large bulb turbine pump device used in the Eastern Route of the South-to-North Water Diversion Project as the research object. The basic design parameters of the device are a flowrate of 64 m3/s and rotational speed of 85.7 r/min. The main structural parameters include an impeller diameter D of 4300 mm, a blade tip δ = 5 mm , three impeller blades, and five guide vanes., a full-flow water body model of the bulb turbine pump assembly was created, dividing the fluid computation domain into the inlet flow channel, impeller, guide vane bulb body, and outlet flow channel. These parts constitute the computation area of the pump device, as shown in Figure 1. The pump conveys clean water, with a density of ρ = 1 g / cm 3 at normal temperature. The materials for the pump impeller and shaft are stainless steel, with a material density of ρ = 7850 kg / m 3 an elastic modulus of E = 200 GPa , a yield strength of 207 MPa , and a Poisson’s ratio of μ = 0.3.
The entire flow field was structured using hexahedral meshes with ANSYS ICEM and ANSYS TurboGrid to enhance numerical accuracy and flow field analysis capability. To more closely approximate the actual flow conditions, boundary layer meshes were employed for local refinement near the wall surfaces. The specific mesh diagram for the flow components is shown in Figure 2. According to numerical calculations, the impeller wall Y+ is shown in Figure 3.
First, eight mesh schemes were established; the grid numbers for each scheme are 3.04 million, 4.02 million, 4.96 million, 6.01 million, 7.04 million, 8.07 million, 8.99 million, and 9.97 million, and the external characteristics of the axial flow pump were calculated for each scheme. Figure 4 shows the validation curve for the mesh independence of the fluid computation domain: when the mesh number exceeds 7 million, the head and efficiency gradually stabilize with very little variation.
Therefore, considering the balance between computational resources and accuracy, a mesh count of 7 million was selected for subsequent analysis. This includes 1.5 million for the inlet flow channel, 1.73 million for the impeller mesh, 1.48 million for the guide vane mesh, 1.03 million for the bulb body structure mesh, and 1.26 million for the outlet flow channel mesh. The mesh quality reached 0.23, meeting the computational requirements.

2.2.1. Boundary Condition Settings

This study used ANSYS CFX to perform numerical simulations of a large bulb turbine pump device. The turbulence model adopted is the SST   k ω model. The inlet condition was set to total pressure, with a value of one atmospheric pressure, and the outlet condition was the mass flow rate. The working fluid used was clean water at 25 °C. All walls were set to no-slip conditions, and the rotor–stator interface was set as “Frozen Rotor”. Convergence was defined as a residual value less than 10 5 . The transient calculation time step is 0.00583431 s, which corresponds to an impeller rotation of 3°. Each cycle consists of 120 steps. The total calculation time is set to 10 times the rotational period, amounting to a total duration of 7.0011 s.

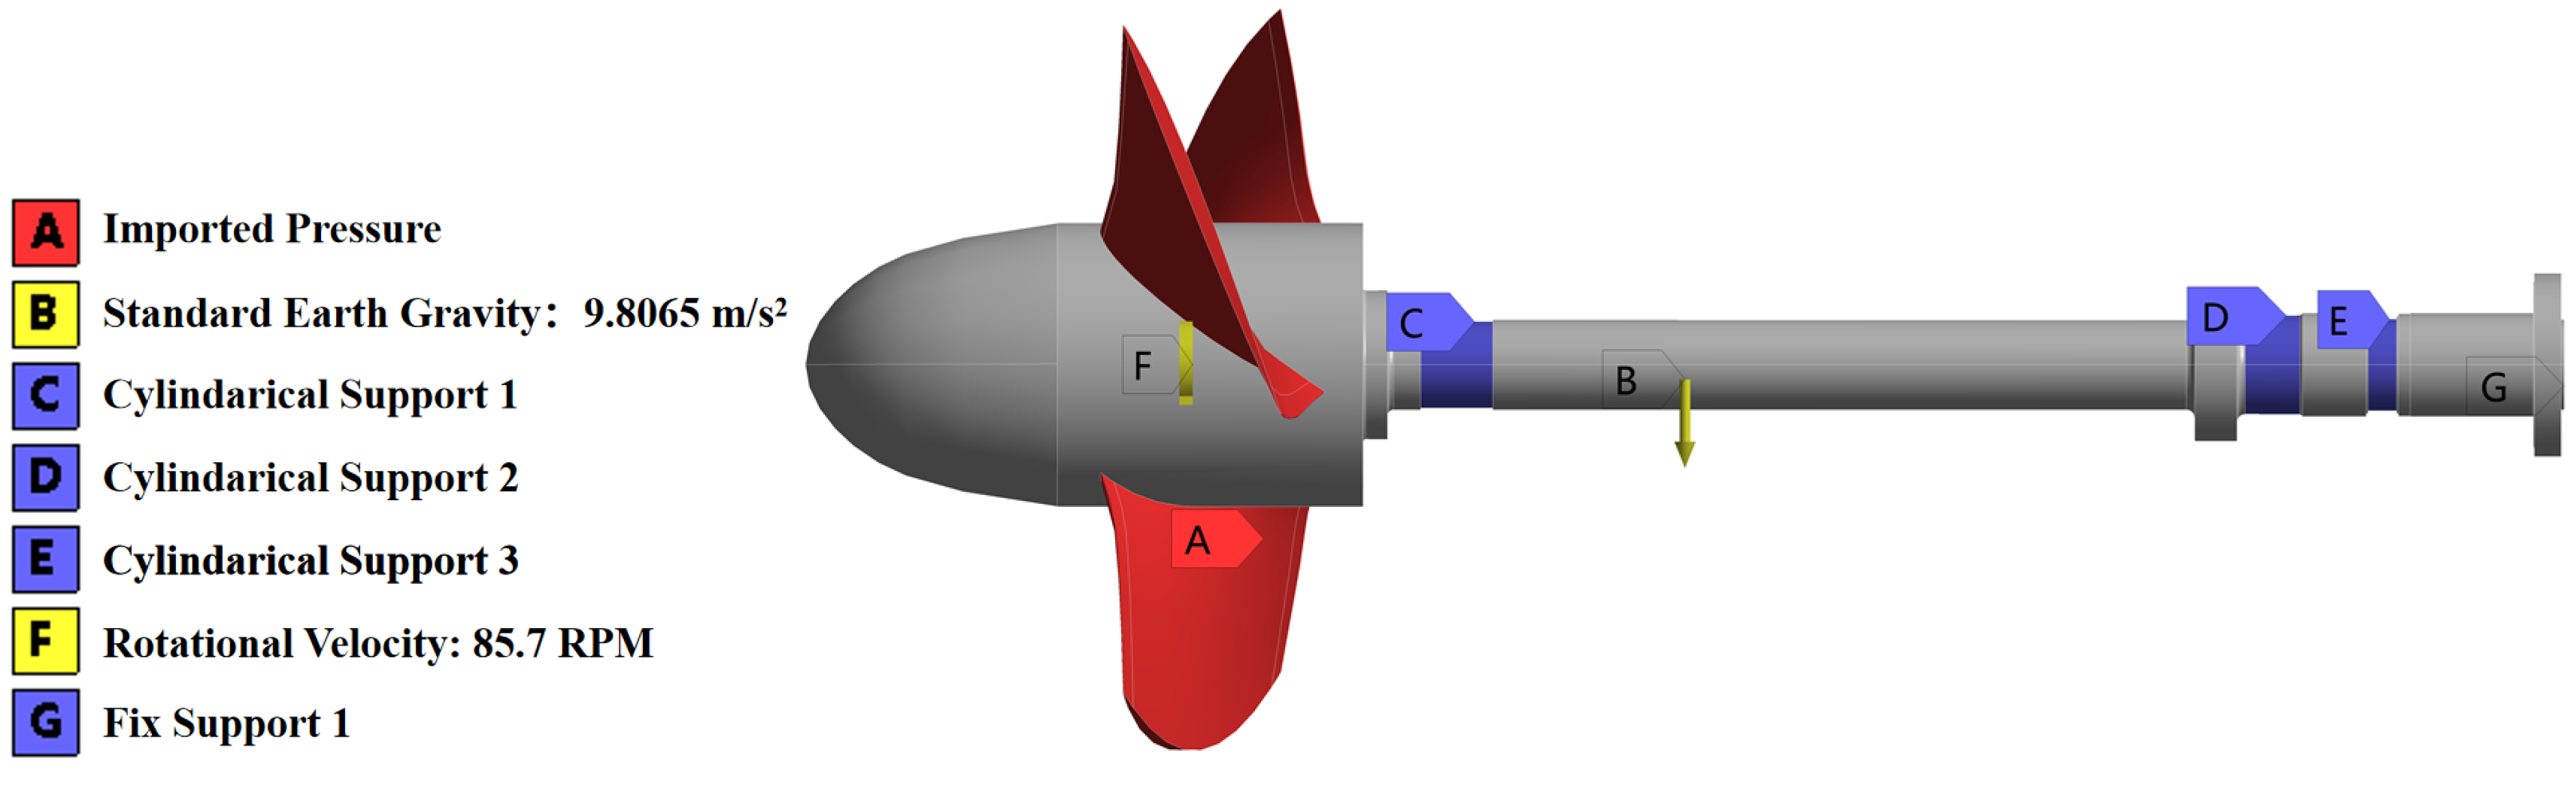
2.2.2. Rotor System Model and Computational Setup

The impeller’s airfoil and geometric parameters are crucial in the efficiency and stability of the device. Therefore, this section presents finite element analysis of the pump’s core components: the guide shell, impeller blades, and shaft.
The rotor structure was meshed for finite element analysis, and after conducting mesh independence analysis, the final mesh count was determined to be 326,000. The rotor material was assigned as structural steel with a density ρ = 7850 Kg / m 3 , an elastic modulus E = 200 GPa, a yield strength 207 MPa, and a Poisson’s ratio μ = 0.3 . The loads on the blades were fluid pressure, centrifugal force, and gravity. The rotor operates at a specified rotational speed. Therefore, a cylindrical support was applied to the middle of the pump shaft to ensure that the rotor rotated around the same axis and a fixed support was applied at the tail to prevent axial displacement. Specific information is shown in Figure 5.

2.2.3. Pump Casing and Internal Support Model and Computational Setup

The bulb turbine pumps used in the South-to-North Water Diversion Project are typically large. As the size of the device increases, so does the amount of material required for construction. Therefore, finite element analysis can be used to accurately determine the mechanical properties of the casing and support components, as well as the strength and stiffness requirements of the casing. This allows for a design that meets engineering needs while minimizing unnecessary material waste.
In practical engineering, the casing of a bulb turbine pump is usually fixed via concrete casting. Before casting, it is essential to select an appropriate support method for the casing. Pedestal support is widely used in engineering due to its stability, ease of installation, and cost-effectiveness. This paper presents a mechanical analysis of the complete casing support and the loads generated during actual operation to identify areas that need reinforcement and weight reduction, thereby achieving cost reduction and efficiency improvement.
The model of the bulb turbine pump device is shown in Figure 6.
The model was meshed in ANSYS Workbench, and after performing a mesh independence comparison, the final mesh count was determined to be 270,000. To accurately simulate the forces on the casing and supports during actual operation, the design flow rate from the previous analysis was applied to the inner wall surfaces of the casing. Additionally, static loads were applied to the supports and the outer wall surfaces of the casing according to the design parameters. The mesh details and model calculation settings are shown in Figure 7.
Conducting FSI analysis on the internal support structure of a bulb turbine pump provides deeper insights into the fluid flow characteristics within the pump and its impact on the support structure. By analyzing these forces and the pressure distribution, more stable and durable support structures can be designed, thereby reducing the risk of failure due to vibration or fatigue. Moreover, the calculated results enable the design of a more efficient and reliable internal support structure for the bulb turbine pump.
Figure 8 illustrates the following details: (a) the support structure model; (b) the meshed model, with a total of 27,000 elements; (c) the imported flow field pressure distribution; and (d) the calculation settings.

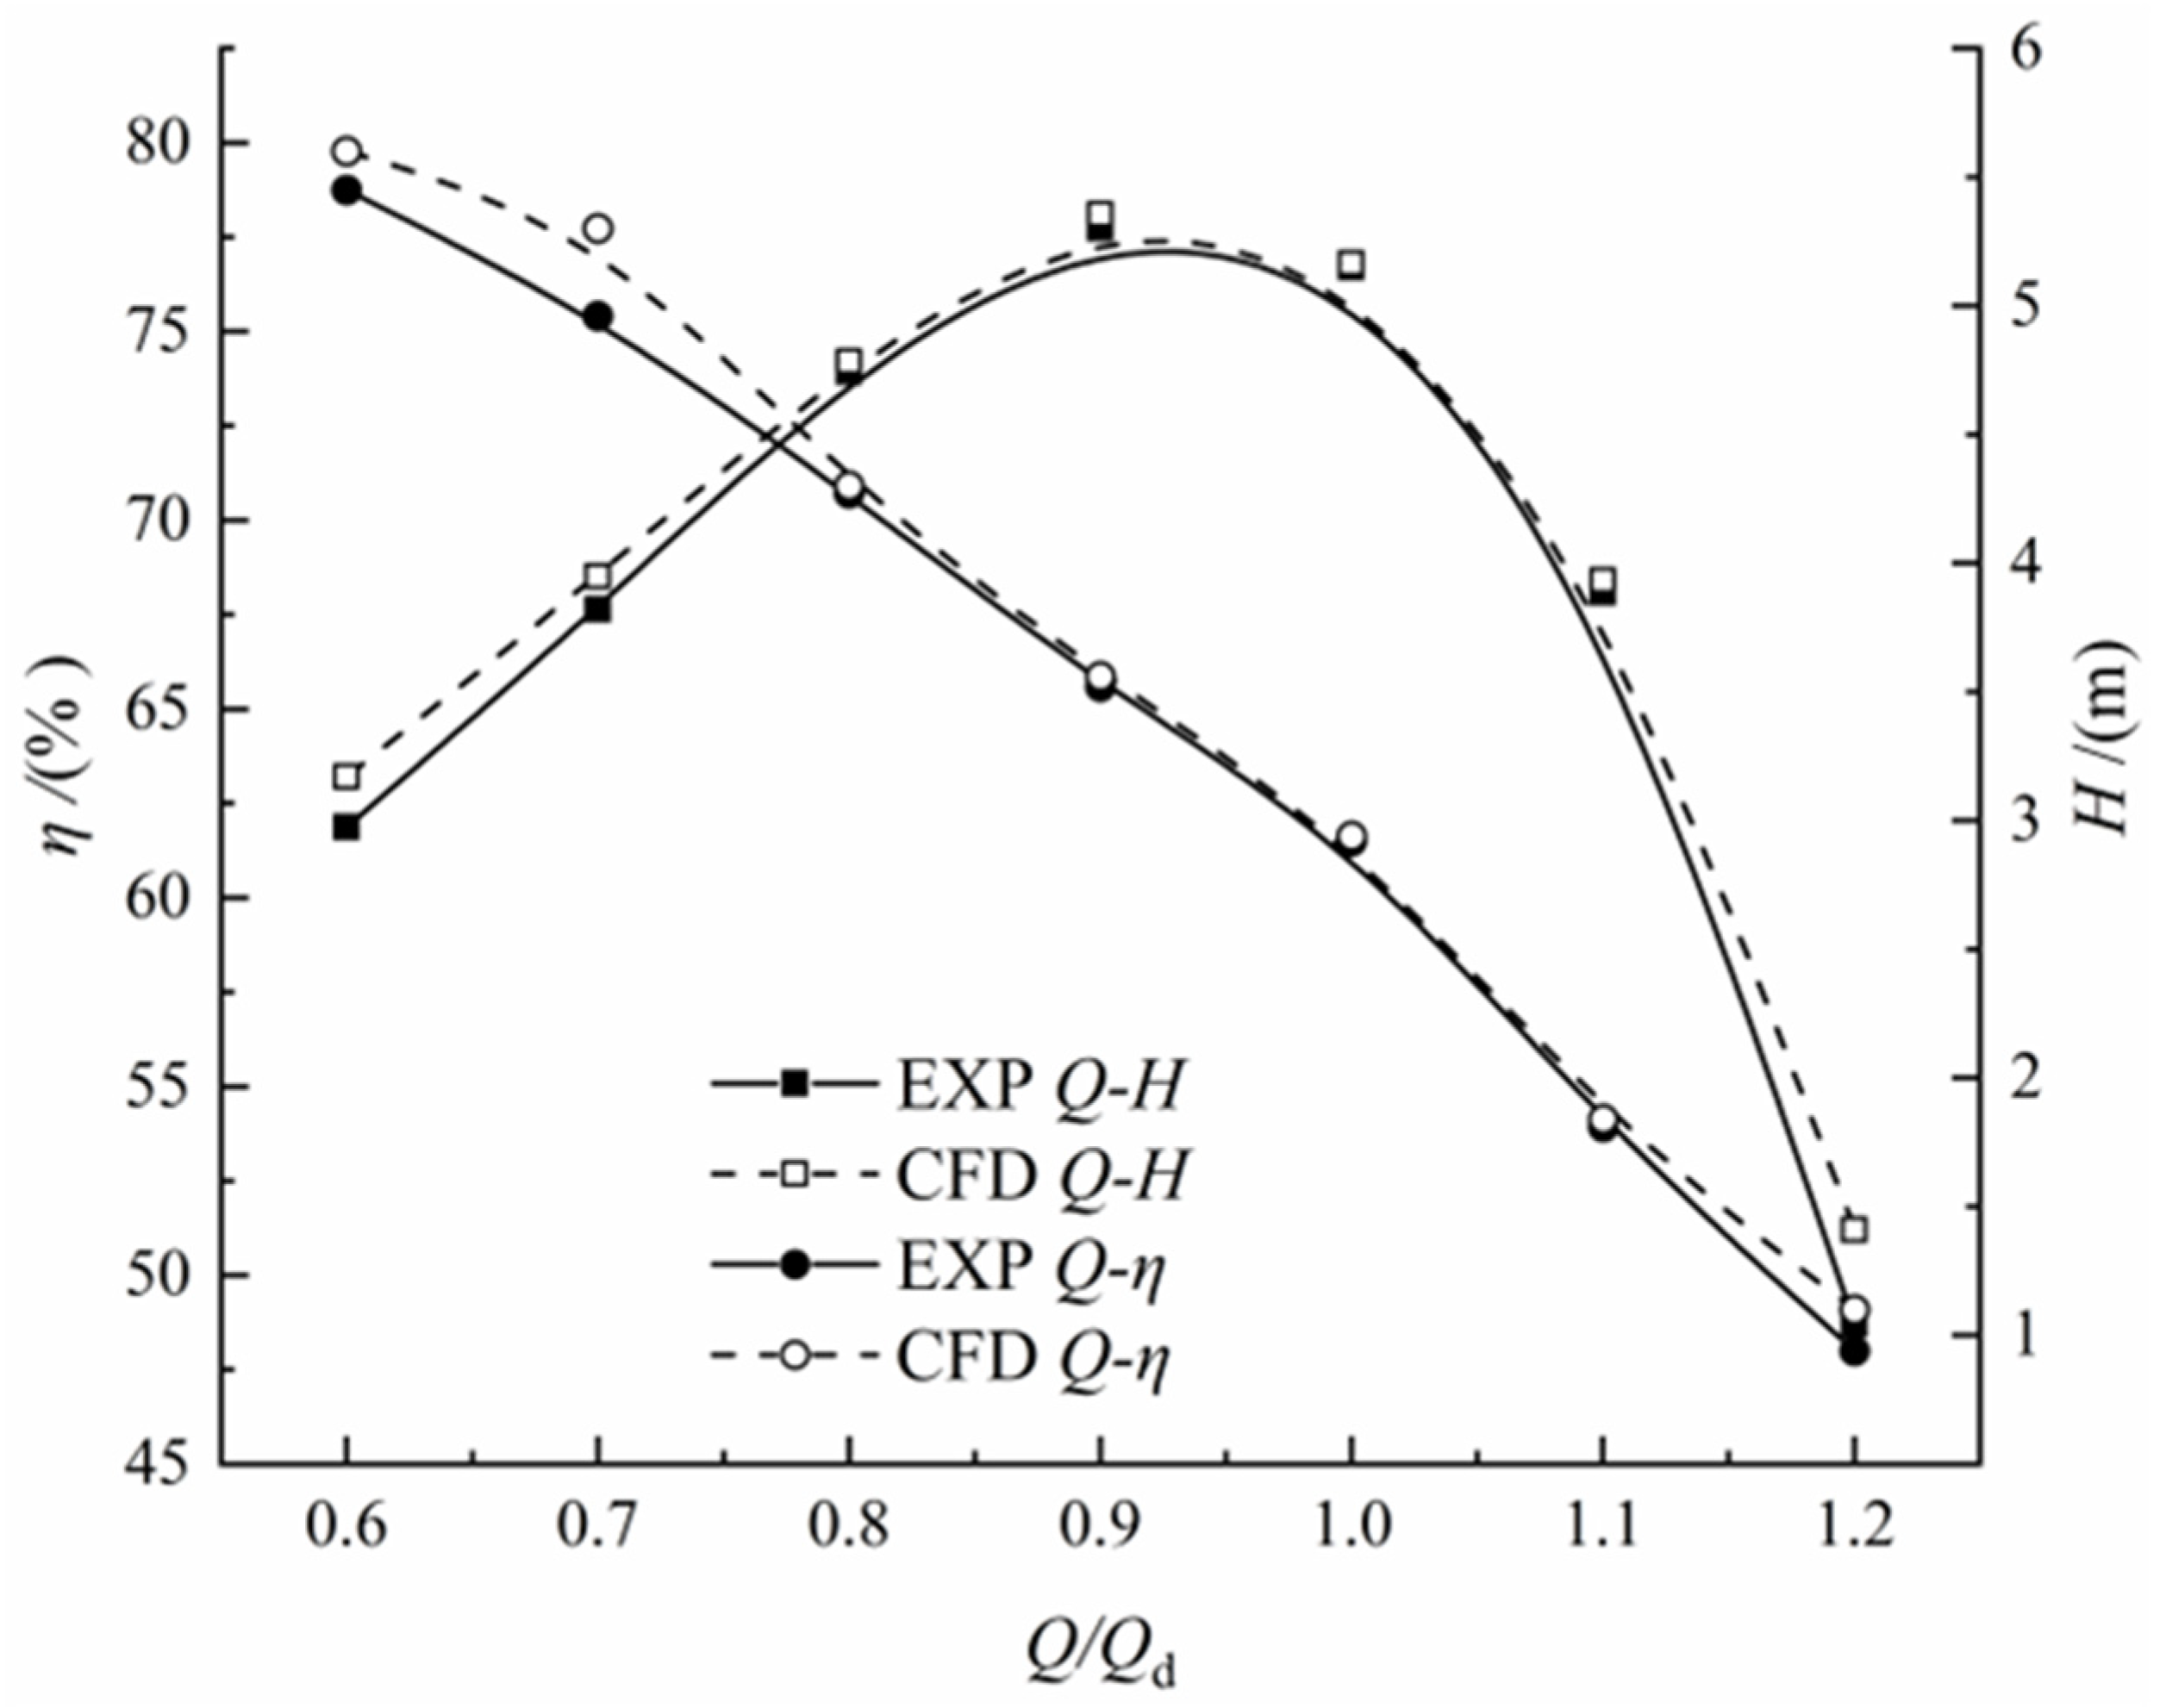
2.2.4. Model Experiment

To verify the accuracy of the numerical simulation results, a scaled-down model of the bulb turbine pump was tested on a closed-loop test bench. The test pump is shown in Figure 9. The flowrate is measured by electromagnetic flowmeter (KROHNE, uncertainty of 0.2%), the head is measured by a differential pressure transmitter (EJA, uncertainty of 0.1%) and the torque is obtained by a dynamometer and speed sensor (NJL2/500Nm, uncertainty of 0.1%). The experimental processes are similar to the research work conducted by Sun [1]. The measurement process is divided into two parts. First, the test flowrate ranges from the design point to the overload condition; the circulation pump will be started to increase the energy of the test system. And the other test flowrate ranges from the design point to the part load condition by closing the valve. The system uncertainty for this study was calculated to be 0.1%, and the combined uncertainty was 0.2%.
After conducting tests on the closed-loop test bench, the real experimental data were compared with the numerical simulation results to evaluate the external characteristics. The comparison chart is shown in Figure 10. At the design flow rate, the experimental head was 2.92 m with an efficiency of 76.7%, while the numerical simulation head was 2.94 m with an efficiency of 76.8%. The results indicate that the error between the numerical simulation and the experimental data is within 3%, meeting the accuracy requirements of the numerical simulation.

3. Results and Discussions

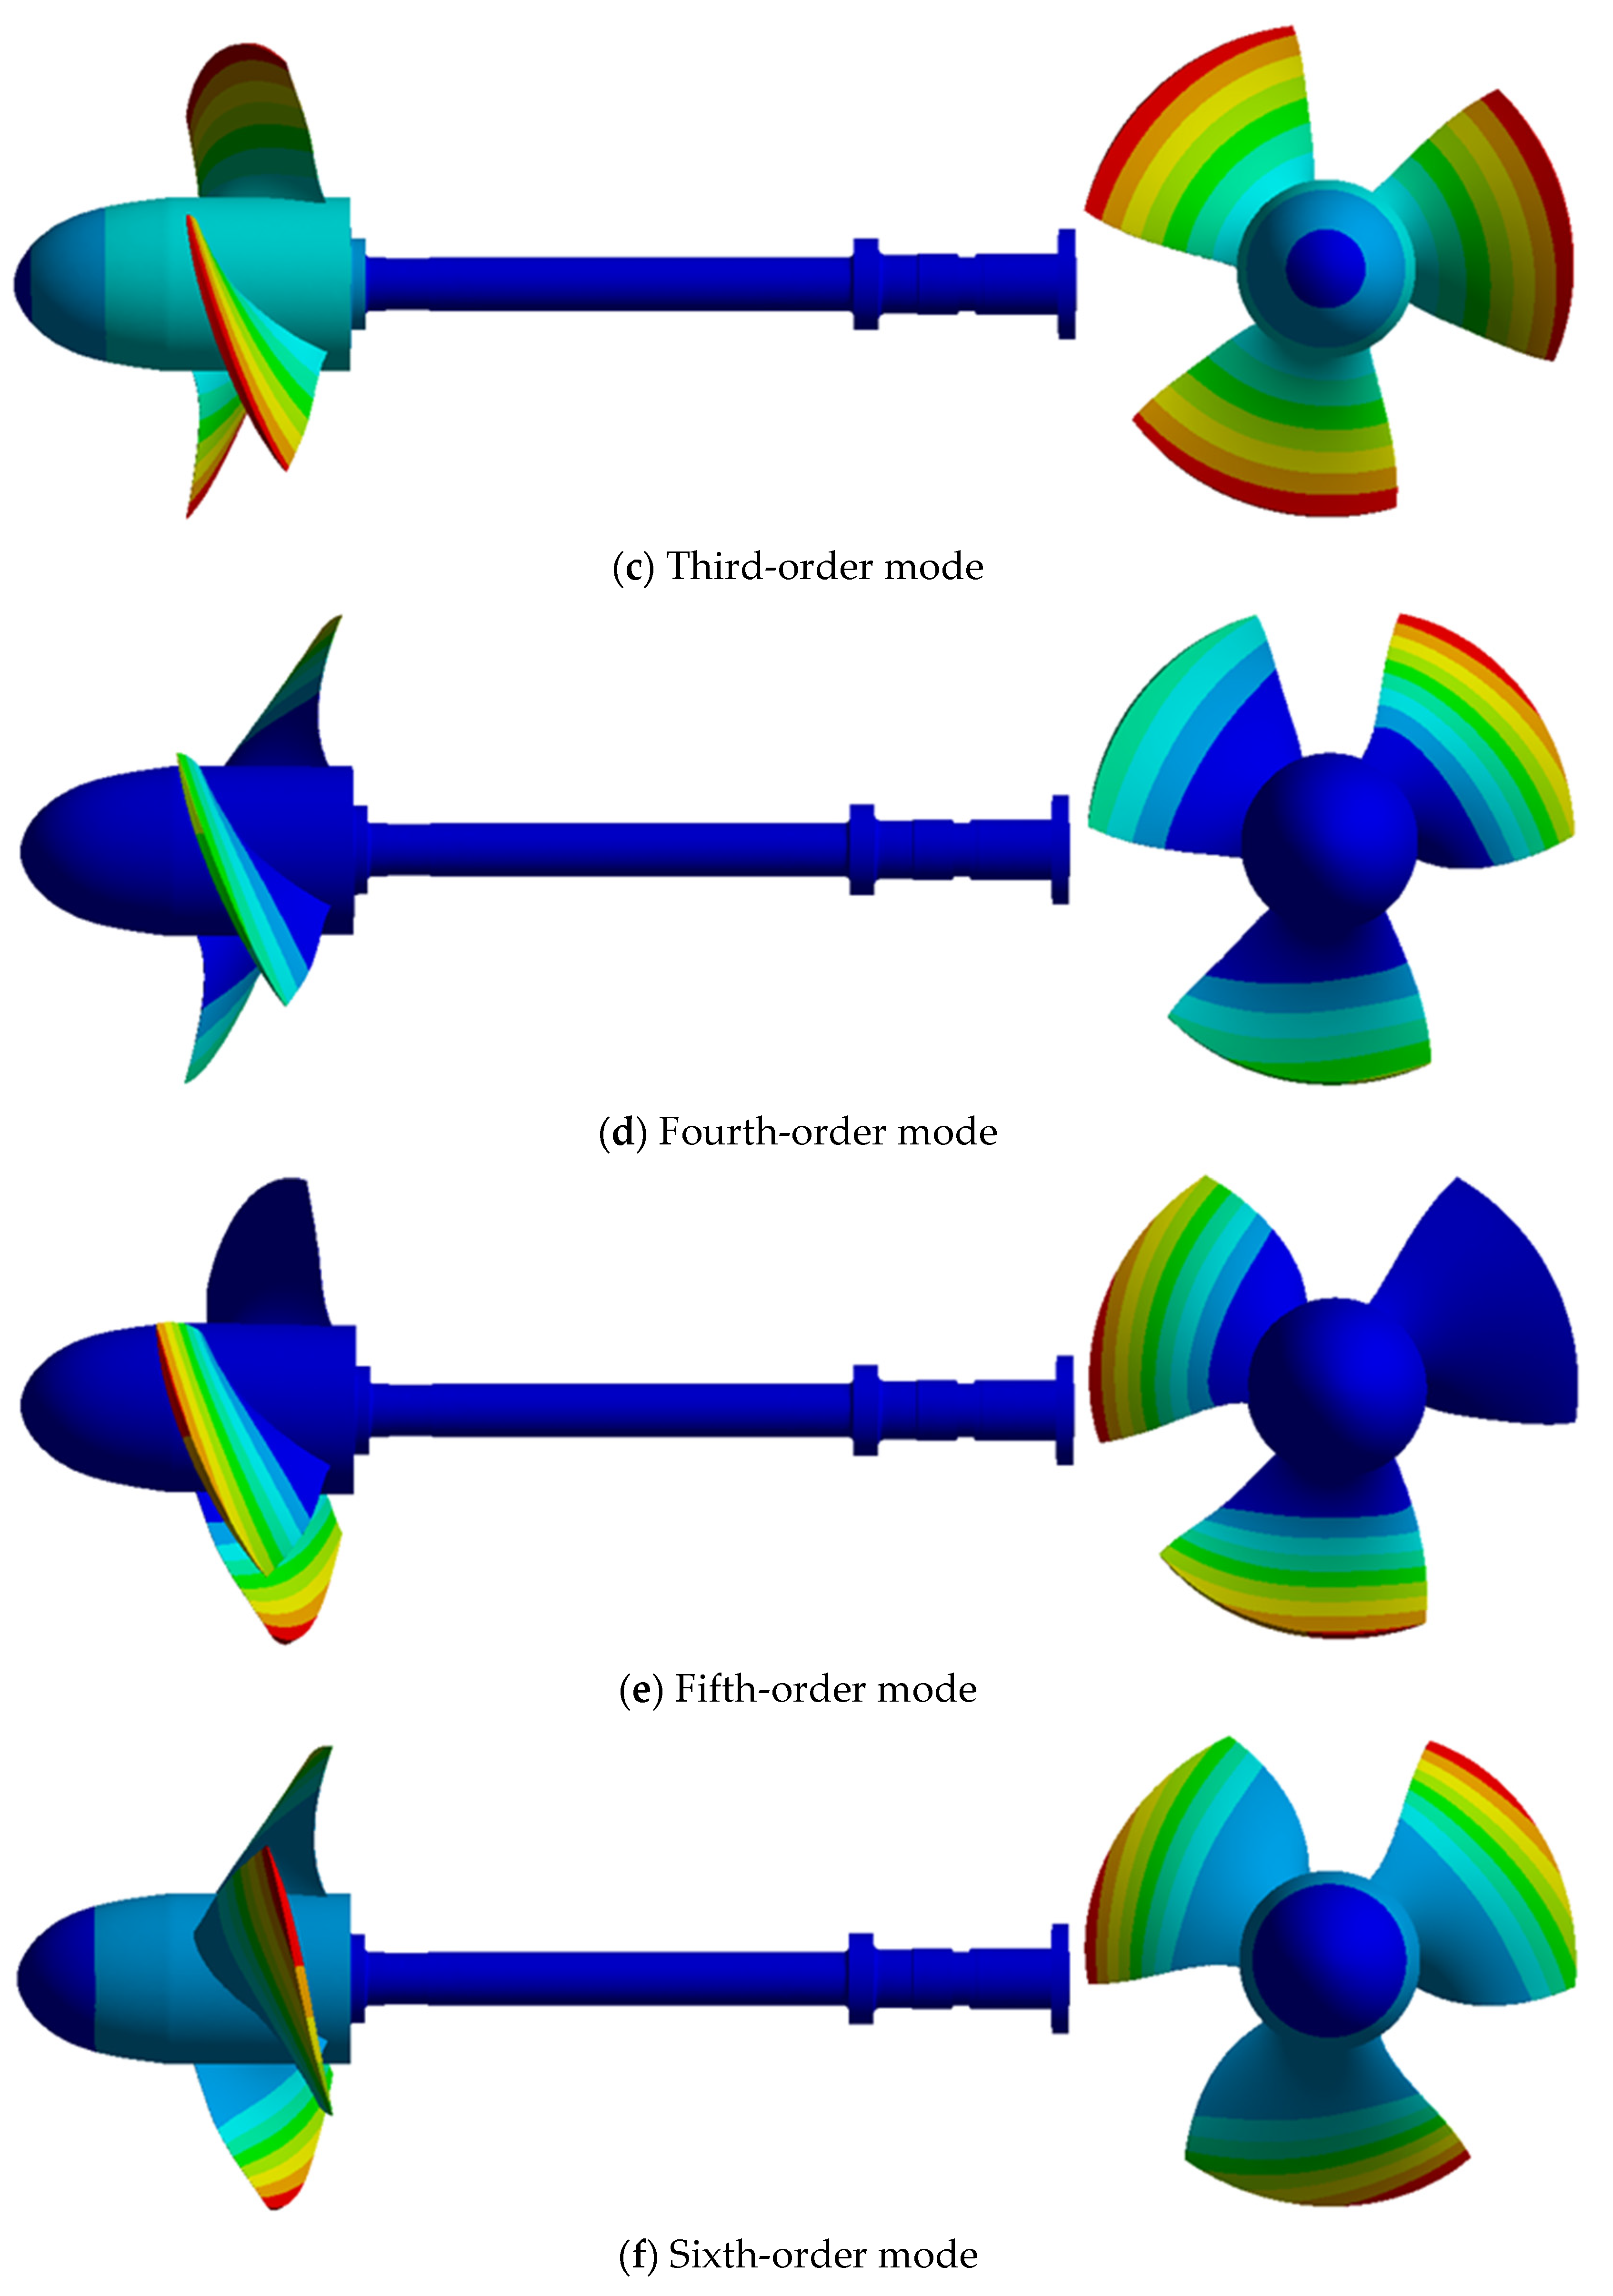
3.1. FSI and Modal Analysis on the Rotor System

Through unsteady, full-flow field calculations under multiple operating conditions, blade pressure information for each condition was obtained; the data were then imported into ANSYS Workbench for structural mechanics analysis. Due to the similarity in forces at different impeller blade installation angles, with only slight numerical variations, a 0-degree installation angle was selected for multi-condition analysis. The total deformation of the rotor structure under multiple conditions is shown in Figure 11. Under low-flow conditions, the structure experiences the greatest deformation, with maximum deformation (2.13 mm) occurring at the leading edge of the impeller inlet and decreasing radially along a gradient distribution, similar to the previously discussed pressure distribution pattern. The high flow speed at the blade tip results in greater fluid dynamic forces, causing larger deformations at this location. As the flow rate increases, structural deformation decreases. Under high-flow conditions, the total deformation of the rotor structure decreases to 1.44 mm; meanwhile, the dynamic pressure on the blade surface increases, which offsets the static pressure acting on the blades, thereby reducing deformation. Despite the reduction in overall deformation, the deformation at the hub gradually increases with the flow rate.
Figure 12 shows the equivalent stress distribution under multiple operating conditions. The equivalent stress is highest under low-flow conditions and lowest at the design flow rate. The main stress concentration occurs at the hub, the connection between the pump shaft, and the impeller. The equivalent stress increases from the rim towards the hub, with a stress concentration appearing in the middle of the hub. The hub is prone to flow separation, leading to an increased pressure difference between the pressure surface and the back of the blade, which raises the equivalent stress in this area. From the stress distribution, it is evident that stress concentration areas are likely to cause metal fatigue and fracture. Therefore, this can be taken as a theoretical reference for the optimization of design.
To evaluate the vibration behavior and dynamic characteristics of the rotor during operation, a modal analysis of the rotor system was conducted. In the modal analysis, the modes in air, pre-stressed modes in air, and wet modes were calculated. The setup for the modes in air was the same as previously described. For the wet modes, the rotor was immersed in water, with the casing filled with water and the rotor surface defined as a fluid–structure interaction (FSI) interface. The configuration for the wet mode calculation model is shown in Figure 13. Since the natural frequencies and mode shapes are similar across the three conditions, the pre-stressed modes in air were selected for detailed analysis. This approach simplified the analysis while still providing accurate insights into the dynamic behavior of the rotor under operational conditions.
Based on the calculated pre-stress information of the rotor, the results were further analyzed to obtain the pre-stressed modes in air. All mode shapes in the results images are presented in an exaggerated form, with actual deformation values not exceeding 2.10 mm. The first six modes are shown in Figure 14. The first and second modes have similar frequencies (22.019 Hz and 22.029 Hz, respectively), with minor changes in the blades and the front part of the rotor swinging downward and upward. The third mode has a frequency of 39.536 Hz, showing minor changes in the rotor shaft and a forward tilt of the blades. The fourth and fifth modes have close frequencies (62.447 Hz and 62.45 Hz, respectively), with the vibration pattern mainly involving blade oscillation. In the fifth mode, adjacent blades move closer together, reducing their angle. The sixth mode has a frequency of 71.804 Hz, with a distinct vibration pattern where all three blades swing in the direction of the water flow.
A comparison of the sixth-order dry and wet modes is shown in Table 2. When the rotor is immersed in water, the damping effect of the water alters the modal characteristics of the rotor structure. Although the vibration patterns (mode shapes) in wet conditions are similar to those in air, the frequencies of each mode decrease to varying degrees. Additionally, as the rotor rotates in the fluid, the fluid introduces an added inertia effect, which is equivalent to increasing the effective mass of the rotor. This added mass lowers the natural frequencies of the system. Therefore, it is important to avoid operating the system at these frequencies to prevent resonance and ensure the stable operation of the unit.

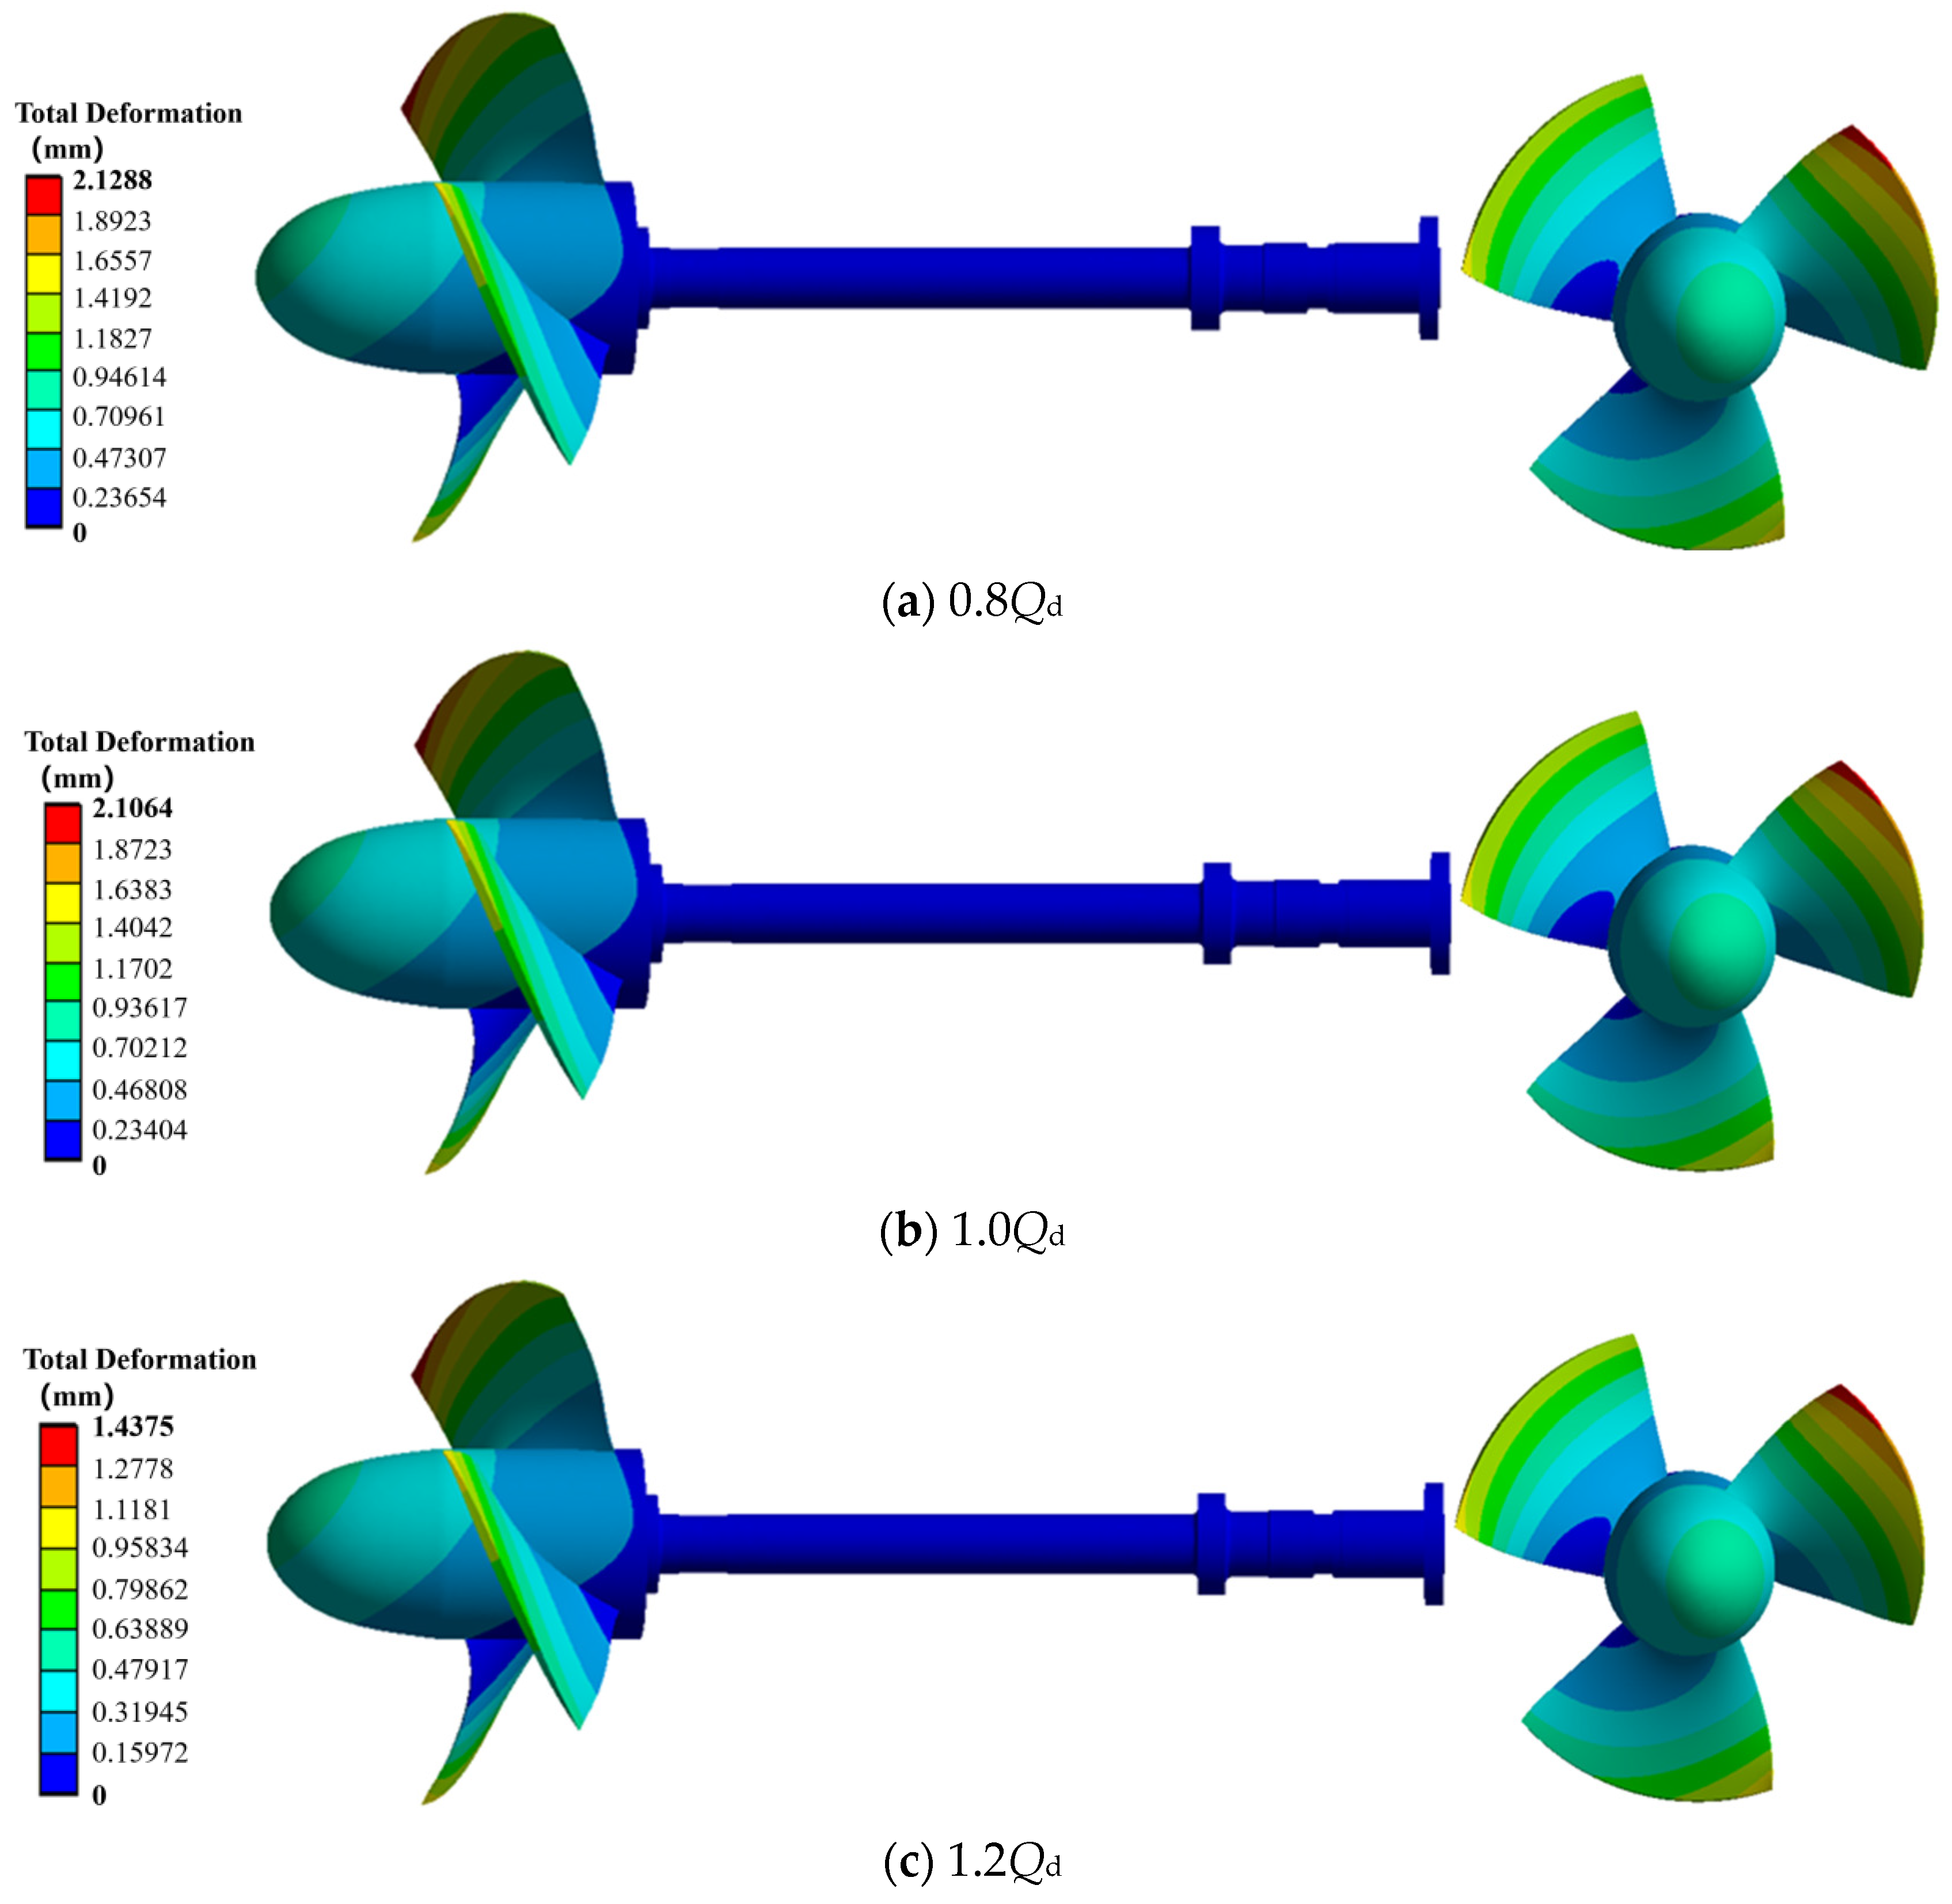
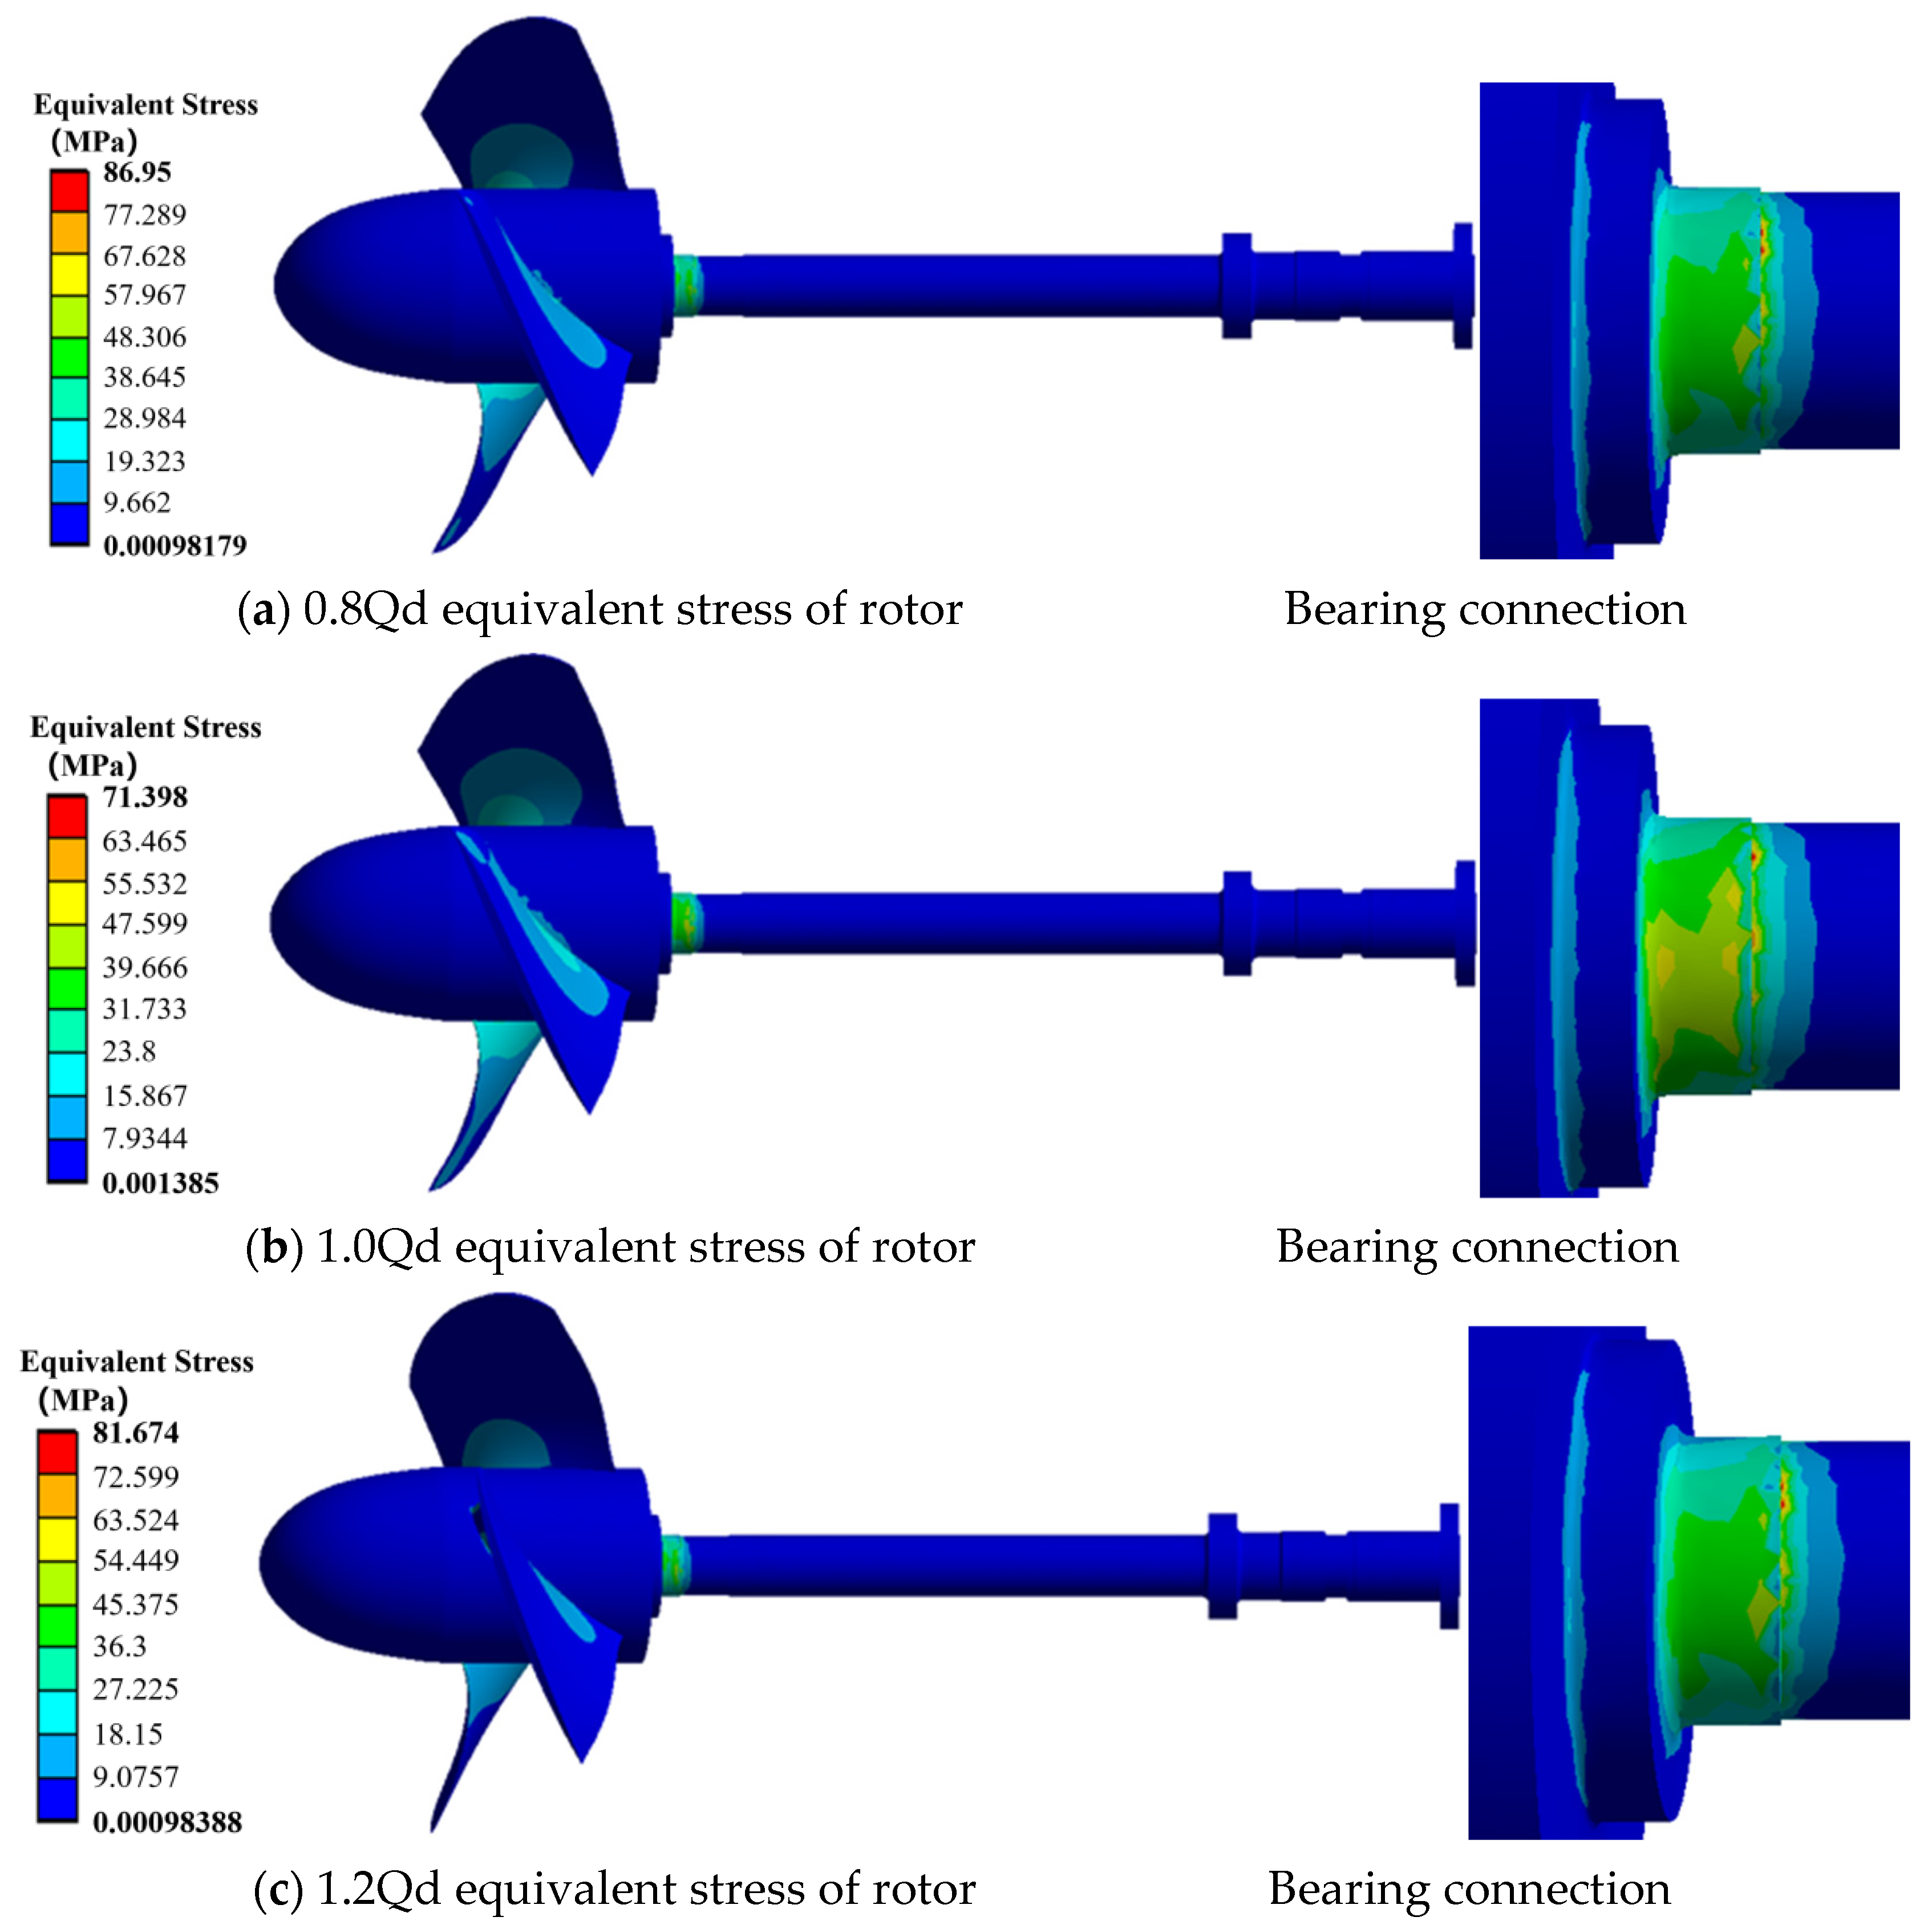
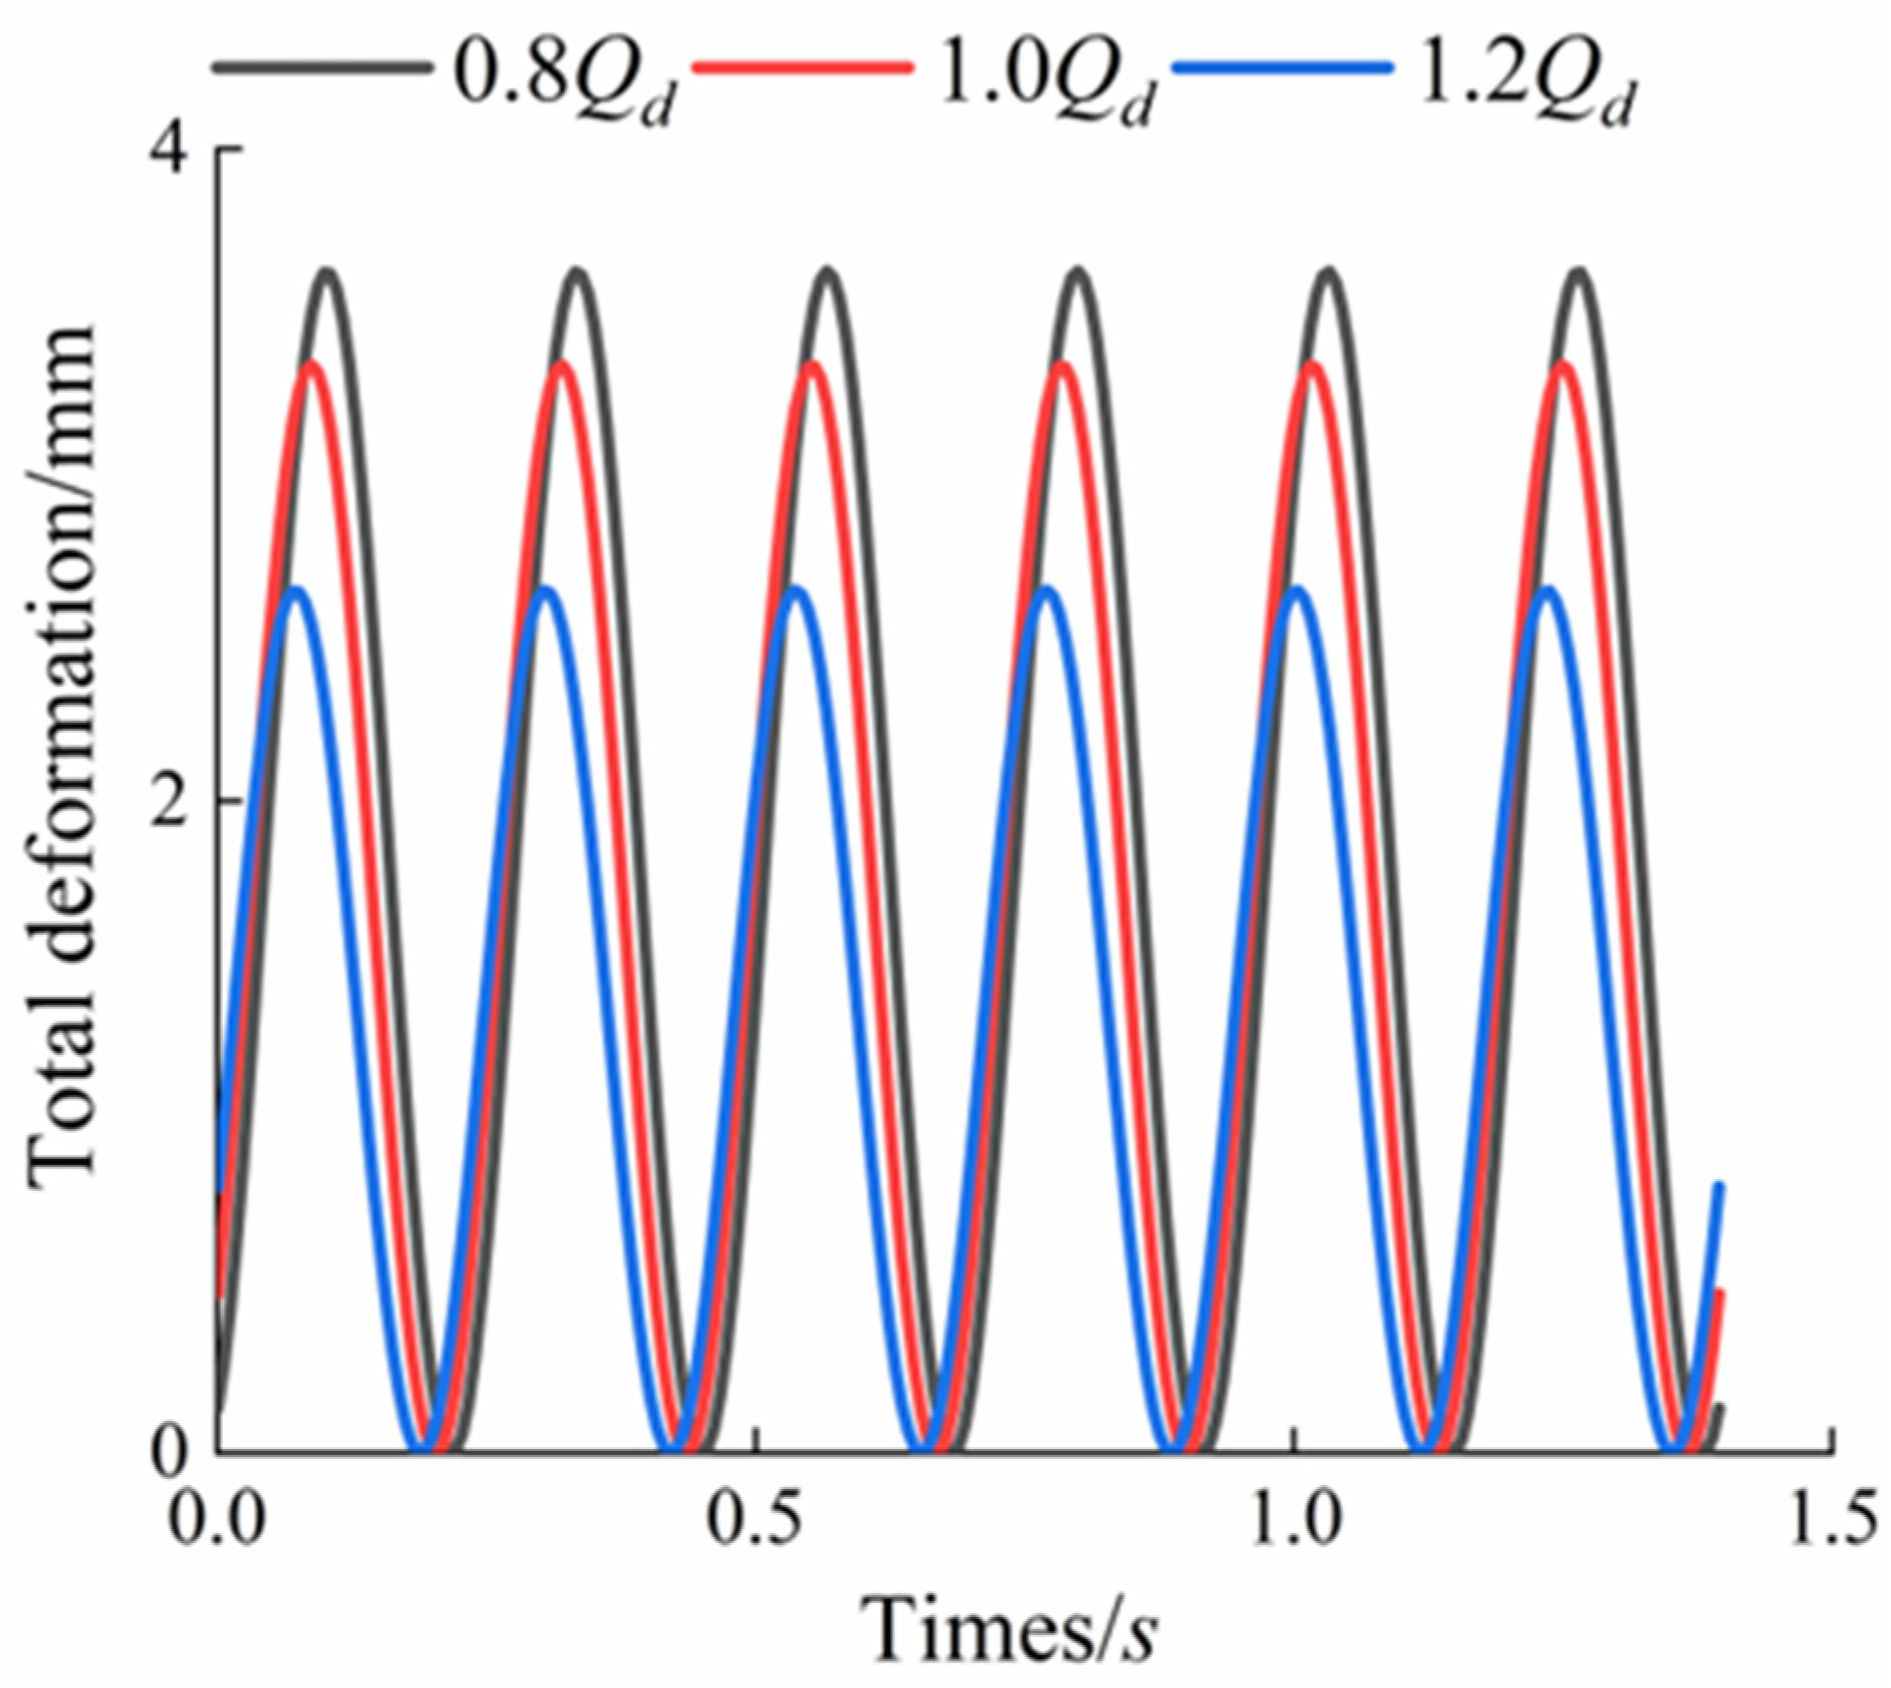
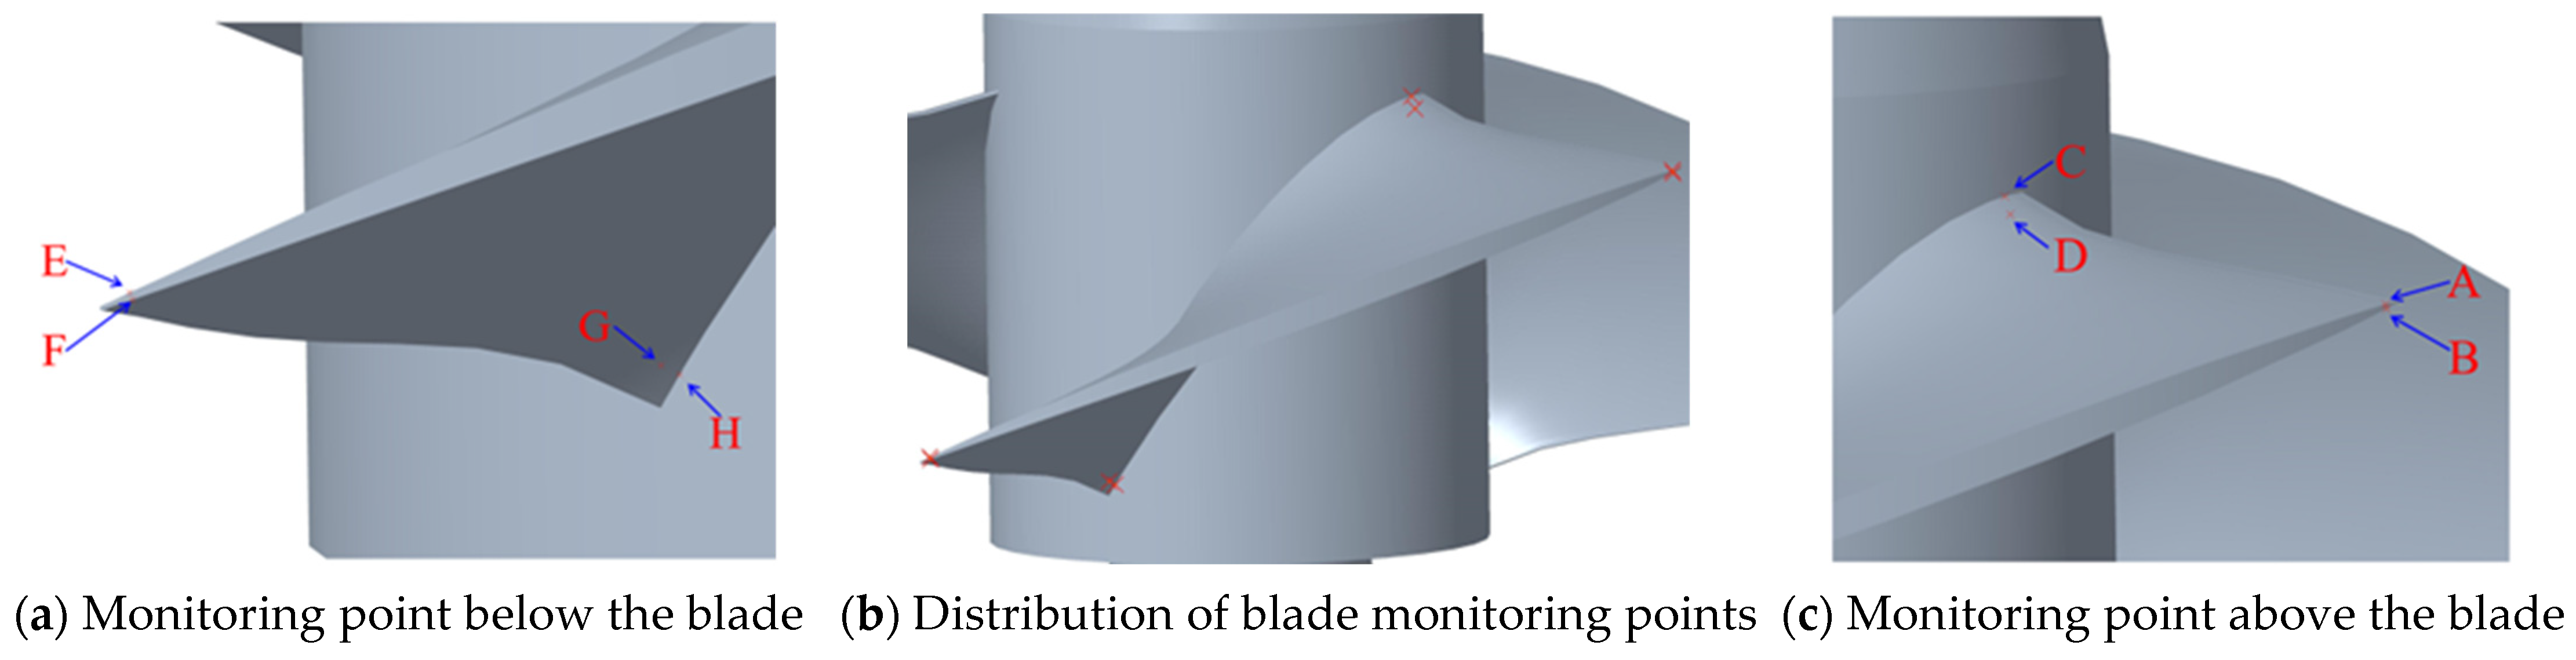
3.2. Transient Structural Characteristics of the Impeller

To more accurately capture the transient characteristics of the rotor at different moments, this study utilized unsteady flow field calculations to perform a transient analysis of the rotor. The calculation setup is the same as the unsteady setup, selecting the last two rotational cycles for transient mechanical analysis of the rotor. The total deformation of the rotor under three different flow rates is shown in Figure 15. The total deformation values exhibit a clear pattern, with the graph showing three peaks and troughs within one cycle, corresponding to the number of blades on the pump device. Under low-flow conditions, the design flow rate, and high-flow conditions, the maximum total deformation was 3.656 mm, 3.337 mm, and 2.646 mm, respectively. In transient analysis, under various conditions, the total deformation was greater than the maximum total deformation obtained from the analysis in the previous section.
From the previous analysis, it was found that the maximum deformation of the rotor blades occurred at the blade tips. This section presents transient monitoring of both the blade tips and the hub. The distribution of the monitoring points is shown in Figure 16, where points B, D, F, and H are located at the leading edge (pressure surface) and the blade root, and points A, C, E, and G are located at the trailing edge (suction surface) and the blade root. Transient total deformation analysis was conducted for the monitoring points on the pressure surface, where deformation was most significant. The results provide insights into the dynamic behavior of the rotor under different operational conditions.
Figure 17 shows the transient total deformation of the blade’s pressure surface and suction surface under low-flow conditions. The figure indicates that at both the inlet and outlet of the blade tip, the deformation on the pressure surface is greater than on the suction surface. At the inlet, the maximum deformation on the pressure surface was 3.624 mm, while on the suction surface it was 3.588 mm; at the outlet, the maximum deformation on the pressure surface was 2.931 mm, while on the suction surface it was 2.788 mm. This deformation difference occurred because the pressure surface of the blade was directly exposed to the high-speed flowing medium, creating higher pressure, whereas the suction surface had less contact with the dynamic fluid, resulting in lower pressure. Additionally, the maximum deformation at the blade root’s inlet and outlet was similar, showing that the inlet deformation was generally greater than the outlet deformation. This is related to the design of the rotating blades, where the blade root is designed to be thicker and sturdier than the blade tip to withstand larger loads and connection stresses. This design difference gives the blade root higher structural stiffness, leading to relatively smaller deformations under the same external forces and causing the deformation values of the pressure surface and the suction surface at the blade root to be similar.
The transient total deformation at the monitoring points on the pressure surface is shown in Figure 18. At monitoring point B (leading edge of the blade), under various flow conditions, the total deformation values across the three flow rates were close to the maximum deformation value of the rotor system. This indicates that the maximum deformation of the rotor system occurred at a specific location on the blade’s leading edge. At the trailing edge of the blade, the total deformation values decreased. Under low-flow conditions, the maximum deformation value was 2.931 mm. The total deformation values decreased with increasing flow rates, following a similar pattern to the total deformation of the rotor system. At the hub of the blade’s leading edge (monitoring point D), the maximum total deformation was 1.964 mm, which is significantly lower compared to the blade tip. At the hub of the trailing edge (monitoring point H), the total deformation value further decreased to 1.282 mm.

3.3. Fluid–Structure Interaction Analysis of Pump Casing and Support Components

Figure 19 presents the fluid–structure interaction calculation results for the pump casing. Part (a) of the figure shows the total deformation of the casing. The observations indicate that the maximum deformation (2.0355 mm) primarily occurred on both sides of the bottom support of the internal bulb body. This occurred because the high-speed rotating water flow was obstructed by the bottom support and changed direction, impacting both sides of the outer casing and causing peak deformation. Other deformation areas are also related to internal flow, such as the diffusion area from the guide vane outlet to the bulb body structure. Here, the fluid diffused outward along a conical shape, which is reflected in the diffusion section of the outer casing. Deformation also occurred at the top of the casing, behind the top support of the bulb body. This was caused by flow phenomena (e.g., vortices and backflow) behind the top support, leading to pressure drops and subsequent deformation that are consistent with the inward deformation of the casing. The calculated maximum equivalent stress of the casing was 44.848 MPa, within the yield strength range of the material. High equivalent stress areas correspond to regions with significant total deformation. From this analysis, it is evident that under the design flow conditions, the stress and strain on the pump casing were within reasonable limits.
Figure 20 shows the FSI calculation results for the internal support structure. From the total deformation plot in (a), it can be observed that the structure exhibited a leftward bending mode, with the side supports also experiencing a certain degree of deformation. These deformations are mainly caused by the impact of the fluid, as evidenced by similar deformation and fluid flow directions. At the rear of the bulb body, due to the combined effect of flow field pressure and fluid impact, the maximum deformation reached 0.081 mm. At the tail end of the bulb body, the streamlines contracted as the fluid flowed past the conical structure, leading to an increase in flow velocity and a decrease in fluid pressure, which created wake vortices. The pressure instability in the wake vortex region resulted in upward deformation at the tail end. The equivalent stress distribution shown in (b) indicates that the main equivalent stress pattern is similar to the total deformation distribution. The stress was primarily located at the top support and the trailing edge, with a maximum value of 22.94 MPa at the trailing edge. This suggests that the streamline contraction, pressure drop, wake vortex formation, pressure recovery, and flow separation as the fluid flowed past the conical structure significantly influenced the equivalent stress magnitude.

4. Conclusions

This study investigated the static and dynamic characteristics of bulb turbine pump rotors through static and transient FSI calculations under flow field conditions. Based on modal analysis under dry and wet conditions, the natural frequencies and mode shapes of the rotor system were evaluated. Further mechanical analysis of the complete casing support and the loads generated during actual operation were conducted to identify areas requiring reinforcement and weight reduction. By analyzing the forces and pressure distribution exerted by the fluid, this study provides references for optimizing the design of the support structure, thereby reducing the risk of failure due to vibration or fatigue. The following conclusions are drawn:
(1) Under low-flow conditions, the rotor structure exhibited the greatest degree of deformation, with maximum deformation (2.13 mm) occurring at the leading edge of the impeller inlet. This deformation decreased radially along a gradient distribution. Due to the high flow velocity at the blade tips, the fluid dynamic forces were greater, thereby increasing deformation. As the flow rate increased, the structural deformation decreased. The damping effect of water alters the modal characteristics of the rotor structure. Although the mode shapes under wet conditions are similar to those in air, the natural frequencies decreased to varying degrees.
(2) In the transient analysis under various conditions, the total deformation of the rotor system was greater than in the static analysis, showing a clear pattern. Within one cycle, the graph exhibited three peaks and valleys. Under low-flow conditions, the deformation at the inlet and outlet of the blade tip on the pressure surface was greater than on the suction surface, with a maximum total deformation of 3.656 mm. At the design flow rate and under high-flow conditions, the maximum total deformation was 3.337 mm and 2.646 mm, respectively.
(3) The total deformation of the casing mainly occurred on both sides of the bottom support of the internal bulb body, with a maximum deformation of 2.0355 mm. The maximum equivalent stress was 44.848 MPa, within the yield strength range of the material. The areas of high equivalent stress corresponded to the regions with significant total deformation.
(4) The equivalent stress distribution in the support structure was similar to the total deformation pattern, primarily located at the top support and the trailing edge. A maximum equivalent stress of 22.94 MPa occurred at the trailing edge. This indicates that, as the fluid flows past the tail of the conical structure, phenomena such as streamline contraction, pressure reduction, wake vortex formation, pressure recovery, and flow separation significantly impact the magnitude of the equivalent stress.

Author Contributions

Supervision, methodology, W.W.; investigation, writing—original draft preparation, J.L.; investigation, writing—review and editing, C.W.; conceptualization, investigation, J.P.; writing—review and editing, visualization, C.L.; validation, B.H. All authors have read and agreed to the published version of the manuscript.

Funding

This work is funded and supported by the Scientific Research Project of the Jiangsu Provincial Department of Water Resources (2022029); the Open Project Program of the Engineering Research Center of the High-efficiency and Energy-saving Large Axial Flow Pumping station (grant no. ECHEAP006); and the Science Center for Gas Turbine Project (P2022-DC-III-001-001).

Data Availability Statement

All the data in this paper are obtained by physical experiment and numerical simulation, respectively, and the data used to support the findings of this study are available from the corresponding author upon request.

Conflicts of Interest

Author Jingyu Li is employed by the Power China Guiyang Engineering Corporation Limited; the remaining authors declare that the research was conducted in the absence of any commercial or financial relationships that could be construed as potential conflicts of interest.

Nomenclature

ρ The density of water, kg/m3
C p The specific heat capacity of the fluid
u The components of the velocity vector in the respective directions
v The components of the velocity vector in the respective directions
w The components of the velocity vector in the respective directions
TThe fluid temperature
kThe thermal conductivity
ϕ The heat generated due to viscous dissipation
P k The turbulence production term
μ t The turbulent viscosity
α Model constants
β Model constants
β Model constants
σ k Model constants
σ ω Model constants
DThe diameter of the impeller: mm
QThe flowrate of the pump, m3/s
QdThe design flowrate of the pump, m3/s
μ Poisson ratio
δ Blade tip clearance
HThe head of the pump, m
η Efficiency, %

References

  1. Sun, L.; Pan, Q.; Zhang, D.; Zhao, R.; van Esch, B.B. Numerical study of the energy loss in the bulb tubular pump system focusing on the off-design conditions based on combined energy analysis methods. Energy 2022, 258, 124794. [Google Scholar] [CrossRef]
  2. Liu, X.; Xu, F.; Cheng, L.; Pan, W.; Jiao, W. Stress characteristics analysis of vertical bi-directional flow channel axial pump blades based on fluid–structure coupling. Machines 2022, 10, 368. [Google Scholar] [CrossRef]
  3. Zhang, L.; Guo, Y.; Wang, W. Large eddy simulation of turbulent flow in a true 3D Francis hydro turbine passage with dynamical fluid–structure interaction. Int. J. Numer. Methods Fluids 2007, 54, 517–541. [Google Scholar] [CrossRef]
  4. Campbell, R.L.; Paterson, E.G. Fluid–structure interaction analysis of flexible turbomachinery. J. Fluids Struct. 2011, 27, 1376–1391. [Google Scholar] [CrossRef]
  5. Zhang, L.; Guo, Y.; Wang, W. FEM simulation of turbulent flow in a turbine blade passage with dynamical fluid–structure interaction. Int. J. Numer. Methods Fluids 2009, 61, 1299–1330. [Google Scholar] [CrossRef]
  6. Cheng, K.; Li, S.; Cheng, L.; Sun, T.; Zhang, B.; Jiao, W. Experiment on influence of blade angle on hydraulic characteristics of the shaft tubular pumping device. Processes 2022, 10, 590. [Google Scholar] [CrossRef]
  7. Shi, L.; Zhu, J.; Wang, L.; Chu, S.; Tang, F.; Jin, Y. Comparative analysis of strength and modal characteristics of a full tubular pump and an axial flow pump impellers based on fluid-structure interaction. Energies 2021, 14, 6395. [Google Scholar] [CrossRef]
  8. Pei, J.; Meng, F.; Li, Y.; Yuan, S.; Chen, J. Fluid–structure coupling analysis of deformation and stress in impeller of an axial-flow pump with two-way passage. Adv. Mech. Eng. 2016, 8, 168781401664626. [Google Scholar] [CrossRef]
  9. Kan, K.; Zheng, Y.; Fu, S.; Liu, H.; Yang, C.; Zhang, X. Dynamic stress of impeller blade of shaft extension tubular pump device based on bidirectional fluid-structure interaction. J. Mech. Sci. Technol. 2017, 31, 1561–1568. [Google Scholar] [CrossRef]
  10. Zhang, L.; Wang, S.; Yin, G.; Guan, C. Fluid–structure interaction analysis of fluid pressure pulsation and structural vibration features in a vertical axial pump. Adv. Mech. Eng. 2019, 11, 168781401982858. [Google Scholar] [CrossRef]
  11. Meng, F.; Yuan, S.; Li, Y. Fluid–structure coupling analysis of impeller in unstable region for a reversible axial-flow pump device. Adv. Mech. Eng. 2018, 10, 168781401775176. [Google Scholar] [CrossRef]
  12. Zhao, F.F.; Adu-Poku, K.A.; Xu, Z.X.; Xu, R.H.; Zhang, H.; Zhang, F. Structural dynamic characteristics analysis of a mixed-flow pump based on fluid–structure coupling. AIP Adv. 2024, 14, 015256. [Google Scholar] [CrossRef]
  13. Shi, L.; Wu, C.; Wang, L.; Xu, T.; Jiang, Y.; Chai, Y.; Zhu, J. Influence of blade angle deviation on the hydraulic performance and structural characteristics of S-Type front shaft extension tubular pump Device. Processes 2022, 10, 328. [Google Scholar] [CrossRef]
  14. Wang, S.; Zhang, L.; Yin, G. Numerical investigation of the FSI characteristics in a tubular pump. Math. Probl. Eng. 2017, 2017, 7897614. [Google Scholar] [CrossRef]
  15. Li, H.; Cai, Z.; Zheng, Y.; Feng, J.; Xu, H.; Chen, H.; Binama, M.; Kan, K. Investigation of structural strength and fatigue life of rotor system of a vertical axial-flow pump under full operating conditions. Water 2023, 15, 3041. [Google Scholar] [CrossRef]
  16. Bai, Y.; Wu, D. Study on fatigue characteristics of axial-flow pump based on two-way fluid–structure coupling. Energies 2022, 15, 8965. [Google Scholar] [CrossRef]
  17. Zhang, D.; Pan, D.; Xu, Y.; Shao, P.; Wang, G. Numerical investigation of blade dynamic characteristics in an axial flow pump. Therm. Sci. 2013, 17, 1511–1514. [Google Scholar] [CrossRef]
  18. Trivedi, C.; Cervantes, M.J. Fluid-structure interactions in francis turbines: A perspective review. Renew. Sustain. Energy Rev. 2017, 68, 87–101. [Google Scholar] [CrossRef]
  19. Hu, F.F.; Chen, T.; Wu, D.Z.; Wang, L.Q. Computation of stress distribution in a mixed flow pump based on fluid-structure interaction analysis. In IOP Conference Series: Materials Science and Engineering; IOP Publishing: Bristol, UK, 2013; Volume 52, p. 022035. [Google Scholar]
  20. Deng, X.; Gates, H.; Weaver, B.; Wood, H.; Fittro, R. Turbulence input parameters correction methodology in water lubricated thrust bearings. In Proceedings of the American Society of Mechanical Engineers 2018, Oslo, Norway, 11–15 June 2018; Volume 7, p. V07BT34A019. [Google Scholar]
  21. Xu, Z.; Zhao, F.; Liu, J.; Zhang, F.; Zhang, J.; Song, M. Investigation of flow-induced noise characteristics in the oblique flow pump. Processes 2022, 10, 2221. [Google Scholar] [CrossRef]
  22. Birajdar, R.; Keste, A. Prediction of flow-induced vibrations due to impeller hydraulic unbalance in vertical turbine pumps using one-way fluid−structure interaction. J. Vib. Eng. Technol. 2020, 8, 417–430. [Google Scholar] [CrossRef]
  23. Pei, J.; Yuan, S.; Yuan, J. Fluid-structure coupling effects on periodically transient flow of a single-blade sewage centrifugal pump. J. Mech. Sci. Technol. 2013, 27, 2015–2023. [Google Scholar] [CrossRef]
Figure 1. Computational domain of whole flow passage. (1) Inlet channel. (2) Impeller. (3) Guide vane body. (4) Bulb body structure. (5) Outlet channel. The specific model parameters of the impeller guide vane are listed in Table 1.
Processes 12 01641 g001
Figure 2. Flow passage component mesh.
Processes 12 01641 g002aProcesses 12 01641 g002b
Figure 3. Y+ value of the blade wall.
Processes 12 01641 g003
Figure 4. Grid independence verification.
Processes 12 01641 g004
Figure 5. Impeller rotor computational grid and settings.
Processes 12 01641 g005
Figure 6. Pump assembly modeling.
Processes 12 01641 g006
Figure 7. Pump assembly mesh and computational settings.
Processes 12 01641 g007
Figure 8. Preprocessing of support structure model.
Processes 12 01641 g008
Figure 9. Bulb tubular pump hydraulic model test.
Processes 12 01641 g009
Figure 10. External characteristics comparison.
Processes 12 01641 g010
Figure 11. Multi-condition rotor total deformation.
Processes 12 01641 g011
Figure 12. Multi-condition rotor equivalent stress.
Processes 12 01641 g012
Figure 13. Rotor sixth-order mode shape.
Processes 12 01641 g013
Figure 14. Rotor sixth-order mode shape.
Processes 12 01641 g014aProcesses 12 01641 g014b
Figure 15. Multi-condition rotor total deformation.
Processes 12 01641 g015
Figure 16. Rotor monitoring point distribution.
Processes 12 01641 g016
Figure 17. Transient total deformation of working and suction surfaces.
Processes 12 01641 g017
Figure 18. Transient deformation of working face monitoring points.
Processes 12 01641 g018
Figure 19. Casing fluid–structure interaction calculation results.
Processes 12 01641 g019
Figure 20. Support structure fluid–structure interaction calculation results.
Processes 12 01641 g020
Table 1. Specific parameters of the impeller guide vane.
Flow Passage ComponentsGeometric ParametersValue
ImpellerImpeller outlet diameter4300 mm
Hub diameter1600 mm
Hub ratio0.37
Number of blades3
Inlet diameter4520 mm
Outlet diameter5520 mm
Guide vaneGuide vane diffusion angle13.4°
Number of blades5
Table 2. Wet and dry mode frequency comparison.
OrderPre-Stressed Air Inherent Mode/HzWet Mode/Hz
First order22.01919.204
Second order22.02919.210
Third order39.53632.753
Fourth order62.44750.394
Fifth order62.4550.401
Sixth order71.80458.721
Disclaimer/Publisher’s Note: The statements, opinions and data contained in all publications are solely those of the individual author(s) and contributor(s) and not of MDPI and/or the editor(s). MDPI and/or the editor(s) disclaim responsibility for any injury to people or property resulting from any ideas, methods, instructions or products referred to in the content.

