Article

Experimental and Numerical Simulation Study on Enhancing Gas Recovery with Impure CO2 in Gas Reservoirs

1
State Key Laboratory of Oil and Gas Reservoir Geology and Exploitation, Chengdu University of Technology, Chengdu 610059, China
2
PetroChina Southwest Oil & Gasfield Company, Chengdu 610041, China
3
Exploration and Development Research Institute, PetroChina Southwest Oil & Gasfield Company, Chengdu 610041, China
4
State Key Laboratory of Oil and Gas Reservoir Geology and Exploitation, Southwest Petroleum University, Chengdu 610500, China
*
Authors to whom correspondence should be addressed.
Processes 2024, 12(8), 1663; https://doi.org/10.3390/pr12081663
Submission received: 8 July 2024 / Revised: 31 July 2024 / Accepted: 2 August 2024 / Published: 8 August 2024
(This article belongs to the Special Issue Advances in Enhancing Unconventional Oil/Gas Recovery, 2nd Edition)

Abstract

:
To achieve carbon peaking and carbon neutrality goals, using CO2 to enhance natural gas recovery has broad application prospects. However, the potential for CO2 to increase recovery rates remains unclear, the mechanisms are not fully understood, and the cost of purifying CO2 is high. Therefore, studying the effects of impure CO2 on natural gas extraction is of significant importance. This study investigated the effects of injection timing and gas composition on natural gas recovery through high-temperature, high-pressure, long-core displacement experiments. Based on the experimental results, numerical simulations of CO2-enhanced gas recovery and sequestration were conducted, examining the impact of impurity gas concentration, injection timing, injection speed, and water saturation on recovery efficiency. The results indicate that higher impurity levels in CO2 increase gas diffusion, reducing the effectiveness of natural gas recovery and decreasing CO2 sequestration. Earlier injection timing improves recovery efficiency but results in a lower ultimate recovery rate. Higher injection speeds and water saturation levels both effectively enhance recovery rates.

1. Introduction

With economic and social development, carbon emissions have been increasing annually, resulting in a severe greenhouse effect. Energy-related CO2 emissions account for 88.8% of total emissions [1]. Therefore, it is imperative to transition the energy structure from high carbon to low carbon. Natural gas is the fossil fuel with the lowest carbon emissions. Increasing its proportion in energy consumption is crucial for gradually achieving this energy transition [2]. As conventional gas reservoirs undergo pressure depletion, the remaining natural gas becomes increasingly difficult to extract through standard production methods [3]. Since the 1990s, the technique of CO2 injection to enhance gas recovery (CO2-EGR), proposed by Burgt et al. [4], has captured significant attention. Injecting CO2 into reservoirs can restore formation pressure and displace residual natural gas, thereby enhancing gas recovery. Moreover, the gas storage capacity of the reservoir and the sealing effectiveness of the trap are favorable for achieving geological CO2 sequestration. This helps to reduce carbon emissions and has significant research value and application prospects [5].
Currently, several small-scale pilot projects for CO2 sequestration and enhanced gas recovery have been conducted. Internationally, these include the Budafa Szinfelleti project in Hungary [6], the Alberta project in Canada [7], the Otway project in Australia [8], and the North Sea K12-B project in the Netherlands [9]. In China, there are pilot projects, such as the pilot project of CO2-enhanced coalbed methane recovery in Qinshui Basin [10] and the pilot experimental project for the joint development of the Lian-4 condensate gas reservoir and the Lian-21 high-CO2 gas reservoir in Fushan Oilfield, Hainan Province.
Studies have demonstrated the feasibility of CO2-EGR. Previous research on CO2-EGR mechanisms indicates that CO2 injection can restore reservoir pressure and extend the production period [11]. The density difference between CO2 and CH4 under reservoir conditions causes CO2 to settle at the bottom of the reservoir and displace CH4 upward, forming a favorable mobility ratio during displacement [12]. CO2 competes with CH4 for adsorption on the rock surface and displaces the CH4 adsorbed on the rock surface [13,14]. CO2 dissolving in formation water can delay CO2 breakthrough [15]. Studies on the influencing factors of CO2-EGR have shown that CO2 purity affects the displacement and enhancement effects [16]. The gas diffusion coefficient significantly influences the mixing of CO2 and CH4. Injecting CO2 after the gas reservoir reaches abandonment pressure helps to maximize ultimate recovery [17]. Within a certain range, higher injection rates and pressures yield higher recovery rates [18]. Low injection and high production can delay CO2 breakthrough, resulting in higher CH4 recovery [19]. Recovery rates in the presence of bound water saturation are higher than in its absence [20].
Overall, although some researchers have discussed the mechanisms and influencing parameters of CO2-EGR, studies on CO2 displacement of natural gas under high-temperature and high-pressure conditions remain limited. On the other hand, CO2 is typically sourced from flue gas and tail gas from natural gas purification plants, which contain significant amounts of impurities such as N2, O2, and SO2. The cost of purifying and separating CO2 is high, making it important to study the effects of impure CO2 on the recovery mechanism. This study investigates the mechanisms by which impure CO2 enhances natural gas recovery through high-temperature and high-pressure long-core displacement experiments and numerical simulations. The aim is to optimize injection parameters to reduce costs and improve recovery efficiency.

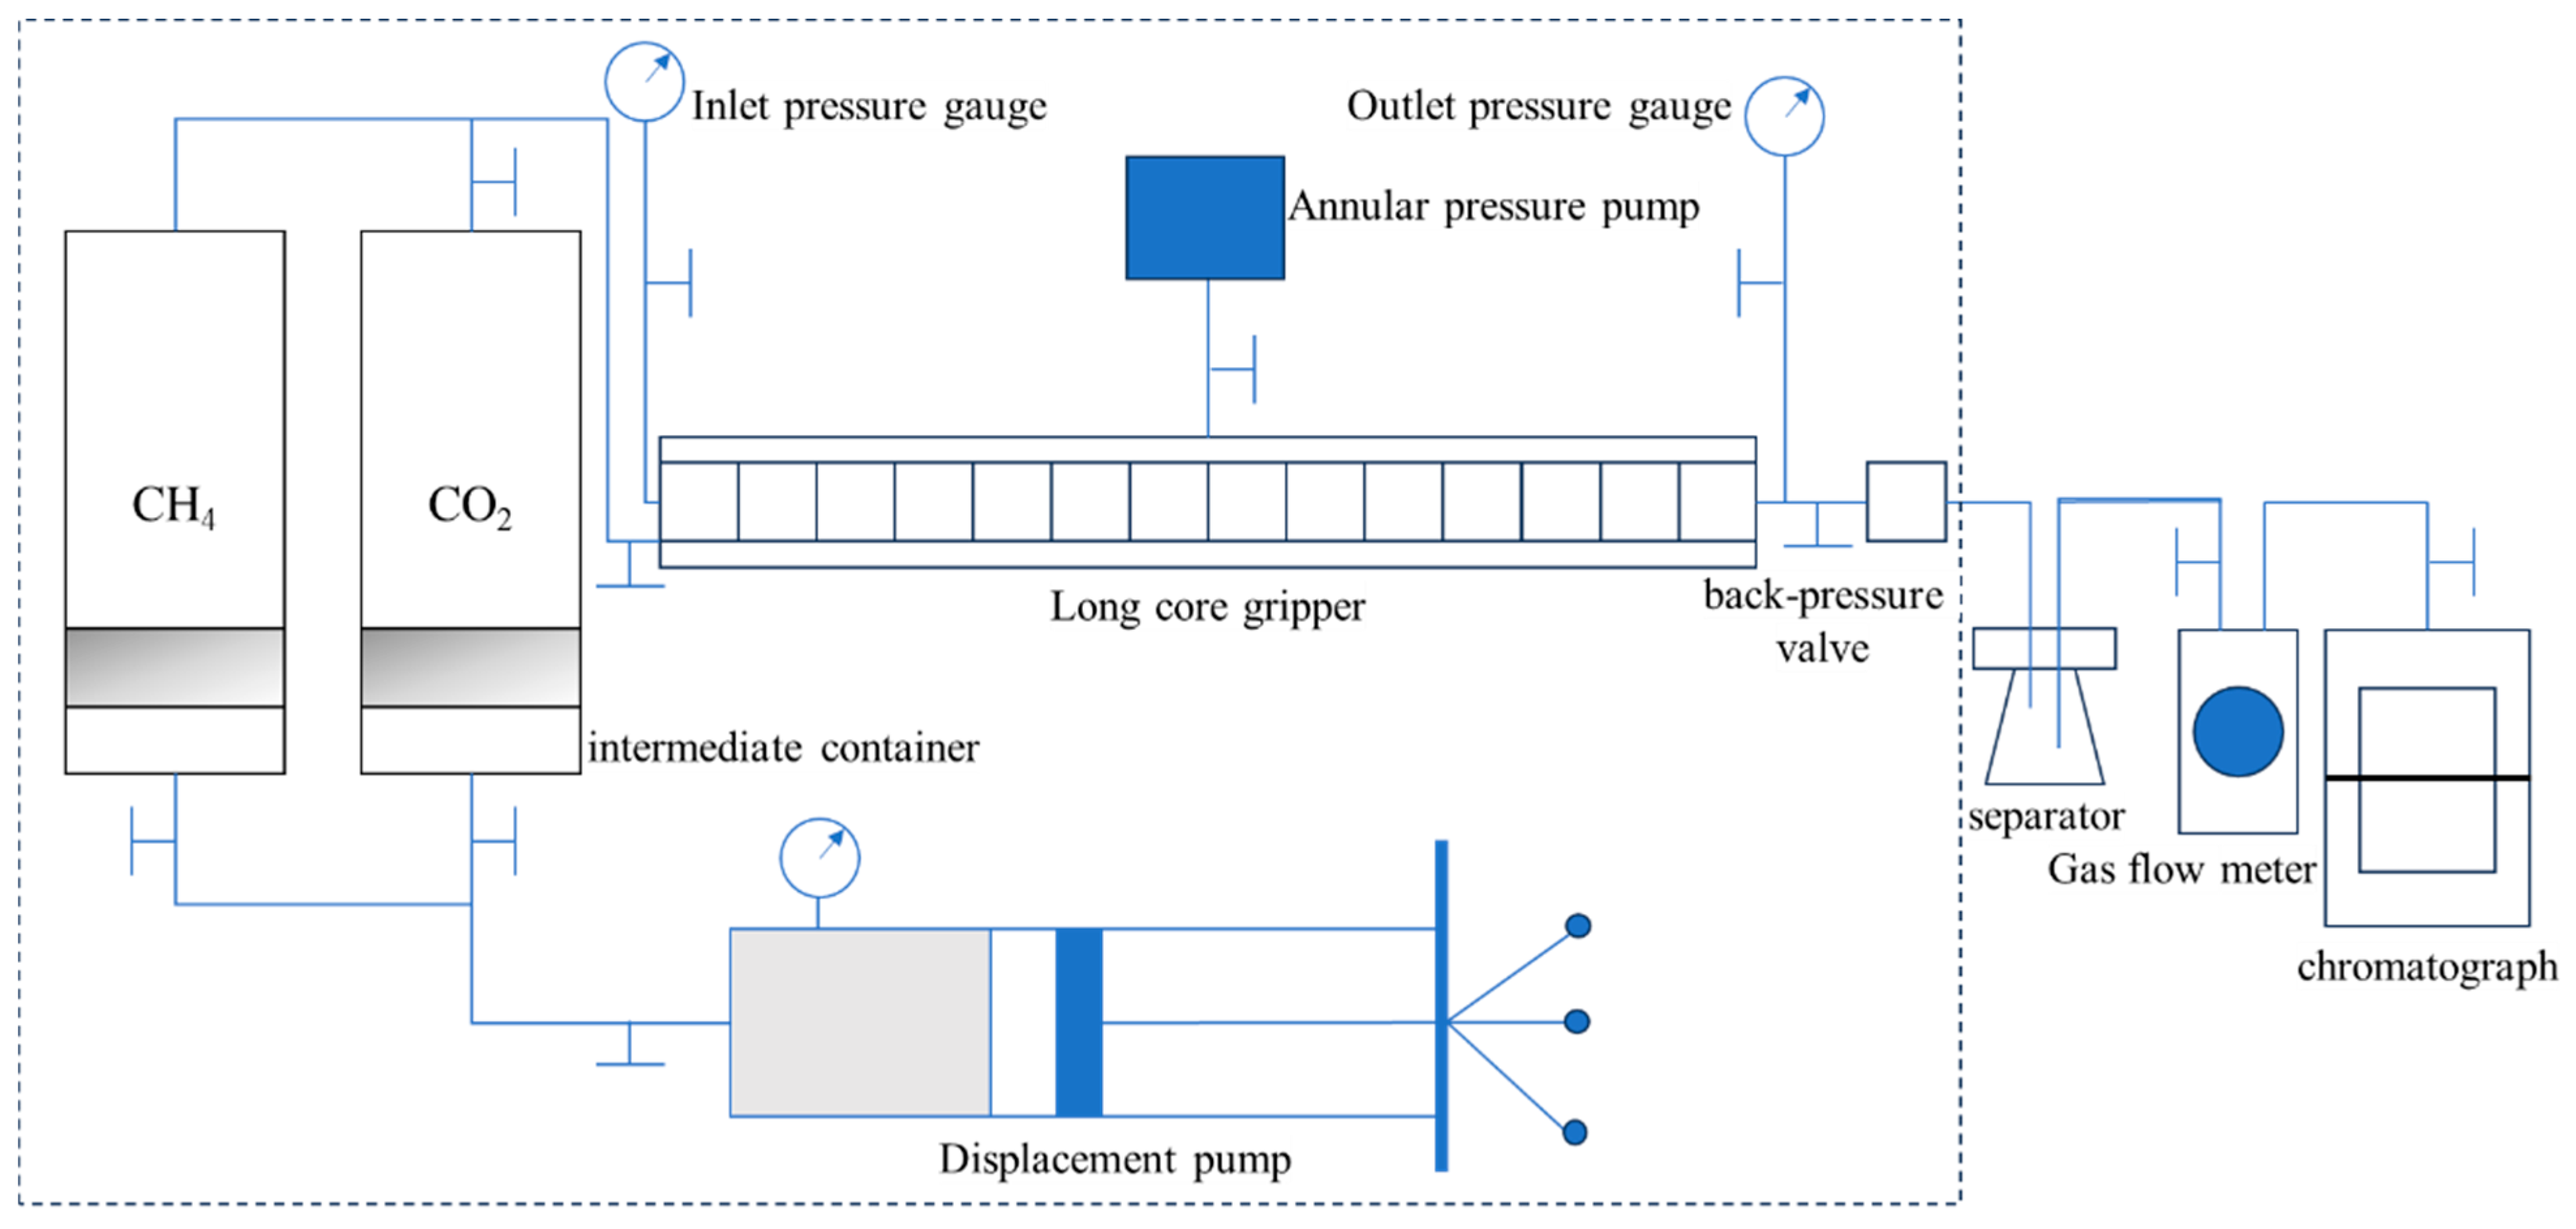
2. High-Temperature and High-Pressure CO2-EGR Displacement Experiments

2.1. Experimental Materials and Content

The gases used in the experiment included industrial CO2 and industrial CH4 (purity > 99.9%) and oxidation-absorption tail gas (28% CO2, 67% N2, 5% O2) configured and supplied by Chengdu Keyuan Gas Co., Ltd., Chendu, China.
Four sets of long-core displacement experiments were designed to investigate the effects of injection timing and gas type on natural gas recovery. These experiments were conducted in a high-temperature and high-pressure long-core displacement system, utilizing six artificial fractured carbonate rock cores. The core parameters are listed in Table 1. The permeability ranged from 0.683 to 2.79 mD, and the porosity ranged from 1.67% to 3.02%. The average permeability was 1.564 mD, average porosity was 2.222%, and total length was 26.796 cm. The cores were sorted according to the harmonic average value of permeability, and filter paper was added to the end faces of the cores to prevent end effects. The long-core displacement equipment simulated the reservoir formation temperature at 85 °C and original formation pressure at 55 MPa.
The long-core displacement experimental apparatus consisted of a displacement pump, a piston-type intermediate container, a thermostatic box, a long-core holder, a back-pressure controller, a confining pressure pump, and a flow meter, as shown in Figure 1. As the power device for the experiments, the displacement pump injected CO2 from the intermediate container into the core by providing the corresponding pressure and flow rate. The prepared long core was placed in a corrosion-resistant rubber sleeve to protect the experimental materials and then placed in the long-core holder. The confining pressure pump provided the surrounding pressure to simulate the reservoir formation pressure. The downstream of the experimental system was equipped with a gas analysis and recording system, mainly consisting of a gas meter and a chromatograph, which were used to record the gas flow rate and gas components, respectively.
In the experiment, the effects of different injection timings and gas compositions were considered. The main steps were as follows.
First, the core was saturated with CH4 to reach the CH4 saturation state under original reservoir formation conditions. Multistage depletion-drive development experiments were then conducted at an original formation pressure of 55 MPa, with a pressure reduction interval of 1 MPa. Throughout the depletion process, the surrounding pressure was kept 5 MPa higher than the internal core pressure. The four experimental groups were depleted to 2, 6, and 8 MPa, followed by CO2 injection displacement at 6 and 8 MPa and oxidation-absorption tail gas injection displacement at 2 and 8 MPa. All gases were injected at a constant speed of 0.05 mL/min. During the displacement process, a chromatograph was used to detect the components of the produced gas. The experiments ended when the CO2 content in the produced gas reached 95%. Throughout the experiments, inlet and outlet pressures, gas production volume, outlet gas components, and CO2 injection volume were recorded in real time. The detailed content of the experimental design is presented in Table 2.

2.2. Experimental Results and Analysis

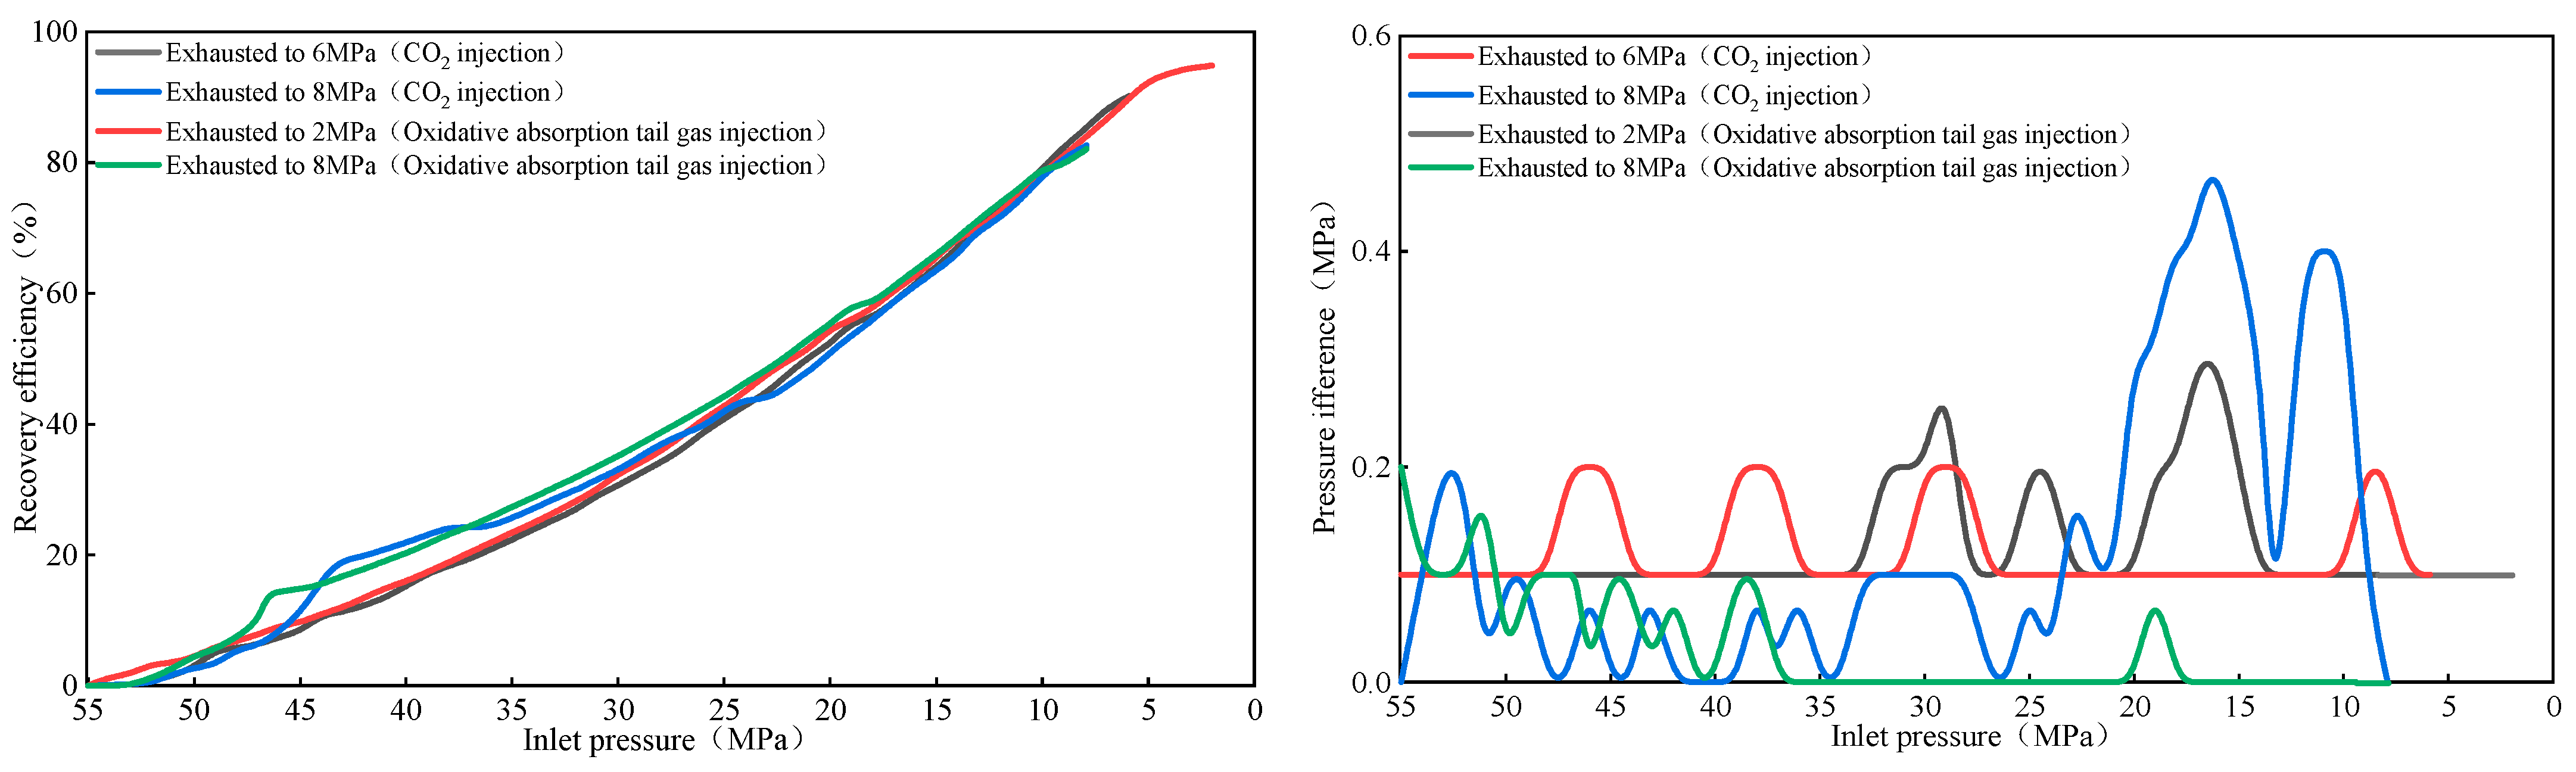
2.2.1. Depletion Experiment

The recovery rate and the pressure difference between the inlet and outlet during the depletion experiment are shown in Figure 2. The horizontal axis represents the inlet pressure during the depletion process. Depletion-drive development was achieved by adjusting the outlet pressure using a control valve, with a pressure reduction gradient of 1 MPa. The pressure was reduced by 1 MPa every half hour, with the entire process taking 24.5 h. Generally, the recovery curve was nearly linear, indicating a stable depletion process. The recovery rate increased with the degree of depletion, reaching a maximum of 96.27% at 2 MPa. Because the outlet pressure was reduced by the control valve, the inlet pressure could not immediately align with the outlet pressure, creating a pressure difference within a certain range. Figure 2 (pressure variations) shows the pressure differences between the inlet and outlet during depletion, with a maximum pressure difference of 0.5 MPa. Overall, the pressure difference was relatively small, suggesting that gas can flow smoothly in the artificial fractured core.

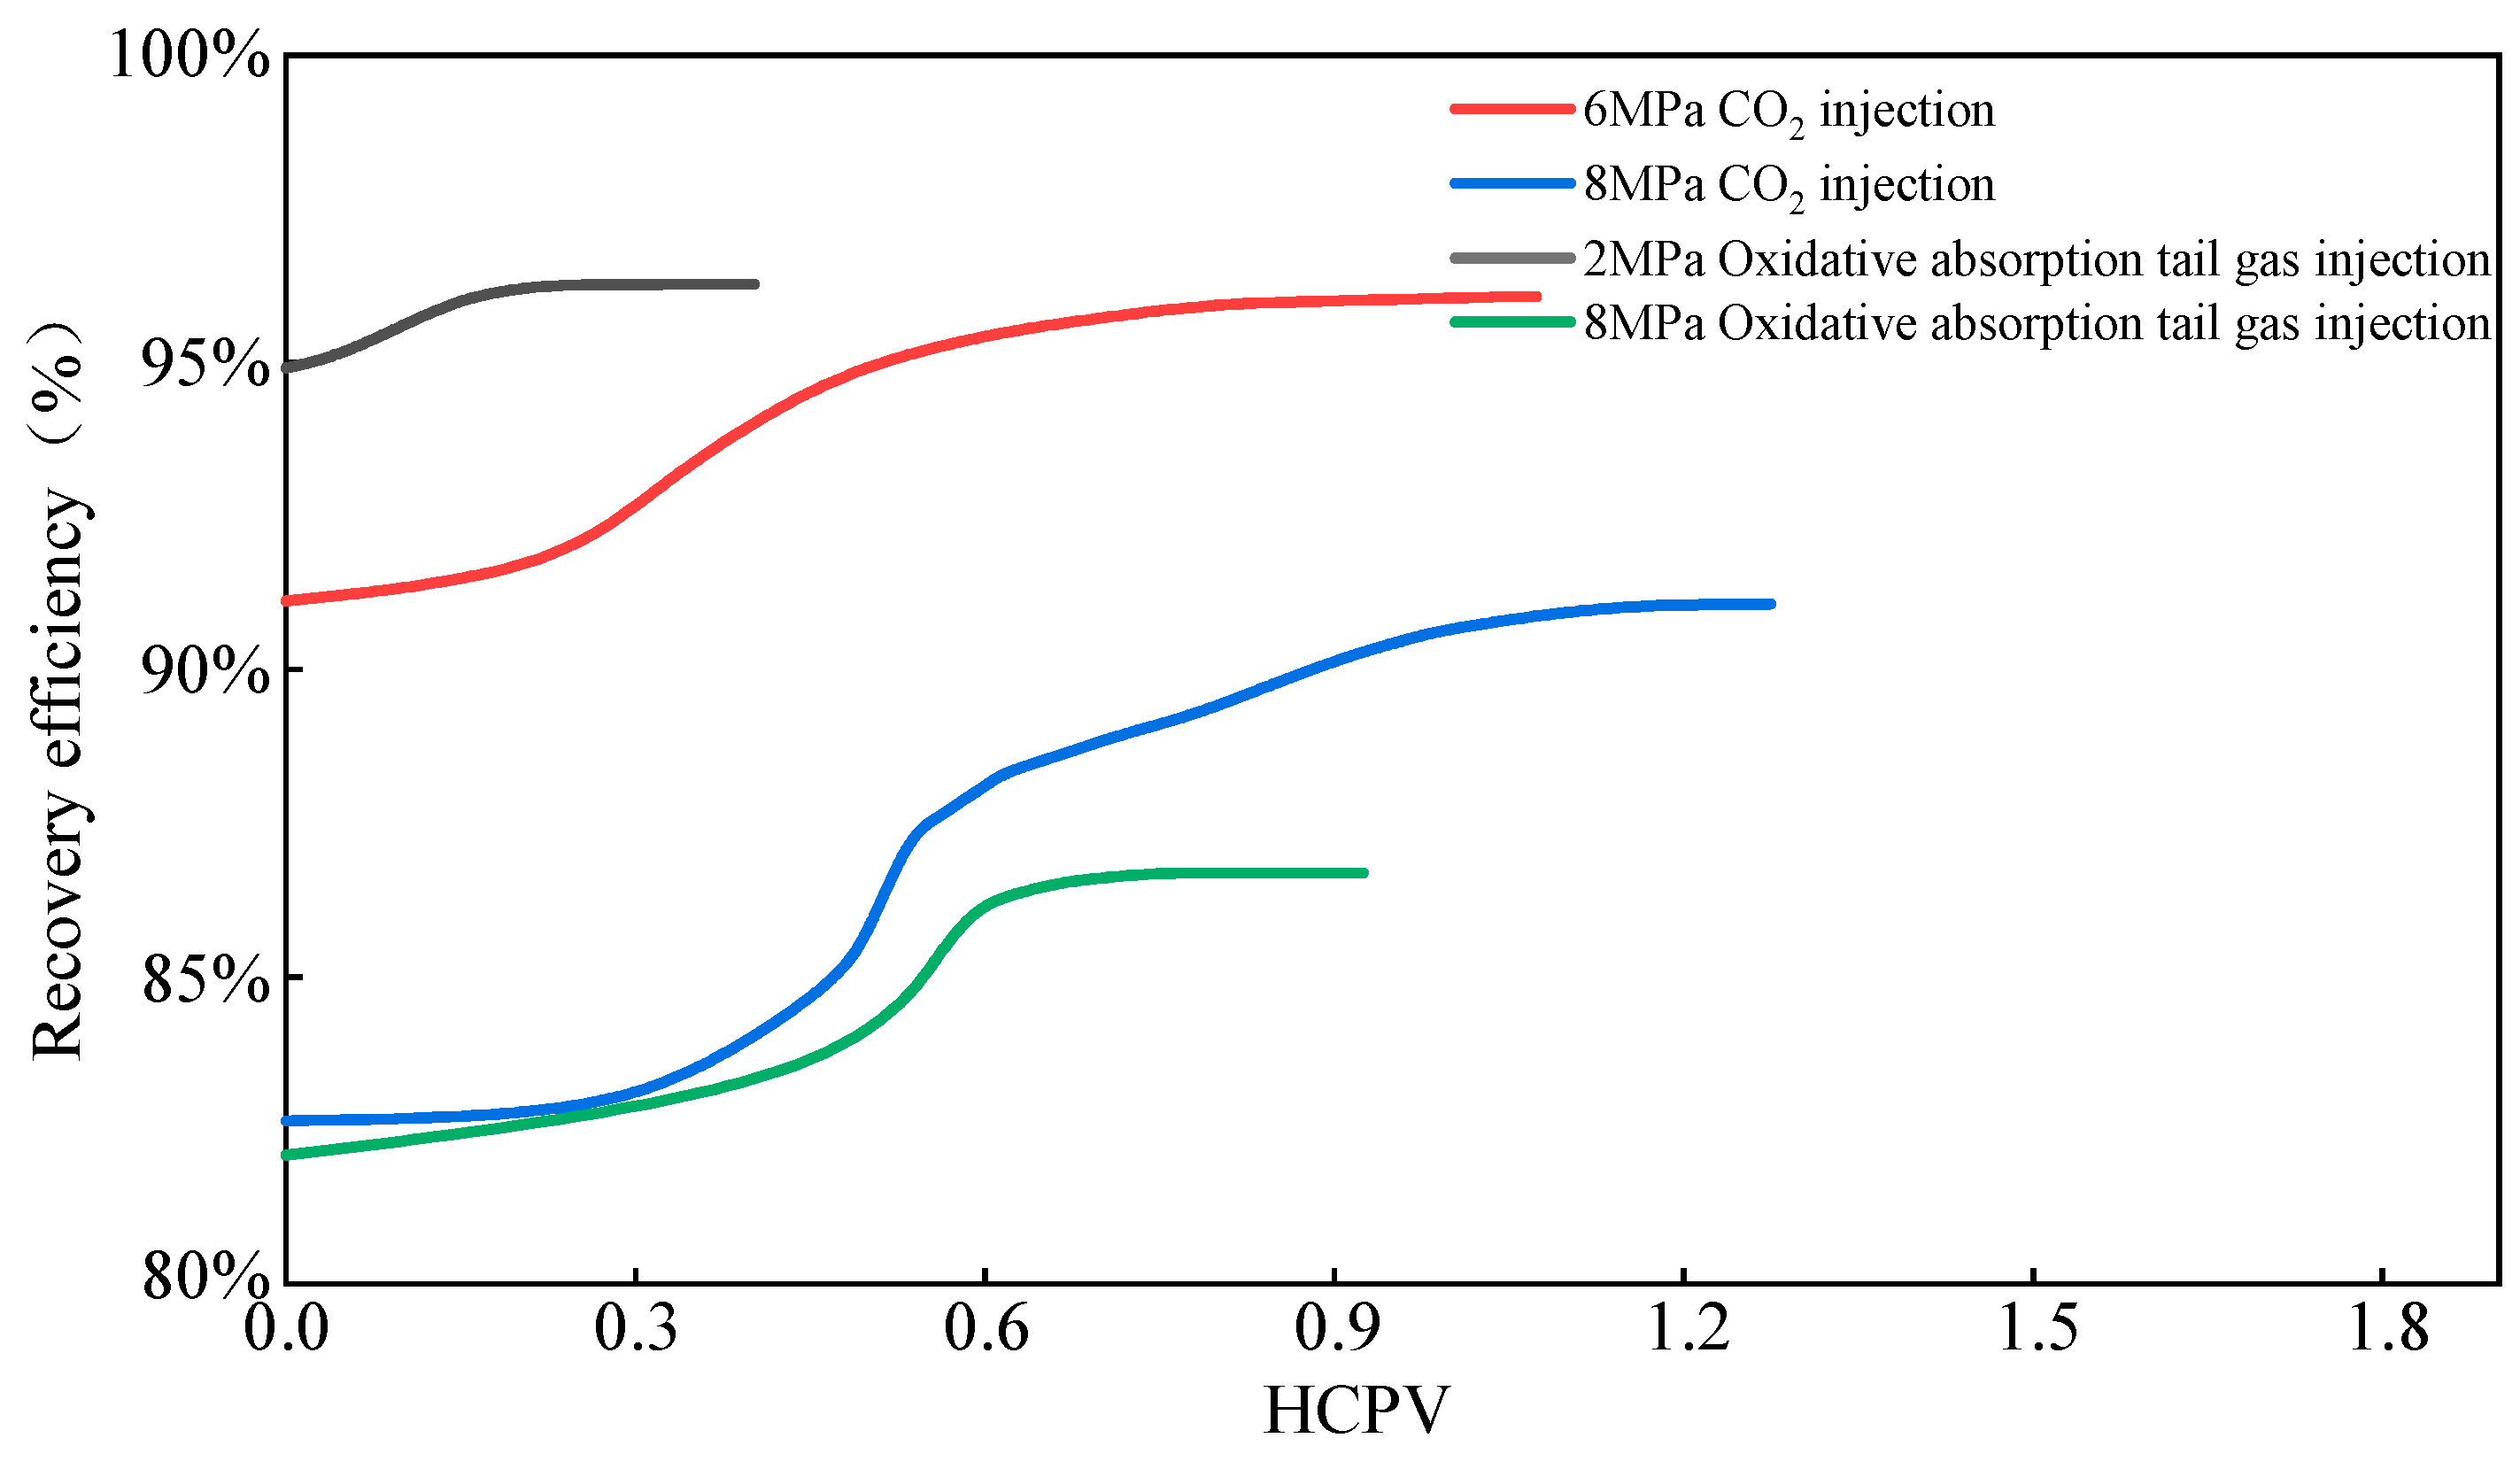
2.2.2. CO2 Injection for Gas Displacement—Ultimate Recovery

Figure 3 and Table 3 show the variation in CH4 recovery with the volume of injected gas occupying the core pores. Generally, as the gas injection displacement progressed, the CH4 recovery rate gradually increased. The gas injection displacement can be divided into three stages.
(1) Initial injection stage: The gas had just been injected, and the displacement effect was not yet evident. There was relatively little produced gas at the outlet, and CH4 recovery increased slowly.
(2) Middle injection stage: As injection continued, the displacement effect became pronounced. There was stable gas production at the outlet, and CH4 recovery increased rapidly.
(3) Late injection stage: Compared with the middle stage, although the gas production at the outlet remained on the same level, the increasing proportion of non-CH4 gases (CO2 and oxidation-absorption tail gas) in the core pores slowed the increase in CH4 recovery. When the CO2 and tail gas contents reached 95%, the CH4 recovery rate stabilized.
Figure 3 shows that the ultimate recovery rate ranged from 86.69% to 96.27%—that is, gas injection enhanced the recovery by 1.36% to 8.41%. CO2 injection at 6 MPa had a 3.45% lower enhancement effect than at 8 MPa but achieved a 5% higher ultimate recovery. Similarly, oxidation-absorption tail gas injection at 2 MPa had a 3.23% lower enhancement effect than at 8 MPa but achieved a 9.58% higher ultimate recovery. Furthermore, CO2 injection at 8 MPa had a 3.82% higher enhancement effect and a 4.38% higher ultimate recovery than tail gas injection at 8 MPa. These results indicate that gas injection significantly improves CH4 recovery. The earlier the injection timing, the more pronounced the enhancement effect. For better ultimate recovery, the highest possible depletion recovery should be achieved first during depletion-drive development. Moreover, under identical experimental conditions, pure CO2 injection is more effective in recovery enhancement than impurity gas (oxidation-absorption tail gas) injection.

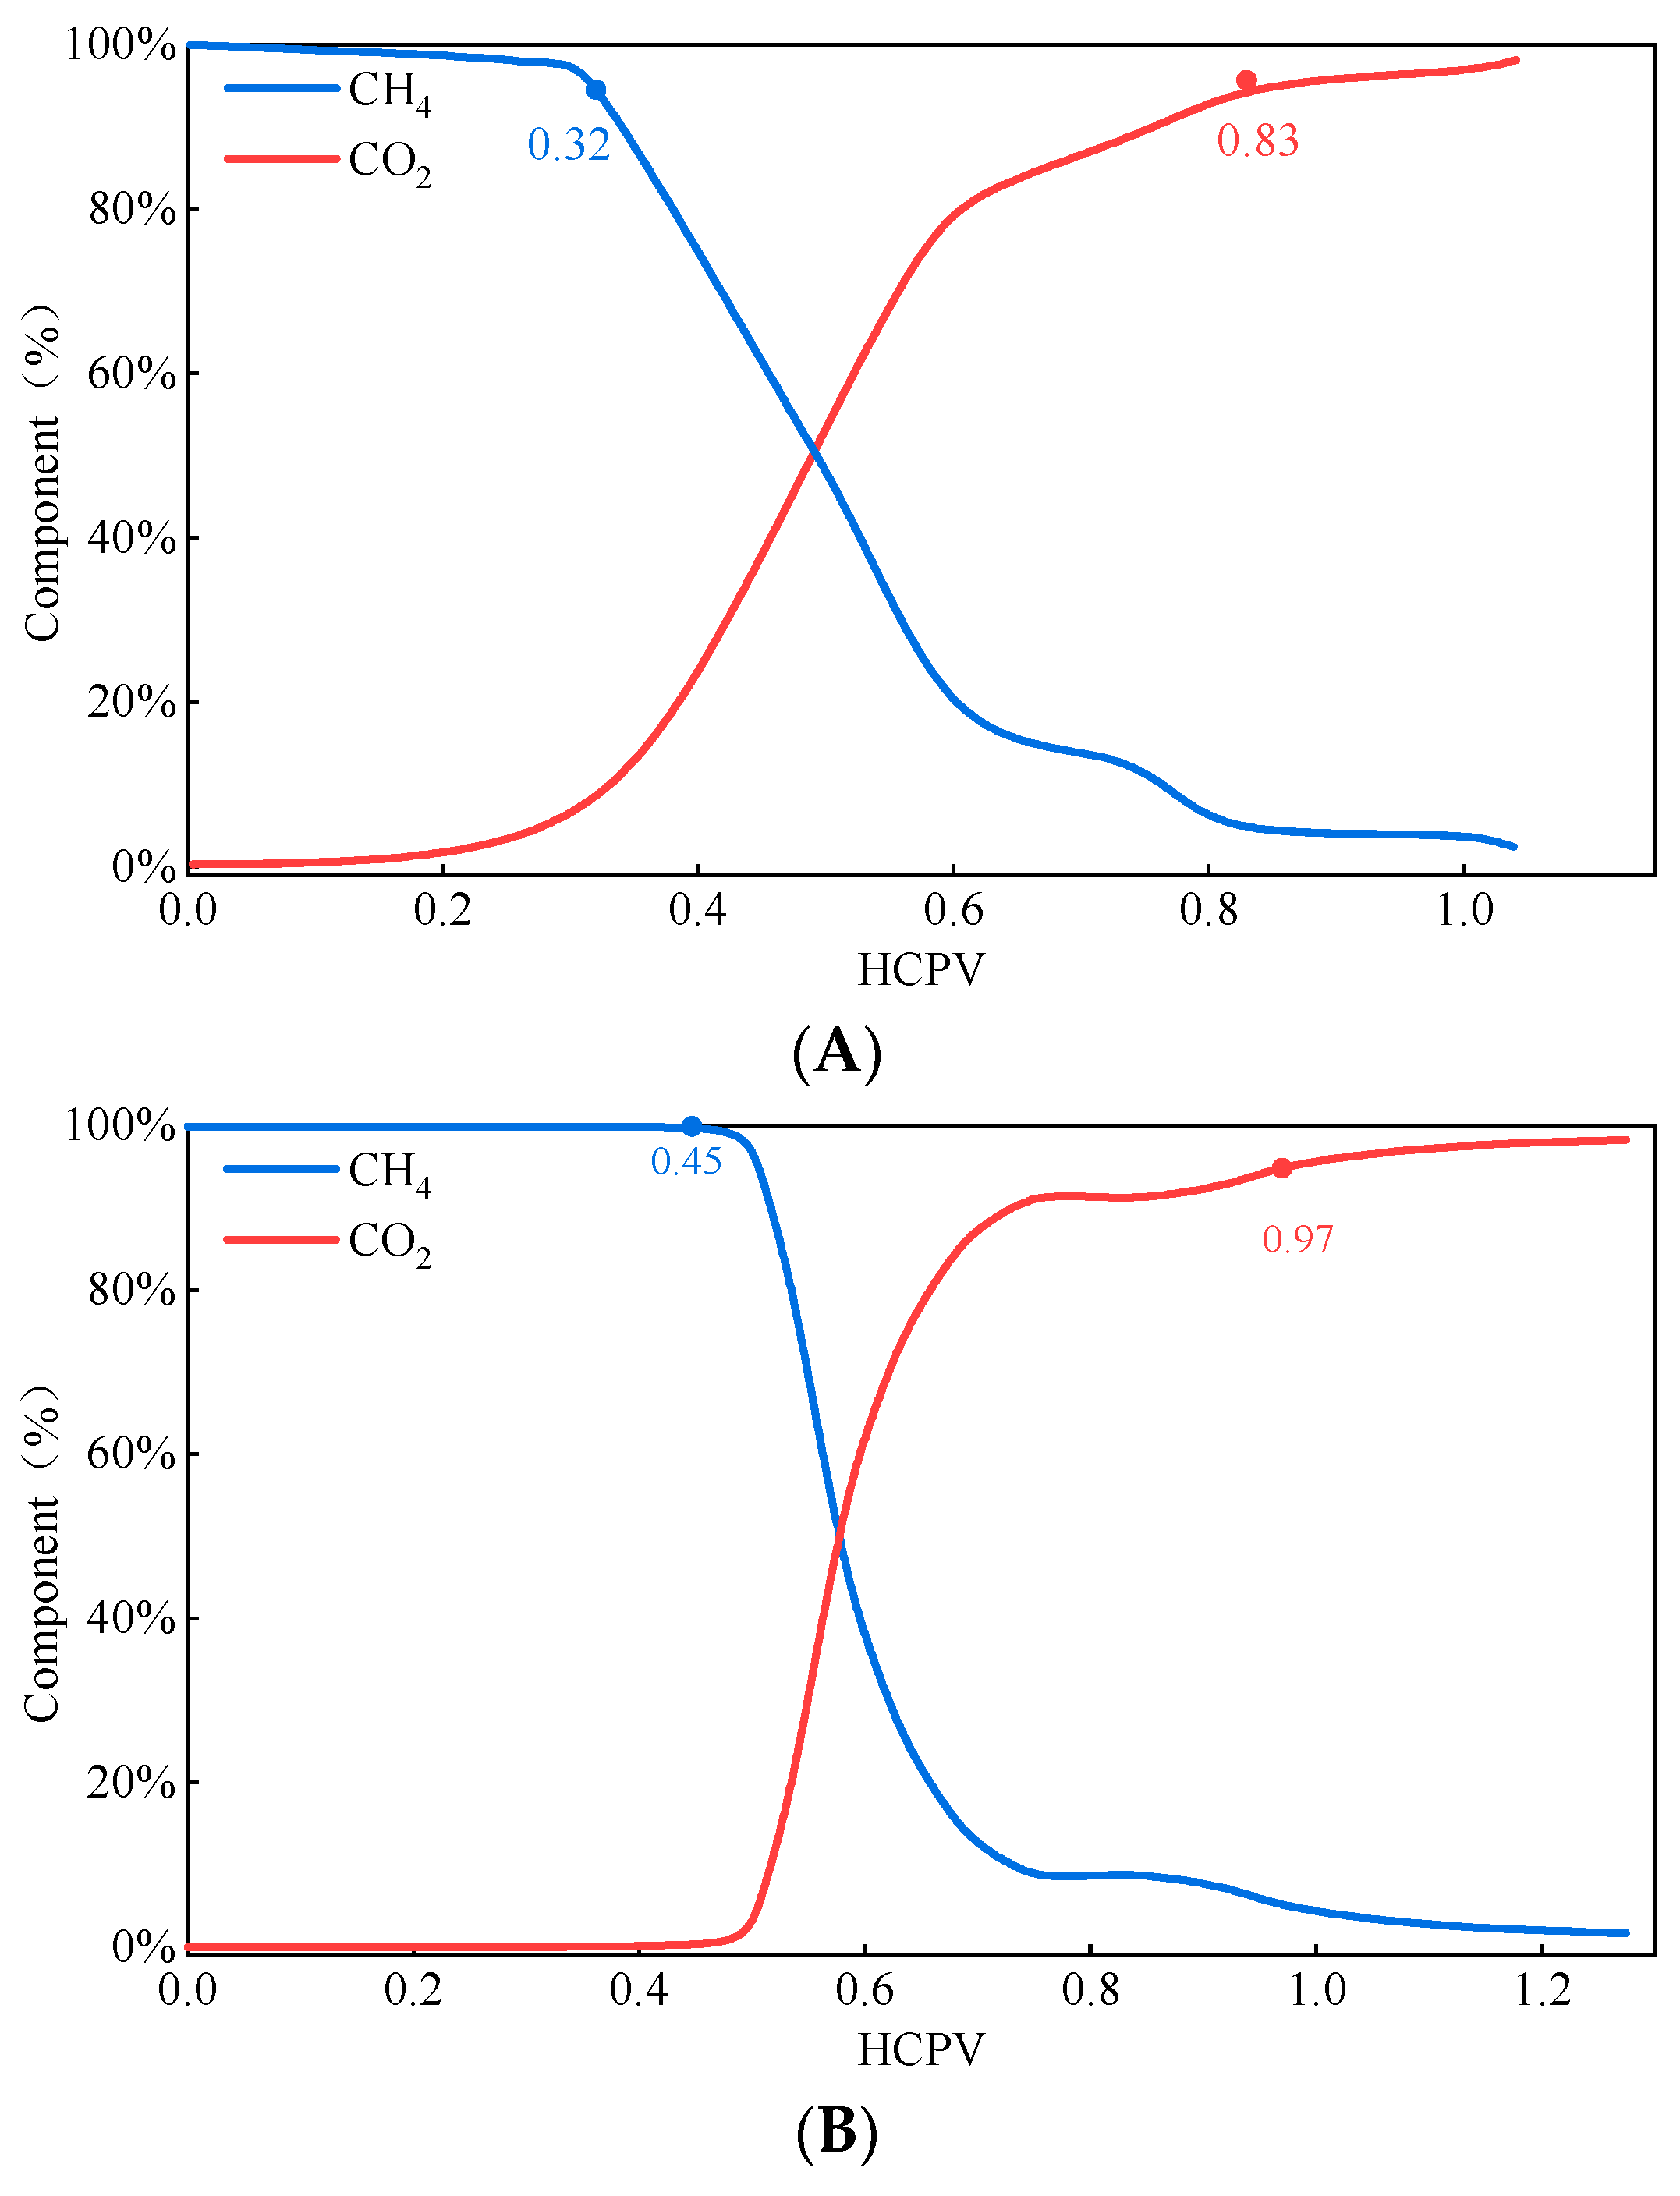
2.2.3. CO2 Injection for Gas Displacement—Gas Components

Figure 4 shows the variation of the gas components at the outlet as a function of the injected gas volume occupying the core pores. The gas component variation can be divided into two stages.
(1) No breakthrough stage: In the initial injection phase, the injected gas had not yet flowed through the core pores and fractures to the outlet. At that time, the gas at the outlet was 100% CH4.
(2) Continuous breakthrough stage: As the injected gas moved through the core pores and fractures to the outlet, the CO2 and oxidation-absorption tail gas contents at the outlet gradually increased, while the CH4 content in the core pores decreased. When the CO2 and tail gas contents at the outlet reached 95%, the gas injection displacement experiment concluded.
Comparing the CO2 injections at 6 and 8 MPa reveals that the breakthrough occurred 0.13 hydrocarbon pore volume (HCPV) later at 8 MPa than at 6 MPa. Similarly, oxidation-absorption tail gas injection at 8 MPa delayed the breakthrough by 0.443 HCPV from that of tail gas injection at 2 MPa. The experimental results indicate that the earlier the injection timing, the later the breakthrough. During the gas injection displacement process, more CO2 and oxidation-absorption tail gas were sequestered as the breakthrough time was delayed.

2.2.4. CO2 Injection for Gas Displacement—Pressure Variations

Figure 5 shows the inlet and outlet pressure variations with the volume of injected CO2. Because of the good gas flow characteristics of the artificial fractured core, the pressure difference between the inlet and outlet fluctuated within the range of 0–0.4 MPa during the displacement process. The overall pressure changes were relatively small. When the CO2 injection volume reached 0.5 HCPV, the pressure difference between the inlet and outlet gradually increased during gas injection displacement at 6 and 8 MPa.

3. CO2 Injection in Long-Core Models for Enhanced Gas Recovery and Sequestration Simulation

3.1. Core Model Parameters

Based on the long-core displacement experiments, a numerical model of a long core was developed using the GEM compositional module of the numerical simulation software CMG 2021.10 (Computer Modelling Group Ltd. Alberta, Canada), considering the porosity and permeability parameters and the bound water saturation of the actual core. The model consists of nine core sections, each 54 cm long, and a total of 18,000 grids. An injection well was placed at the first grid and a production well at the last grid. Pure CH4 was used to simulate natural gas within the model.
The core model parameter distribution is shown in Figure 6, and the core porosity parameters are listed in Table 4. The porosity ranged from 2.1% to 7.5%, the permeability ranged from 0.25 to 0.51 mD, and the bound water saturation was set at 15%.
The diffusion behavior of the multicomponent CO2 mixture within natural gas can lead to an early breakthrough, causing mixing, which reduces the economic value of natural gas and ultimately affects gas recovery. In addition, CO2 dissolution in formation water delays CO2 breakthrough, which also impacts ultimate recovery. For better accuracy, the proposed model considers both the diffusion of the CO2 mixture in natural gas and CO2 dissolution in water.

3.2. Mass-Conservation Equation

t β = A , G ϕ S β ρ β X β κ + β = A , G X β κ v β + J β κ = β = A , G X β κ q β
where t represents time in seconds (s); β denotes the phase, with β = A, G representing the aqueous and gaseous phases, respectively; κ denotes the mass component, with = m, c, ω representing CH4, CO2, and water components, respectively; ϕ is porosity; S β , is the saturation of phase; ρ β is the density of phase β , in kilograms per cubic meter (kg/m3); x k β is the mass fraction of component x in phase β ; v β is the mass flow velocity of phase β , in kilograms per square meter per second (kg/m2/s); J β κ is the mass diffusion rate of component κ in phase β , in kilograms per square meter per second (kg/m2/s); and q β is the mass flow rate per unit volume of phase β in the production or injection well, in kilograms per cubic meter per second (kg/m3/s).
Darcy’s law
v β = K K r β ρ β μ β ( p β ρ β g )
where K is the absolute permeability, in square meters (m2); K r β is the relative permeability of the β phase; μ β is the viscosity of the β phase, in pascal-seconds (Pa. s); p β is the pressure of the β phase, in pascals (Pa); and g is the gravity acceleration vector, in meters per second squared (m/s2).

3.3. Impact of Injection Purity on CO2 Displacement Efficiency and Sequestration

Given the high cost of CO2 separation and purification, CO2 is often captured from such sources as oxidizer boiler flue gas, oxidation-absorption tail gas, and hydrogen desulfurization tail gas. However, the gas thus acquired typically has a low purity. Thus, in this study, the effects of varying CO2 purity on displacement efficiency and sequestration were investigated.
After dewatering, the main impurities in the three types of tail gas (oxidizer boiler flue gas, oxidation-absorption tail gas, and hydrogen desulfurization tail gas) were N2 and O2. There were very few harmful gases, such as H2S and SO2. Ignoring these harmful gases, the average concentrations of the main components were normalized, resulting in the following compositions: oxidizer boiler flue gas (13% CO2 + 82% N2 + 5% O2), oxidation-absorption tail gas (28% CO2 + 67% N2 + 5% O2), and hydrogen desulfurization tail gas (32% CO2 + 68% N2).
Following depletion to 6 MPa, CO2 was injected at 0.2 mL/min to 1.2 times the HCPV using the three types of tail gas and pure CO2. The variation in injection gas content within the produced gas with injection volume is shown in Figure 7, while the CH4 content distribution for different gases is depicted in Figure 8.
As Figure 7 shows, higher impurity content led to earlier breakthrough and slower post-breakthrough increase in injection gas content in the produced gas. The CH4 content distribution indicates that higher impurity content resulted in greater mixing due to diffusion, extending the CO2–CH4 mixing zone and causing earlier injection gas breakthrough.
The simulation results in Figure 8 reveal that impurities in injected CO2 enhanced CO2–CH4 mixing, reducing the improvement in recovery. They also lowered the CO2 content in the injected gas, which in turn suppressed the final CO2 storage rate.

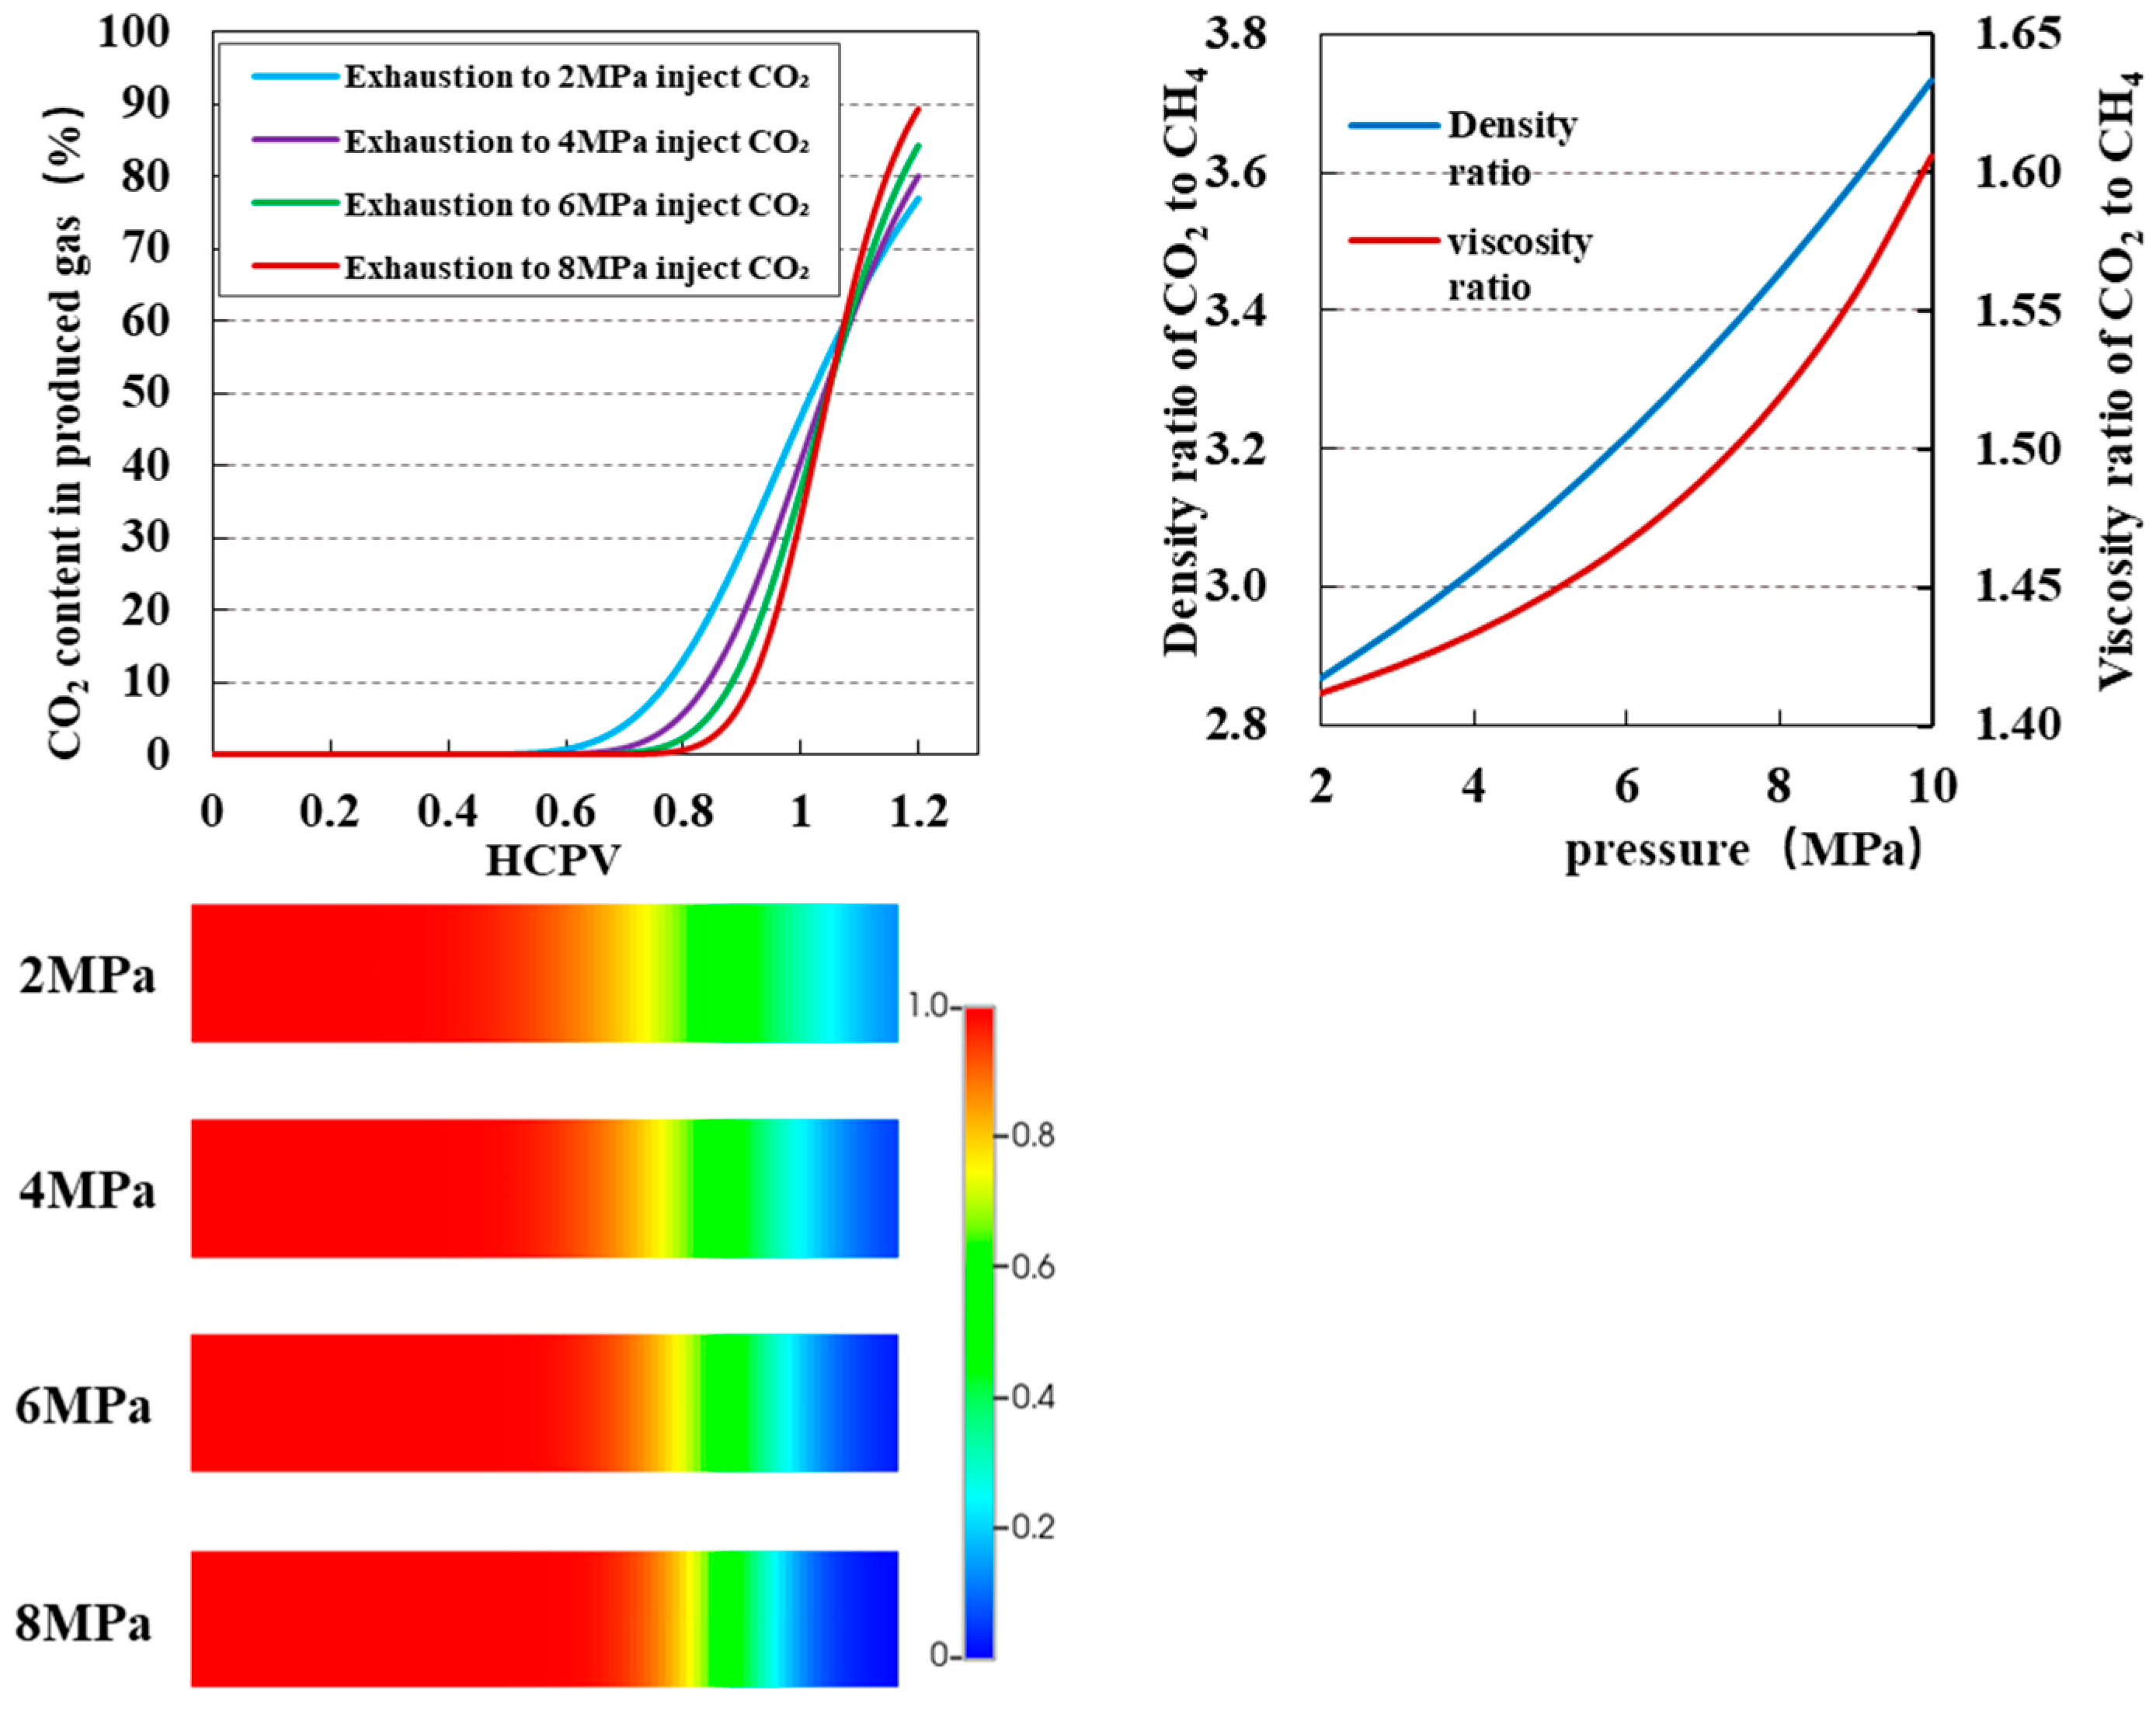
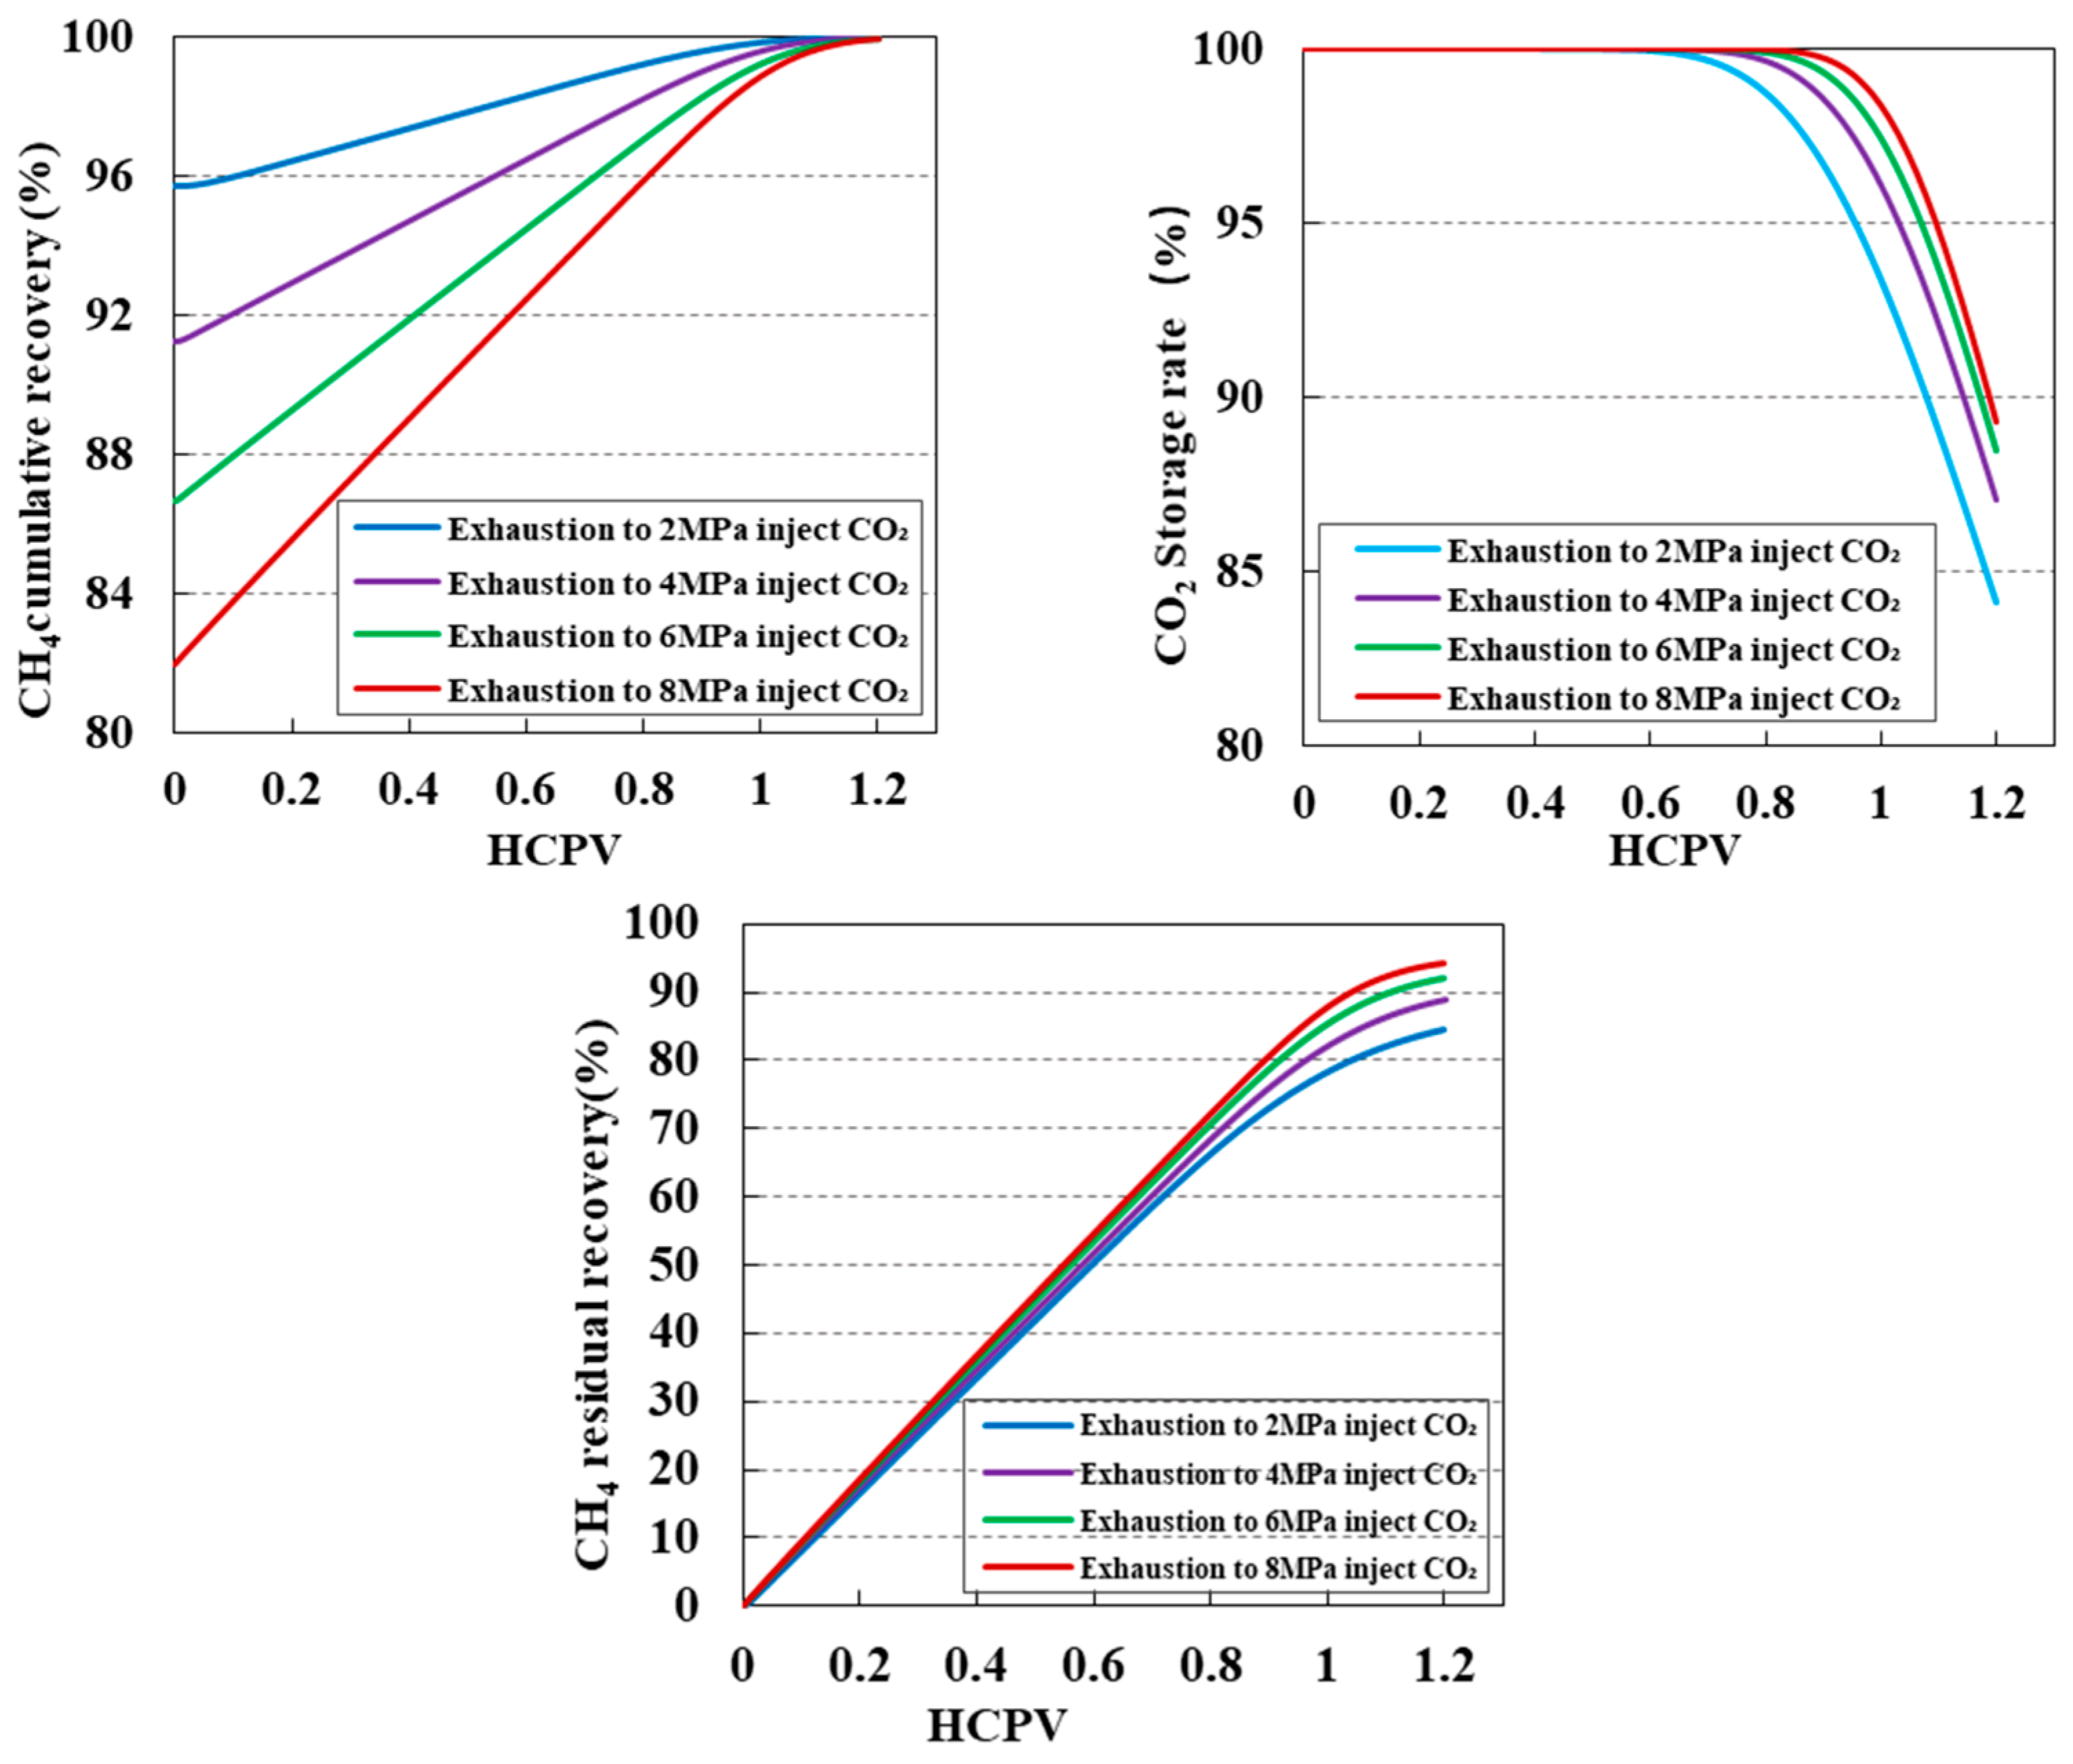
3.4. Impact of Injection Timing on CO2 Displacement Efficiency and Sequestration

After the reservoir pressure depleted to 2, 4, 6, and 8 MPa, CO2 was injected at 0.2 mL/min to 1.2 times the HCPV to study the impact on gas recovery. The variation in CO2 content in the produced gas with injection volume, the CO2/CH4 density and viscosity ratios with pressure, and CO2 content distribution are shown in Figure 9. The variations in residual gas recovery, its cumulative recovery, and CO2 storage rate with injection volume are illustrated in Figure 10.
As shown in Figure 9, increasing the injection pressure delayed CO2 breakthrough but accelerated CO2 content growth after breakthrough. Under higher pressure, CO2 displayed its supercritical characteristics, which increased the CO2/CH4 density and viscosity ratios. The growing physical property difference shortened the CO2–CH4 mixing zone, delayed CO2 breakthrough, and slowed down the breakthrough speed thereafter.
Figure 10 shows that when gas was injected at reservoir pressures of 2, 4, 6, and 8 MPa, the higher the injection pressure, the greater the residual gas content. Furthermore, as the physical property differences between CO2 and CH4 increased, CO2 acted like a piston in the displacement of CH4. The recovery rate of residual gas increased after CO2 injection, enhancing the recovery degree, but the ultimate recovery decreased. With higher injection pressures, CO2 was sequestered in a supercritical state, increasing the final storage rate.

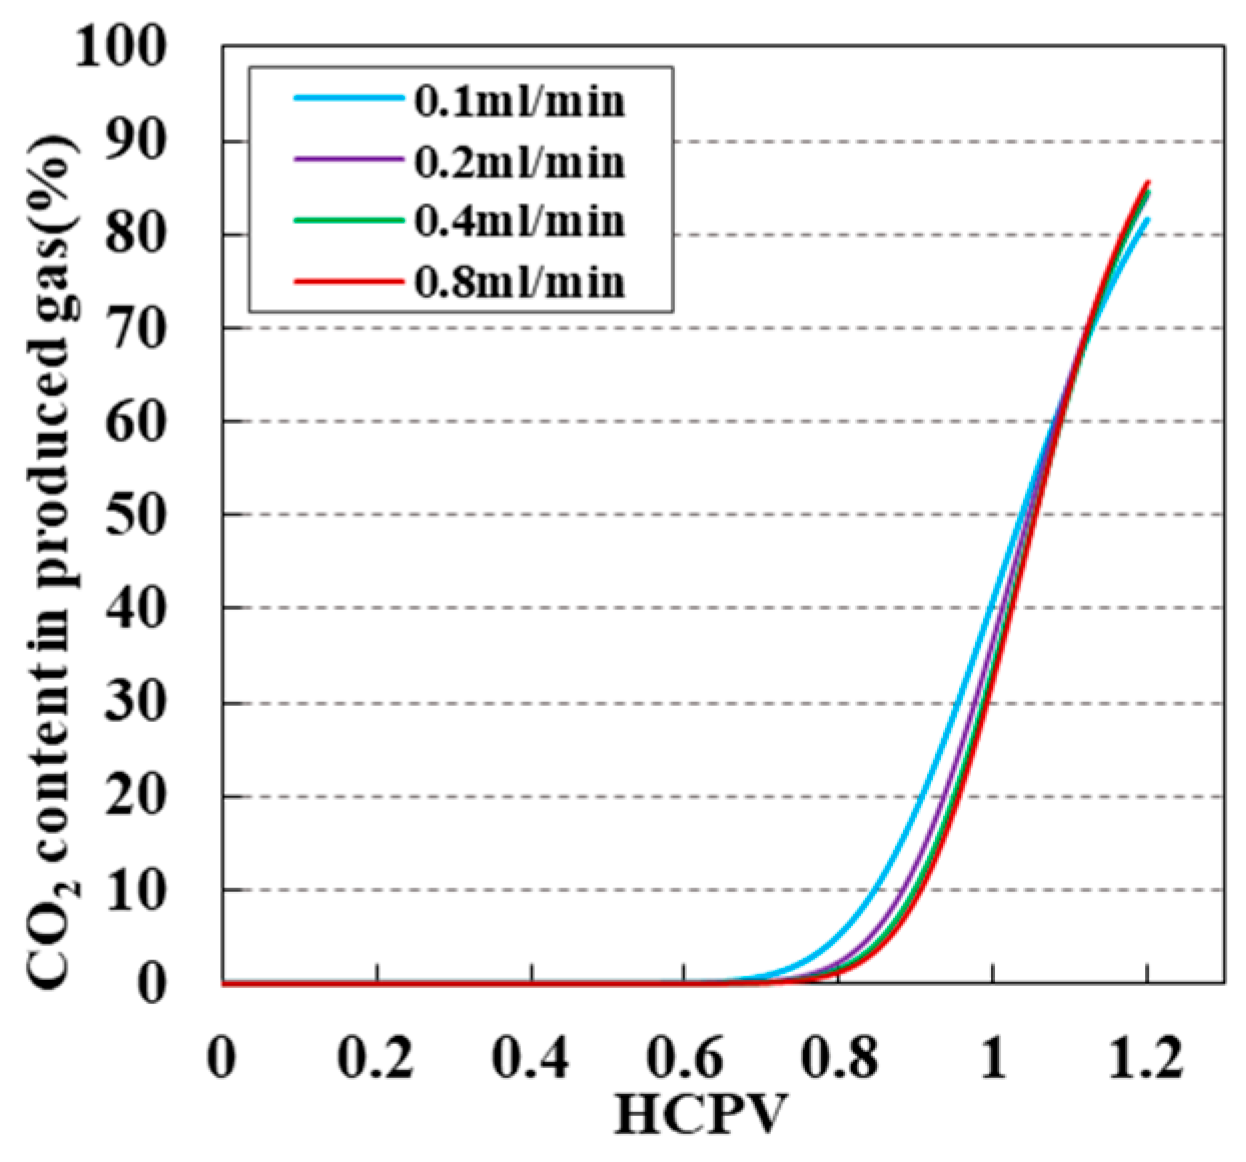
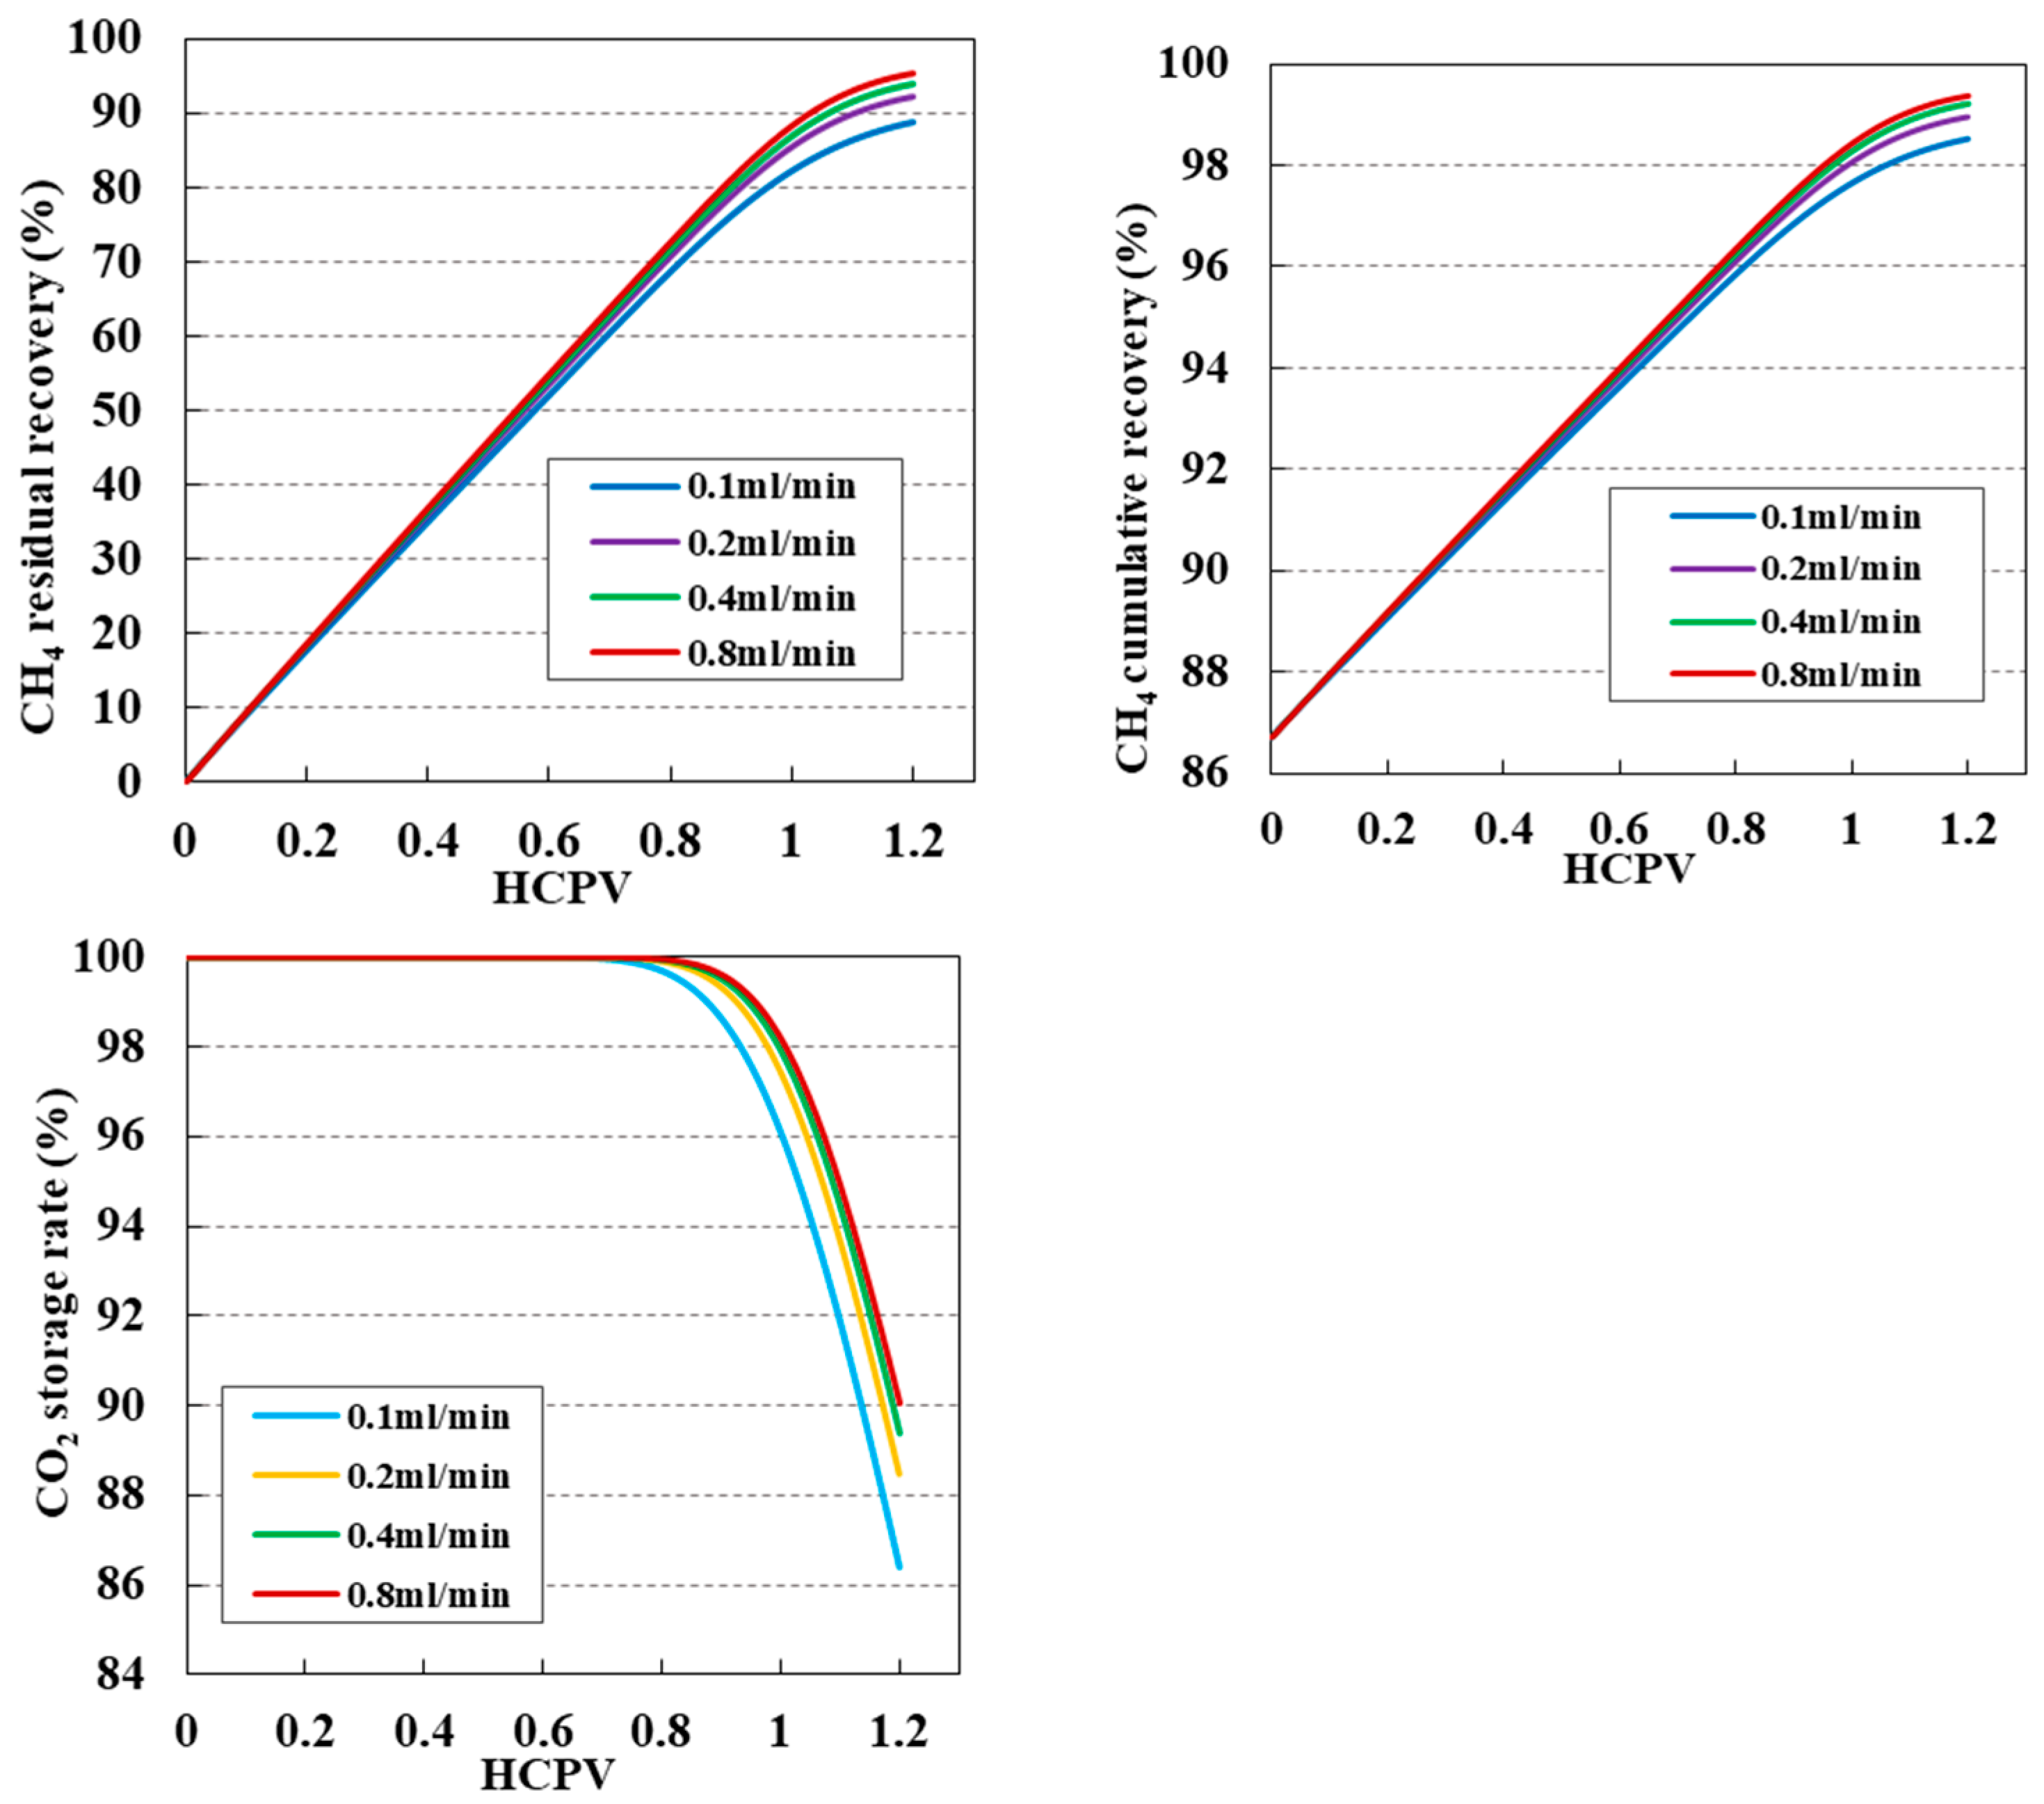
3.5. Impact of Injection Speed on CO2 Displacement Efficiency and Sequestration

When the reservoir pressure was depleted to 6 MPa, CO2 was injected at speeds of 0.1, 0.2, 0.4, and 0.8 mL/min to 1.2 times the HCPV to simulate the enhancement effect on gas recovery. The variation in CO2 content in the produced gas with injection volume and CO2 content distribution is shown in Figure 11, while the variations in residual gas recovery, its cumulative recovery, and CO2 storage rate with injection volume are illustrated in Figure 12.
Figure 11 indicates that higher injection speeds corresponded to larger injection volumes at the time of CO2 breakthrough. With the same injection volume, slower injection speeds caused earlier CO2 breakthrough. The CO2 distribution shows stronger diffusion effects at lower injection speeds, extending the CO2–CH4 transition zone.
As shown in Figure 12, residual gas recovery and the degree of enhanced recovery increased with injection speed, but this increase slowed significantly after the injection speed surpassed 0.2 mL/min. Higher injection speeds caused earlier CO2 breakthrough at the production well. Therefore, the CO2 storage rate decreased with increasing injection speed when the injection volume remained stable. The impact of injection speed on storage rate decreased after it moved beyond 0.2 mL/min.

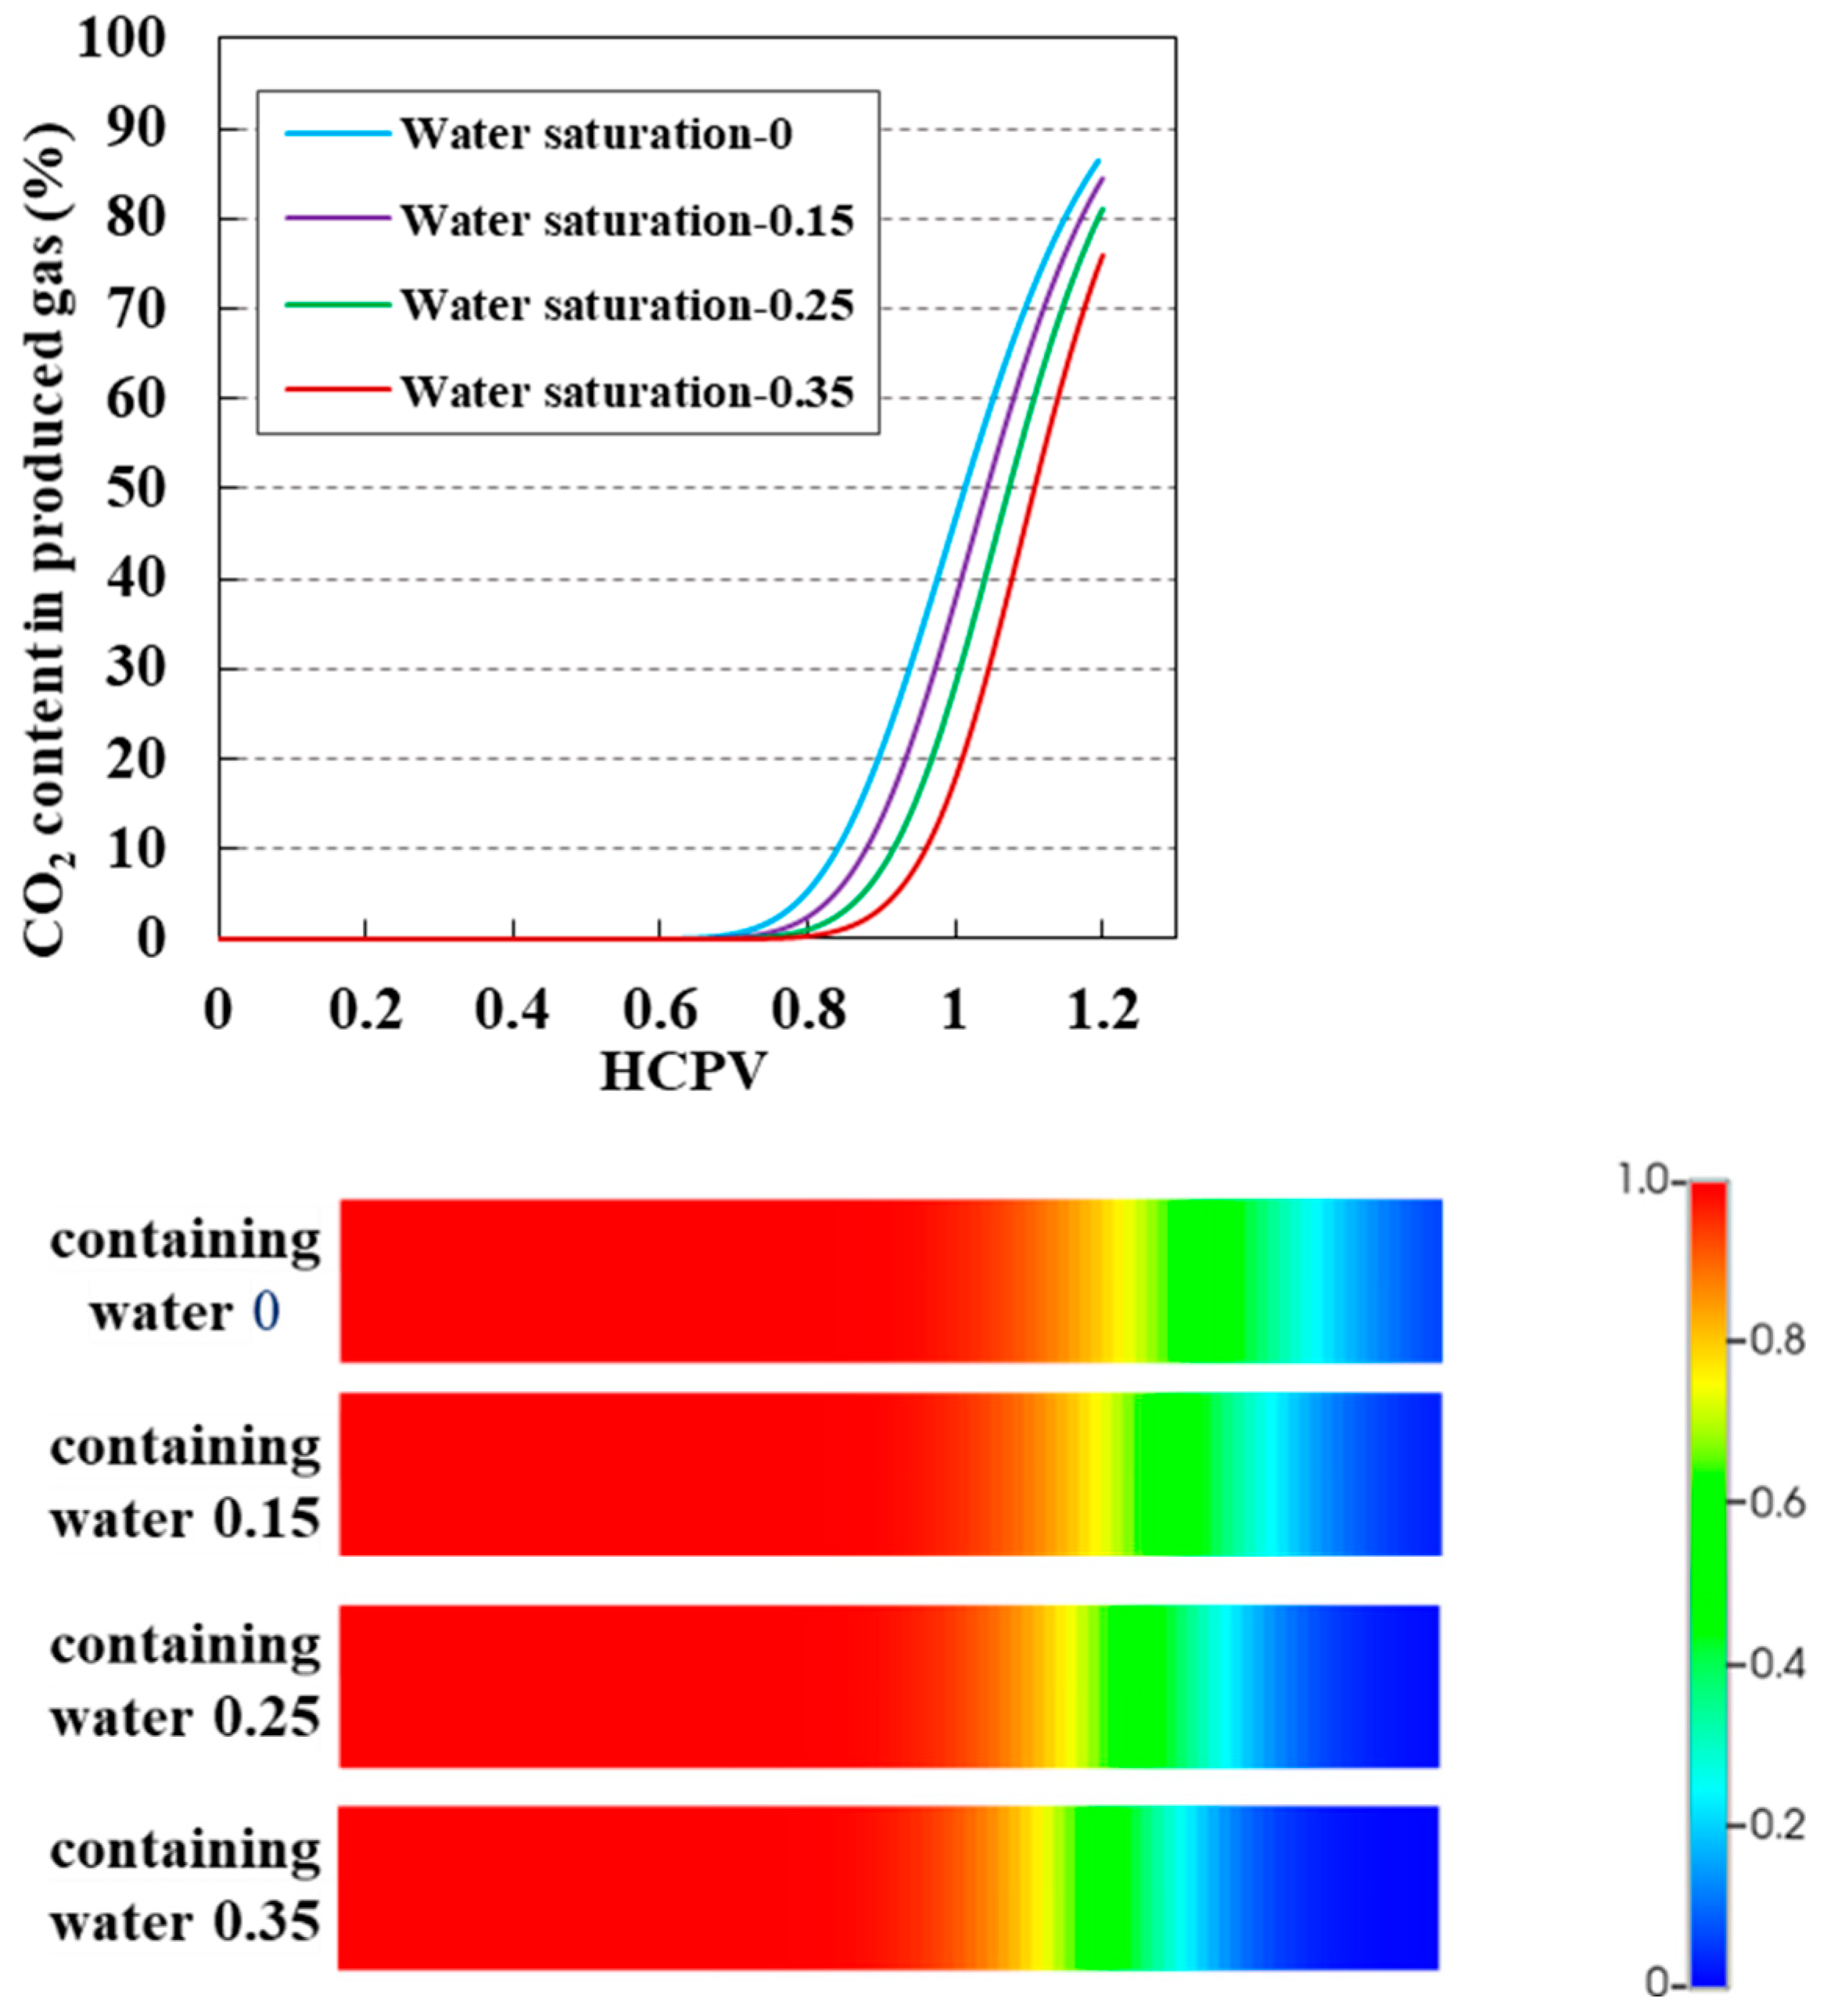
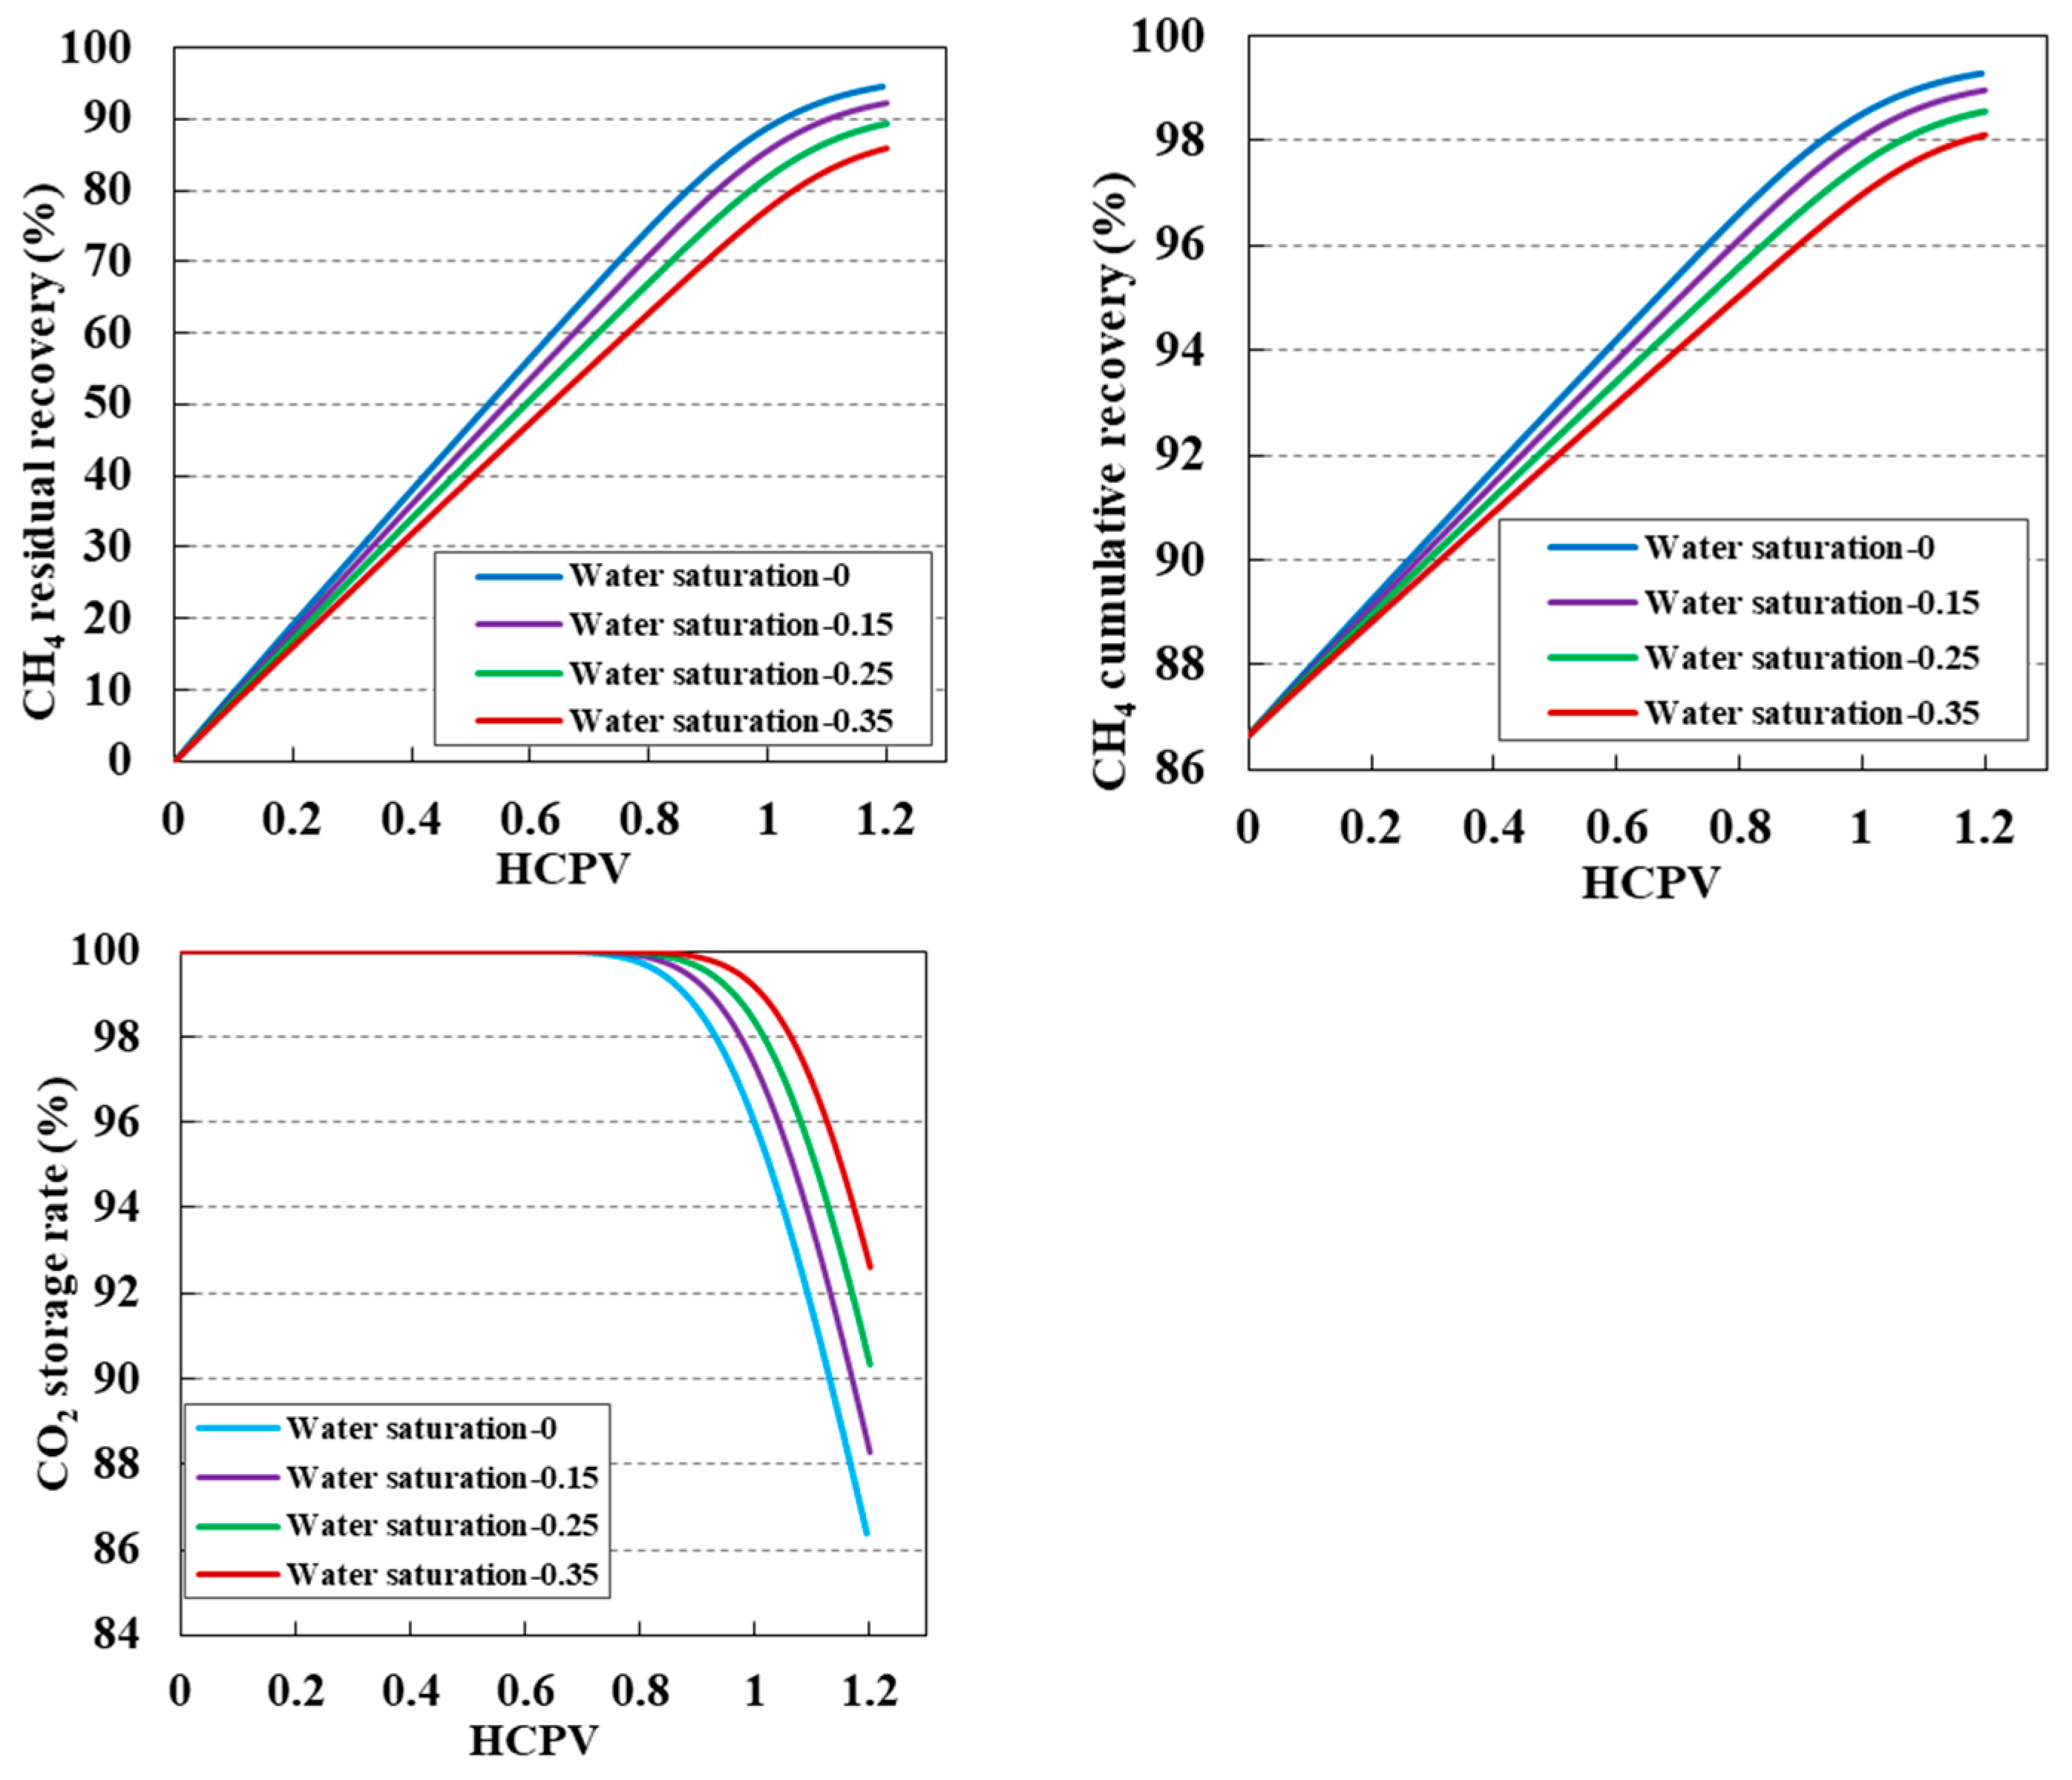
3.6. Impact of Reservoir Bound Water Saturation on CO2 Displacement Efficiency and Sequestration

Bound water saturation levels were set at 0, 0.15, 0.25, and 0.35. When the reservoir pressure depleted to 6 MPa, CO2 was injected at 0.2 mL/min to 1.2 times the HCPV to simulate the enhancement of gas recovery and carbon sequestration. The variation in CO2 content in the produced gas with injection volume and CH4 content distribution is shown in Figure 13, while the variations in residual gas recovery, its cumulative recovery, and CO2 storage rate with injection volume at different bound water saturation levels are illustrated in Figure 14.
Figure 13 shows that higher bound water saturation caused more CO2 to dissolve in water. The growth of dissolved CO2 reduced the amount of free CO2 participating in displacement. This shortened the CO2–CH4 mixing zone and delayed CO2 breakthrough.
As shown in Figure 14, because of the presence of bound water, the dissolution loss of CO2 in water reduced its sweep efficiency during CH4 displacement, suppressing the effectiveness of recovery enhancement. As bound water saturation increased, more CO2 dissolved in water. This delayed CO2 breakthrough and boosted the CO2 storage rate.

4. Conclusions

(1) The long-core displacement experiments indicated that, as gas reservoirs undergo depletion-drive development to lower formation pressures, the degree of CH4 recovery increases. The later the injection timing, the lower the formation pressure, the less CO2 injection volume required to produce flow at the outlet end, and the sooner the CO2 breakthrough, leading to a shorter stable production period. The degree of enhanced recovery with CO2 injection decreases, but the ultimate recovery increases. Under identical experimental conditions, pure CO2 shows better enhancement and ultimate recovery effects than impurity gases.
(2) Numerical simulations revealed that the impurity gases in the injected CO2 increase CO2–CH4 mixing, reducing the degree of enhanced recovery and the CO2 content in the injection gas. This ultimately lowers the CO2 storage rate.
(3) With higher formation pressure during CO2 injection, the CO2–CH4 density and viscosity ratios increase, which in turn delays CO2 breakthrough. After the breakthrough, the breakthrough speed slows, enhancing the degree of recovery and ultimate recovery.
(4) Higher CO2 injection speeds result in greater CO2 injection volumes at breakthrough, leading to higher degrees of CH4 recovery and CO2 sequestration. At lower injection speeds, CO2 diffusion is more pronounced, extending the CO2–CH4 mixing zone.
(5) Higher bound water content causes more CO2 to dissolve in water, which shortens the CO2–CH4 mixing zone and delays CO2 breakthrough. In this case, more CO2 is sequestered in water, reducing the degree of CH4 production enhancement.

Author Contributions

Conceptualization, Z.Z. and S.W.; methodology, M.W.; software, C.C.; validation, L.Z. and C.Y.; formal analysis, Z.Z. and M.W.; data curation, L.L.; writing—original draft preparation, M.W.; writing—review and editing, Z.Z.; funding acquisition, S.W. All authors have read and agreed to the published version of the manuscript.

Funding

This research was funded by National Natural Science Foundation of China Project “Multi-field Coupled Transport Law of Carbon Dioxide Buried in Depleted Gas Reservoirs and Intelligent Safety Monitoring and Evaluation”, grant number U23B20160.

Data Availability Statement

The datasets generated and/or analyzed during the current study are available from the corresponding author on reasonable request.

Acknowledgments

Thanks go to the science and technology management department of the PetroChina Southwest Oil and Gas Field Company and leaders at all levels for their support of this project research, as well as thanks to Southwest Petroleum University for its help.

Conflicts of Interest

Authors Shaomu Wen and Changcheng Yang were employed by the PetroChina Southwest Oil & Gasfield Company. Authors Mengyu Wang, Lianjin Zhang and Longxin Li were employed by the Exploration and Development Research Institute, PetroChina Southwest Oil & Gasfield Company. The remaining authors declare that the research was conducted in the absence of any commercial or financial relationships that could be construed as a potential conflict of interest.

References

  1. EI. Statistical Review of World Energy. 2023. Available online: https://www.energyinst.org/__data/assets/pdf_file/0004/1055542/EI_Stat_Review_PDF_single_3.pdf (accessed on 26 June 2023).
  2. Wang, Z.; Kong, Y.; Li, W. Review on the development of China’s natural gas industry in the background of “carbon neutrality”. Nat. Gas Ind. 2021, 41, 194–202. [Google Scholar] [CrossRef]
  3. Guo, P.; Jing, S.; Peng, C. Technology and countermeasures for gas recovery enhancement. Nat. Gas Ind. 2014, 34, 48–55. [Google Scholar]
  4. Van der Burgt, M.; Cantle, J.; Boutkan, V.J.E.C. Carbon dioxide disposal from coal-based IGCC’s in depleted gas fields. Energy Convers. Manag. 1992, 33, 603–610. [Google Scholar] [CrossRef]
  5. Zhang, L.; Cao, C.; Wen, S.; Zhao, Y.; Peng, X.; Wu, J. Thoughts on the developmengt of CO2-EGR under the background of carbon peak and carbon neutrality. Nat. Gas Ind. 2023, 43, 13–22. [Google Scholar]
  6. Kubus, P. CCS and CO2-storage possibilities in Hungary. In Proceedings of the SPE International Conference on CO2 Capture, Storage, and Utilization, New Orleans, Louisiana, USA, 10 November 2010; OnePetro: Richardson, TX, USA, 2010. [Google Scholar]
  7. Pooladi-Darvish, M.; Hong, H.; Theys, S.S.R.; Bachu, S.; Dashtgard, S. CO2 injection for enhanced gas recovery and geological storage of CO2 in the Long Coulee Glauconite F Pool, Alberta. In Proceedings of the SPE Annual Technical Conference and Exhibition? Denver, CO, USA, 21 September 2008; SPE: Lumpur, Malaysia, 2008. [Google Scholar]
  8. Jenkins, C.R.; Cook, P.J.; Ennis-King, J.; Urosevic, M. Safe storage and effective monitoring of CO2 in depleted gas fields. Proc. Natl. Acad. Sci. USA 2012, 109, E35–E41. [Google Scholar] [CrossRef] [PubMed]
  9. Van der Meer, L.; Kreft, E.; Geel, C.; Hartman, J. K12-B a test site for CO2 storage and enhanced gas recovery. In Proceedings of the SPE Europec Featured at EAGE Conference and Exhibition? Madrid, Spain, 13–16 June 2005; SPE: Lumpur, Malaysia, 2005. [Google Scholar]
  10. Ye, J.; Feng, S.; Fan, Z.; William, D.G.; Wang, S.; Robinson, J.R. Micro-pilot test for enhanced coalbed methane recovery by injecting carbon dioxide in south part of Qinshui Basin. Acta Pet. Sin. 2007, 28, 77–80. [Google Scholar]
  11. Shi, Y.; Jia, Y.; Pan, W.; Yan, J.; Huang, L. Mechanism of supercritical CO2 flooding in low-permeability tight gas reservoirs. Oil Gas Geol. 2017, 38, 610–616. [Google Scholar]
  12. Oldenburg, C.; Pruess, K.; Benson, S.M. Process modeling of CO2 injection into natural gas reservoirs for carbon sequestration and enhanced gas recovery. Energy Fuels 2001, 15, 293–298. [Google Scholar] [CrossRef]
  13. Gao, Y. Evaluation of the Effect of Replacing Shale Gas with Supercritical CO2 in Shale. Master’s Thesis, Southwest Petroleum University, Chengdu, China, 2016. [Google Scholar]
  14. Ding, J.; Yan, C.; Wang, G.; He, Y.; Zhao, R. Competitive adsorption between CO2 and CH4 in tight sandstone and its influence on CO2-injection enhanced gas recovery (EGR). Int. J. Greenh. Gas Control 2022, 113, 103530. [Google Scholar] [CrossRef]
  15. Al-Hashami, A.; Ren, S.; Tohidi, B. CO2 injection for enhanced gas recovery and geo-storage: Reservoir simulation and economics. In Proceedings of the SPE Europec/EAGE Annual Conference, Madrid Spain, 13–16 June 2005; OnePetro: Richardson, TX, USA, 2005. [Google Scholar]
  16. Nogueira de Mago, M.C. Effect of Flue Gas Impurities on the Process of Injection and Storage of Carbon Dioxide in Depleted Gas Reservoirs. Master’s Thesis, Texas A&M University, College Station, TX, USA, 2005. [Google Scholar]
  17. Cao, C.; Hou, Z.; Li, Z.; Pu, X.; Liao, J.; Wang, G. Numerical modeling for CO2 storage with impurities associated with enhanced gas recovery in depleted gas reservoirs. J. Nat. Gas Sci. Eng. 2022, 102, 104554. [Google Scholar] [CrossRef]
  18. Sun, Y.; Sun, R.; Liu, X.; Li, S. Mechanism of enhanced gas recovery in shale gas reservoirs based on competitive adsorption. Xinjiang Pet. Geol. 2021, 42, 224–231. [Google Scholar]
  19. Du, J.; Zhao, Y.; Guo, P.; Zhao, Q. Experimental research on recovery rfficiency improvement by CO2 injection in tight gas reservoirs in northern hubei. Sci. Technol. Eng. 2020, 20, 6459–6465. [Google Scholar]
  20. Turta, A.T.; Sim, S.S.; Singhal, A.K.; Hawkins, B.F. Basic investigations on enhanced gas recovery by gas-gas displacement. J. Can. Pet. Technol. 2008, 47, PETSOC-08-10-39. [Google Scholar] [CrossRef]
Figure 1. Schematic diagram of the EGR core displacement experimental system.
Processes 12 01663 g001
Figure 2. Curves of gas recovery factor and the differential pressure between the inlet and outlet under various inlet pressures.
Processes 12 01663 g002
Figure 3. CH4 recovery curves at different injection volumes.
Processes 12 01663 g003
Figure 4. Proportion curves of produced gas components after CO2 injection at 2, 6, and 8 MPa. (A) Produced gas components of CO2 injection at 6 MPa. (B) Produced gas components of CO2 injection at 8 MPa. (C) Produced gas components of oxidation-absorption tail gas injection at 2 MPa. (D) Produced gas components of oxidation-absorption tail gas injection at 8 MPa.
Processes 12 01663 g004aProcesses 12 01663 g004b
Figure 5. Pressure curves at different CO2 injection volumes.
Processes 12 01663 g005
Figure 6. Core model parameter distribution diagram.
Processes 12 01663 g006
Figure 7. Injection gas content curves in produced gas with injection volume and the distribution of CH4 content (0.8 HCPV).
Processes 12 01663 g007
Figure 8. Residual gas recovery, cumulative recovery, and CO2 storage rate curves at different injection volumes.
Processes 12 01663 g008
Figure 9. CO2 content curves of produced gas at different injection volumes, CO2/CH4 density ratio and viscosity ratio curves at different pressures, and distributions of CO2 content (0.8 HCPV).
Processes 12 01663 g009
Figure 10. Residual gas recovery, cumulative recovery, and CO2 storage rate curves at different injection volumes.
Processes 12 01663 g010
Figure 11. CO2 content curves of produced gas at different injection volumes and distributions of CO2 content (0.8 HCPV).
Processes 12 01663 g011aProcesses 12 01663 g011b
Figure 12. Residual gas recovery, cumulative recovery, and CO2 storage rate curves at different injection volumes.
Processes 12 01663 g012
Figure 13. CO2 content curves of produced gas with injection volumes and distributions of CO2 content (0.8 HCPV).
Processes 12 01663 g013
Figure 14. Residual gas recovery, cumulative recovery, and CO2 storage rate curves at different injection volumes.
Processes 12 01663 g014
Table 1. Carbonate rock core parameters.
SNCore NumberLength (cm)Permeability (mD)Porosity (%)
13-22-424.3742.792.18
23-19-424.7341.011.67
33-19-42-b4.5041.162.24
43-17-424.3420.9811.85
54-5-127-a3.990.6832.36
63-19-42-a4.8522.763.02
Table 2. Experimental design content.
Experimental SequenceInfluencing FactorsExperimental Content
1Injection timingDepletion from 55 MPa to 6 MPa, CO2 injection at 0.05 mL/min
2Injection timing and injection componentsDepletion from 55 MPa to 8 MPa, CO2 injection at 0.05 mL/min
3Injection timingDepletion from 55 MPa to 2 MPa, oxidation-absorption tail gas injection at 0.05 mL/min
4Injection timing and injection componentsDepletion from 55 MPa to 8 MPa, oxidation-absorption tail gas injection at 0.05 mL/min
Table 3. CH4 recovery rates at different injection volumes.
Experiment NameDepletion RecoveryUltimate RecoveryIncrement
Depletion from 55 MPa to 6 MPa, CO2 injection at 0.05 mL/min91.11%96.07%4.96%
Depletion from 55 MPa to 8 MPa, CO2 injection at 0.05 mL/min82.66%91.07%8.41%
Depletion from 55 MPa to 2 MPa, oxidation-absorption tail gas injection at 0.05 mL/min94.91%96.27%1.36%
Depletion from 55 MPa to 8 MPa, oxidation-absorption tail gas injection at 0.05 mL/min82.10%86.69%4.59%
Table 4. Core porosity parameters.
Core NumberPorosityPermeability
12.10.25
22.80.31
33.20.32
44.30.42
53.70.36
64.00.39
77.50.51
86.00.47
93.60.38
Disclaimer/Publisher’s Note: The statements, opinions and data contained in all publications are solely those of the individual author(s) and contributor(s) and not of MDPI and/or the editor(s). MDPI and/or the editor(s) disclaim responsibility for any injury to people or property resulting from any ideas, methods, instructions or products referred to in the content.

