Article

Pore-Scale Modeling of Gas–Oil Two-Phase Flow Based on the Phase-Field Method—A Case Study of Glutenite Reservoirs in China

1
Oil & Gas Survey, China Geological Survey, Beijing 100083, China
2
State Key Laboratory of Continental Shale Oil, Daqing 163002, China
3
Xinjiang Oilfield Company, Karamay 834000, China
4
School of Mechanical Science and Engineering, Northeast Petroleum University, Daqing 163318, China
*
Author to whom correspondence should be addressed.
Processes 2024, 12(8), 1670; https://doi.org/10.3390/pr12081670
Submission received: 2 July 2024 / Revised: 31 July 2024 / Accepted: 3 August 2024 / Published: 8 August 2024

Abstract

:
This work employs the phase field method combined with a realistic microscopic heterogeneous pore structure model to conduct numerical simulations of CO2–oil two-phase flow. This study investigates the diffusion behavior of CO2 during the displacement process and analyzes the impact of various parameters such as the flow rate, the contact angle, and interfacial tension on the displacement effect. The results indicate that, over time, saturated oil is gradually replaced by CO2, which primarily flows along channels with larger throat widths and lower resistance. The preferential flow paths of CO2 correspond to high flow rates and high pore pressures occupied by CO2. As the injection rate increases, the CO2 filtration rate increases, CO2 movement becomes more pronounced, and CO2 saturation rises. Beyond the optimal flow rate, however, the displacement effect worsens. The wettability of the porous medium predominantly determines the CO2 migration path during the displacement process. As the contact angle increases, CO2 wettability towards the rock improves, significantly enhancing the displacement effect. Under different interfacial tension conditions, the recovery rate increases with the amount of CO2 entering the porous medium, but no clear correlation is observed between interfacial tension and the recovery rate. Therefore, it is challenging to further improve the recovery rate by altering interfacial tension. The viscosity ratio affects wettability and thereby influences the displacement effect. Lower viscosity ratios result in reduced wettability effects, making CO2 diffusion more difficult. This study provides theoretical guidance and technical support for CO2-EOR (Enhanced Oil Recovery) in highly heterogeneous reservoirs on a field scale.

1. Introduction

Energy is one of the foundations for the development of modern society and the cornerstone of human survival. However, with the rapid progress and development of modern industry, a large amount of fossil energy has been exploited, thus emitting a large amount of greenhouse gases. Because of the increasing needs of industry and people’s lives, the total global CO2 emission is increasing rapidly. A large amount of CO2 is generated in the actual industrial production process; it can be used to drive oil or it can be transported to stratigraphic structures such as oil fields, gas fields, saline aquifers, and coal mines, which are difficult to extract using capture and separation equipment. In this way, the generated CO2 can be isolated from the atmospheric environment in a long-term, stable, and safe manner. However, the complexity and variability in CO2 flow characteristics in porous rocks and many areas of its flow law are still unknown, requiring researchers to continue in-depth studies.
At present, simulations for two-phase flow have become increasingly diverse. The common way to deal with such problems is by developing pore network methods to predict two-phase flow in porous regions [1,2]. Before establishing a numerical model, it is necessary to determine the relationship among different seepage parameters through experimental or analytical methods, which can be time-consuming or only applicable to porous media with simple geometric shapes. Pore-scale simulation is a new numerical method developed in the past decade. Pore-scale modeling has proven to be a promising technique for deriving accurate relationships among different flow parameters [3,4,5]. The VOF model is considered a useful tool for simulating immiscible two-phase flows [6,7,8]. Park et al. [9] used the finite volume method (FVM) with VOF to predict unsteady water air flow in GDL, where the fiber structure was represented by simplified solid cylinders randomly arranged in the computational domain. As the flow region became more complex, the Lattice Boltzmann Method (LBM) was considered a suitable approach. In the work by Xuan et al. [10], a quadruple structure generation set was introduced to construct the irregular solid structure of porous capillary cores, and LBM was used to simulate the transport phenomena in capillary cores. Hao and Cheng conducted pore-scale numerical simulations of liquid gas flow in porous media using free energy multiphase LBM, in which a random generation method was used to reconstruct fibrous porous media [11]. The pore structure of porous media has a significant impact on the flow characteristics of the pore space, and accurate prediction of the flow in porous media can be achieved by reconstructing the real pore structure. The Lattice Boltzmann method has been widely used in the simulation of two-phase flow, which can be well applied to the simulation of complex boundary conditions, but it is not suitable for more complex structures. Xu, C. I. et al., used the pore network model to calculate key seepage parameters including permeability and gross pipe force curves to simulate seepage and suction in fractured tight reservoirs [12]. Raeini et al., validated the generalized network model on a pore-by-pore basis using micro-CT images of two-phase flow experiments, which enabled the prediction of two-phase flow in porous media from the pore scale to the core scale [13]. Rokhforouz et al., used the finite element method to solve the coupled Cahn–Hilliard phase field and Navier–Stokes equations and investigated the effects of wettability, the viscosity ratio, and interfacial tension. They found a contact angle θ = π/4 and there was a big difference in the recovery rate of oil with a contact angle larger or smaller than π/4; in addition, increasing the interfacial tension between water and oil improved the oil recovery rate [14]. Liu et al., defined the two-phase interface between CO2 and water by the phase field method and applied COMSOL simulation to study the migration of CO2 in porous/fractured media at the pore scale. They found that the preferential flow of CO2 mainly occurred at locations with a high flow rate and high pressure, such as the region of the grain wall [15]. Liu et al., established a numerical model of complex mixed wettability and found that complex wettability behavior was due to the fact that the oil and water phases had high velocity and high pressure [16]. Zhu developed a mathematical model of two-phase flow with BFPM (the Fourier-based phase field method (BFPM) is a numerical method used to simulate multiphase flow, interface evolution, and phase transition behavior in complex structures) and MPN (MPN is a statistical method used to estimate the number of microorganisms present in a sample and is particularly useful for detecting samples with low concentrations of microorganisms), used the phase field method to trace the oil–water interface, and discussed the effects of some gauge parameters. They found that improved wettability could enhance recovery [17]. Zheng et al., proposed an improved direct simulation method to simulate spontaneous wettability behavior in reproduced three-dimensional porous shale structures [18]. Liu Yuyang et al., investigated the fluid distribution in a core based on the parametric simulation of 3D digital core images and simulated the distribution of wet and non-wet phases using the driving simulation method [19]. Guo Jiangfeng et al., used the Markov chain Monte Carlo method to reconstruct 3D digital cores and found that the reconstructed 3D digital core structure was similar to the real structure, but the size was smaller than the real pore size [20]. Yu et al., developed a numerical model to simulate experiments and solved discrete mass balance differential equations numerically to implement a one-dimensional numerical model that described spontaneous seepage and absorption process considering the effect of wettability change [21]. L-Amin et al., carried out two-dimensional calculations using the finite element method and investigated the effect of gravitational position on the pressure and saturation of water and oil [22]. Ahrenholz et al., used lattice Boltzmann method simulations and compared their results to study the capillary hysteresis phenomenon in the self-absorption and expulsion of porous media [23]. Almulhim et al., accurately simulated the flow process of fluids in complex fractures using a simplified orthogonal fracture model of complex fracture networks [24]. Farahani and Mousavi Nezhad et al., simulated the flow of fluid in two porous structures composed of particles with the same diameter. Pore velocity fields were derived, and their sample probability density functions (PDFs) were analyzed vs. time to investigate the dynamics of the flow [25]. Norouzi et al., investigated the influence of wettability, heterogeneity, and viscosity on the displacement process and confirmed that PFM was a reliable approach to capture micro- and macro-scale mechanisms in the simulation of immiscible two-phase flow in micromodel porous media with a reasonable computational time [26]. Hammoudi et al. [27] proposed a multi-physical field model including geometric, electrochemical, and thermodynamic variables as well as two phases that comprehensively considered flow. The coupling of temperature field changes caused by rock deformation is currently simulated, but the results of numerical simulation of thermodynamics are relatively rare. Deng Zhihui [28] used Comsol Multiphysics software 6.0 to simulate a fault failure and the differences in the permeability coefficient between the fracture zone and surrounding rock.
A large number of research works using the phase field method are based on the random distribution of round particle models, while the model studied in this paper is a real pore model of two-dimensional slice extraction and re-engraving from a three-dimensional digital core based on CT scanning. We studied the two-phase flow law of CO2/oil at the pore scale based on the method of phase-field interface tracking and carried out a study of the two-phase fluid transport mechanism at the pore scale by changing the velocity, contact angle, interfacial tension, and number of capillary tubes, among other factors.

2. Methodology

2.1. Governing Equations

Fluid flow in matrix pores and fractures is described using Navier–Stokes equations. Considering the gravity factor, its continuity equation and motion equation are as follows:
ρ u t + ρ ( u ) u = · [ p l + K ] + F
ρ · u = 0
K = μ ( u + ( μ ) T )
where p is the fluid pressure (Pa), u is the fluid velocity (m/s), ρ is the fluid density (kg/m3), F is the surface tension acting on oil–water, gas–water, and gas–oil interfaces, g is the gravity vector (m/s2), and μ is the fluid viscosity (mPa·s).
In phase field theory, the Cahn Hilliard equation is used to express the diffusion interface separating two phases [1]. The following equations represent the diffusion interface separating two phases:
λ = 3 ε p f σ 2 2 , γ = χ ε 2 p f , ψ = p s i
ϑ φ ϑ t + μ · φ = · γ χ ξ 2 ψ
ψ = · ξ 2 φ + ( φ 2 1 ) φ
where u is the fluid velocity, m/s; γ is liquidity, m3⋅s/kg; χ is the mixed energy density, N is the mixed energy density, and ξ is the interface thickness parameter, m. λ is about interfacial tension, σ (N/m). In the phase field model, the surface tension F is:
λ = 3 ε R f σ 8
F = λ ϵ R f 2 ψ ϑ f ϑ ϕ
The density and viscosity of a two-phase fluid smoothly varying at the interface can be expressed as follows:
ρ = ρ W + ( ρ σ ρ w ) V f 2
μ = μ W + ( μ σ μ w ) V f 2
where ρ W is the density of the water phase, μ W is the oil phase density, kg/m3, and ρ σ and μ σ are the viscosity of the two-phase fluid, mPa⋅s.
The wetted wall boundaries on solid particle surfaces are defined as follows:
n · γ λ ε p f 2 ψ = 0
n · ε p f 2 = ε p f 2 cos ( θ W )
where n is the normal unit vector and θ w is the wetting angle. Also, a small inflow velocity is set at the inlet and a pressure boundary of the same atmospheric pressure is set at the outlet.
When a fluid flows in a porous medium, there are obvious phase interfaces among different fluid phases, and the infiltration process mainly occurs in the exchange process between the oil phase and the water phase. Therefore, the precise localization and capture of the oil–water interface is the focus of this study in the wetting process. The phase field is widely used in the numerical simulation of wetting because of its advantages in analyzing the motion of the phase interface. Phase field theory suggests that a certain thickness of the diffuse interfacial layer exists in the interfacial fluid within a small region of the phase interface but not in a sharp state.
The phase field method uses continuous and rapidly changing phase field variables to represent the regional position of each phase fluid and the dynamic changes in the two-phase interface [6], where φ is the phase field variable, which varies continuously from −1 to 1. Fluid 1 represents the oil phase, fluid 2 represents the water phase, and the interval between −1 and 1 represents the oil phase. The interval represents the oil–water interface. According to the above theory, if the influence of surface tension on the oil–water interface is considered (a certain surface tension value is considered), phase field theory and Multiphysics software 6.0 can be used to model and calculate the wetting process.
φ = φ χ , t = 1       Fluid   1 φ ( χ , t ) ϵ ( 0,1 )       Fase     interface φ ( χ , t ) = 1     Fluid     2

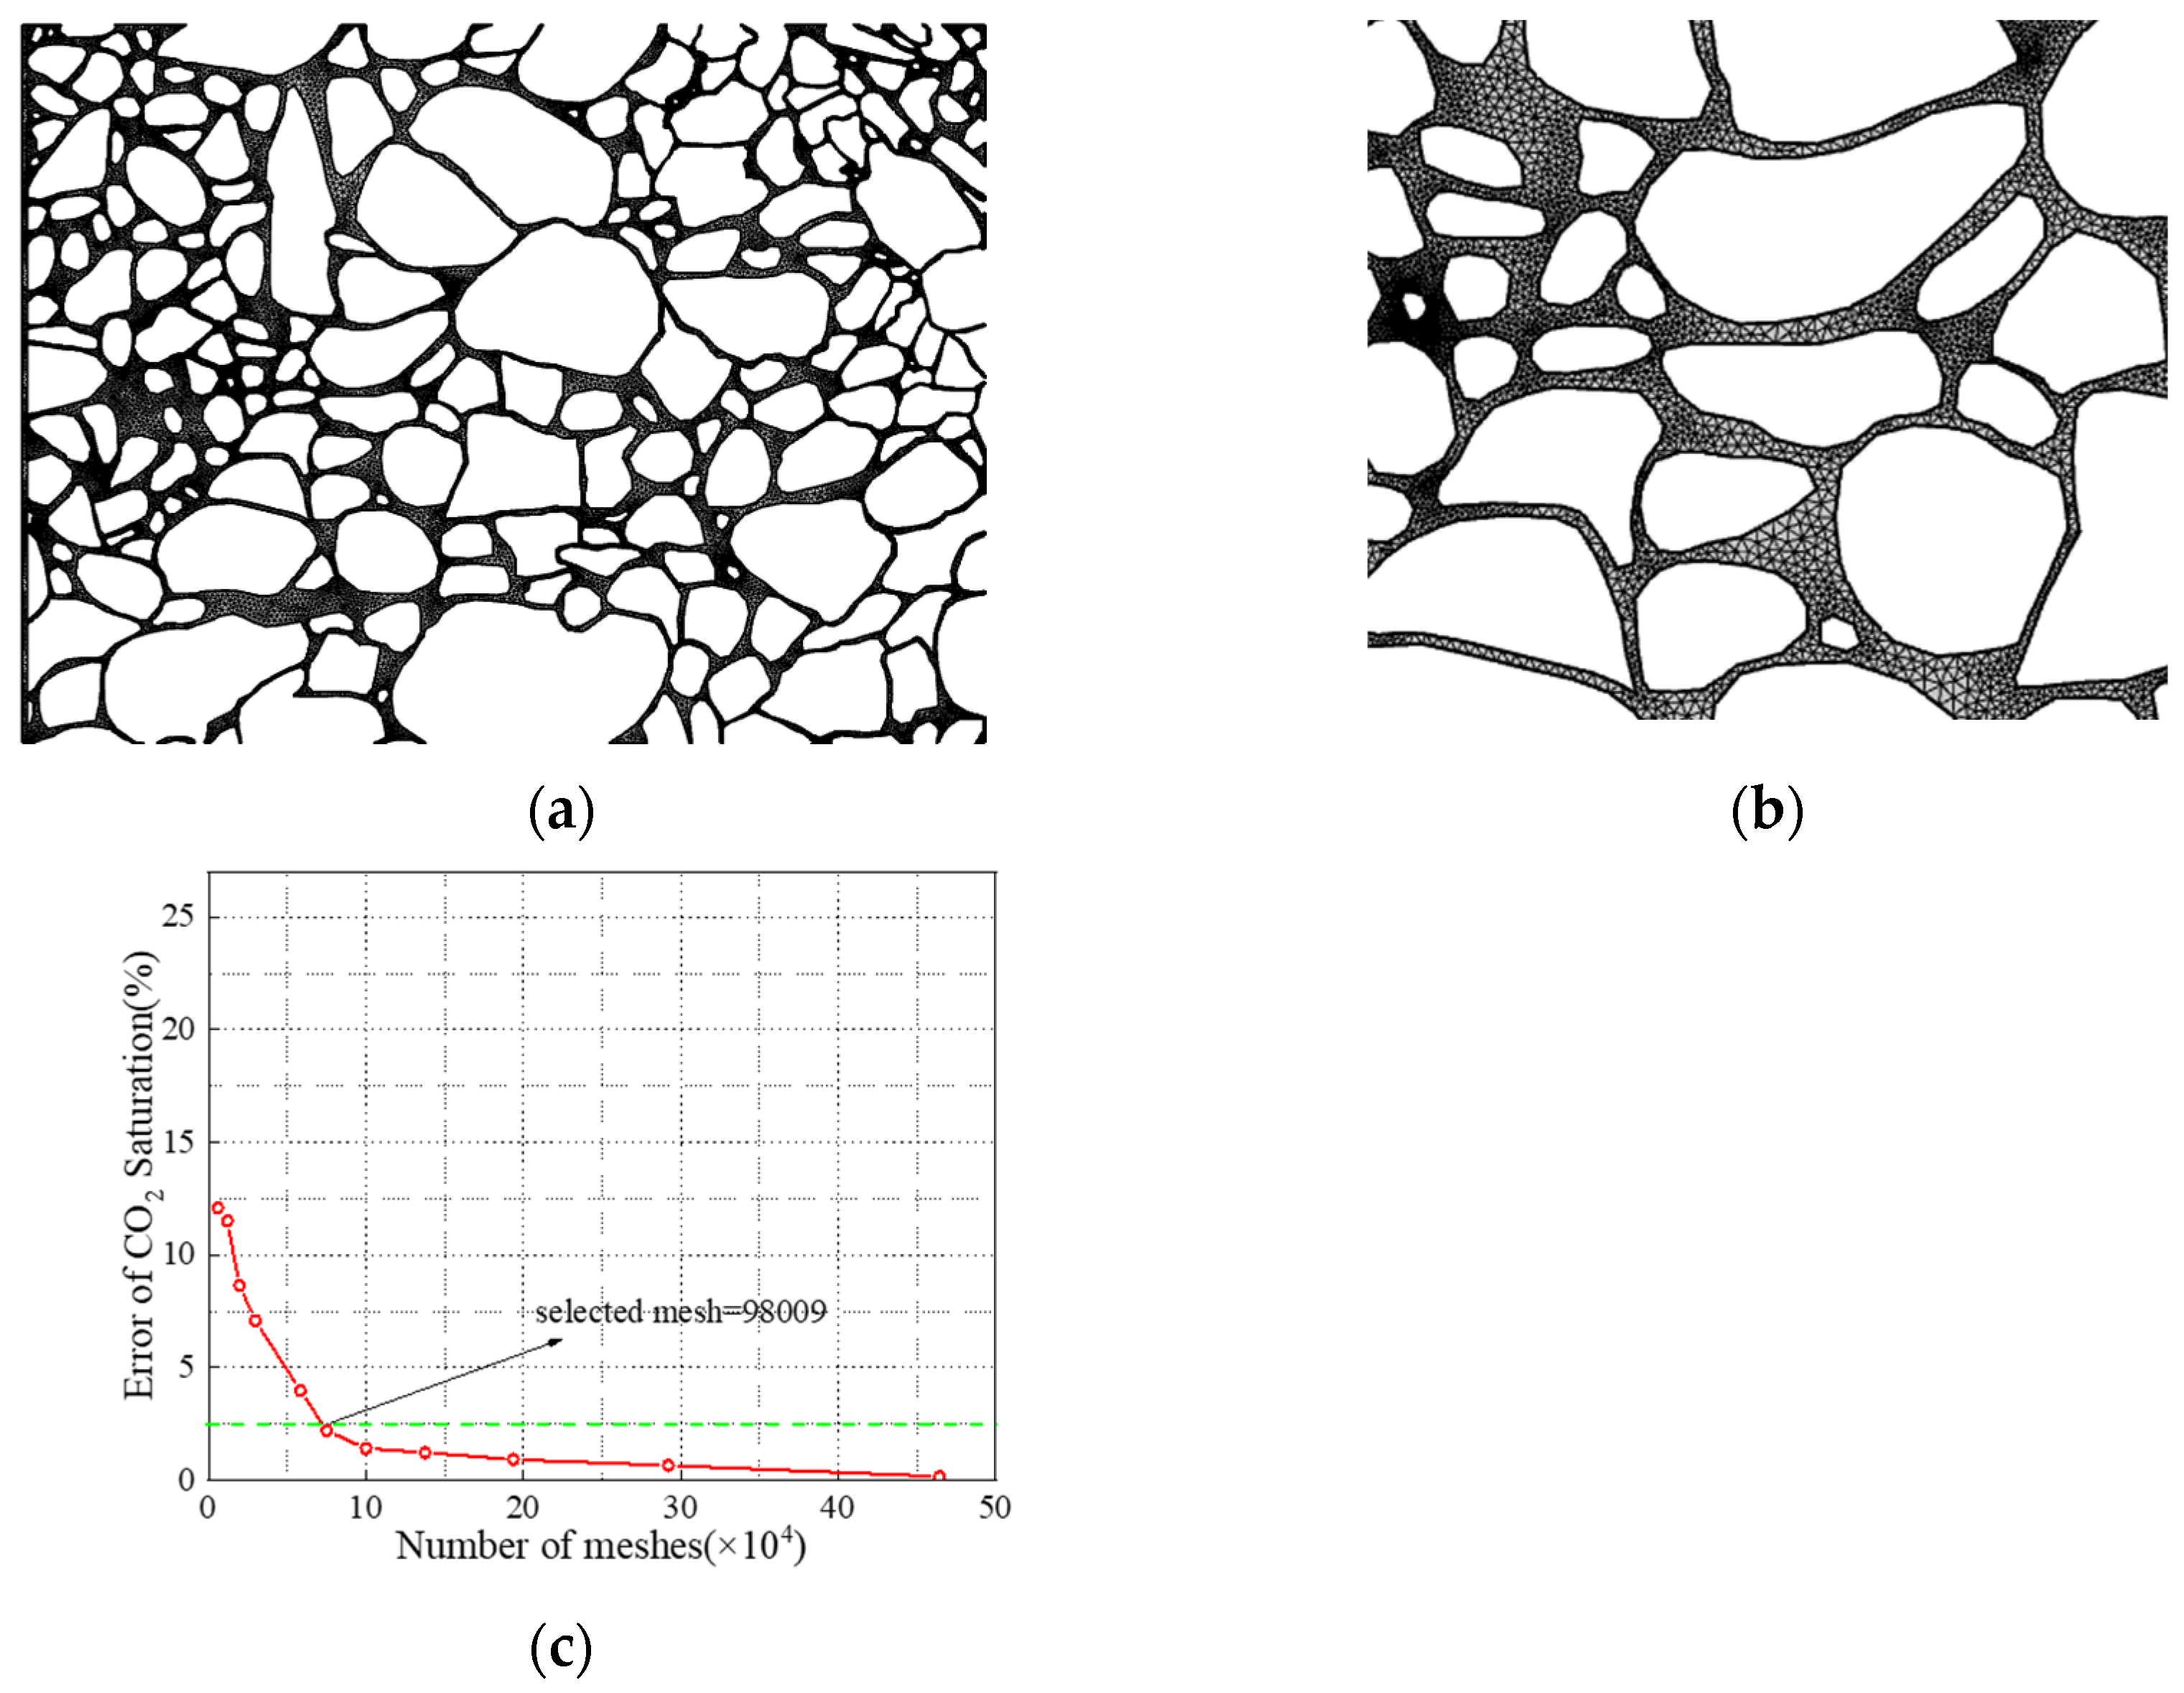
2.2. Numerical Implementation and Details

As shown in Figure 1, a 20 × 15 mm geometric model is established through Auto CAD, and the generated geometry is saved in a format that can be calculated. The white and gray areas represent matrix and channel porosity, respectively. The porosity of the two-dimensional model is 67.6%, and the permeability is 3.4326 × 10⁻¹⁰ m2. CO2 is injected from the left inlet of the crack, and oil drops are discharged from the right outlet. The initial injection velocity is 0.01 m/s. The viscosity and density of the oil phase are 0.0076 Pa·s and 840 kg/m3, respectively. The CO2 phase viscosity and density are 0.05 mPa·s and 1.816 kg/m3, respectively.
The mesh generation of the model is initially based on the established numerical model. In COMSOL Multiphysics software 6.0, physical field control and the super fine free triangular mesh generation method are adopted [3]. The model grid is shown in Figure 2. It contains 90,597 triangular elements, 6823 boundary elements, and 589 vertex elements. The locally enlarged grids are shown in Figure 2, with the minimum element sizes of 0.00236 mm and 0.00236 mm, and the average grid quality of 0.8623.
The input parameters (including density and viscosity) in the basic numerical model are based on the field conditions of CO2 storage in the Chinese basin. Assuming that the porous medium is initially saturated with oil, the oil phase viscosity and density are 0.0076 Pa·s and 840 kg/m3 respectively. Interfacial tension is highly dependent on salt concentration, temperature, and pressure. In this paper, the interfacial tension is set at 27 mN/m at a temperature of 75 °C and a pore pressure of 18 MPa. We assume that the contact angle in porous media is 60 degrees. According to the calculation of the CO2 phase diagram at 75 °C and 18 MPa, the CO2 phase viscosity and density are 4.5 × 10⁻⁵ Pa·s and 550 kg/m3, respectively.
In this study, CO2 is injected from the left boundary at a rate of 10 mm/s. Based on phase field theory, only two additional parameters are adjusted according to experience, namely, interface thickness ϕ and the mobility adjustment parameter χ , to ensure reliable simulation results. In this article, ϕ is set as 104 m, which equals the maximum grid size. Based on the default value, the initial setting of χ is 2 ms/kg. The ϕ and χ parameters should be adjusted according to different numerical simulation operations.
The boundary of the model is divided into the fixed boundary, free boundary, restricted contraction boundary, and periodic boundary. The entrance boundary on the left side of the region is set to a constant flow speed, and the exit boundary on the right side is set to a constant fluid pressure. The exit pressure remains at 0 during the whole process. The top and bottom boundaries are set to symmetric boundary conditions and do not assign flow permeability or varying shear stresses. The wall surface in contact with the fluid and solid skeleton is the wetted wall. Specific contact Angle A can be specified according to the characteristics of the wetted wall.

3. Results and Discussion

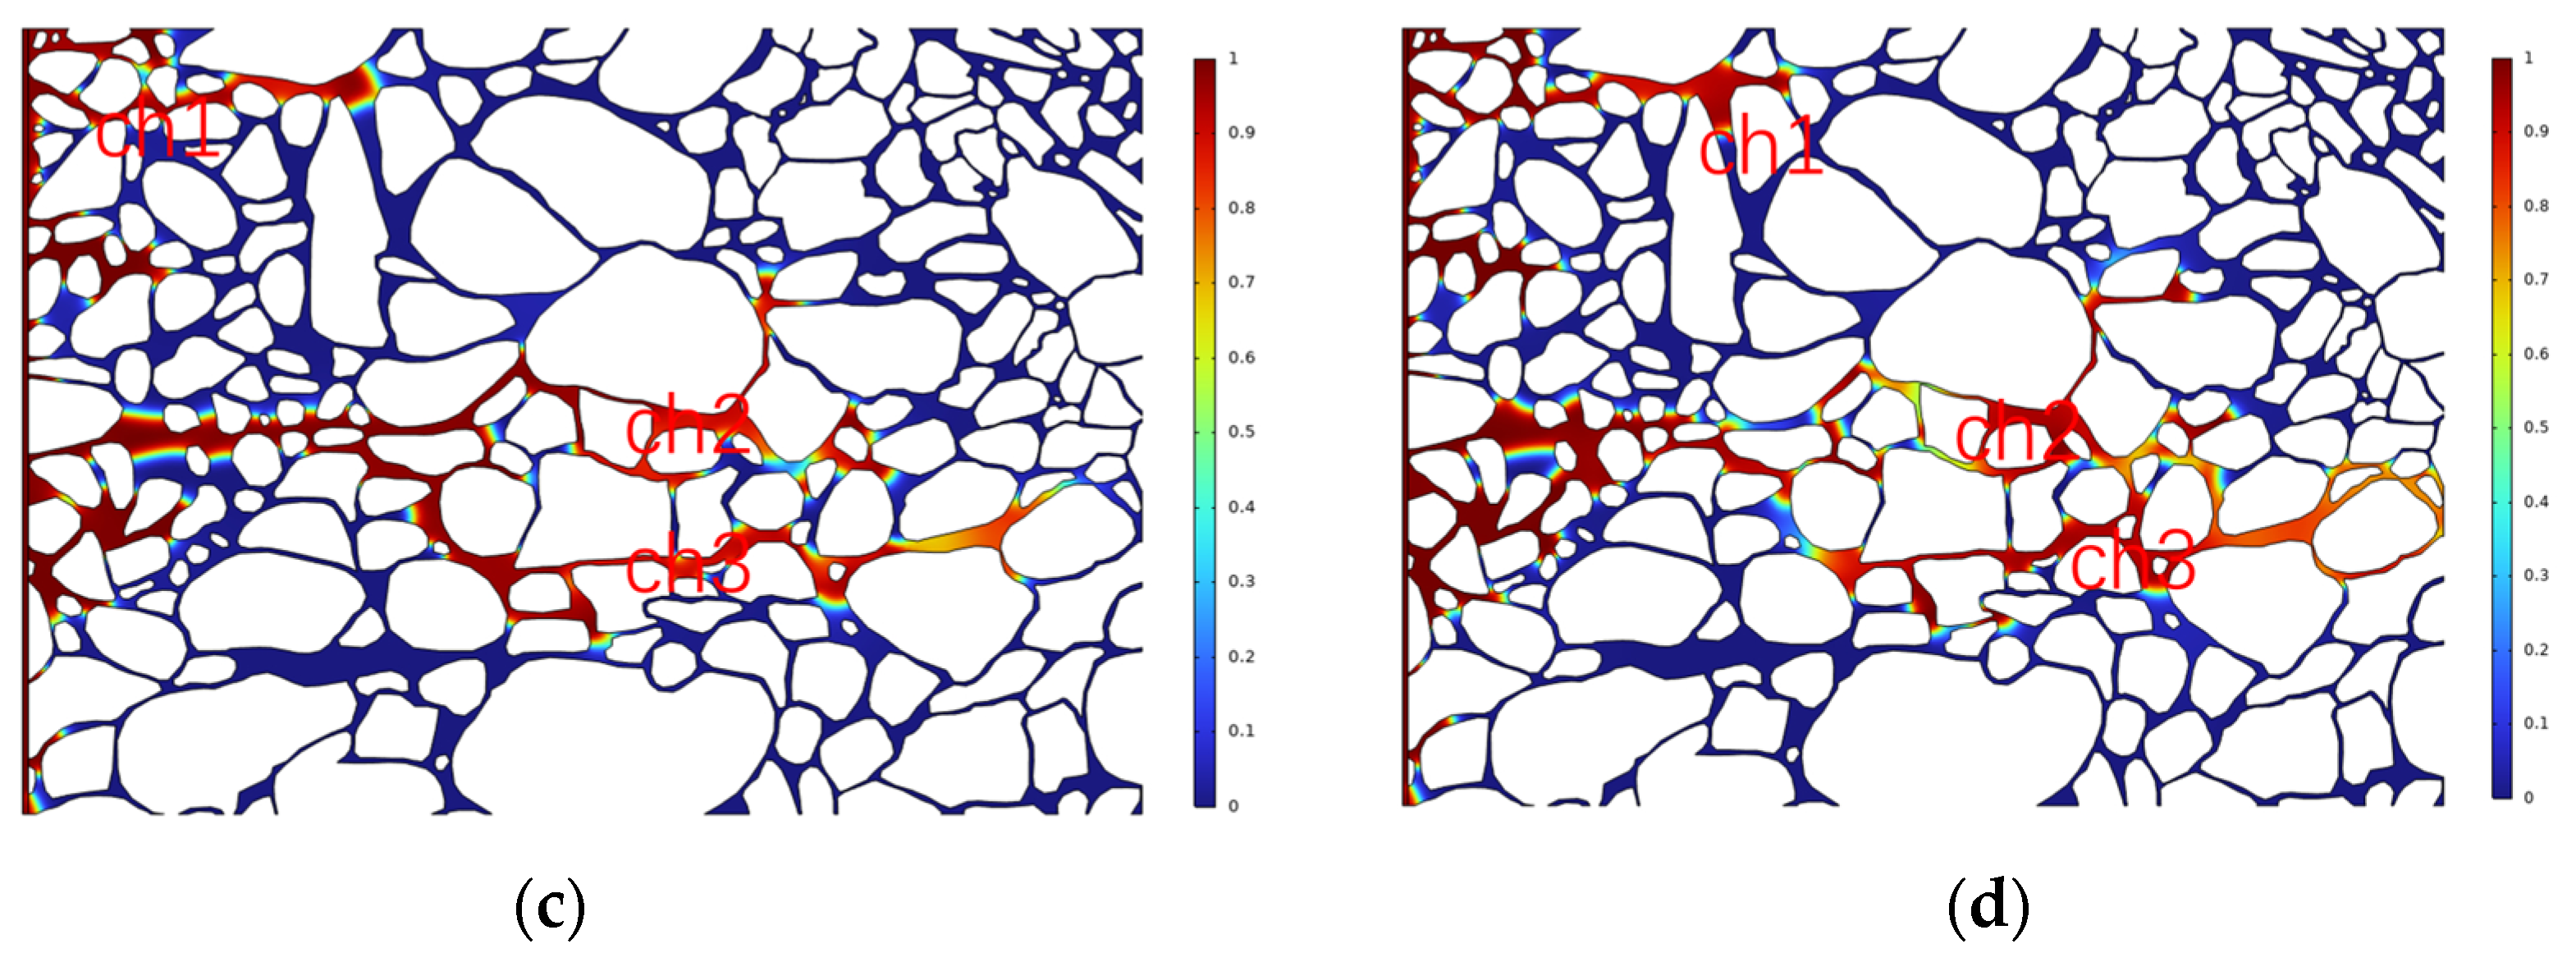
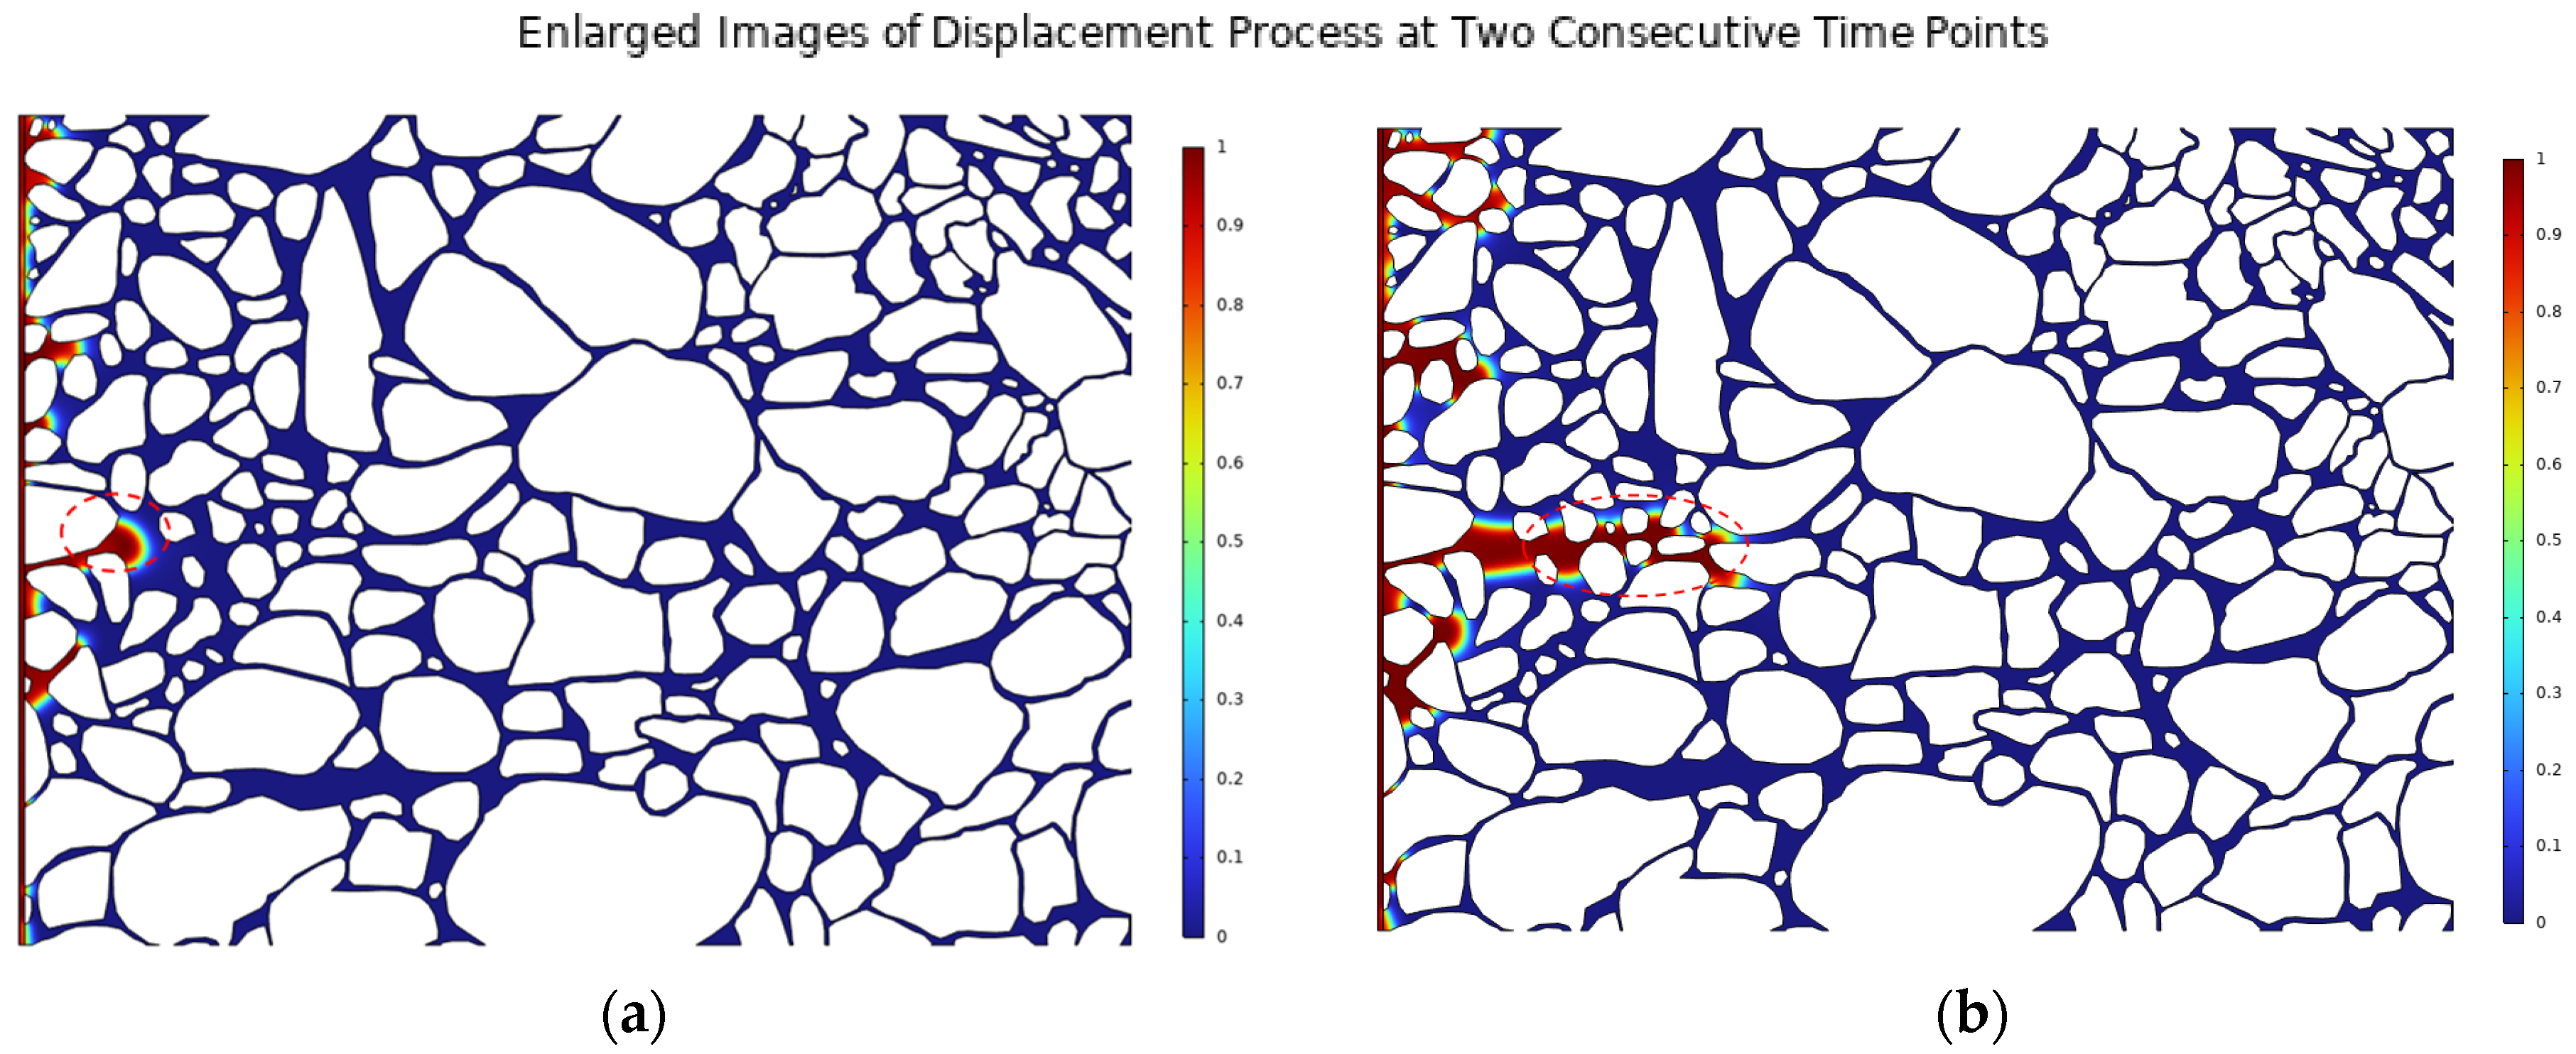
3.1. Distribution of Pore Pressure and Flow Velocity

As shown in Figure 3, a numerical simulation was carried out after simulating the real pore structure model. Saturated oil is displaced by CO2, and the CO2 moves forward along different flow channels (Chs) over time. First, it flows along the channel with a larger throat width and smaller resistance because the narrower throat affects the inflow and movement of CO2, and the resistance is large. It can be clearly seen in the figure that there are three main flow channels, one on the upper side and two on the middle and lower areas. Ch2 is the most preferred flow channel for CO2 movement, followed by Ch3 and Ch3.
Figure 4 shows the pressure distribution diagram and flow rate diagram. The preferential flow path of CO2 corresponds to the high flow rate and high pore pressure occupied by CO2. The pore pressure distribution profile can be used to predict the movement of the CO2 front in the rock matrix. From the speed chart, we can see that the speed of the CO2 dominant channel is significantly higher than that of the other channels. The lowest dominant channel in the three dominant channels has the fastest speed and the most smooth flow. From the pressure diagram, we can see that the pressure in different areas is obviously different. The pressure near the inlet is the largest, followed by the middle area, and the pressure at the right boundary is the smallest. Because CO2 enters the flow channel from the left boundary, the pore pressure on the left side is significantly higher, and sufficient pressure is required to push the CO2 forward. Compared with other places where the propulsion is slower, the pressure where the propulsion continues forward in the flow passage is lower, and the flow rate is higher.

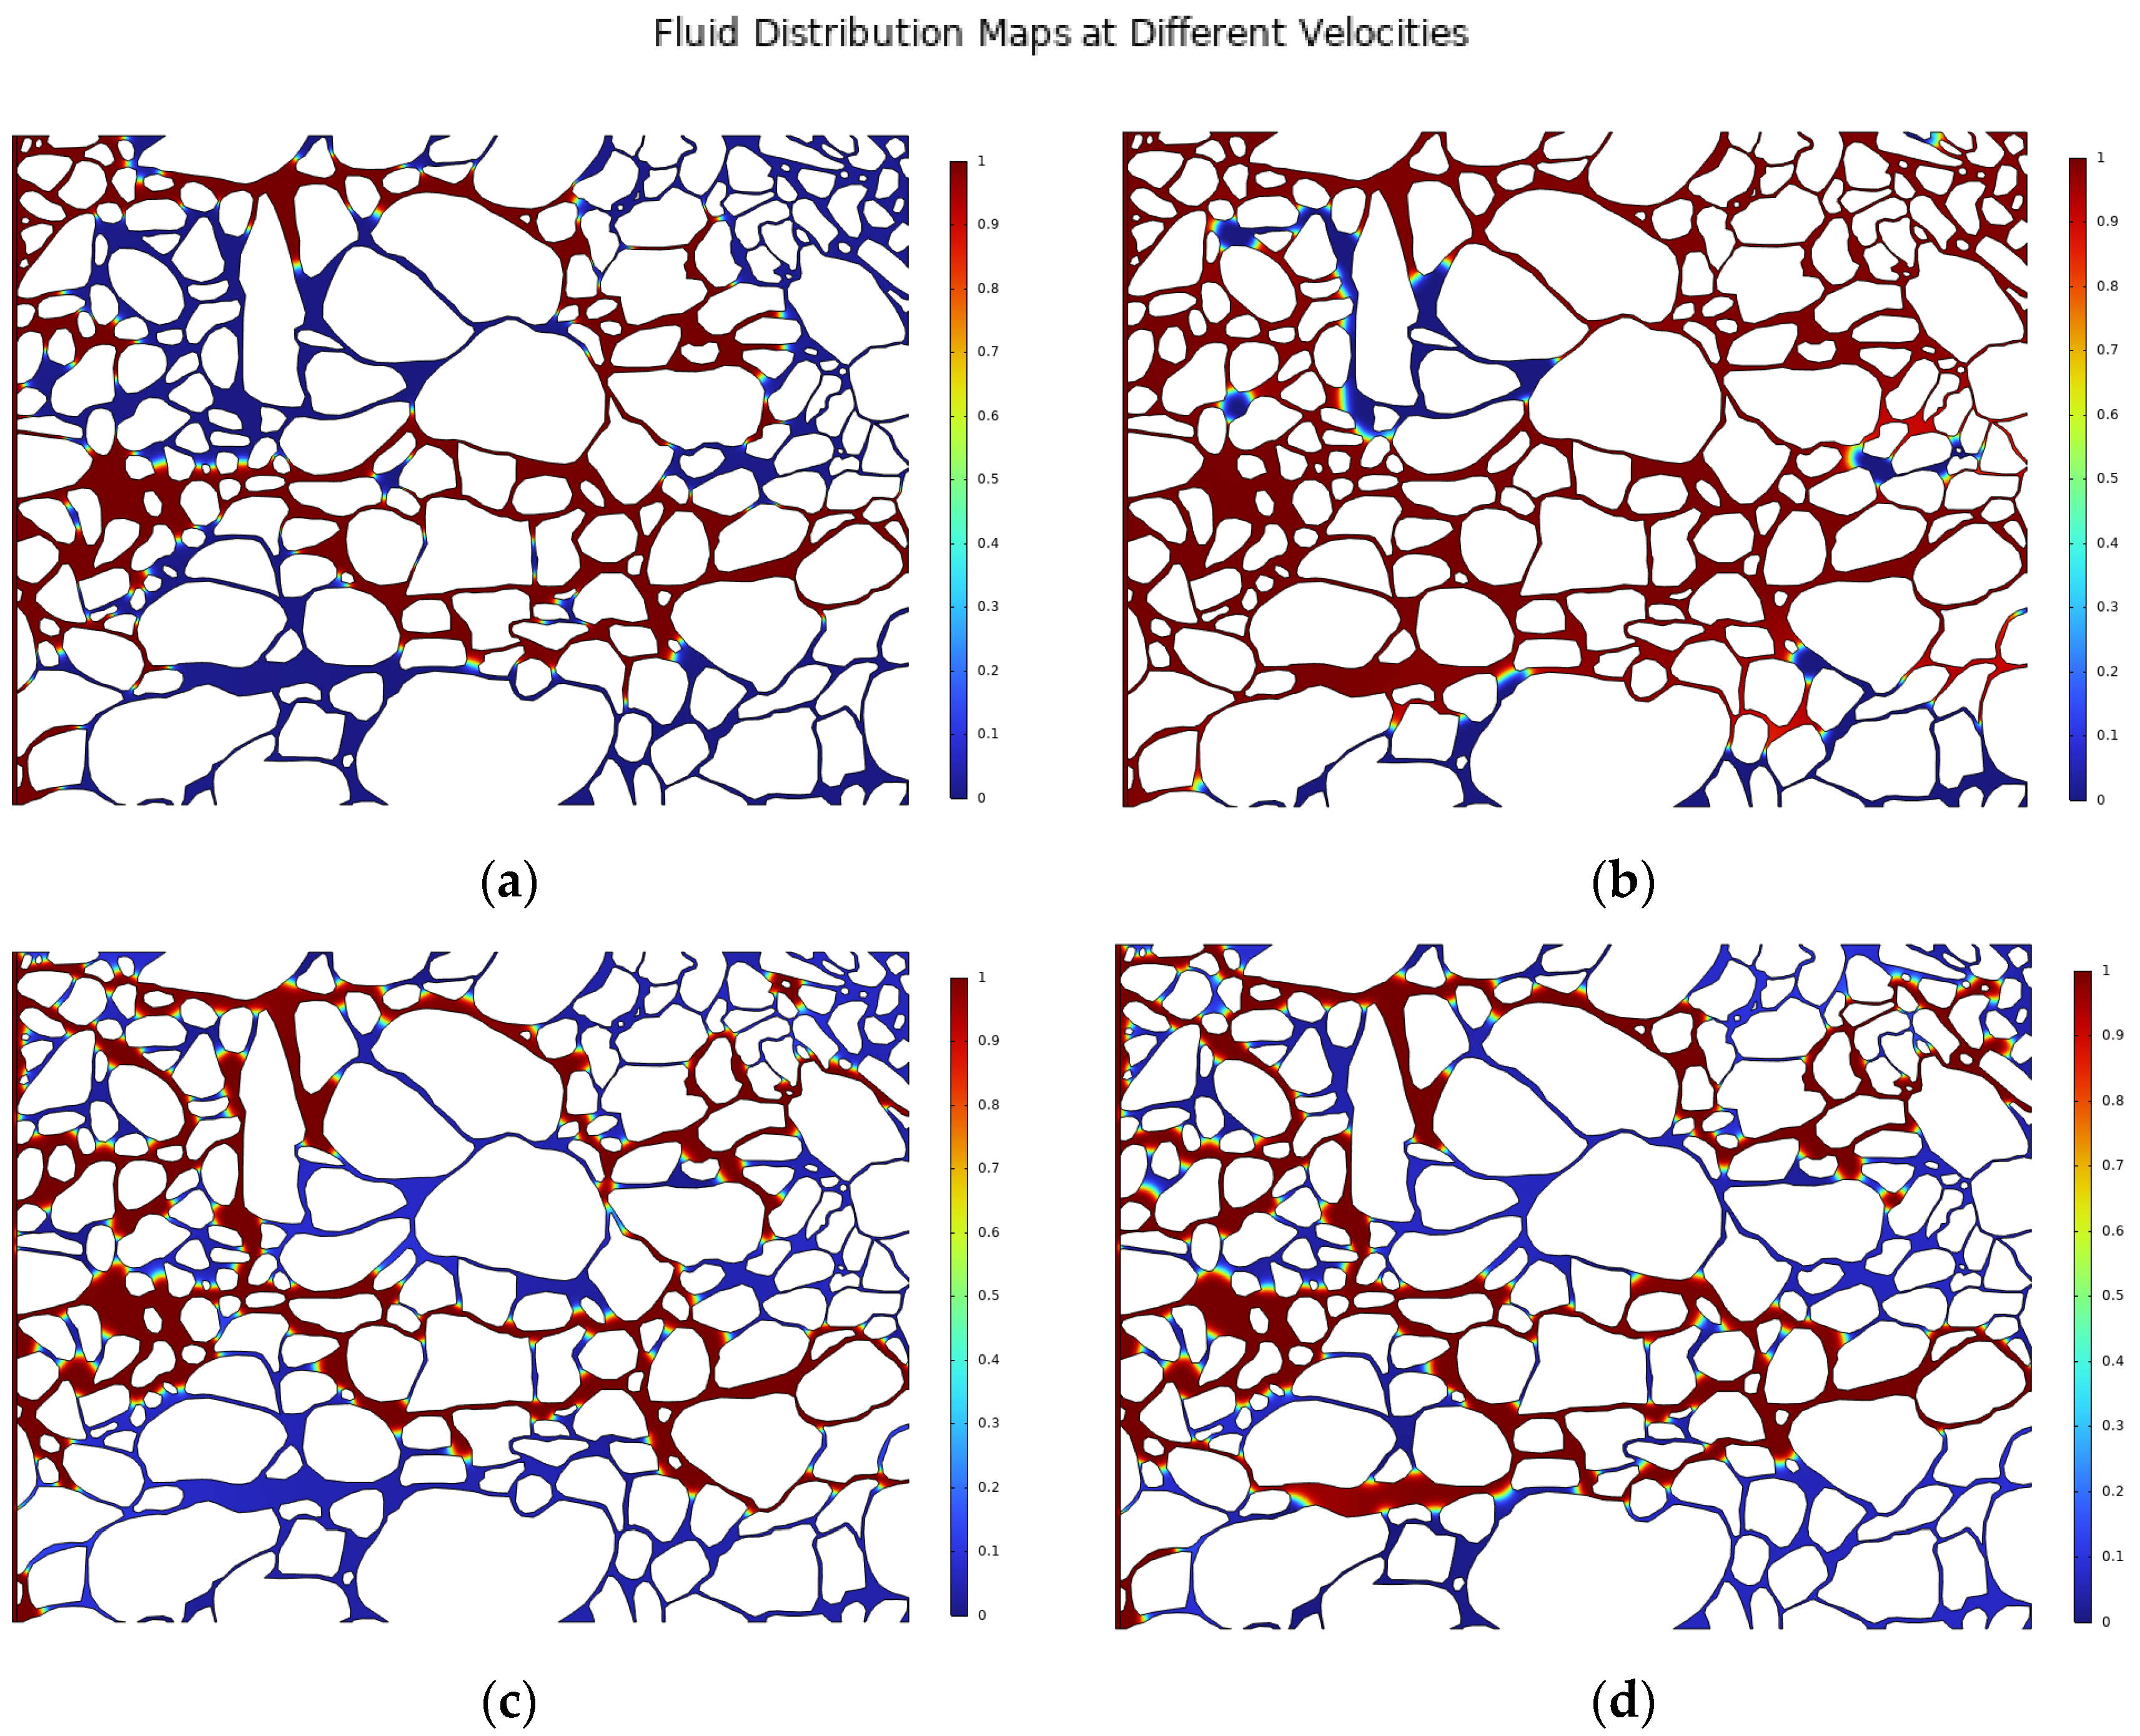
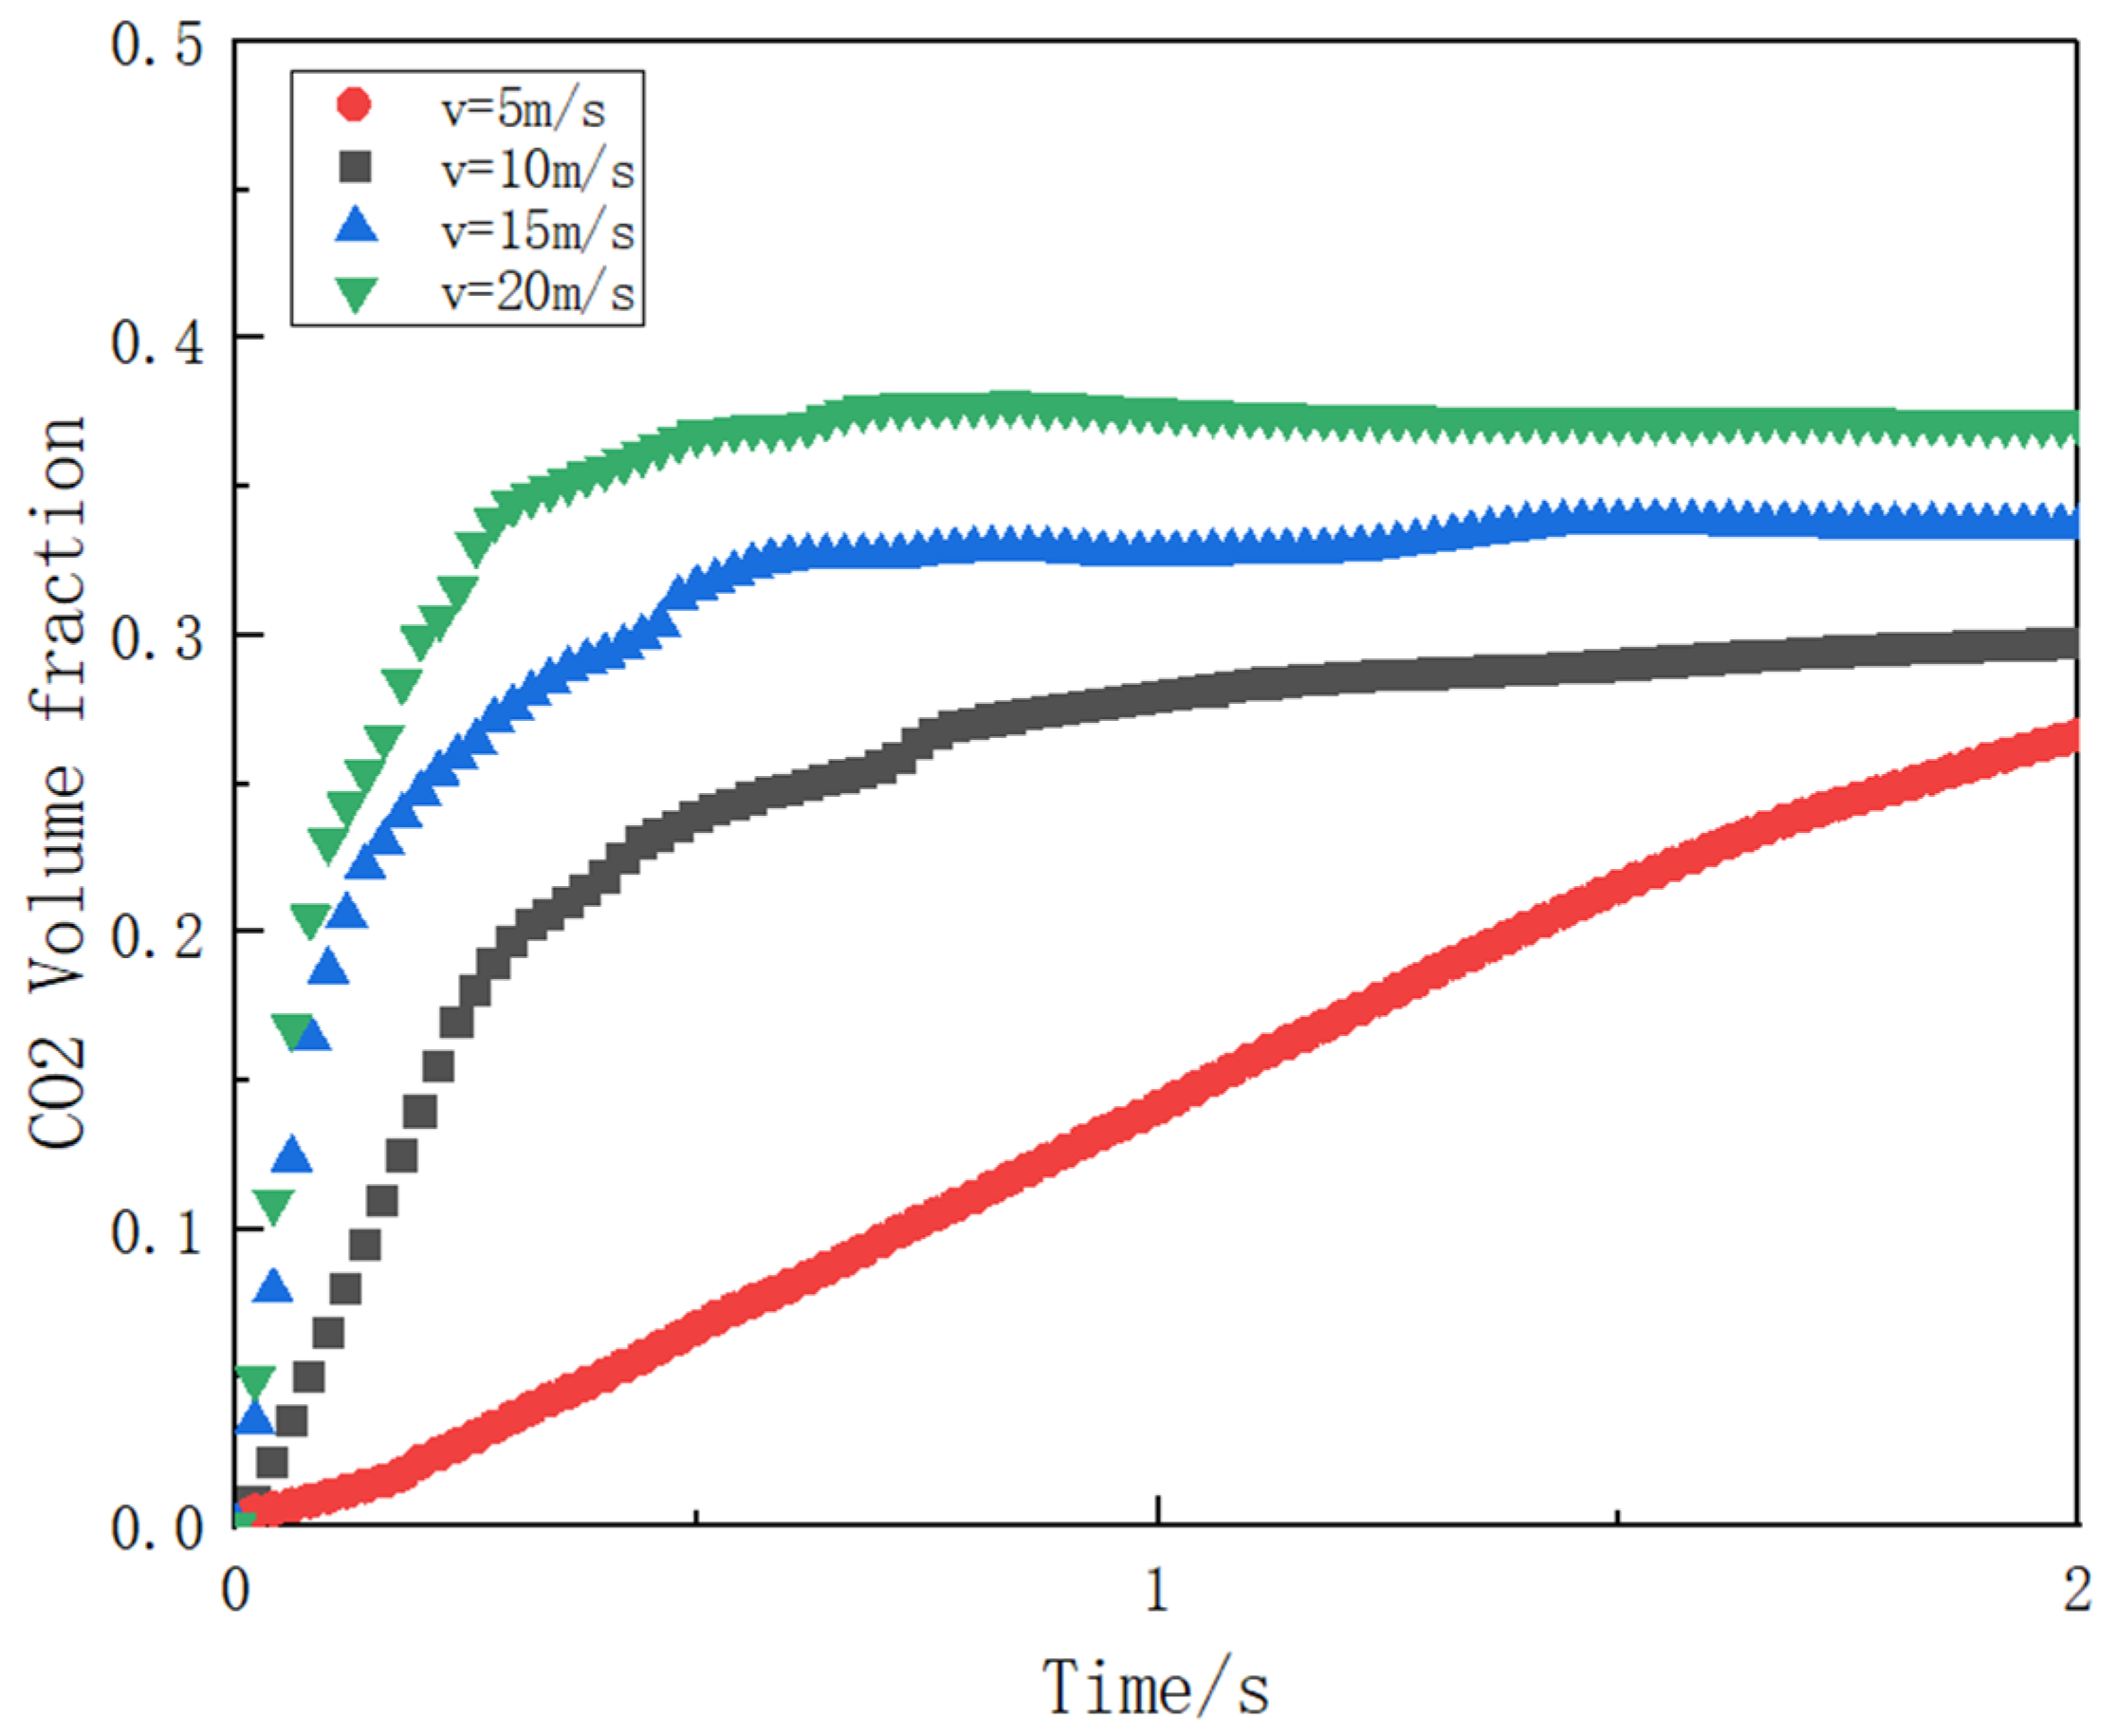
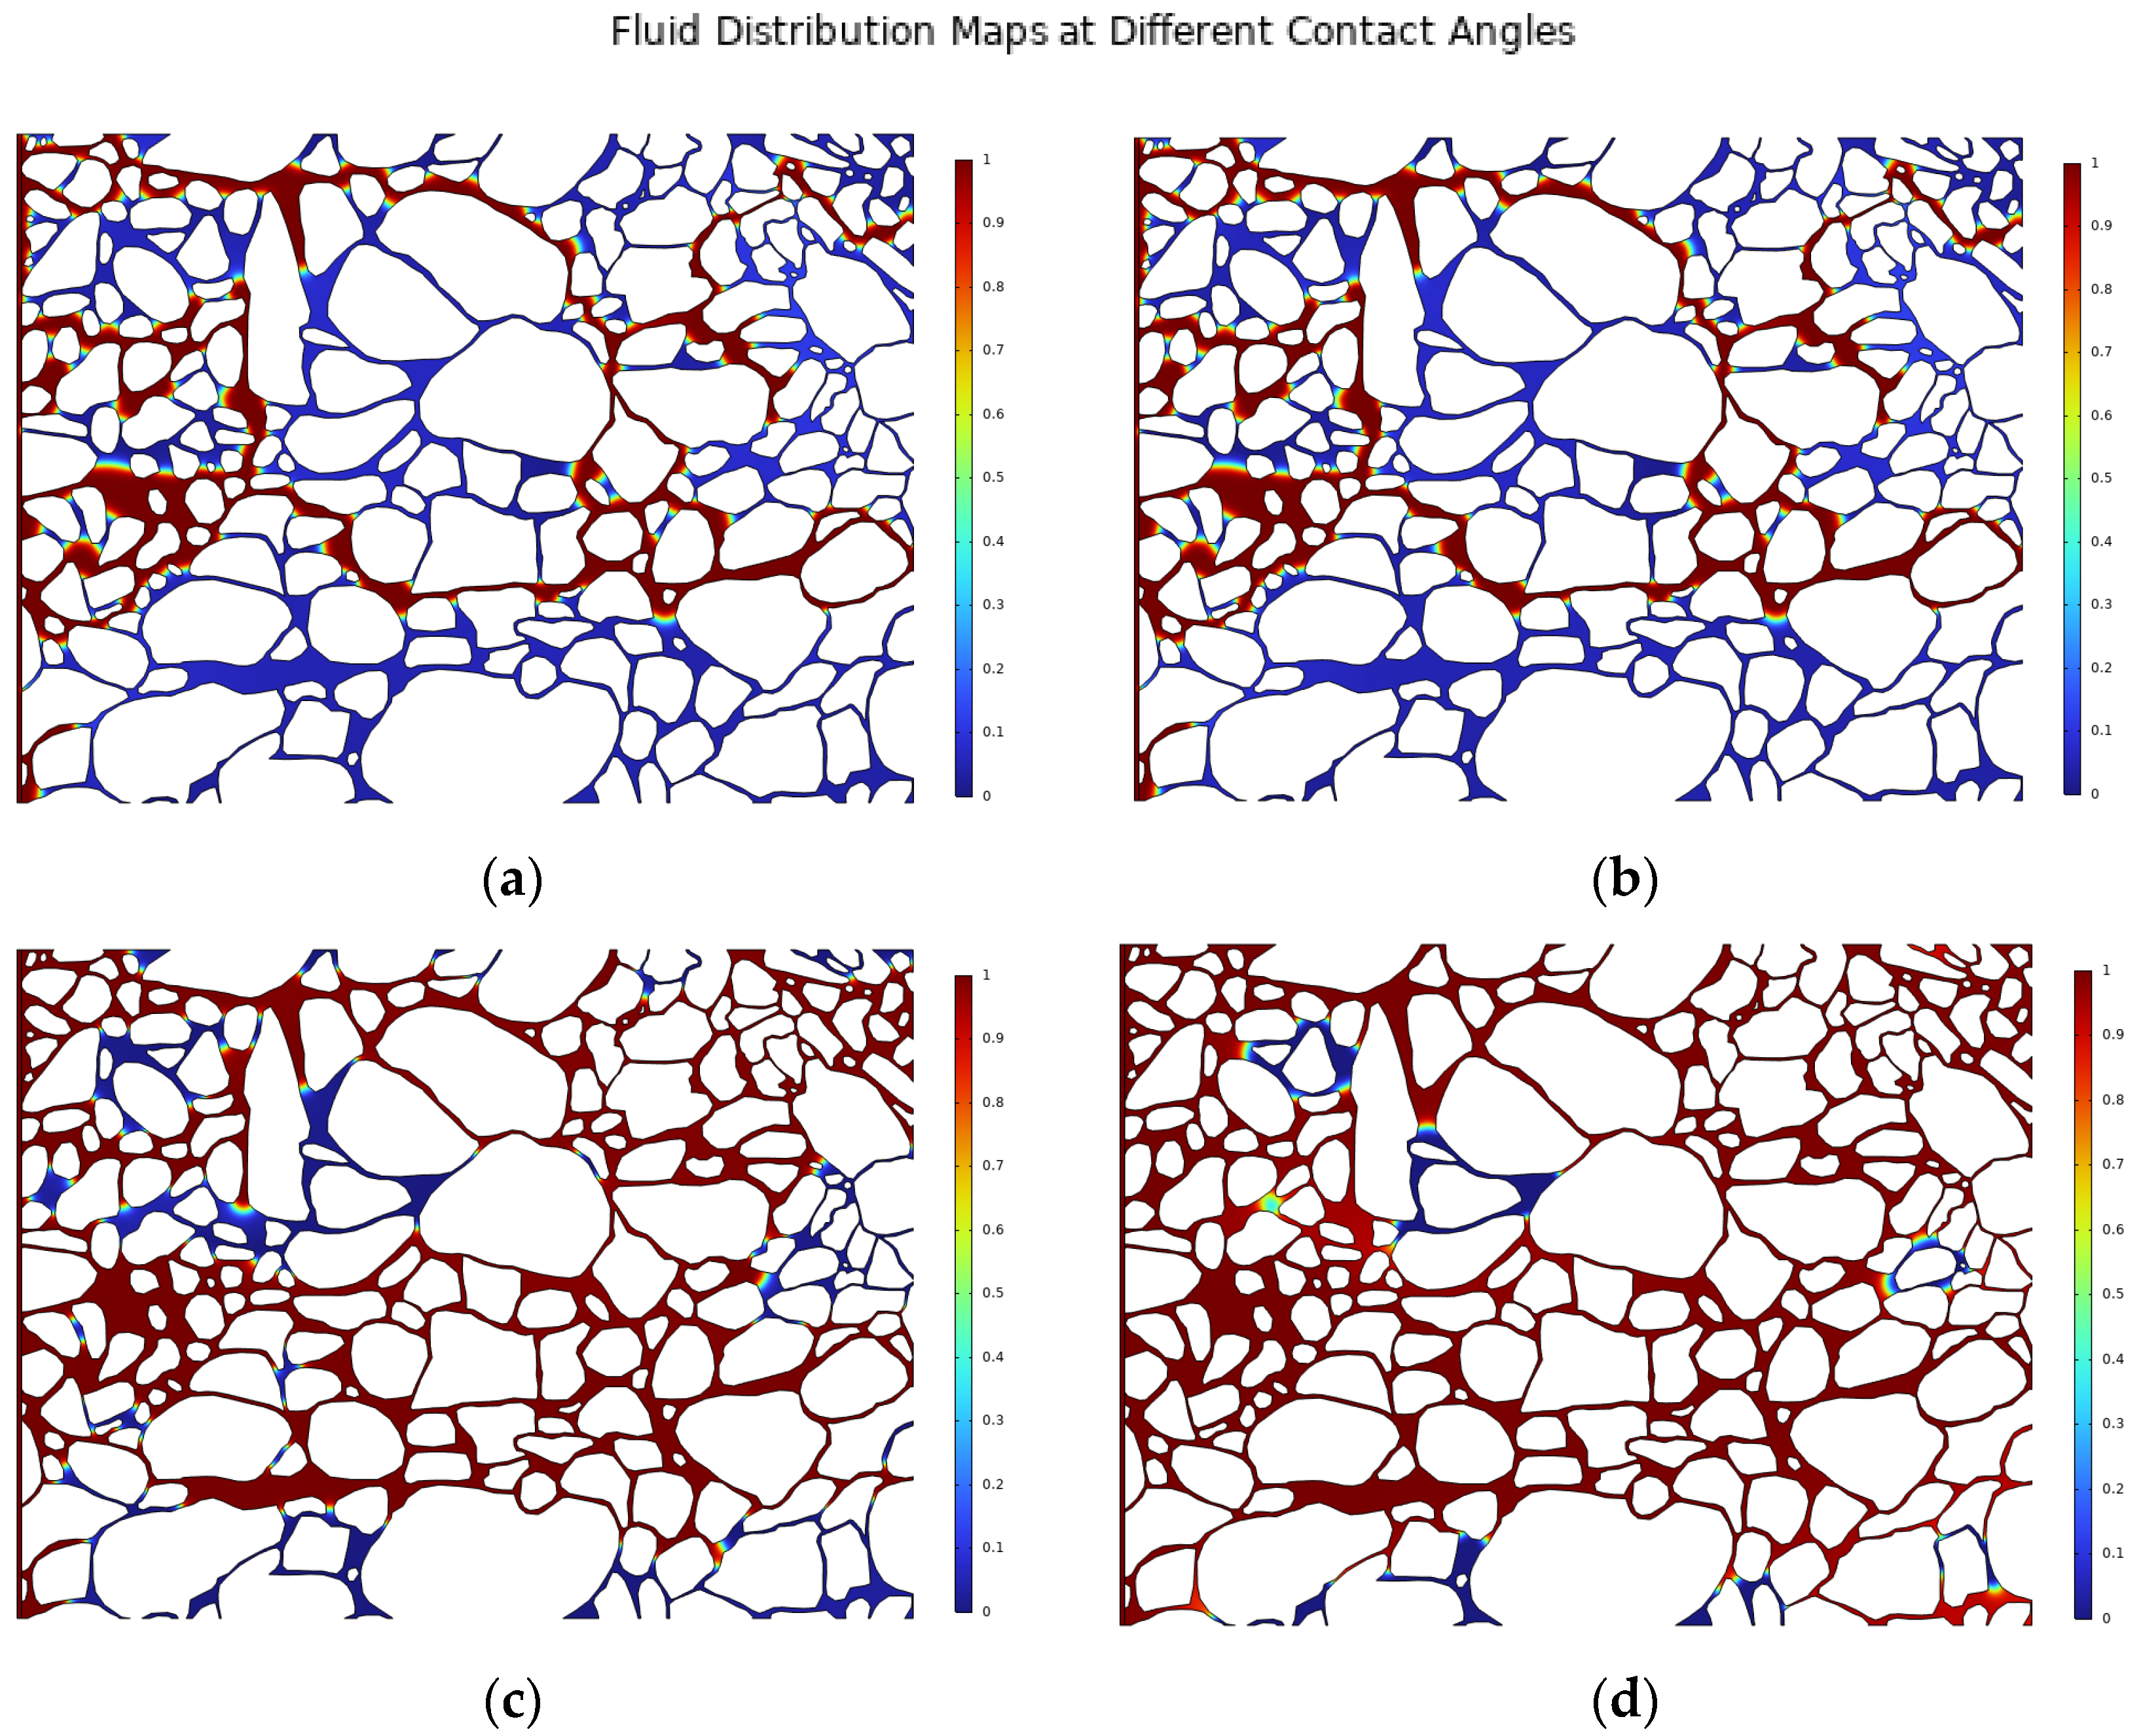
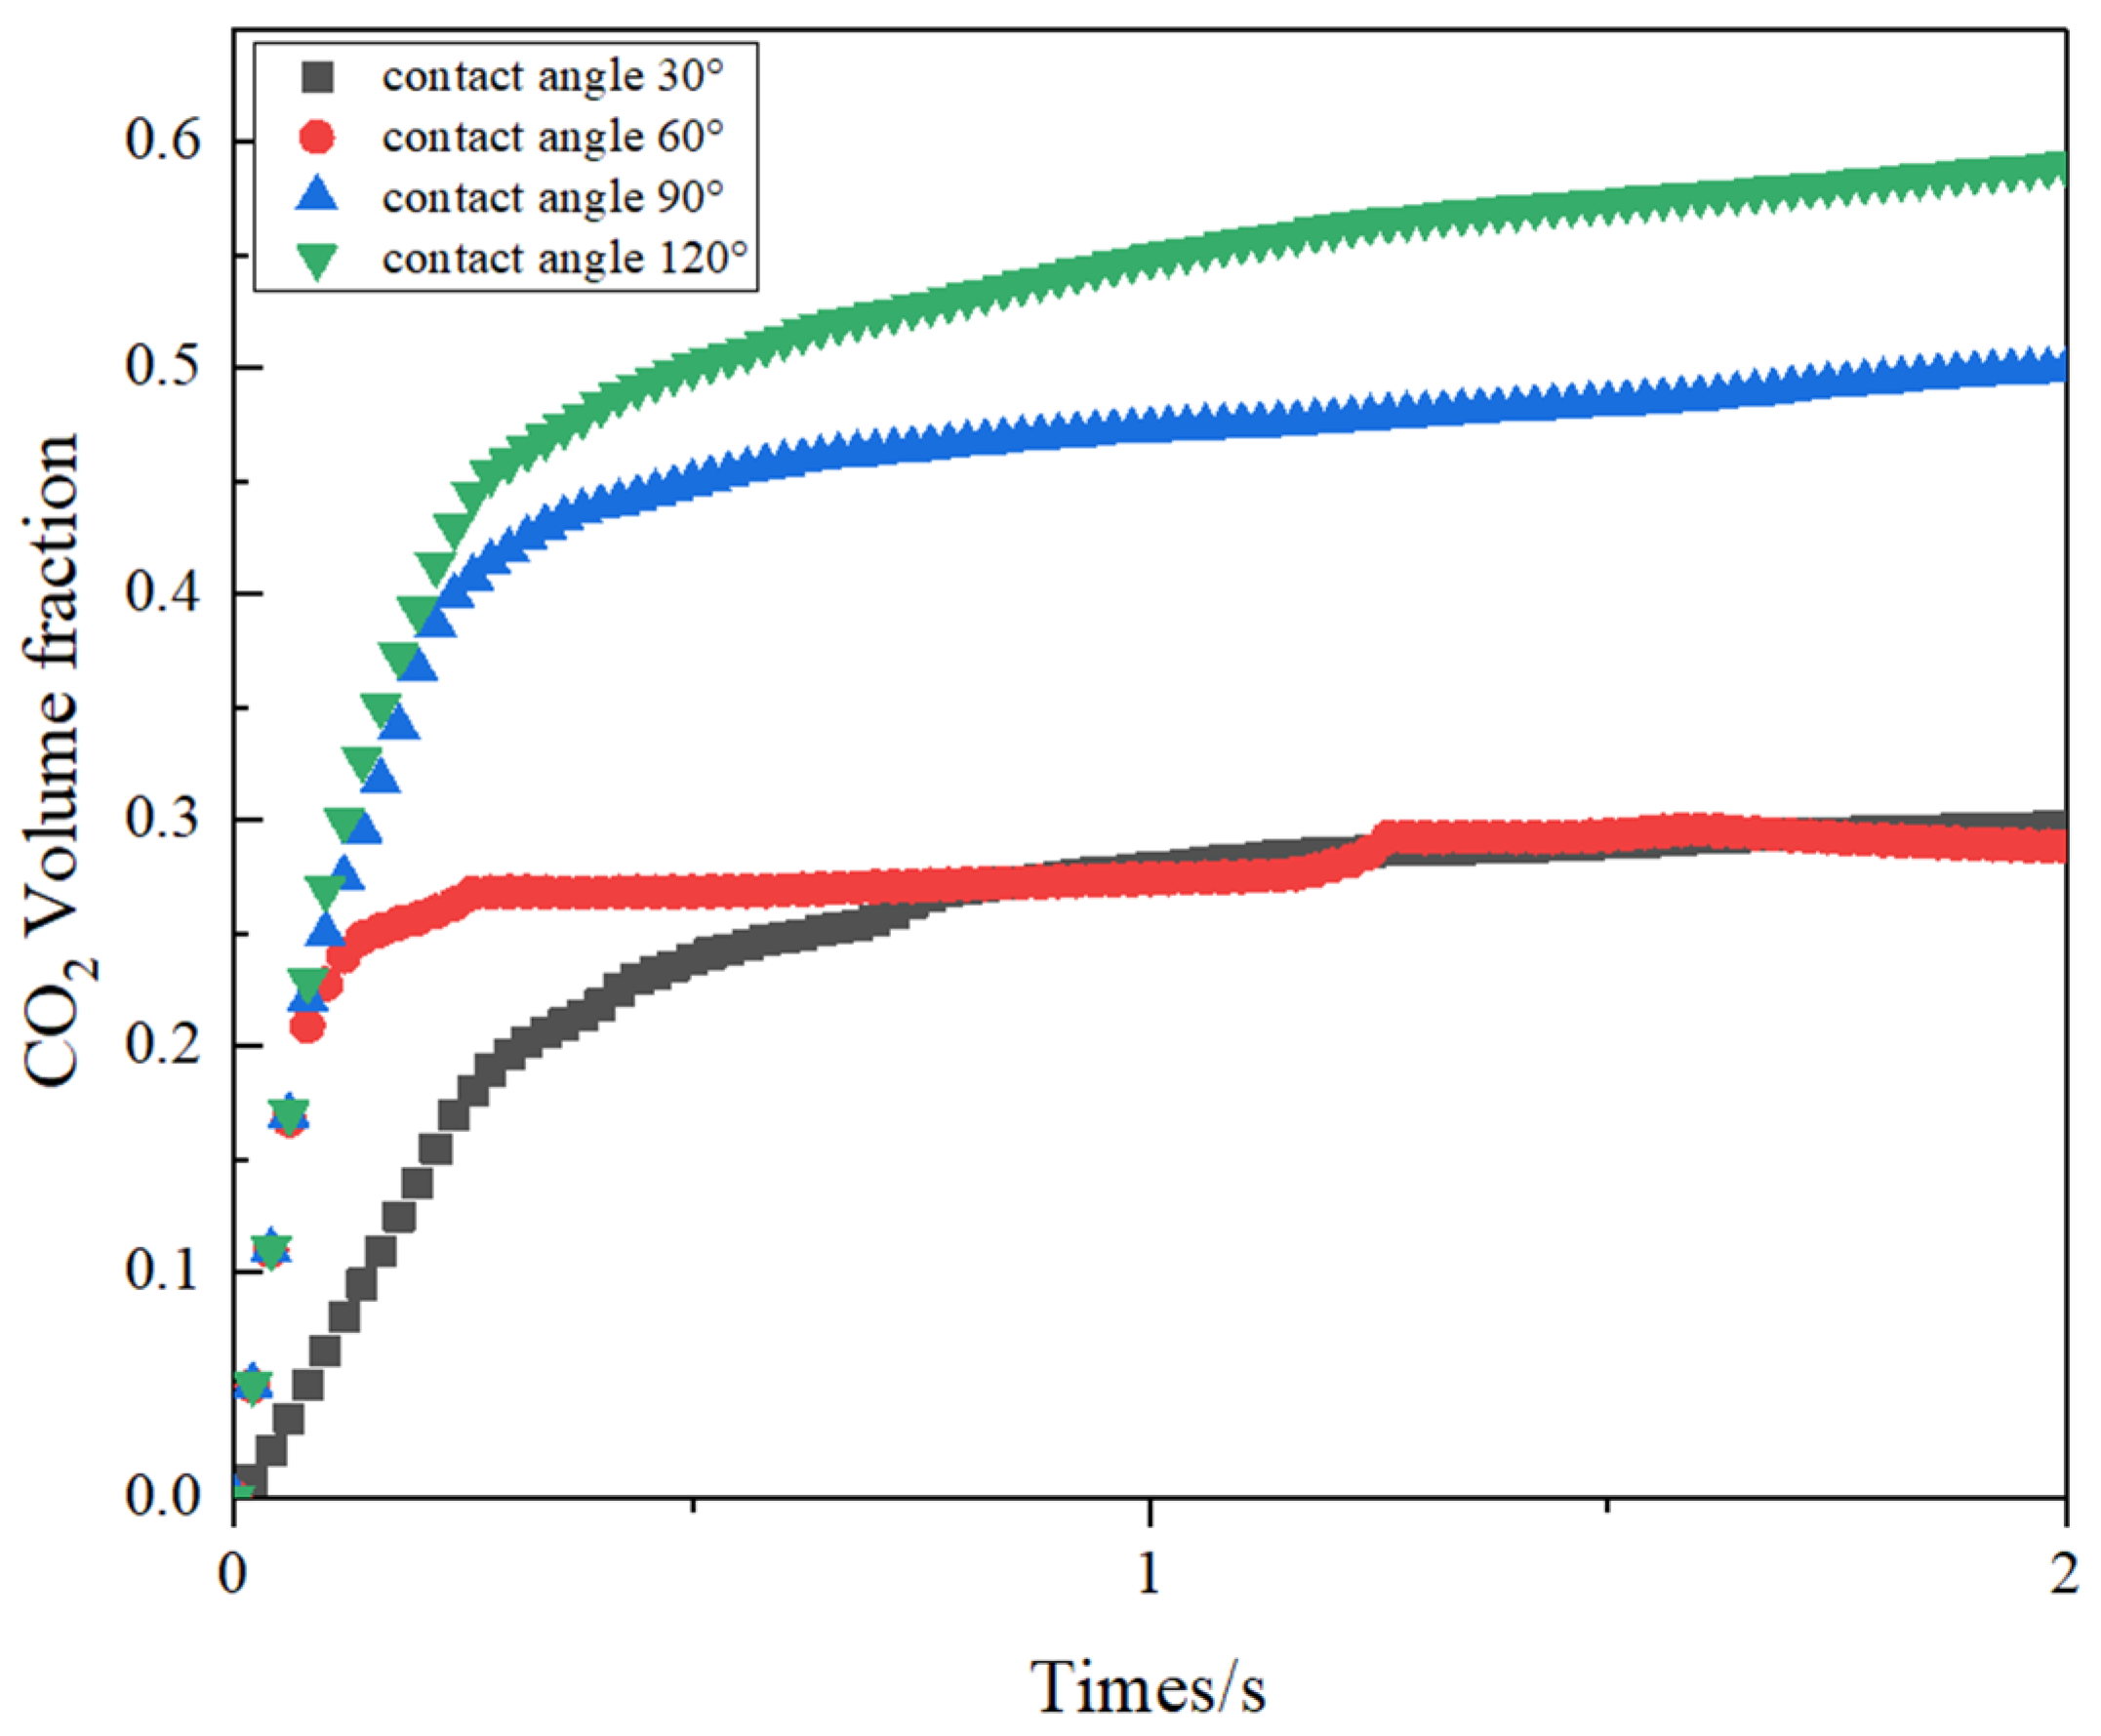
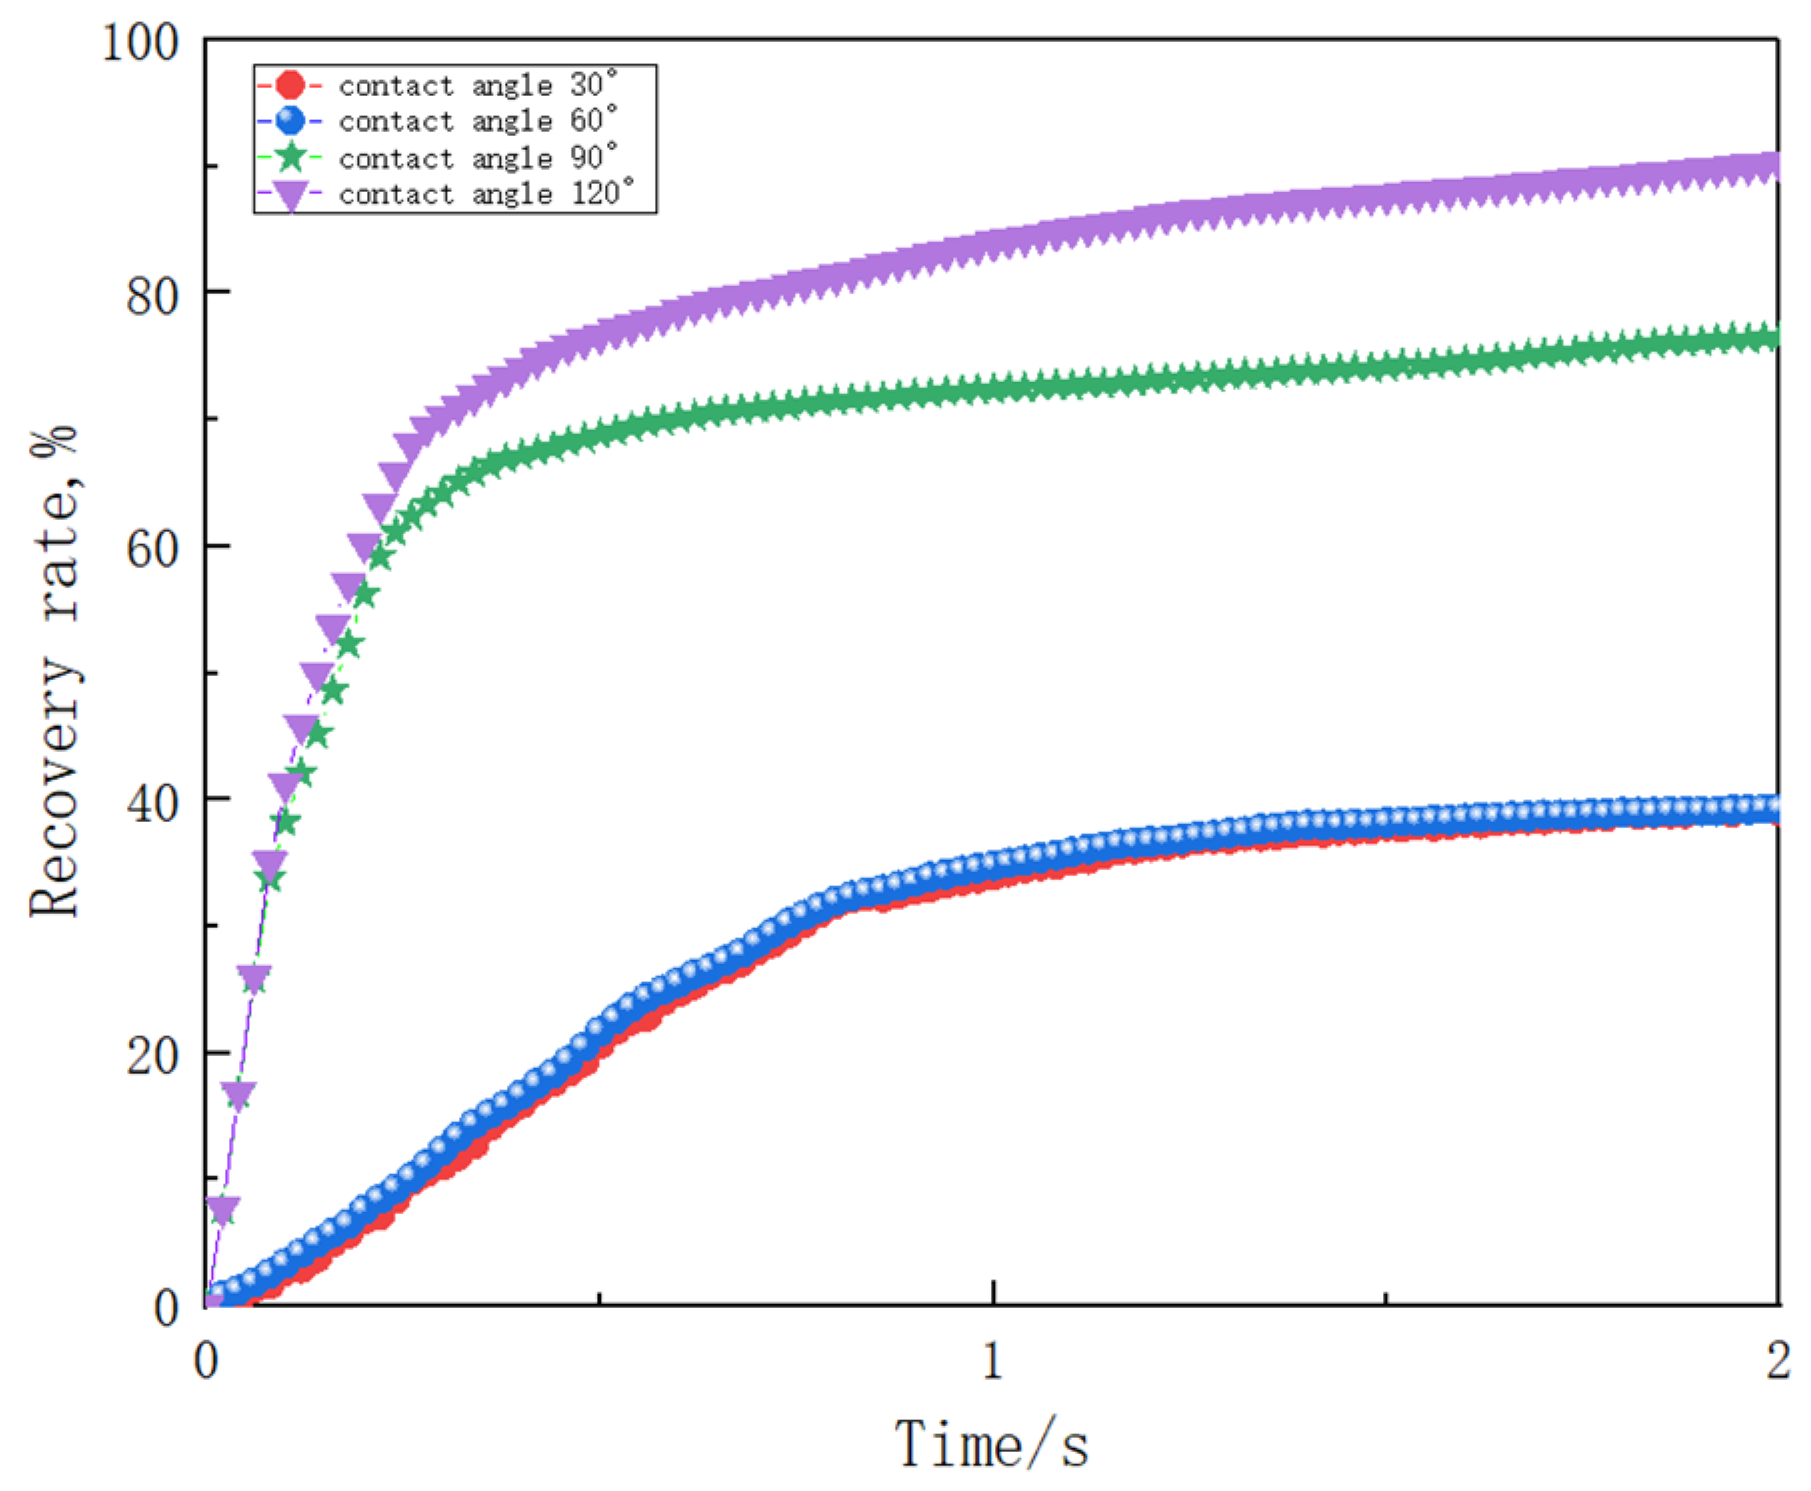
3.2. The Analysis of Influencing Factors

In order to study the effect of different factors on the drive-off and the flow law at the pore scale, numerical simulation studies were carried out under various conditions, including the flow rate, the contact angle, wettability, the interfacial tension of the porous medium, etc. The recovery rate was calculated to study the methods and improve the recovery rate.
(1) Effects of flow rate
The initial velocity of the fluid at the inlet can provide a driving force for the flow of the fluid in the flow channel, and the flow of the fluid in the fracture will produce a certain pressure on the wall surface. The inlet velocity of this experiment was set at 5, 10, 15, and 20 mm/s. The final CO2 saturation distribution at different flow rates is shown in Figure 5. The results show that the higher the inlet speed and the higher the CO2 filtration rate, the movement of CO2 is more obvious However, when the injection speed is 10 mm/s, the spread range is the largest, rather than when the injection speed is 15 and 20 mm/s. This may be because the speed is too fast, resulting in too short a time from the entrance to the boundary and insufficient displacement time. The speed of about 10 mm/s is in the middle, so the effect is better. The CO2 volume fraction distribution at different injection rates is shown in Figure 6. The higher the CO2 injection rate, the higher the CO2 saturation over time, which suggests a positive correlation between the two. In addition, when the speed is high, the saturation is almost unchanged after 0.5 s, and when the speed is low, the saturation still moves forward after 0.5 s. The final volume fraction of CO2 is about 0.4, and the injection rate has little effect on the final volume fraction of CO2.
Figure 7 is an enlarged screenshot of the water drive at two consecutive times. CO2 enters the pores from the left side, driving the oil to the right until the outlet. The microcosmic zoom in two consecutive moments of the figure shows that when water passes through the pore throat, its speed is obviously slow, and the distance of the water phase moving forward in the first two consecutive moments is very small. In the last two moments, the water seems to break through a bottleneck; its speed becomes fast and its moving distance becomes longer, quickly breaking through the adjacent pore body. Then, the water fills the whole pore body and continues to flow to the next adjacent pore body. This phenomenon is a typical Haines jump phenomenon. A Haines jump occurs in the process of displacement, which is formed after the displacement pressure breaks through the capillary force. At this time, the displacement pressure is greater than the capillary pressure, so the pressure suddenly rises.
(2) Effects of the contact angle
In order to understand the complete influence of the contact angle on displacement and the migration law at the pore scale, this section uses different contact angles and considers four situations, including non-wetting with a contact angle of 30°, water wetting with a contact angle of 60°, medium wetting with a contact angle of 90°, and high wetting with a contact angle of 120°, as shown in Figure 8. The main preferential flow paths in the four cases are very similar, and the wettability of porous media dominates the migration path of CO2. After CO2 injection from the inlet, CO2 is gradually pushed forward until the outlet; the oil is constantly discharged, but there is also a lot of residual oil. However, it is also found that under the action of different contact angles, the final displacement effect is quite different. The larger the contact angle, the wider the CO2 spreads. After 2.0 s of CO2 displacement, the contact angle is larger and the constant CO2 saturation is higher.
Figure 9 shows the CO2 volume fraction under different contact angles. It can be seen in the figure that as the contact angle increases, the wettability of CO2 to rocks increases, and the overall displacement spread also increases. CO2 is also more widely distributed, indicating that under a high contact angle, the displacement effect of CO2 will be significantly improved. At a low contact angle, it is difficult for the CO2 to diffuse effectively, and at a low diffusion angle, the large hole is not fully filled by CO2 at a small contact angle because of the unevenness of the interface. As the contact angle increases, CO2 diffusion is more obvious. The larger the contact angle is, the stronger the wettability is, which means the rock matrix is more hydrophilic. As the capillary force is considered resistance, CO2 migration becomes more difficult. However, when the contact angle is 60°, the volume fraction of CO2 increases very slowly, which is finally close to that when the contact angle is 30°, rather than between 30° and 120°.
The whole process of displacement can be divided into three stages as follows: the fast-rising stage, the slow-rising stage, and the stable stage. Figure 10 shows the oil recovery curves under different contact angles. By comparing the oil recovery curves under four contact angles of 30°, 60°, 90°, and 120°, we can see that there is a clear correlation between oil recovery and the size of the wetting angle. With the increase in the contact angle, the oil recovery also increases because the size of the wetting angle directly affects the size of the capillary pressure. In the early stage, it is in a rapid rise period with a fast growth rate. The displacement continues to advance and a large number of oil drops are discharged, and then, the speed slows down. Before reaching the stable period, the recovery factor gradually slows down with the amount of CO2 entering the porous medium. After reaching the stable period, the recovery factor hardly changes with the increase in time. The final recovery factor is about 80% at the contact angles of 90° and 120°, but about 40% at the contact angles of 30° and 60°, representing a big difference, which further explains the complex impact of the wetting angle on the recovery factor. It involves the impact of a variety of complex situations and needs further exploration. The recovery curves under the conditions of 30° and 60° contact angles are close to coincidence, which indicates that there is no significant difference in the impact on recovery under the conditions of 30° and 60° contact angles in this section.
(3) Effects of interfacial tension
Under the same temperature and pressure, the interfacial tension of porous media will change because of the change in CO2 concentration [13]. When the interfacial tension in the CO2 oil rock system is very high, CO2 occupies less pore space and migration path. However, a low interfacial tension in a reservoir will easily allow CO2 to penetrate through the porous media in the middle of pores or pore throats. Figure 11 shows the spatial distribution of CO2 saturation in porous media at T = 0.1 s (a,b) and 1.0 s (c,d) after CO2 injection under the conditions of high interfacial tension (27 mN/m) and low interfacial tension (20 mN/m). It can be seen that CO2 saturation is relatively low under high interfacial tension (27 mN/m) because high interfacial tension corresponds to higher capillary pressure, and a too-high capillary pressure will hinder the flow of CO2 in the pores. However, the CO2 distribution range in both cases is roughly the same.
Figure 12 shows the CO2 volume fraction under the conditions of high interfacial tension (27 mN/m) and low interfacial tension (20 mN/m). It is necessary to conduct more simulations under higher and lower interfacial tensions for more in-depth exploration. The volume fraction of CO2 increased rapidly at the initial stage, but it basically reached the highest point in about 0.2 s and then increased very slowly.
Figure 13 shows the recovery curves under different interfacial tensions. By comparing the recovery curves of CO2 displacement under the conditions of high interfacial tension (27 mN/m) and low interfacial tension (20 mN/m), we can see that there is no obvious correlation between interfacial tension and recovery because the recovery curves under the two conditions basically coincide. However, the recovery efficiency under both conditions increases with the amount of CO2 entering the porous medium. At the final stable stage, the recovery efficiency of both reaches 85%, which is a good displacement effect and may reach the peak of recovery. It is difficult to further improve the recovery efficiency by changing the interfacial tension.
(4) Effects of the viscosity ratio
In the process of rock displacement and imbibition, fluid viscosity is an important factor affecting fluid migration within the pore structure and has always been an important parameter. The viscosity ratio is the ratio of CO2 to oil viscosity M   = μ w μ n w . This section simulates the real pore structure of rocks with different viscosity ratios to study the influence of different viscosity ratios on CO2 displacement. Figure 14 shows the comparison of the CO2 migration results under different viscosity ratios, where (a) logM = −3.2; (b) logM = −3.5; (c) logM = −3.8; and (d) logM = −4.1. It can be seen that CO2 diffusion becomes more difficult as the viscosity ratio becomes smaller. A low viscosity ratio means that the corresponding wetting effect is low. In complex porous media, the wettability will greatly affect the movement path and displacement effect of CO2. So, the CO2 has a better displacement effect with a high viscosity ratio. The low viscosity ratio also means that the viscosity of CO2 is also low. In the normal displacement process, because of the complexity of pores, there are dominant channels. Under a smaller viscosity ratio, it is easier to form dominant channels, but the connectivity is worse. The viscosity comparison makes the formation of the dominant channel slower, but the final spread range is relatively larger.
Figure 15 shows the CO2 volume fraction under different viscosity ratios. It can be seen that the viscosity ratio increases. With the increase in CO2 viscosity, the wettability of rocks increases, and the overall displacement spread range also increases. CO2 is also more widely distributed, indicating that is at a high viscosity ratio. The displacement effect of CO2 will be significantly improved. At low contact angles, it is difficult for CO2 to diffuse effectively. And at a low viscosity ratio, wettability is smaller, and the resistance is greater, making CO2 migration more difficult [16]. At the viscosity ratios of logM = −3.8 and logM = −4.1, the final stable CO2 volume fraction is about 0.45. At the viscosity ratios of logM = −3.2 and logM = −3.5, the final stable CO2 volume fraction is about 0.5.

4. Conclusions

This paper studies the pore scale flow law of a complex pore structure, establishes a CO2–oil two-phase flow model, analyzes the flow characteristics and CO2 migration in the displacement process, and conducts displacement simulation at different speeds, contact angles, viscosity ratios, and interfacial tensions. The main conclusions are as follows:
(1) The overall displacement process can be divided into three stages as follows: the rapid rise stage, the slow rise stage, and the stable stage. The first stage is a rapid rise period; when CO2 begins to be injected, it quickly flows to the dominant channel to squeeze out the oil. The second stage is a slow rise period, in which CO2 keeps advancing in the advantageous flow channel and slowly diffuses to other small flow channels. The amount of oil squeezed out gradually increases. The third stage is the stable displacement stage, in which the residual oil is often distributed in the narrow pore throat and small pores, and it is difficult to use. Therefore, CO2 diffusion is slow, the displacement process is basically stable, and the recovery rate is almost unchanged.
(2) CO2 moves forward along different flow channels, of which three main flow channels are the dominant channels. The CO2 migration speed is fast, and the circulation volume is large. The simulation results at different injection speeds show that the higher the CO2 injection rate, the more obvious the movement of CO2. The saturation of CO2 with time is also correspondingly larger, which is a positive correlation. After 0.5 s, the saturation is almost unchanged, and the final volume fraction of CO2 is about 0.4. The injection rate has little effect on the final volume fraction of CO2.
(3) The wettability of CO2 to rocks increases with an increased contact angle. The displacement effect of CO2 will be significantly improved. Because there is a clear correlation between the recovery factor and the size of the wetting angle, the recovery factor also increases with the increase in the contact angle. The impact of a variety of complex situations should be considered, and more in-depth exploration is needed. The capillary pressure becomes higher with the growth in the interfacial tension. The greater the resistance to CO2 migration, the lower the CO2 saturation. Through simulation and comparison under different viscosity ratios, we found that the greater the viscosity ratio, the better the wettability. The more easily CO2 diffuses, the wider the spread range.

Author Contributions

Conceptualization, Y.T.; Methodology, L.Y.; Validation, Y.C.; Formal analysis, Z.B.; Resources, Y.Y.; Data curation, J.W.; Writing—original draft, S.W. All authors have read and agreed to the published version of the manuscript.

Funding

This work is supported by the National Key Research and Development Program of China under grant (2022YFE0206700).

Data Availability Statement

Data are contained within the article.

Conflicts of Interest

Author Li Yang was employed by the Xinjiang Oilfield company. The remaining authors declare that the research was conducted in the absence of any commercial or financial relationships that could be construed as a potential conflict of interest.

References

  1. Shahraeeni, M.; Hoorfar, M. Pore-network modeling of liquid water flow in gas diffusion layers of proton exchange membrane fuel cells. Int. J. Hydrogen Energy 2014, 39, 10697–10709. [Google Scholar] [CrossRef]
  2. Lee, K.-J.; Kang, J.H.; Nam, J.H. Liquid water distribution in hydrophobic gas-diffusion layers with interconnect rib geometry: An invasion-percolation pore network analysis. Int. J. Hydrogen Energy 2014, 39, 6646–6656. [Google Scholar] [CrossRef]
  3. Liu, Z.; Wu, H. Pore-scale modeling of immiscible two-phase flow in complex porous media. Appl. Therm. Eng. 2016, 93, 1394–1402. [Google Scholar] [CrossRef]
  4. Salomov, U.R.; Chiavazzo, E.; Asinari, P. Pore-scale modeling of fluid flow through gas diffusion and catalyst layers for high temperature proton exchange membrane (HT-PEM) fuel cells. Comput. Math. Appl. 2014, 67, 393–411. [Google Scholar] [CrossRef]
  5. Blunt, M.J.; Bijeljic, B.; Dong, H.; Gharbi, O.; Iglauer, S.; Mostaghimi, P.; Paluszny, A.; Pentland, C. Pore-scale imaging and modelling. Adv. Water Resour. 2013, 51, 197–216. [Google Scholar] [CrossRef]
  6. Liu, Z.; Sunden, B.; Wu, H. Numerical modeling of multiple bubbles condensation in subcooled flow boiling. J. Therm. Sci. Eng. Appl. 2015, 7, 031003. [Google Scholar] [CrossRef]
  7. Liu, Z.; Sunden, B.; Yuan, J. VOF modeling and analysis of filmwise condensation between vertical parallel plates. Heat. Transf. Res. 2012, 43, 47–68. [Google Scholar] [CrossRef]
  8. Zu, Y.Q.; Yan, Y.Y.; Gedupudi, S.; Karayiannis, T.G.; Kenning, D.B.R. Confined bubble growth during flow boiling in a mini-/microchannel of rectangular cross-section part II: Approximate 3-D numerical simulation. Int. J. Therm. Sci. 2011, 50, 267–273. [Google Scholar] [CrossRef]
  9. Park, J.W.; Jiao, K.; Li, X. Numerical investigations on liquid water removal from the porous gas diffusion layer by reactant flow. Appl. Energy 2010, 87, 2180–2186. [Google Scholar] [CrossRef]
  10. Xuan, Y.; Zhao, K.; Li, Q. Investigation on heat and mass transfer in a evaporator of a capillary-pumped loop with the lattice Boltzmann method: Pore scale simulation. Transp. Porous Med. 2011, 89, 337–355. [Google Scholar] [CrossRef]
  11. Hao, L.; Cheng, P. Pore-scale simulations on relative permeabilities of porous media by lattice Boltzmann method. Int. J. Heat Mass Transf. 2010, 53, 1908–1913. [Google Scholar] [CrossRef]
  12. Yang, L.; Yang, D.; Zhang, M.; Meng, S.W.; Wang, S.L.; Su, Y.T.; Long, X. Application of nano-scratch technology to identify continental shale mineral composition and distribution length of bedding interfacial transition zone—A case study of Cretaceous Qingshankou formation in Gulong Depression, Songliao Basin, NE China. J. Petrol. Sci. Eng. 2024, 234, 212674. [Google Scholar] [CrossRef]
  13. Raeini, A.Q.; Yang, J.; Bondino, I.; Bultreys, T.; Blunt, M.J.; Bijeljic, B. Validating the generalized pore network model using micro-CT images of two-phase flow. Transp. Porous Media 2019, 130, 405–424. [Google Scholar] [CrossRef]
  14. Rokhforouz, M.R.; Akhlaghi Amiri, H.A. Phase-field simulation of counter-current spontaneous imbibition in a fractured heterogeneous porous medium. Phys. Fluids 2017, 29, 062104. [Google Scholar] [CrossRef]
  15. Liu, H.; Zhu, Z.; Patrick, W.; Liu, J.; Lei, H.; Zhang, L. Pore-scale numerical simulation of supercritical CO2 migration in porous and fractured media saturated with water. Adv. Geo-Energy Res. 2020, 4, 419–434. [Google Scholar] [CrossRef]
  16. Liu, Q.; Li, J.; Liang, B.; Liu, J.; Sun, W.; He, J.; Lei, Y. Complex wettability behavior triggering mechanism on imbibition: A model construction and comparative study based on analysis at multiple scales. Energy 2023, 275, 127434. [Google Scholar] [CrossRef]
  17. Zhu, Z.; Liu, J.; Liu, H.; Wu, M.; Song, Z. Numerical investigation of single- and two-phase flow in porous media with a bifurcated fracture. Phys. Fluids 2021, 33, 052117. [Google Scholar] [CrossRef]
  18. Zheng, J.; Ju, Y.; Wang, M. Pore-Scale Modeling of Spontaneous Imbibition Behavior in a Complex Shale Porous Structure by Pseudopotential Lattice Boltzmann Method. J. Geophys. Res. Solid Earth 2018, 123, 9586–9600. [Google Scholar] [CrossRef]
  19. Yang, L.; Yang, D.; Li, Y.; Cai, J.C.; Jiang, X.Y. Nanoindentation study on microscopic mineral mechanics and bedding characteristics of continental shales. Energy 2024. [Google Scholar] [CrossRef]
  20. Yang, L.; Wang, H.; Xu, H.; Guo, D.; Li, M. Experimental study on chara-cteristics of water imbibition and ion diffusion in shale reservoirs. Geoenergy Sci. Eng. 2023, 229, 212167. [Google Scholar] [CrossRef]
  21. Yu, L.; Evje, S.; Kleppe, H.; Kårstad, T.; Fjelde, I.; Skjaeveland, S.M. Spontaneous imbibition of seawater into preferentially oil-wet chalk cores experiments and simulations. J. Pet. Sci. Eng. 2009, 66, 171–179. [Google Scholar] [CrossRef]
  22. El-Amin, M.F.; Sun, S. Effects of gravity and inlet/outlet location on a two-phase cocurrent imbibition in porous media. J. Appl. Math. 2011, 2011, 673523. [Google Scholar] [CrossRef]
  23. Ahrenholz, B.; Tölke, J.; Lehmann, P.; Peters, A.; Kaestner, A.; Krafczyk, M.; Durner, W. Prediction of capillary hysteresis in a porous material using lattice-Boltzmann methods and comparison to experimental data and a morphological pore network model. Adv. Water Resour. 2008, 31, 1151–1173. [Google Scholar] [CrossRef]
  24. Almulhim, A.; Alharthy, N.; Tutuncu, A.N.; Kazemi, H. Impact of imbibition mechanism on flowback behavior: A numerical study. In Proceedings of the Abu Dhabi International Petroleum Exhibition and Conference, Abu Dhabi, United Arab Emirates, 4–7 November 2014; p. 171799. [Google Scholar]
  25. Vasheghani Farahani, M.; Mousavi Nezhad, M. On the effect of flow regime and pore structure on the flow signatures in porous media. Phys. Fluids 2022, 34, 115139. [Google Scholar] [CrossRef]
  26. Norouzi, S.; Soleimani, R.; Farahani, M.V.; Rasaei, M.R. Pore-scale simulation of capillary force effect in water-oil immiscible displacement process in porous media. In Proceedings of the 81st EAGE Conference and Exhibition 2019, London, UK, 3–6 June 2019; European Association of Geoscientists & Engineers: Utrecht, The Netherlands, 2019; Volume 2019, pp. 1–5. [Google Scholar]
  27. Hammoudi, M.; Henao, C.; Agbossou, K.; Dubé, Y.; Doumbia, M.L. New multi-physics approach for modelling and design of alkaline electrolyzers. Int. J. Hydrog. Energy 2012, 37, 13895–13913. [Google Scholar] [CrossRef]
  28. Deng, Z. Preliminary numerical simulation of multi-physics coupling of thermal anomaly mechanism before earthquake Research. Int. J. Seismol. 2012, 6, 289. [Google Scholar]
Figure 1. Computational model of a porous medium.
Processes 12 01670 g001
Figure 2. Computational domain meshing. (a) Overall grid division; (b) Local mesh division; (c) Grid independence.
Processes 12 01670 g002
Figure 3. Spatial distribution of CO2 in the porous media channel; (a) 0.02 s from left to right; (b) 0.06 s; (c) 0.1 s; and (d) 0.5 s (white represents solid particles, blue represents oil, and red represents CO2).
Processes 12 01670 g003aProcesses 12 01670 g003b
Figure 4. (a) Velocity and (b) pressure distributions in the flow field.
Processes 12 01670 g004
Figure 5. CO2 saturation in porous media after CO2 injection at different injection rates of (a) 5 mm/s; (b) 10 mm/s; (c) 15 mm/s; and (d) 20 mm/s.
Processes 12 01670 g005
Figure 6. Volume fraction of CO2 at different injection rates.
Processes 12 01670 g006
Figure 7. Microscopic enlargement of the region of continuous momentary displacement. (a) 0.1 s; (b) 0.3 s.
Processes 12 01670 g007
Figure 8. Results of CO2 transportation at different contact angles of (a) 30°, (b) 90°, (c) 60°, and (d) 120°.
Processes 12 01670 g008
Figure 9. Volume fraction of CO2 at different contact angles.
Processes 12 01670 g009
Figure 10. Recovery rates at different contact angles.
Processes 12 01670 g010
Figure 11. Spatial distribution of CO2 saturation in porous media at T = 0.1 s (a,b) and 1.0 s (c,d) after CO2 injection under high interfacial tension (27 mN/m) and low interfacial tension (20 mN/m).
Processes 12 01670 g011
Figure 12. Volume fraction of CO2 at different interfacial tensions.
Processes 12 01670 g012
Figure 13. The recovery curves for different interfacial tensions.
Processes 12 01670 g013
Figure 14. Comparison of CO2 migration results under different viscosity ratios, where (a) logM = −3.2; (b) logM = −3.5; (c) logM = −3.8; and (d) logM = −4.1.
Processes 12 01670 g014
Figure 15. Effect of the CO2 volume fraction on cracking at different viscosity ratios.
Processes 12 01670 g015
Disclaimer/Publisher’s Note: The statements, opinions and data contained in all publications are solely those of the individual author(s) and contributor(s) and not of MDPI and/or the editor(s). MDPI and/or the editor(s) disclaim responsibility for any injury to people or property resulting from any ideas, methods, instructions or products referred to in the content.

