Article

Effect of Far-Infrared Drying on Broccoli Rhizomes: Drying Kinetics and Quality Evaluation

School of Mechanical Engineering, Chongqing Three Gorges University, Chongqing 404020, China
*
Author to whom correspondence should be addressed.
Processes 2024, 12(8), 1674; https://doi.org/10.3390/pr12081674 (registering DOI)
Submission received: 7 July 2024 / Revised: 30 July 2024 / Accepted: 6 August 2024 / Published: 9 August 2024
(This article belongs to the Section Food Process Engineering)

Abstract

:
To clarify the effects of far-infrared drying technology on the drying kinetics and quality of broccoli rhizomes, broccoli rhizomes were dehydrated at 60, 65, 70, 75 and 80 °C, respectively. Eight thin-layer drying mathematical models were used to explore the drying kinetic characteristics and comprehensively evaluate their quality. The results showed that the higher the drying temperature, the shorter the time required to dry the broccoli rhizomes to the endpoint, and the higher the drying rate. The drying temperature was 80 °C, the shortest drying time was 360 min, and the average drying rate was 4.72 g·g−1·min−1. The longest drying time at 60 °C was 660 min, and the minimum average drying rate was 1.99 g·g−1·min−1. The effective diffusion coefficients of moisture at different drying temperatures were 1.22 × 10⁻⁶, 1.25 × 10⁻⁶, 1.34 × 10⁻⁶, 1.46 × 10⁻⁶ and 1.55 × 10⁻⁶ m2/min, respectively. The activation energy was calculated to be 12.26 kJ/mol by the linear relationship between the effective moisture diffusion coefficient and time. From the thermodynamic parameters, the drying of broccoli rhizomes is a non-spontaneous process, and it is necessary to absorb heat from the medium to achieve dehydration. With an increase in the drying temperature, the drying effect is better. The fitting results of eight mathematical models showed that Modified Page, Page, and Wang and Singh were the best mathematical models for the far-infrared drying kinetics of the broccoli rhizomes. The membership function method comprehensively evaluated the quality of the broccoli rhizome dry products. The comprehensive order was 60 °C > 65 °C > 75 °C > 70 °C > 80 °C. When the temperature was 60 °C, the physicochemical properties and nutritional quality of broccoli rhizome were well preserved, and the quality was the best. Therefore, 60 °C is the best temperature for broccoli rhizome drying. The results provide a theoretical reference for further improving the far-infrared drying quality of broccoli rhizomes.

1. Introduction

Broccoli (Brassica oleracea L. var. italica Planck) belongs to the variety of Brassica oleracea in the Cruciferae family [1]. Its nutritional value and disease prevention benefits surpass those of other vegetables, leading to its monikers ‘God-Gifted Medicine’ and ‘Physician of the Poor’. Broccoli is abundant in naturally active compounds that are beneficial to human health, such as polyphenols, flavonoids, proteins, vitamins, and glucosinolates (referred to as ‘glucosinolates’) [2,3]. Glucosinolates can be transformed into sulforaphane, a potent anticancer compound, through myrosinase, making it one of plant-based foods’ most well-known anticancer substances [4,5]. At present, the use of broccoli by consumers is mainly the consumption of flower balls. The rhizome part is often treated as waste because it contains more crude fiber and has poor taste, resulting in a waste of resources. Research has shown that broccoli stems also contain valuable active compounds and significant development potential. Therefore, enhancing the utilization efficiency of broccoli stems and increasing the value of the broccoli industry have emerged as critical challenges that need urgent attention [6,7].
The water content of fresh broccoli rhizomes is as high as 90%, which makes them susceptible to rot and deterioration. A drying treatment is an effective way to prolong the storage period of broccoli rhizomes [8]. The traditional way of drying fruits and vegetables is natural air drying. This method not only has low productivity and poor product quality, but also the sanitary conditions are difficult to meet the standards, which cannot meet the development needs of modern fruit and vegetable industrialization. Far-infrared drying is a thin-layer drying method that uses infrared rays with a wavelength of 5.6–1000 μm as the energy and driving force to quickly dehydrate materials [9]. Compared with near-infrared drying and mid-infrared drying, its radiation rays penetrate deeper into the object. During drying, the far-infrared light can penetrate the surface of the material and be absorbed by the particles inside the material, causing a strong resonance of the water molecules in the material. Because the wet diffusion and thermal diffusion directions inside the material are consistent during the drying process [10]. Compared with other thin-layer drying methods such as natural air drying and hot air drying, it has the advantages of high thermal efficiency and uniform temperature, which can cause the final dry product to have better quality [11]. Li et al. [12] used hot air and far-infrared drying to dehydrate strawberry powder and found that its quality was better with far-infrared drying. Chen et al. [13] used six different drying methods which were sun drying, shade drying, hot air drying, far-infrared drying, microwave drying and ultrasonic hot air drying to dry Eucommia ulmoide leaves. The results showed that far-infrared drying had the least effect on the composition of Eucommia ulmoide leaves, and the effective components were well preserved, resulting in a more reliable drying method.
At present, the drying method of broccoli is mainly hot air drying, and there are relatively few reports on far-infrared drying of broccoli rhizomes. Therefore, this study used far-infrared drying technology to dry the rhizomes of broccoli at different temperatures of 60, 65, 70, 75, and 80 °C. By analyzing the drying characteristics, a mathematical model was established, and the quality changes of broccoli rhizomes before and after drying were studied. The aim was to provide a theoretical basis and technical support for the processing of broccoli by-products to improve the utilization efficiency of broccoli rhizomes, and to increase the added value of the broccoli industry.

2. Materials and Methods

2.1. Materials

The test samples were fresh broccoli picked in the vegetable garden of Ganning Town, Wanzhou District, Chongqing. Fresh broccoli without mechanical damage, insect pests, and diseases were selected. Before the experiment, the broccoli was stored in a refrigerator with constant temperature and humidity at 4 °C. The initial moisture content of fresh samples was 96.08 ± 0.02% by direct drying method [14].

2.2. Experimental Methods

2.2.1. Far-Infrared Drying

The fresh broccoli rhizomes were washed and cut into cubes about 1 × 1 cm in size. Each group of 60 g broccoli rhizomes was weighed and placed on a tray and dried in a far-infrared drying oven (DHG-9023A, Wujiang Yonglian Machinery Equipment Factory, Suzhou, China), as shown in Figure 1. The drying temperatures were set to 60, 65, 70, 75 and 80 °C, respectively. The mass was measured every 10 min in 0~0.5 h, every 15 min in 0.5~1 h, every 30 min in 1~2 h, and then every 1 h. When the moisture content of broccoli rhizome decreased to 10%, the drying was stopped. To ensure the rigor of the experiment, each group of experiments was repeated three times and the average value was taken. The dried broccoli rhizomes were crushed and passed through a 60-mesh sieve and stored in a refrigerator at 4 °C for subsequent analysis of physical and chemical properties.
The broccoli rhizome samples with different treatments were weighed using a ten-thousandth balance (FA1104, Shanghai Shunyu Hengping Scientific Instrument Co., Ltd., Shanghai, China) to obtain a drying curve.

2.2.2. Drying Kinetics

Moisture Ratio

Moisture ratio (MR) refers to the residual moisture content in the rhizome of broccoli after drying for some time [15]. The calculation formula is as follows:
M R = M t M e M 0 M e
In the formula, MR represents the water ratio; M0 represents the initial dry basis moisture content; g/g; Mt represents the dry basis moisture content at time t; and g/g; Me represents the dry basis moisture content at equilibrium.

Drying Rate

The drying rate (DR) refers to the amount of water evaporated from broccoli rhizomes per unit of time [15]. The formula is as follows:
D R = M t M t + Δ t Δ t
In the formula, DR represents the drying rate; g/(g·min); Mt and Mt + Δt are the dry basis moisture content of the sample at t and t + Δt, respectively, g/g; and Δt is the drying interval time, min.

Effective Moisture Diffusivity

The effective moisture diffusion coefficient (Deff) is an important indicator of moisture diffusion in materials, which reflects the dehydration ability of materials under certain drying conditions [16]. The calculation formula is as follows:
ln M R = ln 8 π 2 π 2 D eff t 4 L 2
In the formula, MR represents the moisture ratio; t represents the drying time, min; and L represents half of the sample thickness, m.

Drying Activation Energy

The activation energy (Ea) represents the energy required to remove the amount of water per unit substance from the broccoli rhizome during the drying process [17]. The calculation formula is as follows:
E a = R T ln D eff D 0
In the formula, D0 represents the pre-factor, m2/min; T represents the absolute temperature, K; and R represents the molar gas constant, J/mol·K.

Thermodynamic Parameter

Enthalpy change (∆H) refers to the heat absorbed or released in the chemical reaction process under the condition of constant temperature and constant pressure, which is called the enthalpy change of the reaction. Gibbs free energy (Gibbs free energy, ΔG) is to explore the direction and limit of thermodynamic processes, and a thermodynamic state function and entropy change (Entropy change, ΔS) are artificially introduced to measure the degree of confusion of the system. The three are calculated according to the Formulas (5)~(8) [18,19,20].
ln k = ln A E a R T
Δ H = E a R T
Δ G = R T ln k h k B T
Δ S = Δ H Δ G T
In the formula, A represents the pre-exponential constant/min−1; R represents the ideal gas constant (8.314 × 10⁻³ kJ/(mol·K)); T represents the drying temperature/K; kB represents the Boltzmann constant (1.381 × 10⁻²³ J/K); and h represents the Planck constant (6.626 × 10⁻³⁴ J/(mol·K)).

Drying Mathematical Model

Eight kinds of common thin-layer drying mathematical models were selected, as shown in Table 1, to describe the change of moisture ratio during the drying process of the broccoli rhizomes, and to find out the best mathematical model for the broccoli rhizomes [21].
The determination coefficient (R2), Chi-square value (χ2), and RMSE were selected to evaluate the fitting effect of thin-layer drying kinetics. The R2, χ2, and RMSE calculation formulas are as follows:
R 2 = 1 i = 1 N M R pre , i M R exp , i 2 i = 1 N M R pre , i ¯ M R exp , i 2
χ 2 = i = 1 N M R pre , i M R exp , i 2 N n
R M S E = i = 1 N M R pre , i M R exp , i 2 N
In the formula, MRpre,i, i represents the ith test predicted moisture ratio; MRexp,i, i represents the moisture ratio of the first i test; and N represents the number of tests.

2.2.3. Physicochemical Properties Index

Determination of Color

The color of the dried broccoli rhizome was evaluated. The color of broccoli rhizome granules was determined by a colorimeter (PS2010, Shenzhen Sanenshi Technology Co., Ltd., Shenzhen, China). The L, a, and b values of broccoli rhizome were analyzed according to the CIELAB color system [22]. The calculation formula of ∆E is as follows:
Δ E = L L 0 2 + a a 0 2 + b b 0 2
In the formula, ∆E represents the color difference of broccoli rhizomes before and after drying; L, a, b represent the brightness, red-green value, yellow-blue value of broccoli rhizomes after drying; and L0, a0, b0 represent the brightness, red-green value, yellow-blue value of broccoli rhizome before drying.

Determination of Rehydration Ratio

After drying, 1.5 g of broccoli rhizome cubes were soaked in distilled water for 2 h, and the solid–liquid ratio was 1:100. The residual water droplets on the surface of broccoli rhizome cubes were dried with absorbent paper and weighed. The three groups repeated the test and took the average value. The calculation formula of the rehydration ratio is as follows:
R R = m r m d
In the formula, RR represents the rehydration rate; mr represents the mass of dried broccoli rhizome after rehydration g; and md represents the mass of dried broccoli rhizome g.

2.2.4. Nutritional Quality Indicators

Determination of Total Flavonoids

The method employed by Deng et al. [23], slightly modified from the standard DB43/T476-2009 [24], involves the determination of total flavonoid content using spectrophotometry. Accurately weigh 0.5 g sample in a 150 mL conical flask, add 60 mL 30% ethanol (Tianjin BASF Chemical Co., Ltd., Tianjin, China), 50 °C water bath ultrasonic extraction for 1 h, and obtain the extract. A total of 1 mL of the extract was extracted in a 50 mL colorimetric tube, and 0.0, 0.5, 1.0, 2.0, 3.0, 4.0, and 5.0 mL of rutin standard solution (Shanghai Yuanye Biotechnology Co., Ltd., Shanghai, China) were extracted and placed in a 50 mL colorimetric tube. In the standard tube and the sample tube, 2.0 mL 2.5 g/100 mL aluminum chloride solution (Xilong Science Co., Ltd., Shantou, China) and 2.0 mL 9.82 g/100 mL potassium acetate solution (Xilong Science Co., Ltd., Shantou, China) were added to the standard tube and the sample tube, respectively. The volume was fixed to 50 mL with 30% ethanol, mixed and stood. The absorbance value was measured in a visible spectrophotometer (723 PC, Shanghai Jinghua Technology Instrument Co., Ltd., Shanghai, China) with a wavelength of 415 nm within 30 min.

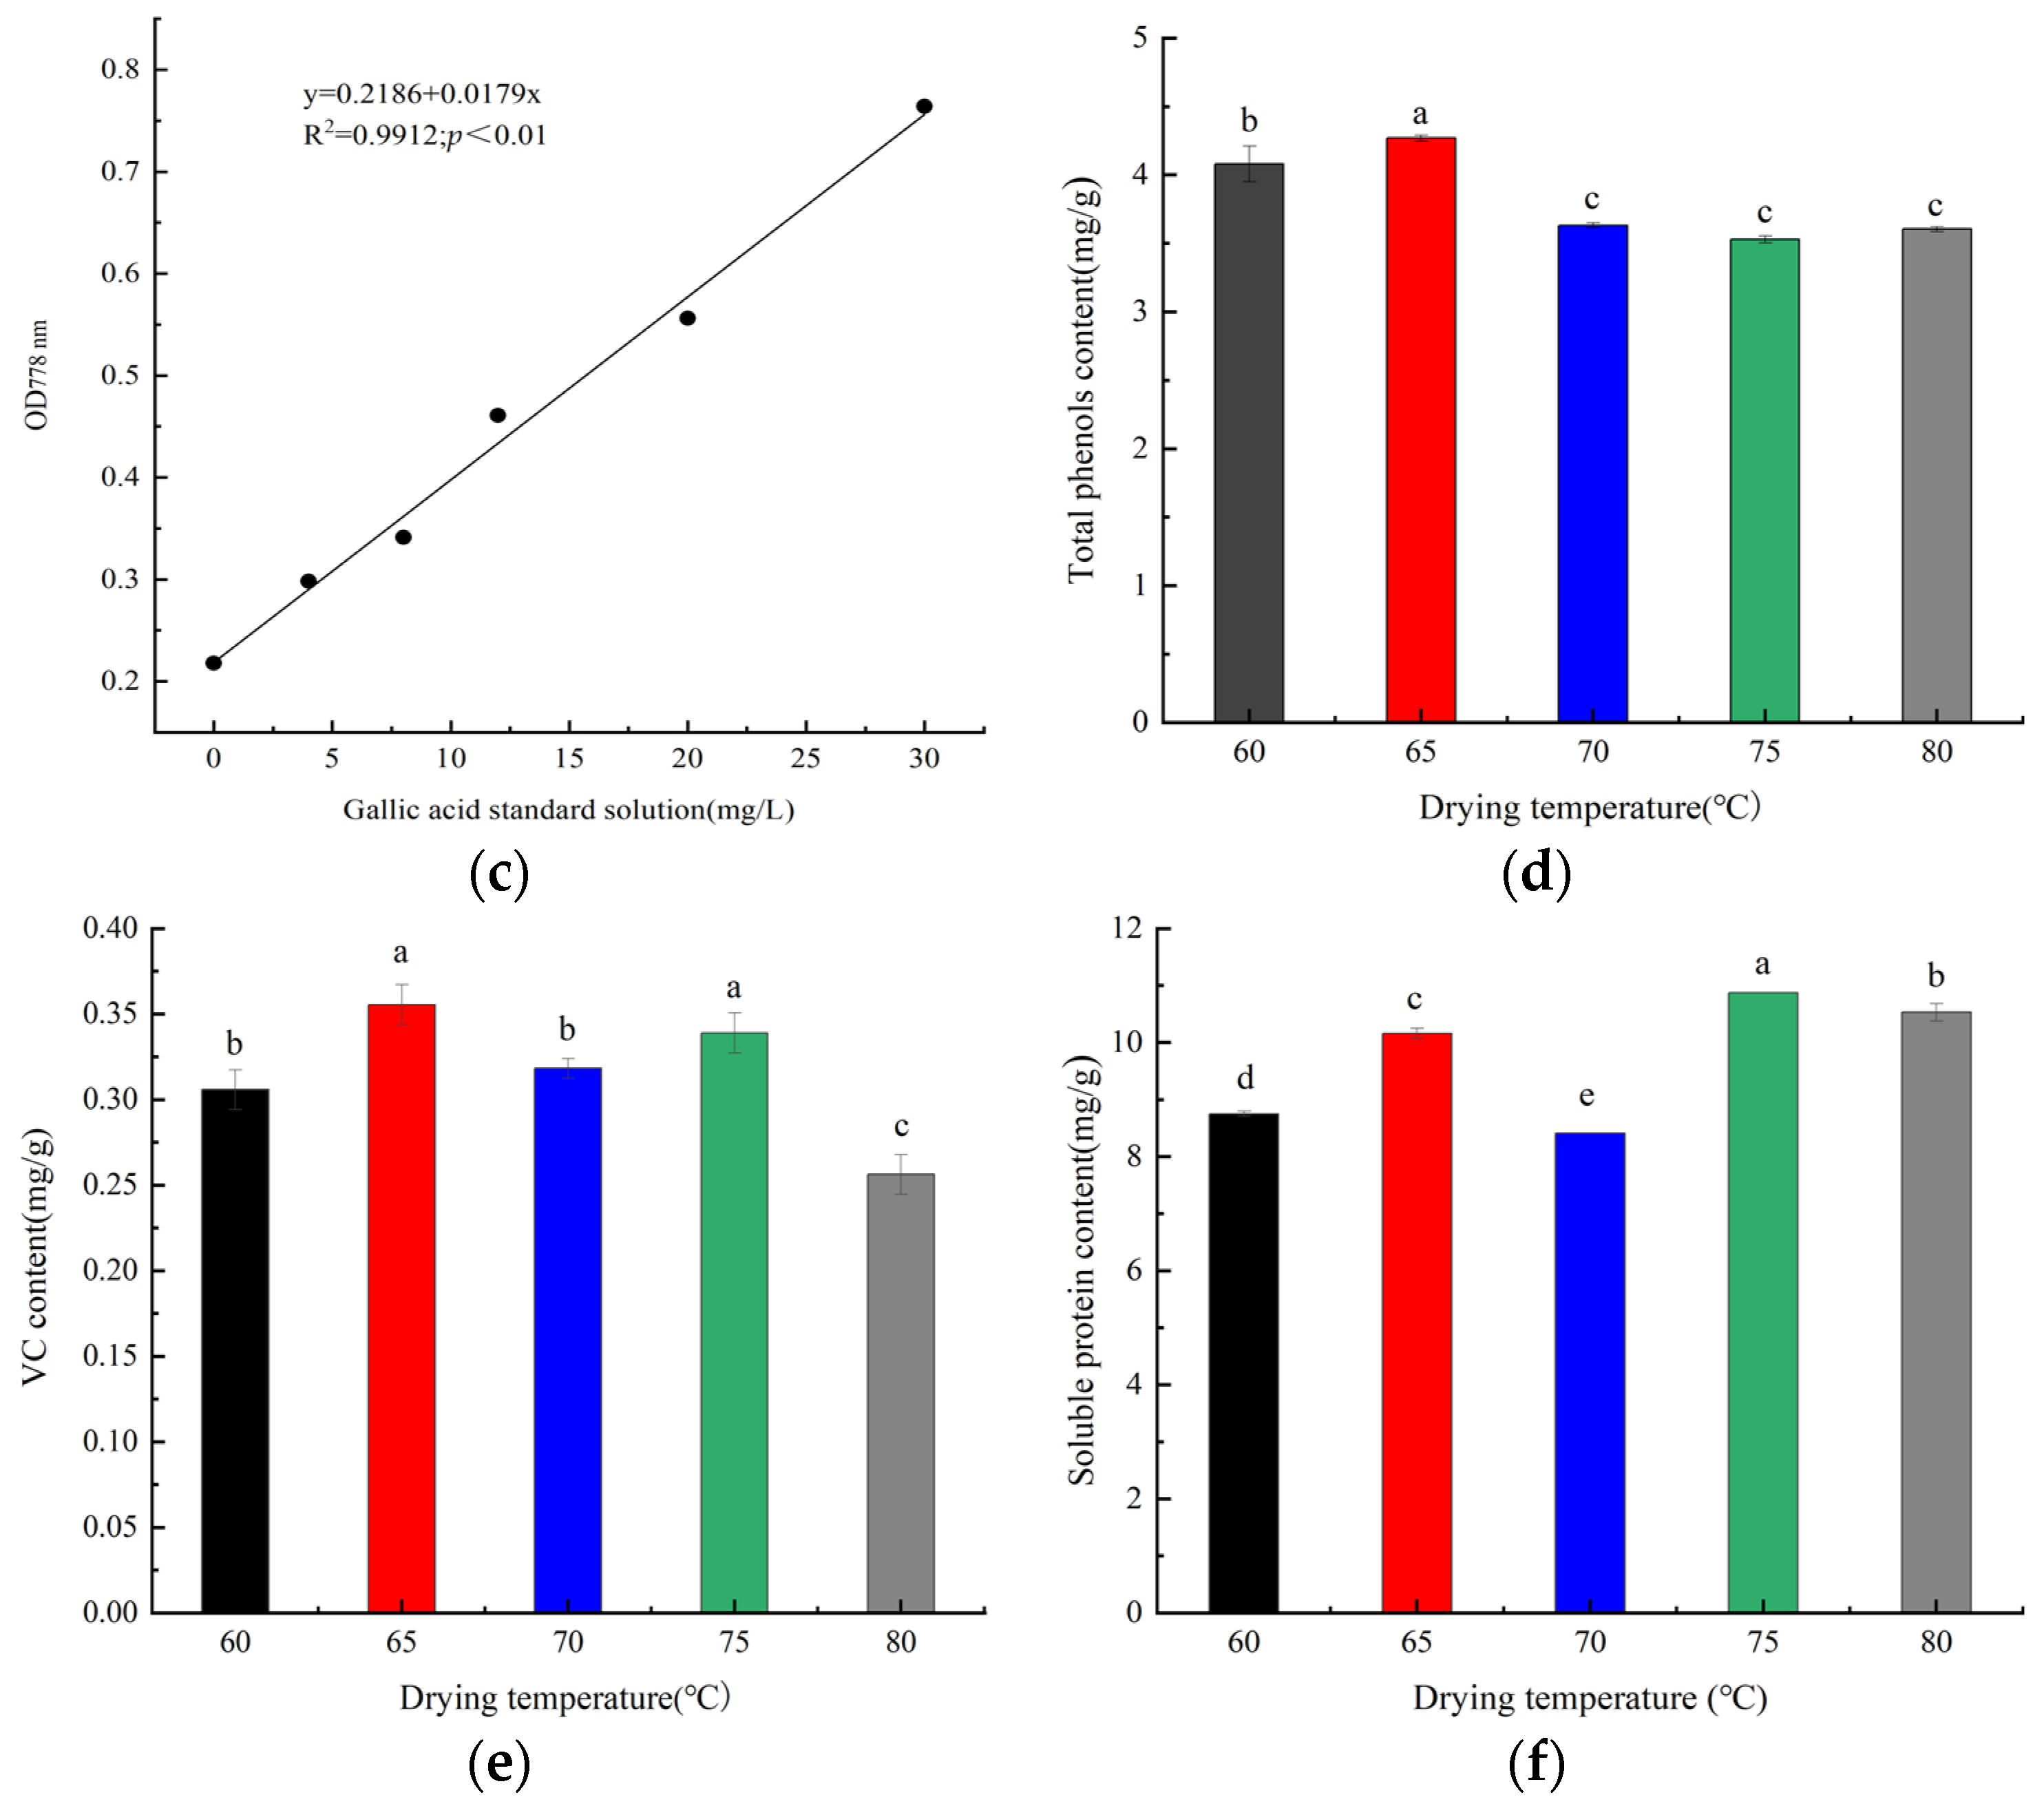
Determination of Total Polyphenols

The method outlined by Hou et al. [25] and others, in conjunction with a slightly modified standard H/AHIA 005-2018 [26], was employed to determine the total polyphenol content using Folin–Ciocalteu spectrophotometry. Accurately weigh 0.5 g sample in 150 mL conical flask, add 60 mL 60% ethanol, 50 °C water bath ultrasonic extraction for 1 h, and obtain the extract. Then, 0, 0.2, 0.4, 0.6, 1.0 and 1.5 mL gallic acid standard solution (Shanghai Yuanye Biotechnology Co., Ltd., Shanghai, China) were placed in 10 mL volumetric flasks and diluted with 60% ethanol to obtain a gallic acid working solution. A 1 mL working solution was taken into a 10 mL colorimetric tube, and 1 mL of extract was taken into a 10 mL colorimetric tube. Then, 2.5 mL of Folin–Ciocalteu reagent (Nanjing Guangxin Biotechnology Co., Ltd., Nanjing, China) was added and shaken well. Add 2.5 mL 15% Na2CO3 solution (Nanjing Guangxin Biotechnology Co., Ltd., Nanjing, China), add distilled water to the scale line, mix well, bath in 40 °C water for 60 min, stand, and cool for 20 min, and measure the absorbance value in a visible spectrophotometer (723PC, Shanghai Jinghua Technology Instrument Co., Ltd., Shanghai, China) with a wavelength of 778 nm.

Determination of Soluble Protein and Ascorbic Acid (VC) Content

The contents of soluble protein and VC in broccoli rhizomes were determined by referring to the method of Han et al. [27].

Determination of Chlorophyll and Carotenoids

The contents of chlorophyll and carotenoid in broccoli rhizomes were determined by referring to the method of An et al. [28]. The contents of chlorophyll a, chlorophyll b, and carotenoids were calculated according to the following formula:
ρ 1 = 9.99 A 665 nm 0.087 A 642 nm
ρ 2 = 17.7 A 642 nm 3.04 A 665 nm
ρ 3 = 4.92 A 474 nm 0.0255 ρ 1 0.225 ρ 2
In the formula, ρ 1 represents the mass concentration of chlorophyll a, mg/L; ρ 2 represents the mass concentration of chlorophyll b, mg/L; and ρ 3 represents the mass concentration of carotenoids, mg/L.

2.3. Data Processing and Analysis

Each experiment was repeated three times and measured three times, respectively. The experimental data were simply processed using Microsoft Excel 2019 16.0 software. IBM SPSS Statistics 21.0 was used for statistical analysis. Duncan’s multiple comparison was used between the means, and the significance test was performed at the 0.05 level (p < 0.05). Origin 2022 Correlation Plot was used to analyze the correlation of the package. Principal component analysis and membership function analysis were performed using IBM SPSS Statistics 21.0. In addition, the data need to be non-dimensionalized before principal component analysis and membership function analysis.

3. Results and Analysis

3.1. Effects of Different Temperatures on the Drying Characteristics of Broccoli Rhizomes Using Far-Infrared Drying

The impact of various temperatures of far-infrared drying on the appearance (A), moisture ratio (B), and drying rate (C) of broccoli rhizomes is illustrated in Figure 2. The moisture ratio curve demonstrates a decrease in the moisture ratio of the broccoli rhizomes as the drying time progresses. The time required to dry the broccoli rhizome to the endpoint was 660, 600, 480, 420, and 360 min, respectively. At the same time node, the temperature increased, the moisture ratio decreased significantly, and the time to reach the drying endpoint was greatly shortened. This phenomenon can be attributed to the fact that when the temperature is higher, there is a difference in the rate of heat conduction and water diffusion, resulting in a non-synchronous temperature change inside and outside the material, resulting in a larger temperature gradient and an enhanced drying effect [29].
It can be seen from the drying rate curve that there are significant differences in the drying rate of the broccoli rhizomes at different temperatures. The average drying rates of the broccoli rhizomes at different temperatures were 1.99, 2.34, 2.92, 3.55, and 4.7 g·g−1·min−1, respectively. The higher the temperature, the greater the drying rate. The drying rate increases first, then decreases and finally tends to stablise with the drying time. In the early drying stage, the broccoli rhizomes’ drying rate increased significantly due to the high initial water content and the rapid evaporation of a large amount of free water. In the late stage of drying, due to the combination of bound water in the broccoli rhizomes with other macromolecular substances, this part of the water is difficult to dry, resulting in a gradual slowdown in the drying rate which tends to be stable [30]. Therefore, increasing the temperature can significantly accelerate the drying process.

3.2. Moisture Effective Diffusion Coefficient, Activation Energy, and Thermodynamic Parameters of the Broccoli Rhizomes

The Deff, Ea, ΔH, ΔG, and ΔS of the broccoli rhizomes at different temperatures are shown in Table 2.
As shown in Table 2, when the drying temperature increased from 60 °C to 80 °C, the Deff of the broccoli rhizomes increased from 1.22 × 10⁻⁶ m2/min to 1.55 × 10⁻⁶ m2/min. This change further confirms that an increase in temperature can promote the process of mass transfer and heat transfer, thus accelerating the drying speed and reducing the required drying time; according to the linear relationship between Deff and t, Ea is calculated to be 12.26 kJ/mol, which is in the range of Ea (12 kJ/mol~110 kJ/mol) of most food materials. It shows that the starting energy required for the sample to evaporate 1 mol of water during the far-infrared drying process of the broccoli rhizomes is 12.26 kJ. During the drying process, ∆H represents the energy absorbed or released by the reactant broccoli rhizomes. The ∆H at five temperatures is 9.49, 9.45, 9.41, 9.37 and 9.33 kJ/mol, respectively, and ∆H > 0, which verifies that the dehydration of the broccoli rhizomes during far-infrared drying is an endothermic process. In addition, with an increase in temperature, ΔH decreases, which indicates that the drying process is smoother at higher temperatures, which corresponds to the previous results. The higher the temperature, the shorter the time required for drying to the endpoint, and the greater the drying rate; ΔG is a basic criterion for judging spontaneity, which characterizes the possibility of spontaneity in the process of water decomposition and adsorption and gives a perspective on the thermodynamic driving force affecting the water decomposition and adsorption reaction. In this study, ΔG > 0 indicates that the drying process of the broccoli rhizomes is a non-spontaneous reaction, which corresponds to the results of ΔH, indicating that the drying of the broccoli rhizomes is a process that requires energy from the environment to react. ∆S plays a decisive role in the chaos of matter, the change of energy, and the stability of the process. In this study, ∆S is negative and its value decreases with an increase in temperature, which indicates that with an increase in temperature, the product stability of the broccoli rhizome after drying was improved [8,31], which is consistent with the results of the peanut [32] and broccoli [33] drying processes.

3.3. Fitting and Analysis of the Drying Mathematical Model

The mathematical model of thin-layer drying can be used to describe and predict the drying process. The drying process of broccoli rhizome involves complex heat and mass transfer processes. Eight common thin-layer drying mathematical models were used to fit and analyze the experimental data to establish an accurate kinetic model to describe the drying process of broccoli rhizomes. The results are shown in Table 3 [34].
In this study, three commonly used statistical indicators R2, χ2, and RMSE were selected to determine the fitting of the drying mathematical model to the experimental data. When R2 is close to 1, χ2 and RMSE is closer to 0, the better the fitting effect is. It can be seen from Table 3 that the determination coefficient R2 of the Geometric model is between 0.0308 and 0.3296, which is not suitable for describing the far-infrared drying kinetics of the broccoli rhizomes. At five temperatures, the determination coefficients R2 of the Modified Page, Page, and Wang and Singh models are all greater than 0.99, the χ2 values are all less than 0.0001, and the RMSE is smaller than 0.01. Compared with the Henderson and the Pabis and Lewis models, the fitting degree is better. Therefore, it is more reasonable to use the Modified Page, Page, and Wang and Singh models as the far-infrared drying kinetic model of the broccoli rhizomes [35]. This result is consistent with the results of Yuan et al. [30] in the study of the microwave freeze-drying characteristics and quality analysis of blueberries.

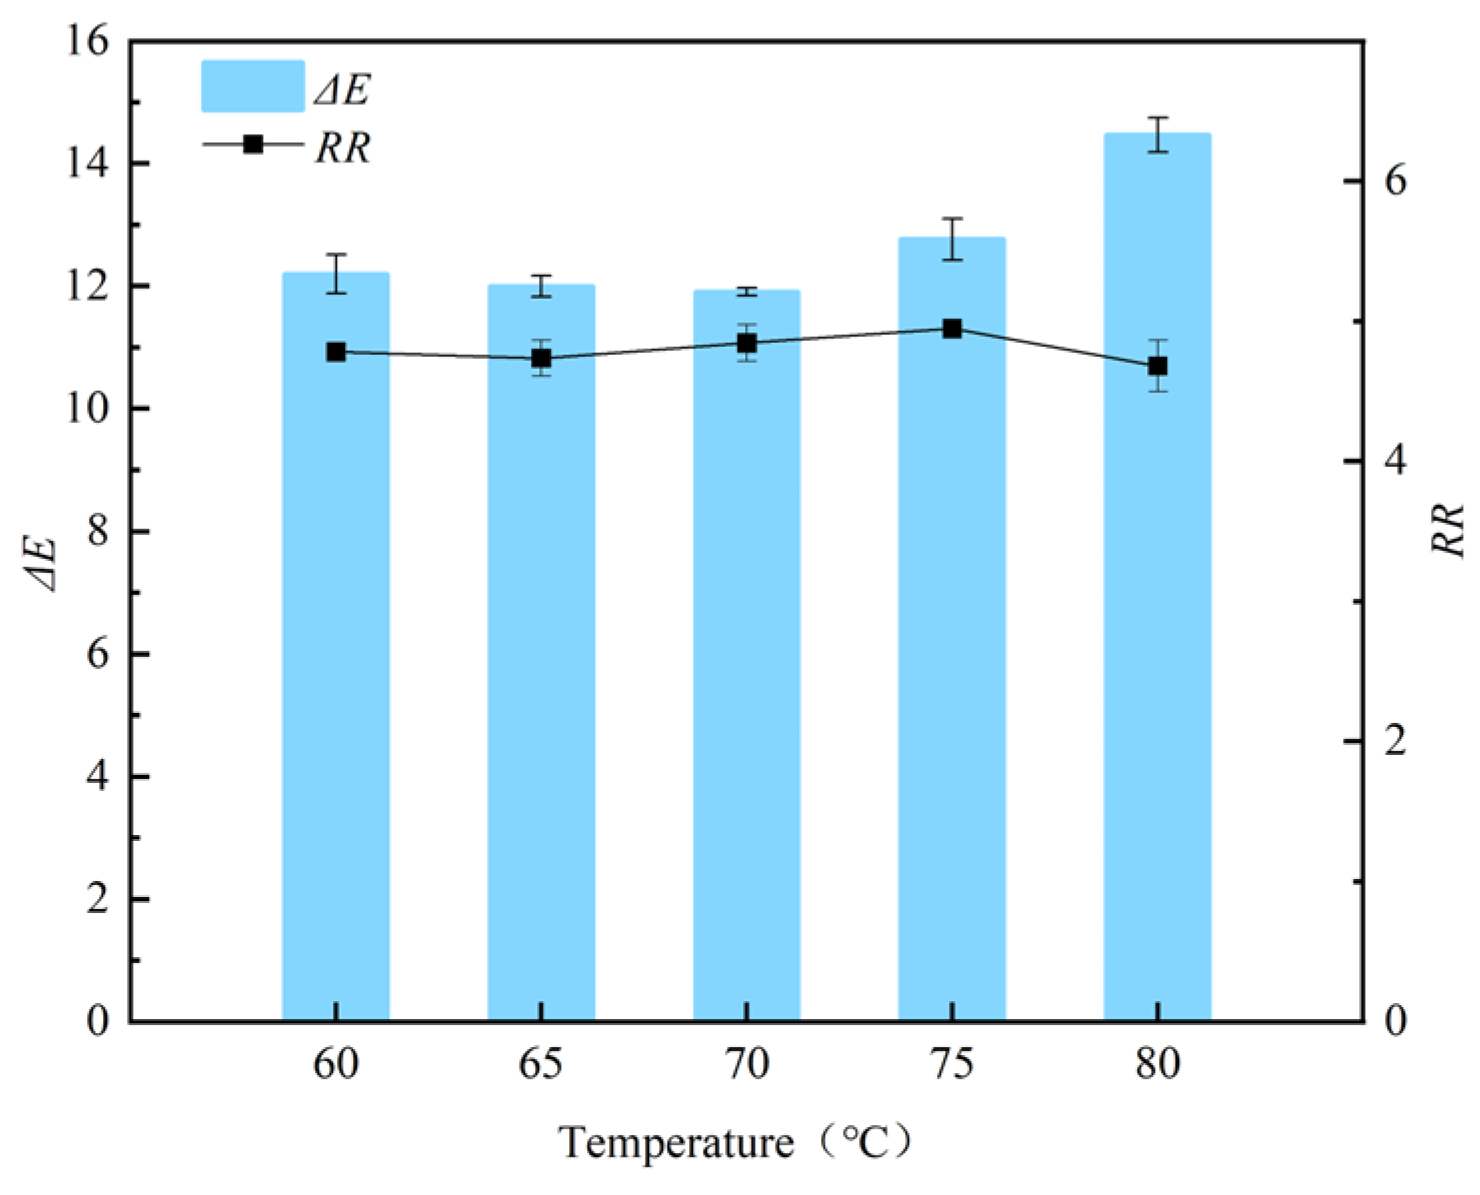
3.4. Effects of Different Temperatures on the Color of the Broccoli Rhizomes during Far-Infrared Drying

Color is one of the important quality indexes to evaluate the quality of dried broccoli rhizome products. The smaller the ∆E value is, the closer the color of the dried product is to the fresh state, and the better the quality is [36]. The L value of fresh broccoli rhizome was 72.11 ± 0.1. The a value was 4.688 ± 0.25; the b value was 17.9 ± 0.49. The color changes of the broccoli rhizomes under far-infrared drying at different temperatures are shown in Figure 3. The results showed that the temperature had a significant effect on the color of the broccoli rhizomes (p < 0.01). When the temperature was in the range of 60–70 °C, the ΔE values were 12.20, 11.99 and 11.9, respectively, and the color change was small. When the temperature rose to 75 °C and 80 °C, the ΔE value changed greatly, and the color change was more obvious. On the one hand, the reason for this phenomenon may be that the higher the temperature, the greater the impact on anthocyanin, vitamins and other heat-sensitive substances in the broccoli rhizomes, resulting in its decomposition, and the ΔE value changes greatly [37]; on the other hand, it may be that the higher the temperature, the stronger the Maillard reaction inside the broccoli rhizome, which reduces the brightness of the dried product, resulting in a large change in color difference [38].

3.5. Effects of Different Temperatures of Far-Infrared Drying on the Rehydration Ratio of the Broccoli Rhizomes

Rehydration is a direct indicator to measure the degree of cell and tissue structure damage during drying [39]. According to Figure 3, the rehydration ratio of broccoli rhizomes was 4.79 ± 0.05, 4.73 ± 0.13, 4.84 ± 0.13, 4.95 ± 0.02, 4.68 ± 0.18, respectively. When the temperature increased from 60 °C to 75 °C, the rehydration ratio of the broccoli rhizomes increased, but there was no significant change. When the temperature was 75 °C, the rehydration ratio reached the maximum. The rehydration characteristics of the broccoli rhizomes are closely related to drying temperature and time. Compared with lower temperatures, higher temperatures and shorter times mean that the broccoli rhizomes per unit mass absorb more heat energy, and the rate of water evaporation is accelerated, resulting in more porous structures inside the broccoli rhizomes, thereby increasing the rehydration ratio. However, compared with 80 °C, a too-high temperature may lead to changes in the structure and composition of some cells and tissues of the broccoli rhizomes, resulting in a decrease in rehydration ratio. Zhang [31] found in the microwave vacuum treatment of sea cucumber and YAO [40] found in the study of dry pepper that irreversible cell damage and dislocation occurred inside the material, resulting in loss of cell integrity and contraction of capillary channels, thus affecting rehydration.

3.6. Effects of Far-Infrared Drying at Different Temperatures on the Content of Total Flavonoids, Total Phenols, VC, and Soluble Protein in Broccoli Rhizomes

The drying temperature had a significant effect on the nutritional quality of the broccoli rhizomes. Figure 4a shows the standard curve of rutin, the regression equation is y = 0.0096x + 0.0055, R2 = 0.9949; Figure 4c shows the standard curve of gallic acid, the regression equation is y = 0.0179x + 0.2186, R2 = 0.9912. The mass concentration of rutin and gallic acid had a good linear relationship with absorbance. According to the data of Figure 4b,d,e, the total flavonoid content was 2.93 ± 0.03, 4.13 ± 0.02, 3.94 ± 0.02, 5.28 ± 0.05 and 6.17 ± 0.05, respectively. There were significant differences between the different temperature treatment groups. Studies have shown that the content of total flavonoids is only partially degraded in the moderately dry (60–100 °C) temperature range, but high temperatures will also destroy the cell structure of broccoli rhizomes, thereby improving the ability to extract total flavonoids, resulting in an increase in content with an increasing temperature, which is consistent with the results of Tang et al. [41] in the extraction process optimization and content comparison of total flavonoids in different types of tea. When the temperature increased from 60 °C to 65 °C, the total phenol content increased and reached the maximum at 65 °C. The reason for this phenomenon is that the increase in temperature may lead to partial damage to the cell structure and contribute to the release of phenols. However, as the drying temperature continues to increase (70, 75 and 80 °C), thermal decomposition becomes the dominant process, and some phenolic compounds begin to degrade due to thermal instability, but this degradation may gradually tend to be stable in a higher temperature range, resulting in no significant change in total phenolic content at 70, 75 and 80 °C [42]. The preservation rate of VC content in the dried broccoli rhizome products of the five temperature treatment groups was low, probably because VC had strong reducibility, was very unstable under high-temperature conditions, and was easily decomposed. In this study, the drying temperature was 60–80 °C, and most of the VC was decomposed, resulting in less VC content in broccoli rhizome-dried products.
Different temperature treatments of far-infrared drying had different effects on soluble protein in broccoli rhizomes. At 75 °C, the soluble protein content was the highest, and a lower drying temperature may prolong the time of cell respiration and enzyme action, thus consuming more soluble protein. Too high a temperature may also destroy the structure of the protein, resulting in a decrease in soluble protein content [43].

3.7. Effects of Different Temperatures on Chlorophyll and Carotenoid in Broccoli Rhizomes Using Far-Infrared Drying

Chlorophyll is divided into chlorophyll a and chlorophyll b, which is the main pigment for photosynthesis of plants, and is one of the important indicators for judging the senescence of broccoli rhizomes. Carotenoids are a general term for a class of important natural pigments, which have many functions such as anti-oxidation, participation in photosynthesis, and staining. From Table 4, it can be seen that the chlorophyll a, chlorophyll b, and carotenoids of the broccoli rhizomes dried at 60 °C were the highest, which were 2.02 ± 0.03, 1.66 ± 0.06 and 0.89 ± 0.01, respectively. In contrast, chlorophyll a (0.99 ± 0.07), chlorophyll b (0.34 ± 0.24), and carotenoids (0.42 ± 0.3) were the lowest at 80 °C. With an increase in temperature, the content of chlorophyll and carotenoids decreased gradually. This is because chlorophyll is very sensitive to high temperatures. At high temperatures, chlorophyll molecules are prone to degradation reactions. Compared with chlorophyll, carotenoids are more stable to heat, but they also degrade at high temperatures [44]. Therefore, the drying temperature has a significant effect on maintaining the stability of these important pigments in broccoli rhizomes. The lower drying temperature is more conducive to maintaining the content of chlorophyll and carotenoids, thereby maintaining the freshness and nutritional value of broccoli rhizomes [45].

3.8. Comprehensive Evaluation of the Effects of Different Temperatures on the Quality of Broccoli Rhizomes Using Far-Infrared Drying

The membership function method uses the principle of fuzzy mathematics to achieve a quantitative analysis and a comprehensive comparison of multiple indicators at a unified level to increase the objectivity and accuracy of the evaluation results [46,47]. By this method, the membership function values of the quality indexes of broccoli rhizomes under five drying temperature treatments were calculated, and then the mean value of the membership function of the indexes was obtained. The higher the mean value of the membership function, the better the quality of the dried broccoli rhizome products, which can more fully reflect the overall quality of the broccoli rhizome and provide an effective quantitative tool for evaluating and comparing the quality of the dried broccoli rhizome products at different drying temperatures.

3.8.1. Correlation Analysis

The Pearson correlation between the drying temperature and the indicators of dried broccoli rhizome products is shown in Figure 5. The results showed that there was a significant positive correlation between drying temperature and L, ΔE and total flavonoid content (p < 0.01), a significant negative correlation between drying temperature and b, total phenolic content and carotenoid content (p < 0.01), a positive correlation between drying temperature and soluble protein content (p < 0.05), and a negative correlation between drying temperature and chlorophyll b content (p < 0.05). There was a certain correlation between drying temperature and a, VC content and chlorophyll a content, but the correlation between drying temperature and RR was not strong. The results were consistent with the results of Li Yannian’s study on the correlation between the drying process and the quality of Salvia miltiorrhiza extract, and there was a certain correlation between drying temperature and nutritional quality [48].

3.8.2. Principal Component Analysis

Due to the different units of the quality index of the broccoli rhizome dried products, the difference in the order of magnitude is large. Therefore, to eliminate the unreasonable influence caused by different dimensions, a principal component analysis is carried out after the original data are standardized. Principal component analysis can reduce the interference in the data and improve the reliability of the analysis results by retaining the main components and ignoring the low-variance components. After the principal component analysis of the quality indexes of broccoli rhizome dried products, the eigenvalues, contribution rates, and cumulative contribution rates of the four principal components were obtained, as shown in Table 5. The size of the eigenvalue represents the size of the difference between the parties, and the cumulative contribution rate represents the ability of each trait to contribute to the variance [49]. It can be seen from Table 5 that there are four principal component factors with eigenvalues greater than 1 obtained by principal component analysis. The eigenvalues of principal component 1 are 6.205, and the contribution rate is 51.709%. The eigenvalues of principal component 2 are 2.000, and the contribution rate is 16.664%. The eigenvalues of principal component 3 are 1.711, and the contribution rate is 14.257%. The eigenvalues of principal component 4 are 1.213, and the contribution rate is 10.110%. The four independent comprehensive indexes obtained by principal component analysis can fully reflect the information contained in the original 12 indexes and provide an accurate and comprehensive analysis framework for the quality evaluation of broccoli rhizome dried products [50]. This method effectively simplifies the evaluation process, while maintaining the accuracy and reliability of the evaluation.

3.8.3. Membership Function Values and Comprehensive Ranking of Quality Indexes of Broccoli Rhizomes Treated with Far-Infrared Drying at Different Temperatures

A comprehensive evaluation can clearly show the advantages and disadvantages of the drying effects at different temperatures. The evaluation system was established according to the measured index values, and the color, rehydration ratio, total flavonoids, and other indicators of dried broccoli rhizome products were selected for evaluation [51]. The mean value of the membership function and comprehensive ranking of quality indexes of broccoli rhizomes treated by far-infrared drying at different temperatures are shown in Table 6. The order of the mean value of membership function was 60 °C > 65 °C > 75 °C > 70 °C > 80 °C, indicating that the physical and chemical properties and nutritional quality of broccoli rhizomes were better maintained under the condition of far-infrared drying at 60 °C, which was the best temperature for drying broccoli rhizomes. On the contrary, far-infrared drying at 80 °C has the greatest impact on the quality of broccoli rhizomes; therefore, it is unsuitable for the processing of broccoli by-products. In summary, by reasonably selecting the drying temperature, far-infrared drying technology has significant advantages in maintaining the quality of broccoli rhizomes and has broad application prospects and commercial value.

4. Conclusions

The results of this study showed that dehydration of broccoli rhizomes under far-infrared drying at different drying temperatures (60, 65, 70, 75 and 80 °C) resulted in significant differences in drying characteristics and quality. With an increase in drying temperature, the moisture content of the broccoli rhizomes decreased more at the same time, and the drying speed was faster, thus significantly shortening the time required for drying to the endpoint. The color and rehydration ratio of the dried broccoli rhizomes showed that the appropriate drying temperature was crucial to maintain its color and prevent the destruction of cell structure. Broccoli rhizomes are rich in active substances with antioxidant properties but have poor stability. In the process of drying and dehydration, total flavonoids, total phenols, VC, soluble protein, chlorophyll a, chlorophyll b, and carotenoids are decomposed to a certain extent, and different drying temperatures lead to different degrees of decomposition. The effects of far-infrared drying on the quality of broccoli rhizomes at different temperatures were comprehensively evaluated using principal component analysis combined with membership function analysis. The comprehensive order was 60 °C > 65 °C > 75 °C > 70 °C > 80 °C. The results showed that the physical and chemical properties and nutritional quality of broccoli rhizomes were well preserved under the condition of far-infrared drying at 60 °C. Therefore, 60 °C is an ideal temperature for drying broccoli rhizomes. The results of this study provide a scientific basis for optimizing the drying process of broccoli rhizomes and prove the importance of reasonable selection of drying temperature.

Author Contributions

Conceptualization, G.Z. (Gen Zhang); methodology, G.Z. (Gen Zhang) and Y.Y.; software, G.Z. (Gen Zhang), L.Z. and G.Z. (Guangyao Zhu); validation, G.Z. (Gen Zhang) and Y.L.; formal analysis, G.Z. (Gen Zhang) and Y.Y.; investigation, C.Y.; resources, G.Z. (Guangyao Zhu) and P.N.; data curation, G.Z. (Gen Zhang) and Y.Y.; writing—original draft, G.Z. (Gen Zhang); supervision, Y.Y.; project administration, P.N.; funding acquisition, P.N. All authors have read and agreed to the published version of the manuscript.

Funding

This research was funded by Chongqing Technology Innovation and Development Application Special Key Project (csts2021jscx-gksbX0013), Chongqing Municipal Education Commission Science and Technology Research Project (KJZD-K202201201) and Chongqing Wanzhou District Science and Technology Plan Project (202206051958331768).

Data Availability Statement

The original contributions presented in the study are included in the article, further enquiries can be directed to the corresponding author.

Conflicts of Interest

The authors declare that there are no conflicts of interest.

References

  1. Zhang, M.; Ma, C.; Ge, B.G.; Wang, C.D.; Yang, L.F.; Meng, X.F. Effect of drying temperature on hot air drying process of broccoli. Hortic. North China 2020, 19, 102–106. [Google Scholar]
  2. Zhang, M.; Wu, M.Y.; Yang, L.F.; Wang, C.D.; Fan, Q.; Meng, X.F.; Ma, C. Effects of different drying methods on physical properties and nutritional quality of old stem powder of broccoli. Food Sci. Technol. 2018, 43, 60–66. [Google Scholar]
  3. Tian, M. Effects of Selenium Treatment on Synthesis and Metabolism of Glucosinolates in Broccoli. Ph.D. Thesis, Huazhong Agricultural University, Wuhan, China, 2018. [Google Scholar]
  4. Zhang, J.H.; Guo, N.; Yang, Y.; Li, Q.P.; Guo, Q.; Duan, Y.Q.; Ha, Y.M. Extraction, purification, and identification of sulforaphane from by-products of broccoli. Food Sci. 2019, 40, 248–255. [Google Scholar]
  5. Du, X.M.; Wu, H.Z.; Zhao, Y.S.; Su, X.H.; Gao, G.Q. Effect of microwave drying on sulforaphane content in different parts of broccoli. Fresh-Keep. Process. 2018, 18, 95–99. [Google Scholar]
  6. Rang, F.J.; Wang, J.L.; Liu, W.; Ren, J.X.; Ou, Y.Y. Study on extraction and physicochemical properties of pectin from the stem of broccoli. Food Res. Dev. 2022, 43, 104–110. [Google Scholar]
  7. Sun, Y.D.; Chen, Y.; Guo, Y.Y.; Zhang, Y.X.; Ma, Y.L.; Yang, M.; Fu, R.Q.; Wang, Y.J. Effect of stem extract of broccoli on storage quality of broccoli. Food Ind. Sci. Technol. 2022, 43, 355–362. [Google Scholar]
  8. Li, W.F.; Zhang, X.Y.; Wang, C.; Lin, L.T.; Chen, X.P.; Qu, Y.; Zhang, X.M.; Lin, Y.; Tan, W.; Zheng, Q.R.; et al. Characteristics of gas jet impact drying kinetics and polyphenol degradation kinetics of stem mustard. Food Sci. 2021, 42, 106–114. [Google Scholar]
  9. Wu, M.J. Effects of Different Drying Methods, Packaging Materials, and Temperature on the Storage Quality of Jujube Slices. Ph.D. Thesis, Nanjing Agricultural University, Nanjing, China, 2021. [Google Scholar]
  10. Chen, K.J.; Wang, S.; Yan, J.C.; Nuhu Jibrril, A.; Yu, H.M.; Sun, J. Study on drying characteristics and quality of rice under different far infrared drying conditions of graphene at low temperature. J. Agric. Mach. 2021, 3, 1–18. [Google Scholar]
  11. Liu, Z.B.; Zhang, Z.Y.; Li, D.J.; Li, D.H.; Jiang, N.; Liu, C.Q. Variation of internal moisture during far-infrared drying of Pleurotus ostreatus. Food Sci. 2016, 37, 82–86. [Google Scholar]
  12. Li, K.X.; Zhang, Y.; Song, C.; Meng, X.; Wang, J.; Yang, L.Q.; Wang, P.Y. Effect of hot air drying and far infrared drying on the quality characteristics of strawberry powder. Food Res. Dev. 2023, 44, 47–54. [Google Scholar]
  13. Chen, S.M.; Zhang, N. Effects of different drying methods on four common components of Euonymus ulmoides leaves. Anhui Chem. Ind. 2023, 49, 94–97. [Google Scholar]
  14. GB 5009.3-2016; National Food Safety Standard Determination of Moisture in Food. Standardization Administration of China: Beijing, China, 2016.
  15. Ma, T.T.; Ou, Y.J.; Xiao, Z.F.; Shen, J. Hot air drying characteristics and drying model of Antarctic krill. Fish. Mod. 2023, 50, 93–102. [Google Scholar]
  16. Zhong, C.J.; Zhu, W.X.; Liu, Y.H.; Wu, J.Y.; Fan, J.L.; Luo, L. Study on a kinetic model of thin-layer drying of carrot. Food Sci. 2014, 35, 24–29. [Google Scholar]
  17. Ma, J.S.; Ou, Y.J.; Ma, T.T.; Huang, T.; Shen, J. Heating and drying characteristics and drying kinetics model of Antarctic krill spiral sleeves. Fish. Mod. 2024, 51, 102–112. [Google Scholar]
  18. Li, Y.; Zhu, W.U.; Chen, P.X.; Wang, Y.K.; Jiang, M.M.; Wang, D.X.; Chen, L.; Zhang, Y.Q.; Hu, X.Y.; Wang, J. Study on hot air drying characteristics and thermodynamic properties of different varieties of high-oleic peanuts. Food Ind. Technol. 2024, 14, 42–49. [Google Scholar]
  19. Han, W.N.; Yan, J.H.; Wu, F.J.; Liu, Y.; Li, S.Q.; Li, S.M.; Gao, L. Effect of heat pump-low temperature regeneration runner dehumidification combined drying on drying characteristics of white radish slices. Food Ferment. Ind. 2024, 1–12. [Google Scholar] [CrossRef]
  20. Li, Y.; Zhu, W.; Chen, P.X.; Wang, Y.K.; Jiang, M.M.; Wang, D.X.; Chen, L.; Zhang, Y.Q.; Hu, X.Y.; Wang, J.; et al. Study on Hot Air drying and Thermodynamic Properties of different varieties of Peanut with High oleic Acid. Food Ind. Sci. Technol. 2024, 1–16. [Google Scholar]
  21. Yin, X.F.; Yang, L. Characteristics and mathematical model of thin layer infrared drying of rice. Chin. J. Cereals Oils 2024, 4, 1–12. [Google Scholar]
  22. Wang, K.H.; Li, J.M.; Peng, F.; Liu, Y.D.; Ma, Q.; Li, M.; Xu, H.D. Effect of radio frequency treatment on medium and short wave infrared drying kinetics and quality characteristics of red jujube. Food Sci. 2020, 41, 117–123. [Google Scholar]
  23. Deng, Q.L.; Liu, M.W.; Shen, J.; Tuerxun, A.D.; Chen, X.S.; Xu, W.S.; Xiao, H. Study on total polyphenols content and antioxidant activity of total flavonoids in mulberry leaves from different producing areas. China Food Addit. 2024, 35, 130–137. [Google Scholar]
  24. DB43/T476-2009; Determination of Flavone in Vegetal Food. Hunan Quality and Technology Supervise Bureau of the People’s Republic of China: Changsha, China, 2009.
  25. Hou, S.; Zhang, X.J.; Zhou, D.D.; Ma, F.Y.; Wang, D.P.; Zhao, S.Q.; Ding, C.; Liu, Q. Analysis of phenolic metabolism of stored rice under high-temperature stress based on dielectric barrier discharge low-temperature plasma. Chin. Agric. Sci. 2024, 57, 1180–1190. [Google Scholar]
  26. H/AHIA 005-2018; Contratada: Nogueira Santos Advogados Associados. Department of Administration and Finance: Teofilândia, Brazil, 2018.
  27. Han, Y. Effect of Slightly Acidic Electrolyzed Water on Circulation Quality of Postharvest Broccoli. Ph.D. Thesis, Shenyang Agricultural University, Shenyang, China, 2023. [Google Scholar]
  28. An, R.H.; Zhou, H.S.; Luo, S.F.; Zhang, Y.T.; Zhang, L.G.; Hu, H.L.; Li, P.X. Effects of vacuum precooling and different circulation modes on the quality of green shelves in Shanghai. Food Sci. 2021, 42, 241–248. [Google Scholar]
  29. Zhu, K.Y.; Ren, G.Y.; Duan, X.; Li, L.L.; Zhao, L.J.; Liu, P.P. Characterization of texture, nutrient composition, and energy consumption of shelled flowers under different drying methods. Chin. J. Food 2022, 22, 177–188. [Google Scholar]
  30. Yuan, D.; Li, Y.; Chen, F.; Zhang, X.S.; Huang, J.W. Analysis of characteristics and quality of blueberry by microwave freeze drying. Chin. J. Food 2024, 4, 1–17. [Google Scholar]
  31. Zhang, Q. Study on Microwave Vacuum Drying of Sea Cucumber and Its Effect on Quality. Ph.D. Thesis, Huazhong Agricultural University, Wuhan, China, 2023. [Google Scholar]
  32. Wang, R.Y.; Zhao, Y.; Shi, Q.L. Effects of drying methods on thermodynamic properties and storage stability of mulberry powder. Food Ferment. Ind. 2018, 2, 247–255. [Google Scholar]
  33. Zhang, G.; Niu, P.; Lai, Y.S. Effects of drying conditions on drying characteristics and physicochemical properties of broccoli. Food Ferment. Ind. 2024, 1–10. [Google Scholar] [CrossRef]
  34. Wang, Q. Low Temperature Drying Characteristics of Sludge and Analysis of Heat Pump Drying System. Ph.D. Thesis, Southwest University of Science and Technology, Mianyang, China, 2024. [Google Scholar]
  35. Gan, T.; Yi, P.; Huang, M.; Sheng, J.F.; Zheng, L.J.; Lin, D.; Zhang, L.; Li, L. Study on microwave drying characteristics and mathematical model of mango. Food Sci. Technol. 2024, 49, 19–26. [Google Scholar]
  36. Wang, D.; Cao, Z.; Gao, Y.; Yang, L.; Zhao, L. Impact of the Pre-Dehydration and Drying Methods on the Mass Transfer and Quality Attributes of Yak Milk Casein. Foods 2024, 13, 1062. [Google Scholar] [CrossRef] [PubMed]
  37. Nie, M.M.; Yang, H.Z.; Li, D.J.; Xiao, Y.D.; Yang, Y.W.; Yu, R.; Liu, C.J.; Niu, L.Y.; Jin, P. Optimization of vacuum freeze drying process and its effect on the quality of blueberry pretreated by ultrasonic. J. Nanjing Agric. Univ. 2024, 4, 1–17. [Google Scholar]
  38. Zheng, X. Study on Drying Characteristics and Quality of Red Jujube Mud Slices Based on Different Drying Techniques. Ph.D. Thesis, China Agricultural University, Beijing, China, 2016. [Google Scholar]
  39. Yu, Y.Y.; Tang, D.B.; Wen, J.; Wu, J.J.; Yu, Y.S.; An, K.J.; Zou, Y. Effect of heat pump temperature on drying rate and quality of white radish. Food Mach. 2020, 36, 211–214. [Google Scholar]
  40. Wang, H.D.; Sun, P.; Li, X.D.; Xiao, J.X.; Guo, L.P. Study on hot air drying characteristics and quality of broccoli. J. Food Saf. Qual. Insp. 2022, 13, 182–189. [Google Scholar]
  41. Tang, X.D.; Wang, L.; Cui, J.Y. Optimization of the extraction process and comparative study on the content of total flavonoids in different kinds of tea. Int. J. Pharm. Res. 2019, 46, 862–866. [Google Scholar]
  42. Sun, P.; Wang, H.D.; Wang, F.W.; Xiao, J.X.; Geng, X.; Guo, L.P. Study on hot air drying kinetics and quality of purple cabbage powder. Food Sci. Technol. 2020, 45, 61–67. [Google Scholar]
  43. Sun, Q.Y.; Zhang, Z.C.; Jia, Z.C.; Han, M.L.; Zhao, F. Effects of pretreatment methods and drying temperature on hot air drying characteristics and quality of Chinese cabbage. Food Ind. Sci. Technol. 2021, 42, 210–215. [Google Scholar]
  44. Long, Y.Y.; Lei, Y.J.; Ma, X.Y.; Min, T.T.; Zhao, J.; Yue, J. Research Progress on Degradation and Color Protection Technology of Vegetable Chlorophyll in Thermal Processing. Food Sci. 2024, 1–18. Available online: http://kns.cnki.net/kcms/detail/11.2206.TS.20240529.1331.004.html (accessed on 7 July 2024).
  45. Yuan, D.S. Study on Nutritional Quality and Antioxidant Properties of Broccoli during Processing. Ph.D. Thesis, Henan University of Technology, Luoyang, China, 2018. [Google Scholar]
  46. Liao, Z.J.; Liao, M.; Li, Q.M.; Wang, F.; Li, W.J.; Zhou, Y.; Su, X.J. Effect of drying methods on the quality of perilla leaves. Chin. Condiment 2024, 49, 116–121. [Google Scholar]
  47. Lu, J.Y.; Tian, H.; Xiong, J.B.; Wu, X.J.; Liu, Y.; Zhang, H.S. A comprehensive evaluation of cold tolerance of 14 native Pennisetum seedlings. J. Grass Ind. 2024, 8, 98–111. [Google Scholar]
  48. Li, Y.N. Study on the Correlation between the Drying Process and Quality of Salvia Miltiorrhiza Extract. Ph.D. Thesis, Chengdu University of Traditional Chinese Medicine, Chengdu, China, 2018. [Google Scholar]
  49. Ge, Q.L.; Liu, Y.; Fan, Y.F.; Ma, L.N.; Chen, D.W.; Gao, Y.S.; Zhou, Y.M.; Tang, X.J. Study on meat quality evaluation of Ningdu yellow chicken based on correlation analysis and principal component analysis. J. Food Saf. Qual. Insp. 2024, 10, 49–55. [Google Scholar]
  50. Su, X.Y.; Gao, T.M.; Zhang, P.Y.; Li, F.; Wu, Y.; Wang, D.Y.; Tian, Y.; Wei, S.L. A comprehensive evaluation of heat tolerance of sesame at seedling stage based on principal component analysis and membership function method. Crop J. 2023, 4, 52–59. [Google Scholar]
  51. Lu, K.; Zhu, G.X.; Shi, J.G.; Chai, G.H.; Dillon; Zhang, G.R.; Qin, Y.Y.; Duan, Y.Z. Evaluation of adaptability of different sea buckthorn varieties in the Yulin area. China Agric. Bull. 2021, 34, 52–58. [Google Scholar]
Figure 1. Far-infrared dryer schematic diagram: 1, far-infrared original; 2, temperature control instrument; 3. over-temperature protection instrument; 4. timer; 5, power switch; 6. heating switch; 7. timing switch; 8, alarm switch; 9, buzzer; 10, standby switch; 11, stainless steel tray; 12. box door.
Processes 12 01674 g001
Figure 2. Effects of different temperatures on appearance (A), moisture ratio (B), and drying rate (C) of broccoli rhizomes.
Processes 12 01674 g002
Figure 3. Color difference and rehydration ratio of broccoli rhizomes under far-infrared drying at different temperatures.
Processes 12 01674 g003
Figure 4. The effects of flavonoid standard curve (a), different temperatures on total flavonoid content (b), polyphenol standard curve (c), total phenol content (d), VC content (e), and soluble protein content (f) in broccoli. Note: Different letters a, b, c, d, and e indicate significant differences (p < 0.05).
Processes 12 01674 g004aProcesses 12 01674 g004b
Figure 5. Correlation analysis of the effect of drying temperature on rhizome quality of broccoli.
Processes 12 01674 g005
Table 1. Eight mathematical models of thin-layer drying.
ModelModel NameModel Equations
Theoretical modelPage M R = exp k t n
Henderson and Pabis M R = a exp k t
Lewis M R = exp ( k t )
Modified Page M R = exp ( k t ) n
Asymptotic M R = a exp k t + C
Empirical modelWang and Singh M R = 1 + a t + b t 2
Weibull M R = a b exp k 0 t n
Geometric M R = a t n
Table 2. Effective water diffusion coefficient, activation energy, and thermodynamic parameters of broccoli rhizomes at different temperatures.
Temp/°CDeff/(10−6 m2/min)Ea/kJ/molH/kJ/molG/kJ/molS/kJ/(mol·K)
601.2212.269.49119.62−0.33058
651.259.45121.37−0.33099
701.349.41123.02−0.33109
751.469.37124.62−0.33104
801.559.33126.27−0.33116
Table 3. Fitting results of 8 thin-layer drying mathematical models.
Model NameTemp/°CModel IndexesEvaluating Indicator
knabR2χ2RMSE
Page800.00271.2113 0.99299.5431 × 10−40.0095
750.00161.2864 0.99536.8295 × 10−40.0075
707.976 × 10−41.3566 0.99625.601 × 10−40.0067
656.327 × 10−41.3579 0.99773.4872 × 10−40.0049
605.652 × 10−41.3588 0.99832.5856 × 10−40.0039
Henderson and Pabis800.0078 1.0265 0.98260.00230.0231
750.0069 1.0509 0.98260.00250.0276
700.0056 1.0612 0.97950.0030.0358
650.0048 1.0601 0.9850.00220.0307
600.0045 1.0633 0.98540.00220.0336
Lewis800.0075 0.98270.00230.0252
750.0065 0.97910.0030.0361
700.0051 0.97370.00380.0499
650.0045 0.97980.0030.0455
600.0041 0.97920.00320.0508
Modified Page80−1.981 × 10−81.464 × 10−8 0.99369.5408 × 10−40.0095
75−1.98 × 10−81.462 × 10−8 0.99536.8264 × 10−40.0075
70−1.874 × 10−81.461 × 10−8 0.99625.5875 × 10−40.0067
65−2.007 × 10−81.456 × 10−8 0.99883.4787 × 10−40.0049
60−1.998 × 10−81.454 × 10−8 0.99832.5728 × 10−40.0039
Wang and Singh80 −0.00578.0396 × 10−60.99832.22899 × 10−40.0022
75 −0.00495.8496 × 10−60.99965.88887 × 10−56.478 × 10⁻⁴
70 −0.00383.5024 × 10−60.99871.90102 × 10−40.0023
65 −0.00332.7193 × 10−60.99921.14041 × 10−40.0016
60 −0.00302.2874 × 10−60.9991.67368 × 10−40.0025
Geometric80 0.43463.0187 0.03080.12831.2833
75 0.43243.1706 0.15230.12241.3469
70 0.39863.0237 0.18620.11851.4215
65 0.39923.1018 0.2910.10671.494
60 0.39733.1405 0.32960.10250.3973
Note: The R2 of the Asymptotic and Weibull mathematical models is negative, so the fitting fails.
Table 4. Effects of different temperatures on chlorophyll and carotenoids in broccoli rhizomes.
Temp/°CChlorophyll aChlorophyll bCarotenoid
602.02 ± 0.03 a1.66 ± 0.06 a0.89 ± 0.01 a
651.66 ± 0.02 b0.86 ± 0.05 b0.73 ± 0.01 b
701.03 ± 0.73 c0.45 ± 0.34 bc0.44 ± 0.31 c
751.01 ± 0.06 c0.43 ± 0.08 c0.42 ± 0.01 c
800.99 ± 0.07 c0.34 ± 0.24 c0.42 ± 0.3 c
Note: Different letters a, b, and c indicate significant differences (p < 0.05).
Table 5. Explanation of total variance.
NumberEigenvaluePercentage Variance of Initial EigenvalueCumulative Variance Contribution
16.20551.70951.709
22.00016.66468.374
31.71114.25782.631
41.21310.11092.741
Table 6. The mean value of membership function and comprehensive ranking of quality indexes of broccoli rhizomes treated at different temperatures.
Temp/°CLabΔERRTotal FlavonoidsTotal Phenols
6080.88 ± 0.420.33 ± 0.0224.57 ± 0.0712.19 ± 0.314.78 ± 0.052.93 ± 0.034.08 ± 0.13
6580.62 ± 0.340.33 ± 0.0224.57 ± 0.0612.00 ± 0.174.73 ± 0.124.13 ± 0.024.27 ± 0.02
7081.11 ± 0.16−0.36 ± 0.0424.19 ± 0.1511.90 ± 0.064.85 ± 0.133.94 ± 0.023.64 ± 0.02
7582.15 ± 0.240.15 ± 0.0124.47 ± 0.3513.03 ± 0.344.95 ± 0.165.28 ± 0.053.53 ± 0.02
8083.55 ± 0.341.27 ± 0.1323.8 ± 0.1114.28 ± 0.294.68 ± 0.186.17 ± 0.053.60 ± 0.02
Temp/°CVCSoluble proteinChlorophyll aChlorophyll bCarotenoidThe mean value of the membership functionIntegrated ranking
600.31 ± 0.018.75 ± 0.042.02 ± 0.031.66 ± 0.060.89 ± 0.010.821
650.36 ± 0.0110.16 ± 0.081.66 ± 0.020.86 ± 0.050.73 ± 0.010.702
700.32 ± 0.018.41 ± 0.121.03 ± 0.730.45 ± 0.340.44 ± 0.310.444
750.34 ± 0.0110.87 ± 0.071.01 ± 0.060.43 ± 0.080.42 ± 0.010.573
800.26 ± 0.0110.53 ± 0.040.99 ± 0.070.34 ± 0.240.42 ± 0.300.265
Disclaimer/Publisher’s Note: The statements, opinions and data contained in all publications are solely those of the individual author(s) and contributor(s) and not of MDPI and/or the editor(s). MDPI and/or the editor(s) disclaim responsibility for any injury to people or property resulting from any ideas, methods, instructions or products referred to in the content.

