
Experimental Study on the Spray Characteristics of Diesel and Hydrotreated Vegetable Oil (HVO) Fuels under Different Injection Pressures
 , , ,
, , ,
Abstract
:1. Introduction
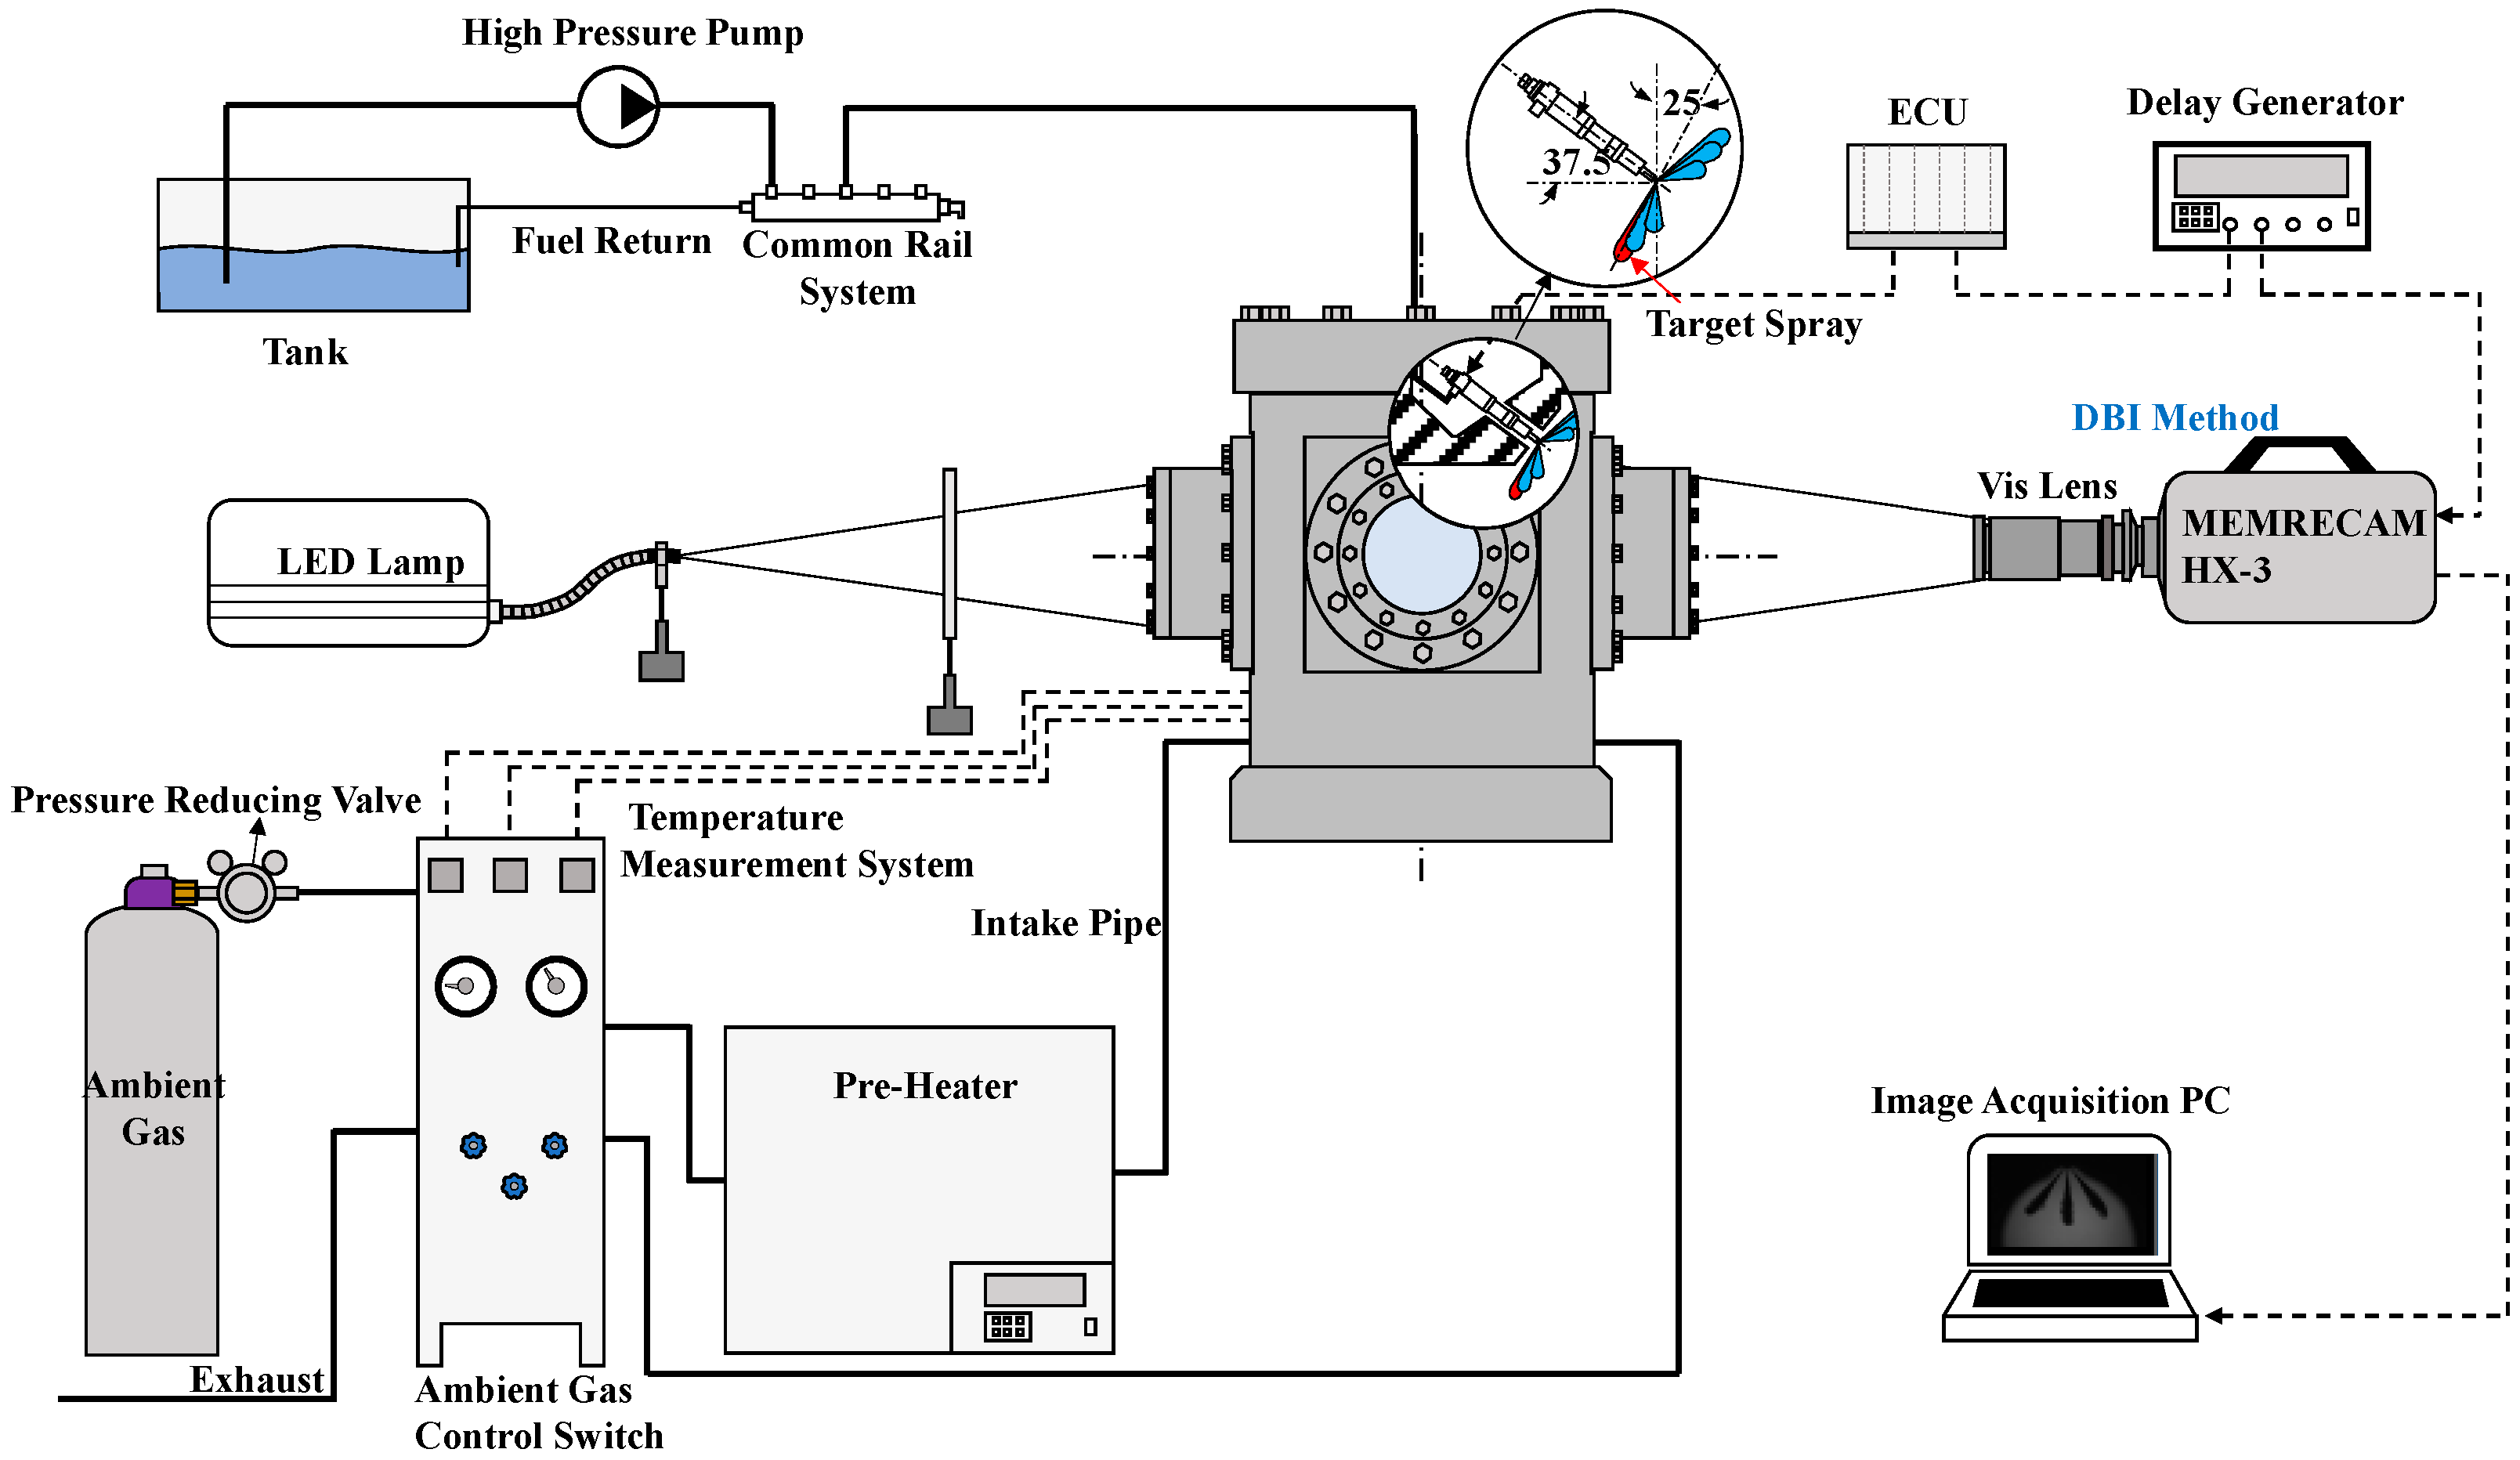
2. Experimental Conditions and Setup
3. Results and Discussion
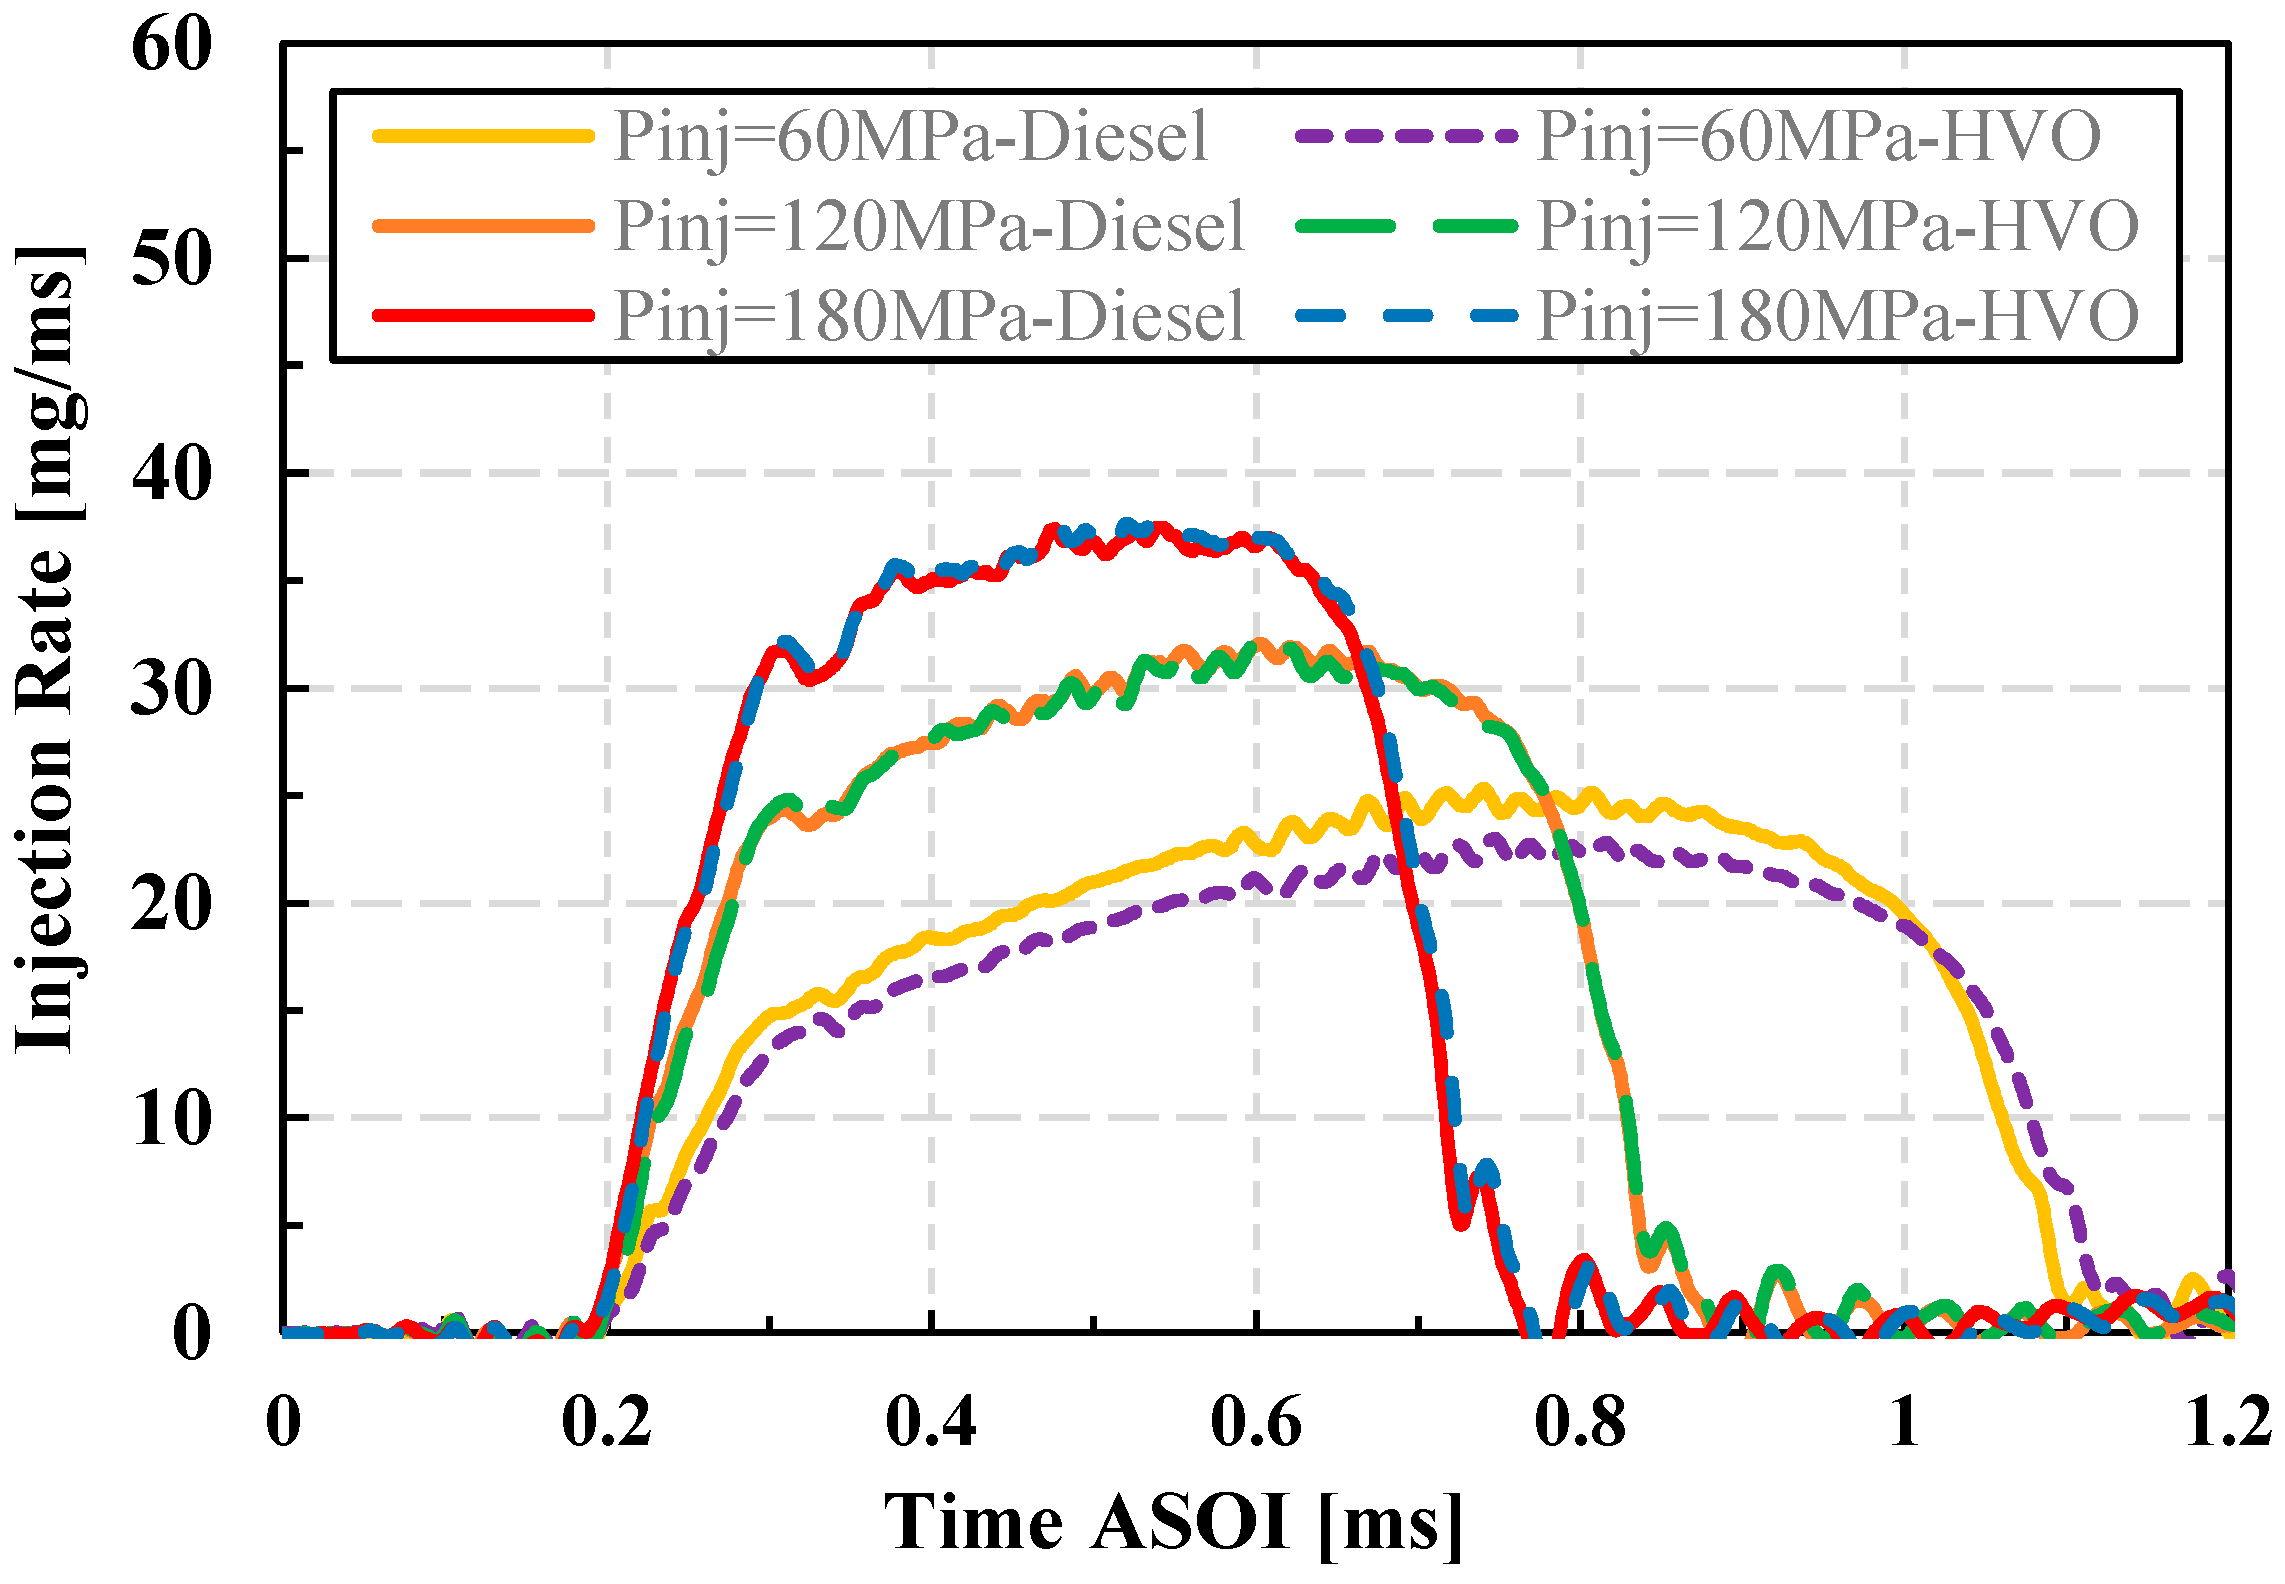
3.1. Injection Rate
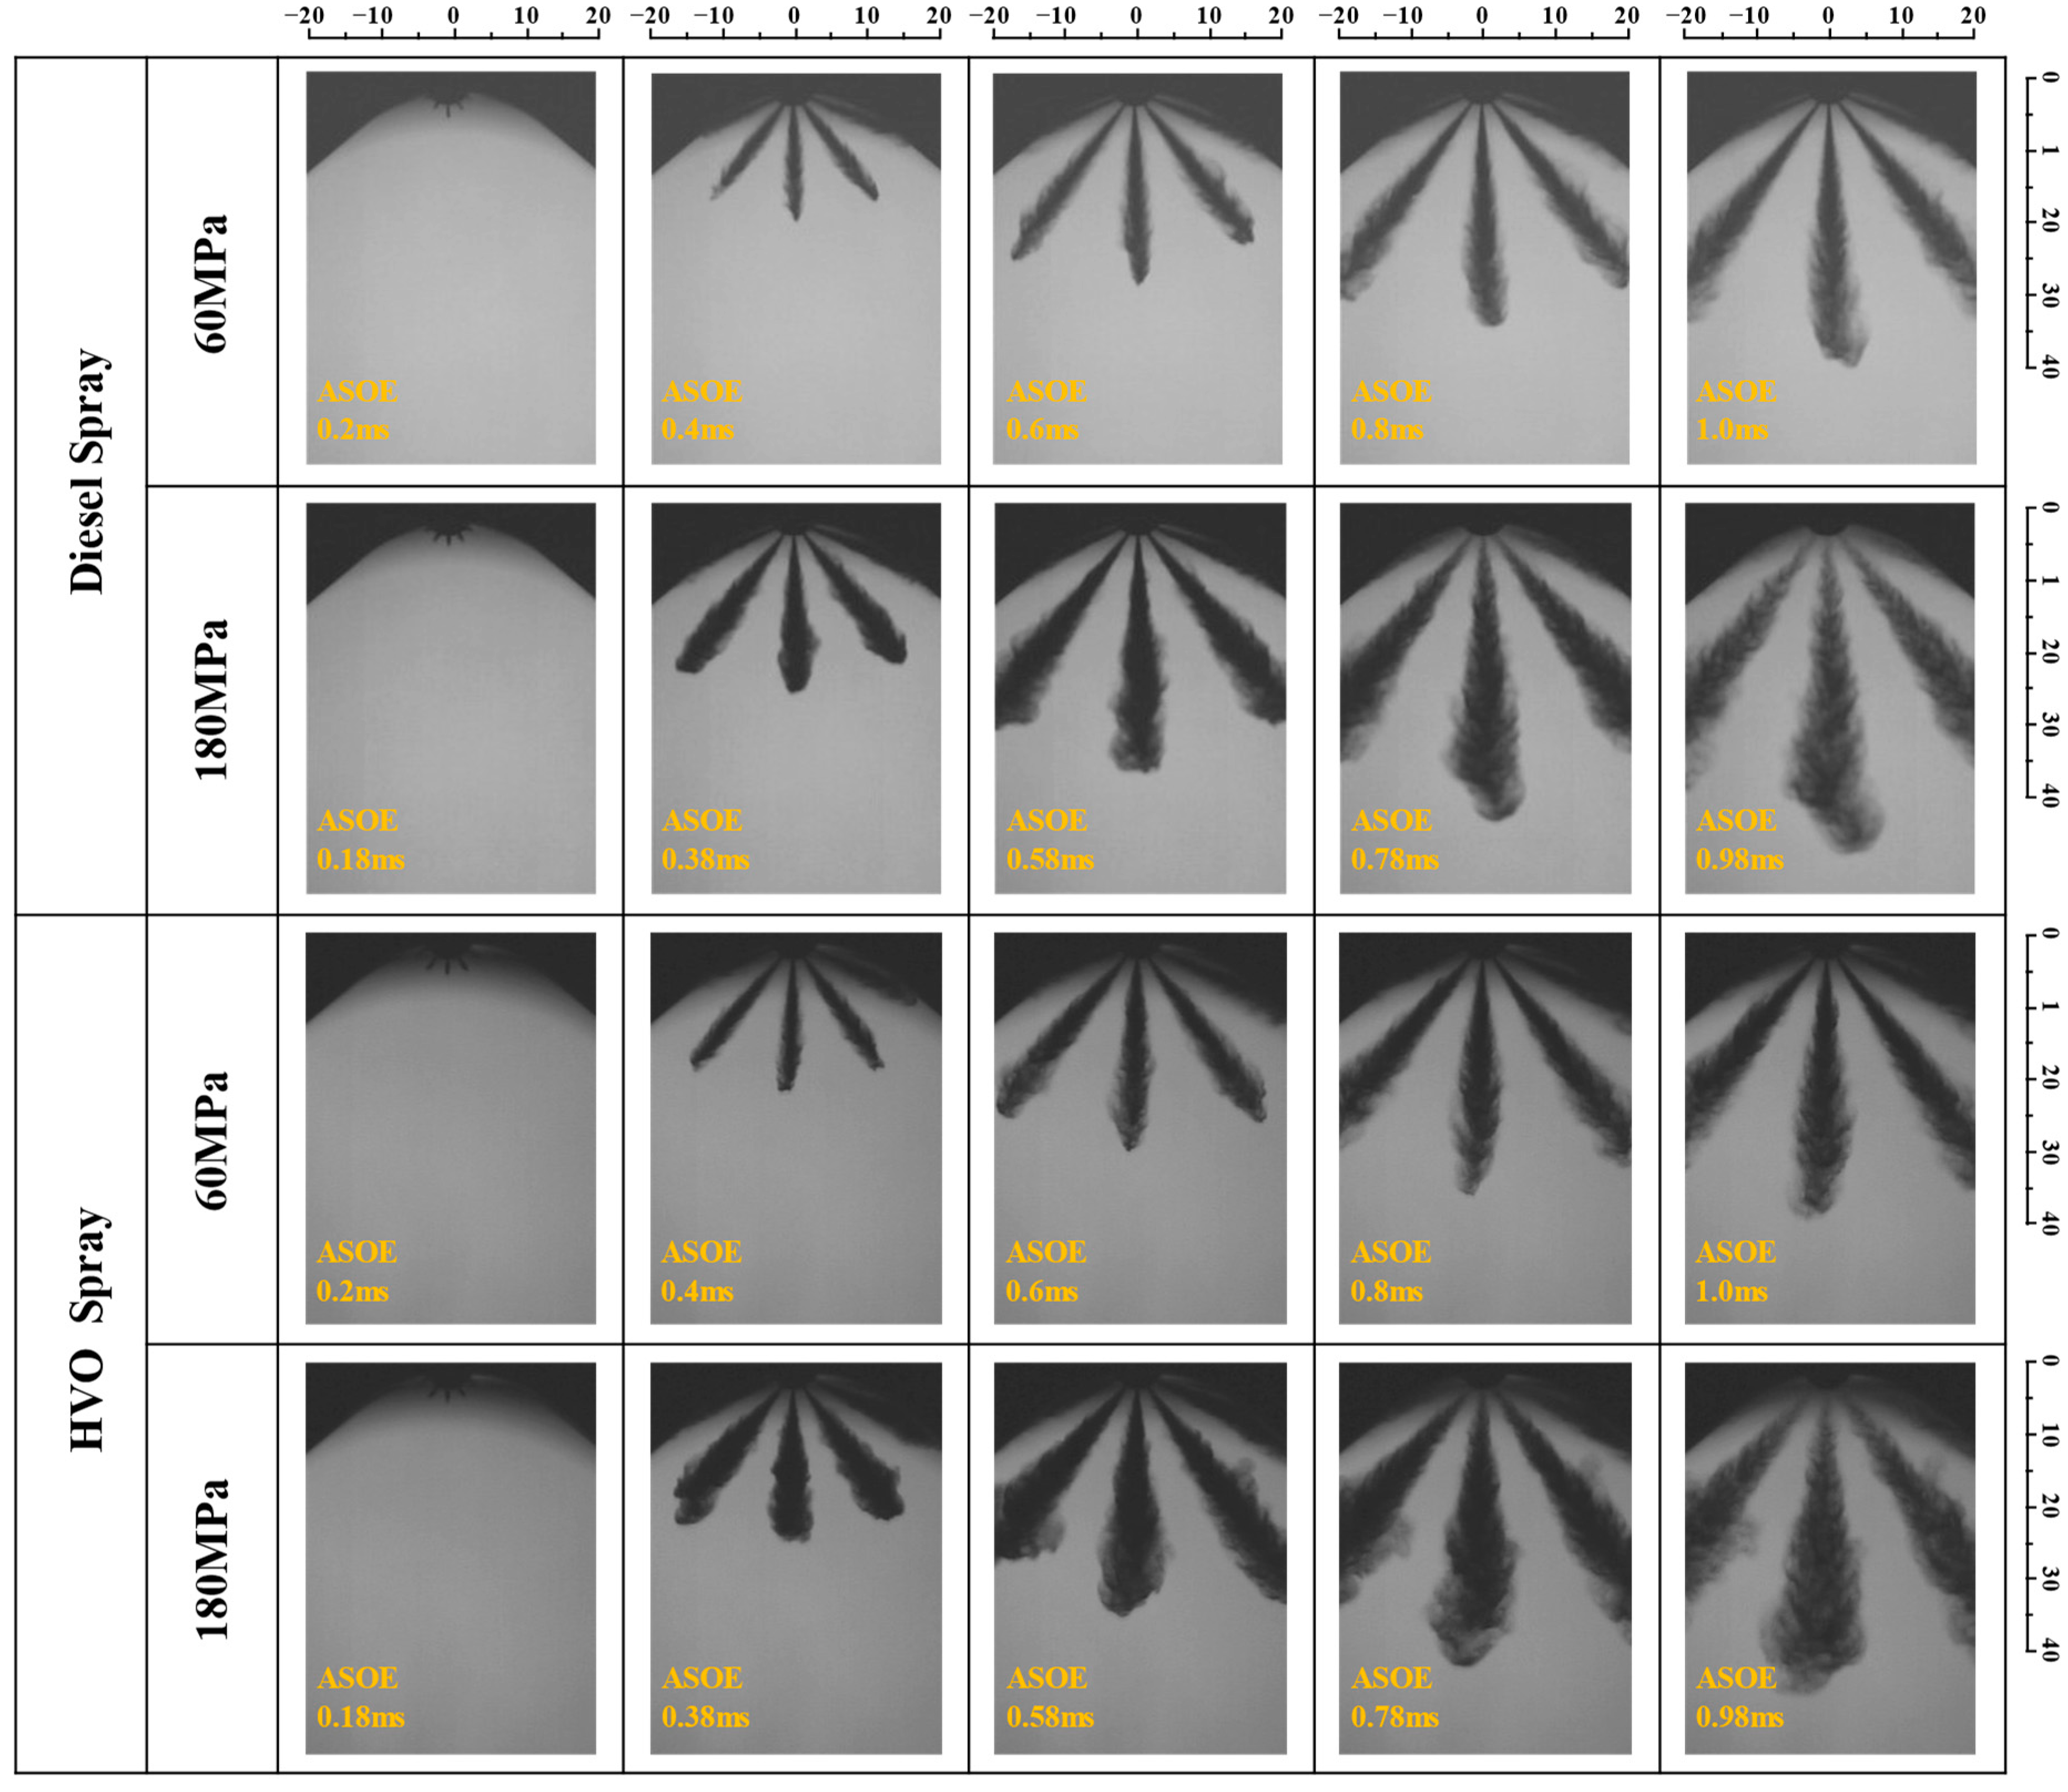
3.2. Macroscopic Characteristics of the Spray
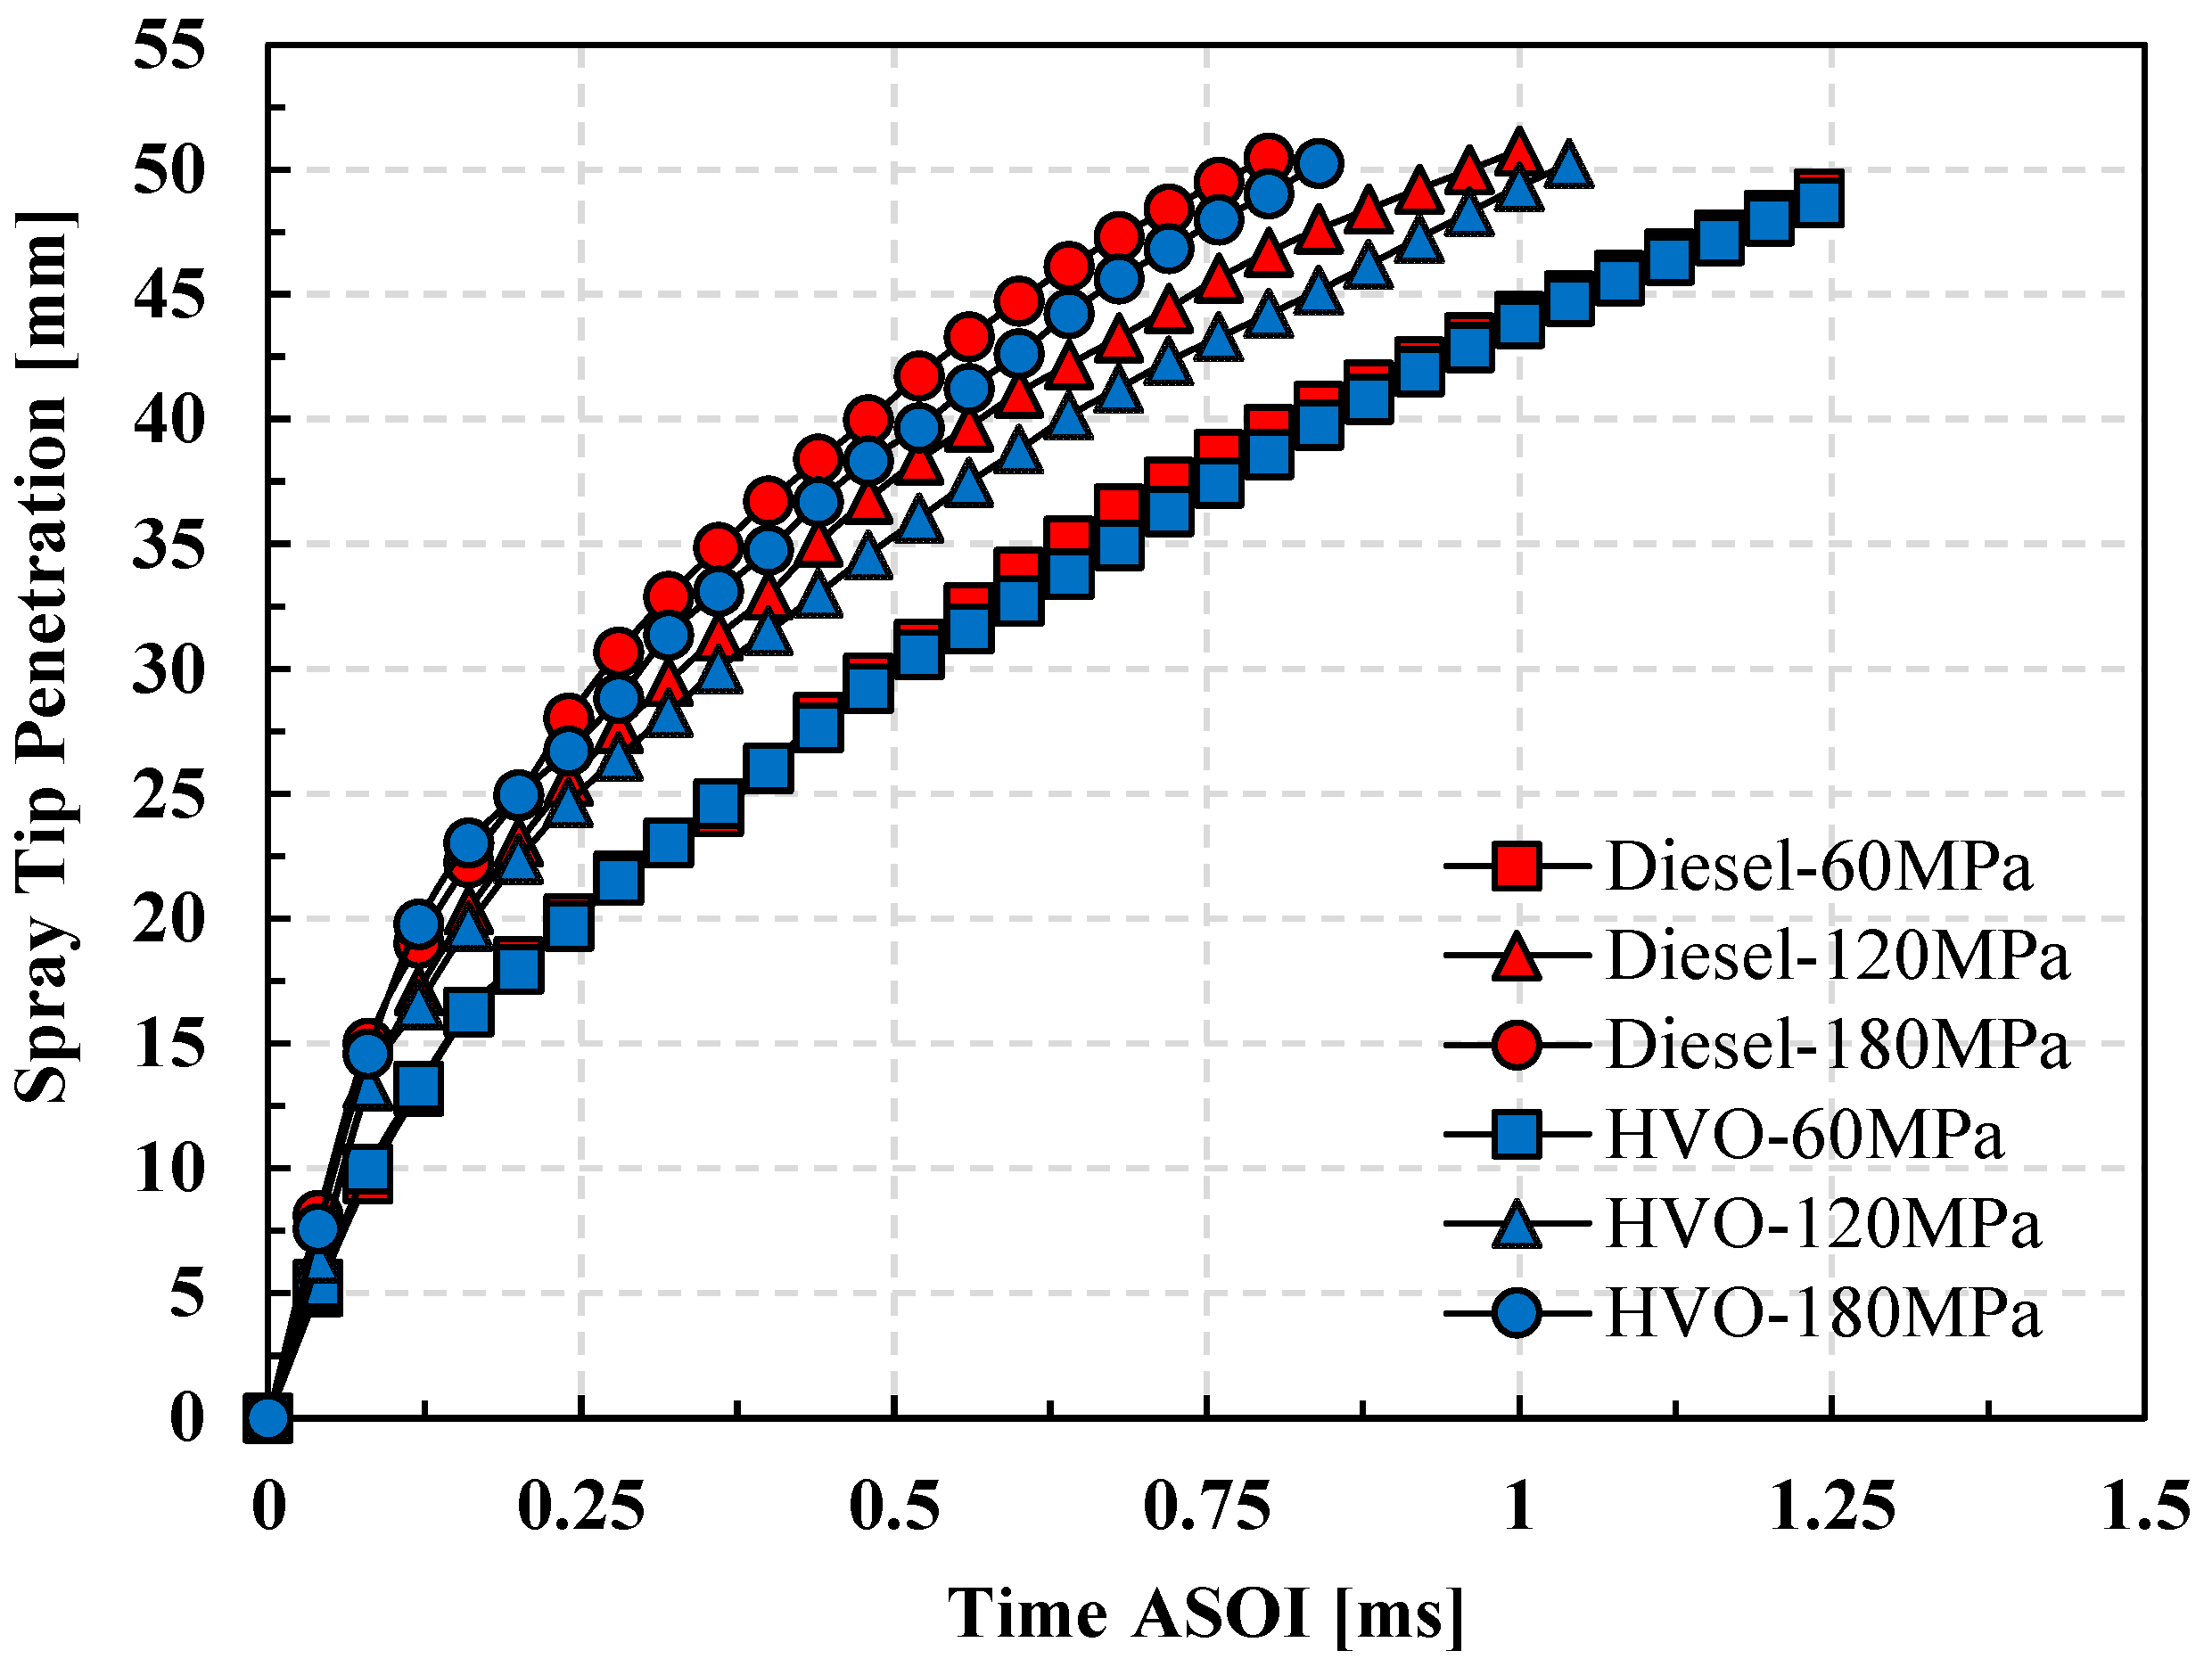
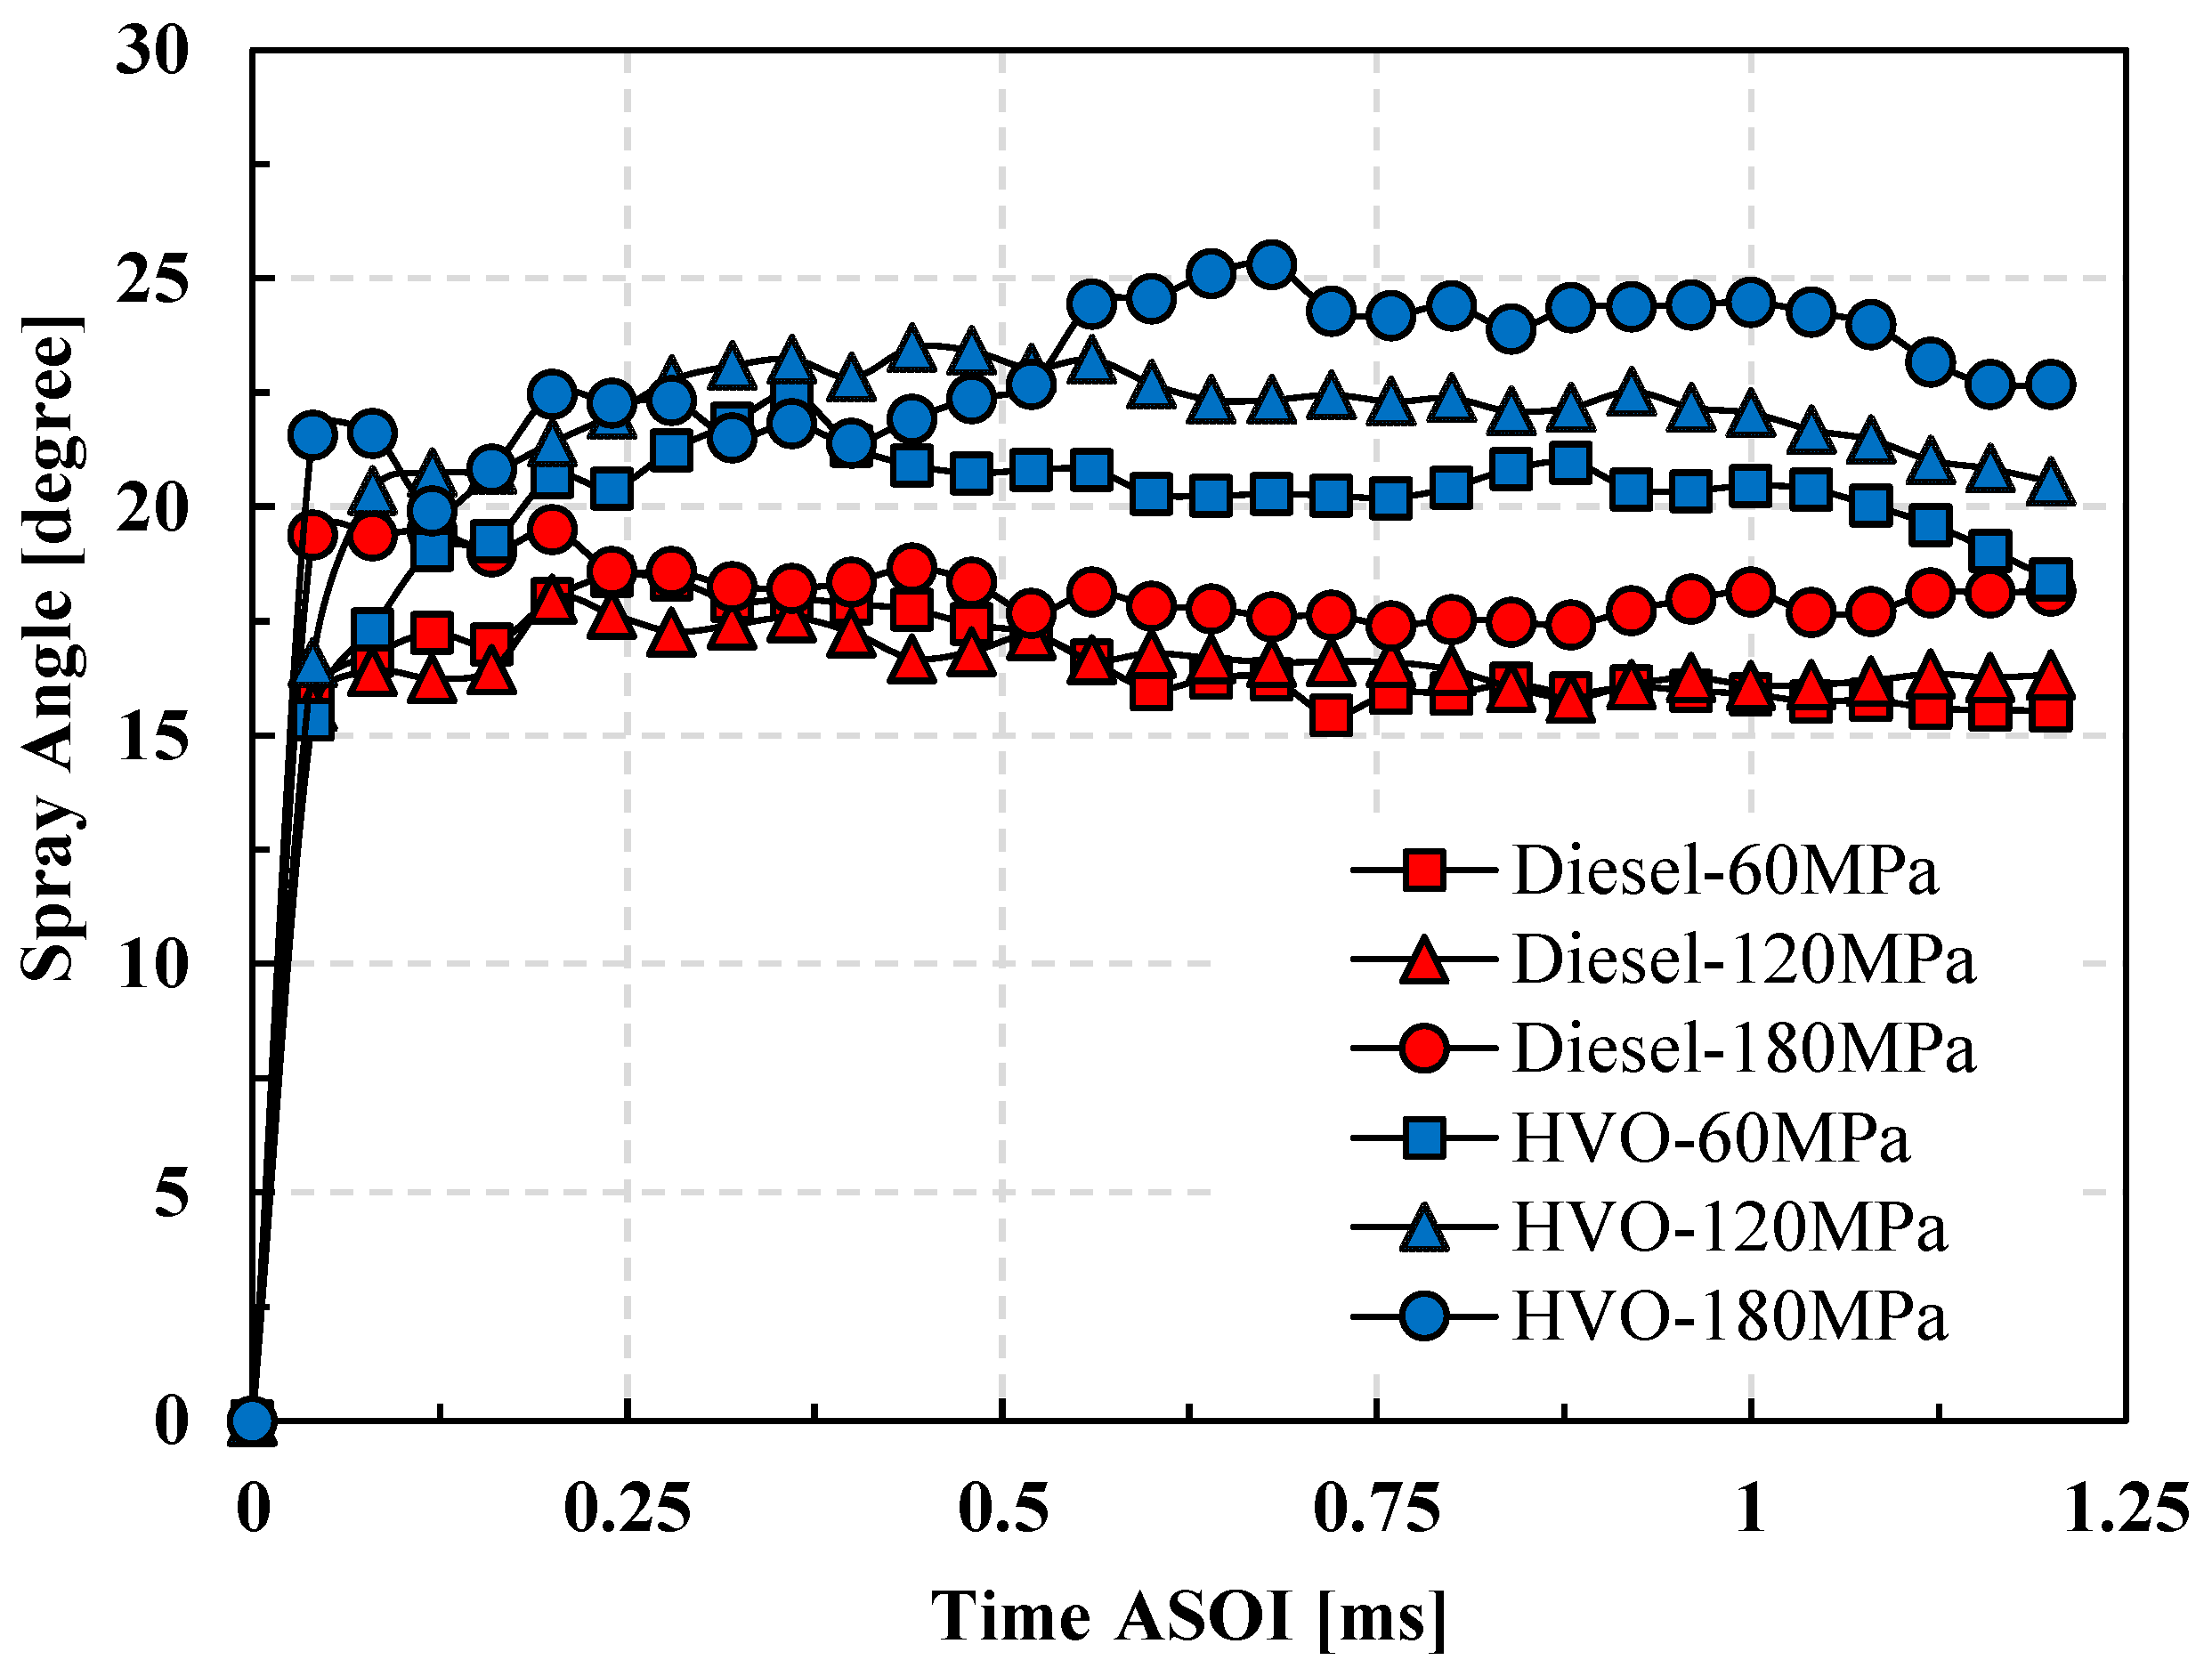
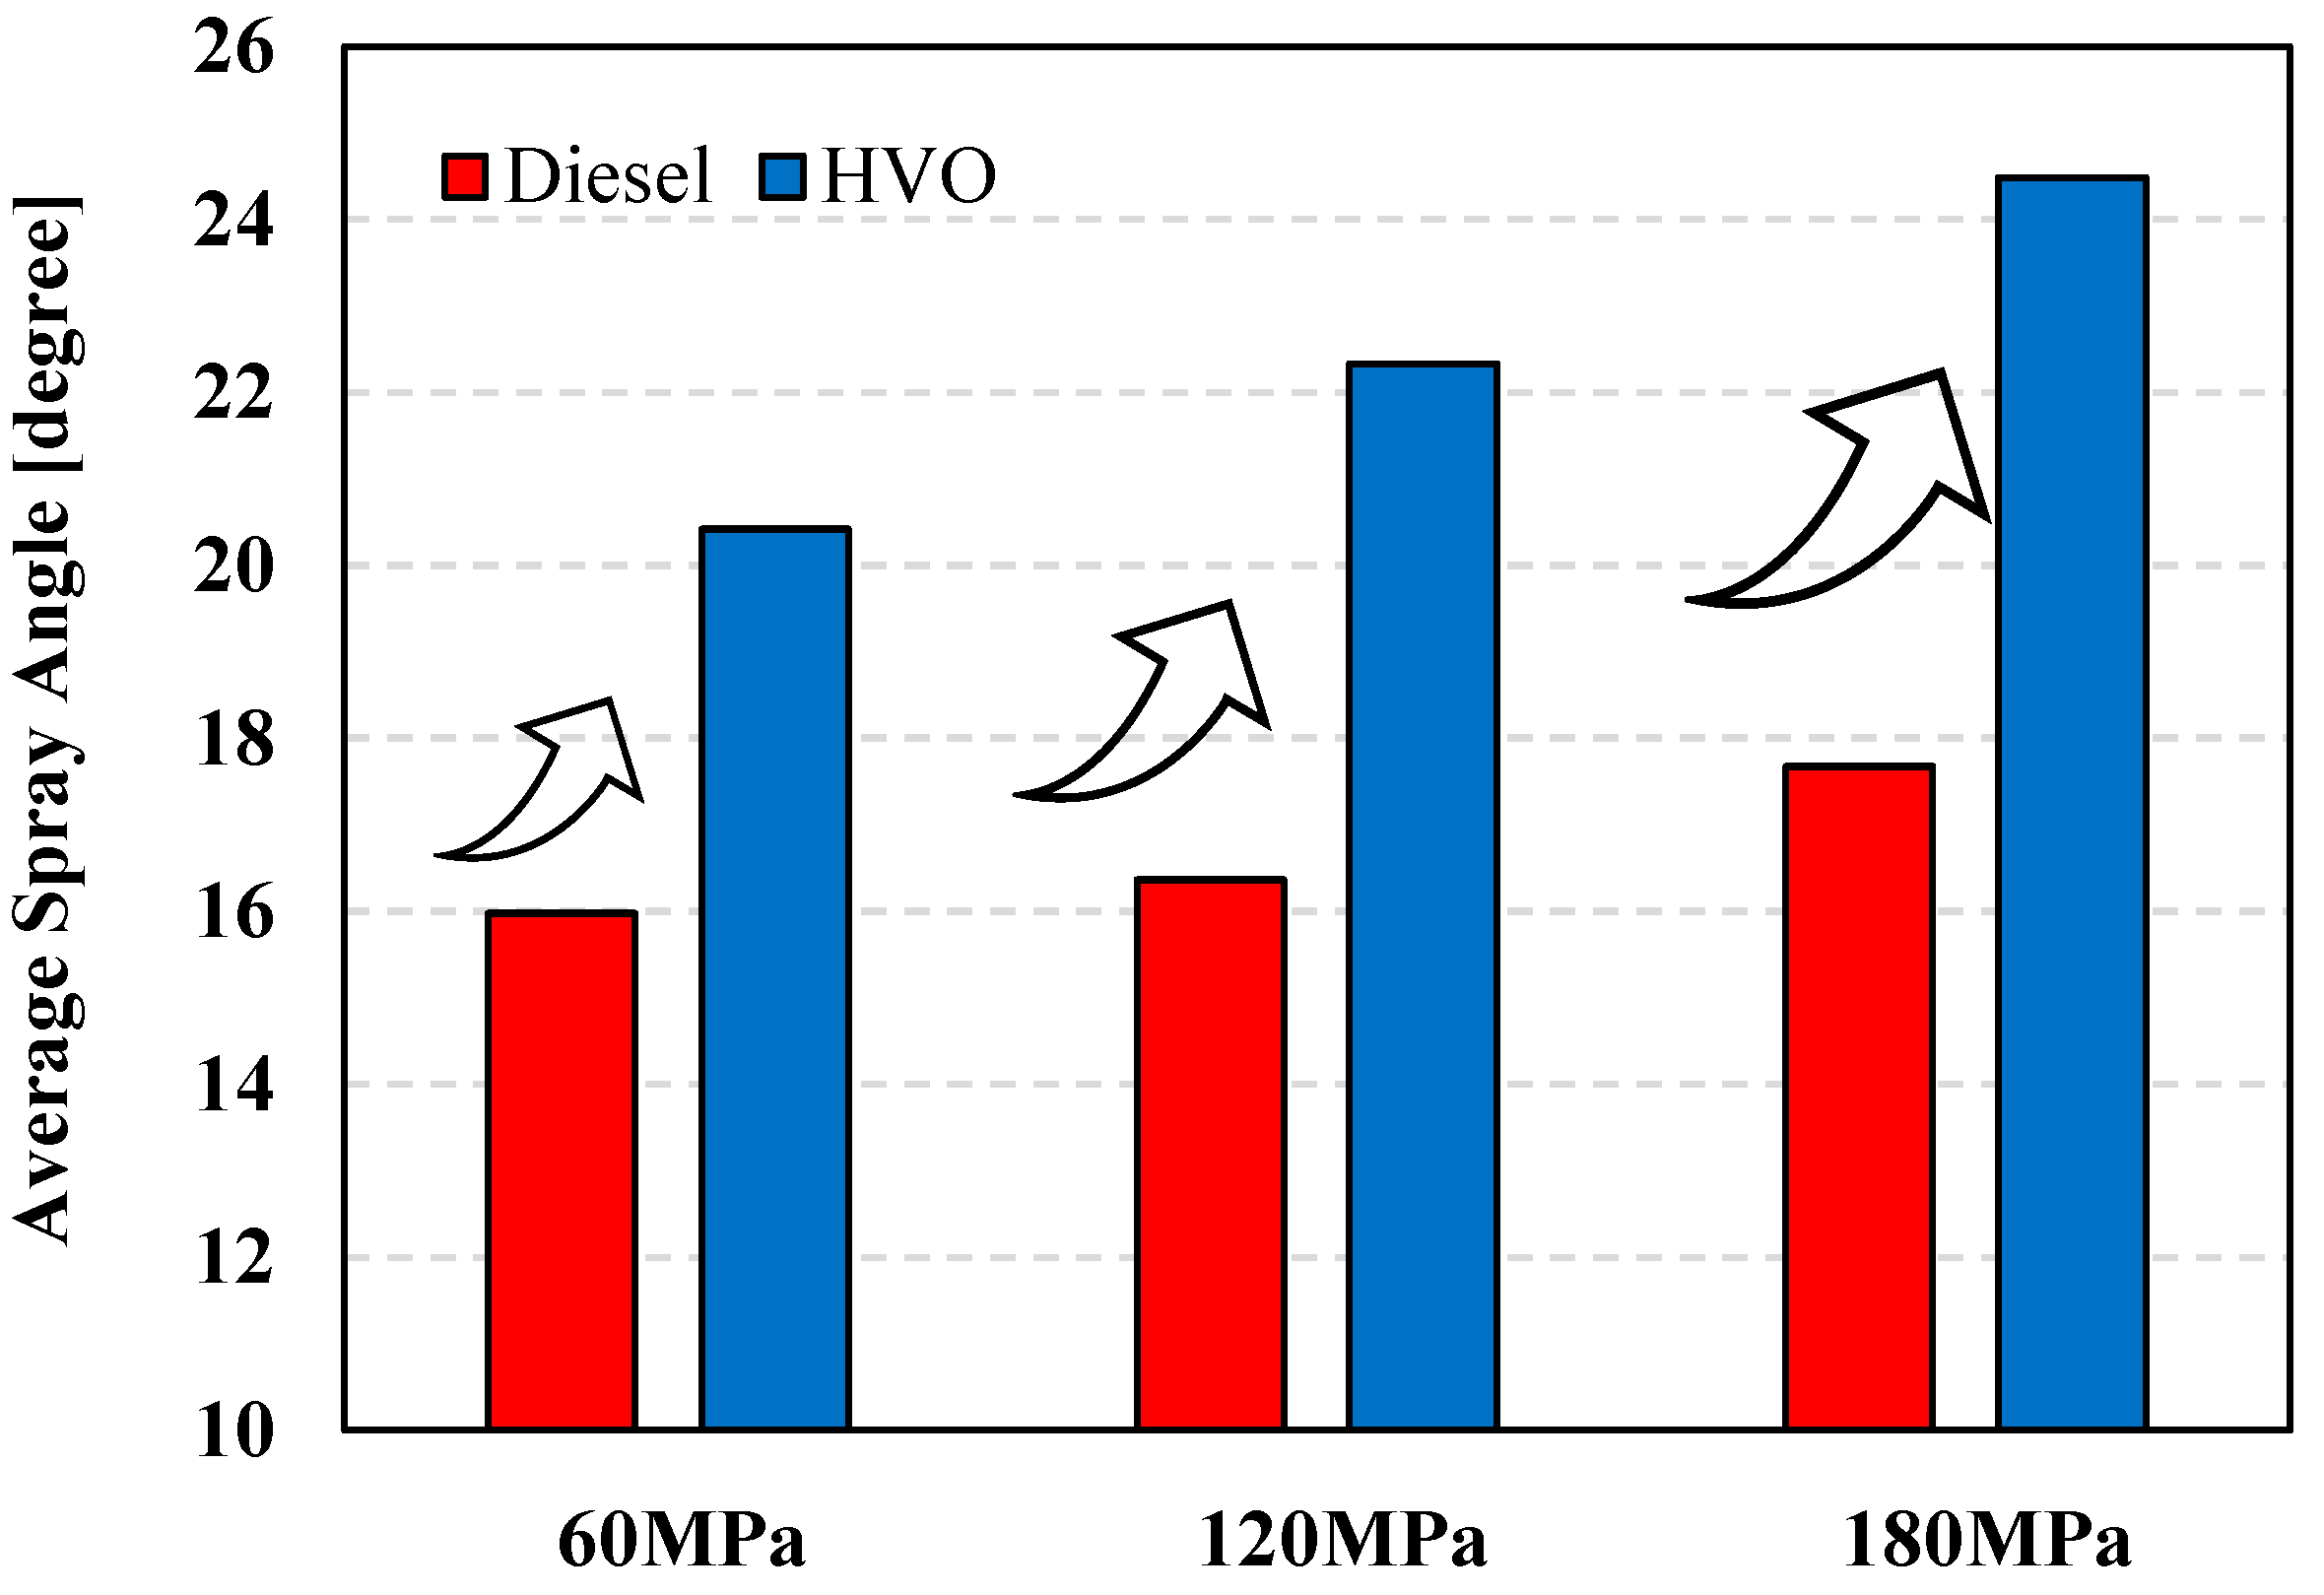
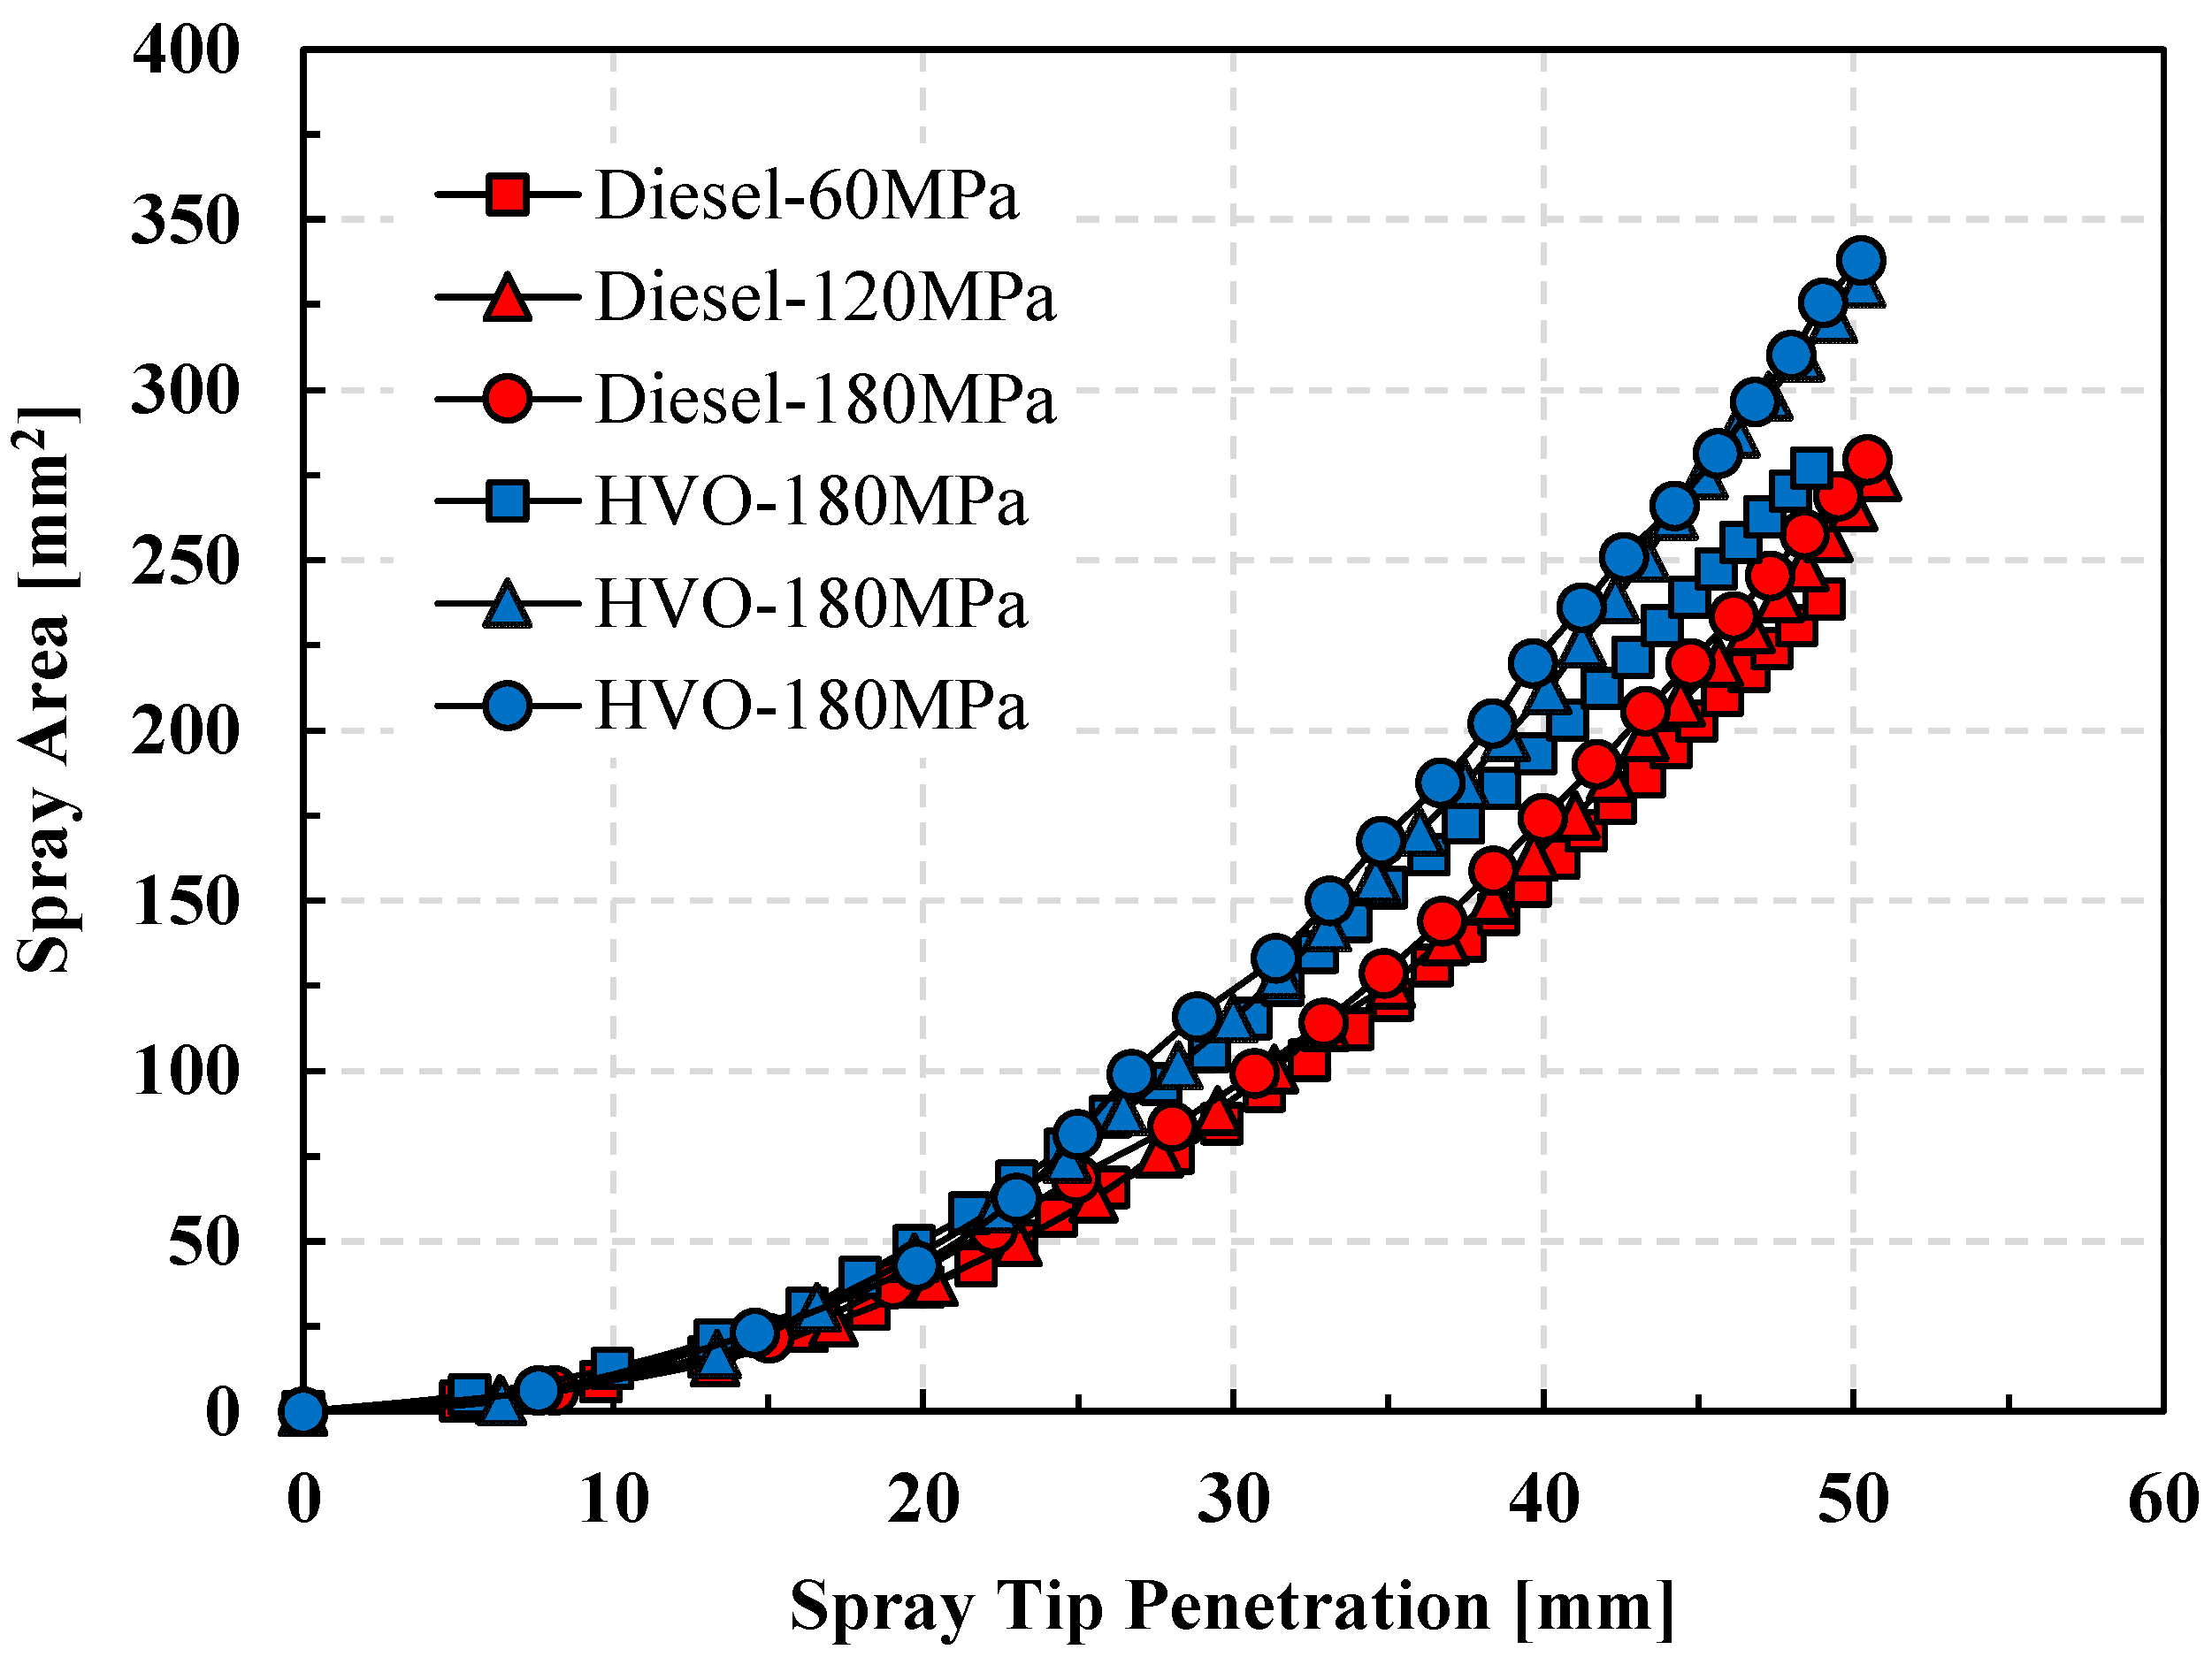
3.2.1. Spray Tip Penetration, Spray Angle and Spray Area
3.2.2. Spray Volume and Entrainment
3.3. Empirical Prediction
3.3.1. Spray Tip Penetration Prediction
3.3.2. Spray Angle Prediction
4. Conclusions
- (1)
- As the pressure increased, the peak injection rate also increased. At injection pressures above 120 MPa, the injection rates of both fuels were nearly identical. However, under low-pressure conditions, the injection rates differed, which may be due to the influence of fuel properties on the initial sac pressure establishment and needle valve movement trajectory.
- (2)
- Increased pressure shortened the injection delay. Although different fuel properties may affect injection delay, further detailed analysis is required. Compared to diesel, the HVO spray showed a wider spray width, attributed to its lower viscosity and surface tension.
- (3)
- Increased injection pressure enhanced the spray tip penetration and spray angle, but as the injection pressure continued to increase, its effect on the spray tip penetration diminished. Compared to diesel, HVO fuel had a shorter spray tip penetration, larger spray angle, and area, but its spray angle stability was lower than that of diesel. In the initial stage, the HVO fuel exhibited a larger spray tip penetration, which may be due to incomplete fuel breakup and its low viscosity. It is worth noting that the effect of increased injection pressure on spray area differed from that in previous studies, possibly due to the injector structure and lower injection pressure.
- (4)
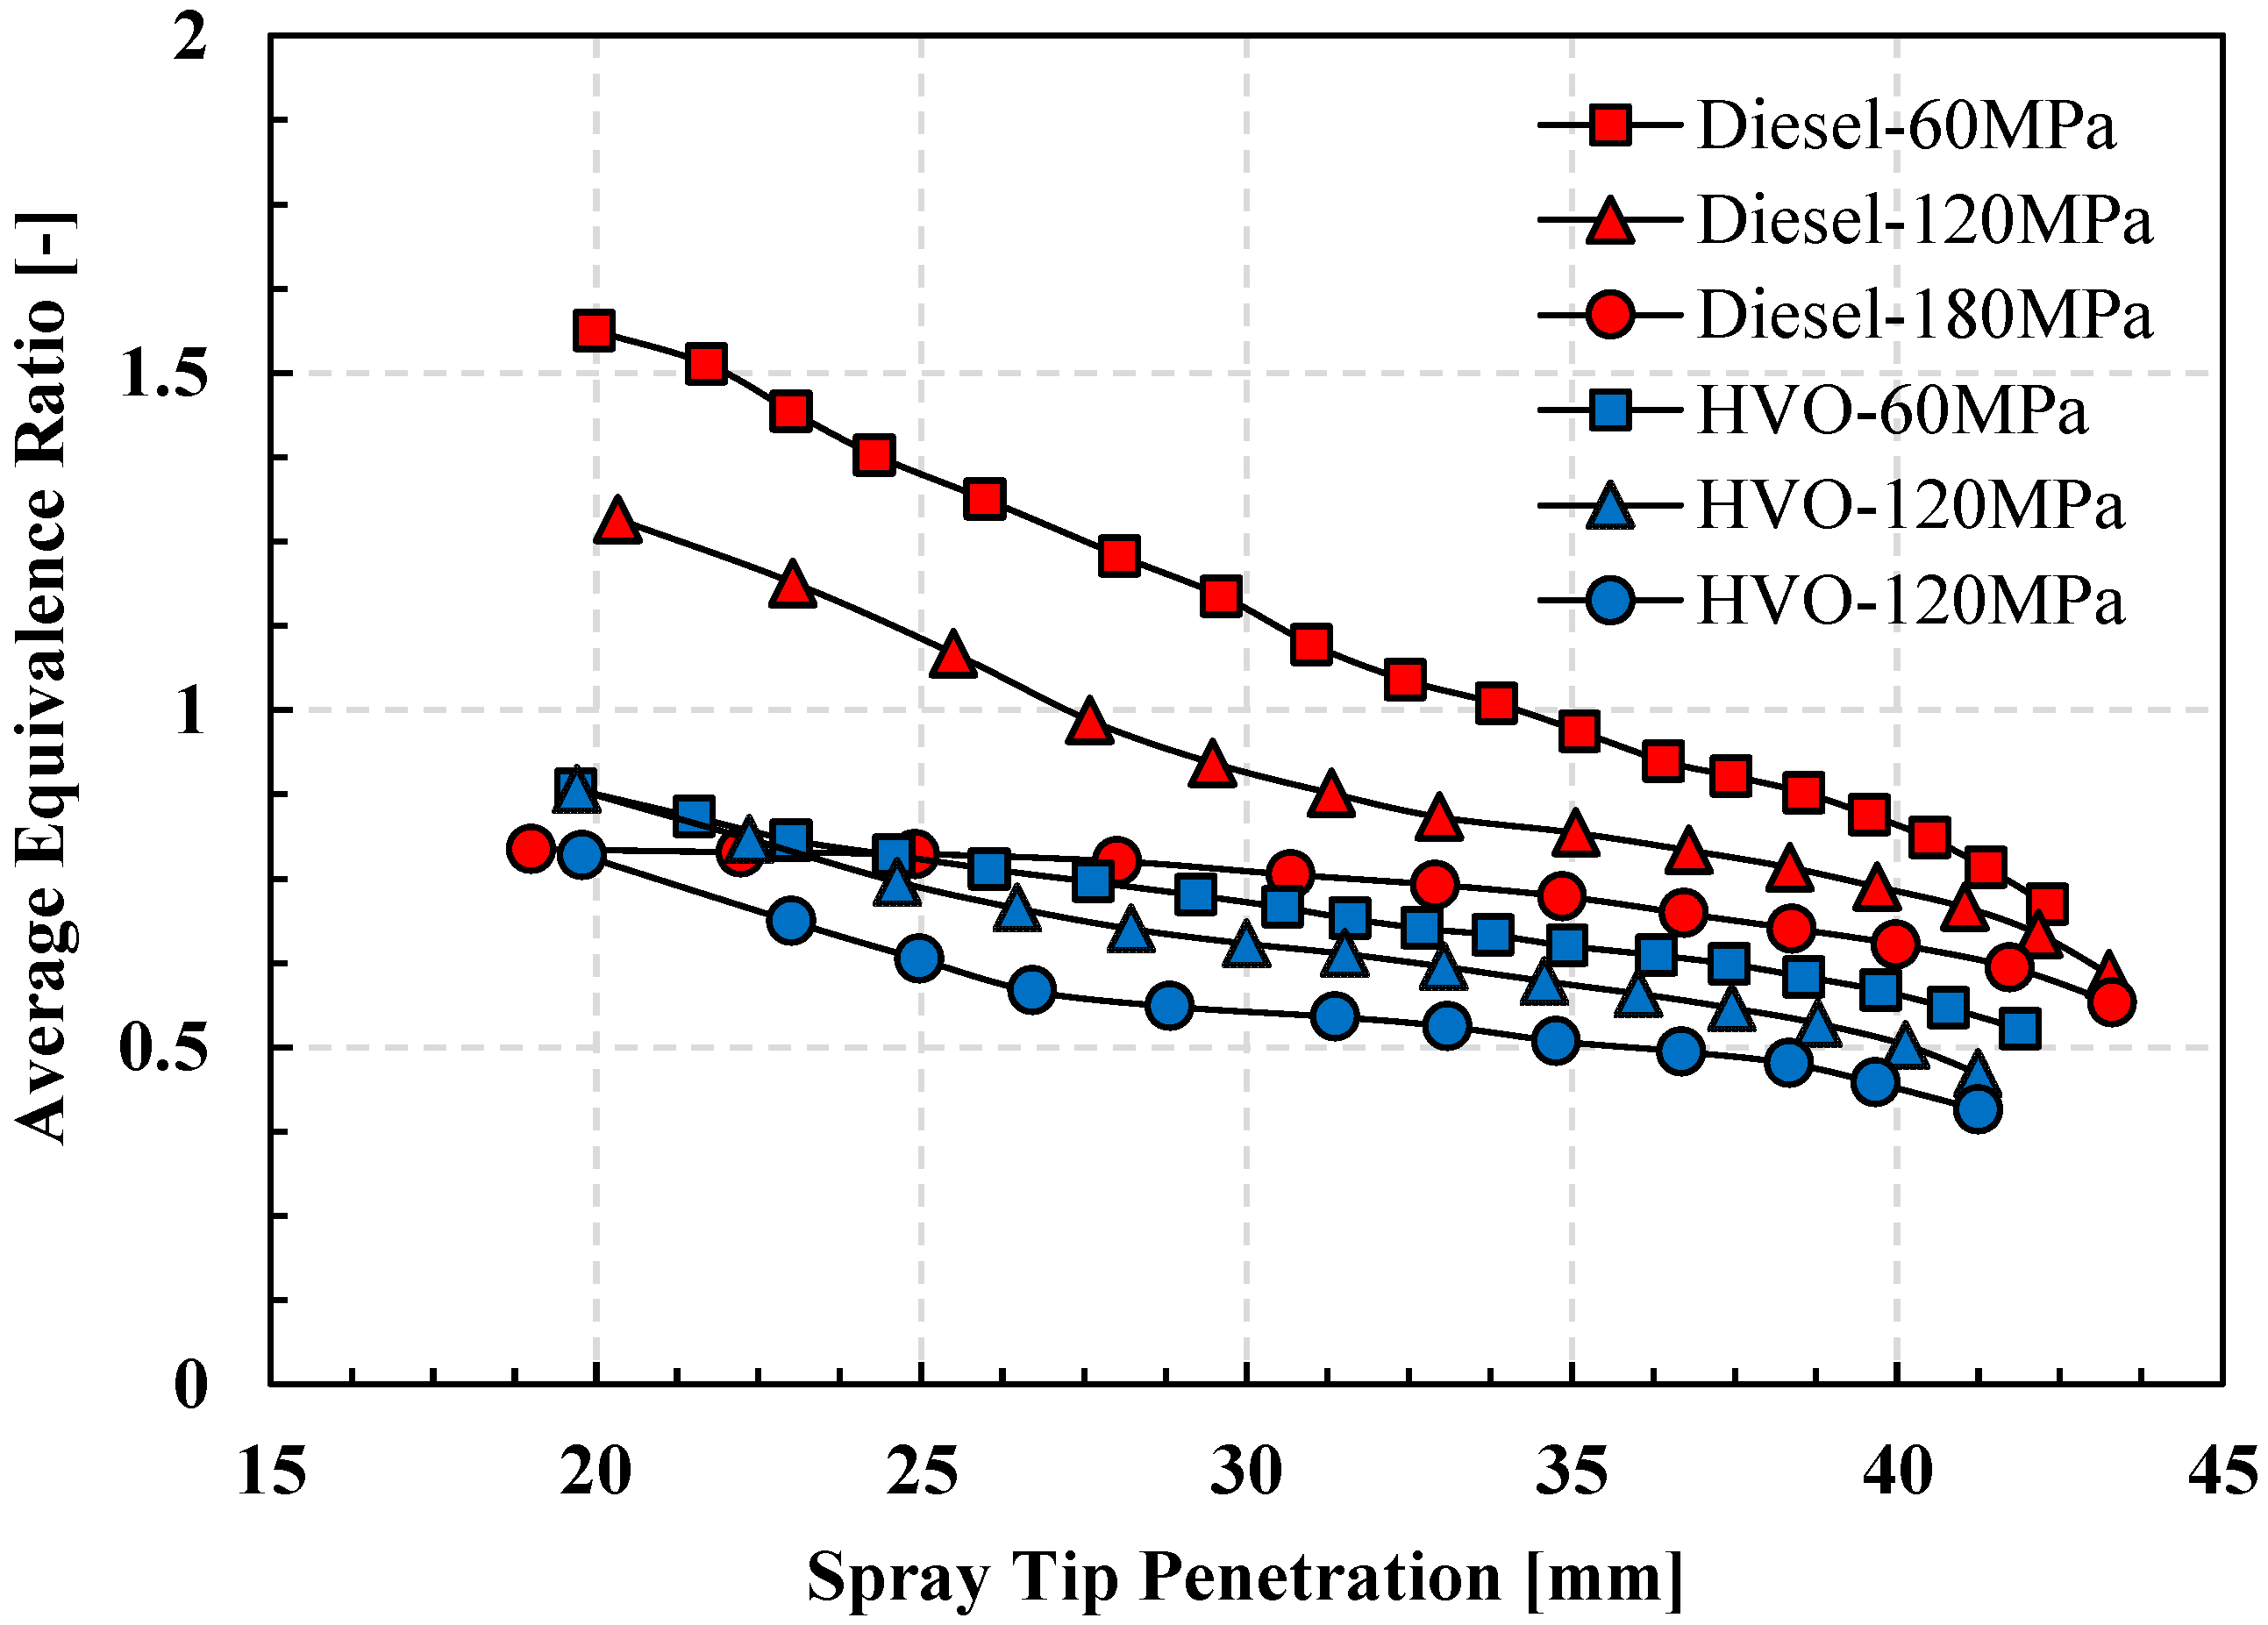
- Increasing injection pressure raised the spray volume and entrained air mass, reducing the average equivalence ratio of the spray. As the injection pressure increased, its influence on spray volume and entrained air mass decreased. The HVO fuel had a larger spray volume, higher entrained air mass, and lower average equivalence ratio. The ambient gas entrainment rate mainly occurred in two stages, primarily influenced by the spray breakup development stage. For the diesel spray, the injection pressure mainly affected the equivalence ratio near the nozzle, with relatively minor effects downstream. The change in the equivalence ratio of the HVO spray showed that the effect of the increased pressure on both the upstream and downstream regions was relatively small.
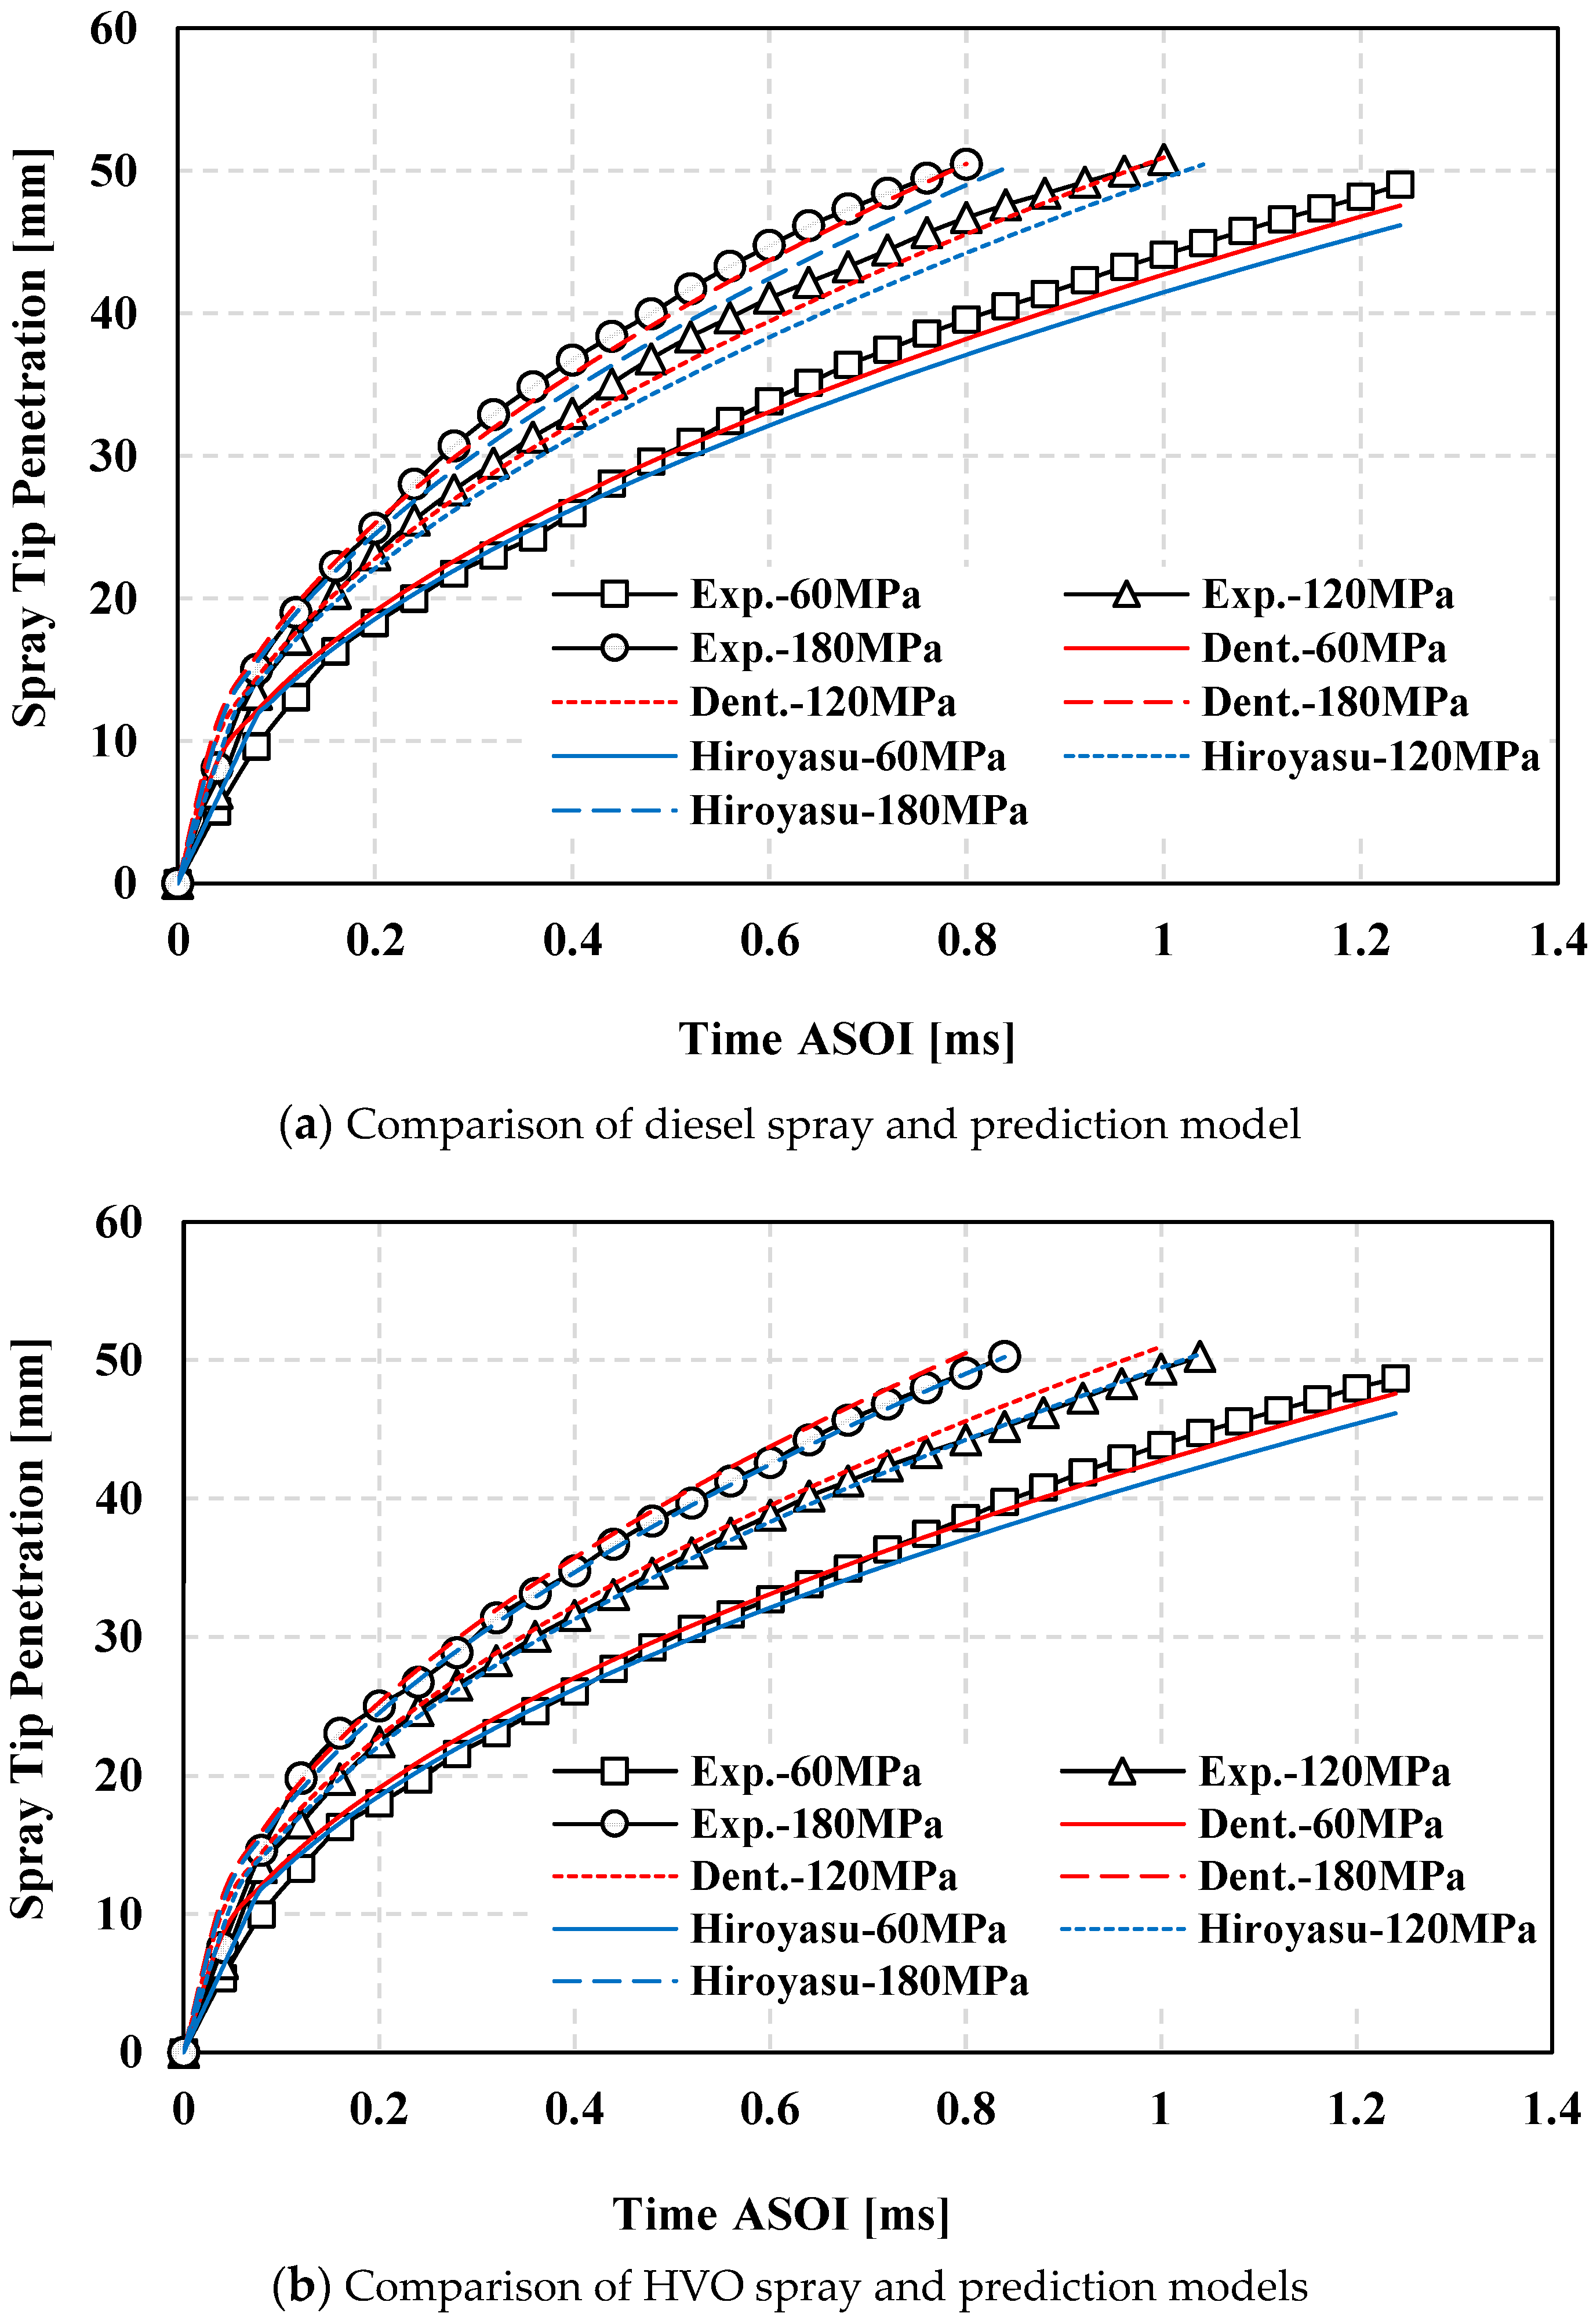
- (5)
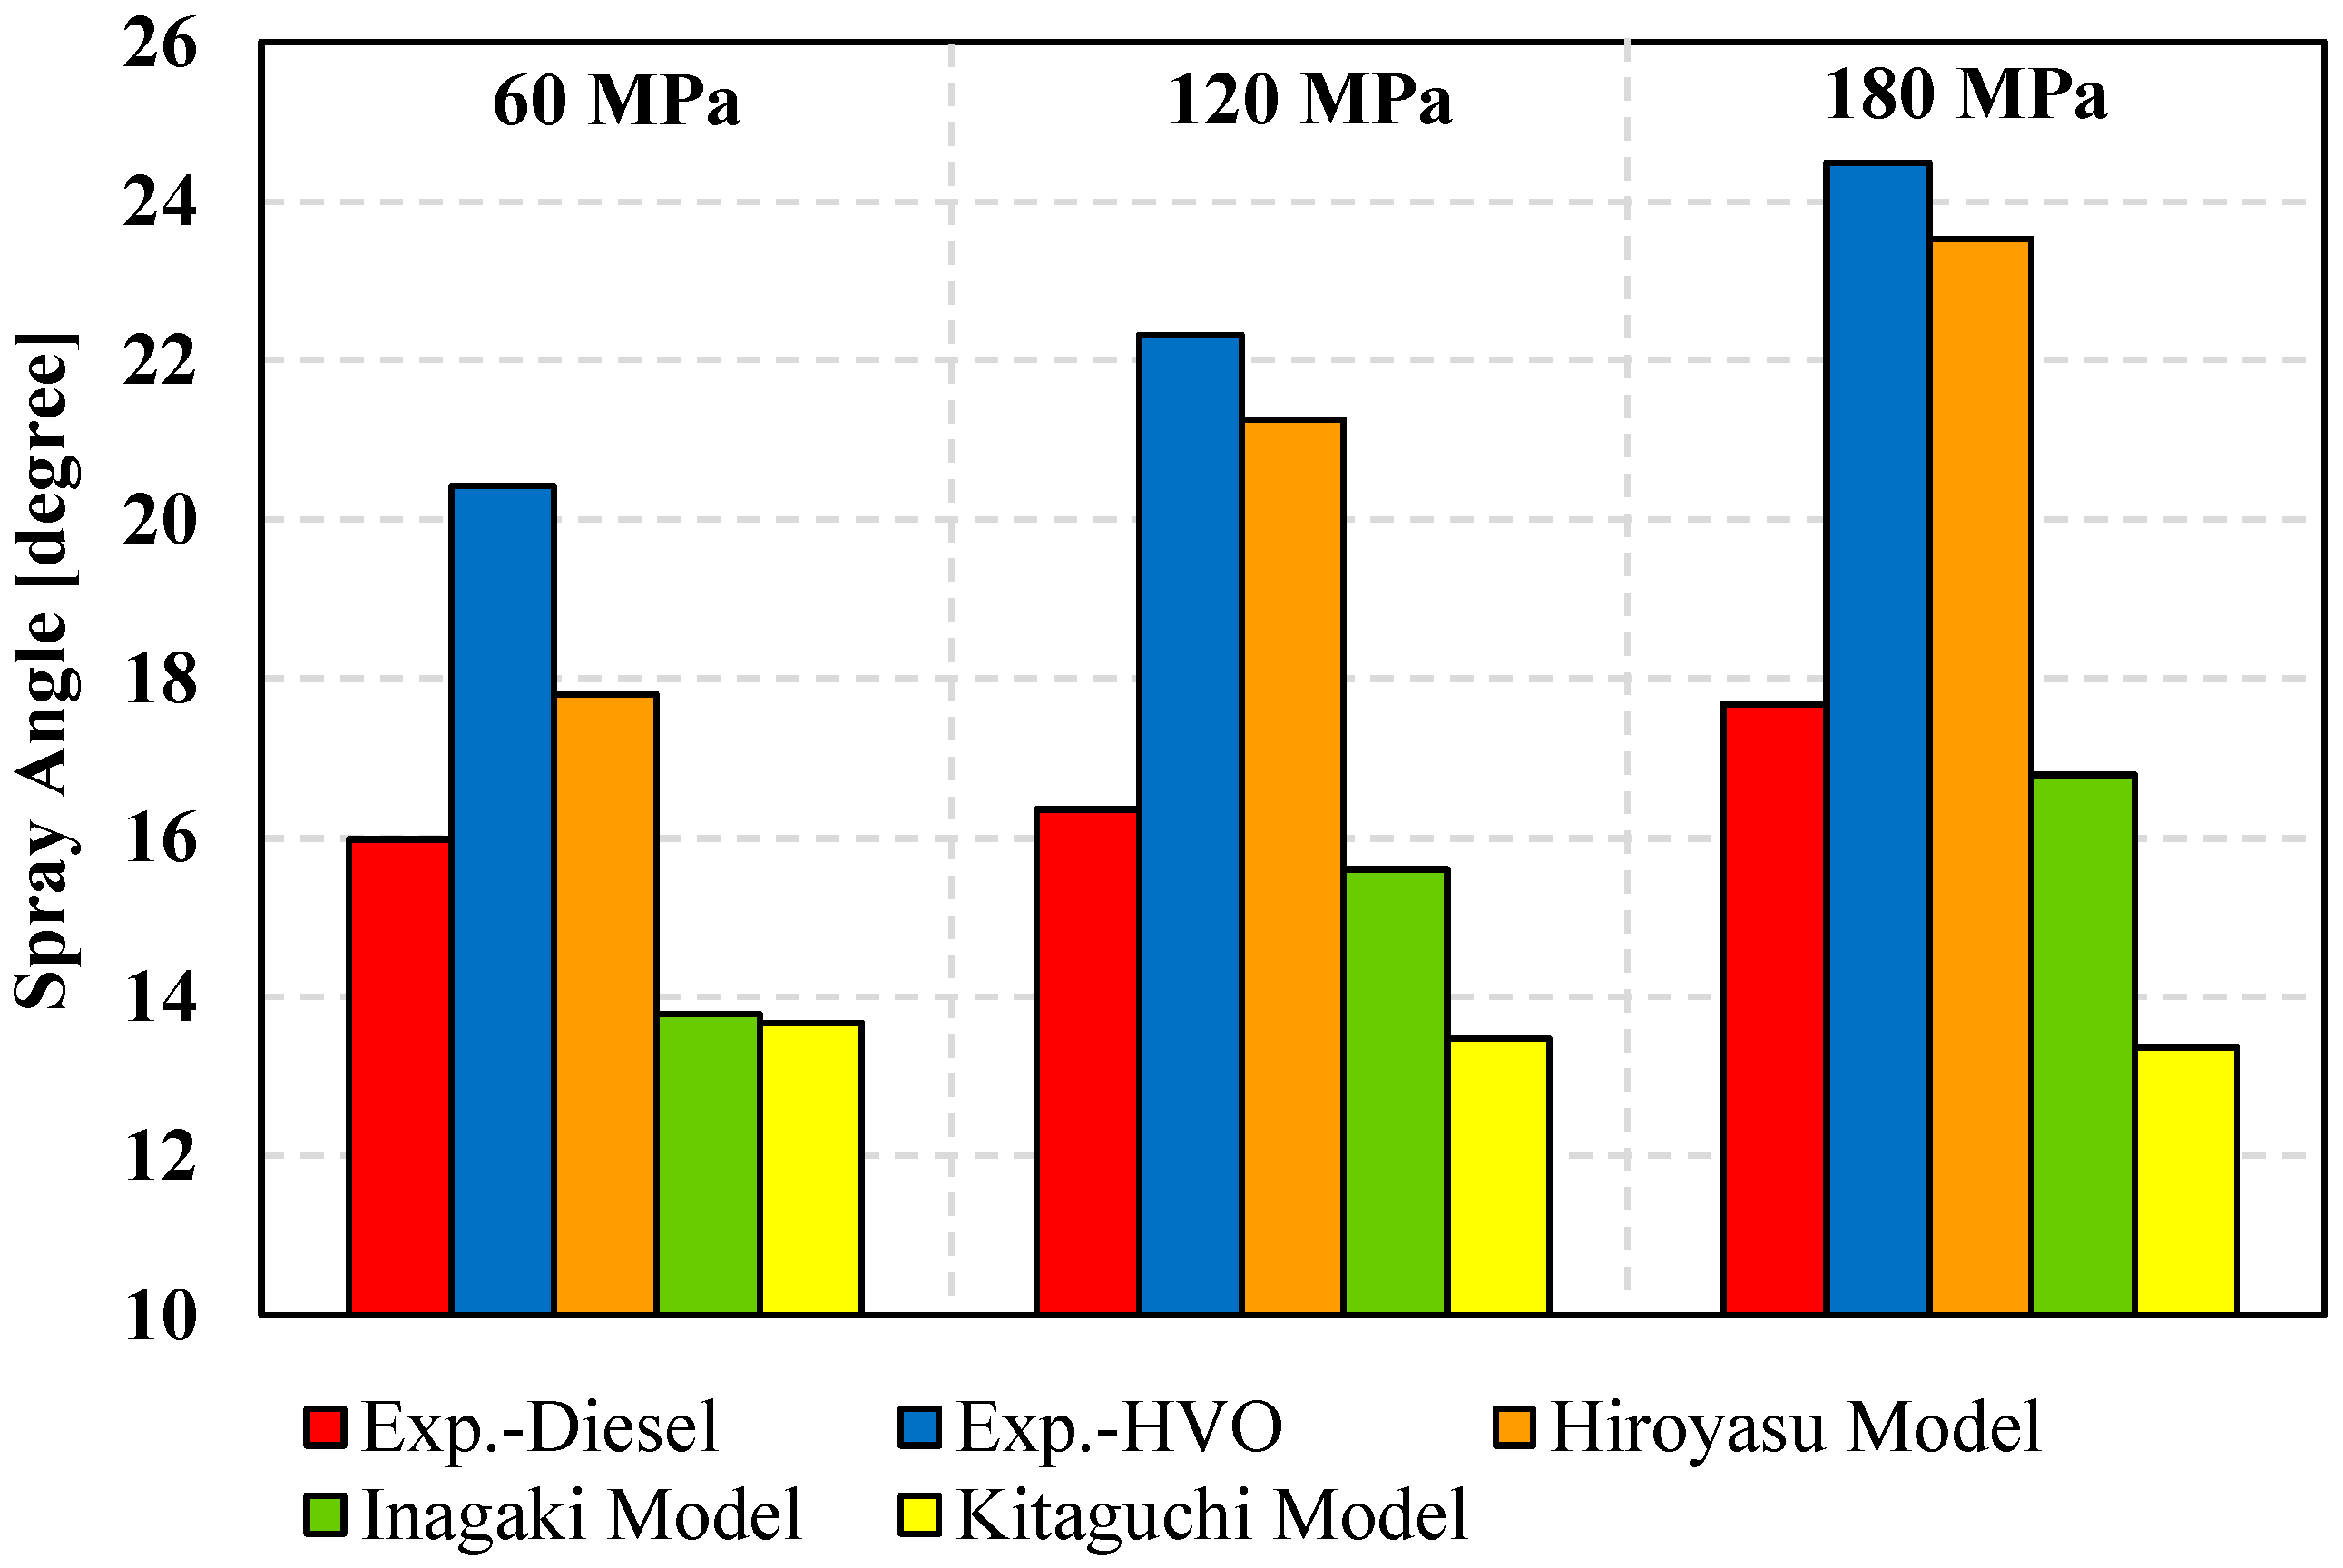
- For the diesel spray tip penetration, Dent‘s model performed well in predicting data at the end of injection under different injection pressures. For the HVO spray tip penetration, Hiroyasu‘s model better predicted the spray tip penetration at 120 MPa and 180 MPa, while Dent‘s model performed better at 60 MPa. It is important to note that both models showed differences in predictions during the initial stage of injection, which may be attributed to the definition of start of injection (SOI) and the accuracy of the model parameters. For the diesel spray angle, the Inagaki model performed relatively well, while for the HVO spray angle, the Hiroyasu model performed better.
Author Contributions
Funding
Data Availability Statement
Acknowledgments
Conflicts of Interest
References
- Zhen, X.; Wang, Y.; Liu, D. Bio-butanol as a new generation of clean alternative fuel for SI (spark ignition) and CI (compression ignition) engines. Renew. Energy 2020, 147, 2494–2521. [Google Scholar] [CrossRef]
- Luo, H.; Jin, Y.; Zhai, C.; Chang, F.; Xing, W.; Nishida, K.; Ogata, Y. Very low soot formation with modulated liquid length and lift-off length of diesel spray flame. J. Energy Inst. 2023, 111, 101383. [Google Scholar] [CrossRef]
- Zhai, C.; Zhang, G.; Jin, Y.; Nishida, K.; Ogata, Y.; Luo, H. Characterization of diesel spray combustion using two-color pyrometry and OH∗ chemiluminescence imaging-comparison between micro-hole and ultra-high injection pressure effects. J. Energy Inst. 2022, 103, 104–116. [Google Scholar] [CrossRef]
- Abbasi, T.; Abbasi, S. Is the use of renewable energy sources an answer to the problems of global warming and pollution? Crit. Rev. Environ. Sci. Technol. 2012, 42, 99–154. [Google Scholar] [CrossRef]
- Armaroli, N.; Balzani, V. The future of energy supply: Challenges and opportunities. Angew. Chem. Int. Ed. 2007, 46, 52–66. [Google Scholar] [CrossRef] [PubMed]
- Zhai, C.; Liu, E.; Zhang, G.; Xing, W.; Chang, F.; Jin, Y.; Luo, H.; Nishida, K.; Ogata, Y. Similarity and normalization study of fuel spray and combustion under ultra-high injection pressure and micro-hole diameter conditions–spray characteristics. Energy 2024, 288, 129684. [Google Scholar] [CrossRef]
- Eremeeva, A.M.; Ilyushin, Y.V. Automation of the control system for drying grain crops of the technological process for obtaining biodiesel fuels. Sci. Rep. 2023, 13, 14956. [Google Scholar] [CrossRef] [PubMed]
- Scarlat, N.; Dallemand, J.-F.; Monforti-Ferrario, F.; Banja, M.; Motola, V. Renewable energy policy framework and bioenergy contribution in the European Union–An overview from National Renewable Energy Action Plans and Progress Reports. Renew. Sustain. Energy Rev. 2015, 51, 969–985. [Google Scholar] [CrossRef]
- Musiał, W.; Zioło, M.; Luty, L.; Musiał, K. Energy policy of European Union member states in the context of renewable energy sources development. Energies 2021, 14, 2864. [Google Scholar] [CrossRef]
- Suarez-Bertoa, R.; Kousoulidou, M.; Clairotte, M.; Giechaskiel, B.; Nuottimäki, J.; Sarjovaara, T.; Lonza, L. Impact of HVO blends on modern diesel passenger cars emissions during real world operation. Fuel 2019, 235, 1427–1435. [Google Scholar] [CrossRef]
- Eremeeva, A.M.; Kondrasheva, N.K.; Khasanov, A.F.; Oleynik, I.L. Environmentally friendly diesel fuel obtained from vegetable raw materials and hydrocarbon crude. Energies 2023, 16, 2121. [Google Scholar] [CrossRef]
- Zeman, P.; Hönig, V.; Kotek, M.; Táborský, J.; Obergruber, M.; Mařík, J.; Hartová, V.; Pechout, M. Hydrotreated vegetable oil as a fuel from waste materials. Catalysts 2019, 9, 337. [Google Scholar] [CrossRef]
- Millo, F.; Bensaid, S.; Fino, D.; Marcano, S.J.C.; Vlachos, T.; Debnath, B.K. Influence on the performance and emissions of an automotive Euro 5 diesel engine fueled with F30 from Farnesane. Fuel 2014, 138, 134–142. [Google Scholar] [CrossRef]
- Zhang, Z.; Lu, Y.; Ren, H.; Roskilly, A.P.; Chen, L.; Smallbone, A.; Wang, Y. Experimental and numerical investigation on the macroscopic characteristics of hydrotreated vegetable oil (HVO) spray. Energy Procedia 2017, 142, 474–480. [Google Scholar] [CrossRef]
- Cheng, Q.; Tuomo, H.; Kaario, O.T.; Martti, L. Spray dynamics of HVO and EN590 diesel fuels. Fuel 2019, 245, 198–211. [Google Scholar] [CrossRef]
- Bjørgen, K.O.P.; Emberson, D.R.; Løvås, T. Combustion and soot characteristics of hydrotreated vegetable oil compression-ignited spray flames. Fuel 2020, 266, 116942. [Google Scholar] [CrossRef]
- Khuong, L.S.; Hashimoto, N.; Konno, Y.; Suganuma, Y.; Nomura, H.; Fujita, O. Droplet evaporation characteristics of hydrotreated vegetable oil (HVO) under high temperature and pressure conditions. Fuel 2024, 368, 131604. [Google Scholar] [CrossRef]
- Fajri, H.; Rieß, S.; Mallada, R.C.; Ruoff, I.; Wensing, M. Optical measurements of two cylindrical and conical heavy-duty diesel injector nozzels–A comparison of reference diesel, HVO, and RME fuels. Energy Convers. Manag. 2023, 285, 117018. [Google Scholar] [CrossRef]
- Bohl, T.; Tian, G.; Smallbone, A.; Roskilly, A.P. Macroscopic spray characteristics of next-generation bio-derived diesel fuels in comparison to mineral diesel. Appl. Energy 2017, 186, 562–573. [Google Scholar] [CrossRef]
- Zhai, C.; Chang, F.; Jin, Y.; Luo, H. Investigations on the Diesel Spray Characteristic and Tip Penetration Model of Multi-Hole Injector with Micro-Hole under Ultra-High Injection Pressure. Sustainability 2023, 15, 11114. [Google Scholar] [CrossRef]
- Fathurrahman, N.A.; Ginanjar, K.; Devitasari, R.D.; Maslahat, M.; Anggarani, R.; Aisyah, L.; Soemanto, A.; Solikhah, M.D.; Thahar, A.; Wibowo, E. Long-term storage stability of incorporated hydrotreated vegetable oil (HVO) in biodiesel-diesel blends at highland and coastal areas. Fuel Commun. 2024, 18, 100107. [Google Scholar] [CrossRef]
- Arcoumanis, C.; Baniasad, M.; Banias, M. Analysis of consecutive fuel injection rate signals obtained by the Zeuch and Bosch methods. SAE Trans. 1993, 102, 1371–1384. [Google Scholar]
- Luo, F.; Cui, H.; Dong, S. Transient measuring method for injection rate of each nozzle hole based on spray momentum flux. Fuel 2014, 125, 20–29. [Google Scholar] [CrossRef]
- Hwang, J.; Bae, C.; Gupta, T. Application of waste cooking oil (WCO) biodiesel in a compression ignition engine. Fuel 2016, 176, 20–31. [Google Scholar] [CrossRef]
- Jin, Y.; Dong, P.; Zhai, C.; Nishida, K.; Ogata, Y.; Leng, X. Internal flow and spray characterization of multi-hole injectors: Comparison with single-hole injectors. Energy Fuels 2020, 34, 7490–7501. [Google Scholar] [CrossRef]
- Zhai, C.; Jin, Y.; Nishida, K.; Ogata, Y. Diesel spray and combustion of multi-hole injectors with micro-hole under ultra-high injection pressure–non-evaporating spray characteristics. Fuel 2021, 283, 119322. [Google Scholar] [CrossRef]
- Desantes, J.M.; Payri, R.; Salvador, F.J.; Gil, A. Development and validation of a theoretical model for diesel spray penetration. Fuel 2006, 85, 910–917. [Google Scholar] [CrossRef]
- Desantes, J.M.; Pastor, J.V.; García-Oliver, J.M.; Briceño, F.J. An experimental analysis on the evolution of the transient tip penetration in reacting Diesel sprays. Combust. Flame 2014, 161, 2137–2150. [Google Scholar] [CrossRef]
- Delacourt, E.; Desmet, B.; Besson, B. Characterisation of very high pressure diesel sprays using digital imaging techniques. Fuel 2005, 84, 859–867. [Google Scholar] [CrossRef]
- Wang, X.; Huang, Z.; Kuti, O.A.; Zhang, W.; Nishida, K. Experimental and analytical study on biodiesel and diesel spray characteristics under ultra-high injection pressure. Int. J. Heat Fluid Flow 2010, 31, 659–666. [Google Scholar] [CrossRef]
- Dent, J. A basis for the comparison of various experimental methods for studying spray penetration. SAE Trans. 1971, 80, 1881–1884. [Google Scholar]
- Hiroyasu, H.; Arai, M. Structures of fuel sprays in diesel engines. SAE Trans. 1990, 99, 1050–1061. [Google Scholar]
- Hiroyasu, H. Fuel spray penetration and spray angle in diesel engines. JSAE 1980, 21, 5–11. [Google Scholar]
- Inagaki, K.; Mizuta, J.; Kawamura, K.; Idota, Y.; Hashizume, T. Theoretical Study on Spray Design for Small-Bore Diesel Engine; 0148-7191; SAE Technical Paper; SAE International: Warrendale, PA, USA, 2016. [Google Scholar]
- Kitaguchi, K.; Matsumoto, M. Prediction of Diesel Spray with Super High Injection Pressure under High Atmosphere Density by Use of Experimental Formula and Numerical Simulation: 1st Report: Validity of the Experimental Formula Concerning the Spray Characteristics. Symp. (ILASS-Jpn.) At. 2012, 21, 15–22. [Google Scholar]


| Items | Value |
|---|---|
| Injectors | Denso G4S (solenoid injector) |
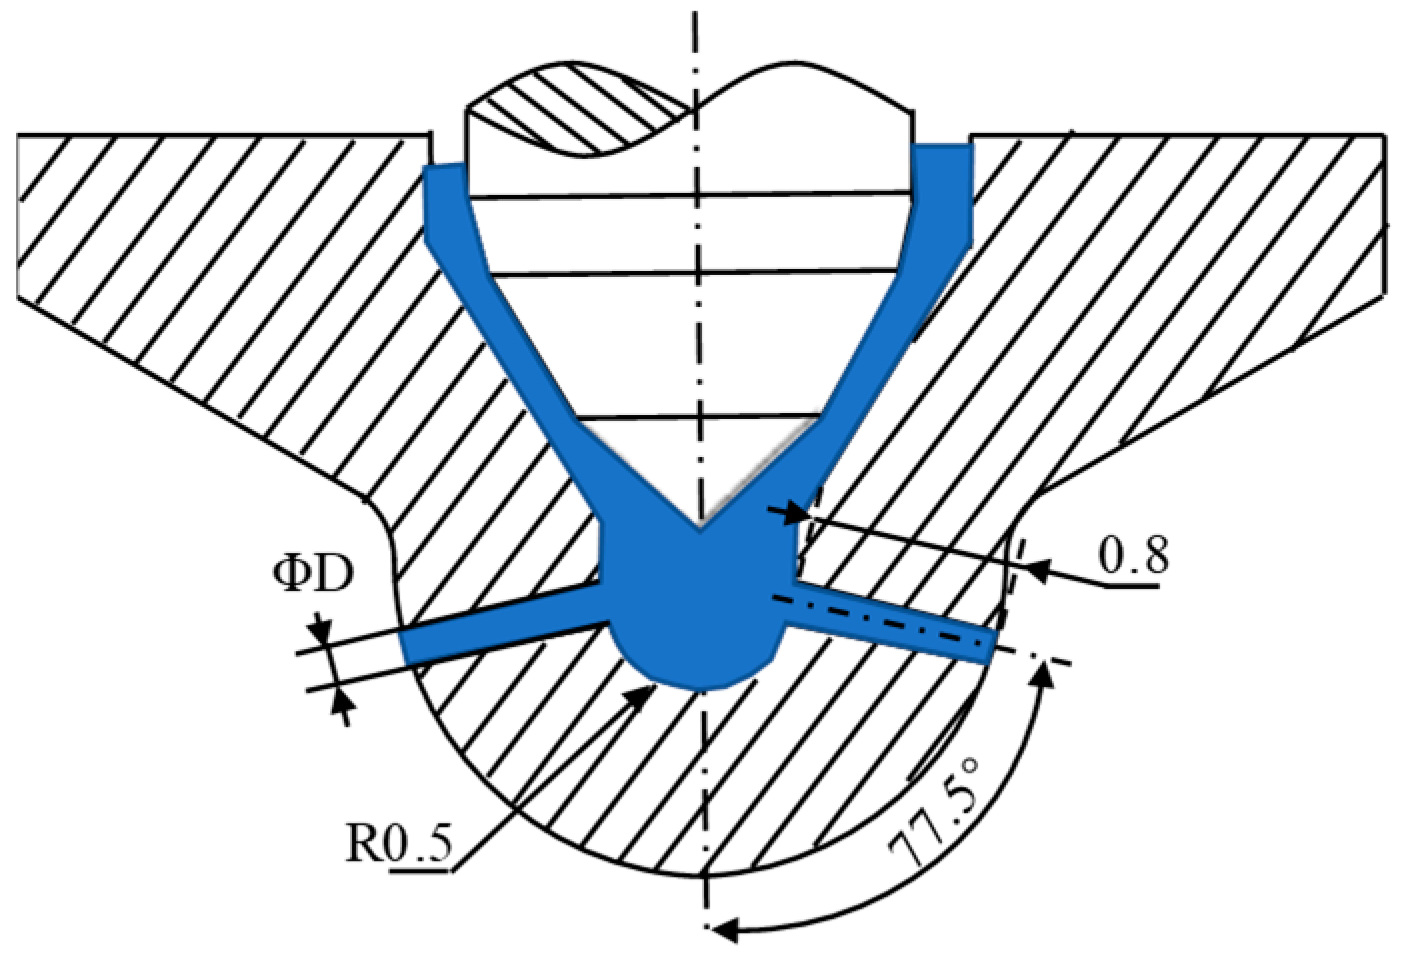
| Type | Mini-sac |
| Hole number | 10 |
| Umbrella angle [°] | 155 |
| Nozzle-hole diameter (D) [mm] | 0.106 |
| Hole length [mm] | 0.8 |
| Sac radius [mm] | 0.5 |
| Injection Condition | |
| Fuel | Diesel (JIS#2), HVO |
| Injection amount [mg] | 16.6 |
| Injection pressure (Pinj) [MPa] | 60; 120;180 |
| Nozzle hole diameter (D) [mm] | 0.106 |
| Ambient Condition | |
| Ambient gas | Nitrogen |
| Gas density (ρamb) [kg/m3] | 16.84 |
| Ambient temperature [K] | 300 |
| Ambient pressure [MPa] | 1.5 |
| Fuel Property | Diesel (JIS#2) | HVO |
|---|---|---|
| Density @ 15 °C [kg/m3] | 830 | 779 |
| Kin. viscosity @ 40 °C [cSt] | 3.477 | 3.289 |
| Distillation range [°C] | 155–384 | 276–312 |
| Cloud point [°C] | 13 | 14 |
| Derived cetane number | 59.85 | 72.72 |
| Lower heating value [MJ/kg] | 42.9 | 43.81 |
| Molecular weight [g/mol] | ~203 | ~222 |
| Stoichiometric air-to-fuel ratio | 14.56 | 14.95 |
| Items | Value |
|---|---|
| High-speed camera | NAC-MEMRECAM HX-3 |
| Lens | Nikon, 105 mm |
| Light source | Altec LED lamp |
| Pulse generator | DG535 |
| Resolution | 640 × 640 |
| Exposure [ms] | 0.005 |
| Framerate [fps] | 50,000 |
| Aperture sizes [1/f] | 4.8 |
Disclaimer/Publisher’s Note: The statements, opinions and data contained in all publications are solely those of the individual author(s) and contributor(s) and not of MDPI and/or the editor(s). MDPI and/or the editor(s) disclaim responsibility for any injury to people or property resulting from any ideas, methods, instructions or products referred to in the content. |
© 2024 by the authors. Licensee MDPI, Basel, Switzerland. This article is an open access article distributed under the terms and conditions of the Creative Commons Attribution (CC BY) license (https://creativecommons.org/licenses/by/4.0/).
Share and Cite
Zhai, C.; Li, K.; Dong, P.; Jin, Y.; Luo, H.; Zhou, B.; Liu, Y. Experimental Study on the Spray Characteristics of Diesel and Hydrotreated Vegetable Oil (HVO) Fuels under Different Injection Pressures. Processes 2024, 12, 1697. https://doi.org/10.3390/pr12081697
Zhai C, Li K, Dong P, Jin Y, Luo H, Zhou B, Liu Y. Experimental Study on the Spray Characteristics of Diesel and Hydrotreated Vegetable Oil (HVO) Fuels under Different Injection Pressures. Processes. 2024; 12(8):1697. https://doi.org/10.3390/pr12081697
Chicago/Turabian StyleZhai, Chang, Kuichun Li, Pengbo Dong, Yu Jin, Hongliang Luo, Beini Zhou, and Yang Liu. 2024. "Experimental Study on the Spray Characteristics of Diesel and Hydrotreated Vegetable Oil (HVO) Fuels under Different Injection Pressures" Processes 12, no. 8: 1697. https://doi.org/10.3390/pr12081697