
Average Carbon Number Analysis and Relationship with Octane Number and PIONA Analysis of Premium and Regular Gasoline Expended in Ecuador

 , , and
Abstract
:1. Introduction
2. Materials and Methods
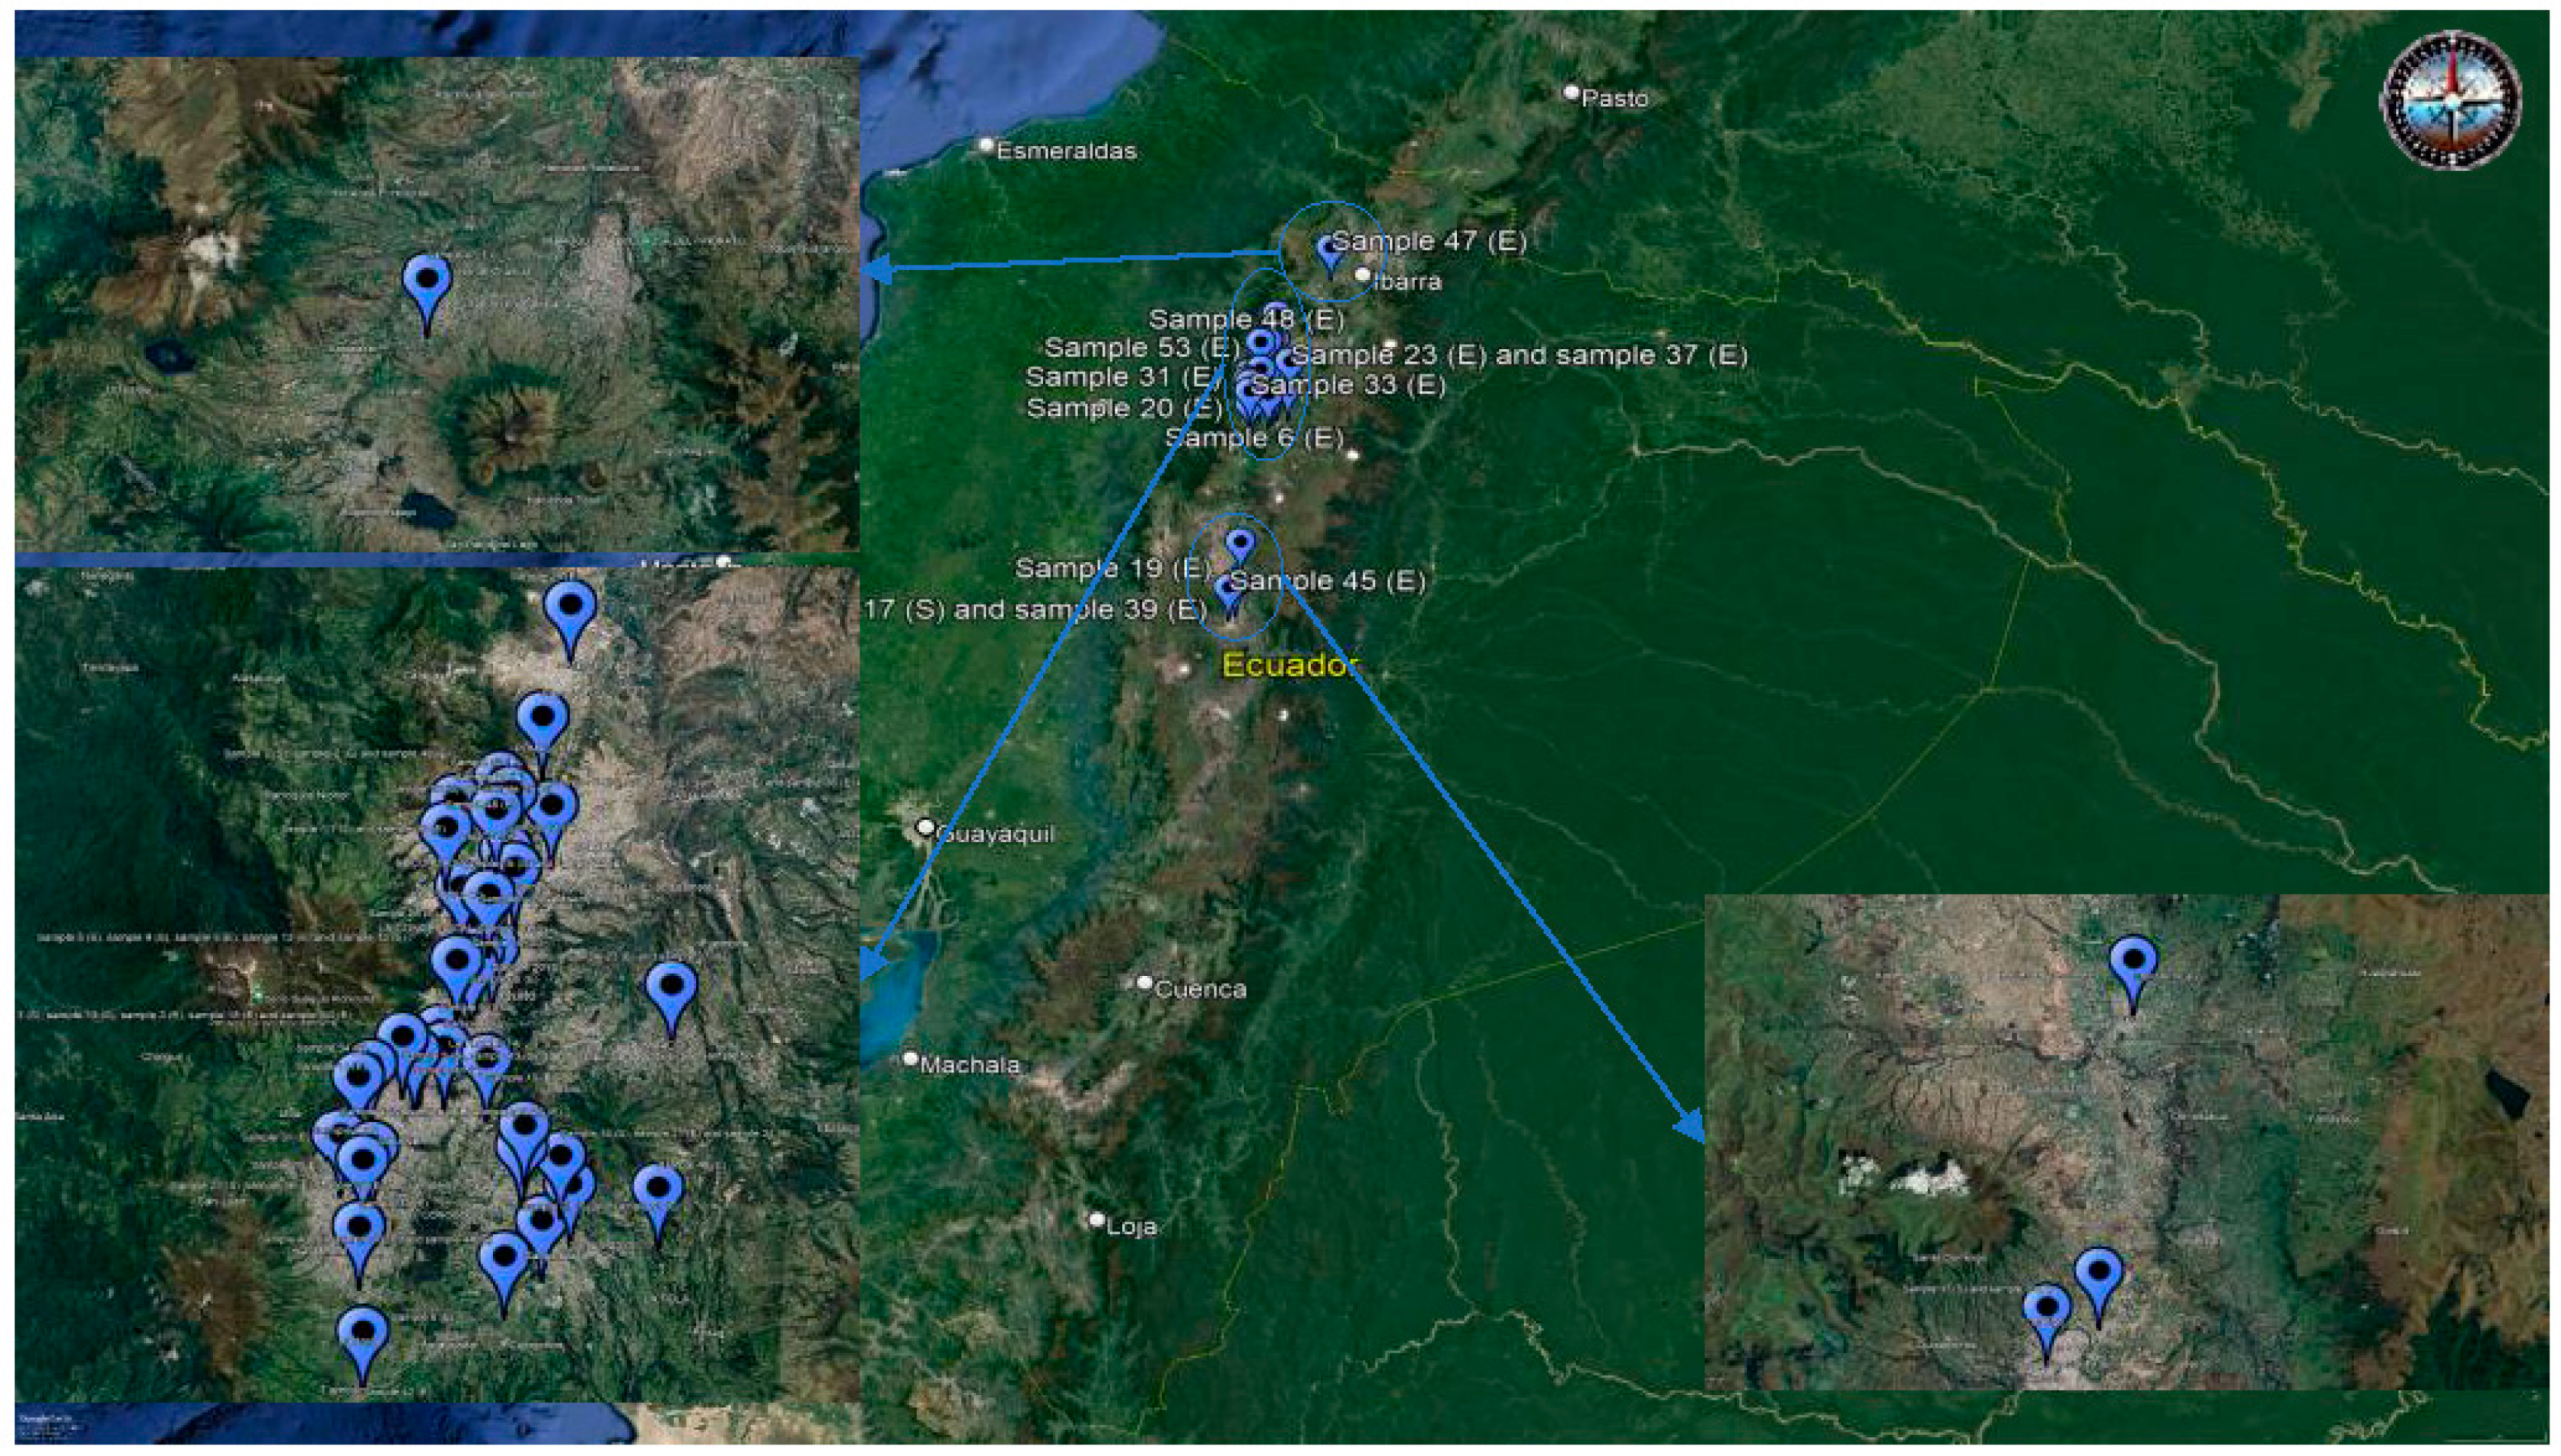
2.1. Sample Collection
2.2. Determination of Research Octane Number
2.3. GC-MS Analysis
2.4. PIONA Analysis
2.5. Calculation of the Average Carbon Number
2.6. Statistical Analysis
3. Results
3.1. Determination of Research Octane Number
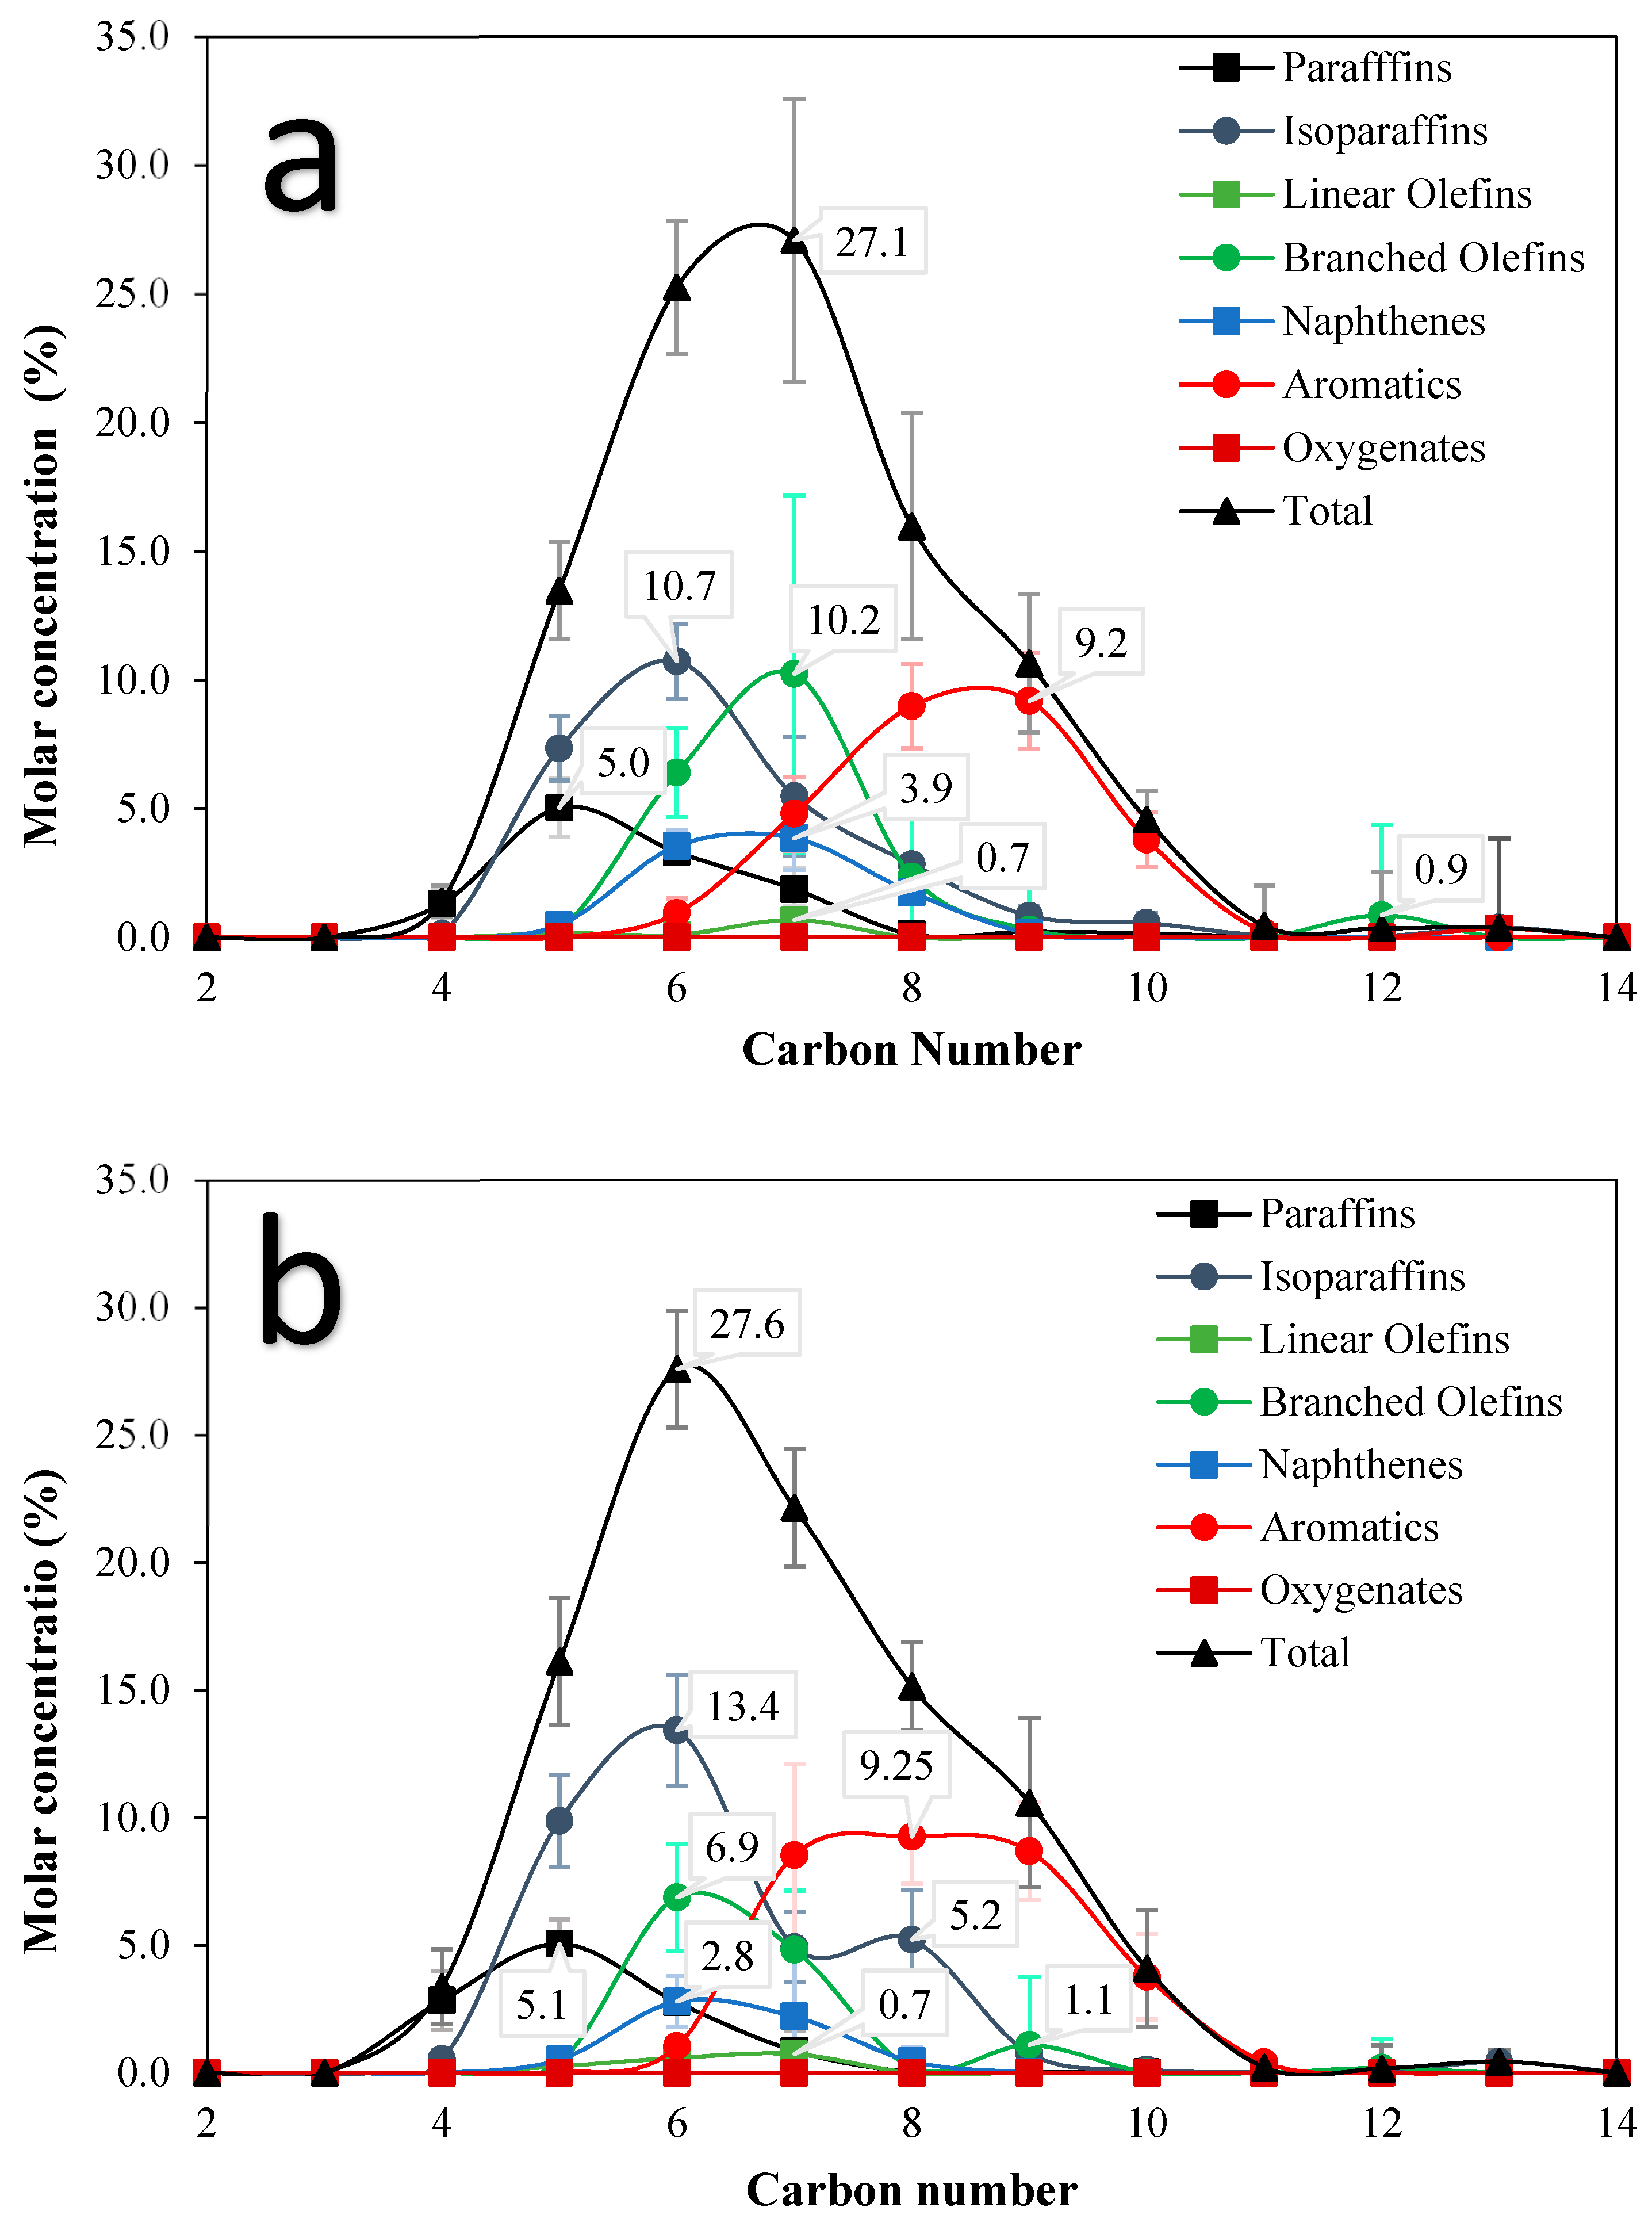
3.2. PIONA Analysis
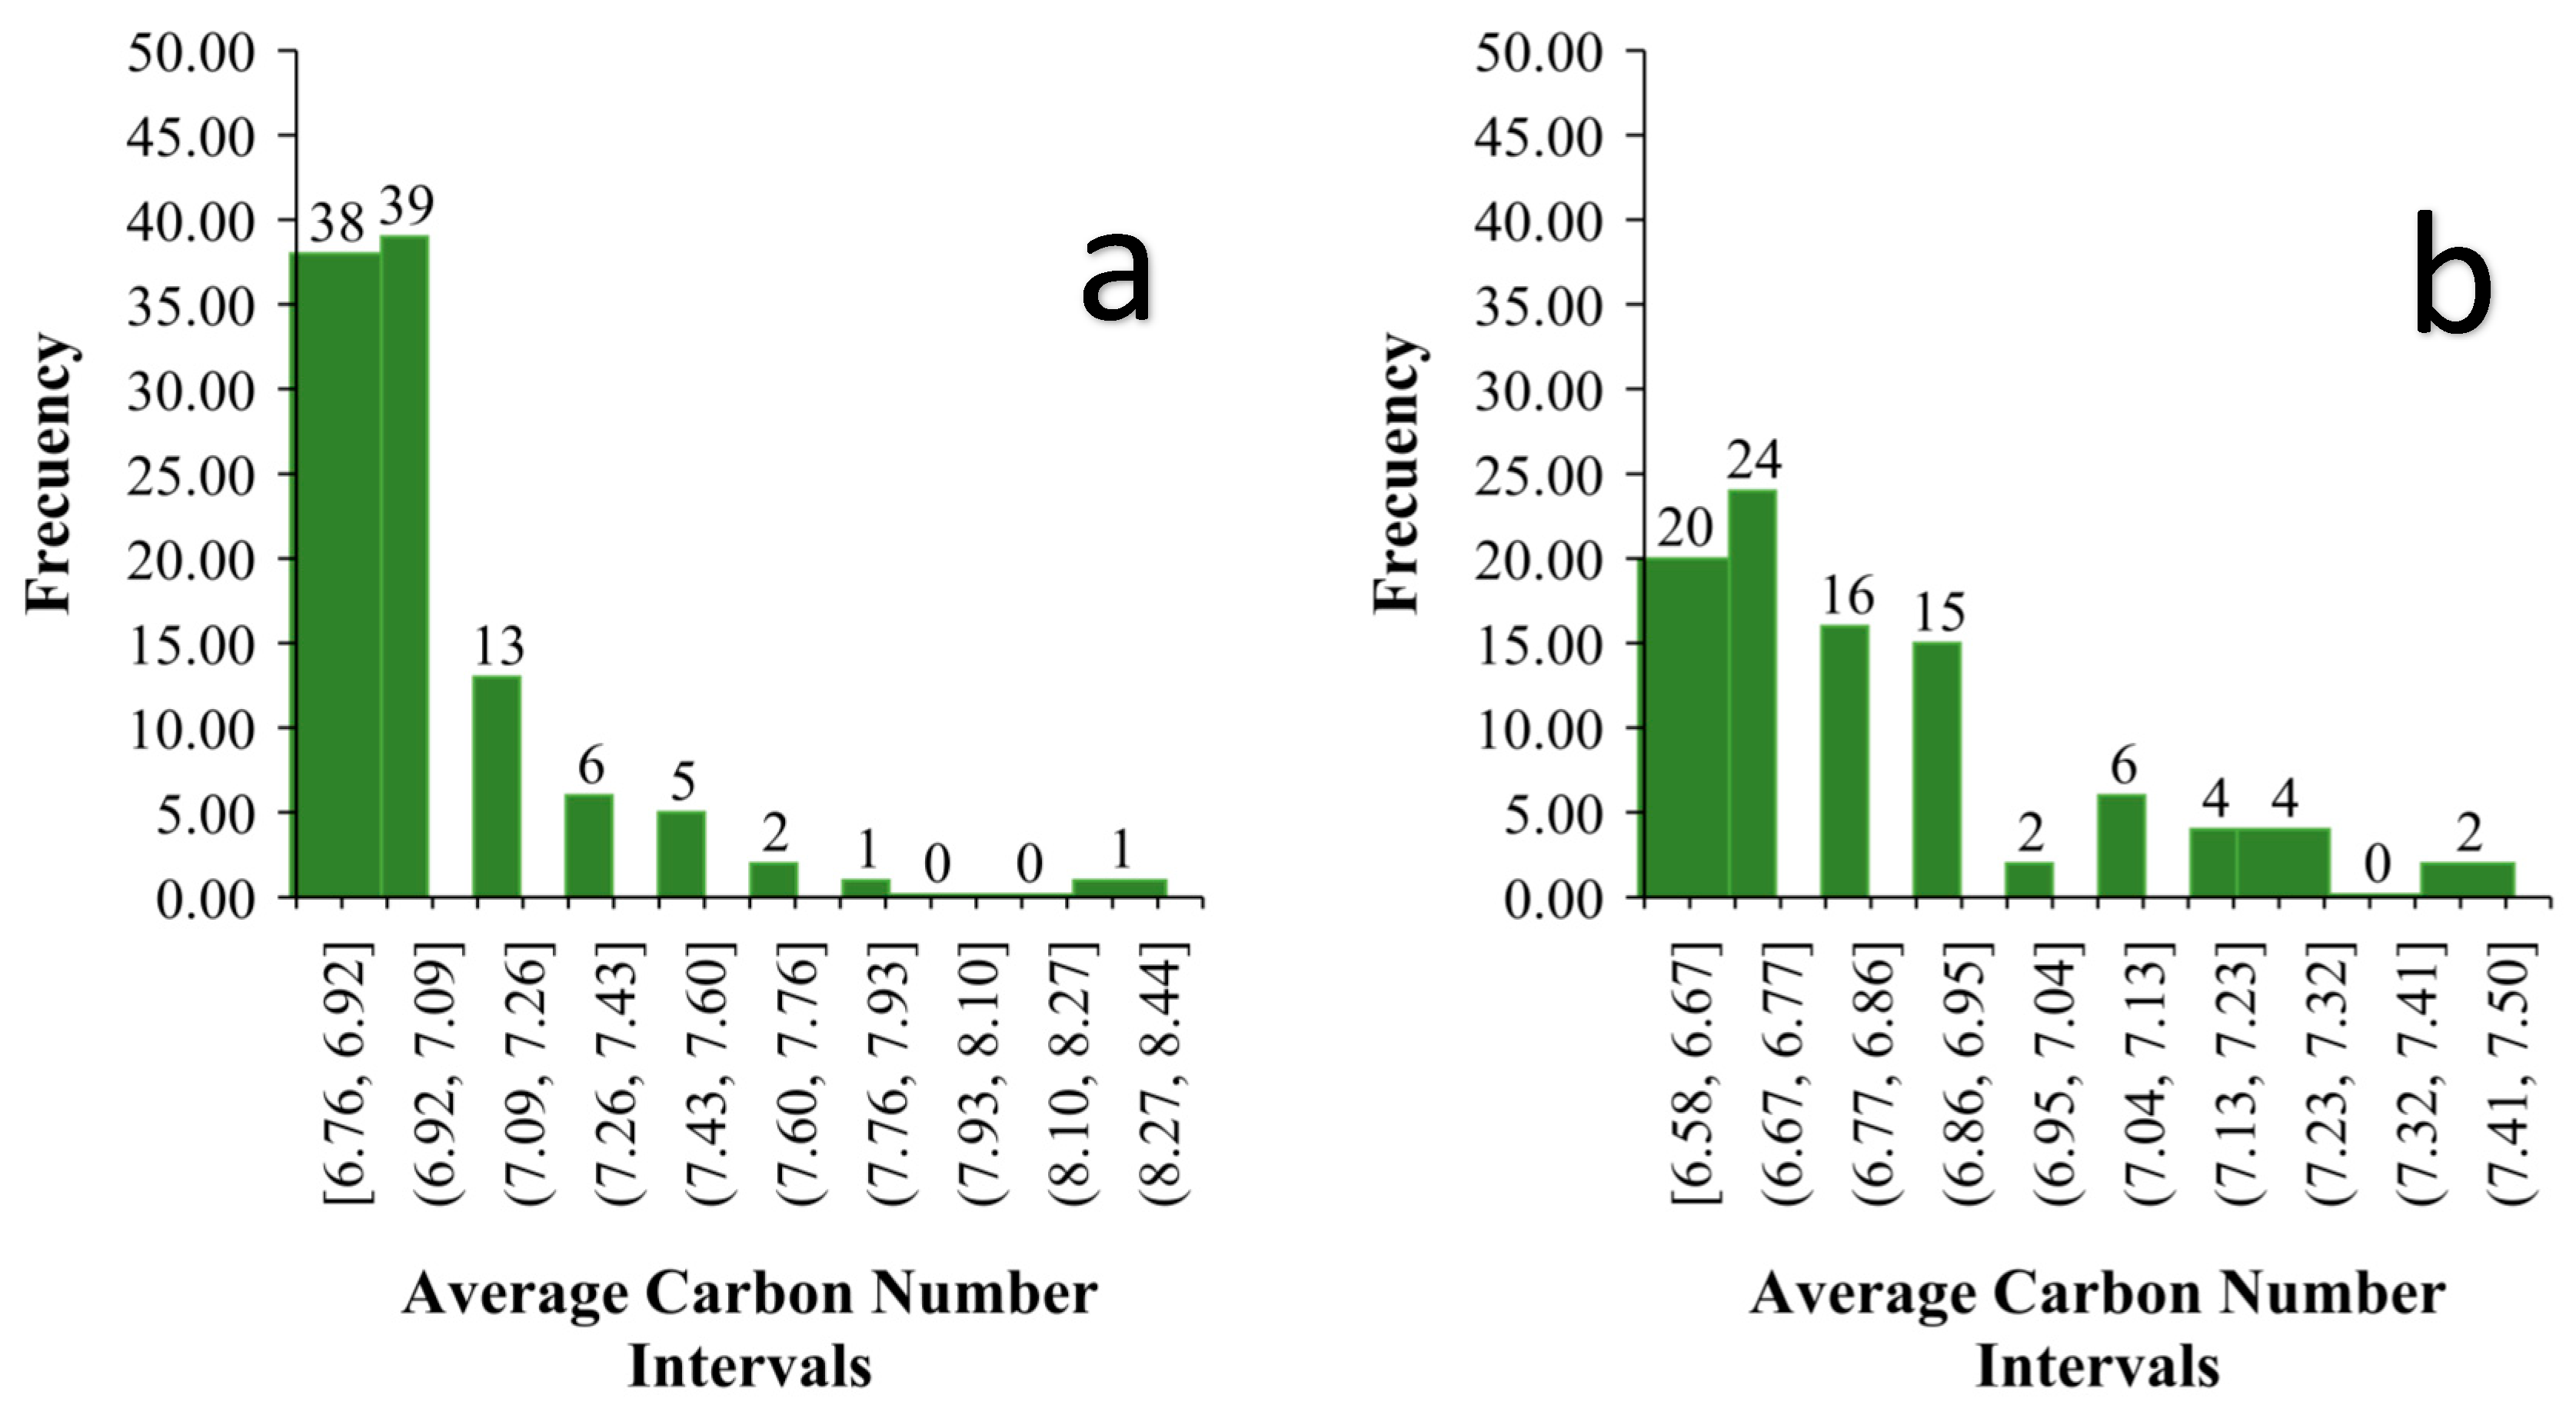
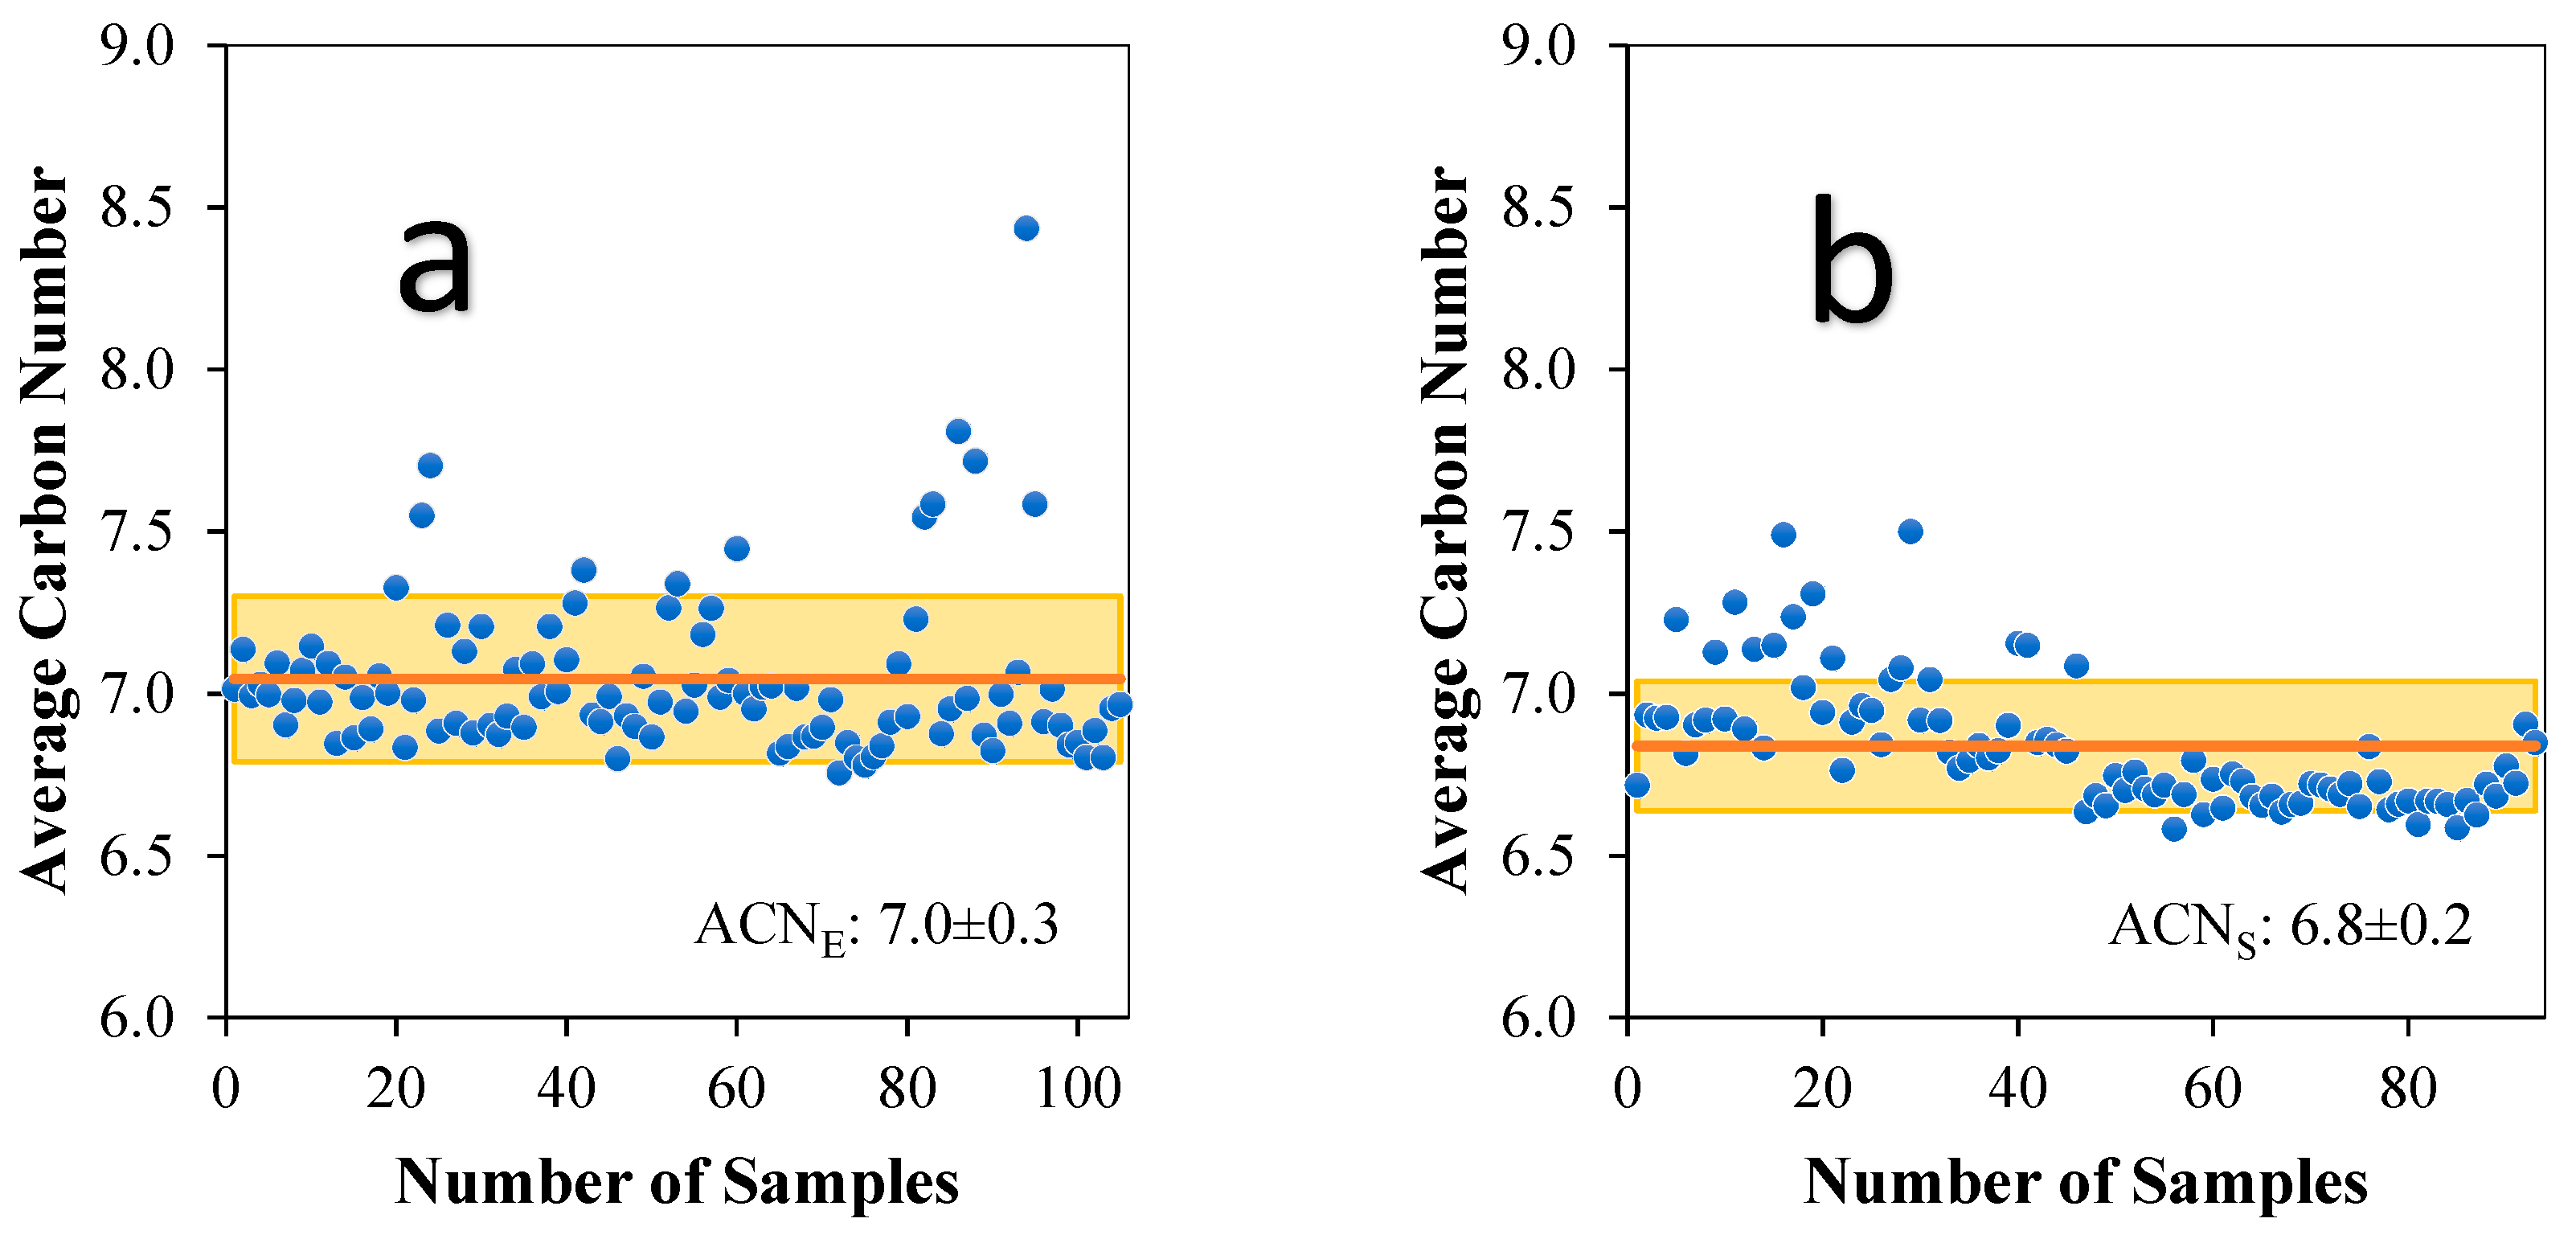
3.3. Analysis of Average Carbon Number
3.4. Statistical Analysis
4. Conclusions
Supplementary Materials
Author Contributions
Funding
Data Availability Statement
Acknowledgments
Conflicts of Interest
Appendix A

| N° | Gasoline Type | Volume (mL) | Sampler | Gas Station | Location | Coordinates | Collection Date dd/mm/yy | Collection Time | Reception Date dd/mm/yy | Reception Time |
|---|---|---|---|---|---|---|---|---|---|---|
| 1 | Extra | - | Melanie Muela | Primax | Iñaquito | 0°10′29″ S 78°29′16″ W | 07/02/22 | 15:00:00 | 07/04/22 | 7:30:00 |
| 2 | Extra | 40 | Liney Mejía | Primax | Carcelén | 0°05′30″ S 78°28′36″ W | 07/03/22 | 19:52:00 | 07/04/22 | 7:21:00 |
| 3 | Extra | 50 | Guido Acevedo | Mobil | La Magdalena | 0°14′27″ S 78°31′38″ W | 07/03/22 | 17:00:00 | 07/04/22 | 7:20:00 |
| 4 | Extra | 260 | Lizbeth Alarcón | Petroecuador | Quitumbe | 0°17′49″ S 78°33′32″ W | 07/03/22 | 16:44:00 | 07/04/22 | 7:22:00 |
| 5 | Extra | 40 | Zaid Falcón | Primax | Mariscal Sucre | 0°11′48″ S 78°29′58″ W | 07/03/22 | 12:30:00 | 07/04/22 | 7:10:00 |
| 6 | Extra | 60 | Jessica Totoy | Primax | Sangolquí | 0°21′56″ S 78°28′30″ W | 07/03/22 | 10:37:00 | 07/04/22 | 7:20:00 |
| 7 | Extra | - | Gabriela Calvache | Primax | La Mena | 0°15′24″ S 78°32′36″ W | 07/02/22 | 14:00:00 | 07/04/22 | 7:20:00 |
| 8 | Extra | 125 | Angie Avilés | Petroecuador | Posmasqui | 0°03′27″ S 78°27′18″ W | 07/03/22 | 18:05:00 | 07/04/22 | 7:20:00 |
| 9 | Extra | 250 | Karen Ponce | Petroecuador | Calderón | 0°06′30″ S 78°27′01″ W | 07/10/22 | 17:15:00 | 07/11/22 | 10:30:00 |
| 10 | Extra | - | Janina Chusquillo | Primax | Jipijapa | 0°08′38″ S 78°28′11″ W | 06/09/22 | 10:00:00 | 06/10/22 | 11:00:00 |
| 11 | Extra | 340 | Melanie Chamorro | Primax | La Magdalena | 0°14′49″ S 78°31′12″ W | 07/04/22 | 17:00:00 | 07/05/22 | 13:54:00 |
| 12 | Extra | - | Cassidy Garzón | Primax | Mariscal Sucre | 0°11′48″ S 78°29′58″ W | 07/04/22 | 11:00:00 | 07/05/22 | 14:00:00 |
| 13 | Extra | 100 | Josselyn López | Primax | Mariscal Sucre | 0°11′48″ S 78°29′58″ W | 07/03/22 | 11:00:00 | 07/05/22 | 13:50:00 |
| 14 | Extra | 110 | María Pino | Primax | Kennedy | 0°08′03″ S 78°28′26″ W | 07/04/22 | 19:00:00 | 07/05/22 | 13:50:00 |
| 15 | Extra | 50 | Rodrigo Andrade | Petroecuador | Conocoto | 0°15′12″ S 78°29′02″ W | 07/03/22 | 21:00:00 | 07/07/22 | 15:00:00 |
| 16 | Extra | 1000 | Andrea Pico | PDV | Comité del Pueblo | 0°06′39″ S 78°28′45″ W | 07/07/22 | 18:50:00 | 07/08/22 | 7:51:00 |
| 17 | Extra | 600 | Job Segovia | Masgas | Chimbacalle | 0°14′41″ S 78°31′06″ W | 07/07/22 | 7:59:00 | 07/08/22 | 7:26:00 |
| 18 | Extra | 50 | Javier Villegas | Mobil | La Magdalena | 0°14′27″ S 78°31′38″ W | 07/07/22 | 21:45:00 | 07/08/22 | 7:20:00 |
| 19 | Extra | 350 | María Gavilanes | E. S. Figueroa | Salcedo | 1°02′29″ S 78°35′08″ W | 07/05/22 | 10:35:00 | 07/07/22 | 7:23:00 |
| 20 | Extra | 200 | Alisson Clavijo | Primax | Quitumbe | 0°18′13″ S 78°32′32″ W | 07/08/22 | 16:00:00 | 07/09/22 | 7:00:00 |
| 21 | Extra | 25 | Salma Cadena | Primax | Sangolquí | 0°18′30″ S 78°26′44″ W | 06/09/22 | 15:00:00 | 06/10/22 | 10:50:00 |
| 22 | Extra | 25 | Salomé Zapata | Terpel | Cochapamba | 0°09′17″ S 78°29′49″ W | 06/09/22 | 16:20:00 | -- | -- |
| 23 | Extra | 500 | Melany Carrera | Masgas | Tumbaco | 0°12′42″ S 78°23′15″ W | 07/08/22 | 14:00:00 | 07/11/22 | 13:15:00 |
| 24 | Extra | 200 | Carlos Cadena | Primax | Sangolquí | 0°18′30″ S 78°26′44″ W | 07/08/22 | 17:30:00 | 07/11/22 | 10:01:00 |
| 25 | Extra | 220 | Laura Palacios | Petroecuador | Comité del Pueblo | 0°06′56″ S 78°28′45″ W | 07/10/22 | 17:38:00 | 07/11/22 | 9:23:00 |
| 26 | Extra | 200 | Cynthia Carvajal | Petroecuador | Quitumbe | 0°17′49″ S 78°33′32″ W | 07/09/22 | 10:00:00 | 07/11/22 | 9:00:00 |
| 27 | Extra | 100 | Samanta Ortiz | Primax | El Condado | 0°06′19″ S 78°30′00″ W | 07/10/22 | 15:30:00 | 07/11/22 | 11:00:00 |
| 28 | Extra | 100 | Dayerlin Guerrero | Primax | El Inca | 0°09′33″ S 78°28′59″ W | 07/10/22 | 12:36:00 | 07/11/22 | 7:10:00 |
| 29 | Extra | 250 | Daniel Cervantes | P&S | San Antonio | 0°00′24″ N 78°26′25″ W | 07/10/22 | 13:00:00 | 07/11/22 | 11:00:00 |
| 30 | Extra | - | Patricia Moreira | Terpel | Conocoto | 0°17′27″ S 78°27′51″ W | 07/10/22 | 16:36:00 | 07/11/22 | 10:36:00 |
| 31 | Extra | 350 | Pamela Bonilla | Petroecuador | Guamaní | 0°18′41″ S 78°32′50″ W | 07/10/22 | 12:35:00 | 07/12/22 | 11:06:00 |
| 32 | Extra | 200 | Fernanda Moreno | Primax | Iñaquito | 0°11′48″ S 78°29′35″ W | 07/10/22 | 18:20:00 | 07/11/22 | 11:05:00 |
| 33 | Extra | 100 | Cristian Sopa | Petroecuador | Guamaní | 0°20′56″ S 78°32′57″ W | 07/09/22 | 19:30:00 | 07/11/22 | 11:00:00 |
| 34 | Extra | 750 | Daniel Guerrero | Petroecuador | La Mena | 0°15′50″ S 78°33′00″ W | 07/10/22 | 14:40:00 | 07/11/22 | 8:45:00 |
| 35 | Extra | 250 | Karen Ponce | Petroecuador | Calderón | 0°06′30″ S 78°27′01″ W | 07/10/22 | 17:15:00 | 07/11/22 | 10:30:00 |
| 36 | Extra | 1000 | Katherine Chulca | Petroecuador | Calderón | 0°06′30″ S 78°27′01″ W | 07/10/22 | 21:15:00 | 07/11/22 | 11:00:00 |
| 37 | Extra | 500 | Mishell Vega | Masgas | Tumbaco | 0°12′42″ S 78°23′15″ W | 07/08/22 | 14:00:00 | 07/11/22 | 7:15:00 |
| 38 | Extra | - | Patricia Moreira | Terpel | Conocoto | 0°17′27″ S 78°27′51″ W | 07/10/22 | 16:36:00 | 07/11/22 | 10:36:00 |
| 39 | Extra | 200 | Stalin Aurea | Petroecuador | Ambato | 1°13′42″ S 78°36′16″ W | 07/08/22 | 20:00:00 | 07/11/22 | 7:00:00 |
| 40 | Extra | 300 | Gabriel Espinoza | Primax | Sangolquí | 0°20′43″ S 78°27′19″ W | 07/09/22 | 8:30:00 | 11/07/22 | 9:00:00 |
| 41 | Extra | 200 | Katherine Martínez | Terpel | La Magdalena | 0°14′58″ S 78°31′16″ W | 07/10/22 | 17:42:00 | 07/11/22 | 9:00:00 |
| 42 | Extra | 100 | Bryan Tupe | Terpel | Tambillo | 0°24′29″ S 78°32′50″ W | 07/10/22 | 20:00:00 | 07/11/22 | 11:00:00 |
| 43 | Extra | 50 | Lizeth Loachamin | Primax | Sangolquí | 0°20′43″ S 78°27′19″ W | 07/10/22 | 10:20:00 | 07/11/22 | 8:40:00 |
| 44 | Extra | 50 | Jhon Suquitana | Primax | Amaguaña | 0°20′43″ S 78°27′19″ W | 07/10/22 | 10:00:00 | 07/11/22 | 7:20:00 |
| 45 | Extra | 150 | Sandra Chango | Primax | Ambato | 1°15′00″ S 78°37′58″ W | 07/08/22 | 17:27:00 | 07/11/22 | 11:00:00 |
| 46 | Extra | - | Jhuliana Vinueza | Primax | Alangasí | 0°19′36″ S 78°23′43″ W | 07/10/22 | 10:30:00 | 07/11/22 | 8:40:00 |
| 47 | Extra | 200 | Katherine Vega | Masgas | Atuntaqui | 0°18′50″ N 78°13′26″ W | 07/10/22 | 15:00:00 | 07/10/22 | 7:20:00 |
| 48 | Extra | 250 | Robinson Yandún | P&S | Cotocollao | 0°07′16″ S 78°30′18″ W | 07/11/22 | 21:45:00 | 07/12/22 | 8:30:00 |
| 50 | Extra | 100 | Dayana Merizalde | Mobil | La Magdalena | 0°14′27″ S 78°31′38″ W | 07/10/22 | 16:07:00 | 07/11/22 | 7:00:00 |
| 51 | Extra | 50 | Lizbeth Abril | Petroecuador | Sangolquí | 0°18′11″ S 78°27′57″ W | 06/06/22 | 17:00:00 | 06/07/22 | 14:00:00 |
| 52 | Extra | 500 | Juliett Fernández | Primax | Jipijapa | 0°08′38″ S 78°28′11″ W | 07/09/22 | 12:45:00 | 07/11/22 | 10:30:00 |
| 53 | Extra | Santiago Pati | Primax | Comité del Pueblo | 0°06′02″ S 78°28′17″ W | 07/09/22 | ||||
| 54 | Extra | - | Juan Noroña | Terpel | Conocoto | 0°17′27″ S 78°27′51″ W | 07/11/22 | 5:45:00 | 07/11/22 | 13:15:00 |
| 1 | Súper | - | Melanie Muela | Primax | Iñaquito | 0°10′29″ S 78°29′16″ W | 07/02/22 | 15:00:00 | 07/04/22 | 7:30:00 |
| 2 | Súper | 40 | Liney Mejía | Primax | Carcelén | 0°05′30″ S 78°28′36″ W | 07/03/22 | 19:52:00 | 07/04/22 | 7:21:00 |
| 3 | Súper | 50 | Guido Acevedo | Mobil | La Magdalena | 0°14′27″ S 78°31′38″ W | 07/03/22 | 17:00:00 | 07/04/22 | 7:20:00 |
| 4 | Súper | 260 | Lizbeth Alarcón | Petroecuador | Quitumbe | 0°17′49″ S 78°33′32″ W | 07/03/22 | 16:44:00 | 07/04/22 | 7:22:00 |
| 5 | Súper | 40 | Zaid Falcón | Primax | Mariscal Sucre | 0°11′48″ S 78°29′58″ W | 07/03/22 | 12:30:00 | 07/04/22 | 7:10:00 |
| 6 | Súper | 25 | Mario Guilcapi | Petroecuador | Chimbacalle | 0°14′13″ S 78°30′29″ W | 06/10/22 | 10:30:00 | 06/10/22 | 10:50:00 |
| 7 | Súper | 25 | Mario Guilcapi | Primax | Chimbacalle | 0°14′49″ S 78°30′20″ W | 06/10/22 | 10:25:00 | 06/10/22 | 10:50:00 |
| 8 | Súper | - | Janina Chusquillo | Primax | Mariscal Sucre | 0°08′38″ S 78°28′11″ W | 06/09/22 | 10:00:00 | 06/10/22 | 11:00:00 |
| 9 | Súper | - | Cassidy Garzón | Primax | Mariscal Sucre | 0°11′48″ S 78°29′58″ W | 07/04/22 | 11:00:00 | 07/05/22 | 14:00:00 |
| 10 | Súper | 200 | Esteban Morales | Shell | Iñaquito | 0°11′31″ S 78°29′19″ W | 07/02/22 | 17:30:00 | 07/05/22 | 13:30:00 |
| 11 | Súper | 1000 | Andrea Pico | PDV | Comité del Pueblo | 0°06′39″ S 78°28′45″ W | 07/07/22 | 18:55:00 | 07/08/22 | 7:51:00 |
| 12 | Súper | 600 | Job Segovia | Masgas | Chimbacalle | 0°14′41″ S 78°31′06″ W | 07/07/22 | 7:59:00 | 07/08/22 | 7:26:00 |
| 13 | Súper | 50 | Javier Villegas | Mobil | La Magdalena | 0°14′27″ S 78°31′38″ W | 07/07/22 | 21:45:00 | 07/08/22 | 7:20:00 |
| 14 | Súper | 25 | Salma Cadena | Primax | Sangolquí | 0°18′30″ S 78°26′44″ W | 06/09/22 | 15:00:00 | 06/10/22 | 10:50:00 |
| 15 | Súper | 25 | Salomé Zapata | Terpel | Cochapamba | 0°09′17″ S 78°29′49″ W | 06/09/22 | 16:20:00 | ||
| 16 | Súper | 220 | Laura Palacios | Petroecuador | Comité del Pueblo | 0°06′56″ S 78°28′45″ W | 07/10/22 | 17:40:00 | 07/11/22 | 9:23:00 |
| 17 | Súper | 200 | Stalin Aurea | Petroecuador | Ambato | 1°13′42″ S 78°36′16″ W | 07/08/22 | 20:00:00 | 07/11/22 | 7:00:00 |
| 18 | Súper | 250 | Karen Ponce | Petroecuador | Calderón | 0°06′30″ S 78°27′01″ W | 07/10/22 | 17:15:00 | 07/11/22 | 10:30:00 |
| 19 | Súper | 1000 | Landy Flores | Primax | Mariscal Sucre | 0°12′00″ S 78°29′30″ W | 07/11/22 | 8:45:00 | 07/11/22 | 9:15:00 |
| 20 | Súper | 5 | Mateo Terán | Masgas | Iñaquito | 0°11′22″ S 78°28′52″ W | 07/10/22 | 12:03:00 | 07/11/22 | 9:00:00 |
| 21 | Súper | 50 | Lizbeth Abril | Petroecuador | Sangolquí | 0°18′11″ S 78°27′57″ W | 06/06/22 | 17:00:00 | 06/07/22 | 14:00:00 |
| 22 | Súper | - | Juan Noroña | Terpel | Conocoto | 0°17′27″ S 78°27′51″ W | 07/11/22 | 5:45:00 | 07/11/22 | 13:15:00 |
| 23 | Súper | 150 | Luis Cueva | Petroecuador | Sangolquí | 0°19′29″ S 78°26′26″ W | 07/11/22 | 6:30:00 | 07/11/22 | 11:10:00 |
References
- Pérez Darquea, D.G. Estudio de Emisiones Contaminantes Utilizando Combustibles Locales. INNOVA Res. J. 2018, 3, 23–34. [Google Scholar] [CrossRef]
- Höök, M.; Hirsch, R.; Aleklett, K. Giant Oil Field Decline Rates and Their Influence on World Oil Production. Energy Policy 2009, 37, 2262–2272. [Google Scholar] [CrossRef]
- Vempatapu, B.P.; Kanaujia, P.K. Monitoring Petroleum Fuel Adulteration: A Review of Analytical Methods. TrAC Trends Anal. Chem. 2017, 92, 1–11. [Google Scholar] [CrossRef]
- O’Neil, M.J.; Heckelman, P.E.; Roman, K.J. (Eds.) The Merck Index: An Encyclopedia of Chemicals, Drugs, and Biologicals, 14th ed.; Merck and Co., Inc.: Whitehouse Station, NJ, USA, 2007. [Google Scholar]
- Lois, E.; Keating, E.L.; Gupta, A.K. Fuels. In Encyclopedia of Physical Science and Technology; Meyers, R.A., Ed.; Elsevier: Berkeley, CA, USA, 2003; pp. 275–314. [Google Scholar]
- Jones, D.S.J.S. Quality Control of Products in Petroleum Refining. In Handbook of Petroleum Processing; Springer: Dordrecht, The Netherlands, 2006; pp. 705–737. [Google Scholar]
- Kaltschmitt, T.; Deutschmann, O. Fuel Processing for Fuel Cells. In Advances in Chemical Engineering (Volume 41); Sundmacher, K., Ed.; Academic Press: Cambridge, MA, USA, 2012; pp. 1–64. [Google Scholar]
- Siddiqui, M.A.B.; Aitani, A.M. FCC Gasoline Sulfur Reduction by Additives: A Review. Pet. Sci. Technol. 2007, 25, 299–313. [Google Scholar] [CrossRef]
- Salazar Almeida, A.P. Cuantificación de Los Aditivos BTEX Presentes En La Gasolina Distribuída En El Distrito Metropolitano de Quito y Análisis Ingenieril Del Trabajo de La Refinería; Universidad San Francisco de Quito: Quito, Ecuador, 2015. [Google Scholar]
- Speight, J.G. Fouling During Catalytic Cracking. In Fouling in Refineries; Elsevier: Amsterdam, The Netherlands, 2015; pp. 271–302. [Google Scholar]
- Terneus Páez, C.F.; Cabrera Mera, A.G.; Grandes Villamarín, R.D. Impact Analysis of Migration from Súper Gasoline to Others of Lower Octane Number in Ecuador. In Recent Advances in Electrical Engineering, Electronics and Energy; Botto Tobar, M., Cruz, H., Díaz Cadena, A., Eds.; Lecture Notes in Electrical Engineering; Springer International Publishing: Cham, Germany, 2021; Volume 763, pp. 95–108. ISBN 978-3-030-72211-1. [Google Scholar]
- Antamba Guasgua, J.F.; Reyes Campaña, G.G.; Granja Paredes, M.E. Estudio Comparativo de Gases Contaminantes En Un Vehículo M1, Utilizando Gasolina de La Comunidad Andina. Enfoque UTE 2016, 7, 110–119. [Google Scholar] [CrossRef]
- Chen, Y.; Kasseris, E.; Heywood, J.; Han, D.; Kim, J.; Lee, K.; Kang, H.; Zhou, J.; Mizuno, K.; Seitz, S.; et al. Benefits of Octane-On-Demand in an E10-Gasoline Engine Vehicle Using an On-Board Fuel Separator; No. 2022-01-0424; SAE: Warrendale, PA, USA, 2022. [Google Scholar] [CrossRef]
- Druet Rodríguez, F.A.; Vera Castro, P.V. Evaluación Técnica y Optimización Del Uso de Aditivos Comerciales Para Elevar El Octanaje de Las Gasolinas En El Ecuador; Escuela Superior Politécnica del Litoral: Guayaquil, Ecuador, 2017. [Google Scholar]
- Fisher, I.P. Effect of Feedstock Variability on Catalytic Cracking Yields. Appl. Catal. 1990, 65, 189–210. [Google Scholar] [CrossRef]
- MacLean, H.L.; Lave, L.B. Evaluating Automobile Fuel/Propulsion System Technologies. Prog. Energy Combust. Sci. 2003, 29, 1–69. [Google Scholar] [CrossRef]
- Maharjan, S.; Elbaz, A.M.; Roberts, W.L. Study of the Effect of Research Octane Number on the Auto-Ignition of Lubricant Oil Surrogates (n-Hexadecane). ACS Omega 2022, 7, 2766–2773. [Google Scholar] [CrossRef]
- Ghosh, P.; Hickey, K.J.; Jaffe, S.B. Development of a Detailed Gasoline Composition-Based Octane Model. Ind. Eng. Chem. Res. 2006, 45, 337–345. [Google Scholar] [CrossRef]
- Fahim, M.A.; Alsahhaf, T.A.; Elkilani, A. Refinery Feedstocks and Products. In Fundamentals of Petroleum Refining; Elsevier: Amsterdam, The Netherlands, 2010; pp. 11–31. [Google Scholar]
- Sinche Arias, D.F. Caracterización Físico-Química de Naftas Producidas En La Refinería Estatal de Esmeraldas, Mediante Cromatografía de Gases; Universidad Central del Ecuador: Quito, Ecuador, 2012. [Google Scholar]
- Aitani, A.M. Oil Refining and Products. In Encyclopedia of Energy; Elsevier: Amsterdam, The Netherlands, 2004; pp. 715–729. [Google Scholar]
- Ugena, L.; Moncayo, S.; Manzoor, S.; Rosales, D.; Cáceres, J.O. Identification and Discrimination of Brands of Fuels by Gas Chromatography and Neural Networks Algorithm in Forensic Research. J. Anal. Methods Chem. 2016, 2016, 1–7. [Google Scholar] [CrossRef]
- Mueller, C.J.; Cannella, W.J.; Kalghatgi, G.T. Fuels for Engines and the Impact of Fuel Composition on Engine Performance. In Encyclopedia of Automotive Engineering; Wiley: Hoboken, NJ, USA, 2014; pp. 1–27. [Google Scholar]
- Wang, Z.; Yang, C.; Yang, Z.; Brown, C.E.; Hollebone, B.P.; Stout, S.A. Petroleum Biomarker Fingerprinting for Oil Spill Characterization and Source Identification. In Standard Handbook Oil Spill Environmental Forensics; Stout, S.A., Wang, Z., Eds.; Elsevier: London, UK, 2016; pp. 131–254. [Google Scholar]
- Kuppusamy, S.; Maddela, N.R.; Megharaj, M.; Venkateswarlu, K. An Overview of Total Petroleum Hydrocarbons. In Total Petroleum Hydrocarbons; Springer International Publishing: Cham, Switzerland, 2020; pp. 1–27. [Google Scholar]
- Demirbas, A.; Balubaid, M.A.; Basahel, A.M.; Ahmad, W.; Sheikh, M.H. Octane Rating of Gasoline and Octane Booster Additives. Pet. Sci. Technol. 2015, 33, 1190–1197. [Google Scholar] [CrossRef]
- Jalili, V.; Amin Rashidi, M.; Mehrifar, Y.; Koozekonan, A.G.; Zendehdel, R. A Comprehensive Review on Microextraction Techniques for Sampling and Analysis of Fuel Ether Oxygenates in Different Matrices. Microchem. J. 2021, 168, 106437. [Google Scholar] [CrossRef]
- Sarıkoç, S. Fuels of the Diesel-Gasoline Engines and Their Properties. In Diesel and Gasoline Engines; Viskup, R., Ed.; IntechOpen: London, UK, 2020; pp. 1–16. ISBN 978-1-78985-447-3. [Google Scholar]
- Hajbabaei, M.; Karavalakis, G.; Miller, J.W.; Villela, M.; Xu, K.H.; Durbin, T.D. Impact of Olefin Content on Criteria and Toxic Emissions from Modern Gasoline Vehicles. Fuel 2013, 107, 671–679. [Google Scholar] [CrossRef]
- De Paulo, J.M.; Barros, J.E.M.; Barbeira, P.J.S. Differentiation of Gasoline Samples Using Flame Emission Spectroscopy and Partial Least Squares Discriminate Analysis. Energy Fuels 2014, 28, 4355–4361. [Google Scholar] [CrossRef]
- Boot, M.D.; Tian, M.; Hensen, E.J.M.; Mani Sarathy, S. Impact of Fuel Molecular Structure on Auto-Ignition Behavior—Design Rules for Future High Performance Gasolines. Prog. Energy Combust. Sci. 2017, 60, 1–25. [Google Scholar] [CrossRef]
- Schifter, I.; Díaz, L.; Sánchez-Reyna, G.; González-Macías, C.; González, U.; Rodríguez, R. Influence of Gasoline Olefin and Aromatic Content on Exhaust Emissions of 15% Ethanol Blends. Fuel 2020, 265, 116950. [Google Scholar] [CrossRef]
- Hochhauser, A.M. Review of Prior Studies of Fuel Effects on Vehicle Emissions. SAE Int. J. Fuels Lubr. 2009, 2, 541–567. [Google Scholar] [CrossRef]
- González Dota, E.V. Detección de Plomo En Gasolina Ecopaís, Extra, Súper y Diesel Expendida En Ecuador; Universidad de Guayaquil: Guayaquil, Ecuador, 2022. [Google Scholar]
- Amaral, L.V.; Santos, N.D.S.A.; Roso, V.R.; Sebastião, R.d.C.d.O.; Pujatti, F.J.P. Effects of Gasoline Composition on Engine Performance, Exhaust Gases and Operational Costs. Renew. Sustain. Energy Rev. 2021, 135, 110196. [Google Scholar] [CrossRef]
- Chen, L.; Zhang, Z.; Gong, W.; Liang, Z. Quantifying the Effects of Fuel Compositions on GDI-Derived Particle Emissions Using the Optimal Mixture Design of Experiments. Fuel 2015, 154, 252–260. [Google Scholar] [CrossRef]
- Karavalakis, G.; Short, D.; Vu, D.; Russell, R.; Hajbabaei, M.; Asa-Awuku, A.; Durbin, T.D. Evaluating the Effects of Aromatics Content in Gasoline on Gaseous and Particulate Matter Emissions from SI-PFI and SIDI Vehicles. Environ. Sci. Technol. 2015, 49, 7021–7031. [Google Scholar] [CrossRef]
- Wang, Y.; Zheng, R.; Qin, Y.; Peng, J.; Li, M.; Lei, J.; Wu, Y.; Hu, M.; Shuai, S. The Impact of Fuel Compositions on the Particulate Emissions of Direct Injection Gasoline Engine. Fuel 2016, 166, 543–552. [Google Scholar] [CrossRef]
- He, Z.; Zhang, L.; Liu, G.; Qian, Y.; Lu, X. Evaluating the Effects of Olefin Components in Gasoline on GDI Engine Combustion and Emissions. Fuel 2021, 291, 120131. [Google Scholar] [CrossRef]
- Biernat, K. Criteria for the Quality Assessment of Engine Fuels in Storage and Operating Conditions. In Storage Stability of Fuels; InTech: London, UK, 2015. [Google Scholar]
- Ferreiro-González, M.; Ayuso, J.; Álvarez, J.A.; Palma, M.; Barroso, C.G. New Headspace-Mass Spectrometry Method for the Discrimination of Commercial Gasoline Samples with Different Research Octane Numbers. Energy Fuels 2014, 28, 6249–6254. [Google Scholar] [CrossRef]
- ASTM D2699-21; Standard Test Method for Research Octane Number of Spark Ignition Engine Fuel. ASTM International: West Conshohocken, PA, USA, 2021.
- Ferreiro-González, M.; Ayuso, J.; Álvarez, J.A.; Palma, M.; Barroso, C.G. Gasoline Analysis by Headspace Mass Spectrometry and near Infrared Spectroscopy. Fuel 2015, 153, 402–407. [Google Scholar] [CrossRef]
- Abdul-Manan, A.F.N.; Kalghatgi, G.; Babiker, H. Exploring Alternative Octane Specification Methods for Improved Gasoline Knock Resistance in Spark-Ignition Engines. Front. Mech. Eng. 2018, 4, 1–13. [Google Scholar] [CrossRef]
- Myers, M.E.; Stollsteimer, J.; Wims, A.M. Determination of Gasoline Octane Numbers from Chemical Composition. Anal. Chem. 1975, 47, 2301–2304. [Google Scholar] [CrossRef]
- Dutta, S.; Madav, V.; Joshi, G.; Naik, N.; Kumar, S. Directional Synthesis of Aviation-, Diesel-, and Gasoline Range Hydrocarbon Fuels by Catalytic Transformations of Biomass Components: An Overview. Fuel 2023, 347, 128437. [Google Scholar] [CrossRef]
- Cerri, T.; D’Errico, G.; Onorati, A. Experimental Investigations on High Octane Number Gasoline Formulations for Internal Combustion Engines. Fuel 2013, 111, 305–315. [Google Scholar] [CrossRef]
- ASTM D2699; Standard Test Method for Research Octane Number of Spark-Ignition Engine Fuel 1. American Society for Testing and Materials: West Conshohocken, PA, USA, 2023; pp. 1–48.
- Abou El Leil, I.M.; Mezughi, K.M.; Altayeb, S.A.; Abodera, G.A. Prediction of Octane Numbers of Petroleum Fractions Using Approaches Correlations. Int. Sci. Technol. J. 2022, 30, 1–23. [Google Scholar]
- Dias, T.; Oliveira, R.; Saraiva, P.; Reis, M.S. Predictive Analytics in the Petrochemical Industry: Research Octane Number (RON) Forecasting and Analysis in an Industrial Catalytic Reforming Unit. Comput. Chem. Eng. 2020, 139, 106912. [Google Scholar] [CrossRef]
- Muller, A. New Method Produces Accurate Octane Blending Values. Oil Gas J. 1992, 90, 30–1388. [Google Scholar]
- Mendes, G.; Aleme, H.G.; Barbeira, P.J.S. Determination of Octane Numbers in Gasoline by Distillation Curves and Partial Least Squares Regression. Fuel 2012, 97, 131–136. [Google Scholar] [CrossRef]
- Issa, H.M. Prediction of Octane Numbers for Commercial Gasoline Using Distillation Curves: A Comparative Regression Analysis between Principal Component and Partial Least Squares Methods. Pet. Sci. Technol. 2024, 42, 1233–1249. [Google Scholar] [CrossRef]
- Van Leeuwen, J.A.; Jonker, R.J.; Gill, R. Octane Number Prediction Based on Gas Chromatographic Analysis with Non-Linear Regression Techniques. Chemom. Intell. Lab. Syst. 1994, 25, 325–340. [Google Scholar] [CrossRef]
- Nikolaou, N.; Papadopoulos, C.E.; Gaglias, I.A.; Pitarakis, K.G. A New Non-Linear Calculation Method of Isomerisation Gasoline Research Octane Number Based on Gas Chromatographic Data. Fuel 2004, 83, 517–523. [Google Scholar] [CrossRef]
- Metwally, M.M. Approach to Accurate Octane Number Calculation for Gasoline Blending. Acad. Res. Community Publ. 2019, 2, 457–464. [Google Scholar] [CrossRef]
- Rusin, M.H.; Chung, H.S.; Marshall, J.F. A “Transformation” Method for Calculating the Research and Motor Octane Numbers of Gasoline Blends. Ind. Eng. Chem. Fundam. 1981, 20, 195–204. [Google Scholar] [CrossRef]
- Schoen, W.F.; Mrstik, A.V. Calculating Gasoline Blend Octane Ratings. Ind. Eng. Chem. 1955, 47, 1740–1742. [Google Scholar] [CrossRef]
- Maylin, M.V.; Kirgina, M.V.; Sviridova, E.V.; Sakhnevitch, B.V.; Ivanchina, E.D. Calculation of Gasoline Octane Numbers Taking into Account the Reaction Interaction of Blend Components. Procedia Chem. 2014, 10, 477–484. [Google Scholar] [CrossRef]
- Hay, G.; Loria, H.; Satyro, M.A. Thermodynamic Modeling and Process Simulation through PIONA Characterization. Energy Fuels 2013, 27, 3578–3584. [Google Scholar] [CrossRef]
- Oduola, M.K.; Iyaomolere, A.I. Development of Model Equations for Predicting Gasoline Blending Properties. Am. J. Chem. Eng. 2015, 3, 9–17. [Google Scholar] [CrossRef]
- Smolenskii, E.A.; Ryzhov, A.N.; Bavykin, V.M.; Myshenkova, T.N.; Lapidus, A.L. Octane Numbers (ONs) of Hydrocarbons: A QSPR Study Using Optimal Topological Indices for the Topological Equivalents of the ONs. Russ. Chem. Bull. 2007, 56, 1681–1693. [Google Scholar] [CrossRef]
- Al-Fahemi, J.H.; Albis, N.A.; Gad, E.A.M. QSPR Models for Octane Number Prediction. J. Theor. Chem. 2014, 2014, 520652. [Google Scholar] [CrossRef]
- Ahmed, A.; Goteng, G.; Shankar, V.S.B.; Al-Qurashi, K.; Roberts, W.L.; Sarathy, S.M. A Computational Methodology for Formulating Gasoline Surrogate Fuels with Accurate Physical and Chemical Kinetic Properties. Fuel 2015, 143, 290–300. [Google Scholar] [CrossRef]
- Chuzlov, V.A.; Nazarova, G.Y.; Dolganov, I.M.; Dolganova, I.O.; Seitenova, G.Z. Calculation of the Optimal Blending Component Ratio by Using Mathematical Modeling Method. Pet. Sci. Technol. 2019, 37, 1170–1175. [Google Scholar] [CrossRef]
- Tipler, S.; D’Alessio, G.; Van Haute, Q.; Parente, A.; Contino, F.; Coussement, A. Predicting Octane Numbers Relying on Principal Component Analysis and Artificial Neural Network. Comput. Chem. Eng. 2022, 161, 107784. [Google Scholar] [CrossRef]
- Abdul Jameel, A.G.; Van Oudenhoven, V.; Emwas, A.-H.; Sarathy, S.M. Predicting Octane Number Using Nuclear Magnetic Resonance Spectroscopy and Artificial Neural Networks. Energy Fuels 2018, 32, 6309–6329. [Google Scholar] [CrossRef]
- AL-Sayd Toohi, H.; Ahmed, Z. Developing a New Method for Calculating the Octane Number Based on Quantum Mechanics Methods. Coll. Basic Educ. Res. J. 2023, 19, 835–843. [Google Scholar] [CrossRef]
- Chen, X.; Shi, X.; Tong, C.; Li, Y. Prediction of Octane Number of Gasoline Based on Improved Extreme Learning Machine. In Chinese Control Conference (CCC), Proceedings of the 2018 37th Chinese Control Conference (CCC), Wuhan, China, 25–27 July 2018; IEEE: Piscataway, NJ, USA; pp. 8055–8059.
- Benavides, A.; Zapata, C.; Benjumea, P.; Franco, C.A.; Cortés, F.B.; Ruiz, M.A. Predicting Octane Number of Petroleum-Derived Gasoline Fuels from MIR Spectra, GC-MS, and Routine Test Data. Processes 2023, 11, 1437. [Google Scholar] [CrossRef]
- Wallington, T.J.; Kaiser, E.W.; Farrell, J.T. Automotive Fuels and Internal Combustion Engines: A Chemical Perspective. Chem. Soc. Rev. 2006, 35, 335. [Google Scholar] [CrossRef]
- Schlichting, S.; Methling, T.; Oßwald, P.; Zinsmeister, J.; Riedel, U.; Köhler, M. Numerical Prediction of Research Octane Numbers via a Quasi-Dimensional Two-Zone Cylinder Model. Appl. Energy Combust. Sci. 2022, 11, 100079. [Google Scholar] [CrossRef]
- Instituto Ecuatoriano de Normalización (INEN). Productos Derivados Del Petróleo. Gasolina. Requisitos; Instituto Ecuatoriano de Normalización (INEN): Quito, Ecuador, 2021; p. 5. [Google Scholar]
- Arias-Andramunio, L.P.; Otero-Potosí, S.A.; Fraga-Portilla, J.A. Comportamiento Del Rendimiento y El Nivel de Contaminación Entre La Gasolina Súper y Ecopaís. Polo Del Conoc. 2022, 7, 2254–2269. [Google Scholar] [CrossRef]
- Rojas-Reinoso, V.; Alvarez-Loor, J.; Zambrano-Becerra, H.; Soriano, J.A. Comparative Study of Gasoline Fuel Mixture to Reduce Emissions in the Metropolitan District. Sustainability 2023, 15, 2921. [Google Scholar] [CrossRef]
- Morquecho Andrade, F.L. Análisis de Rendimiento y Costo de Los Combustibles Ecopaís y Súper. INNOVA Res. J. 2018, 3, 135–149. [Google Scholar] [CrossRef]
- Castillo Rivera, E.O.; Mora Díaz, L.B. Análisis, Estudio y Modelamiento Matemático Para La Caracterización Energética de Las Gasolinas Comerciales En Función de Los Parámetros de Calidad Referentes a La Norma ASTM; Universidad de las Fuerzas Armadas: Sangolquí, Ecuador, 2019. [Google Scholar]
- Rocha-Hoyos, J.; Llanes-Cedeño, E.A.; Andrade-Villarreal, J.; Caiza-Quishpe, L.; Leguísamo-Milla, J. Incidencia Del Uso de Gasolina Extra y Mezcla Al 5 % Con Etanol Anhidro En Los Microfiltros de Los Inyectores Multipunto. Enfoque UTE 2019, 10, 28–38. [Google Scholar] [CrossRef]
- Suppajariyawat, P.; de Andrade, A.F.B.; Elie, M.; Baron, M.; Gonzalez-Rodriguez, J. The Use Of Chemical Composition And Additives To Classify Petrol And Diesel Using Gas Chromatography–Mass Spectrometry And Chemometric Analysis: A Uk Study. Open Chem. 2019, 17, 183–197. [Google Scholar] [CrossRef]
- Sandercock, P.M.; Du Pasquier, E. Chemical Fingerprinting of Unevaporated Automotive Gasoline Samples. Forensic Sci. Int. 2003, 134, 1–10. [Google Scholar] [CrossRef]
- El Naggar, A.Y.; Elkhateeb, A.; Altalhi, T.A.; El Nady, M.M.; Alhadhrami, A.; Ebiad, M.A.; Salem, A.A.; Elhardallou, S.B. Hydrocarbon Compositions and Physicochemical Characteristics for the Determination of Gasoline Quality: An Implication from Gas Chromatographic Fingerprints. Energy Sources Part A Recover. Util. Environ. Eff. 2017, 39, 1694–1699. [Google Scholar] [CrossRef]
- Tang, G.; Sun, J.; Wu, F.; Sun, Y.; Zhu, X.; Geng, Y.; Wang, Y. Organic Composition of Gasoline and Its Potential Effects on Air Pollution in North China. Sci. China Chem. 2015, 58, 1416–1425. [Google Scholar] [CrossRef]
- Ritter, S. Chemical & Engineering News. 2005, p. 37. Available online: https://pubsapp.acs.org/cen/whatstuff/stuff/8308gasoline.html (accessed on 10 August 2024).
- Ré-Poppi, N.; Almeida, F.F.P.; Cardoso, C.A.L.; Raposo, J.L.; Viana, L.H.; Silva, T.Q.; Souza, J.L.C.; Ferreira, V.S. Screening Analysis of Type C Brazilian Gasoline by Gas Chromatography—Flame Ionization Detector. Fuel 2009, 88, 418–423. [Google Scholar] [CrossRef]
- Araujo, A. Arrancó La FCC de La Refinería de Esmeraldas. El Comercio, 1 October 2015; 1. [Google Scholar]
- Taco-Vasquez, S.; Holtzapple, M.T. Conversion of Acetone and Mixed Ketones to Hydrocarbons Using HZSM-5 Catalyst in the Carboxylate Platform. PLoS ONE 2022, 17, e0277184. [Google Scholar] [CrossRef]
- Mul, P.; Rommens, H.C.W. Alkane Sulfonic Acid or Sulfonate Composition and Use Thereof in Enhanced Oil Recovery. European Patent EP2 995 670A1, 10 September 2015. [Google Scholar]
- Speight, J.G. The Chemistry and Technology of Petroleum, 4th ed.; CRC Press: Boca Raton, FL, USA, 2006; ISBN 9780429118494. [Google Scholar]
- Berkowitz, N. Fossil Hydrocarbons; Elsevier: San Diego, CA, USA, 1997; ISBN 9780120910908. [Google Scholar]
- Kapur, G.S.; Singh, A.P.; Sarpal, A.S. Determination of Aromatics and Naphthenes in Straight Run Gasoline by 1H NMR Spectroscopy. Part, I. Fuel 2000, 79, 1023–1029. [Google Scholar] [CrossRef]
- Thomas, V.M. The Elimination of Lead in Gasoline. Annu. Rev. Energy Environ. 1995, 20, 301–324. [Google Scholar] [CrossRef]
- Simanzhenkov, V.; Idem, R. Crude Oil Chemistry, 1st ed.; CRC Press: Boca Raton, FL, USA, 2003; ISBN 9780429214998. [Google Scholar]
- Dell, R.M.; Moseley, P.T.; Rand, D.A.J. Development of Road Vehicles with Internal-Combustion Engines. In Towards Sustainable Road Transport; Elsevier: Oxford, UK, 2014; pp. 109–156. [Google Scholar]
- Guharoy Sarkar, C. Tetraethyllead (TEL) in Gasoline as a Case of Contentious Science and Delayed Regulation: A Short Review. Orient. J. Chem. 2020, 36, 86–92. [Google Scholar] [CrossRef]
- Rocha-Hoyos, J.C.; Tipanluisa, L.E.; Zambrano, V.D.; Portilla, Á.A. Estudio de Un Motor a Gasolina En Condiciones de Altura Con Mezclas de Aditivo Orgánico En El Combustible. Inf. Tecnol. 2018, 29, 325–334. [Google Scholar] [CrossRef]
- Shedid Ali, N. The Effect of Compositions (PIONA) on the Octane Numbers of Environmental Gasolines of Reformate, Isomerate and Hydrocracked Naphtha Blends by Using GC. Int. J. Oil Gas Coal Eng. 2017, 5, 167. [Google Scholar] [CrossRef]
- Nadim, F.; Zack, P.; Hoag, G.E.; Liu, S. United States Experience with Gasoline Additives. Energy Policy 2001, 29, 1–5. [Google Scholar] [CrossRef]
- Health Effects Institute. The Potential Health Effects of Oxygenates Added to Gasoline. A Review of the Current Literature; Health Effects Institute: Cambridge, MA, USA, 1995. [Google Scholar]
- Caprino, L.; Togna, G.I. Potential Health Effects of Gasoline and Its Constituents: A Review of Current Literature (1990–1997) on Toxicological Data. Environ. Health Perspect. 1998, 106, 115. [Google Scholar] [CrossRef]
- Koehl, W.J.; Benson, J.D.; Burns, V.; Gorse, R.A.; Hochhauser, A.M.; Reuter, R.M. Effects of Gasoline Composition and Properties on Vehicle Emissions: A Review of Prior Studies—Auto/Oil Air Quality Improvement Research Program. In Proceedings of the International Fuels & Lubricants Meeting & Exposition, San Fracisco, CA, USA, 1 October 1991; Volume 100, pp. 715–747. [Google Scholar]
- Lin, M.; Zhang, X.; Wen, M.; Zhang, C.; Kong, X.; Jin, Z.; Zheng, Z.; Liu, H. Effects of Unconventional Additives in Gasoline on the Performance of a Vehicle. Energies 2022, 15, 1605. [Google Scholar] [CrossRef]
- Lin, Y.-C.; Jhang, S.-R.; Lin, S.-L.; Chen, K.-S. Comparative Effect of Fuel Ethanol Content on Regulated and Unregulated Emissions from Old Model Vehicles: An Assessment and Policy Implications. Atmos. Pollut. Res. 2021, 12, 66–75. [Google Scholar] [CrossRef]
- Karimi Abiyazani, N.; Pirouzfar, V.; Su, C.-H. Enhancing Engine Power and Torque and Reducing Exhaust Emissions of Blended Fuels Derived from Gasoline-Propanol-Nano Particles. Energy 2022, 241, 122924. [Google Scholar] [CrossRef]
- Elfasakhany, A. Experimental Study of Dual N-Butanol and Iso-Butanol Additives on Spark-Ignition Engine Performance and Emissions. Fuel 2016, 163, 166–174. [Google Scholar] [CrossRef]
- Ancillotti, F.; Fattore, V. Oxygenate Fuels: Market Expansion and Catalytic Aspect of Synthesis. Fuel Process. Technol. 1998, 57, 163–194. [Google Scholar] [CrossRef]
- Reddy Saragada, D.B.; Danaiah, P.; Dattu, V.S.N. Impact of ETBE Proportions on RCCI Engine to Analyse Performance and Emission Characteristics. Mater. Today Proc. 2022, 62, 6740–6748. [Google Scholar] [CrossRef]
- Jesu Godwin, D.; Edwin Geo, V.; Thiyagarajan, S.; Leenus Jesu Martin, M.; Maiyalagan, T.; Saravanan, C.G.; Aloui, F. Effect of Hydroxyl (OH) Group Position in Alcohol on Performance, Emission and Combustion Characteristics of SI Engine. Energy Convers. Manag. 2019, 189, 195–201. [Google Scholar] [CrossRef]
- Zhang, X.; Zhang, S.; Zhao, Y.; Liu, J.; Kong, X.; Zhang, S.; Wen, M.; Liu, H. Effects of Different Additives on Physicochemical Properties of Gasoline and Vehicle Performance. Fuel Process. Technol. 2023, 242, 107668. [Google Scholar] [CrossRef]
- Perdih, A.; Perdih, F. Chemical Interpretation of Octane Number. Acta Chim. Slov. 2006, 53, 306–315. [Google Scholar]
- Speight, J.G. Handbook of Petroleum Product Analysis, 2nd ed.; John Wiley & Sons, Inc.: Hoboken, NJ, USA, 2002; ISBN 9781118369265. [Google Scholar]
- Rankovic, N.; Bourhis, G.; Loos, M.; Dauphin, R. Understanding Octane Number Evolution for Enabling Alternative Low RON Refinery Streams and Octane Boosters as Transportation Fuels. Fuel 2015, 150, 41–47. [Google Scholar] [CrossRef]
- Santana Romo, F.M.; Basantes Moreano, L.F.; Trujillo Sánchez, S.F.; de Los Ángeles Delgado Montenegro, I.; Moncayo Espín, C.R. Chemical Approach “Structure-Conformation” of Regular Gasoline in the Ecuadorian Fuel Market. Rev. Investig. Talent. 2024, 11, 64–78. [Google Scholar] [CrossRef]
- Szybist, J.P.; Splitter, D.A. Understanding Chemistry-Specific Fuel Differences at a Constant RON in a Boosted SI Engine. Fuel 2018, 217, 370–381. [Google Scholar] [CrossRef]
- Bawase, M.A.; Reve, S.D.; Shete, S.V.; Saraf, M.R. Carbon Number Distribution by Gas Chromatography for Identification of Outlying Diesel Sample. J. AdMet Päper 2012, 3, 1–7. [Google Scholar]
- Altin, O.; Eser, S. Carbon Deposit Formation from Thermal Stressing of Petroleum Fuels. ACS Div. Fuel Chem. Prepr. 2004, 49, 764–766. [Google Scholar]
- Pitz, W.J.; Cernansky, N.P.; Dryer, F.L.; Egolfopoulos, F.N.; Farrell, J.T.; Friend, D.G.; Pitsch, H. Development of an Experimental Database and Chemical Kinetic Models for Surrogate Gasoline Fuels. In Proceedings of the SAE World Congress & Exhibition, Ann Arbor, MI, USA, 16–19 April 2007; SAE Technical Papers Series. pp. 195–216. [Google Scholar]
- Castillo, J.; Guzmán-Beckmann, L.; Escola, B.; Reyes, E. Influencia de Las Condiciones de Almacenamiento En La Presión de Vapor Reid, Formación de Gomas y El Número de Octano Research de La Gasolina. Rev. Politécnica 2023, 52, 63–72. [Google Scholar] [CrossRef]


| Group | Compound Class | Gasoline Composition (%) | ||
|---|---|---|---|---|
| [7] | [24] | [25] | ||
| Saturates | 50–60 | |||
| Alkanes | 4–7 | 45–55 | 4–8 | |
| Isoalkanes | 25–40 | 25–40 | ||
| Cyclo-alkanes | 6–16 | ~5 | 3–7 | |
| Olefins | 6–16 | 5–10 | 2–5 (30 *) | |
| Cicloalkenes | 1–4 | |||
| Aromatics | 20–50 | 25–40 | 20–50 | |
| BTEX | 15–35 | |||
| PAHs | ||||
| Sulfur | <0.05 | |||
| Metals (ppm) | ||||
| Country | Saudi Arabia [81] 1 | China [82] 2 | Brazil [84] 1 | ||||
|---|---|---|---|---|---|---|---|
| RON | 91 | 95 | 92 | 93 | 95 | 97 | N/A |
| Hydrocarbon Group | Volume Percent of Total Hydrocarbons per Group Type (% v/v) | ||||||
| Paraffins | 25.32 | 29.22 | 50.20 4 | 42.40 4 | 37.40 4 | 35.80 4 | 8.21 |
| Isoparaffins | 26.74 | 27.96 | 16.08 | ||||
| Olefins | 1.48 | 1.44 | 9.00 | 12.50 | 12.40 | 15.00 | 18.48 |
| Naphthenes | 2.96 | 4.10 | N/A | N/A | N/A | N/A | 9.64 |
| Aromatics | 29.09 | 29.06 | 31.90 | 37.00 | 41.40 | 40.90 | 15.87 |
| Oxygenates | N/A 3 | N/A | N/A | N/A | N/A | N/A | 26.75 |
| MTBE | N/A | N/A | 4.30 | 4.60 | 1.80 | 2.90 | N/A |
| Aniline | N/A | N/A | 0.28 | 0.26 | 0.24 | 0.60 | N/A |
| Total C14 | 3.95 | 2.04 | N/A | N/A | N/A | N/A | N/A |
| Others | N/A | N/A | 8.90 | 8.10 | 8.90 | 8.30 | N/A |
| Unknowns | 10.45 | 6.17 | N/A | N/A | N/A | N/A | N/A |
| N° Sample | Extra Gasoline | Súper Gasoline |
|---|---|---|
| 1 | 85.5 | 93.5 |
| 2 | 85.7 | 93.0 |
| 3 | 85.9 | 90.8 |
| Mean ± Standard Deviation | 85.7 ± 0.2 | 92.4 ± 1.4 |
| Type of Variable | p-Value Comparing Extra Gasoline and Súper Gasoline | Type of Variable | p-Value Comparing Extra Gasoline and Súper Gasoline |
|---|---|---|---|
| Molar % of paraffins | 0.18 MW 0.32 KS | ACN of paraffins | 1.26 × 10⁻³ MW 1.05 × 10⁻⁴ KS |
| Molar % of Isoparaffins | 0.00 MW 0.00 KS | ACN of Isoparaffins | 0.27 MW 0.02 KS |
| Molar % of Linear Olefins | 1.47 × 10⁻⁵ MW 2.84 × 10⁻⁵ KS | ACN of Linear Olefins | 0.26 MW 1.84 × 10⁻⁵ KS |
| Molar % of Branched Olefins | 3.82 × 10⁻¹² MW 0.00 KS | ACN of Branched Olefins | 1.29 × 10⁻⁷ MW 0.00 KS |
| Molar % of Naphthenes | 0.00 MW 0.00 KS | ACN of Naphthenes | 0.00 MW 0.00 KS |
| Molar % of Aromatics | 2.17 × 10⁻¹¹ MW 0.00 KS | ACN of Aromatics | 2.39 × 10⁻¹⁰ MW 0.00 KS |
| Molar % of Oxygenates | 0.35 MW 0.00 KS | ||
| ACNTotal | 7.68 × 10⁻¹² MW 0.00 KS |
| Type of Hydrocarbon per Type of Gasoline | Extra Gasoline | Súper Gasoline | ||||||||||||
|---|---|---|---|---|---|---|---|---|---|---|---|---|---|---|
| Paraffins | Isoparaffins | Linear Olefins | Branched Olefins | Naphthenes | Aromatics | Paraffins | Isoparaffins | Linear Olefins | Branched Olefins | Naphthenes | Aromatics | Total ACN | ||
| Extra gasoline | Paraffins | N/A | -- | -- | -- | -- | -- | -- | -- | -- | -- | -- | -- | -- |
| Isoparaffins | −329.55 * | N/A | -- | -- | -- | -- | -- | -- | -- | -- | -- | -- | -- | |
| Linear Olefins | −364.84 * | −35.29 | N/A | -- | -- | -- | -- | -- | -- | -- | -- | -- | -- | |
| Branched Olefins | −703.58 * | −374.03 * | −338.74 * | N/A | -- | -- | -- | -- | -- | -- | -- | -- | -- | |
| Naphthenes | −685.96 * | −356.41 * | −321.12 * | 17.62 | N/A | -- | -- | -- | -- | -- | -- | -- | -- | |
| Aromatics | −1140.27 * | −810.71 * | −775.42 * | −436.69 * | −454.31 * | N/A | -- | -- | -- | -- | -- | -- | -- | |
| ACNTotal | −897.96 * | −568.41 * | −533.12 * | −194.38 * | −212.00 * | 242.31 * | −941.24 * | −608.12 * | −585.63 * | −425.84 * | −523.67 * | 190.74 | 148.75 | |
| Súper gasoline | Paraffins | −43.28 | −372.83 * | −408.12 * | −746.86 * | −729.24 * | −1183.54 * | N/A | -- | -- | -- | -- | -- | -- |
| Isoparaffins | 289.85 * | −39.71 | −74.99 | −413.74 * | −396.12 * | −850.42 * | −333.12 * | N/A | -- | -- | -- | -- | -- | |
| Linear Olefins | 312.33 * | −17.22 | −52.51 | −391.25 * | −373.63 * | −827.94 * | −355.61 * | −22.48 | N/A | -- | -- | -- | -- | |
| Branched Olefins | 472.13 * | 142.57 | 107.28 | −231.46 * | −213.84 * | −668.14 * | −515.40 * | −182.28 | −159.80 | N/A | -- | -- | -- | |
| Naphthenes | 374.29 * | 44.74 | 9.45 | −329.28 * | −311.67 * | −765.98 * | −417.57 * | −84.45 | −61.96 | 97.83 | N/A | -- | -- | |
| Aromatics | 1088.70 * | 759.15 * | 723.86 * | 385.12 * | 402.74 * | −51.57 | −1131.98 * | −798.86 * | −776.37 * | −616.58 * | −714.41 * | N/A | -- | |
| ACNTotal | −749.22 * | −419.66 * | −384.37 * | −45.64 | −63.25 | 391.05 * | −792.50 * | −459.37 * | −436.89 * | −227.09 * | −374.93 * | 339.48 * | N/A | |
Disclaimer/Publisher’s Note: The statements, opinions and data contained in all publications are solely those of the individual author(s) and contributor(s) and not of MDPI and/or the editor(s). MDPI and/or the editor(s) disclaim responsibility for any injury to people or property resulting from any ideas, methods, instructions or products referred to in the content. |
© 2024 by the authors. Licensee MDPI, Basel, Switzerland. This article is an open access article distributed under the terms and conditions of the Creative Commons Attribution (CC BY) license (https://creativecommons.org/licenses/by/4.0/).
Share and Cite
Pazmiño-Viteri, K.; Cabezas-Terán, K.; Echeverría, D.; Cabrera, M.; Taco-Vásquez, S. Average Carbon Number Analysis and Relationship with Octane Number and PIONA Analysis of Premium and Regular Gasoline Expended in Ecuador. Processes 2024, 12, 1706. https://doi.org/10.3390/pr12081706
Pazmiño-Viteri K, Cabezas-Terán K, Echeverría D, Cabrera M, Taco-Vásquez S. Average Carbon Number Analysis and Relationship with Octane Number and PIONA Analysis of Premium and Regular Gasoline Expended in Ecuador. Processes. 2024; 12(8):1706. https://doi.org/10.3390/pr12081706
Chicago/Turabian StylePazmiño-Viteri, Katherine, Katty Cabezas-Terán, Daniel Echeverría, Marcelo Cabrera, and Sebastián Taco-Vásquez. 2024. "Average Carbon Number Analysis and Relationship with Octane Number and PIONA Analysis of Premium and Regular Gasoline Expended in Ecuador" Processes 12, no. 8: 1706. https://doi.org/10.3390/pr12081706
APA StylePazmiño-Viteri, K., Cabezas-Terán, K., Echeverría, D., Cabrera, M., & Taco-Vásquez, S. (2024). Average Carbon Number Analysis and Relationship with Octane Number and PIONA Analysis of Premium and Regular Gasoline Expended in Ecuador. Processes, 12(8), 1706. https://doi.org/10.3390/pr12081706