Article

Green Synthesis of Yttrium Derivatives Nanoparticles Using Pine Needle Leaf Extract: Characterization, Docking, Antibacterial, and Antioxidant Potencies

1
Department of Biological Sciences, Faculty of Science, Beirut Arab University, Beirut P.O. Box 11-5020, Lebanon
2
Department of Physics, Faculty of Science, Beirut Arab University, Beirut P.O. Box 11-5020, Lebanon
3
Microbial Genetics Department, Biotechnology Research Institute, National Research Centre, Giza 12622, Egypt
4
Egypt Center for Research and Regenerative Medicine (ECRRM), Cairo 11517, Egypt
5
Physics Department, Faculty of Science, University of Tabuk, Tabuk 47512, Saudi Arabia
6
Molecular Biology Unit, Department of Zoology, Faculty of Science, Alexandria University, Alexandria 21568, Egypt
*
Authors to whom correspondence should be addressed.
Processes 2024, 12(8), 1713; https://doi.org/10.3390/pr12081713
Submission received: 21 July 2024 / Revised: 2 August 2024 / Accepted: 7 August 2024 / Published: 15 August 2024

Abstract

:
Green nanoparticles are synthesized using environmentally friendly methods, and natural materials hold significant importance. This makes the process environmentally sustainable and reduces the production of harmful waste by-products. Green nanoparticles exhibit reduced toxicity which is crucial for biomedical applications. The current study suggested that yttrium nanoparticles (YNPs) should be synthesized, characterized, and evaluated for their diverse biological applications due to the rise in antibacterial resistance. The YNPs were prepared using a pine needle leaf extract (PNLE). The structural and morphological features have been investigated using X-ray diffraction (XRD), scanning electron microscopy (SEM), energy-dispersive X-ray spectroscopy (EDX), transmission electron microscopy (TEM), X-ray photoelectron spectroscopy (XPS), photoluminescence (PL), Fourier transform infrared spectroscopy (FTIR), ultraviolet–visible spectroscopy (UV–vis), and vibrating sample magnetometry (VSM). The XRD pattern demonstrated the presence of yttrium oxide and yttrium nitrate phases. The crystallite size and particle size of the synthesized YNPs measured 1.696 nm and 24.55 nm, respectively. The XPS peaks showed two components with binding energies at 530.940 eV and 532.18 eV due to the bond between O–Y and OH–Y, respectively. Additionally, the ferromagnetic nature of the YNPs was confirmed by VSM analysis. The YNPs were tested for antibacterial activity on six uropathogenic bacteria (S. aureus, S. haemolyticus, E. faecalis, E. coli, K. pneumonia, and P. aeruginosa) using the microdilution assays, to find the minimum inhibitory concentration (MIC) as well as the minimum bactericidal concentration (MBC), the agar well diffusion assay, and antibiofilm screening assays, where they showed bacteriostatic action against all isolates (0.5–1 mg/mL MIC) and significant inhibition of biofilm formation (80% inhibition rate). The antioxidant capacity assessed by 1,1, diphenyl-2-picrylhydrazyl (DPPH) radical scavenging revealed 50% DPPH scavenging. Moreover, docking studies exhibited that YNPs inhibit crucial bacterial enzymes, including DNA gyrase, penicillin-binding proteins, carbapenemase, LasR-binding protein, and dihydropteroate synthase. These findings may explain the mechanisms responsible for the observed antibacterial effects of YNPs. Overall, these findings underscore YNPs as promising candidates for antioxidant and antibacterial applications.

1. Introduction

The consequences of antibiotic resistance acknowledged as a significant global health concern are far-reaching; these effects range from higher death rates and more severe illness to increased healthcare costs [1]. While creating another form of antibiotics is still an important way to ensure public health, it is a proven fact that they take time to develop. A new approach in this field has been the use of antibacterial nanoparticles (NPs), which are resistant to drugs and highly effective against dangerous bacteria-causing infections that do not respond well to medication [2]. The specialty of these NPs lies in their unusual behavior from the rest of the bulk materials, which is primarily caused by a considerable increase in the surface- area- to- volume ratio. This rise greatly impacts their inherent characteristics, causing them to adhere more effectively to microorganisms and penetrate cells [3].
Studies have shown that metal-oxide NPs such as silver, silver oxide, titanium dioxide, silicon, copper oxide, zinc oxide, gold, calcium oxide, and magnesium oxide have strong bactericidal properties [4]. For these reasons, NPs have been applied in different sectors such as research, manufacturing, farming, the food industry, packaging businesses, and the medical field [3].
In recent times, the production of metal and metal oxide NPs has become more complex with the emergence of biosynthesis. This process prevents the creation of harmful chemicals which are usually by-products in some chemical reactions, but it also avoids using synthetic organic chemicals. Many manufacturing processes use toxic substances, thus the need for safe substitutes that can be sustained is crucial. Green synthesis is an approach to making environmentally friendly, non-toxic, and sustainable NPs through plant biomass or minerals [5]. It also helps improve anti-inflammatory properties by maintaining low levels of toxicity [6]. In phytochemistry, toxicology, and pharmacology, plants produce a lot of bioactive metabolites, such as pentacyclic triterpenoids, phytosterols, polyphenols, etc., has been extensively studied [7].
Studies in the past have emphasized yttrium oxide (Y2O3), which is a fundamental rare earth compound appreciated for its roles in optoelectronic appliances as well as chemical catalysis. It can be described by its high dielectric constant and excellent thermal stability when it is powdered [8]. Efficient additives can only be created if Y2O3 is used together with other compounds during their production; an example of such a compound is yttria-stabilized zirconia films [8,9]. Additionally, this material acts as a host matrix for different types of rare earth dopants that may find use in fields like biological imaging, materials science, inorganic compound synthesis, optics, electricity biology, and photodynamic therapy, among others [8,9].
Recently, many studies have shown a significant effect of biosynthesized NPs in many medical applications, especially in the antibacterial and antioxidant domains. For example, Prabitha et al. [10] reported that Y doping enhances the antibacterial activity of the NPs against bacteria, especially Escherichia coli and Staphylococcus aureus. The main mechanism of action of the NPs includes the induction of oxidative stress caused by the production of reactive oxygen species (ROS). In addition, Y doping also enhances the antioxidant activity by increasing the electrical, optical, and chemical composition of the NPs. In addition, magnetic NPs are widely used in cancer treatment through magnetoreception, photothermal therapy, targeted drug delivery, and magnetic hyperthermia.
In this study, we report the synthesis of novel yttrium NPs (YNPs) using pine needle leaf extract (PNLE). We also present their characterization, as well as their antibacterial, antioxidant, and docking activities to test the inhibition of some crucial enzymes.

2. Materials and Methods

2.1. Preparation of the PNLE and Synthesis of the YNPs

After collecting the fresh pine needle leaves (Pinus pinea) from the Aishiya pine forest, Jezzine, South Lebanon, they were washed multiple times with distilled water to remove the dust, sun-dried to eliminate moisture, and cut into approximately 1 cm pieces. A total of 6 g of the pieces were added to a 500 mL graduated cylinder, filled with up to 300 mL of distilled water, and heated to 60 °C for 30 min, with shaking at 120 rpm. The resulting aqueous extract was cooled to room temperature, vacuum-filtered, collected in a foil-wrapped container, and stored at 4 °C for use in synthesizing the YNPs. The YNPs were synthesized using a green method. Initially, 0.09 g of Y nitrate (YNO3; Central Drug House (P) Ltd., RE3615, New Delhi, India) was mixed with 250 mL of the PNLE and heated to 60 °C for 30 min. Successful biogenesis of the YNPs was indicated by a color change from colorless to yellow. The resulting YNPs were centrifuged at 10,000 rpm for 30 min, washed three times by centrifugation for 15 min, and then oven-dried at 40 °C for 24 h, after which the final mass of the NPs was measured. For biological applications, the YNPs were diluted to concentrations 0.0625–1 mg/mL using sterile distilled water (dw).

2.2. Characterization Techniques of the YNPs

2.2.1. X-ray Diffraction (XRD)

XRD profiles of the YNPs were analyzed using a Bruker D8 Advance instrument (Bruker, Ettlingen, Germany) equipped with Cu-Kα radiation of wavelength 1.54060 Å. The XRD data collection spanned a 2θ range of 20° to 80° at a scan speed of 0.02° per second. The profiles were optimized using MAUD software (version 2.992) via the Rietveld method, a process that requires analysis of XRD patterns to identify specific crystal phases, with CIF files obtained from the Crystallography Open Database (COD).

2.2.2. Scanning Electron Microscopy (SEM) and Energy-Dispersive X-ray (EDX)

The SEM and EDX measurements confirmed the elemental composition of the prepared samples, which was determined by JEOL, JCM-6000PLUS with EX-54450U1S61 detector, on different regions of the samples, operated at 10 keV.

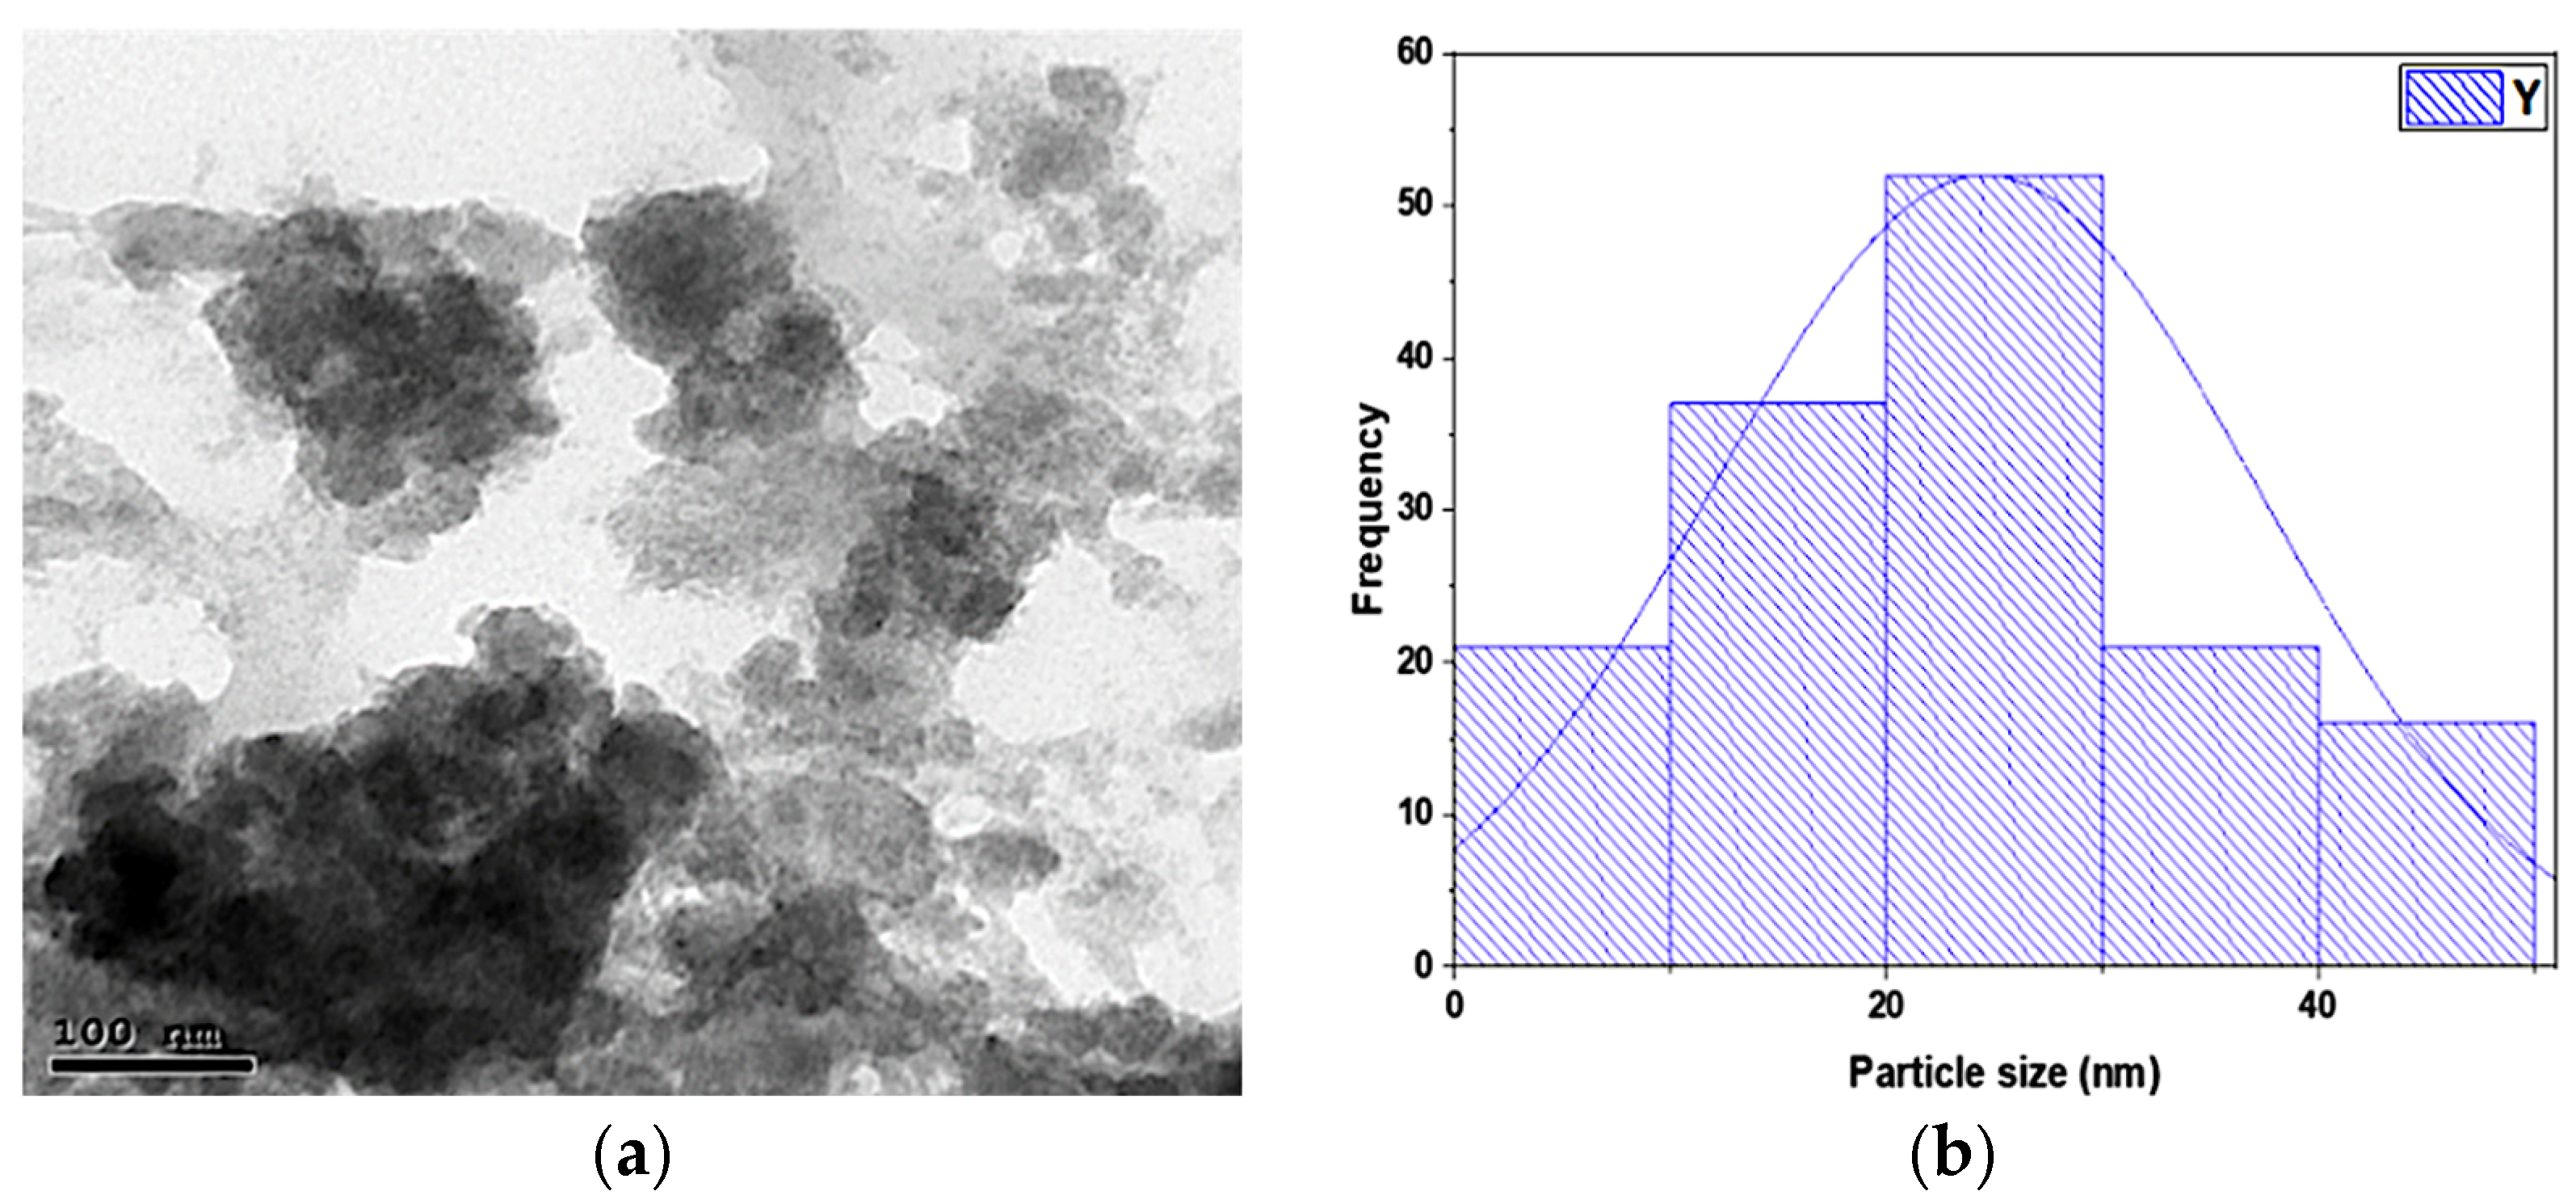
2.2.3. Transmission Electron Microscopy (TEM)

A morphological analysis was performed using a TEM (JEOL JEM-100 CX, Peabody, MA, USA) operating at 80 kV with a resolution of 0.1 nm. The TEM images were taken at 100 nm magnification and analyzed using ImageJ software (version 1.54g) to evaluate the particle size distribution.

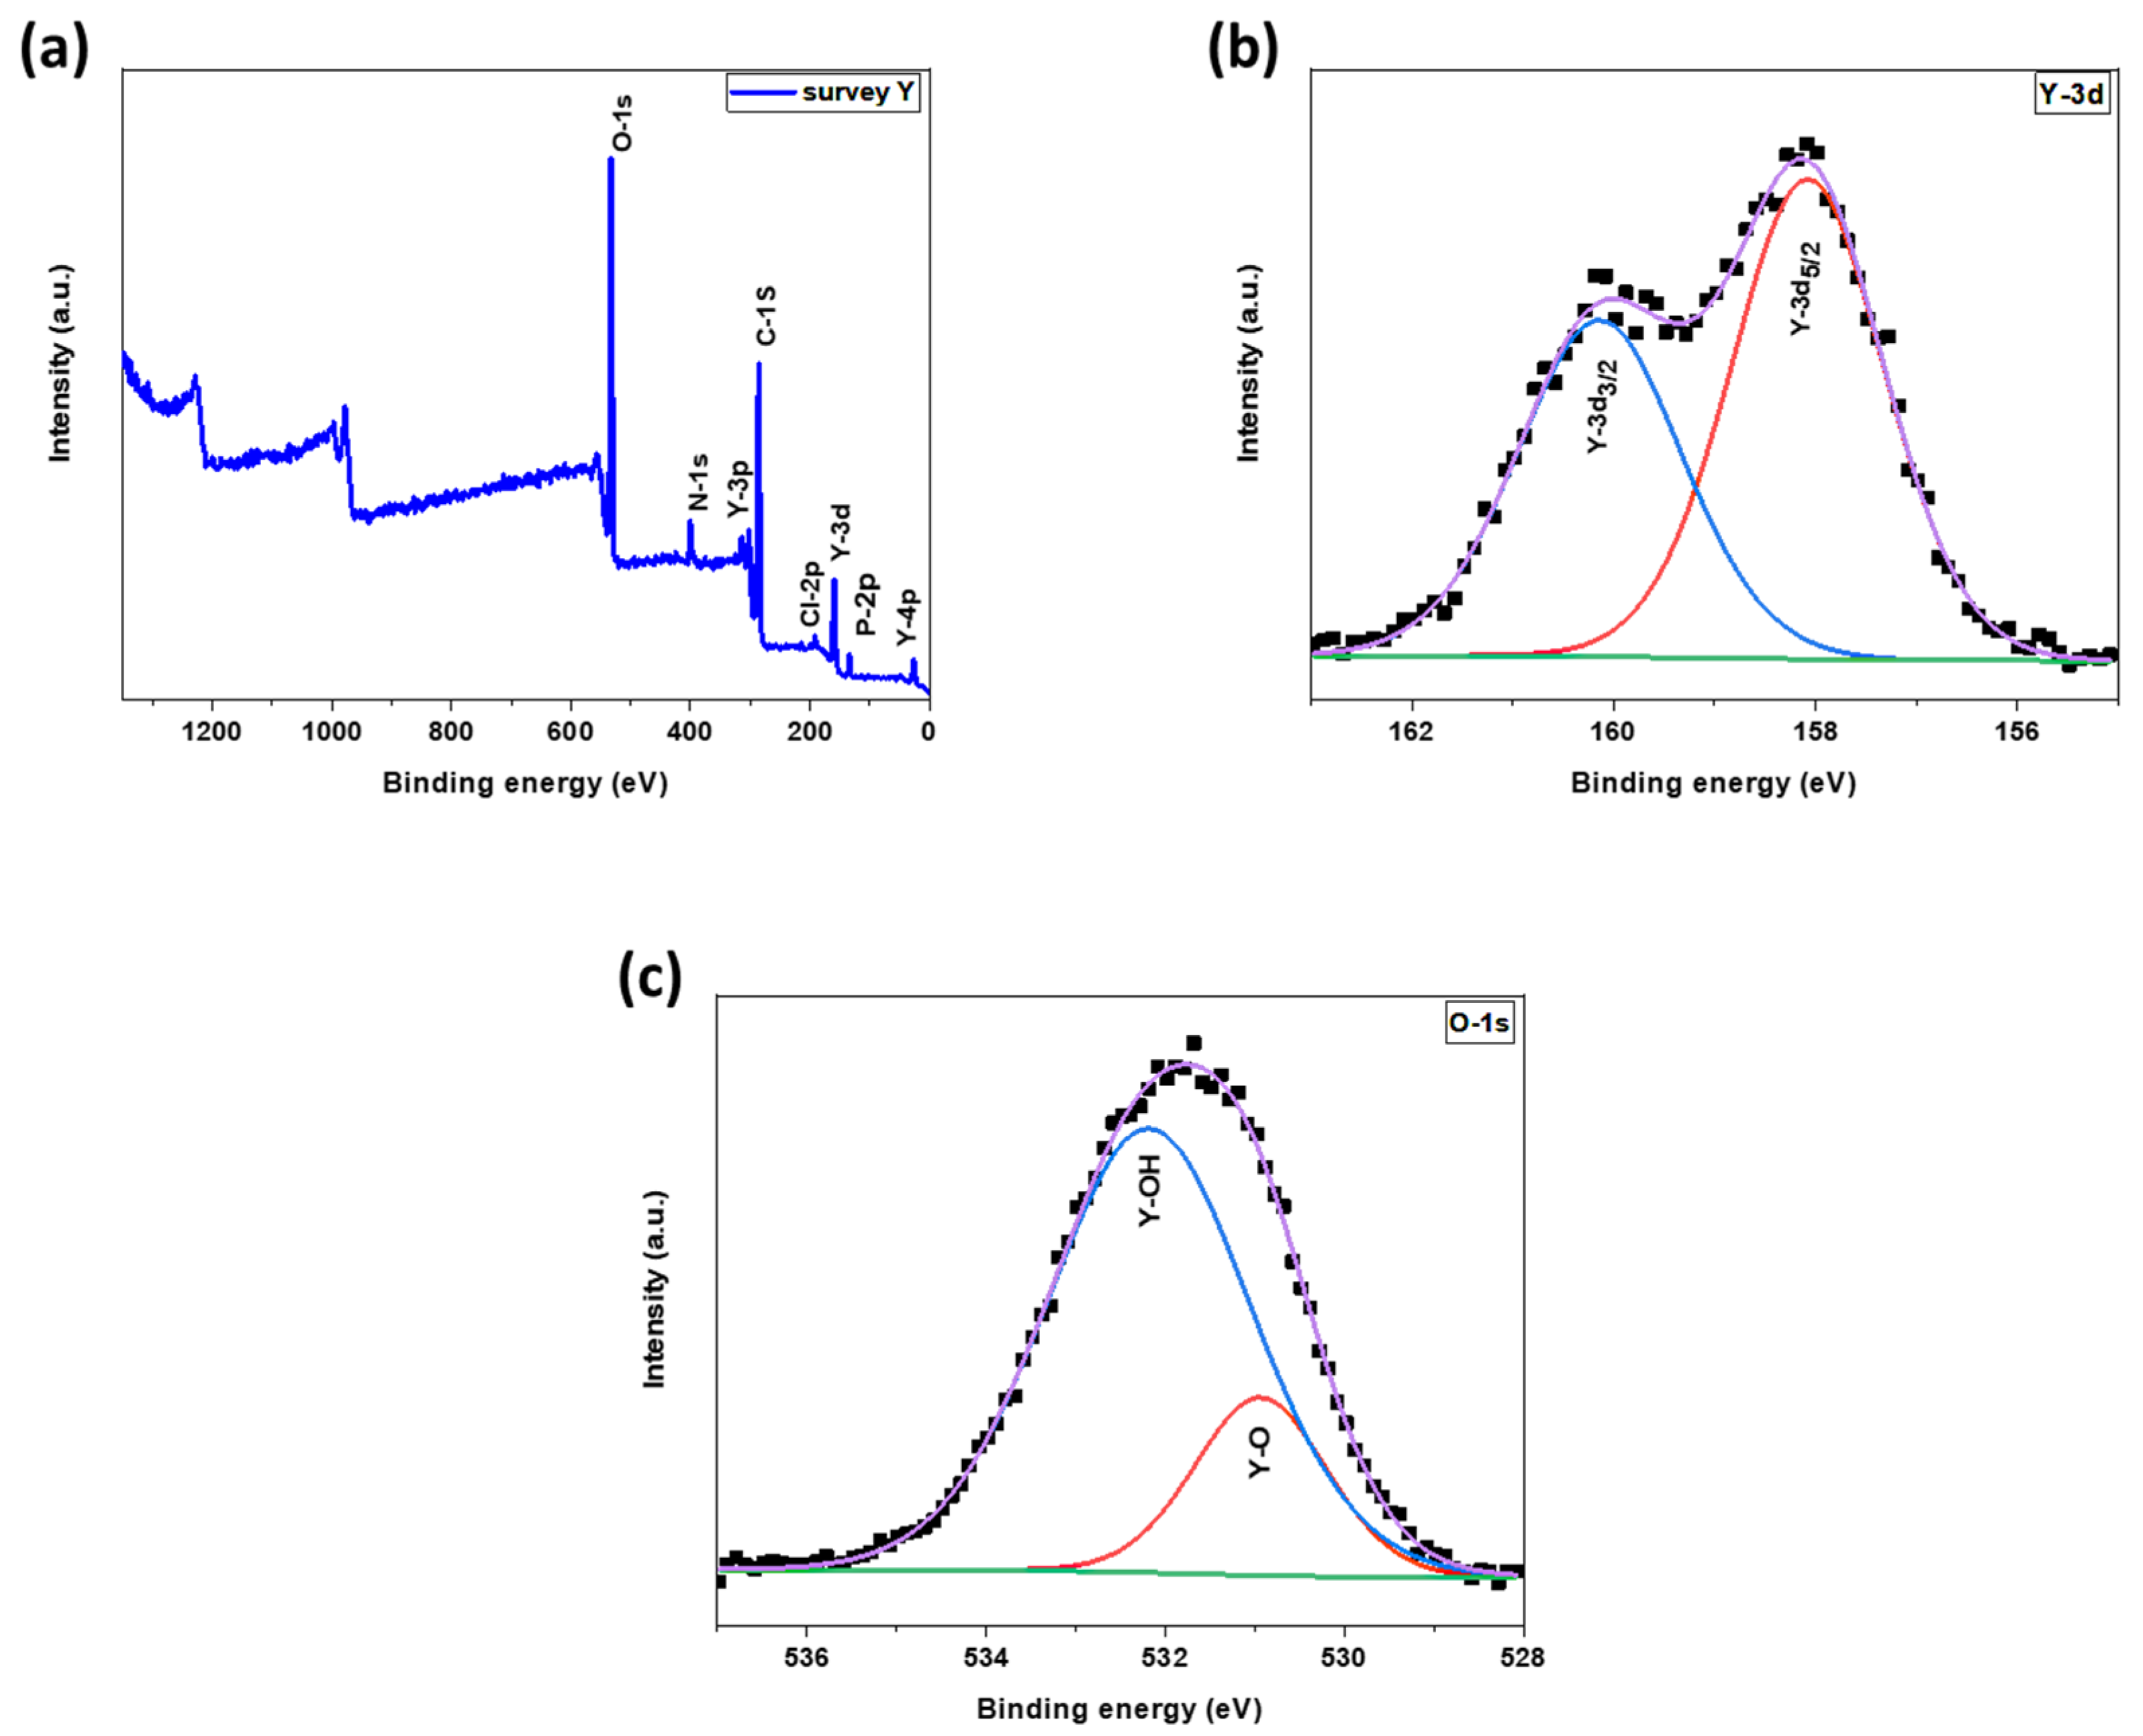
2.2.4. X-ray Photoelectron Spectroscopy (XPS)

The elemental composition and oxidation states of the YNPs were analyzed through XPS using a K-Alpha instrument from Thermo Fisher Scientific, Waltham, MA, USA; Central Metallurgical Research & Development Institute, Helwan, Egypt). A micro-focused Al-Kα X-ray source is featured by this instrument. The measurements were conducted under a vacuum pressure of 10−9 mbar, employing a pass energy of 200 eV and a narrow spectrum setting of 50 eV.

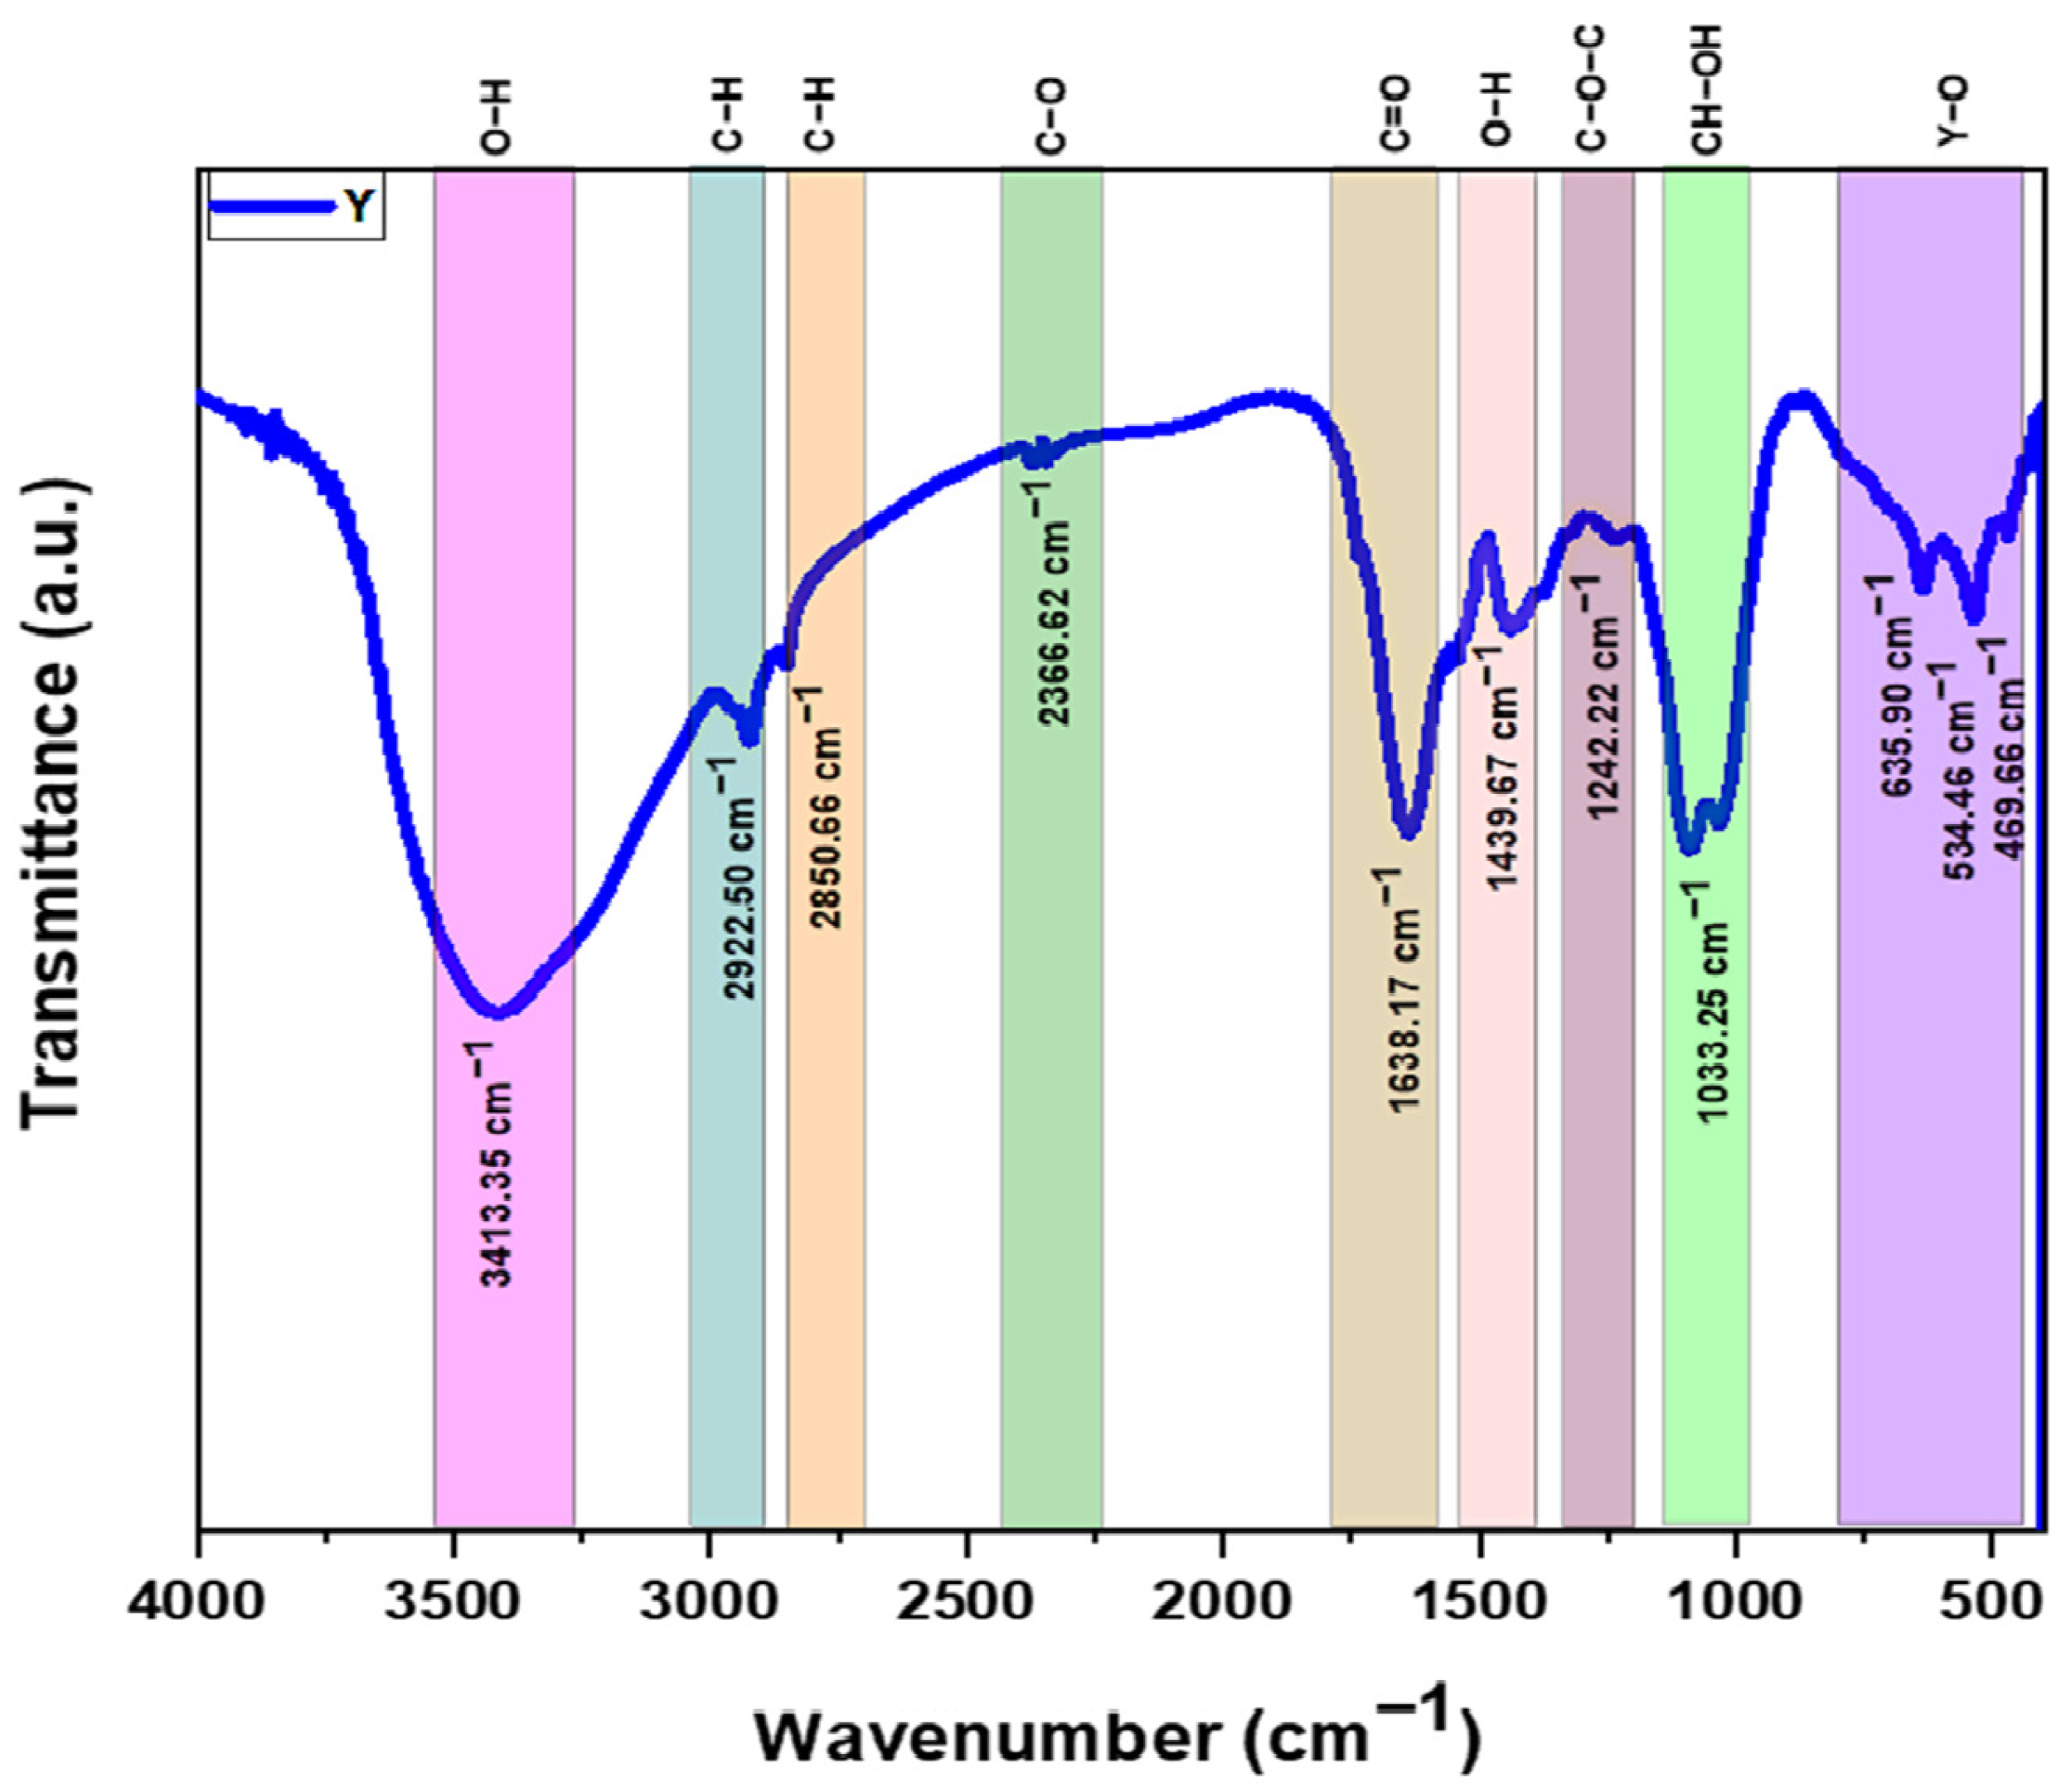
2.2.5. Fourier Transform Infrared Spectroscopy (FTIR)

FTIR analyses were performed using a Nicolet iS5 FTIR-8400S spectrophotometer (Thermo Fisher Scientific) over a spectral range of 4000–400 cm−1 at room temperature. To prepare samples for FTIR measurements, 2 mg of each sample was blended with potassium bromide (KBr) in a 1:100 ratio and compressed at 13,790 kPa to form disk-shaped samples.

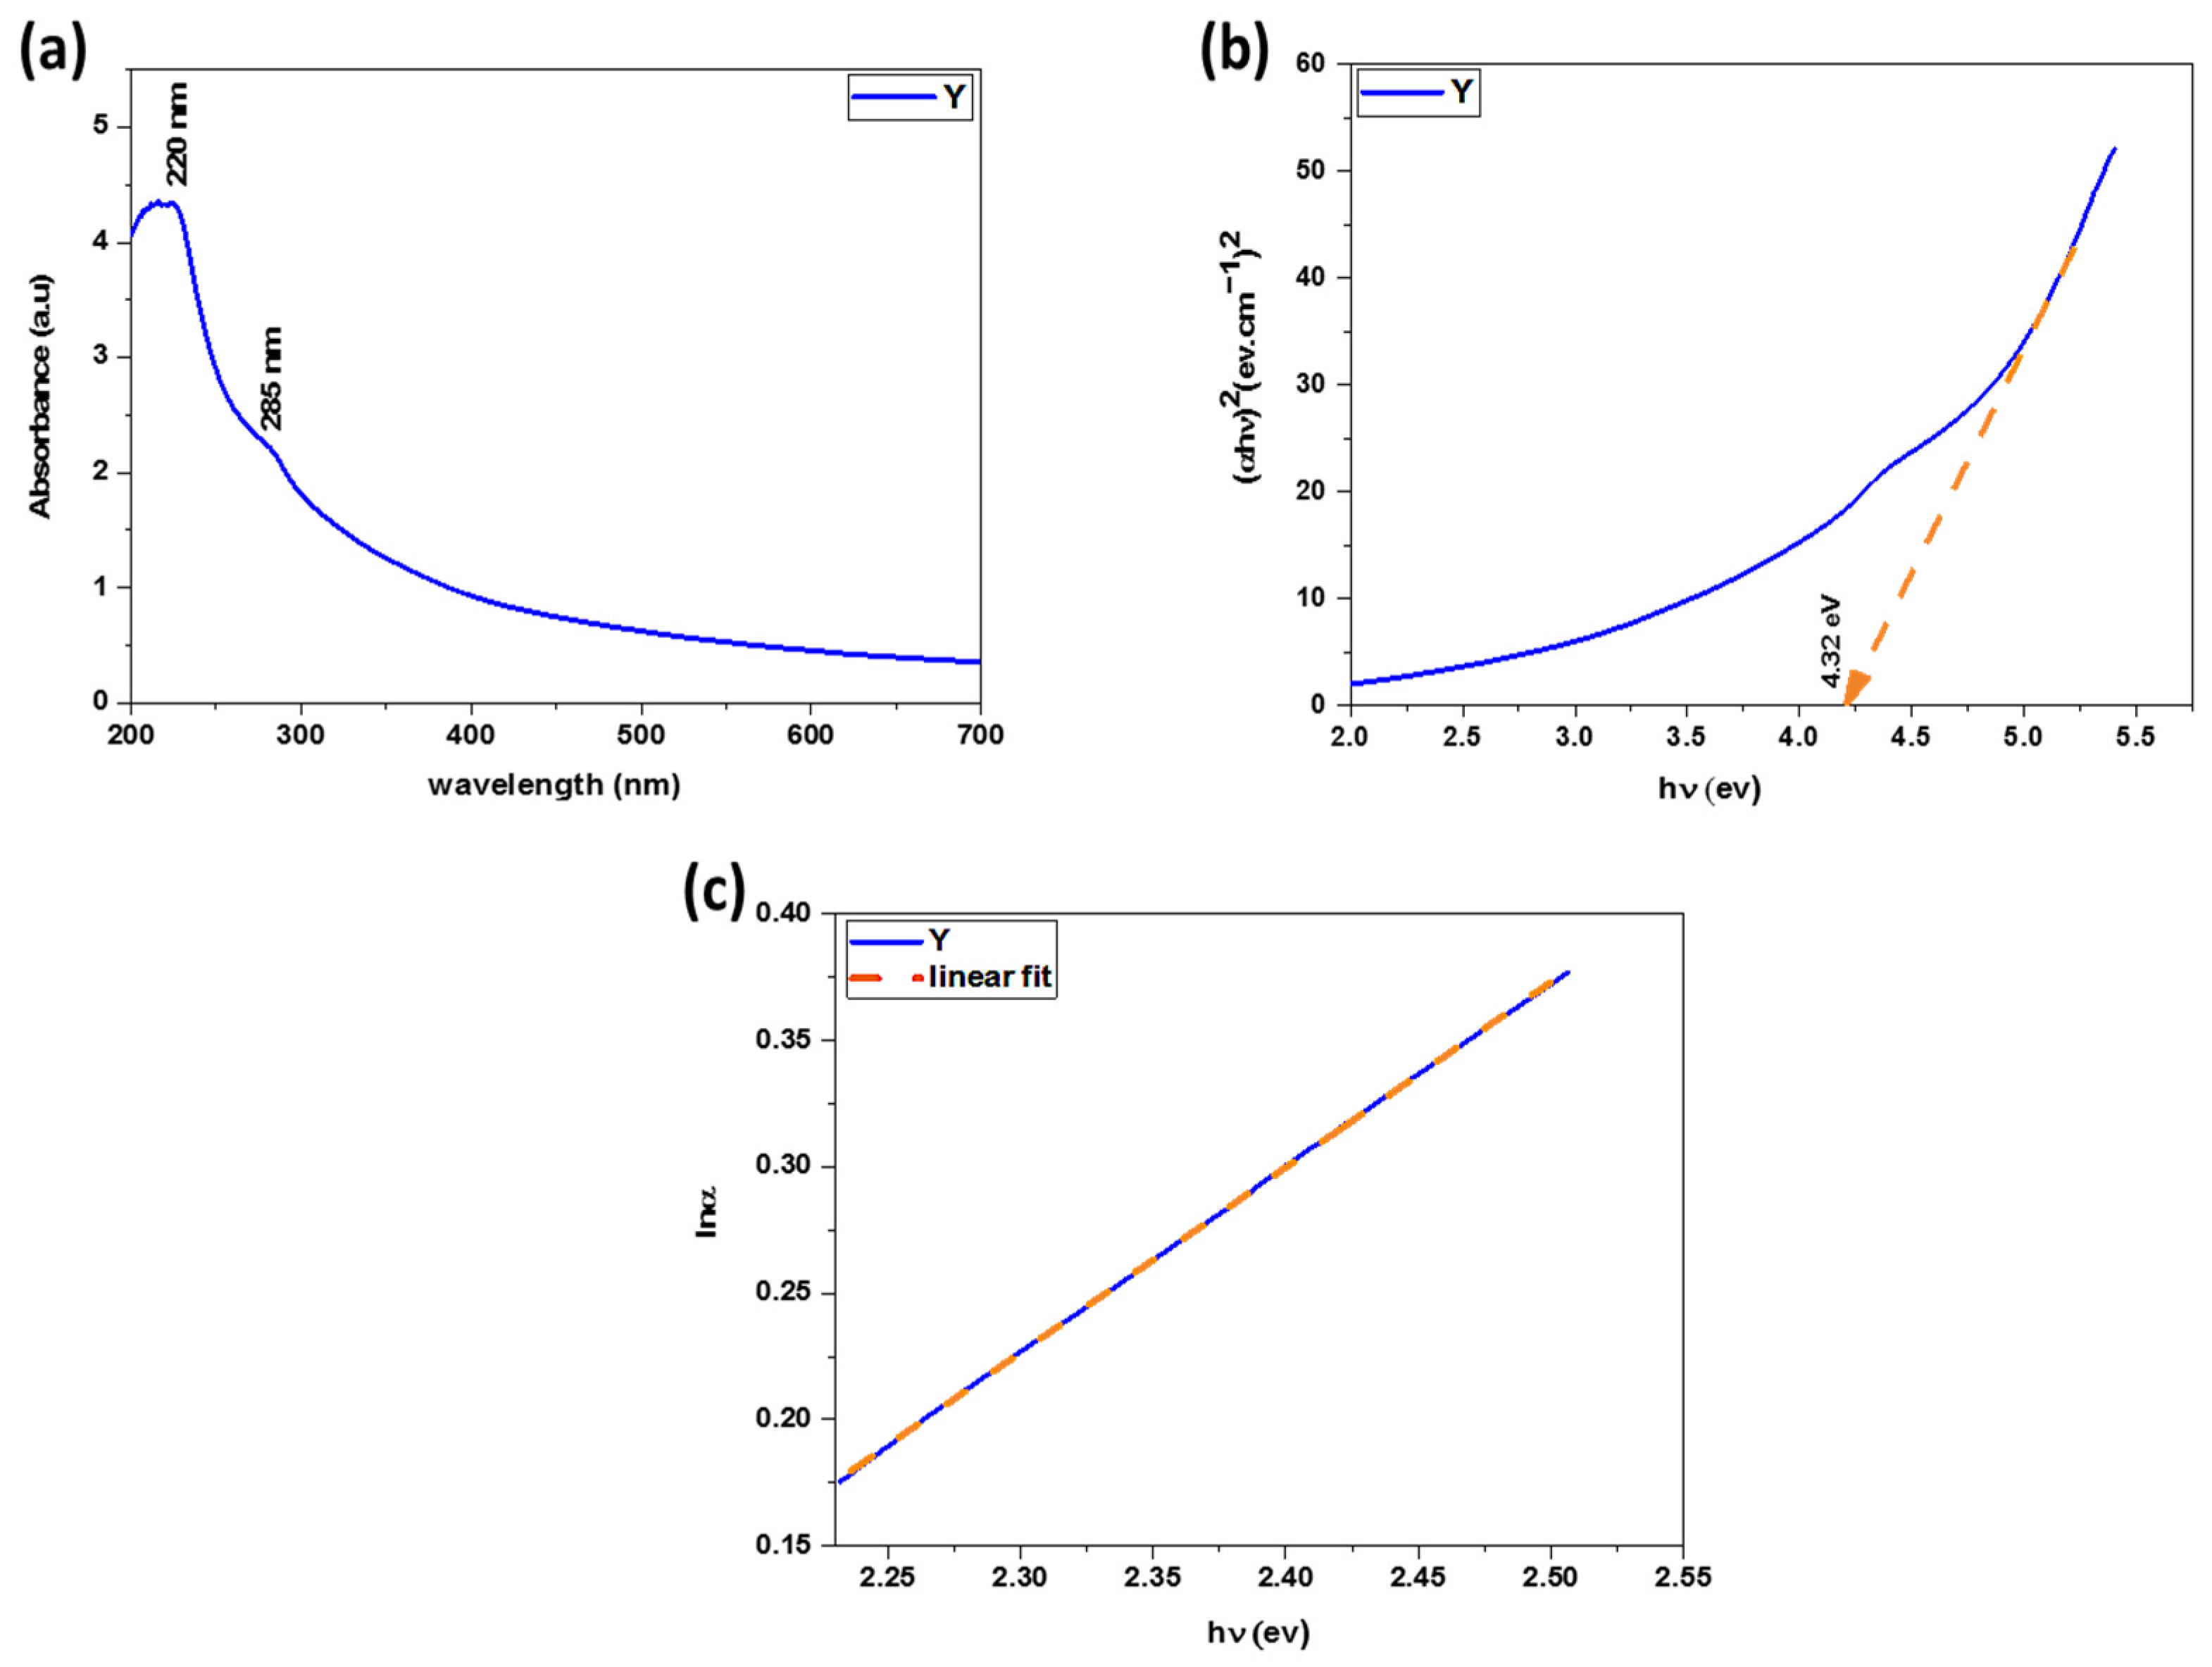
2.2.6. UV–Visible Spectroscopy (UV–Vis)

The optical properties of the samples were evaluated using a UV–vis spectrophotometer (V-670; Jasco, Tokyo, Japan) at room temperature, spanning wavelengths from 200 to 700 nm. Following the third wash, the supernatant was discarded, and the pellet was retained and diluted with distilled water until a color change indicated the formation of a stock solution. A total of 400 μL of this solution was then placed into a cuvette and diluted to the required volume with distilled water, which also served as the blank solution.

2.2.7. Photoluminescence (PL)

PL spectra were obtained using a JASCO-FP-8600 fluorescence spectrometer (Jascon) equipped with a Xenon (Xe) laser, employing an excitation wavelength of 420 nm, using the same sample preparation as for the UV–visible spectroscopy.

2.2.8. Vibrating Sample Magnetometry (VSM)

The magnetic properties of the samples were assessed using a Lakeshore 7410 VSM (Lakeshore Cryotronics, Westerville, OH, USA) at room temperature. This device can apply a magnetic field ranging from −20 to +20 kG.

2.3. Antibacterial Activity of the YNPs

2.3.1. Preparation of the Bacterial Isolates

Six uropathogenic bacteria were used in this study: S. aureus, Staphylococcus haemolyticus, Enterococcus faecalis, E. coli, Klebsiella pneumonia, and Pseudomonas aeruginosa. The bacterial isolates were cultured on nutrient agar (NA; TM Media, TM 1054, El Achour, Algeria) plates. After 24 h of incubation, a colony of each isolate was suspended in nutrient broth (NB; TM Media, TM 1054) and adjusted to 0.5 McFarland.

2.3.2. Minimum Inhibitory Concentration (MIC) and Minimum Bactericidal Concentration (MBC) Broth Microdilution Assay

The test was performed in 96-well microtiter plates by adding 90 µL of NB and 10 µL of the previously prepared bacterial suspensions. Then, 100 µL of the diluted YNPs were added to the wells. Doxycycline (Dox; 250 µg/mL; Sinoway Industrial Co., Ltd., Xiamen, China). The plates were incubated at 37 °C for 24 h. After that, bacterial growth was detected by measuring the optical density (O.D.) at 595 nm using an ELISA microtiter plate reader (Scitek, Jinan, China). The MIC was defined as the lowest NP concentration that inhibited the visible growth of bacteria. The MBCs were determined by adding 10 µL of the clear wells on Muller Hinton agar (MHA; TM Media, TM 1054) and incubating them at 37 °C for 24 h. The MBC was defined as the lowest concentration not exhibiting bacterial growth [11]. All experiments were conducted at least three times.

2.3.3. Agar Well Diffusion Assay

The assay relied on spreading 100 µL of the previously prepared bacterial suspensions on MHA plates and punching the agar with a 6 mm cork-borer to create wells. The wells were then filled with 100 µL of the YNPs diluted solutions. Dox served as a reference antibiotic. The diameter of the zone of inhibition (ZOI) was measured after 24 h of incubation at 37 °C [11]. The experiments were carried out in triplicates.

2.3.4. Anti-Biofilm Assay

The test was performed in 96-well microtiter plates by adding 90 µL of NB to 10 µL of the prepared bacterial suspensions and incubating them at 37 °C for 3 h to ensure the attachment of the biofilms. The wells were then filled with 100 µL of the diluted YNPs solutions. Dox served as a positive control, and a bacterial culture without any treatment served as a negative control. The plates were incubated at 37 °C for 24 h. The wells were then washed with sterile distilled water, dried at 40 °C in an oven, and stained with 100 µL of 1% crystal violet (CV; Alpha Chemika, CV506, Mumbai, India) for 15 min at room temperature. After heavy washing, the biofilms appeared as purple rings on the sides of the wells. A total of 100 µL of 95% ethanol was added to the wells to de-stain them. The biofilm growth was quantified at 595 nm by an ELISA microplate reader. The following formula was used to determine the % inhibition of biofilm formation:
%   Inhibition = O . D . negative   control   O . D . treated   sample O . D . negative   control × 100
Similarly, for the destruction of pre-formed biofilms, the same steps were performed. However, the bacteria were incubated in NB for 24 h instead of 3 h to form the biofilms [11]. All experiments were repeated at least three times.

2.4. 1,1, Diphenyl 1-2 Picrylhydrazyl (DPPH) Free Radical Scavenging Assay

The test was performed by mixing 1 mL of the diluted YNPs solutions (concentrations ranging between 0 and 200 µg/mL) with 1 mL of 0.3 M of 1,1, diphenyl 1-2 picrylhydrazyl DPPH (ANCUS, Scotland, UK). Ascorbic acid (GNF Chemical, 50-81-7, Tsingtao, China) served as a positive control; 1 mL of each DPPH and methanol served as a negative control. The tubes were incubated in dark conditions for 30 min, and the absorbance was measured at 517 nm using a spectrophotometer [12]. All tests were repeated three times. The percentage of the DPPH-scavenging activity was calculated using the following equation:
DPPH   radical - scavenging   activity   ( % ) = Ac     As Ac × 100
Ac: absorbance of the control, As: absorbance of the sample.

2.5. Molecular Docking Simulation

Antibacterial protein receptors were obtained from the Protein Data Bank to cover a wide range of bacterial species. The structures were prepared by removing water molecules, ions, and existing ligands. Hydrogen atoms were added to the receptor molecule using Autodock Vina, and YNPs in pdb format were used as the input for docking simulations. Before docking, polar-H atoms were added to the target followed by Gasteiger charges calculation using Autodock tools. Ligand-centered maps were generated by the AutoGrid program and grid dimensions of 90 A° × 90 A° × 90 A°. Analysis of the 2-D hydrogen-bond interactions of the target-ligand structure was performed by Discovery Studio 4.5 A°.

2.6. Statistical Analysis

The statistical tests were conducted in Excel software (64-bit edition, KB4011684, 2016). The errors were detected by calculating the standard error of the means (SEM) and the statistical significance was obtained by a t-Test. The graphs were drawn in Origin software (64-bit edition, 2018).

3. Results

3.1. Characterization of the YNPs

3.1.1. X-ray Diffraction (XRD)

The XRD patterns of the biosynthesized YNPs, as shown in Figure 1, exhibit seven diffraction peaks. The peak at 14.45° corresponds to YNO4 near the (002) plane, while the peaks at 17.42°, 21.38°, 32.92°, 39.59°, 50.73°, and 63.29° correspond to (200), parallel to (211), (231), (420), (440), and (444) planes of yttrium oxide, respectively [13]. Utilizing MAUD software, the composition analysis yielded 82.870% for YNO3 and 17.129%, respectively, for YNO4, as shown in Figure 1. The average crystallite size was determined by MAUD software to be 1.696 nm, which was significantly smaller compared to previous studies synthesizing Y oxide using urea and glycine, where sizes ranged between 15 and 20 nm and 14 and 30 nm, respectively. Moreover, the lattice constants for YNPs were measured at 7.298 Å, markedly small compared to the values reported in other reported literature, which are usually about 10.65 Å [14].

3.1.2. Transmission Electron Microscopic (TEM) Analysis

Morphological studies of the biosynthesized YNPs were performed via a TEM at 100 nm scale resolution. Figure 2a shows the TEM images of the YNPs synthesized from the PNLE. The TEM analysis revealed sheet-like and spherical particles, which exhibited nearly uniform sizes. Importantly, the TEM images also indicate the presence of particle aggregates [15]. The particle sizes of the synthesized YNPs, as measured by ImageJ software, ranged from 5.23 to 50 nm, with an average size of 24.55 nm, as illustrated in Figure 2b.

3.1.3. X-ray Photoelectron Spectroscopy (XPS)

The synthesized YNPs were analyzed for their chemical composition and oxidation state using XPS. The XPS spectra analyzed in Figure 3a show the existence of Y, carbon (C), oxygen (O), nitrogen (N), chlorine (Cl), and phosphorous (P) in the YNPs. The YNPs were also characterized using high-resolution XPS (HR-XPS) techniques to gain a deeper insight into binding dynamics. Figure 3b shows the HR-XPS spectrum for Y–3d having binding energies at 158.07 eV and 160.14 eV for Y–3d5/2 and Y–3d3/2, respectively. The HR-XPS of the O-1s peak shown in Figure 3c may include two components, with binding energies at 530.940 eV and 532.18 eV. Information about the elemental composition and atomic percentages is given in Table 1 regarding the NPs, such as YNPs, are under consideration here. In this case, the majority of the data suggests that O1s constitute the major part, amounting to 71.44%. For instance, Y–3d accounts for 7.41% of the composition. The NPs mainly consist of Y and O, as indicated by the EDX analysis results with these percentages. Additionally, it is worth pointing out that N-1s amounts to 13.4%, while P-2p is at 7.75%.

3.1.4. Scanning Electron Microscopy (SEM) with Energy-Dispersive X-ray (EDX) Spectroscopy Analysis

Figure 4a shows the surface morphology of the green-synthesized YNPs as examined using SEM [16]. The study reveals that the YNPs are generally spherical, but they form clusters with different nano-diameters. In addition, the SEM analysis of the YNPs indicates indistinct circular morphologies of aggregated particles. An elemental composition analysis of the YNPs was conducted using EDX, as depicted in Figure 4b. It can be seen that biogenic YNPs contain Y (7.08%), O (51.17%), and C (41.75%), respectively. In the case of YNPs, around 2 keV represents a peak for Y within them.

3.1.5. Fourier Transform Infrared (FTIR) Analysis

The synthesized YNPs were subjected to FTIR spectrum analysis at room temperature within the range of 4000–400 cm−1. It is qualitative and checks the infrared light scanning of the chemical bonding of the sample. FTIR spectroscopy is a valuable tool for identifying the functional groups involved in NP synthesis. Through FTIR spectroscopy analysis, the absorption spectrum profile exhibits various peaks corresponding to specific chemical bonds and functional groups such as alkanes, ketones, and amines absorbing infrared radiation at different wavelengths. As illustrated in Figure 5, the OH stretching observed at 3413.55 cm−1 for the YNPs is due to both hydroxyl groups and highly adsorbed molecular water inside the Y hydroxide crystal lattice. These include the antisymmetric stretch vibration for C–H bonds on both sides, which has a peak at 2922.50 cm−1, while the symmetric vibrations are represented by ranges around 2850.66 cm−1 [13]. Also shown are bands that appear at wavenumbers near 1638 cm−1, which likely result from carbonyl-group-stretching vibrations, and are seen with secondary amides [13]. The presence of carboxylic acid O–H bonds were indicated by the green-synthesized NPs FTIR spectrum at 1439.67 cm−1 [17]. The capping ligands of the NPs were also evidenced by the weaker band that appeared at wavenumbers around 1242 cm−1 and was attributed to C–O–C stretching. The CH–OH in cyclic alcohols with C=O stretch vibrations gave rise to a peak at 1033.25 cm−1 in the green-synthesized YNPs FTIR spectrum [13]. The Y–O stretching vibration, caused by hydroxide and nitrate bindings with the Y ion, is responsible for the peaks between 400 and 800 cm−1 (at 635.90, 534.46, and 469.66 cm−1) [18].

3.1.6. Visual Observation and UV–Vis Spectroscopy Analysis

The UV–vis spectrum was conducted within the wavelength range of 200–700 nm to discern the predominant presence of metal NPs in the plant aqueous medium. The YNPs demonstrated two absorbance peaks at 220 and 285 nm (Figure 6a). The peak at 220 nm reflects the electronic transitions within YNPs themselves, potentially related to charge transfer or intrinsic electronic transition for yttrium in its nanoparticle form [19]. Additionally, this peak may arise due to charge transfer transitions between the Y3+ ions and surrounding ligands or capping agents. This absorption type may result from interactions with oxygen-containing groups from the pine needle extract, such as hydroxyl or carboxyl groups [19]. Furthermore, noble metals like gold or silver are typically characterized by surface plasmon resonance (SPR). However, very small yttrium nanoparticles might have SPR-like features due to quantum size effects, thus exhibiting a peak at this wavelength [20]. The presence of organic molecules from pine needle extracts may be responsible for the absorption peak at 285 nm. Numerous phytochemicals, like flavonoids, phenolic acids, and other conjugated organic compounds, absorb light within this range because of π–π* transition or n–π* transition [21]. Usually, organic compounds with conjugated double bonds are often found in plant extracts. These molecules can strongly absorb light at 250–300 nm, which is attributed to π→π* excitation. Moreover, the extract has atoms with an unshared pair of electrons due to the presence of oxygen and nitrogen in its structure; hence, n→π* transition may be responsible for absorption maxima around 285 nm [21].
The direct bandgap energy ( E g ) value for the green-synthesized YNPs was derived from the absorbance spectrum using the Tauc plot method, which is a theoretical correlation between the absorption coefficient (α) and the photon energy [22]:
α h υ n = B h ν E g
The absorption coefficient (α) was calculated using the measured absorbance (A):
α = 2.303 A t
In the equations, t represents the path length, B is a constant, and n is an exponent with a value of 2 for the direct bandgap transition, as depicted in Figure 6b [23]. The direct bandgap was determined from Tauc’s plot, estimated by extrapolating the linear segment of the Tauc plot curves (αhν)2 versus the photon energy to y = 0, as illustrated in Figure 6b. The YNPs exhibit a direct bandgap value of 4.32 eV. The width of the band tails of localized states is denoted as the Urbach energy ( E u ). The slope of the linear portion of the plot of lnα against photon energy (Figure 6c) is utilized to calculate the Urbach energy following Equation (3) [24]:
α = α 0 exp h ν E u
In the equation, α 0 represents a constant. Figure 6c illustrates the change in l n α with respect to h ν . The values of E u for the YNPs sample are derived from the reciprocal of the slope of the linear segment in the tail region, which is equivalent to 1.36 eV.

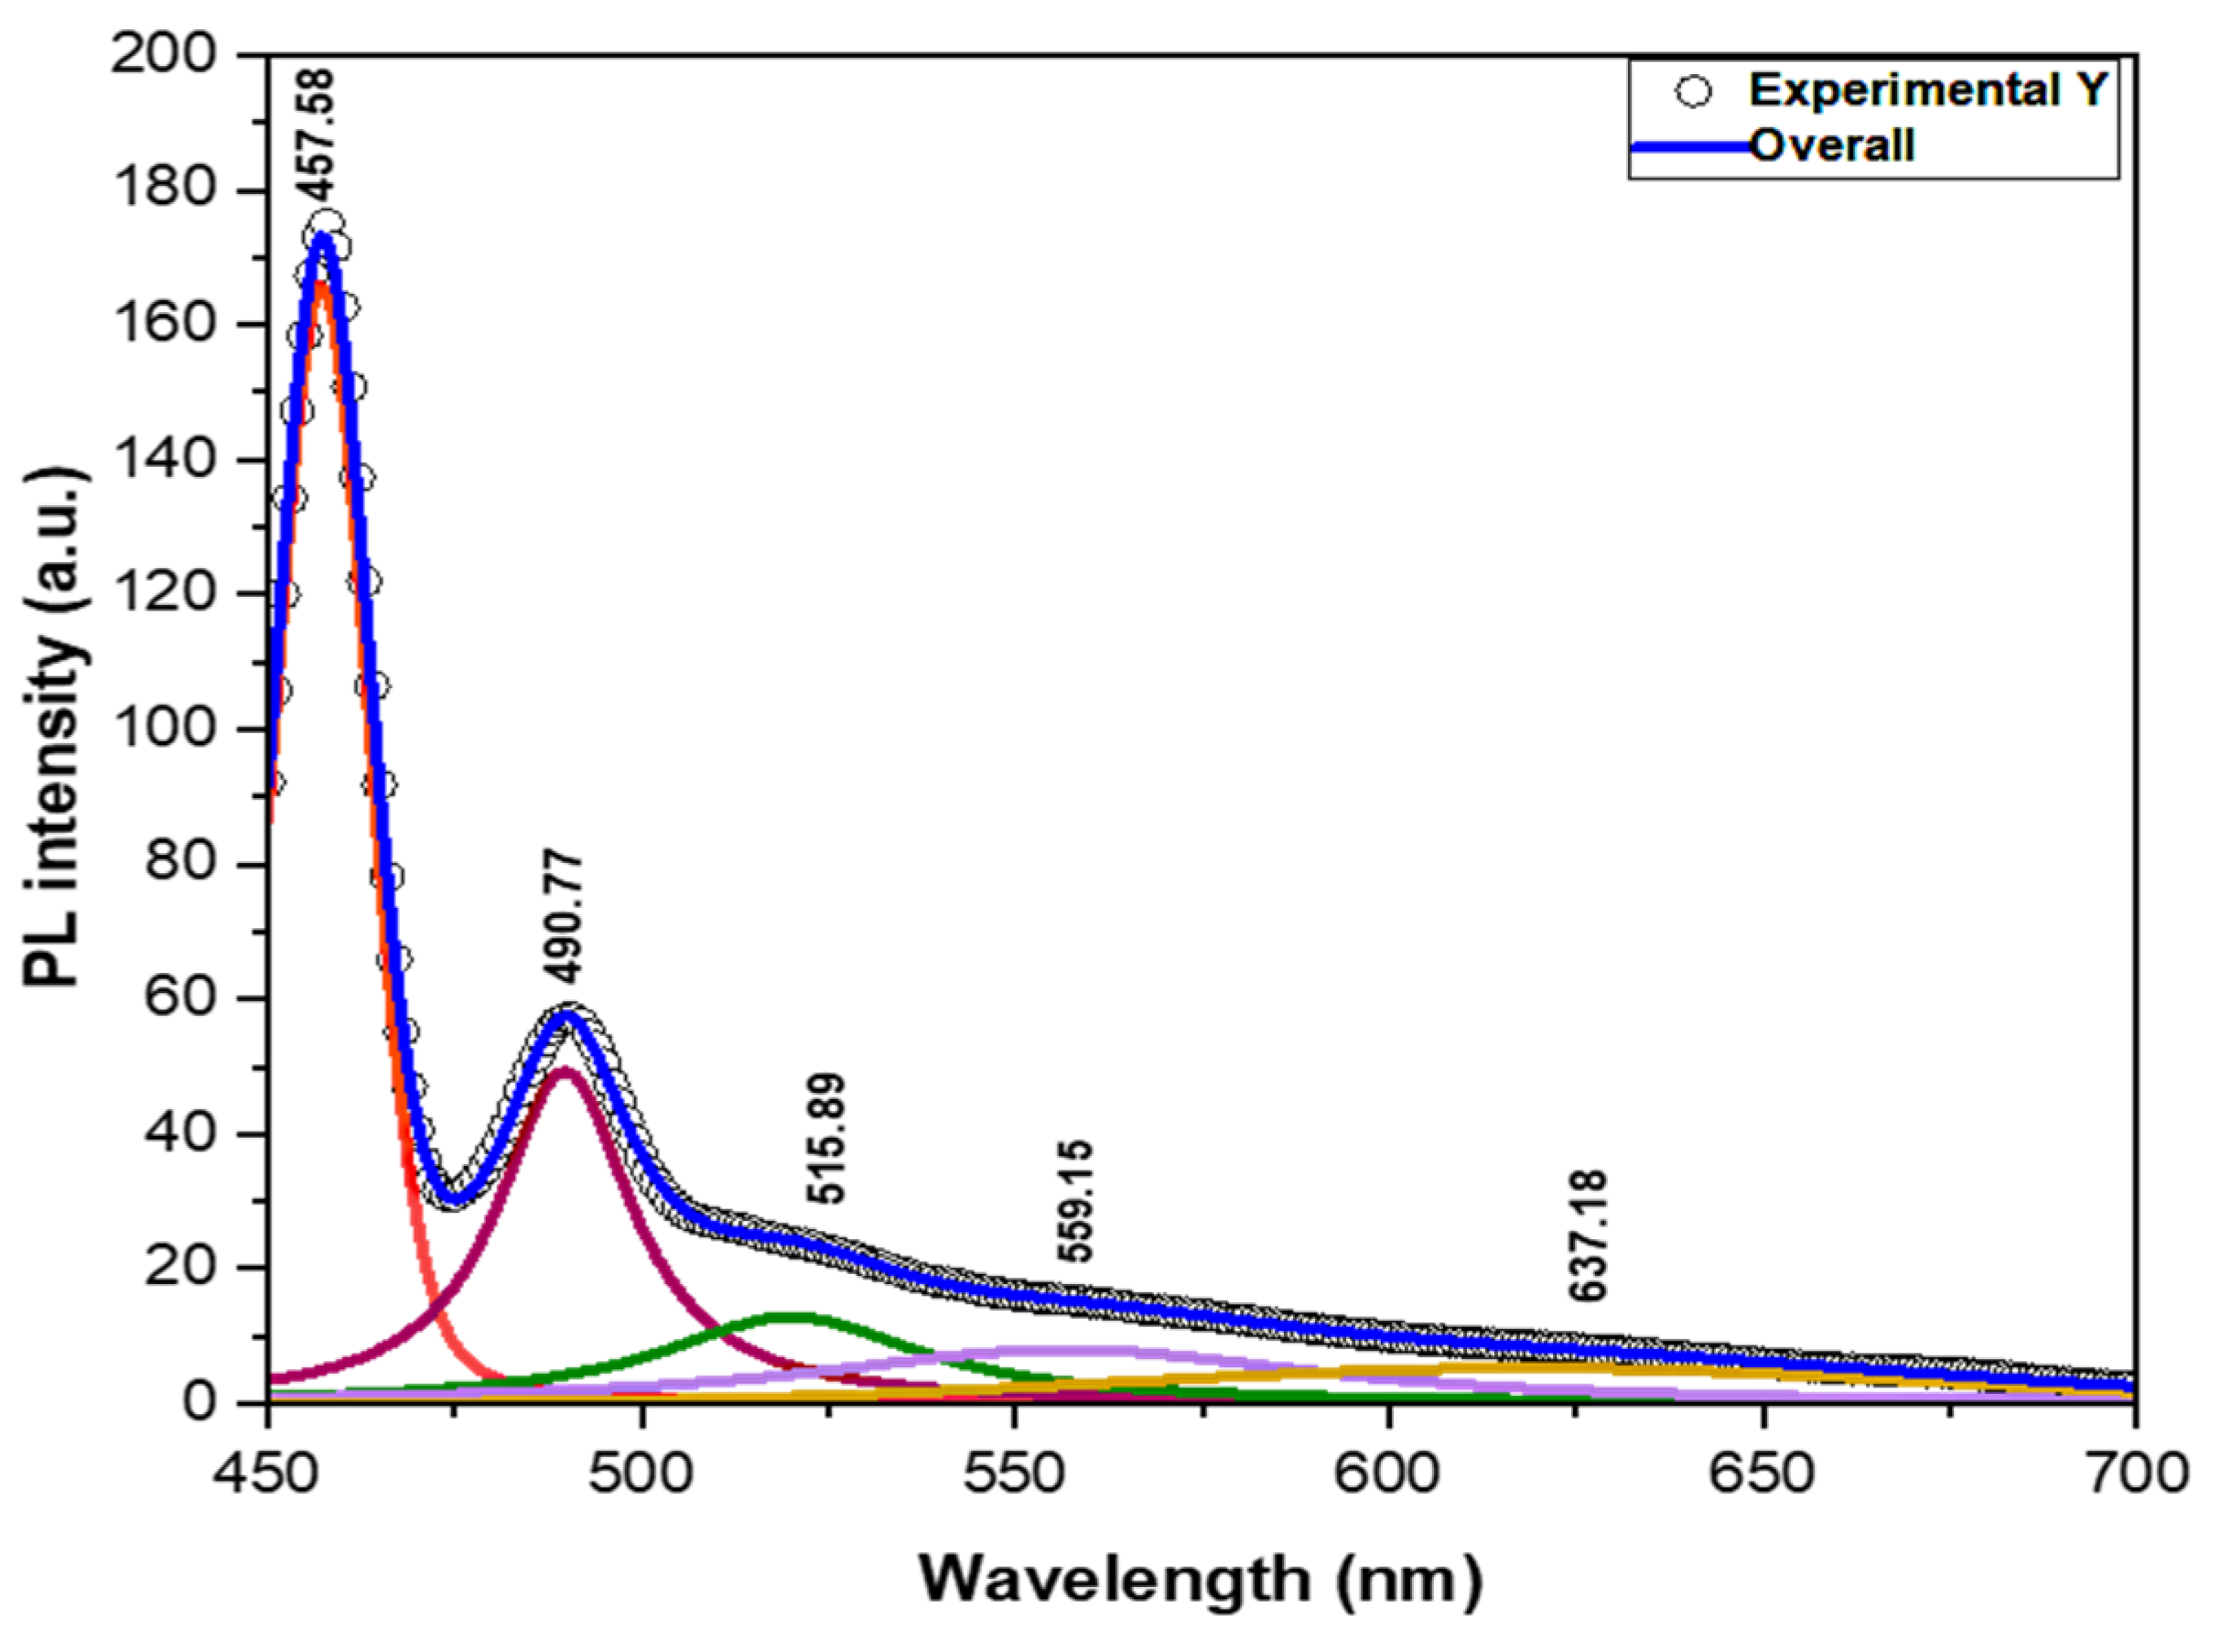
3.1.7. Photoluminescence (PL) Studies

The PL spectrum of the synthetic samples at room temperature is shown in the PL study (Figure 7). To explain this broad emission, a Voigt fitting analysis was used to deconvolve the PL curve of the YNPs into five different components, as illustrated in Figure 7. They include two blue emissions at 457.58 nm and 490.77 nm related to NP interactions; two green emissions at 515.89 nm and 559.15 nm originating from O vacancies; and one red emission peak at 637.18 nm.

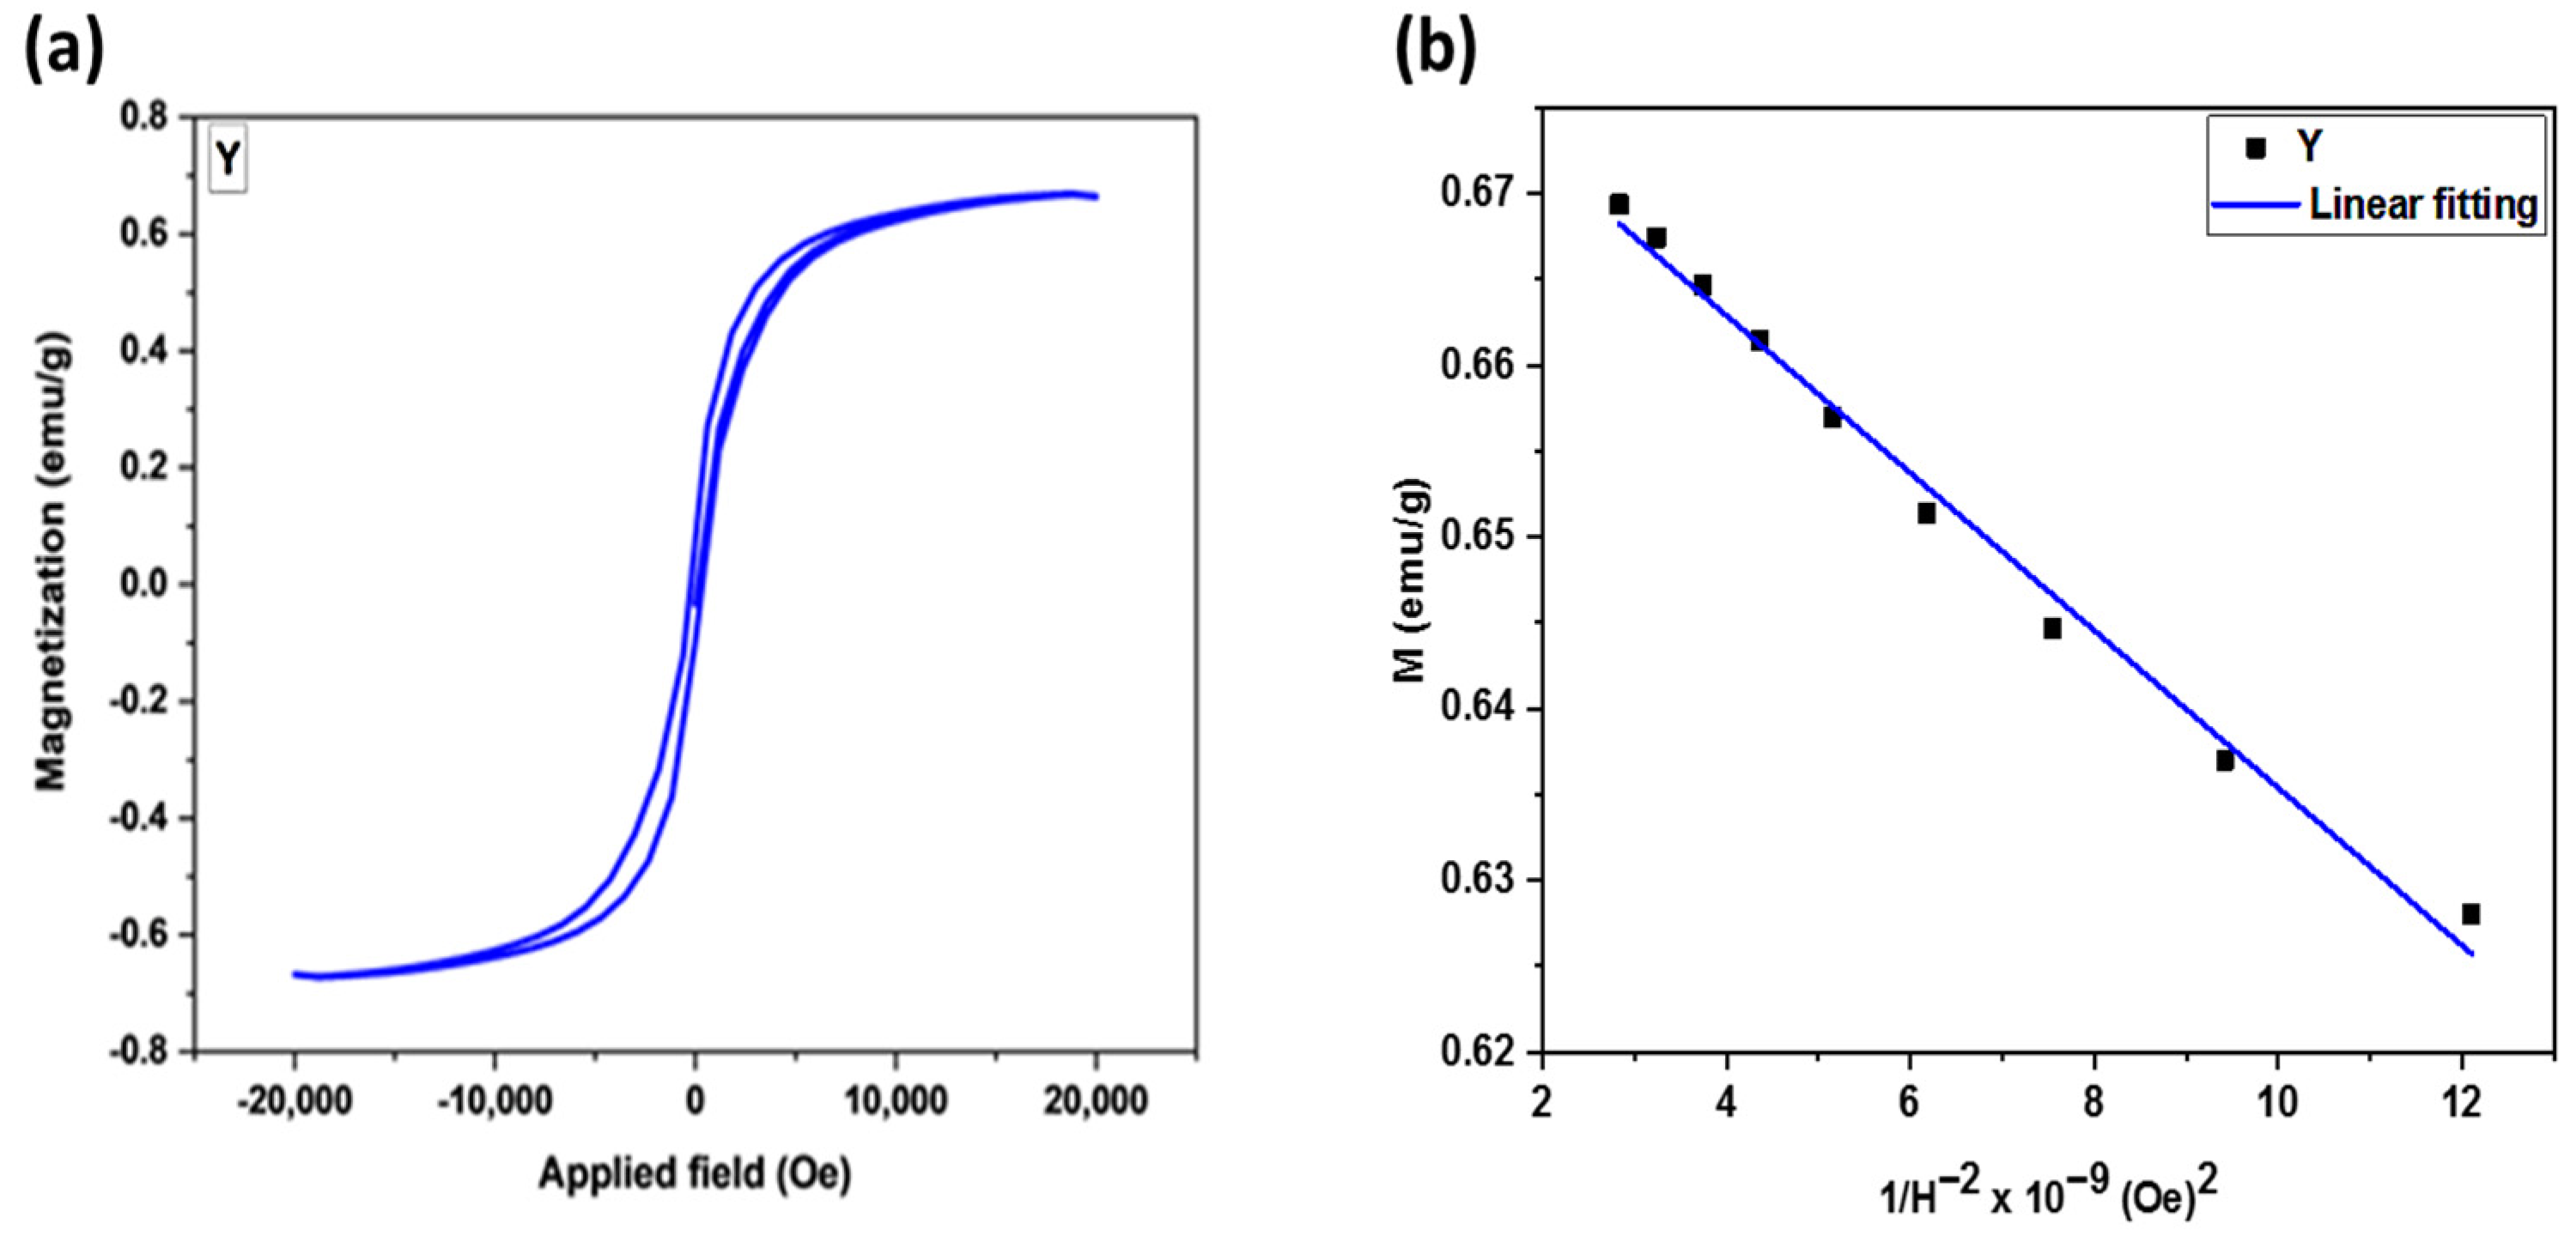
3.1.8. Vibrating Sample Magnetometer (VSM)

Using VSM, the magnetic behavior of the YNPs was investigated at room temperature using magnetic fields between −20 and +20 kG. For the synthesized YNPs, Figure 8a shows a magnetization versus applied field (M–H) plot. The hysteresis loop is indicative of weak ferromagnetism in YNPs. Generally, the yttrium compounds are known for their paramagnetic or diamagnetic nature, based on their sizes and coordination. However, interestingly, the yttrium derivatives synthesized in this study exhibit a favorable weak ferromagnetic nature. This may stem from the induced changes to the surface atoms, as their coordination environment and electronic states change upon quantum size-effects and deviate from the bulk state [25]. Specially, the crystallite size reduces to 1.696 nm, as seen from the XRD analysis. Moreover, due to the size reduction to the nano regime scale, multiple structural defects arise, including the vacancies, dislocations, grain boundaries, and stacking faults. These structural defects play a significant role in tuning the magnetic nature and possibly generating the ferromagnetic behavior [22,23]. Various magnetic parameters, such as magnetization at 20 kOe (M20kOe), retentivity (Mr), coercivity (Hci), and squareness values (S = Mr/MS), were measured and are listed in Table 2. Moreover, the saturation magnetization (MS) was derived from the law of approach to saturation [26]:
M = M S 1 b H 2
Figure 8b gives a linear fit for the magnetization as a function of 1/H2 at high-applied magnetic fields, from which the MS values were obtained. The obtained MS value for the YNPs is 0.681 emu/g.

3.2. Antibacterial Activity of the YNPs

3.2.1. Minimum Inhibitory Concentration (MIC) and Minimum Bactericidal Concentration (MBC) of the YNPs against the Bacterial Isolates

The results of the MIC and MBC microdilution assay presented in Table 3 and Figure S1 revealed that the YNPs had a bacteriostatic effect against all the bacterial isolates. No bactericidal activity was observed. The inhibitory concentrations ranged between 0.5 and 1 mg/mL for both Gram-positive and Gram-negative bacteria. Indeed, the green-synthesized NPs exert strong antibacterial actions. Both the Gram-positive and Gram-negative bacteria responded similarly to the YNPs, meaning that the main effector is the structure of the NPs.

3.2.2. Agar Well Diffusion Results of the Yttrium Nanoparticles against the Bacterial Isolates

The agar well diffusion results confirmed those of the MIC and MBC assay. The significant ZOIs ranging between 7 and 10 mm were observed at inhibitory concentrations ranging between 0.5 and 1 mg/mL for all the bacterial isolates as shown in Table 4 and Figure S2.

3.2.3. Inhibition of Bacterial Biofilm Formation and Destruction of Pre-Formed Bacterial Biofilms by the YNPs

Among the mentioned measurements, a percentage of inhibition above 10% was considered effective for biofilm inhibition, and negative percentages represent an enhancement of biofilm formation [11,27]. The YNPs were able to inhibit the formation of S. haemolyticus, E. faecalis, K. pneumonia, and P. aeruginosa biofilms, as shown in Figure 9a. The inhibitory concentrations reached about 86%, especially for P. aeruginosa. However, the destructive effect of the YNPs was weak. They were able to destroy K. pneumonia biofilm only with a percentage of destruction of 73.7%. However, the other biofilms were resistant, as presented in Figure 9b.

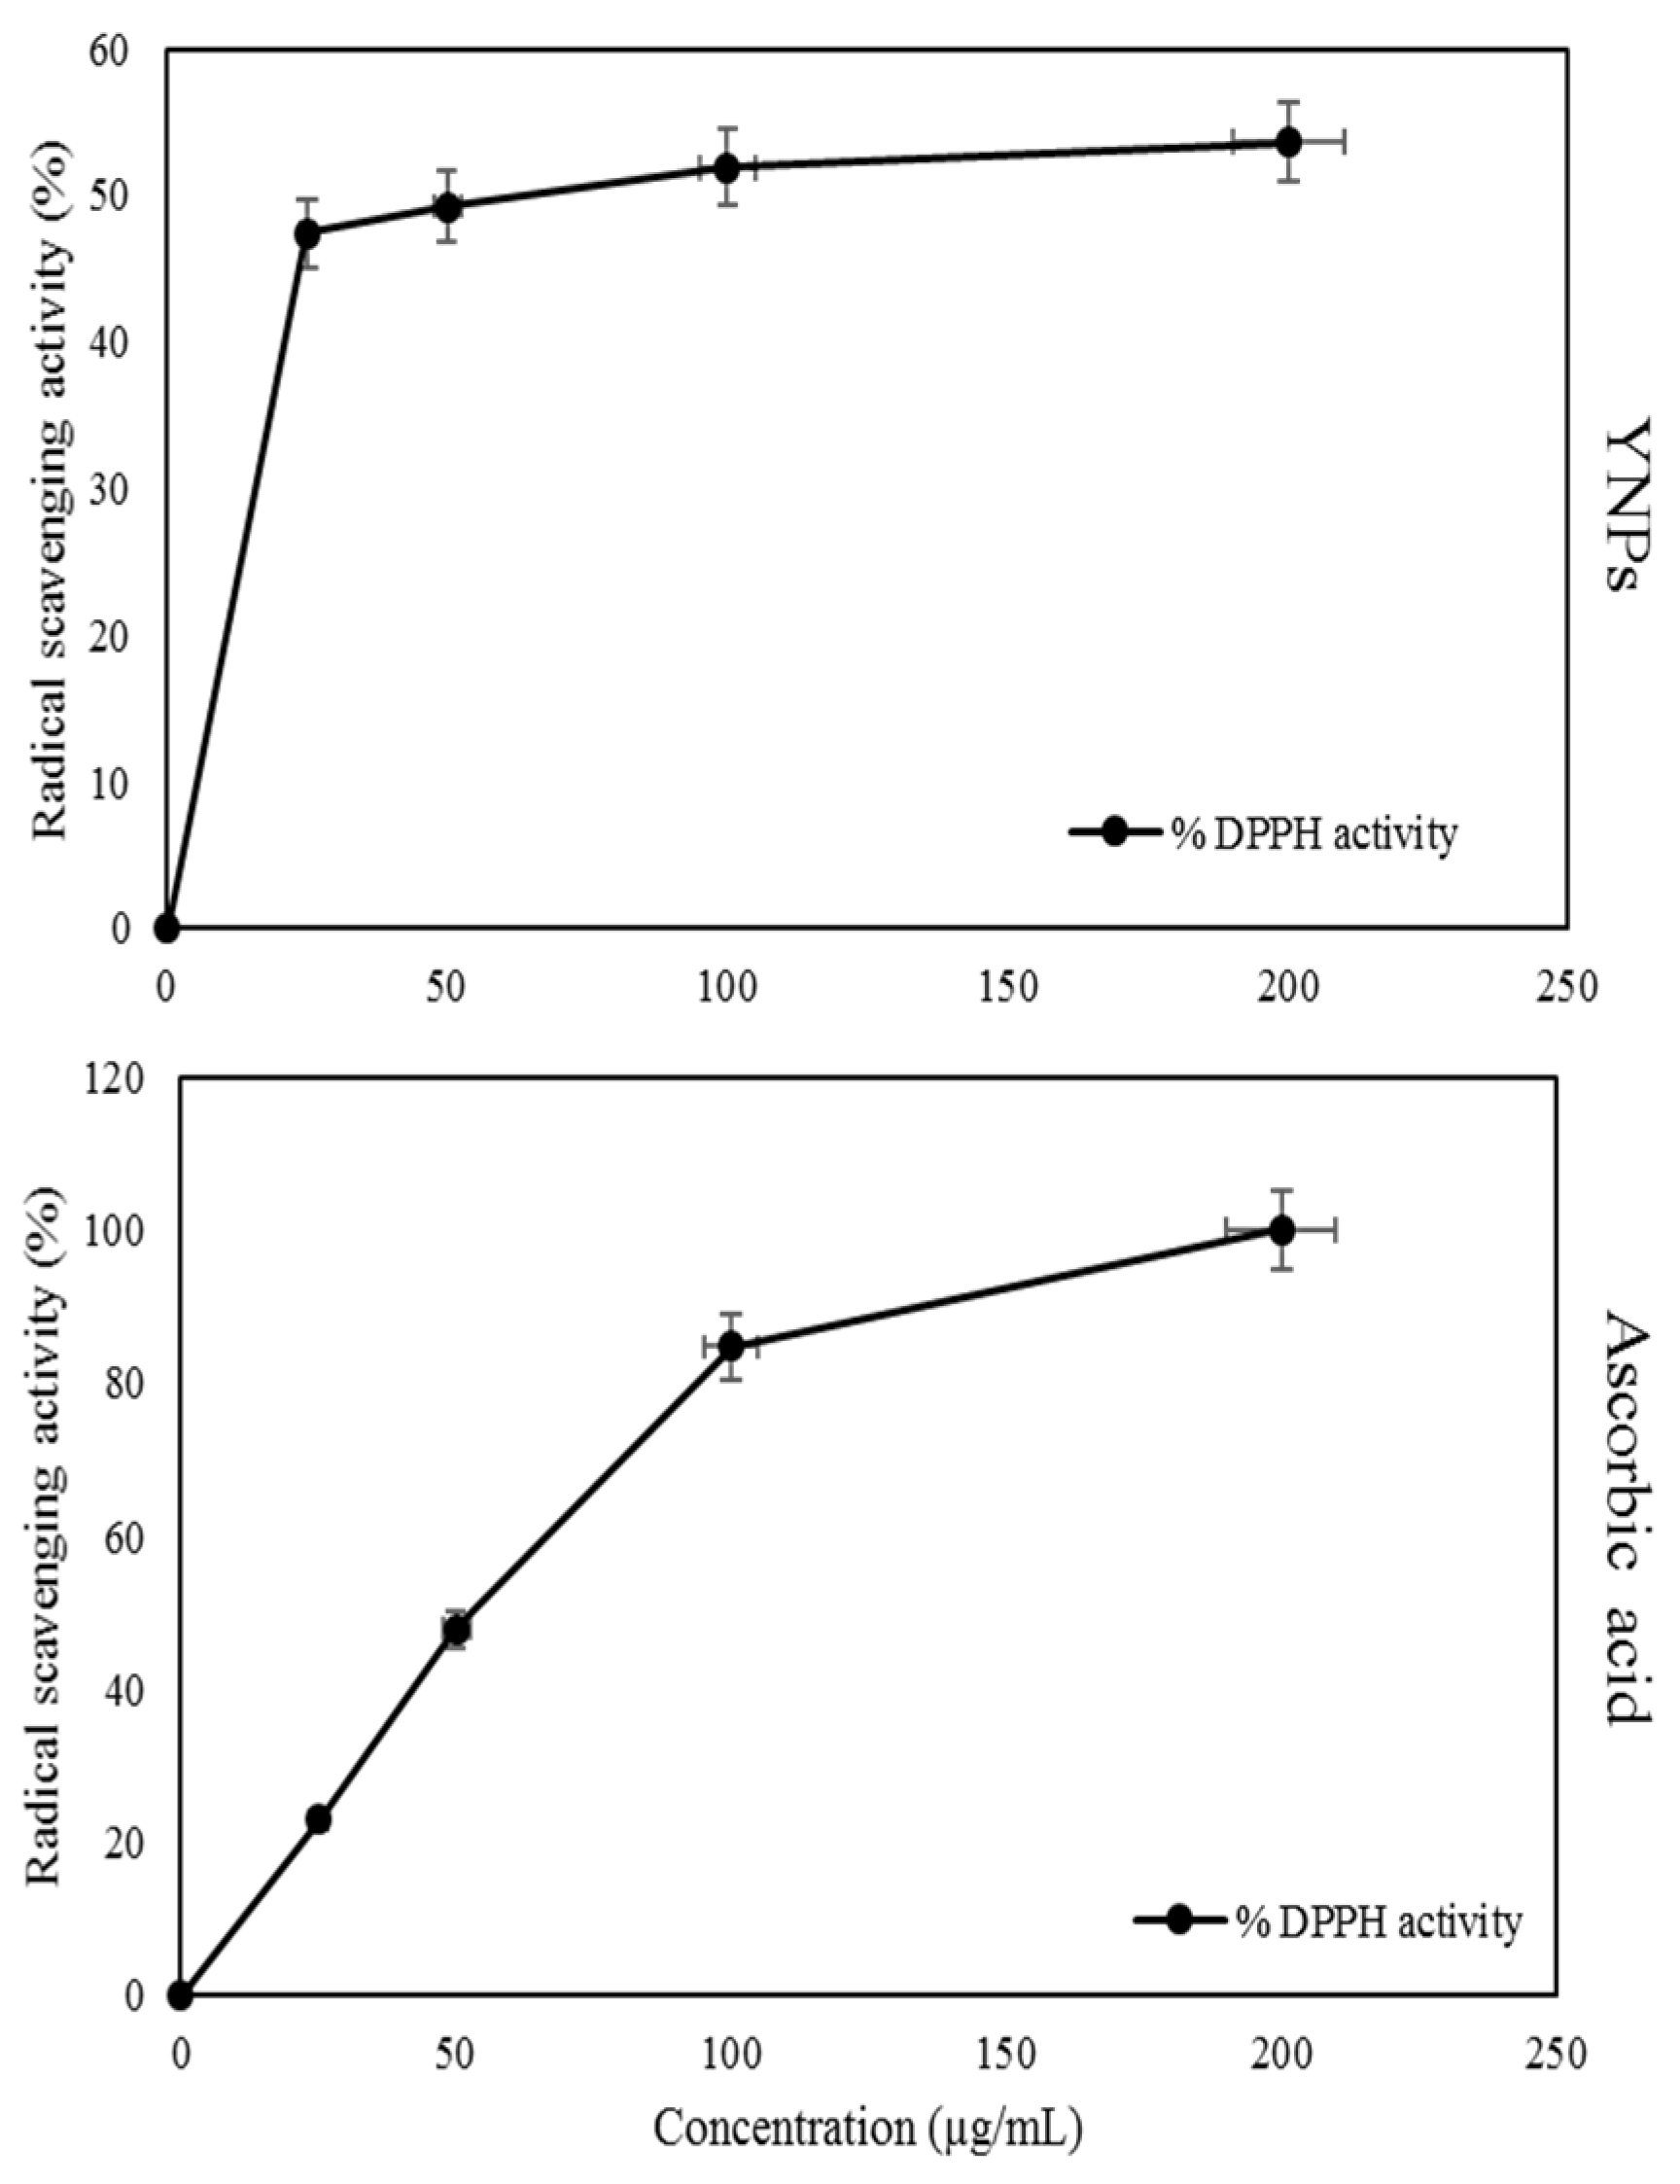
3.3. Antioxidant Radical Scavenging Activity Results of the YNPs against DPPH

The antioxidant results of the YNPs have a significant action against DPPH. The radical scavenging percentage reached 53.6%, as presented in Figure 10. The positive control (ascorbic acid) also showed 100% activity.

3.4. Molecular Docking of the YNPs with Antibacterial Target Proteins

DNA gyrase is an enzyme that plays a crucial role in DNA replication and repair processes in E. coli. According to the analysis of docking results (Table 5), the docking of YNPs has an affinity interaction of −12.54 kcal/mol. The YNPs formed seven hydrogen bonds with Asn46, Val120, Ser121, Glu42, Asn46, Asn46, and Gly119. Also, hydrophobic contacts, including one carbon–hydrogen bond with Gly119 and a metal acceptor with Asn46, were formed within the activity pocket. Furthermore, it can be observed that common residues, Asn46, Val120, Ser121, and Gly119, in the catalytic site enhance the binding affinity (Figure 11A–C). Penicillin-binding proteins (PBPs) are a group of enzymes found in E. faecalis that play a key role in cell wall synthesis. The calculated binding energies of YNPs with PBPs were −8.90 kcal/mol. The YNPs formed eight hydrogen bonds with Ser367, Thr418, Tyr420, Ile550, Gln552, Met654, Ile547, and Phe416 in the activity pocket. Also, hydrophobic contacts included one carbon–hydrogen bond with Phe416 and one Pi–donor hydrogen bond with Tyr420. In addition, it can be observed that common residues like Ser367, Ile550, and Tyr420 in the catalytic site enhance the binding affinity (Figure 11D–F). KPC-2 carbapenemase is an important enzyme associated with antibiotic resistance in K. pneumoniae. KPC-2 belongs to class A of the Ambler classification system for beta-lactamases. According to docking results, YNPs have an affinity interaction of −10.22 kcal/mol. Also, hydrophilic interaction formed ten hydrogen bonds with Ser71, Arg161, Ser181, Ser182, Val186, Tyr247, Tyr264, Thr180, Pro67, and Phe66. Also, three carbon–hydrogen bond interactions within the activity pocket with Leu68, Phe72, and Val186 were formed. Also, two metal–acceptor bonds with Tyr247 and Tyr264. Furthermore, it can be observed that the residues Ser182, Tyr264, and Phe72 in the catalytic site enhance the binding affinity (Figure 11G–I). The LasR-binding protein, produced by P. aeruginosa, contributes to the pathogenicity. According to docking results, YNPs have an affinity interaction, of −8.90 kcal/mol. It formed six hydrogen bonds with Gly38, Arg61, Ala127, Asp73, Tyr47, and Tyr64. Also, two hydrophobic interactions, a Pi–Lone pair and Pi–Donor hydrogen bonds, with Tyr64 and Tyr47 were formed. Furthermore, it can be observed that the amino acids, Gly38, Arg61, Ala127, and Tyr64, in the catalytic site enhance the binding affinity (Figure 11J–L). Dihydropteroate synthase is an enzyme that participates in the synthesis of folate, a precursor molecule necessary for folate, a vital cofactor involved in the production of nucleotides. As indicated by the docking outcomes, the interaction between YNPs and DHPS exhibited an affinity of −6.87 kcal/mol. Notably, YNPs established five hydrogen bonds with Asn11, Arg52, Lys203, Gln105, and Arg239 (Figure 11M–O). Finally, Lincosamide adenylyl transferase is an enzyme produced by S. haemolyticus that confers resistance to antibiotics, including clindamycin. The computed binding energies of YNPs were determined to be −9.44 kcal/mol. Throughout the activity pocket, it formed six hydrogen bonds with Arg78, His92, Asp48, Phe140, Asp28, and Gly29. Additionally, there were hydrophobic contacts involving two carbon–hydrogen bonds with Gly29 and His92 (Figure 11P–R). Docking studies have been employed to predict the inhibition of various bacterial enzymes. However, it is important to note that these predictions have not been experimentally validated. Future work should focus on experimental validation to confirm the inhibitory effects. The list of protein targets, PDB IDs, resolution, and active site coordinates are represented in Table S1.

4. Discussion

In the framework of studying bacterial infections and multidrug resistance, our study focused on synthesizing YNPs from PNLE and testing their antibacterial, antioxidant, and docking potencies.
Different characterization techniques were applied to reveal the structural morphology of the YNPs. The XRD patterns revealed many peaks. Most importantly, the presence of the (211) and (440) planes in our results is consistent with a previous study [14], which used Lantana camara leaf extracts for synthesizing Y oxide NPs. The size change in the YNPs can be attributed to a decrease in flame temperature during combustion. Also, for particle sizes less than 8 nm, the structure is expected to be monoclinic due to the effect of surface tension [28]. For the TEM analysis, the results are very similar to those obtained with L. camara leaf extracts, possibly due to the presence of similar reducing agents in both plant species [13]. Another study using Lantana camara leaf extracts revealed an average particle size of 30 nm, which is slightly higher than the values obtained in this study [13]. This size is also significantly greater than the average size observed when using Agathosma betulina extract (13 nm), indicating a variation in particle size depending on the type of botanical extract used in the synthesis process. The XPS data revealed the presence of different chemical elements. Most importantly, the presence of C and N elements is due to the adsorption of phyto-molecules from the PNLE on the surface of NPs [29]. The presence of C is important because it acts as a reference point for other elements that can be more accurately plotted for significantly improved XPS spectra [30]. In addition, the HR–O–1s peak may include two components with binding energies at 530.940 eV (due to the bond between O and Y) and 532.18 eV (down to the bonds of OH and Y) [30]. Information about the elemental composition and atomic percentages suggests that the presence of O1s signifies an accelerated oxidization as well as the probable formation of oxides like yttria (Y2O3), generally resulting from the interaction between Y and O. The presence of Y-3d indicates its existence primarily in an oxidized state. The EDX analysis focused on the presence of N-1s and P-2p, which implicates possible nitridation or contamination together with the inclusion of phosphate during synthesis. For their shape, the study reveals that the YNPs are generally spherical, but they form clusters with different nano-diameters, a finding already reported by Porosnicu et al. [31]. The shape and dimensions of these NPs may be influenced by the organic compounds or reducing agents found in the extract. Reduction takes place because certain chemical substances interact with these particles [32]. In addition, SEM analysis of the YNPs indicates indistinct circular morphologies of the aggregated particles, which is consistent with earlier studies involving Y oxide NPs [15]. The O peak could be due to X-ray emissions from free amino groups, proteins, or enzymes present in the extract, while C traces may have resulted from the C tape used during sample preparation [31]. There may also be a weak Cl peak, which might be a result of X-ray emission by carbohydrates or proteins, as well as organic molecules attached to the YNP surfaces in this extract itself [33]. The FTIR data revealed the presence of different functional groups that are directly associated with the biological actions of the YNPs. This helps in the identification of biomolecules [34]. The main action relies on the asymmetrical stretching of the C–O bond due to CO2 absorption from air, whose peak lies at about 2352.80 cm−1 since, after drying the precursor or exposing the dried powder to air, Y hydroxide, like other lanthanides, can absorb CO2 from the atmosphere [13]. The results obtained by the UV–vis spectra are comparable with findings documented in prior studies. They closely align with the energy gap reported in the literature for Y2O3 NPs prepared at pH = 9 via the co-precipitation method, which was found to be 4.47 eV [35]. However, they are less than the value obtained through green synthesis using A. betulina, which was found to be 5.67 eV [36]. Furthermore, the visible luminescence of YNPs is due to electron–hole pair recombination between the sp-conduction band and d-band above the Fermi level [22]. The VSM analysis revealed the ferromagnetic characteristics of the NPs. It has been predicted that ferromagnetic spin polarization could happen for transition metals in groups 4d and 5d with low coordination numbers because of their high ratio of surface atoms to core atoms. Hence, this spin polarization was suggested to be responsible for the observed magnetism in the YNPs, and this is associated with surface defects due to the small particle size of biosynthesized NPs [37]. It is also reported that the presence of O may play a role in the ferromagnetic properties, and part thereof is due to the non-stoichiometric oxide layer on its surface. Ferromagnetism is a relatively rare characteristic, typically found only in the transition metals iron (Fe), nickel (Ni), and cobalt (Co), as well as in the lanthanides (rare earth elements, REEs) [38]. Y, a transition metal with an atomic number of 39, shares chemical similarities with the lanthanides (atomic numbers 57–71). Interestingly, Y is never found as a free element on Earth; it is usually combined with other lanthanide elements.
The antibacterial results revealed bacteriostatic actions of the YNPs. These findings are reported in many previous studies focusing on the synthesis of NPs from plant extracts. However, the weak effect observed in our study could be explained by the difference in the composition of the YNPs, as well as their interaction with the bacterial cells. The XRD profiles reported a small size of the YNPs (15–20 nm). This means that the NPs are small enough to penetrate the bacterial cells and cause death. However, the TEM results revealed the formation of aggregates within the NPs. It has been reported that the aggregation and agglomeration of the NPs decreases their antibacterial potential [39]. In addition, aggregation of the NPs leads to an increase in the bandgap energy as revealed by the UV–vis results and causes accelerated oxidation states as shown by the XPS results. This could decrease their efficiency in the antibacterial domain. Rabaa et al. [40] reported that the increased bandgap energy decreases the antibacterial potential due to the deficiency in oxygen vacancies. This in turn decreases the production of the reactive oxygen species (ROS), thus weakening the antibacterial potential [40]. In addition, the agar well diffusion results were similar to those of the MIC and MBC assay. The obtained results can be explained by the spherical shape of the YNPs detected by the TEM profiles. Previous literature reported that sharp-edge NPs exert better antibacterial activities than spherical NPs [34,35,36]. In addition, the aggregation of the NPs cause an increase in their size, thus limiting their capability of interacting with the bacteria and penetrating the internal compartments [40]. It is worth mentioning that, in addition to the production of ROS, many antibacterial mechanisms have been reported. These include penetration into the bacterial cell, anchoring the bacterial cell wall, and causing structural changes in the membrane [10].
For the antibiofilm potential of the YNPs, the observed inhibitory activity could be explained by the ability of the small-sized YNPs to interact with the cells of the biofilm and disperse them, leading to their unattachment [41]. In addition, the YNPs can interact with the exopolysaccharides and proteins secreted by the biofilms, thus causing morphological changes in the biofilm structure and eventually leading to complete cell lysis [40,41,42,43]. Note that the inhibitory concentrations were independent of the MICs, in which the biofilms were inhibited at concentrations different from those reported by the mic and MBC microdilution assay. This could be due to the enumeration and absorbance of the biofilm cells [11].
The antioxidant activity reported by the DPPH assay could be explained by the adsorption of different bioactive compounds like flavonoids and polyphenols. This plays an important role in the antioxidant activity [44]. In addition, the YNPs are shown to act as reducing agents to increase the antioxidant activity and produce hydrogen peroxide. This increases the production of ROS, which acts as the main inducer of antioxidation [44]. It has been reported that NPs are applied as antioxidants that decrease the oxidative stress. For example, Prabitha et al. reported that Y-doped NPs were able to induce stability and ability to scavenge free radicals [10].
The different findings revealed by the docking technique align with Siddique et al. (2024) [45], who employed molecular docking simulations to investigate the antibacterial effects of YNPs against DNA gyrase, as well as Ayub et al. (2023) [46], who demonstrated the efficacy of Y-doped La2O3 nanostructures against DNA gyrase in E. coli through in silico docking studies. In addition, the results are consistent with those of Ikram et al. (2023) [47], who utilized in silico docking to investigate the inhibitory effect of nanomaterials on PBPs involved in cell wall synthesis. Furthermore, the in silico docking of LasR binding protein, produced by P. aeruginosa used as a protein target with nanomaterials to demonstrate a potential inhibitory effect [47].
Overall, the bio-synthesized YNPs exhibit potential in the biological domains, especially in the antibacterial, antioxidant, and docking approaches.

5. Conclusions

This study reported the green synthesis of YNPs from PNLE, their characterization, and their antibacterial, antibiofilm, and antioxidant activities. The XRD profiles revealed NPs of size 1.696 nm. The TEM analysis revealed nearly uniform sheet-like and spherical particles, along with particle aggregates. The PL results assured two blue emissions at 457.58 nm and 490.77 nm related to NP interactions, two green emissions at 515.89 nm and 559.15 nm originating from O vacancies. The UV–vis revealed profiles with a bandgap energy of 4.23. The VSM profiles showed NPs with ferromagnetic properties. The antibacterial activity of the YNPs was tested against uropathogenic bacteria, including S. aureus, S. haemolyticus, E. faecalis, E. coli, K. pneumonia, and P. aeruginosa. The YNPs exerted bacteriostatic activity against all bacterial isolates. In addition, they showed significant antibiofilm activity against most biofilms. The antioxidant potential was reported at about 50% of the scavenging DPPH activity. The docking studies have revealed that YNPs possess the ability to inhibit essential enzymes, namely DNA gyrase, penicillin-binding proteins, carbapenemase, LasR-binding protein, and dihydropteroate synthase. By targeting and interacting with these critical enzymes, YNPs disrupt key cellular processes involved in DNA replication, cell wall formation, antibiotic resistance, and pathogenicity. This inhibition ultimately leads to the observed antibacterial activity of YNPs. Overall, this study revealed a good potential of the tested YNPs in the biological domains, thus opening a way to use them in the medical domains.

Supplementary Materials

The following supporting information can be downloaded at: https://www.mdpi.com/article/10.3390/pr12081713/s1, Figure S1: MIC results of the YNPs against the bacterial isolates. Figure S2: Agar well diffusion results of the YNPs against the bacterial isolates; Table S1: List of targets, PDB IDs, resolution, and active site coordinates.

Author Contributions

Conceptualization, R.E.H., T.A.H. and M.I.K.; data curation, N.A.D., M.M., A.F.E.-S. and M.I.K.; formal analysis, N.A.D., M.M., R.E.H., T.A.H. and M.I.K.; investigation, N.A.D., R.E.H., T.A.H. and M.I.K.; methodology, N.A.D., M.M., A.M.A., A.F.E.-S., R.E.H., T.A.H. and M.I.K.; project administration, M.I.K.; software, N.A.D., M.M., A.M.A. and A.F.E.-S.; supervision, R.E.H. and M.I.K.; validation, A.F.E.-S., R.E.H., T.A.H. and M.I.K.; writing—original draft, N.A.D.; writing—review and editing, N.A.D., M.M., A.M.A., R.E.H., T.A.H. and M.I.K. All authors have read and agreed to the published version of the manuscript.

Funding

This research received no external funding.

Data Availability Statement

All data of this study are included in the manuscript. Raw data are available from the corresponding upon reasonable request.

Conflicts of Interest

The authors declare no conflicts of interest.

References

  1. Makowski, M.; Silva, Í.C.; Pais Do Amaral, C.; Gonçalves, S.; Santos, N.C. Advances in Lipid and Metal Nanoparticles for Antimicrobial Peptide Delivery. Pharmaceutics 2019, 11, 588. [Google Scholar] [CrossRef]
  2. Gupta, A.; Mumtaz, S.; Li, C.-H.; Hussain, I.; Rotello, V.M. Combatting antibiotic-resistant bacteria using nanomaterials. Chem. Soc. Rev. 2019, 48, 415–427. [Google Scholar] [CrossRef]
  3. Jamkhande, P.G.; Ghule, N.W.; Bamer, A.H.; Kalaskar, M.G. Metal nanoparticles synthesis: An overview on methods of preparation, advantages and disadvantages, and applications. J. Drug Deliv. Sci. Technol. 2019, 53, 101174. [Google Scholar] [CrossRef]
  4. Chakra, C.S.; Rajendar, V.; Rao, K.V.; Kumar, M. Enhanced antimicrobial and anticancer properties of ZnO and TiO2 nanocomposites. 3 Biotech 2017, 7, 89. [Google Scholar] [CrossRef]
  5. Perveen, A.; Molardi, C.; Fornaini, C. Applications of Laser Welding in Dentistry: A State-of-the-Art Review. Micromachines 2018, 9, 209. [Google Scholar] [CrossRef]
  6. Thompson, L.A.; Darwish, W.S. Environmental Chemical Contaminants in Food: Review of a Global Problem. J. Toxicol. 2019, 2019, 2345283. [Google Scholar] [CrossRef]
  7. Bahrulolum, H.; Nooraei, S.; Javanshir, N.; Tarrahimofrad, H.; Mirbagheri, V.S.; Easton, A.J.; Ahmadian, G. Green synthesis of metal nanoparticles using microorganisms and their application in the agrifood sector. J. Nanobiotechnol. 2021, 19, 86. [Google Scholar] [CrossRef]
  8. Andelman, T.; Gordonov, S.; Busto, G.; Moghe, P.V.; Riman, R.E. Synthesis and Cytotoxicity of Y2O3 Nanoparticles of Various Morphologies. Nanoscale Res. Lett. 2010, 5, 263. [Google Scholar] [CrossRef]
  9. Chang, M.; Tie, S. Fabrication of novel luminor Y2O3: Eu3+@SiO2@YVO4 Eu3+ with core/shell heteronanostructure. Nanotechnology 2008, 19, 075711. [Google Scholar] [CrossRef] [PubMed]
  10. Prabitha, V.G.; Sahadevan, J.; Madhavan, M.; Muthu, S.E.; Kim, I.; Sudheer, T.K.; Sivaprakash, P. Effect of Yttrium doping on antibacterial and antioxidant property of LaTiO3. Discov. Nano 2023, 18, 155. [Google Scholar] [CrossRef]
  11. Mezher, M.; Hajj, R.E.; Khalil, M. Investigating the antimicrobial activity of essential oils against pathogens isolated from sewage sludge of southern Lebanese villages. GERMS 2022, 12, 488–506. [Google Scholar] [CrossRef]
  12. Baliyan, S.; Mukherjee, R.; Priyadarshini, A.; Vibhuti, A.; Gupta, A.; Pandey, R.P.; Chang, C.-M. Determination of Antioxidants by DPPH Radical Scavenging Activity and Quantitative Phytochemical Analysis of Ficus religiosa. Molecules 2022, 27, 1326. [Google Scholar] [CrossRef]
  13. Govindasamy, R.; Govindarasu, M.; Alharthi, S.S.; Mani, P.; Bernaurdshaw, N.; Gomathi, T.; Ansari, M.A.; Alomary, M.N.; Atwah, B.; Malik, M.S.; et al. Sustainable Green Synthesis of Yttrium Oxide (Y2O3) Nanoparticles Using Lantana camara Leaf Extracts: Physicochemical Characterization, Photocatalytic Degradation, Antibacterial, and Anticancer Potency. Nanomaterials 2022, 12, 2393. [Google Scholar] [CrossRef]
  14. Shivaramu, N.J.; Lakshminarasappa, B.N.; Nagabhushana, K.R.; Singh, F. Synthesis characterization and luminescence studies of gamma irradiated nanocrystalline yttrium oxide. Spectrochim. Acta Part A Mol. Biomol. Spectrosc. 2016, 154, 220–231. [Google Scholar] [CrossRef]
  15. Kannan, S.K.; Sundrarajan, M. Biosynthesis of Yttrium oxide nanoparticles using Acalypha indica leaf extract. Bull. Mater. Sci. 2015, 38, 945–950. [Google Scholar] [CrossRef]
  16. Amanzadeh, E.; Esmaeili, A.; Abadi, R.E.N.; Kazemipour, N.; Pahlevanneshan, Z.; Beheshti, S. Quercetin conjugated with superparamagnetic iron oxide nanoparticles improves learning and memory better than free quercetin via interacting with proteins involved in LTP. Sci. Rep. 2019, 9, 6876. [Google Scholar] [CrossRef]
  17. Emamzadeh Yazdi, S.; Heyman, H.M.; Prinsloo, G.; Klimkait, T.; Meyer, J.J.M. Identification of Anti-HIV Biomarkers of Helichrysum Species by NMR-Based Metabolomic Analysis. Front. Pharmacol. 2022, 13, 904231. [Google Scholar] [CrossRef]
  18. Aghazadeh, M.; Ghaemi, M.; Nozad Golikand, A.; Yousefi, T.; Jangju, E. Yttrium Oxide Nanoparticles Prepared by Heat Treatment of Cathodically Grown Yttrium Hydroxide. ISRN Ceram. 2011, 2011, 542104. [Google Scholar] [CrossRef]
  19. Wörner, H.J.; Arrell, C.A.; Banerji, N.; Cannizzo, A.; Chergui, M.; Das, A.K.; Hamm, P.; Keller, U.; Kraus, P.M.; Liberatore, E.; et al. Charge migration and charge transfer in molecular systems. Struct. Dyn. 2017, 4, 061508. [Google Scholar] [CrossRef]
  20. Luis Aleixandre-Tudo, J.; Du Toit, W. The Role of UV-Visible Spectroscopy for Phenolic Compounds Quantification in Winemaking. In Frontiers and New Trends in the Science of Fermented Food and Beverages; Lidia Solís-Oviedo, R., De La Cruz Pech-Canul, Á., Eds.; IntechOpen: London, UK, 2019. [Google Scholar] [CrossRef]
  21. Sisa, M.; Bonnet, S.L.; Ferreira, D.; Van Der Westhuizen, J.H. Photochemistry of Flavonoids. Molecules 2010, 15, 5196–5245. [Google Scholar] [CrossRef]
  22. Verma, A.; Mehata, M.S. Controllable synthesis of silver nanoparticles using Neem leaves and their antimicrobial activity. J. Radiat. Res. Appl. Sci. 2016, 9, 109–115. [Google Scholar] [CrossRef]
  23. Al-Otibi, F.; Perveen, K.; Al-Saif, N.A.; Alharbi, R.I.; Bokhari, N.A.; Albasher, G.; Al-Otaibi, R.M.; Al-Mosa, M.A. Biosynthesis of silver nanoparticles using Malva parviflora and their antifungal activity. Saudi J. Biol. Sci. 2021, 28, 2229–2235. [Google Scholar] [CrossRef]
  24. Bashir, B.; Khalid, M.U.; Aadil, M.; Zulfiqar, S.; Warsi, M.F.; Agboola, P.O.; Shakir, I. CuxNi1−xO nanostructures and their nanocomposites with reduced graphene oxide: Synthesis, characterization, and photocatalytic applications. Ceram. Int. 2021, 47, 3603–3613. [Google Scholar] [CrossRef]
  25. Cursaru, L.M.; Piticescu, R.M.; Dragut, D.V.; Tudor, I.A.; Kuncser, V.; Iacob, N.; Stoiciu, F. The Influence of Synthesis Parameters on Structural and Magnetic Properties of Iron Oxide Nanomaterials. Nanomaterials 2020, 10, 85. [Google Scholar] [CrossRef]
  26. El-Said Bakeer, D. Investigation on Optical, Dielectric, and Magnetic Properties of CoAl2−xFexO4 Nanoparticles. J. Supercond. Nov. Magn. 2020, 33, 1789–1801. [Google Scholar] [CrossRef]
  27. Adnan, R.; Abdallah, A.M.; Mezher, M.; Noun, M.; Khalil, M.; Awad, R. Impact of Mg-doping on the structural, optical, and magnetic properties of CuO nanoparticles and their antibiofilm activity. Phys. Scr. 2023, 98, 055935. [Google Scholar] [CrossRef]
  28. Zhang, X.; Yang, C.; Zhou, J.; Huo, M. Somatostatin Receptor-Mediated Tumor-Targeting Nanocarriers Based on Octreotide-PEG Conjugated Nanographene Oxide for Combined Chemo and Photothermal Therapy. Small 2016, 12, 3578–3590. [Google Scholar] [CrossRef]
  29. Kapoor, R.T.; Salvadori, M.R.; Rafatullah, M.; Siddiqui, M.R.; Khan, M.A.; Alshareef, S.A. Exploration of Microbial Factories for Synthesis of Nanoparticles—A Sustainable Approach for Bioremediation of Environmental Contaminants. Front. Microbiol. 2021, 12, 658294. [Google Scholar] [CrossRef]
  30. Khan, A.; Fayyaz, O.; Shakoor, R.A.; Mansoor, B. Recent Trends in Applications of X-ray Photoelectron Spectroscopy (XPS) Technique in Coatings for Corrosion Protection. In Recent Developments in Analytical Techniques for Corrosion Research; Toor, I.U., Ed.; Springer: Cham, Switzerland, 2022; pp. 167–186. [Google Scholar] [CrossRef]
  31. Porosnicu, I.; Butnaru, C.M.; Tiseanu, I.; Stancu, E.; Munteanu, C.V.A.; Bita, B.I.; Duliu, O.G.; Sima, F. Y2O3 Nanoparticles and X-ray Radiation-Induced Effects in Melanoma Cells. Molecules 2021, 26, 3403. [Google Scholar] [CrossRef]
  32. Phatak, R.S.; Hendre, A.S. Sunlight induced green synthesis of silver nanoparticles using sundried leaves extract of Kalanchoe pinnata and evaluation of its photocatalytic potential. Der Pharm. Lett. 2015, 7, 313–324. [Google Scholar]
  33. Khalifa, K.S.; Hamouda, R.A.; Hamza, D.H.A. In vitro antitumor activity of silver nanoparticles biosynthesized by marine algae. Dig. J. Nanomater. Biostruct. 2016, 11, 213–221. [Google Scholar]
  34. Palithya, S.; Gaddam, S.A.; Kotakadi, V.S.; Penchalaneni, J.; Golla, N.; Krishna, S.B.N.; Naidu, C.V. Green synthesis of silver nanoparticles using flower extracts of Aerva lanata and their biomedical applications. Part. Sci. Technol. 2022, 40, 84–96. [Google Scholar] [CrossRef]
  35. Parangusan, K.; Subramanium, V.; Sundarabharathi, L.; Kannan, K.; Radhika, D. Influence of pH on Structural, Morphological, Optical, Photocatalytic, and Antibacterial Properties of Yttrium Oxide Nanoparticles via Co-Precipitation Method. Res. Sq. 2021. [Google Scholar] [CrossRef]
  36. Khalid, A.; Ahmad, P.; Alharthi, A.I.; Muhammad, S.; Khandaker, M.U.; Rehman, M.; Faruque, M.R.I.; Din, I.U.; Alotaibi, M.A.; Alzimami, K.; et al. Structural, Optical, and Antibacterial Efficacy of Pure and Zinc-Doped Copper Oxide Against Pathogenic Bacteria. Nanomaterials 2021, 11, 451. [Google Scholar] [CrossRef]
  37. Xing, Y.; Liao, X.; Liu, X.; Li, W.; Huang, R.; Tang, J.; Xu, Q.; Li, X.; Yu, J. Characterization and Antimicrobial Activity of Silver Nanoparticles Synthesized with the Peel Extract of Mango. Materials 2021, 14, 5878. [Google Scholar] [CrossRef]
  38. Kanwal, Z.; Raza, M.A.; Riaz, S.; Manzoor, S.; Tayyeb, A.; Sajid, I.; Naseem, S. Synthesis and characterization of silver nanoparticle-decorated cobalt nanocomposites (Co@AgNPs) and their density-dependent antibacterial activity. R. Soc. Open Sci. 2019, 6, 182135. [Google Scholar] [CrossRef]
  39. Adnan, R.M.; Mezher, M.; Abdallah, A.M.; Awad, R.; Khalil, M.I. Synthesis, Characterization, and Antibacterial Activity of Mg-Doped CuO Nanoparticles. Molecules 2022, 28, 103. [Google Scholar] [CrossRef]
  40. Rabaa, M.; Mezher, M.; Aridi, A.; Naoufal, D.; Khalil, M.I.; Awad, R.; Abdeen, W. Influence of Lanthanum Doping on the Photocatalytic and Antibacterial Capacities of Mg0.33Ni0.33Co0.33Fe2O4 Nanoparticles. Catalysts 2023, 13, 693. [Google Scholar] [CrossRef]
  41. Rabaa, M.; Mezher, M.; Aridi, A.; Naoufal, D.; Khalil, M.; Awad, R. Improved Photocatalytic and Antibacterial Activity of Mg0.33Ni0.33Co0.33GdxFe2−xO4 Nanoparticles Synthesized via the Co-precipitation Method. ChemistrySelect 2023, 8, e202301951. [Google Scholar] [CrossRef]
  42. Famuyide, I.M.; Aro, A.O.; Fasina, F.O.; Eloff, J.N.; McGaw, L.J. Antibacterial and antibiofilm activity of acetone leaf extracts of nine under-investigated south African Eugenia and Syzygium (Myrtaceae) species and their selectivity indices. BMC Complement. Altern. Med. 2019, 19, 141. [Google Scholar] [CrossRef]
  43. Iseppi, R.; Tardugno, R.; Brighenti, V.; Benvenuti, S.; Sabia, C.; Pellati, F.; Messi, P. Phytochemical Composition and In Vitro Antimicrobial Activity of Essential Oils from the Lamiaceae Family against Streptococcus agalactiae and Candida albicans Biofilms. Antibiotics 2020, 9, 592. [Google Scholar] [CrossRef] [PubMed]
  44. Bedlovičová, Z.; Strapáč, I.; Baláž, M.; Salayová, A. A Brief Overview on Antioxidant Activity Determination of Silver Nanoparticles. Molecules 2020, 25, 3191. [Google Scholar] [CrossRef]
  45. Siddique, M.A.B.; Imran, M.; Haider, A.; Shahzadi, A.; Ul-Hamid, A.; Nabgan, W.; Mahmood, A. Enhancing catalytic and antibacterial activity with size-controlled yttrium and graphene quantum dots doped MgO nanostructures: A molecular docking analysis. Mater. Today Sustain. 2024, 25, 100690. [Google Scholar] [CrossRef]
  46. Ayub, A.; Ikram, M.; Haider, A.; Shahzadi, I.; Ul-Hamid, A.; Shahzadi, A.; Algaradah, M.M.; Fouda, A.M.; Nabgan, W.; Imran, M. Enhanced Industrial Dye Degradation and Antibacterial Activity Supported by the Molecular Docking Study of Yttrium and Carbon Sphere-Doped Lanthanum Oxide Nanostructures. ACS Omega 2023, 8, 37564–37572. [Google Scholar] [CrossRef]
  47. Ikram, M. Multiple phases of yttrium-doped molybdenum trioxide nanorods as efficient dye degrader and bactericidal agents with molecular docking analysis. Chemosphere 2023, 340, 139855. [Google Scholar] [CrossRef]
Figure 1. YNPs refinement on MAUD software (the diamonds represent experimental data, the red solid line represents the refinement fitting).
Processes 12 01713 g001
Figure 2. (a) TEM image, (b) particle size distribution graph and the solid line represents the Guassian distribution for the YNPs.
Processes 12 01713 g002
Figure 3. XPS spectrum of greenly synthesized YNPs: (a) survey spectrum, (b) HR-XPS of Y–3d, and (c) HR-XPS of O-1s. (b,c) The squares refer to the experimental data, the purple solid line refers to the envelope, the green solid line refers to the background, the blue and red solid lines refer to different spectral lines indicated in the figure.
Processes 12 01713 g003
Figure 4. (a) SEM images and (b) EDX spectrum for the greenly synthesized YNPs.
Processes 12 01713 g004
Figure 5. FTIR spectra for the green-synthesized YNPs.
Processes 12 01713 g005
Figure 6. (a) UV–visible spectrum, (b) band gap energy calculations and the dashed line represent the extrapolation for the linear fit, and (c) Urbach energy of greenly synthesized YNPs.
Processes 12 01713 g006
Figure 7. PL spectra for the greenly synthesized YNPs. The dots represent the experimental data, the blue solid line represents the overall fitting of the spectra, the red, dark red, green, violet, and yellow lines represent the deconvolution for the PL spectra referring to different transitions.
Processes 12 01713 g007
Figure 8. (a) The magnetization curve, and (b) law of approach-to-saturation curve of the YNPs. The squares refer to the experimental data, the solid blue line refers to the law of approach-to-saturation fitting (b).
Processes 12 01713 g008
Figure 9. Antibiofilm activity of YNPs after 24 h of incubation with the bacterial biofilms. (a) Inhibition of biofilm formation. (b) Destruction of pre-formed bacterial biofilms.
Processes 12 01713 g009
Figure 10. Antioxidant activity of the YNPs against DPPH.
Processes 12 01713 g010
Figure 11. Three-dimensional complex of YNPs conformations at the binding pocket, the left side showed features interaction between residues and YNPs, the right side showed chemical structures of YNPs and interacting amino acid residues according to their type. (AC) DNA Gyrase of E. coli (PDB:ID 7P2M), (DF) Penicillin-binding proteins of E. faecalis (PDB:ID 6MKI), (GI) KPC-2 Carbapenemase of K. pneumoniae (PDB:ID 2OV5), (JL) LASR-binding domain of P. aeruginosa (PDB:ID 2UV0), (MO) dihydropteroate synthase of S. aureus (PDB:ID 1AD4), (PR) lincosamide adenylyl transferase of S. haemolyticus (PDB:ID 4WH5).
Processes 12 01713 g011
Table 1. Presented elements and atomic % for YNPs.
NPs 1Presented ElementsAtomic %
YNPs 2O-1s71.44
Y–3d7.41
N-1s13.4
P-2p7.75
1 Nanoparticles, 2 Yttrium nanoparticles.
Table 2. Magnetic parameters for the YNPs.
SampleM20kOe (emu/g) 2Ms (emu/g) 3Mr × 10−3 (emu/g) 4Hci (Oe) 5S 6
YNPs 10.6640.68185.540289.240.127
1 Yttrium nanoparticles, 2 Magnetization 20 KOe, 3 Saturation magnetization, 4 Retentivity, 5 Coercivity. 6 Squareness.
Table 3. MICs and MBCs of the yttrium nanoparticles against the bacterial isolates.
Bacterial IsolatesConcentration (mg/mL)
MIC 1MBC 2
Gram-positive bacteria
S. aureus1- 3
S. haemolyticus0.5-
E. faecalis0.5-
Gram-negative bacteria
E. coli1-
K. pneumonia0.5-
P. aeruginosa0.5-
1 Minimum inhibitory concentration, 2 Minimum bactericidal concentration, 3 Not determined.
Table 4. ZOIs obtained from the treatment of the bacterial isolates with YNPs.
YNPs
Concentration
(mg/mL)
Bacterial Isolates
Gram-PositiveGram-Negative
S. aureusS. haemolyticusE. faecalisE. coliK. pneumoniaP. aeruginosa
ZOI ± SEM (mm)2
0.0625
p-value
Significance
7.00 ± 0.00
0.001
***
7.00 ± 0.00
0.001
***
7.33 ± 0.27
˂0.001
***
0.00 ± 0.00
˂0.001
***
0.00 ± 0.00
˂0.001
***
0.00 ± 0.00
˂0.001
***
0.125
p-value
Significance
7.00 ± 0.00
0.001
***
7.00 ± 0.00
0.001
***
9.33 ± 0.27
0.001
***
0.0 ± 0.00
˂0.001
***
0.0 ± 0.00
˂0.001
***
0.00 ± 0.00
˂0.001
***
0.25
p-value
Significance
7.33 ± 0.27
˂0.001
***
7.33 ± 0.27
˂0.001
***
9.33 ± 0.27
˂0.001
***
0.00 ± 0.00
˂0.001
***
0.0 ± 0.00
˂0.001
***
0.00 ± 0.00
˂0.001
***
0.5
p-value
Significance
7.33 ± 0.27
˂0.001
***
7.33 ± 0.27
˂0.001
***
10.00 ± 0.00
˂0.001
***
7.33 ± 0.27
˂0.001
***
7.33 ± 0.27
˂0.001
***
7.33 ± 0.27
˂0.001
***
1
p-value
Significance
8.33 ± 0.7
˂0.001
***
7.33 ± 0.27
˂0.002
**
10.00 ± 0.00
˂0.001
***
10.33 ± 0.27
˂0.001
***
7.33 ± 0.27
˂0.001
***
7.33 ± 0.27
˂0.001
***
YNPs; Yttrium nanoparticles, ZOI; Zone of inhibition, p-values were calculated such that: ** p ˂ 0.01, *** p ˂ 0.001.
Table 5. The molecular interactions of YNPs with the amino acids of the list of targets.
BacteriaProteins
3D Structure
Hydrophilic InteractionsHydrophobic ContactsNo. of H-BondsNo. of Total BondsAffinity kcal mol-1
Residue (H-Bond) LengthResidue (Bond Type)Length
1E. coliProcesses 12 01713 i001Asn46 (H-Bond)
Val120 (H-Bond)
Ser121 (H-Bond)
Glu42(H-Bond)
Asn46(H-Bond)
Asn46(H-Bond)
Gly119(H-Bond)
2.31
2.10
2.73
3.17
2.72
2.64
2.54
Gly119 (C–H Bond)
Asn46 (Metal–Acceptor)
2.54
2.88
79–12.54
2E. faecalisProcesses 12 01713 i002
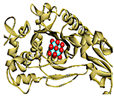
Ser367 (H-Bond)
Thr418 (H-Bond)
Tyr420 (H-Bond)
Ile550(H-Bond)
Gln552(H-Bond)
Met654(H-Bond)
Ile547(H-Bond)
Phe416(H-Bond)
2.11
2.95
3.03
3.66
2.23
2.85
2.54
2.14
Phe416 (C–H Bond)
Tyr420 (Pi–Donor H Bond)
2.56
3.51
810–8.90
3K. pneumoniaProcesses 12 01713 i003Ser71 (H-Bond)
Arg161 (H-Bond)
Ser181 (H-Bond)
Ser182(H-Bond)
Val186(H-Bond)
Tyr247(H-Bond)
Tyr264(H-Bond)
Thr180(H-Bond)
Pro67(H-Bond)
Phe66(H-Bond)
1.94
2.86
2.98
2.68
2.85
3.06
2.41
3.23
2.90
3.25
Leu68 (C–H Bond)
Phe72 (C–H Bond)
Val186 (C–H Bond)
Tyr247 (Metal–Acceptor)
Tyr264 (Metal–Acceptor)
2.66
2.71
3.40
3.29
3.09
1015–10.22
4P. aeruginosaProcesses 12 01713 i004Gly38, (H-Bond)
Arg61, (H-Bond)
Ala127, (H-Bond)
Asp73, (H-Bond)
Tyr47, (H-Bond)
Tyr64, (H-Bond)
2.37
2.59
2.41
3.07
2.47
2.51
Tyr64, (Pi–Lone Pair)
Tyr47 (Pi–Donor Hydrogen)
4.07
2.51
68–8.90
5S. aureusProcesses 12 01713 i005
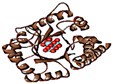
Asn11, (H-Bond)
Arg52, (H-Bond)
Lys203, (H-Bond)
Gln105, (H-Bond)
Arg239, (H-Bond)
2.68
1.75
2.84
2.95
1.80
--55–6.87
6S. haemolyticusProcesses 12 01713 i006
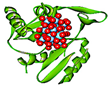
Arg78, (H-Bond)
His92, (H-Bond)
Asp48, (H-Bond)
Phe140, (H-Bond)
Asp28, (H-Bond)
Gly29, (H-Bond)
2.17
2.08
2.65
2.93
2.93
2.35
Gly29, (C–H bond)
His92, (C–H bond)
3.56
3.05
68–9.44
Ala: Alanine, Arg: Arginine, Asn: Asparagine, Asp: Aspartic acid, Glu: Glutamic acid, Gln: Glutamine, Gly: Glycine, His: Histidine, Ile: Isoleucine, Leu: Leucine, Lys: Lysine, Met: Methionine, Phe: Phenylalanine, Pro: Proline, Ser: Serine, Thr: Threonine, Tyr: Tyrosine, Val: Valine.
Disclaimer/Publisher’s Note: The statements, opinions and data contained in all publications are solely those of the individual author(s) and contributor(s) and not of MDPI and/or the editor(s). MDPI and/or the editor(s) disclaim responsibility for any injury to people or property resulting from any ideas, methods, instructions or products referred to in the content.

