Article

Physical Properties of High-Rank Coal Reservoirs and the Impact on Coalbed Methane Production

1
School of Coal and Chemical Industry, Shaanxi Energy Institute, Xianyang 712000, China
2
School of Geology and Environment, Xi’an University of Science and Technology, Xi’an 710100, China
3
College of Earth Sciences & Engineering, Shandong University of Science and Technology, Qingdao 266590, China
*
Author to whom correspondence should be addressed.
Processes 2024, 12(8), 1754; https://doi.org/10.3390/pr12081754
Submission received: 10 July 2024 / Revised: 12 August 2024 / Accepted: 17 August 2024 / Published: 20 August 2024
(This article belongs to the Section Chemical Processes and Systems)

Abstract

:
The physical characteristics of coal reservoirs are important factors affecting the occurrence status of coalbed methane, as well as key factors restricting the production capacity. Therefore, taking 3# coal in Qinnan region of China as the research object, based on the actual production data of 200 coalbed methane wells in the research area, experimental testing combined with simulation analysis was used to explore the physical properties of medium and high-order reservoirs and their impact on the occurrence and production of coalbed methane. The characteristics of coalbed methane reservoir formation and production capacity changes in the research area were revealed, and the factors restricting the production capacity of coalbed methane wells were calculated using the gray correlation analysis method. The results indicate that the micropores in the coal reservoir in the study area are well-developed, while the macropores and mesopores (exogenous fractures) are underdeveloped, the surface of the micropores is complex, and the connectivity of the micropores is poor, resulting in reservoirs with high gas adsorption characteristics and low permeability. The fractal characteristics of pores and fractures can reflect the permeability characteristics of reservoirs. Permeability is positively correlated with macropores (exogenous fractures) and mesopores, and negatively correlated with micropores. There is a positive correlation between permeability and productivity, and the reservoir in the study area has a stress-sensitive boundary. The main factors restricting productivity under the complex pore and fracture system of high-rank coal reservoir were identified, and the gray relational analysis method was used to evaluate the development effect of the research area. This study provides guidance for the development of coalbed methane production in high-rank coal reservoirs.

1. Introduction

The physical properties of coal reservoirs are important factors restricting the production capacity of coalbed methane wells [1,2,3,4]. The physical properties of reservoirs include pore and fracture structures, permeability, and other related parameters, which affect the entire process of coalbed methane analysis, diffusion, seepage, and production [5,6,7], and which determines the productivity of coalbed methane wells. The practical results of coalbed methane exploration and development indicate that the differences in physical properties such as porosity, adsorption, desorption, and permeability of coal reservoirs can lead to certain differences in coalbed methane production behavior and mechanism, which affects the effectiveness of coalbed methane production [8,9,10,11]. Generally speaking, coalbed methane undergoes desorption from the surface of the matrix pores, transforming from an adsorbed state to a free state, and then diffusing in the coal matrix. Finally, it seeps into the wellbore through cleats or larger external fractures [12,13,14]. The dual differences in matrix pores and macroscopic fractures of different coal reservoirs determine the gas production capacity under reservoir conditions and the main controlling factors at different production stages [15,16,17].
Therefore, accurately grasping the physical characteristics of coal reservoirs is particularly important for understanding the laws and guiding the production of coalbed methane [18,19]. At present, a reservoir’s physical parameters are mainly obtained through experimental testing, and the testing methods are relatively mature [20,21]. Lu et al. explored the pore volume and specific surface area of coal reservoirs through mercury intrusion, nitrogen adsorption/desorption, and carbon dioxide adsorption methods, and studied the influence of pore structure on the adsorption and free methane content in structurally deformed coal [22]. Zhao et al. conducted extensive research on the adsorption characteristics of coal reservoirs using isothermal adsorption tests and determined the adsorption characteristics of reservoirs under different conditions [23,24]. Hou et al. found, through multiphase medium coal rock mechanics experiments, that the permeability of coal reservoirs has always been in a dynamic state during the evolution and exploitation of coalbed methane, and has an important impact on the occurrence state and exploitation efficiency of coalbed methane [25,26]. Zhang et al., based on the nuclear magnetic resonance experiment, explored the stress sensitivity characterization and heterogeneous change in the middle and high-rank coal seam pore fracture system; calculated the stress sensitivity of adsorption pores, seepage pores, and fractures; studied the relationship between the compressibility of the pore fracture system and its effective stress; and provided further theoretical guidance for deepening the change in CBM permeability in the process of CBM emission [27,28].
Reservoir parameters are an important basis for mastering gas production laws, but the process of coalbed methane desorption–diffusion–seepage is an extremely complex dynamic process [29,30,31,32], and it is difficult to accurately predict production capacity changes using traditional geological condition comprehensive analysis methods based solely on reservoir parameter data. Numerical simulation analysis, due to its strong multifactor integration analysis function, has been widely used in the calculation of coalbed methane reserves and resources, production well productivity, reservoir physical property simulation, and other aspects, with application examples demonstrating the effectiveness and practicality of the prediction results [33,34,35].
In view of this, this study takes 3# coal in the Qinshui Basin of China as the research object; conducts targeted experimental tests; obtains coal reservoir parameters in the study area; comprehensively and finely describes the pore, fracture, and permeability characteristics of the reservoir; and based on the data of coalbed methane well discharge and production in the research area, analyzes the gas production laws of typical coalbed methane wells. Based on relevant reservoir parameters and using numerical simulation analysis methods, this study explores the dynamic changes in production capacity under the constraints of physical properties of high-rank coal reservoirs in the research area.

2. Geological Setting

The research area is located in the southern part of the Qinshui Basin in Shanxi Province, China. The strata from old to new are Benxi Formation, Taiyuan Formation, Shanxi Formation, Lower Shihezi Formation, Upper Shihezi Formation, and Shiqianfeng Formation. The main coal bearing strata are the Carboniferous Permian strata, with a thickness of 3# coal ranging from 4.5 to 8.0 m, with an average thickness of 6.03 m. The coal seam has a large thickness and stable distribution, providing a material basis for the enrichment and high production of coalbed methane. In order to achieve the research objectives of this paper, production data from 200 coalbed methane wells within the study area were collected (Figure 1). The coalbed methane wells were evenly distributed within the block, achieving control over the entire area and providing a basis for the analysis of coalbed methane production capacity in the study area.
The technical parameters of the coalbed methane wells were as follows: the completion method was casing completion, the outer diameter was 244.5 mm, and the inner diameter was 226.62 mm.

3. Experimental and Methods

3.1. Samples

The samples were collected from coal 3# in the study area, and the coal rock composition was mainly clarain. The microscopic components were mainly composed of vitrinite, with a content ranging from 48.3% to 83.4% and an average of 68.6%, followed by inertinite, with a content ranging from 16.6% to 51.7% and an average of 31.4%. The inertinite was mainly composed of semi serinite, with a small amount of microsomes, serinite, and detrital inertinite, with a very low content of exinite. The industrial analysis of coal was carried out in accordance with GB/T 212-2008 “Methods for Industrial Analysis of Coal” [36]. We selected 100 samples from different intervals of 72 wells and conducted industrial analysis to obtain coal quality parameter information (Table 1).
From the box plot of coal quality parameters (Figure 2), it can be seen that the median values of ash content, moisture content, fixed carbon, and volatile matter are 9.40%, 1.24%, 82.36%, and 6.14%; the IQR values are 6.14, 0.18, 7.77, and 1.79; the numerical dispersion is low; and the distribution is reasonable. This indicates that the coal reservoirs in the research area have the characteristics of high fixed carbon, low moisture, low ash content, and low volatile matter.

3.2. Experiments

The pore, fracture, permeability, and adsorption characteristics of coal reservoirs were obtained through mercury injection, scanning electron microscopy, permeability testing, and isothermal adsorption experiment, while reservoir pressure was obtained based on production data from coalbed methane wells. The corresponding experimental conditions and parameter settings are shown below.
The pore parameters were obtained through mercury injection using a fully automatic mercury porosimeter AutoPore IV 9500. The sample was processed into 2–3 mm and weighed 5 g. It was dried at 393 k for 12 h before the experiment. Standard: GB/T21650 “Determination of pore size distribution and porosity of solid materials by mercury intrusion porosimetry and gas adsorption method” [37].
The crack characteristics were observed by scanning electron microscopy (SEM) (Quanta 250) and the sample was processed into thin sheets with a height of less than 20 mm and a diameter of less than 5 cm. The sample was dried in a vacuum oven for 6 h before the experiment and could be magnified to over 10,000 times using a scanning microscope. Standard: GB/T17359-1998 “General rules for quantitative analysis of electron probe and scanning electron microscope X-ray energy spectrum” [38].
The permeability was obtained through a pulse attenuation permeability meter (PDP-200) and the sample was processed into columns with a diameter of 2.5 cm and a length of 3–5 cm. The pulse PDP-200 can measure permeability in the range of 0.00001–10 mD. Standard: NB/T 11327-2023 “Test Method for Coalbed Gas Permeability” [39].
For the isothermal adsorption experiment, the experimental instrument was an IS-300 high-pressure light hydrocarbon adsorption instrument. The sample preparation and balance water treatment included grinding the original sample into 400 g of 60–80 mesh, and then conduct a balance water experiment. After spraying water on the coal sample, place it in a balance water container and weigh it daily until there is no change in weight to achieve balance. This usually takes one standard: GB/T 19560-2008 “High pressure isothermal adsorption test method for coal” [40].

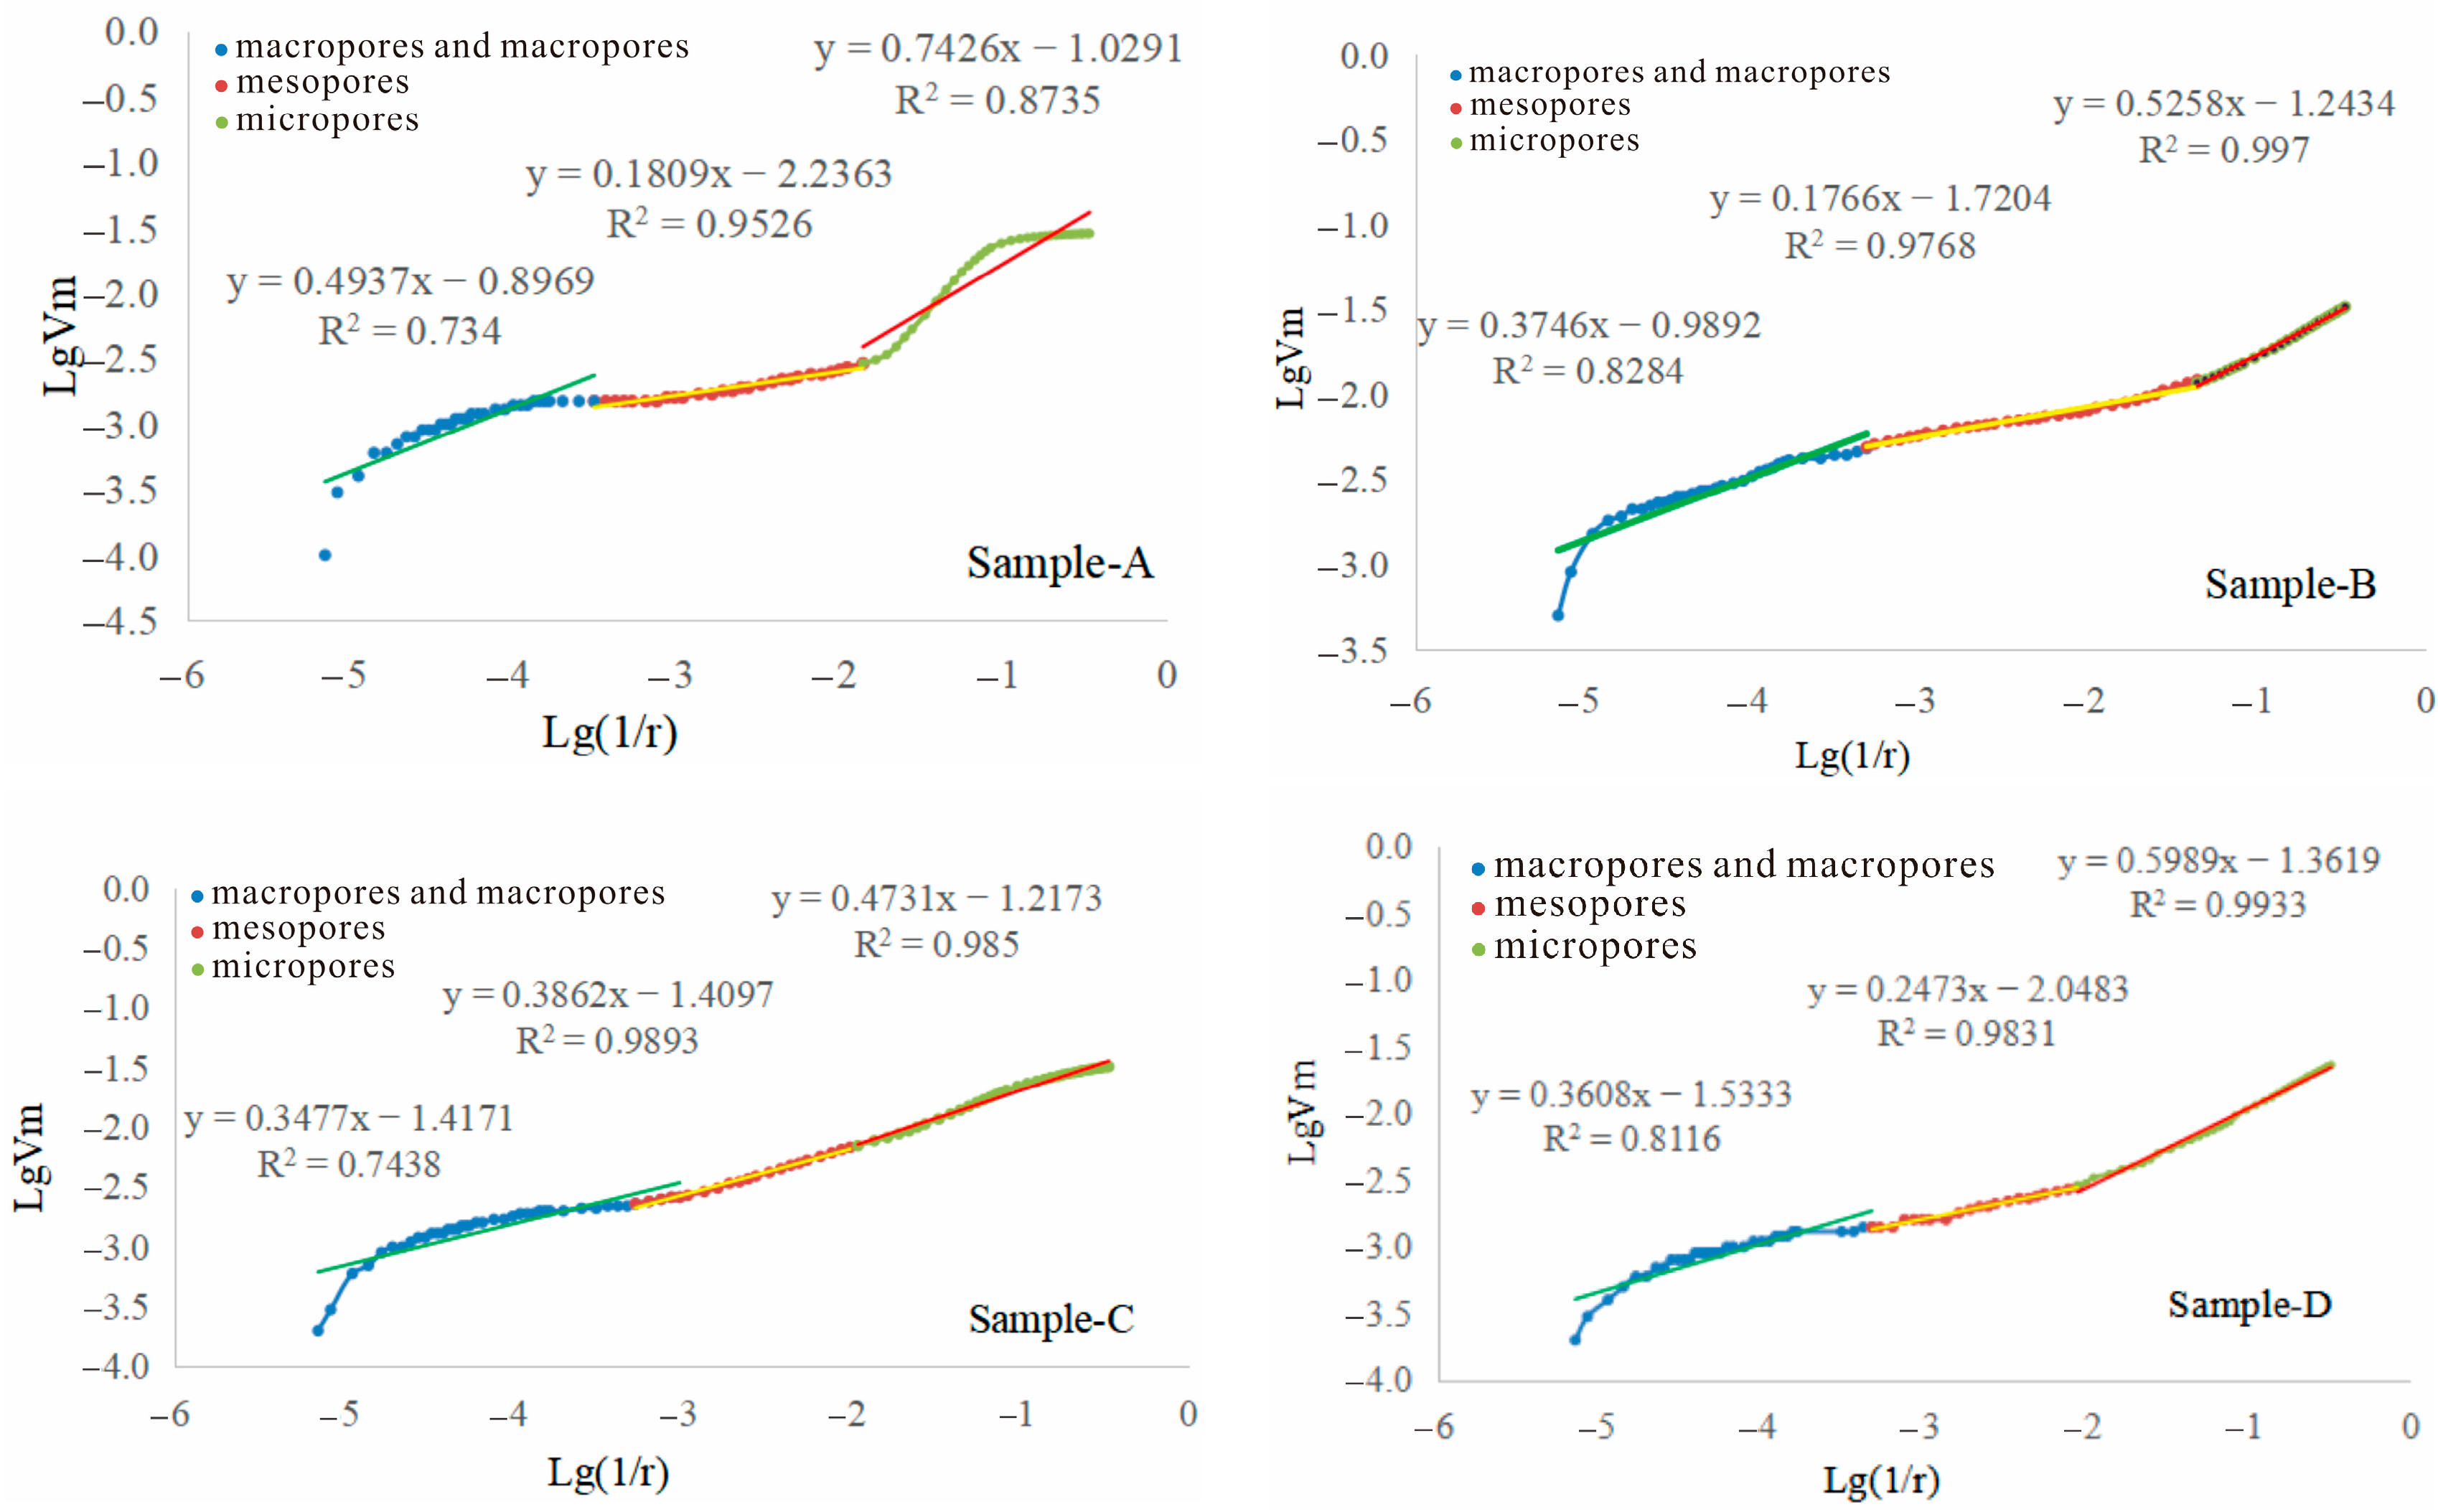
3.3. Evaluation of Fractal Dimension

The concept of fractals was first proposed by Mandelbert and has now become an important tool for analyzing the geometric and structural characteristics of surfaces and pore structures [41]. The fractal dimension D is an important parameter in fractal theory, which serves as a quantitative representation and fundamental parameter of fractals, and can describe the complexity and irregularity of surfaces. When the surface of the coal structure is completely smooth, the analysis dimension is 2. As the surface roughness of the coal increases, the fractal dimension will gradually increase and approach 3. When the fractal dimension is equal to 3, the corresponding situation is that the pore volume is filled [42].
Using the results of mercury intrusion test to calculate the fractal dimension of coal pores, the calculation equation is as follows:
lgVm = (D − 2)lg(1/r) + C
  • Vm, the volume of mercury input;
  • D, the fractal dimension;
  • R, the aperture;
  • C, a constant.
Draw double logarithmic relationship graphs of different coal reservoirs lgVm and lg(1/r), fit the corresponding scatter points as straight lines, obtain linear equations and slope k, and then calculate the fractal dimension D = 2 + K [43].

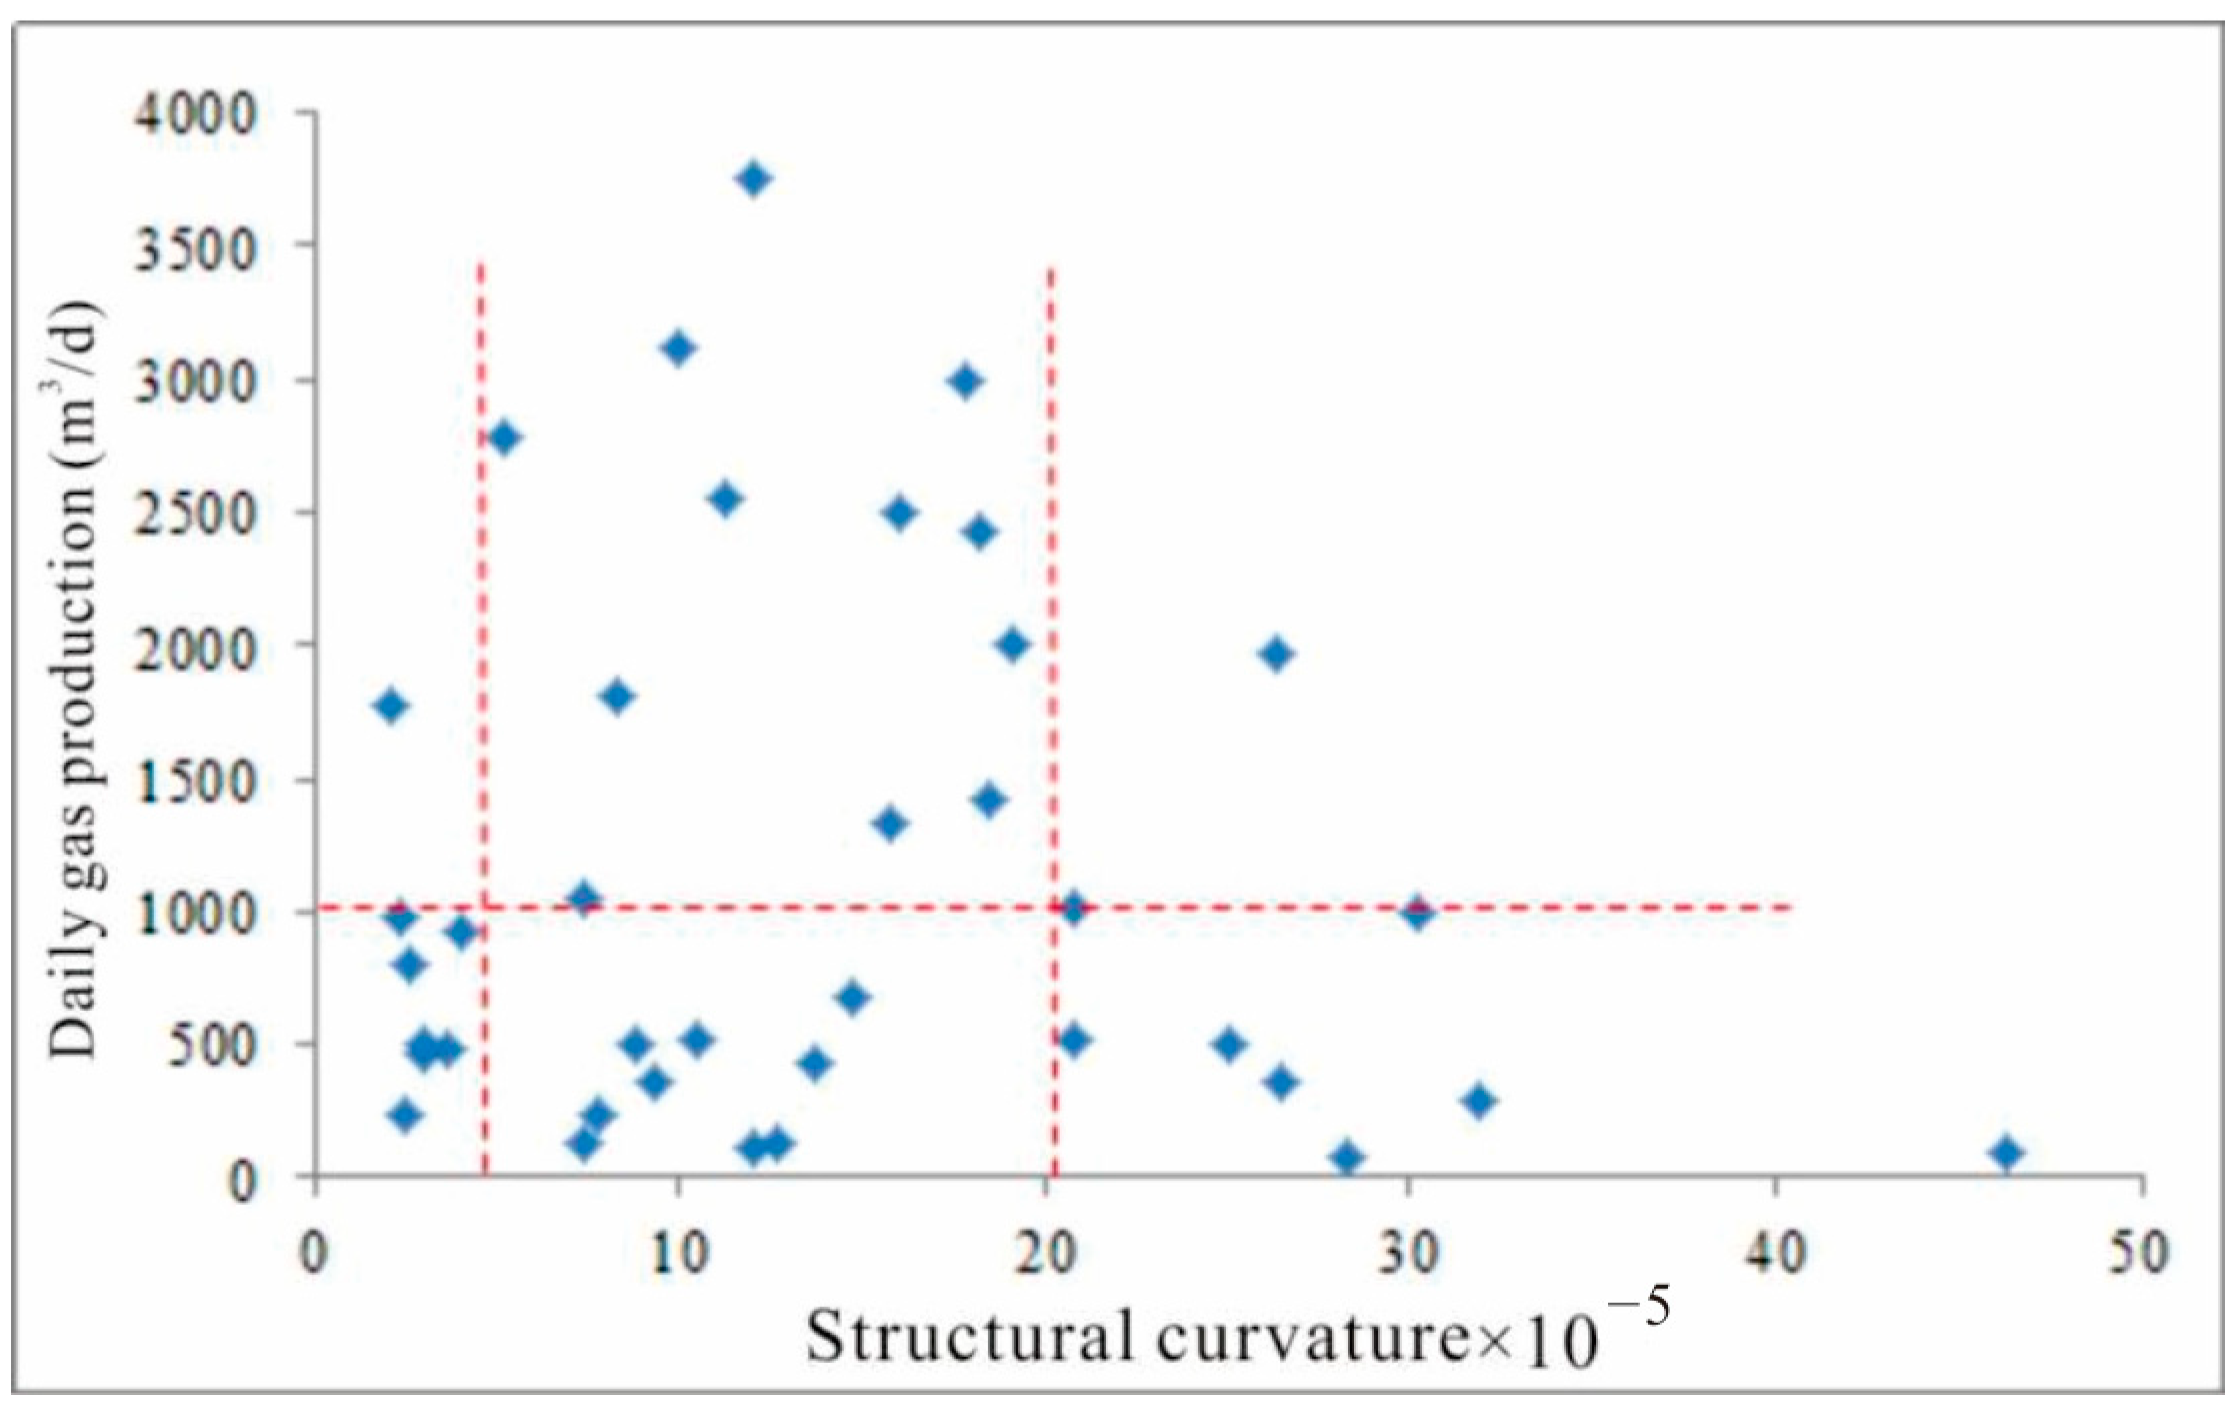
3.4. Structural Curvature

Structural curvature is a digital description of the geometric shape of geological structures, the calculation equation of which is as follows:
K = z ( 1 + ( z ) 2 ) 3 2
  • K, the curvature value;
  • Z, elevation of coal seam floor, Z = f(x,y).

3.5. The Gray Correlation Analysis Method

Gray relational analysis is utilized to assess the interrelationships among different factors within a system. It has the function of determining the degree of correlation and quantitative representation, and is an important analytical method for summarizing the relationship between multiple factors [44]. It has gained extensive application across various scientific domains due to its modeling of control capabilities [45,46].

3.5.1. Determine the Comparison Sequence and Reference Sequence

The comparative sequence consists of parameter values that evaluate the production capacity of coalbed methane wells. The reference sequence consists of criteria for evaluating parameters that affect production capacity, and it is represented by (3).
Wi(k) = (Wi(1), Wi(2)…, Wi(85)); k = 1, 2……, 85; i = 0, 1, 2……, 8

3.5.2. Dataization of Variables

Due to the different physical meanings of various factors in the system, the dimensions of the data may not necessarily be the same, making it difficult to compare or draw correct conclusions during comparison. Therefore, when conducting gray correlation analysis, dimensionless data processing is generally required. The commonly used non-dimensional methods include initialization, averaging, and interval relative value. Initialization refers to dividing all data by the first data to obtain a new sequence, which is the percentage of values at different time points relative to the values at the first time point. Data averaging refers to removing all data from the average to obtain a sequence of numbers as a percentage of the average. The dimensionless data of reference and comparison sequences are represented by (4).
xi(k) = AVG Wi(k); k = 1, 2, ……, 85; i = 0, 1, 2……, 7

3.5.3. Calculate Correlation Coefficient

Differencing sequence: In order to find the maximum difference and minimum difference between two levels, it is necessary to first calculate the absolute difference sequence between each comparison sequence and the reference sequence. The calculation formula is (5).
Δ0i(k) = ∣x0(k) − xi(k)∣; k = 1, 2, ……, 85; i = 1, 2, ……, 7
The difference sequence Δ01(k) between x1(k) and x0(k) is represented by (6).
Δ01(k) = (Δ01(1), Δ01(2), ……, Δ01(85))
Based on the sequence of differences, the maximum and minimum differences can be calculated, as follows:
Δ 0 i ( max ) = max i   max k   Δ 0 i ( k )
Δ 0 i ( min ) = min i   min k   Δ 0 i ( k )
Calculate correlation coefficient: The formula for calculating the correlation coefficient between x 0 ( k ) and x i ( k ) is (9).
ε x 0 ( k ) , x i ( k ) = min i   min k   Δ 0 i ( k ) + ξ max i   max k   Δ 0 i ( k ) Δ 0 i ( k ) + ξ max i   max k   Δ 0 i ( k )
ζ is the distinguishing coefficient and the value range is (0,1); usually, ζ = 0.5 [47,48].

3.5.4. Calculate Correlation Degree

Due to the large number of correlation coefficients, the average value of the correlation coefficients is used as the degree of correlation between the reference sequence and the comparison sequence, and the correlation can be calculated by Equation (10).
γ ( x 0 , x i ) = 1 85 k = 1 85 ε x 0 ( k ) , x i ( k )

4. Results and Discussion

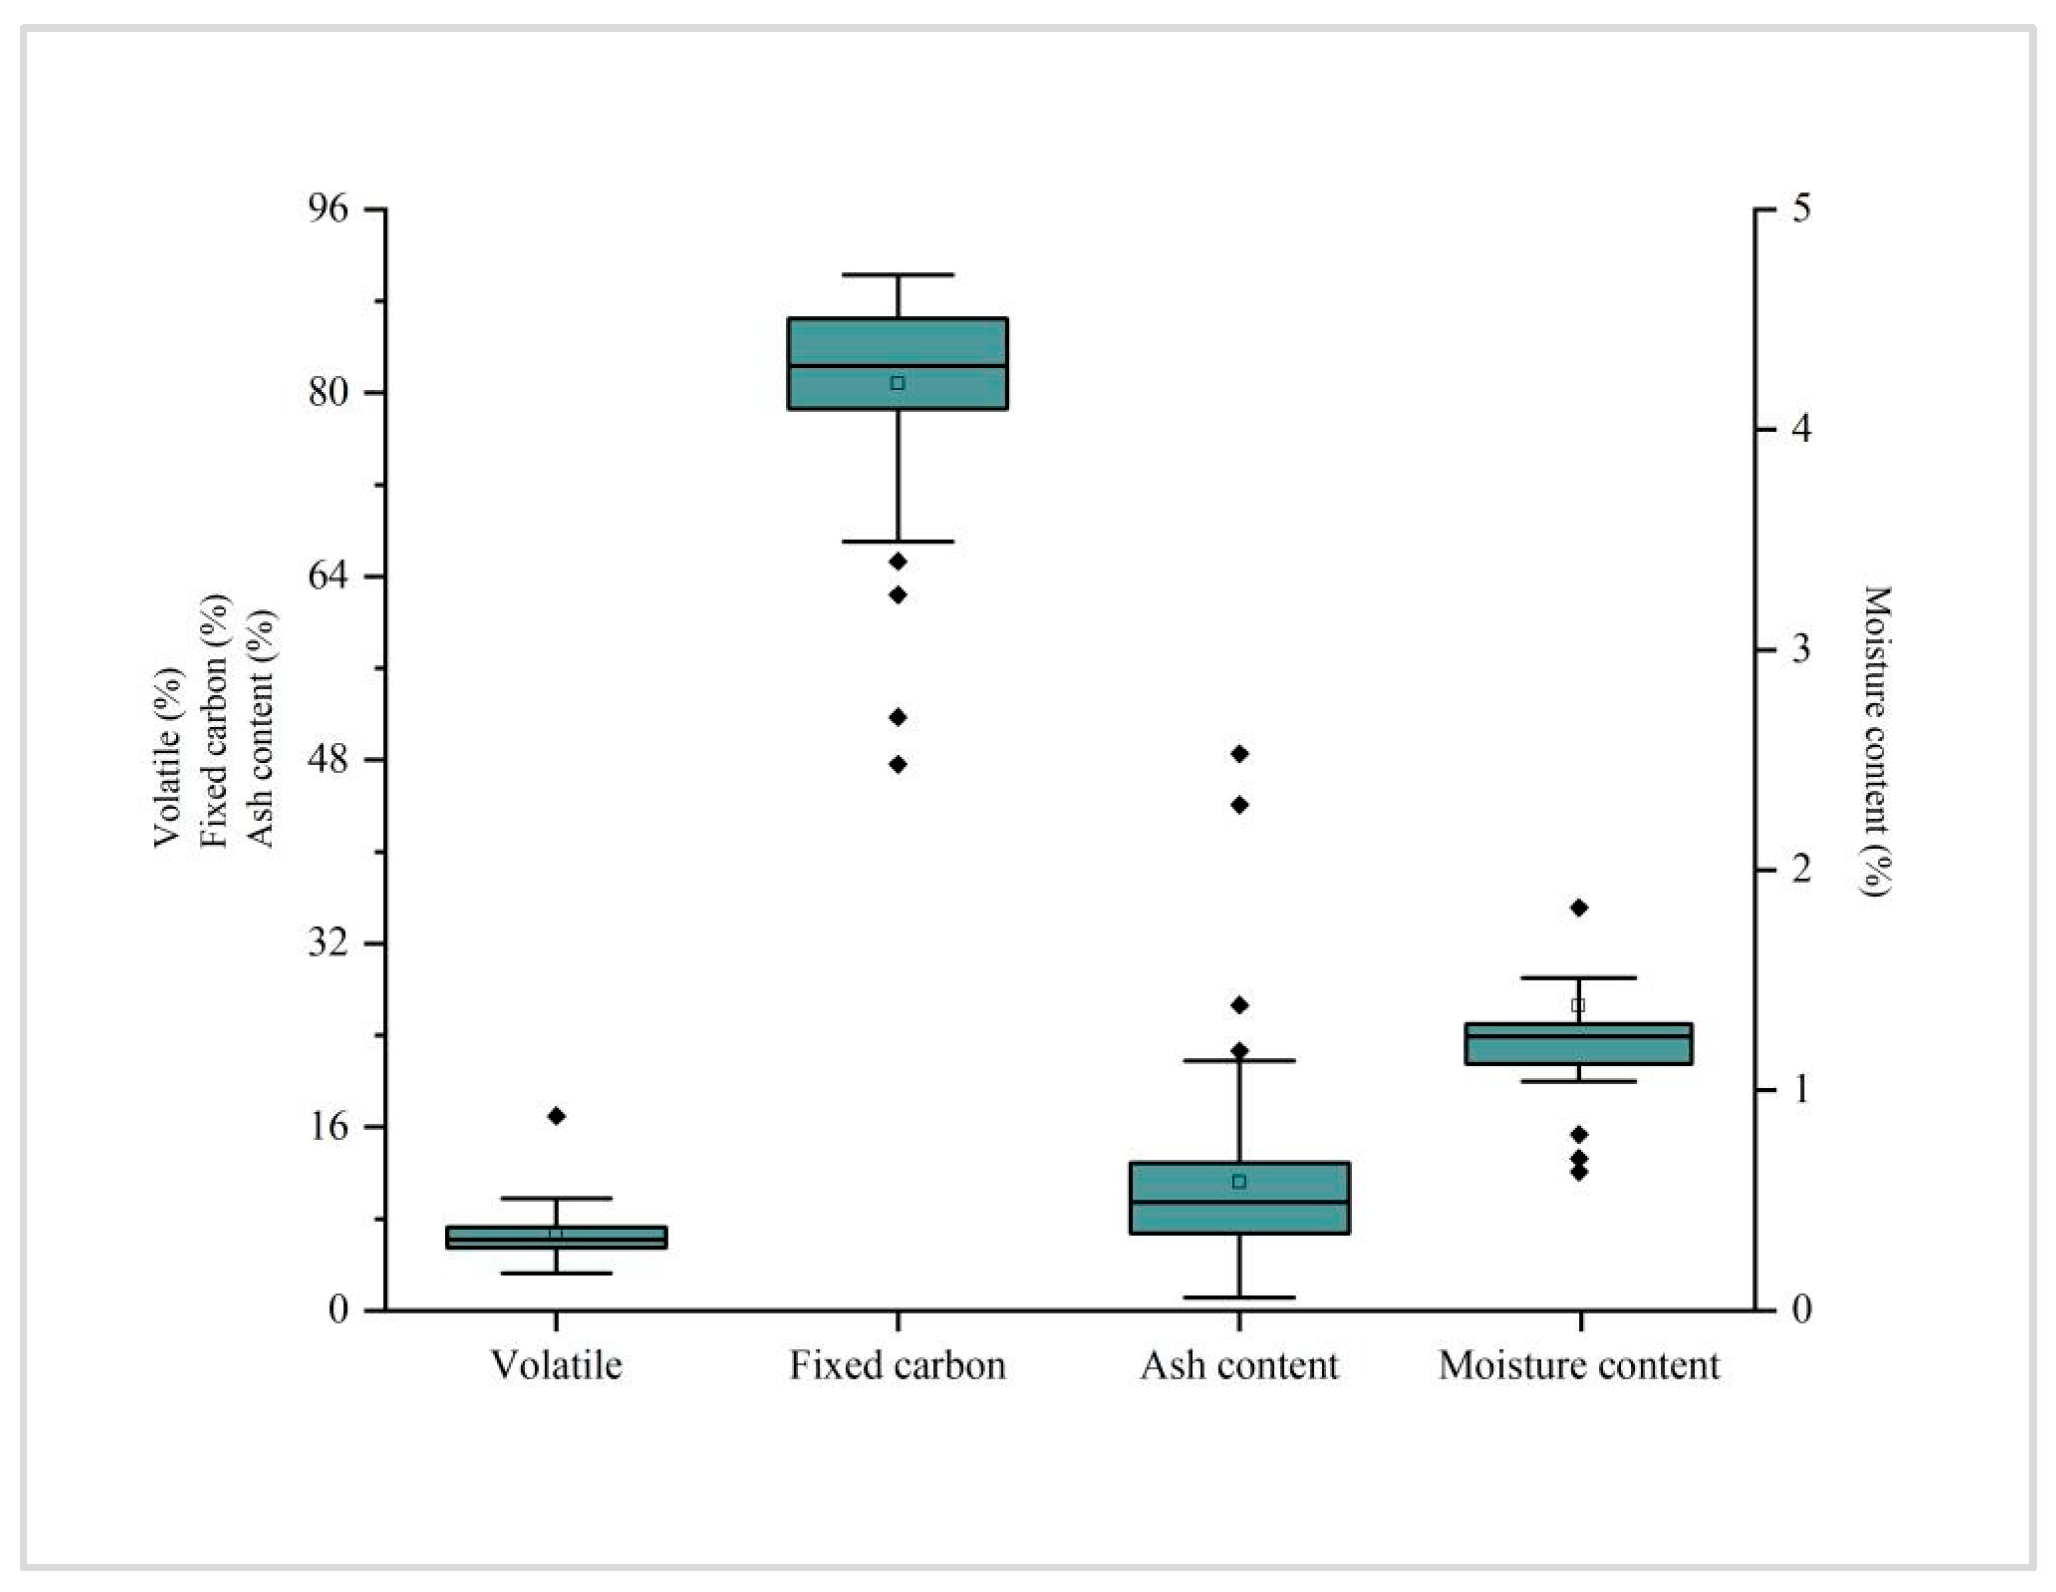
4.1. Physical Characteristics of Coal Reservoirs in the Research Area

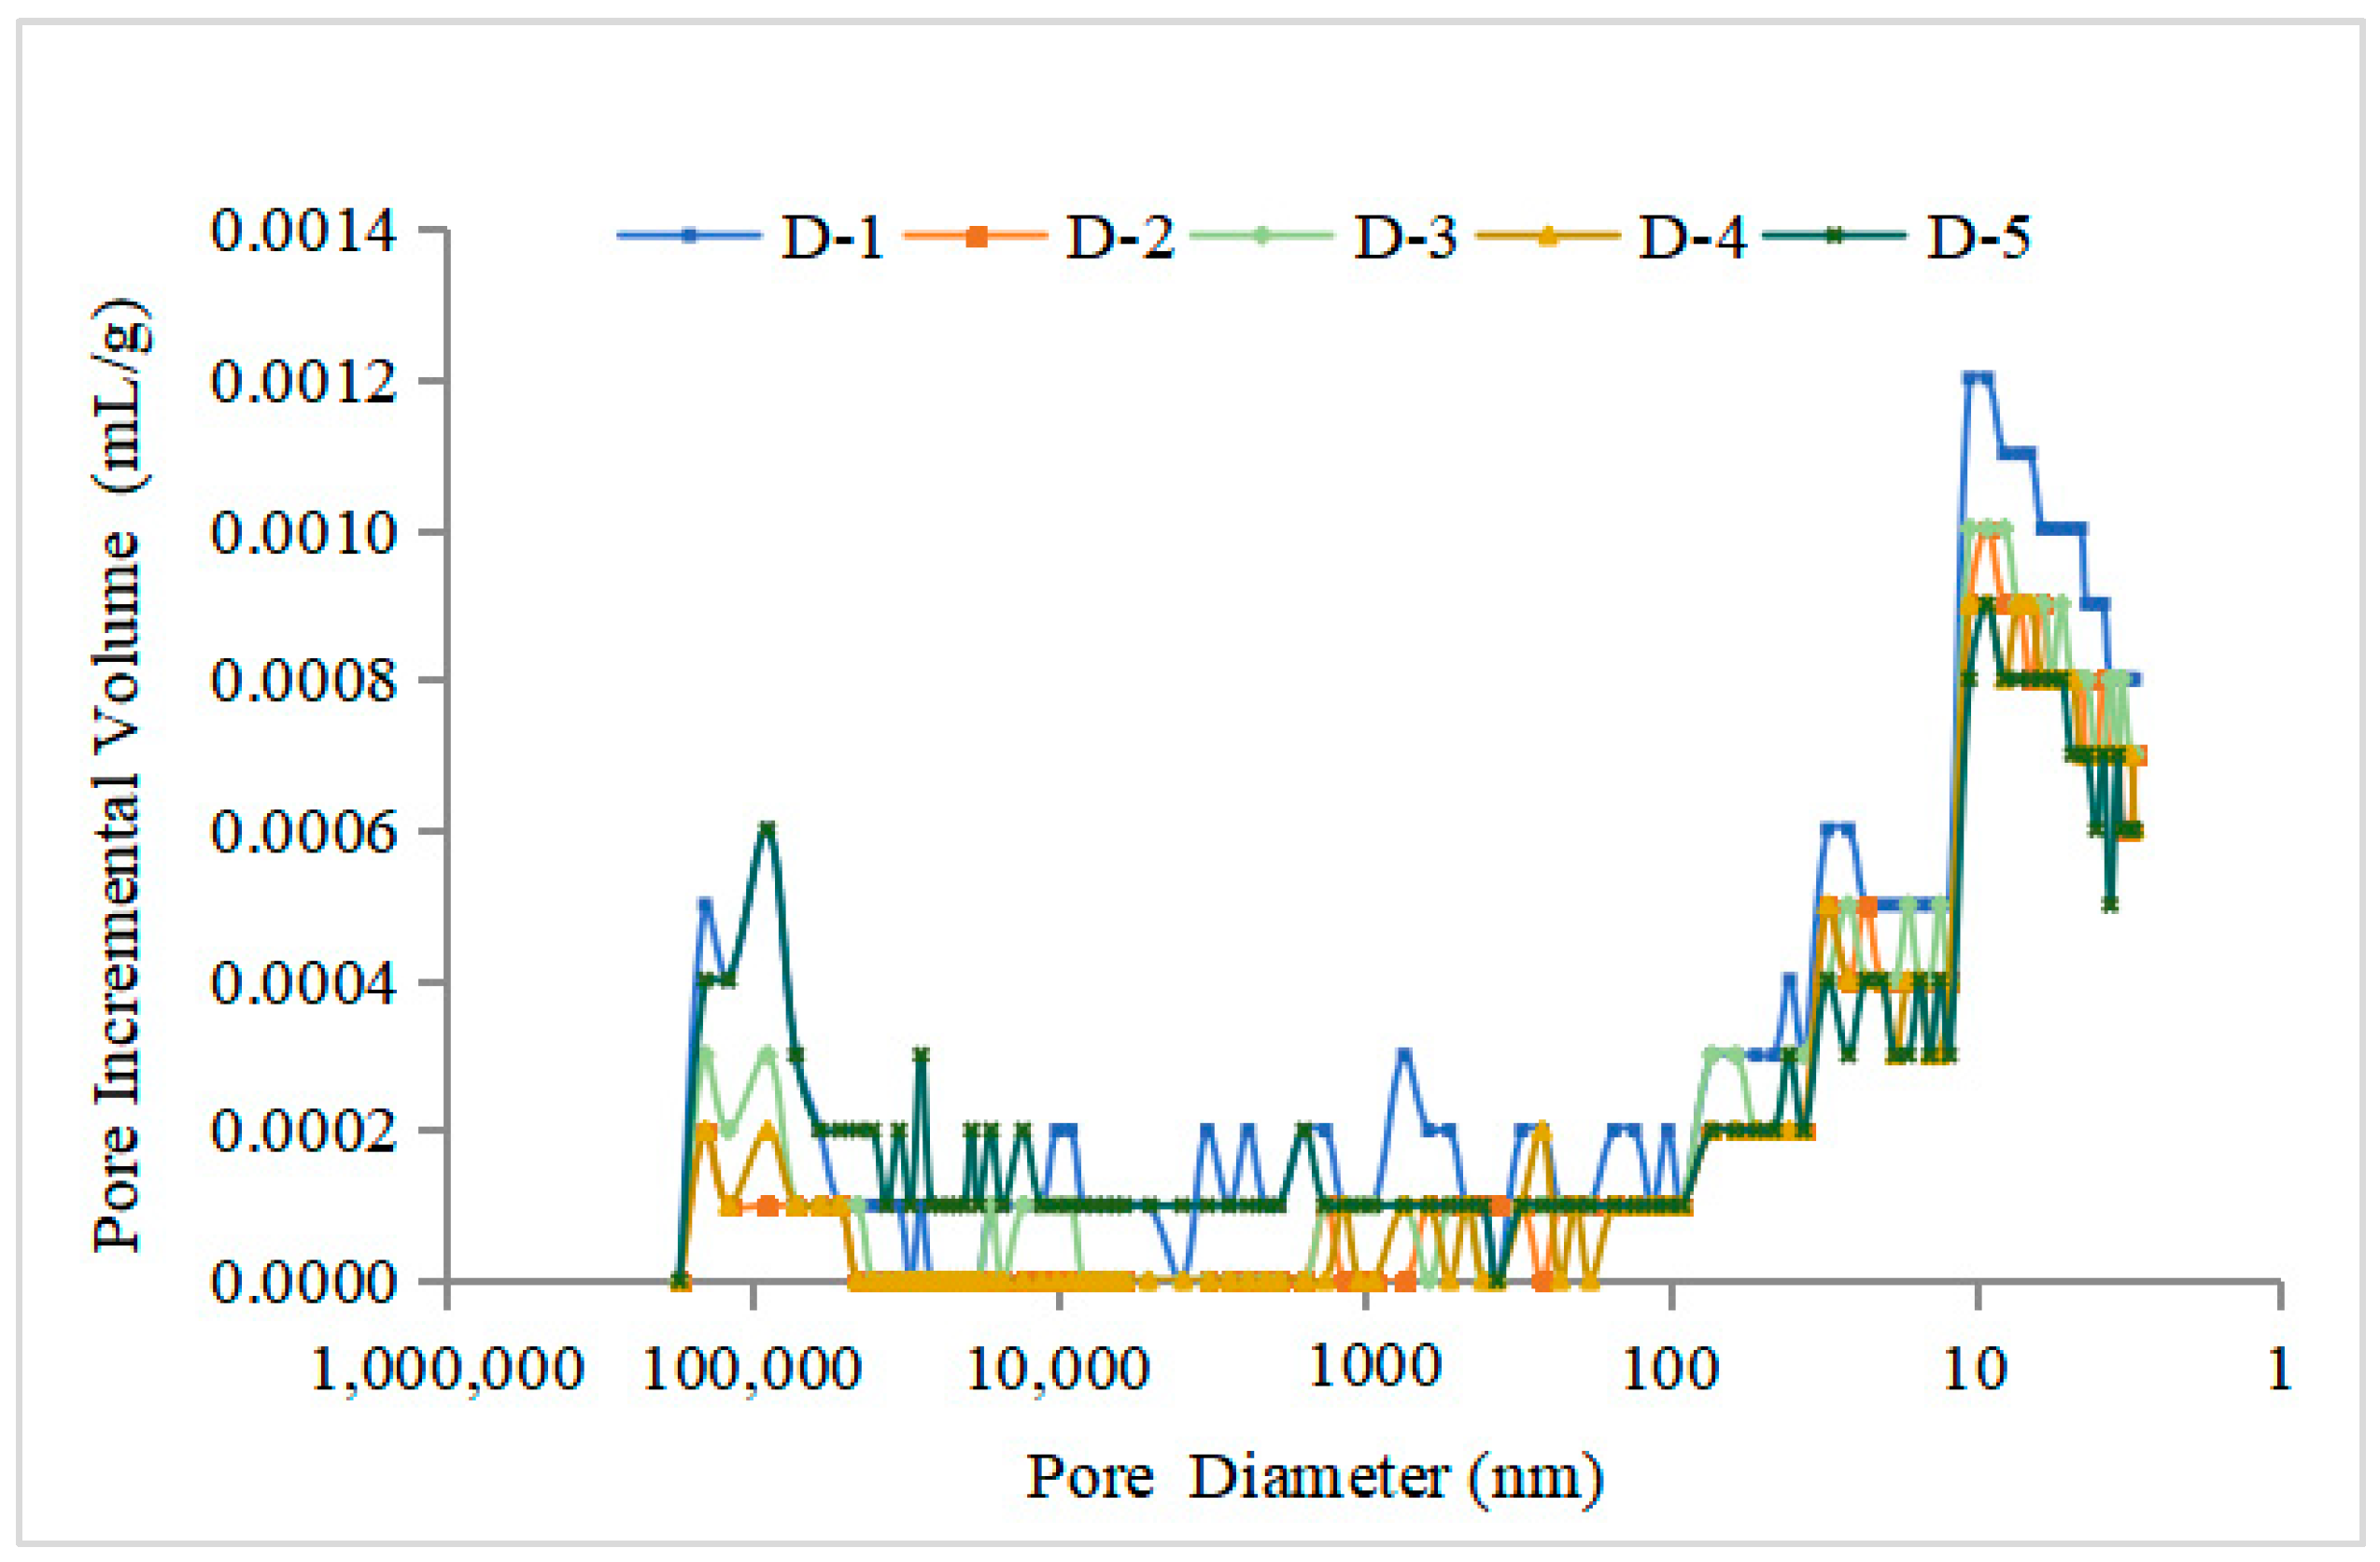
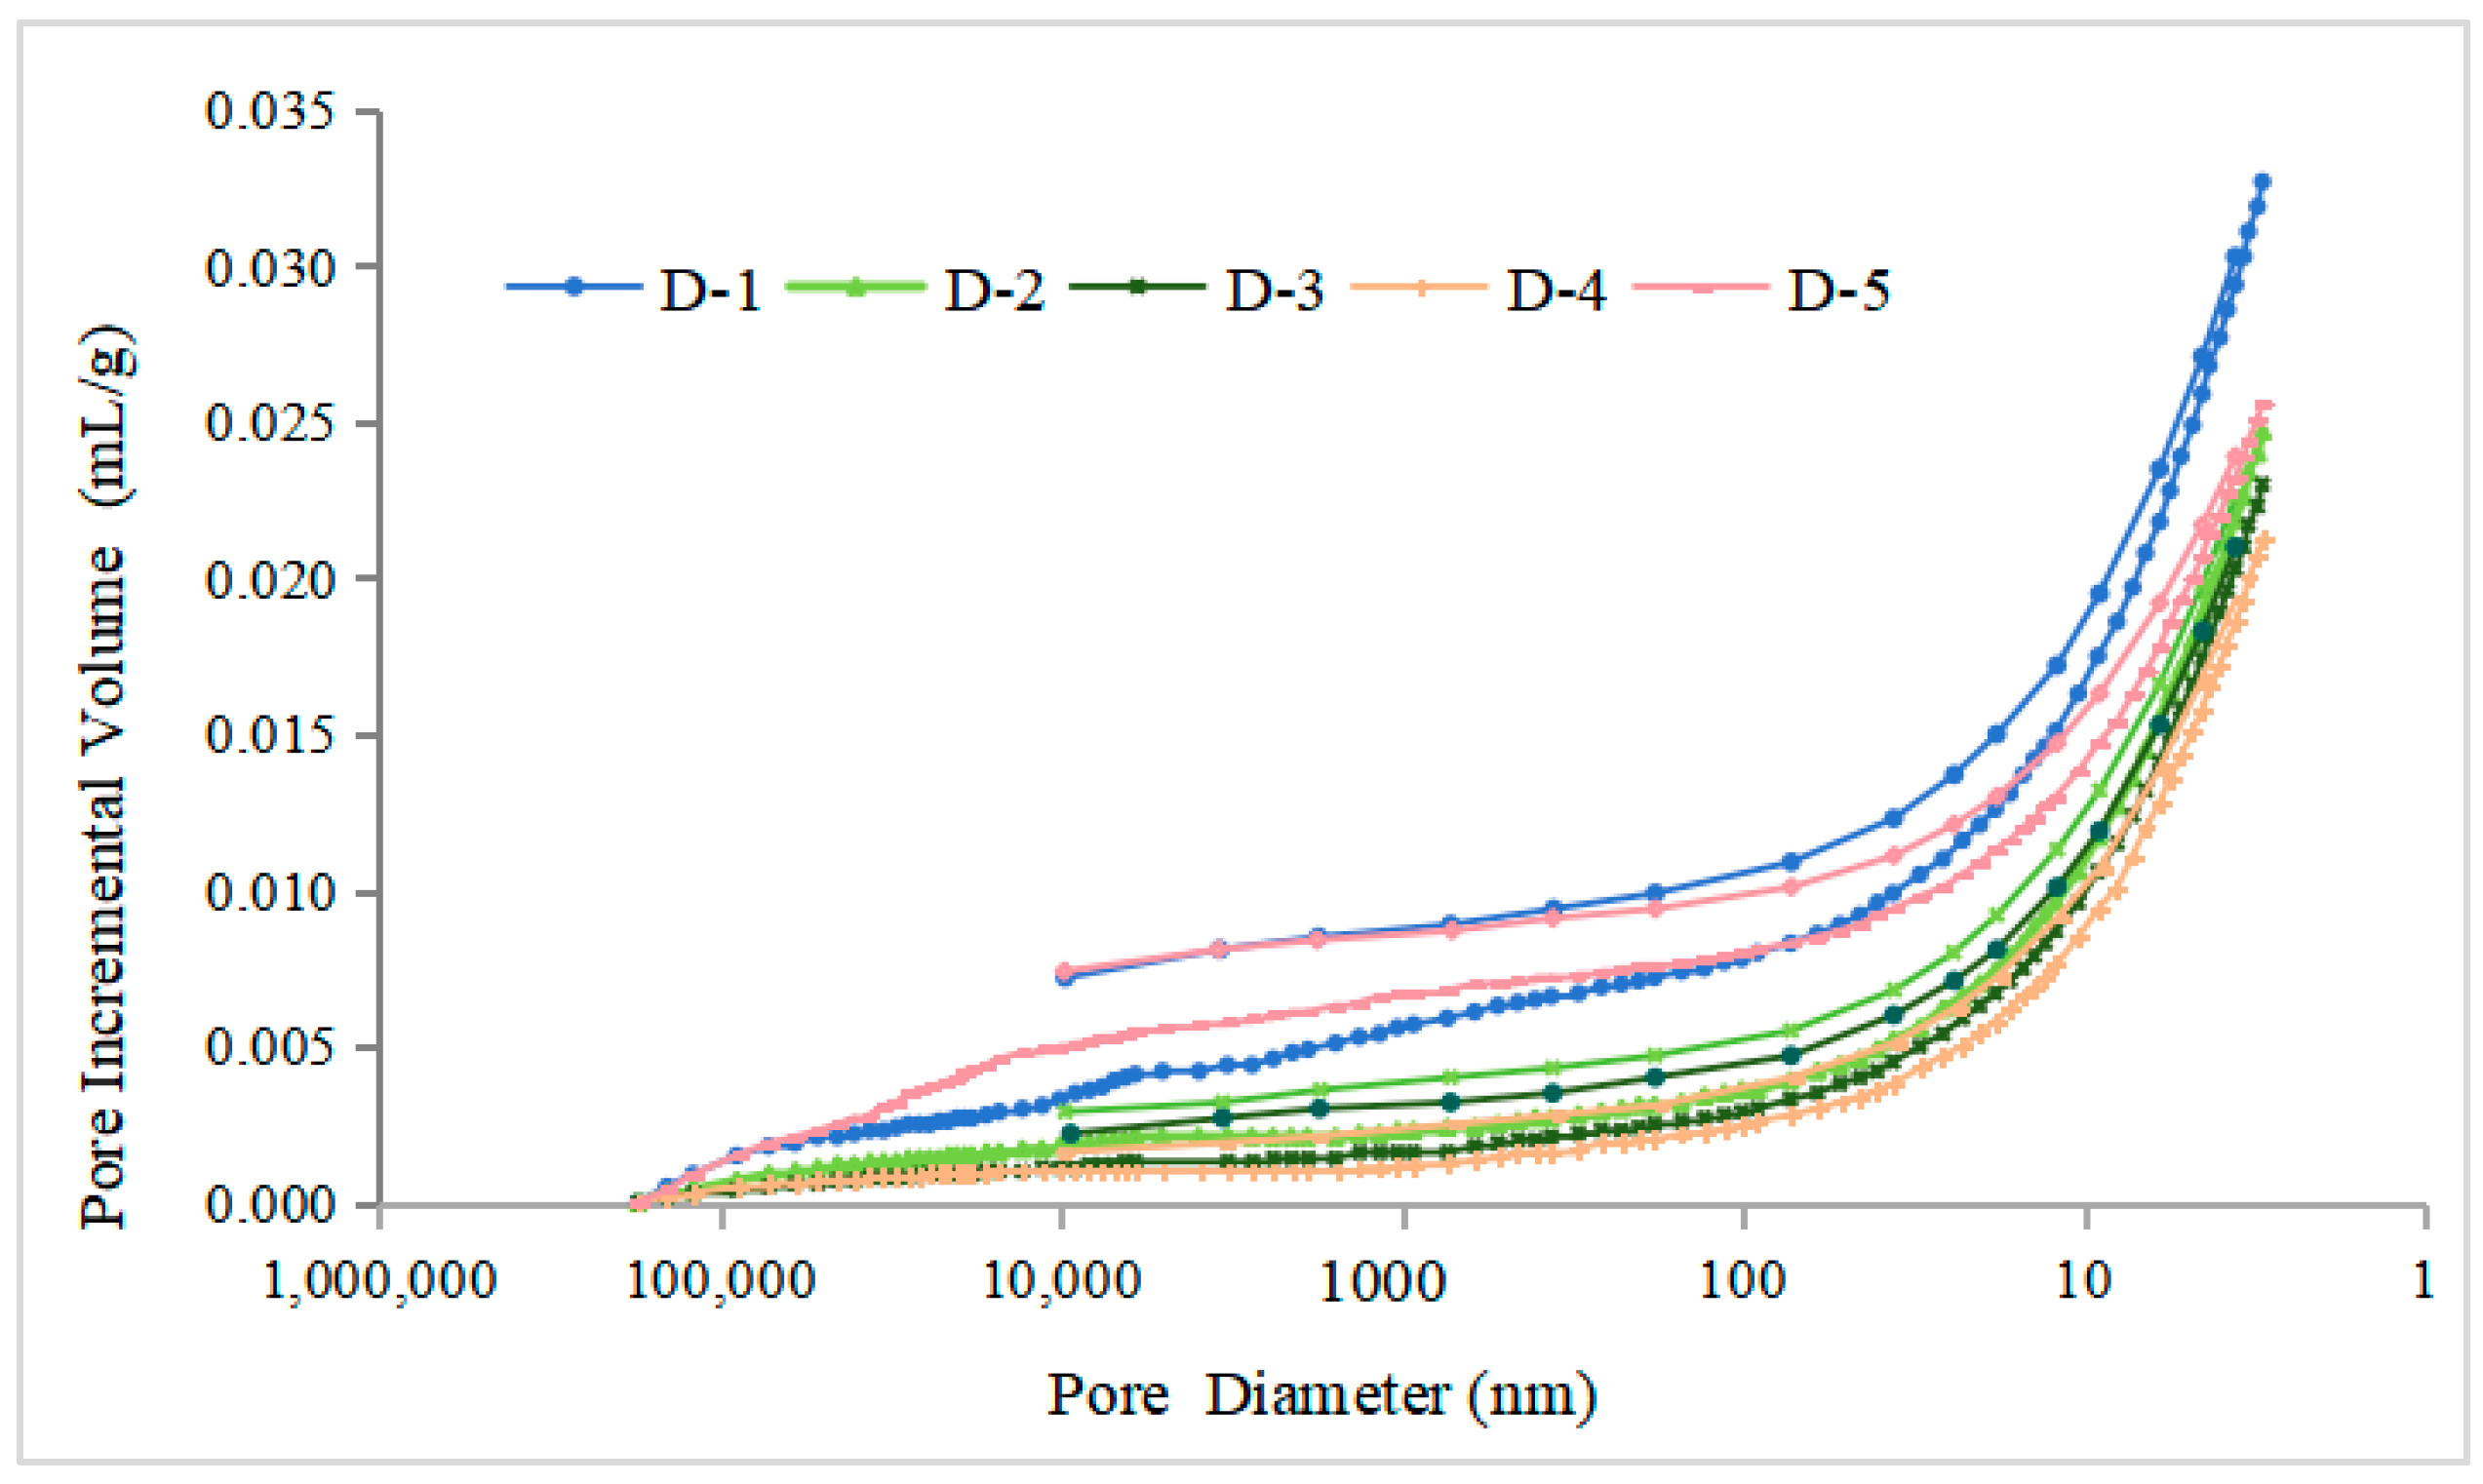
4.1.1. Reservoir Pore Characteristics

Five samples were selected for mercury intrusion testing. According to the pore volume and specific surface area data of coal reservoirs (Table 2), the porosity ranges from 1.3% to 6.3%, with an average of 3.8%. It is mainly composed of micropores and transitional pores, accounting for over 80%. In terms of specific surface area, the proportion of micropores is the highest, followed by transitional pores, with average proportions of 89.08% and 10.77%.
From the curve of the change in stage mercury intake with pore size (Figure 3), it can be seen that the stage mercury intake has obvious distribution characteristics at both ends. The mercury intake is mainly distributed in the range between >10,000 nm and <100 nm, with obvious advantages at <100 nm. This indicates that the development of micropores and transitional pores is mainly found in the study area of coal 3#, with a certain amount of super large pores (microcracks), with relatively underdeveloped large pores and mesopores.
According to the morphological characteristics of the mercury advance and retreat curves (Figure 4), it can be observed that the mercury advance and retreat curves overlap in the microporous segment with a pore size of less than 10 nm, while in the pore size stage with a pore size greater than 10 nm, there is a difference in the volume of mercury advance and retreat, and the curves do not overlap. This indicates that the microporous pore types in the coal reservoir in the study area are mainly semi-closed pores and ink bottle-shaped pores, while other pore types are mostly open pores.

4.1.2. Reservoir Fracture Characteristics

Although there are some external fractures, endogenetic fractures, and micro fractures in the coal reservoir of the research area, the degree of fracture development varies at different scales. Among them, exogenous cracks are relatively developed (Figure 5A,B). With a large extension length and a broadband of several tens of micrometers, the endogenetic fractures of the reservoir are relatively undeveloped, with a development density of less than 80 fractures/cm2 (Figure 5C,D). The micro fractures in the reservoir have a certain degree of development (Figure 5E,F), with an average development density of 170 pieces/cm2. The development scale varies greatly, with a length mainly between 85 and 1600 μm and a width mainly greater than 1 μm. The development degree of ultra micro fractures in coal reservoirs is good, with fracture lengths of less than 10 μm and widths of generally less than 0.1 μm. The development degree of fractures at different scales varies, which affects the permeability characteristics of the reservoirs.

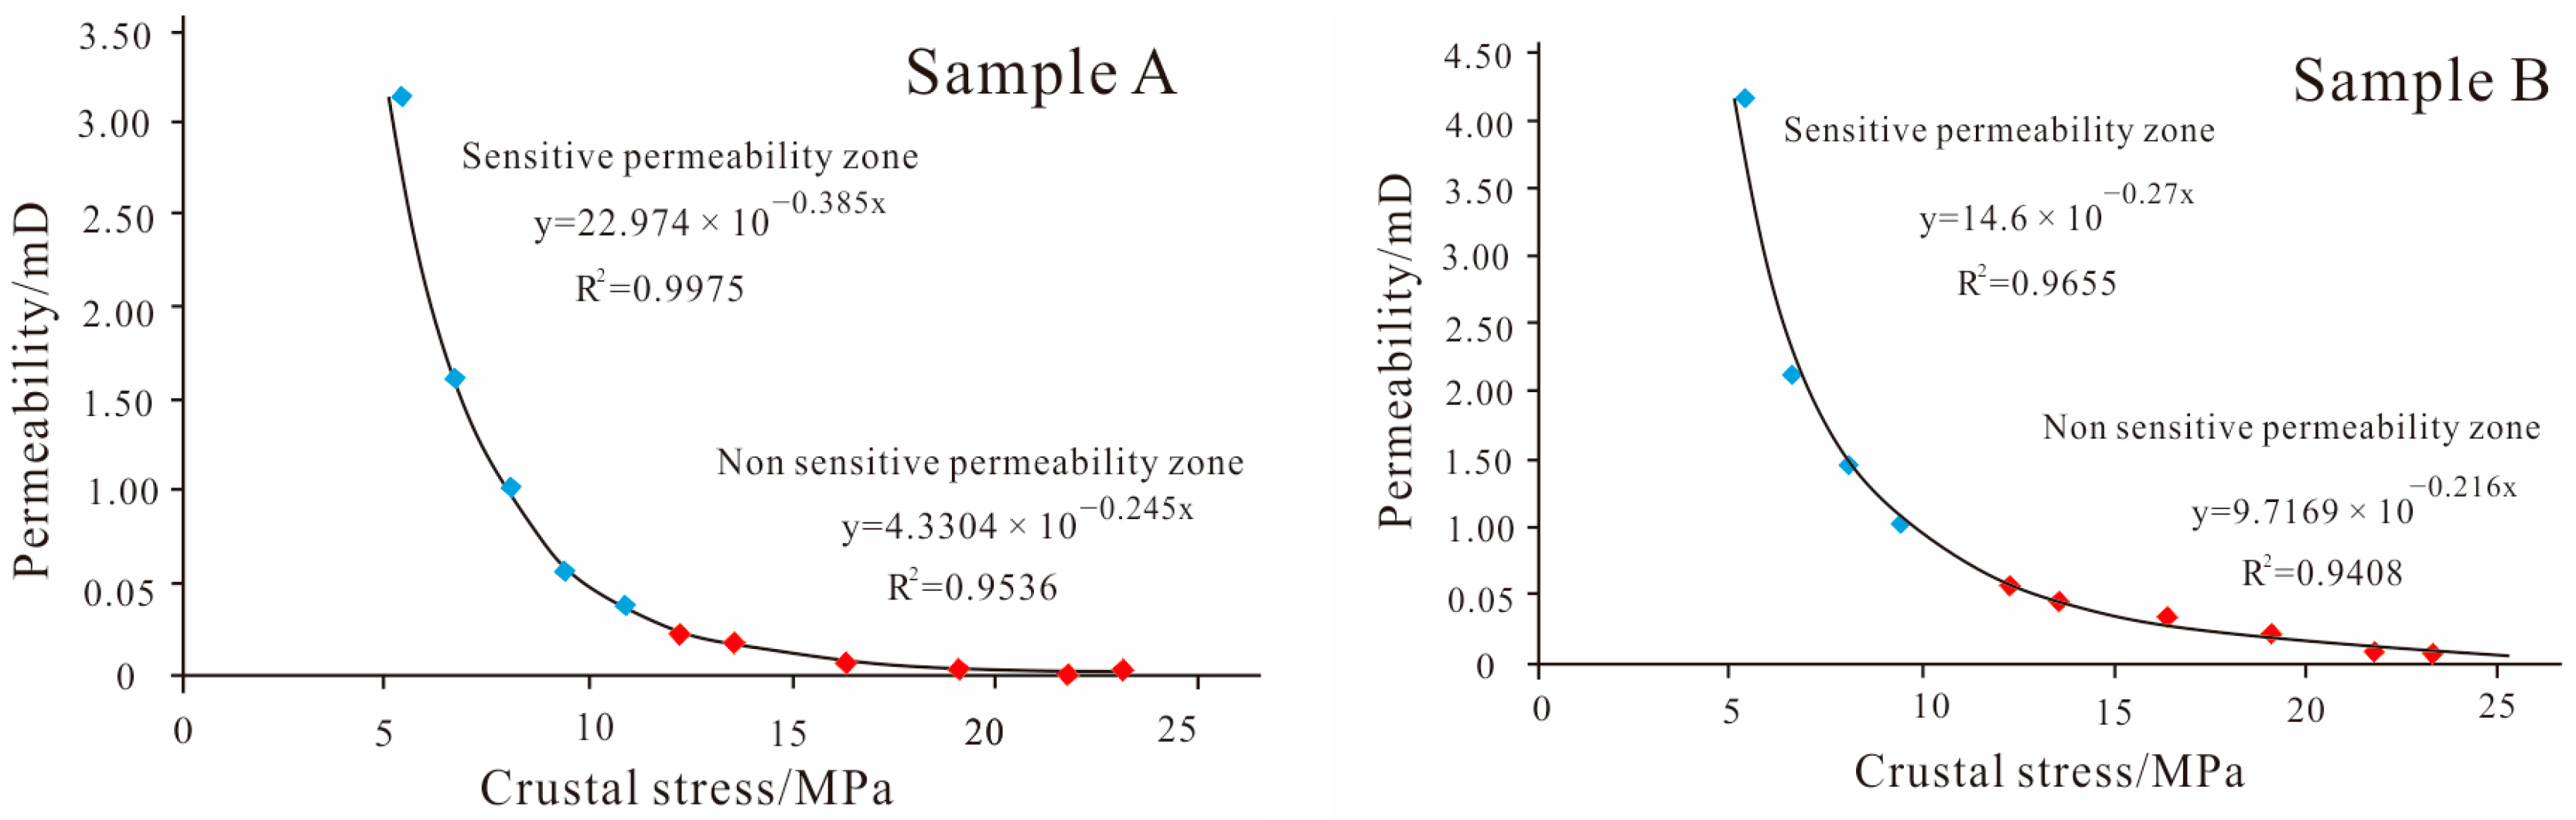
4.1.3. Permeability Characteristics

Experimental tests found that the permeability values of coal reservoirs in the study area were generally low, mainly ranging from 0.09 × 10⁻³ to 8.07 × 10⁻³ μm2, and the permeability was mostly less than 2 × 10⁻³ μm2. This indicated that the coal reservoirs in the study area were mainly developed as low-permeability reservoirs, which has a certain impact on the migration and production of coalbed methane.
Comparing the relationship between coal seam permeability and effective stress, it was found that there is a certain correlation between them, showing a negative exponential relationship. Using the principle of ordered quality optimal segmentation, the sensitive and insensitive areas of effective stress on permeability were segmented.
The optimal segmentation points for samples A and B both occurred at an effective stress of 12.2 MPa (Figure 6), when the effective stress of sample A increased to about 12.2 MPa, the dimensionless permeability decreased by 93.25%, and the dimensionless permeability of sample B decreased by 85.79%. Through the segmentation, it can be concluded that the effective stress in the permeability-sensitive zone (the stage of macroscopic fracture compression) corresponds to an effective stress of 12.2 MPa and a coal seam with a burial depth of less than 720 m, and that the effective stress corresponds to coal seams with a burial depth greater than 720 m in areas where permeability is not sensitive (during the compression stage of micro pores, small pores, and micro cracks). It can be seen that the 3# coal seam in the research area (with a burial depth range of 300–800 m) is mostly located in a stress-sensitive permeability zone.

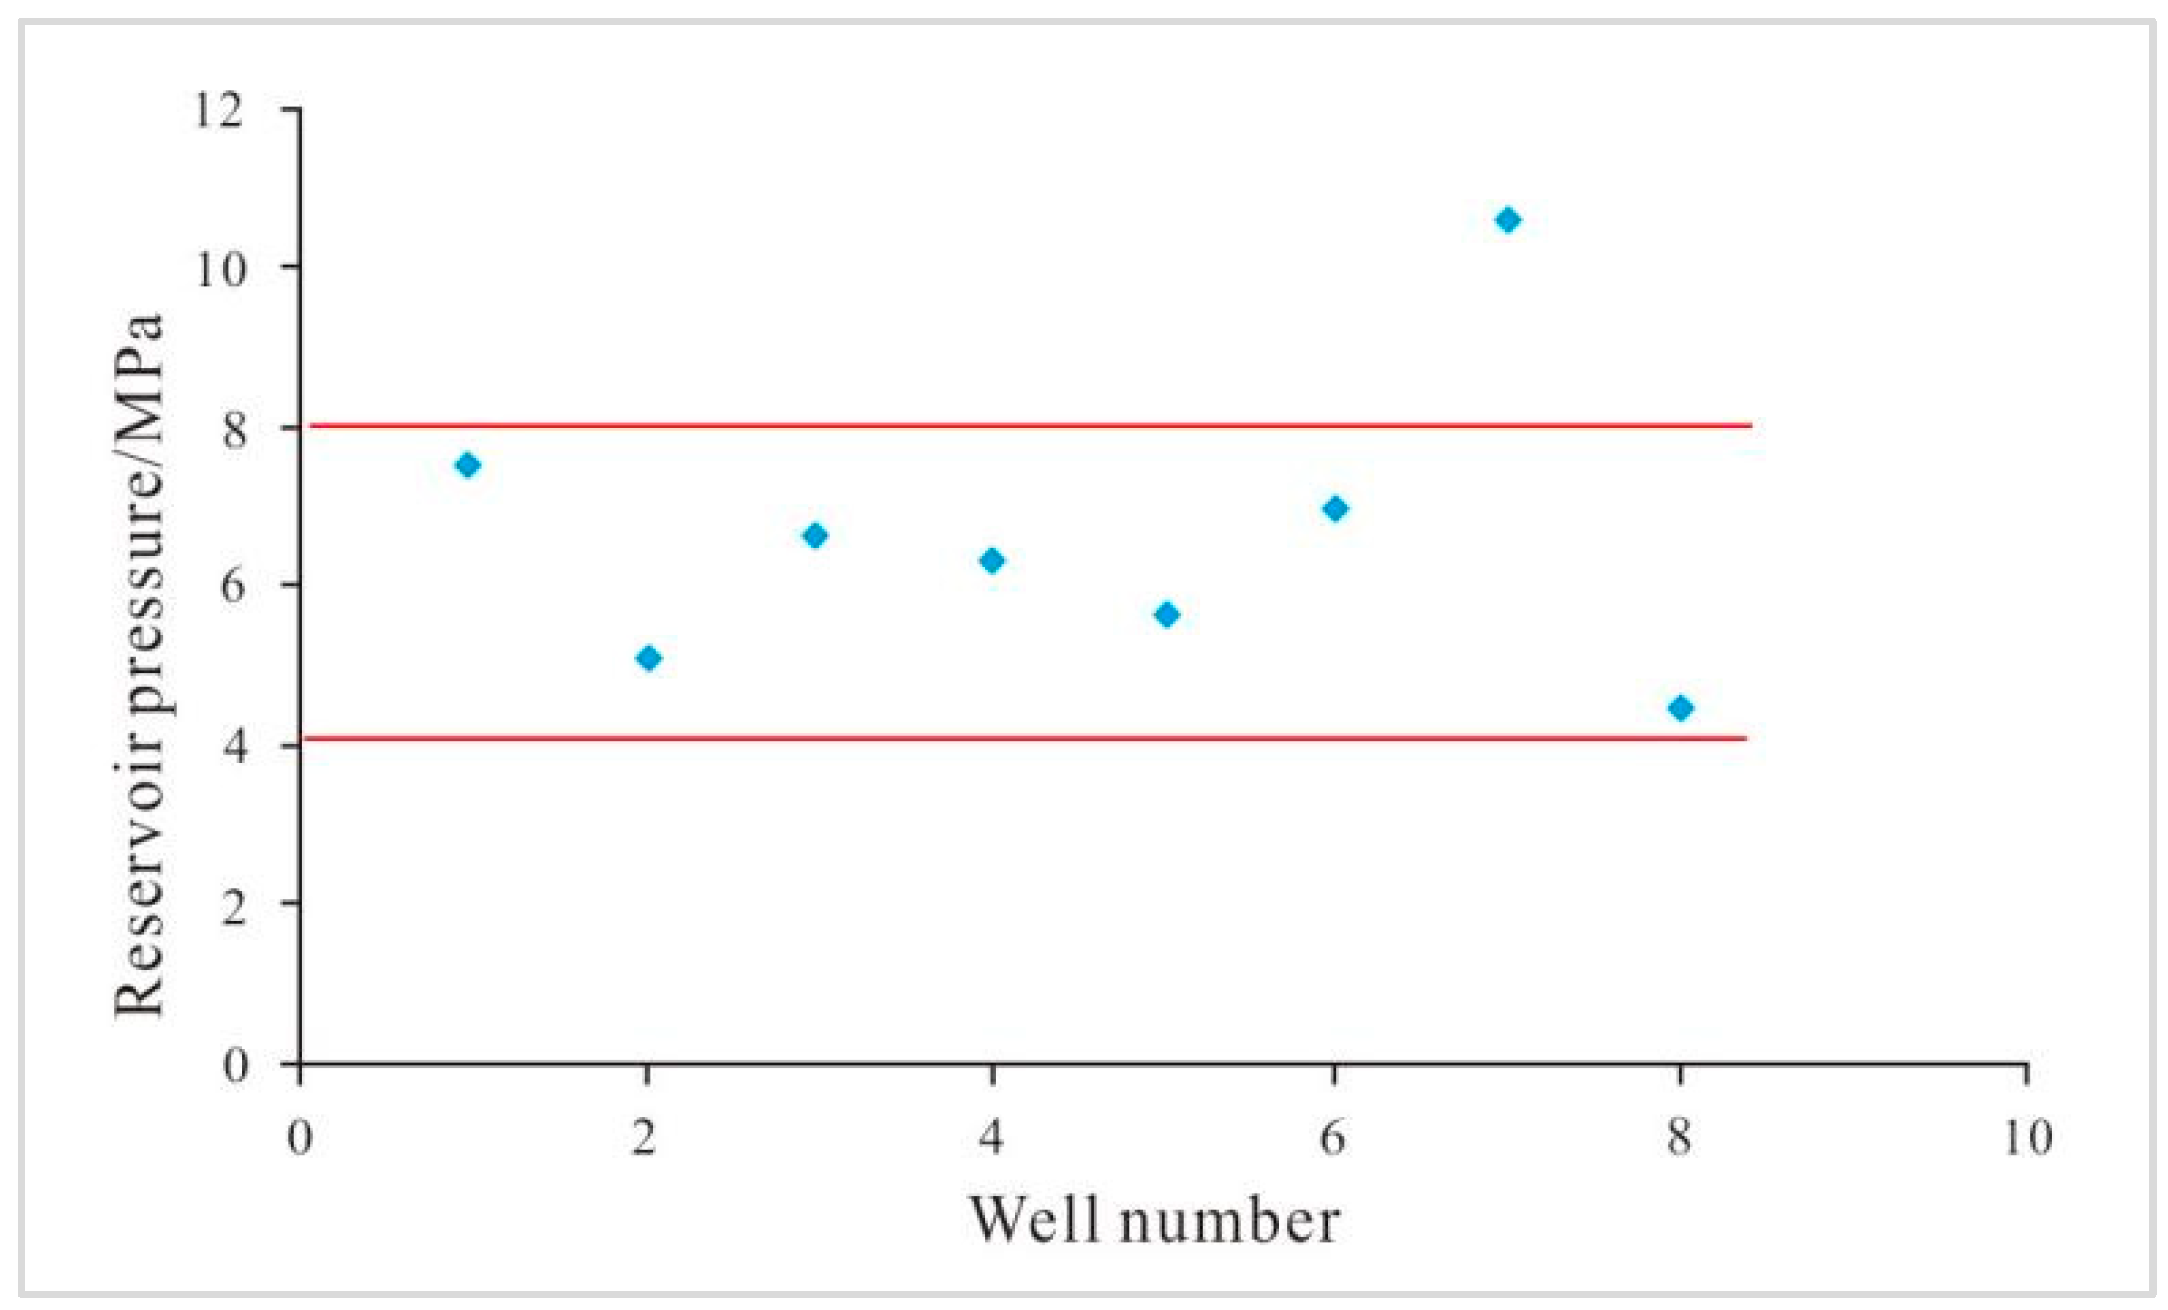
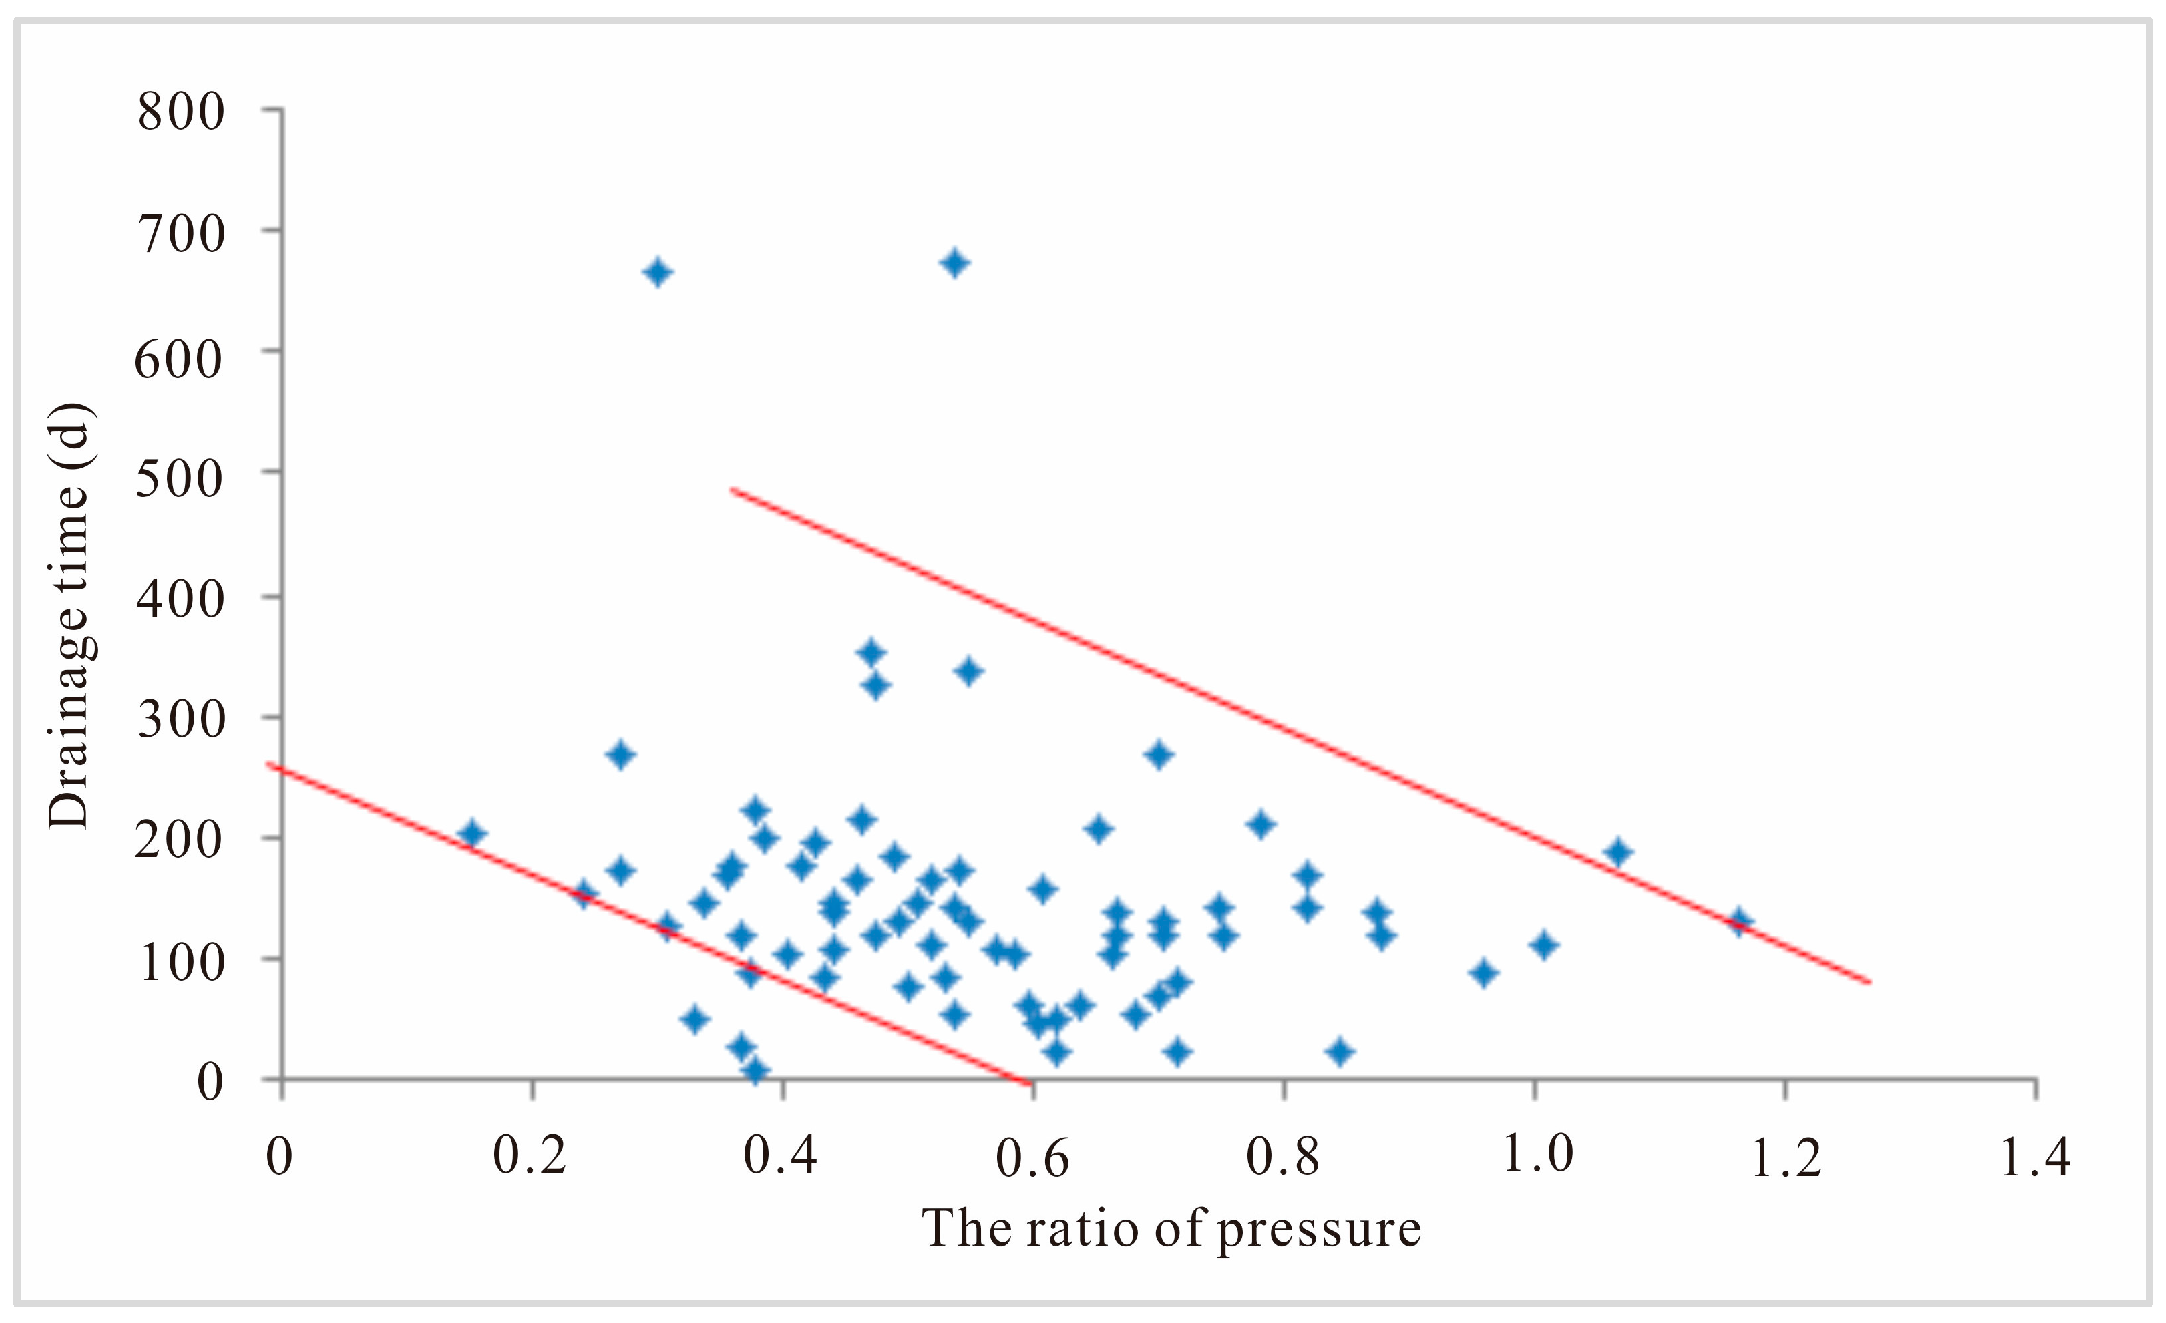
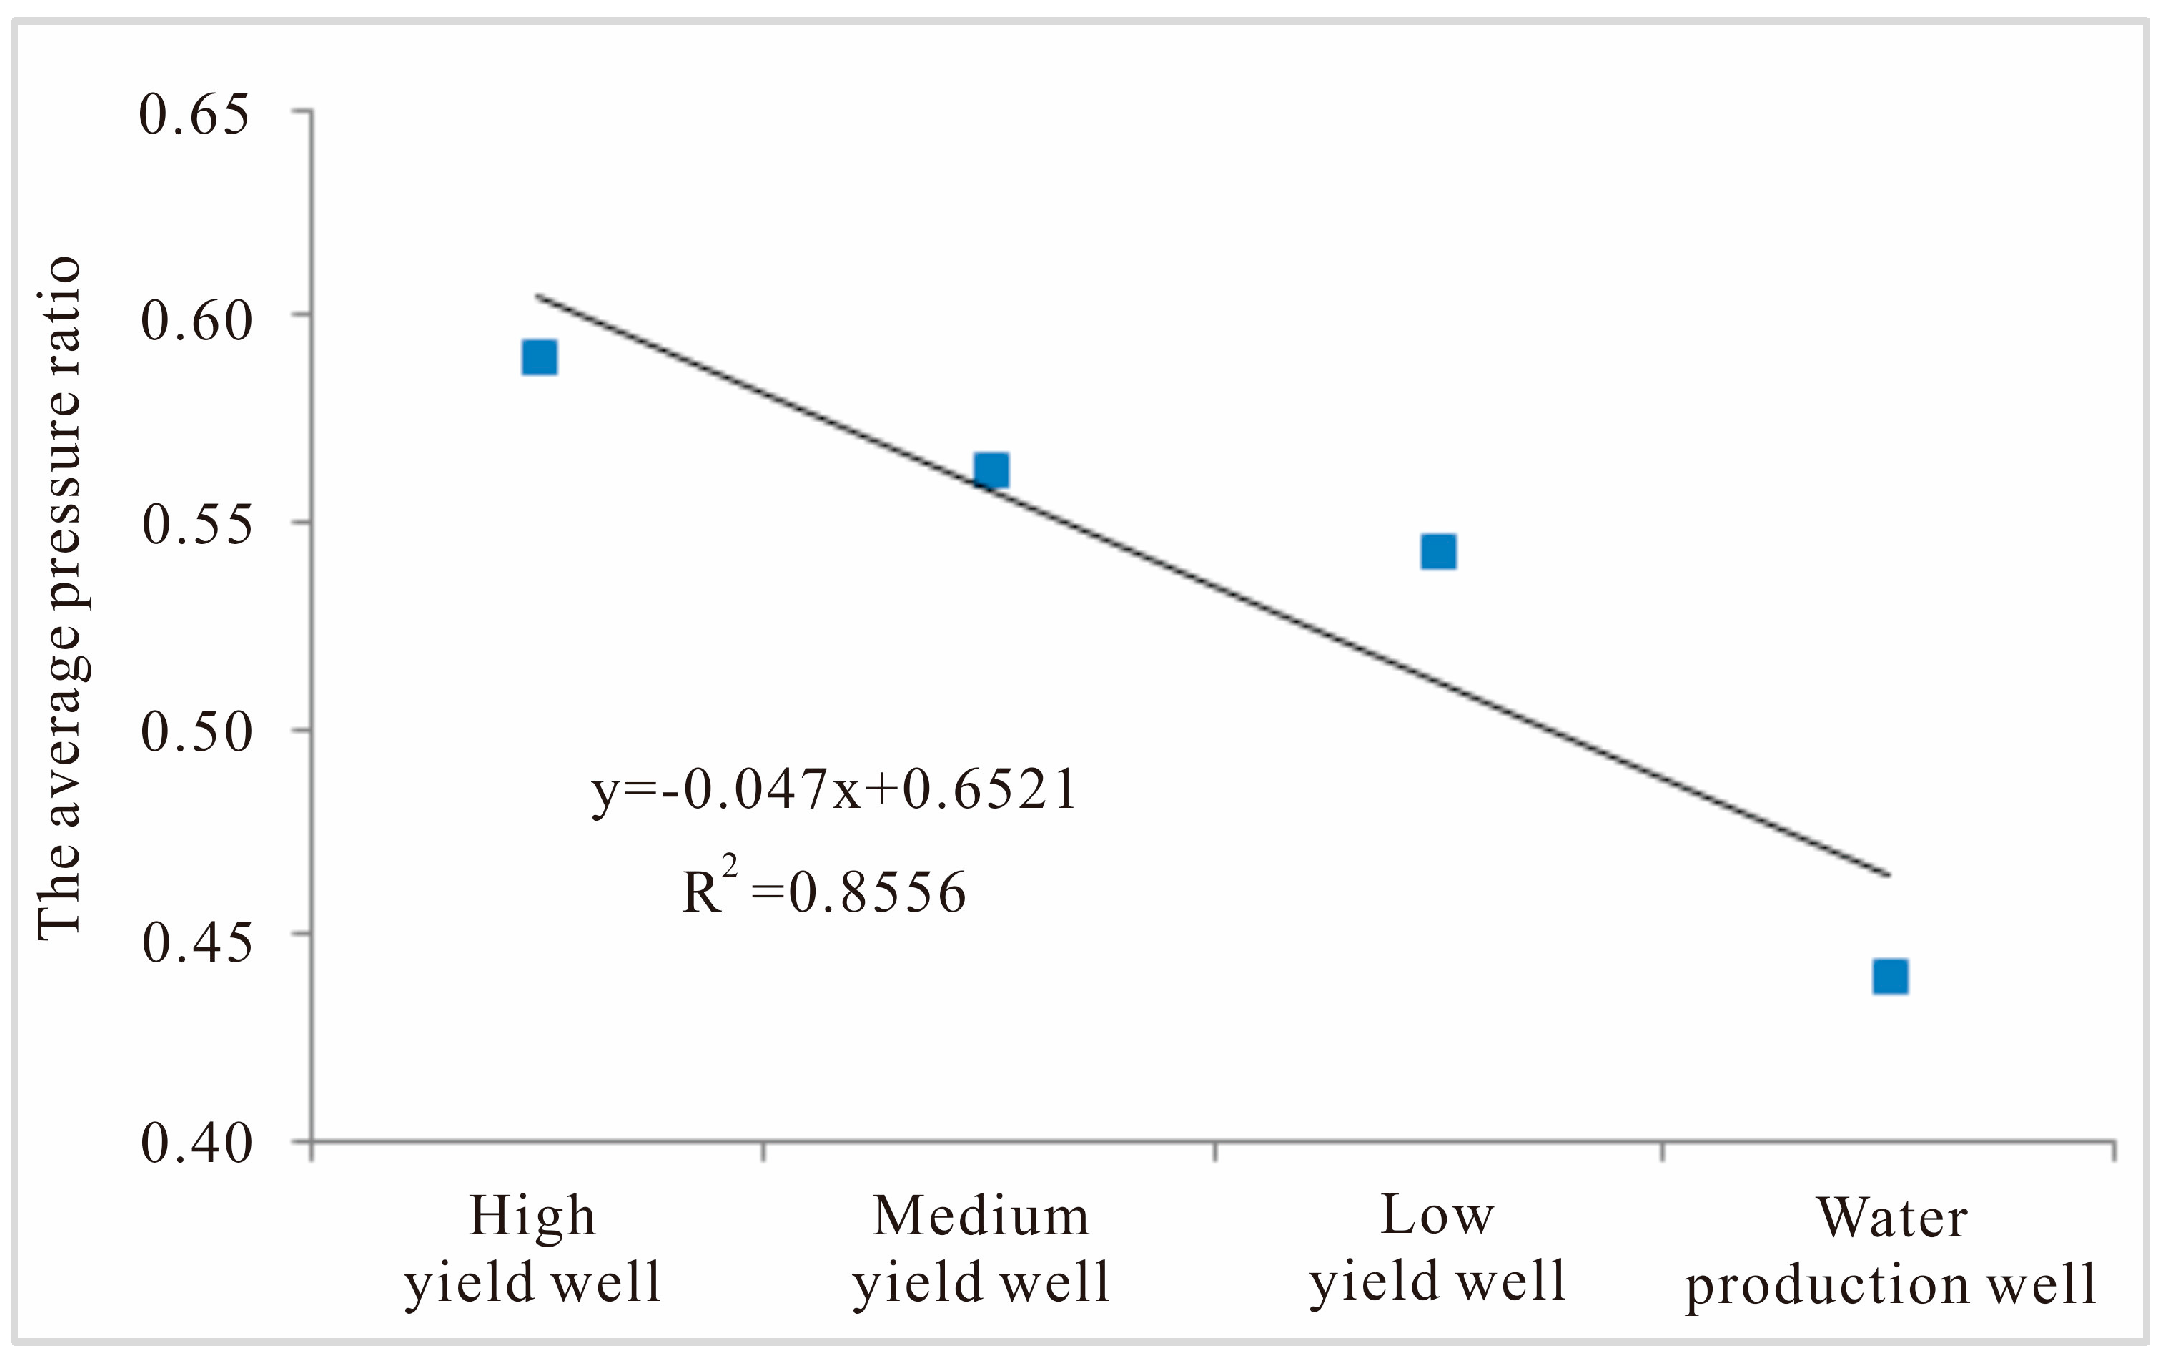
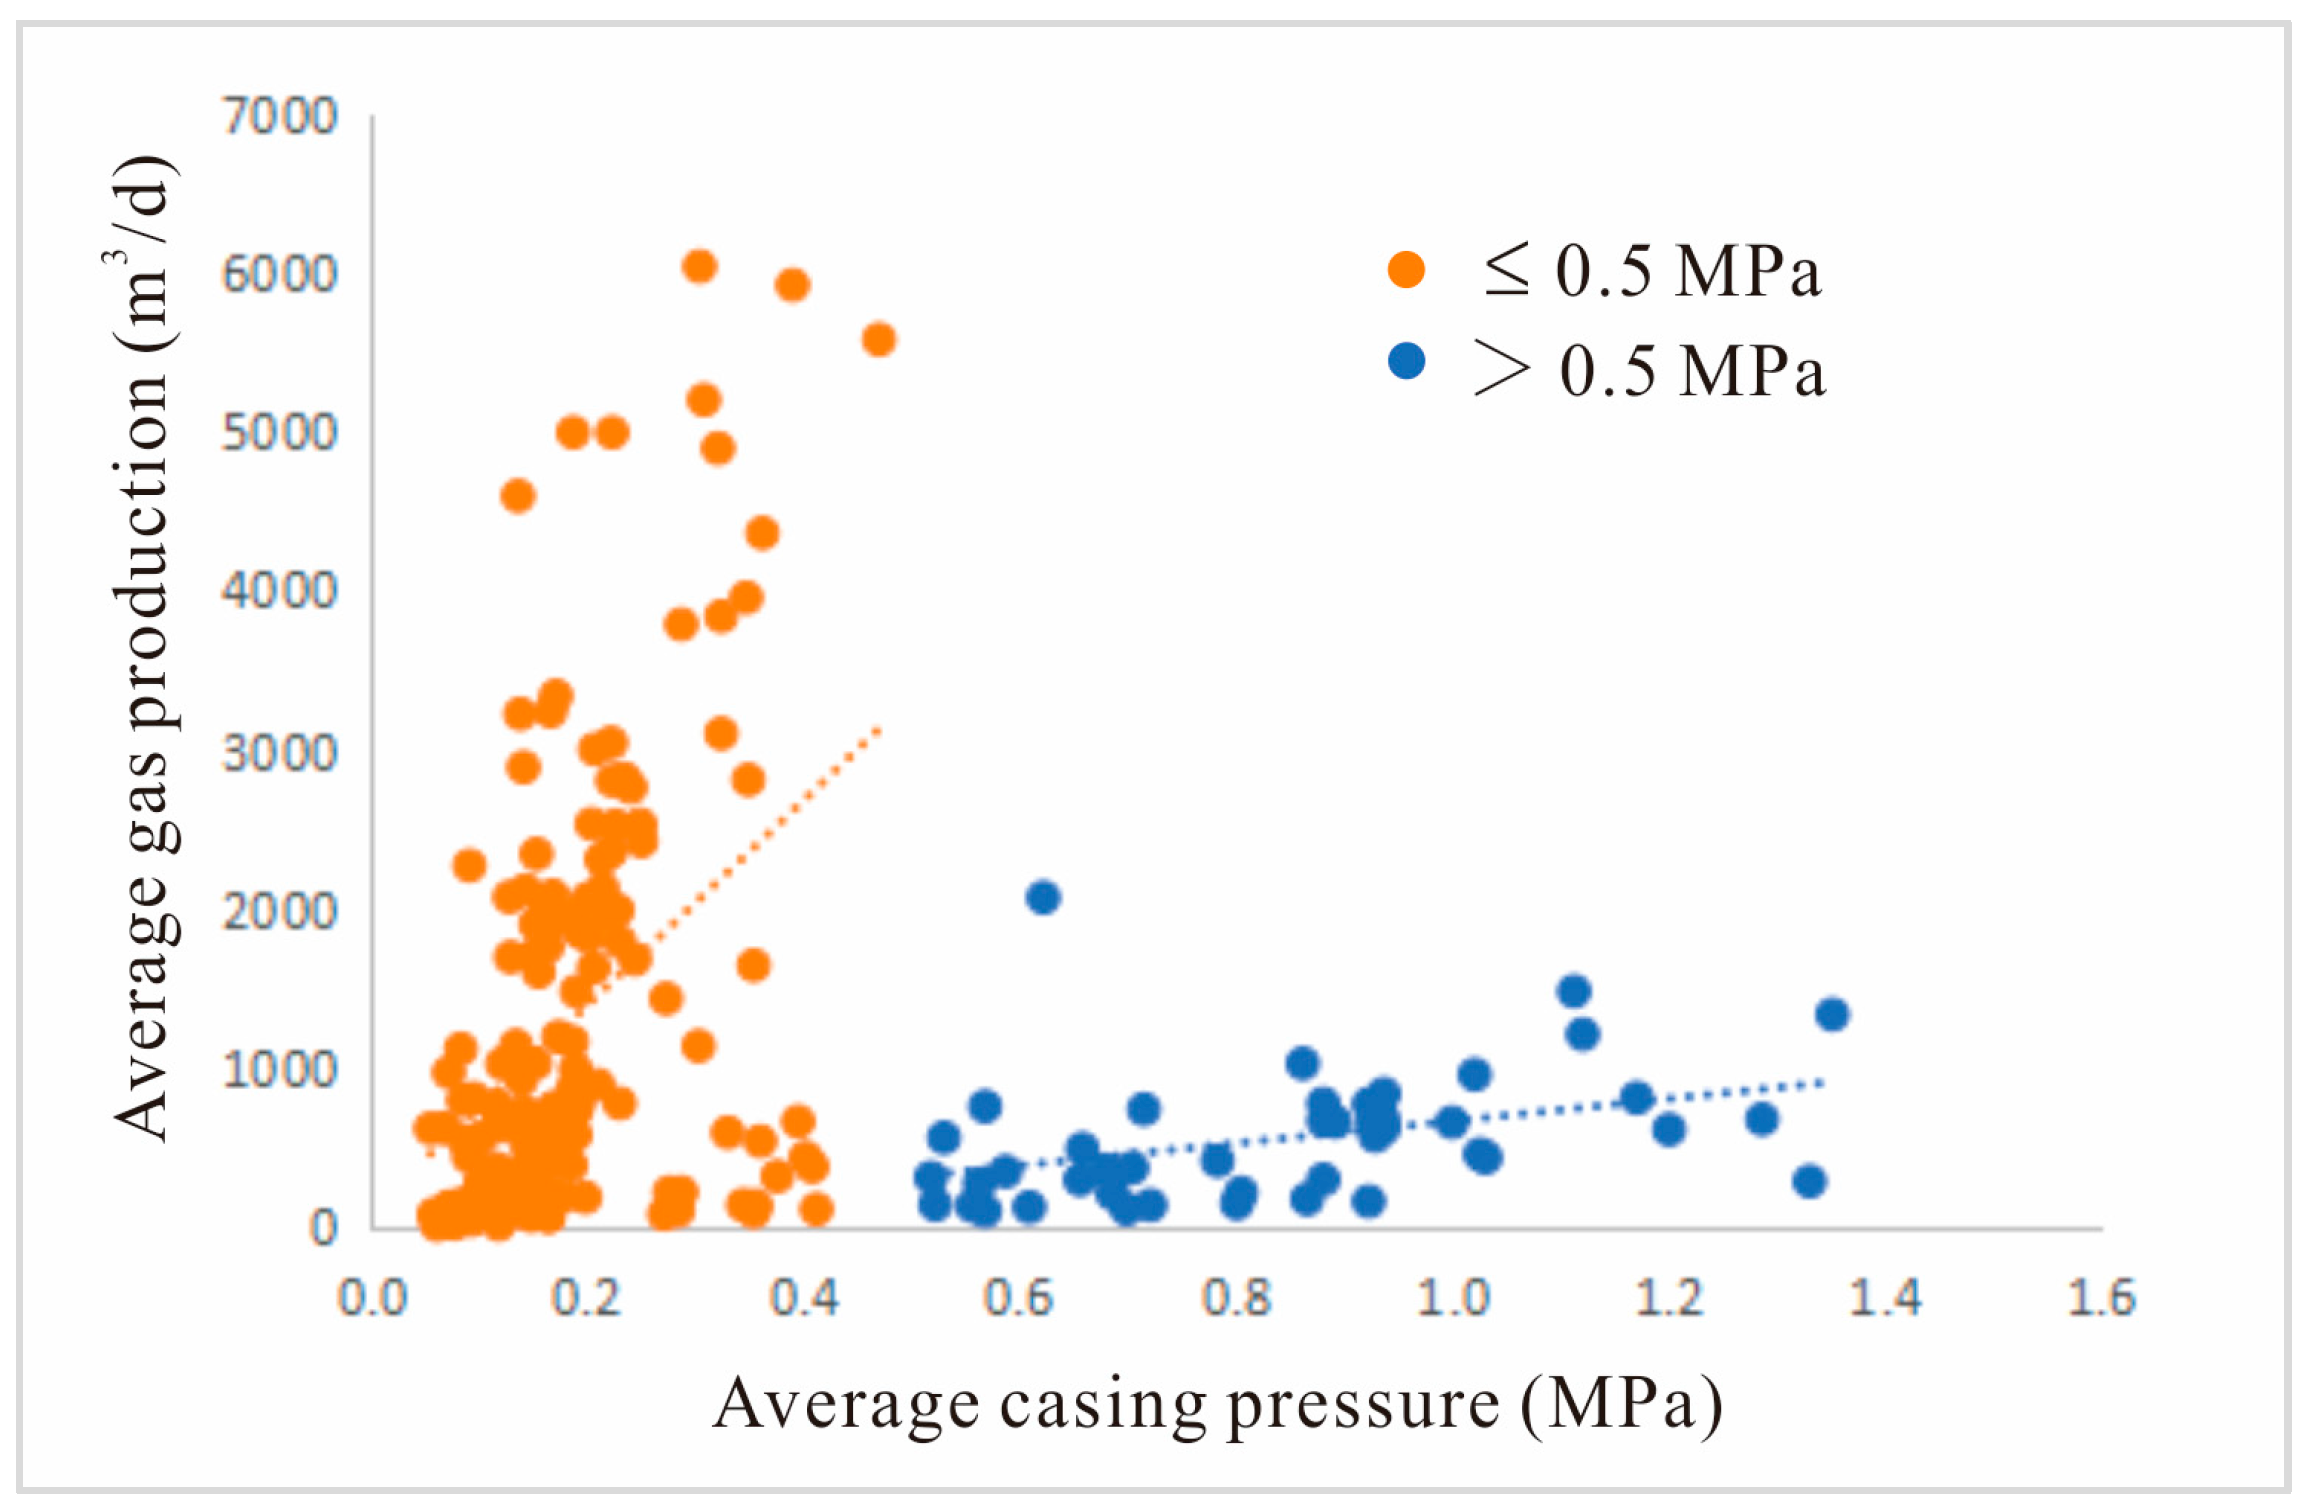
4.1.4. Reservoir Pressure Characteristics

By utilizing well testing techniques, reservoir pressure was obtained through on-site measurements, using injection/pressure drop well testing methods, installing a pumping system on the ground and a testing device underground, and using the DDI-T-150 series storage electronic pressure gauge to record changes in downhole pressure. During the in situ stress testing process, one data point was collected every second, and the data were analyzed using PanSystem V3.2.0 well testing software to obtain reservoir pressure parameters.
According to the production data of coalbed methane wells, it was found that the lowest and highest coal reservoir pressures in the study area were about 4.0 MPa and 11.3 MPa, with an average of 6.6 MPa (Figure 7). Although reservoir pressure is constrained by factors such as depth and stress characteristics, statistical analysis of reservoir pressure gradients in the target area reveals that their values mainly range from 8.3 to 10.8 KPa/m, with an average of about 9.45 KPa/m, which is lower than the static water pressure gradient value of 9.78 KPa/m. Therefore, the reservoirs in the study area have obvious characteristics of low-pressure reservoirs, which have certain constraints on the opening degree of reservoir fractures and affect the production and seepage of coalbed methane.

4.1.5. Reservoir Adsorption Characteristics

Isothermal adsorption tests were conducted on 10 samples, and the experimental results, seen in Figure 8, show that the Langmuir volume (VL) of 3# coal ranges from 28.23 to 36.31 m3/t, with an average of 32.67 m3/t, and the Langmuir pressure (PL) ranges from 1.92 to 2.73 MPa, with an average of 2.35 MPa, indicating that the coal reservoir has strong coalbed methane adsorption capacity.

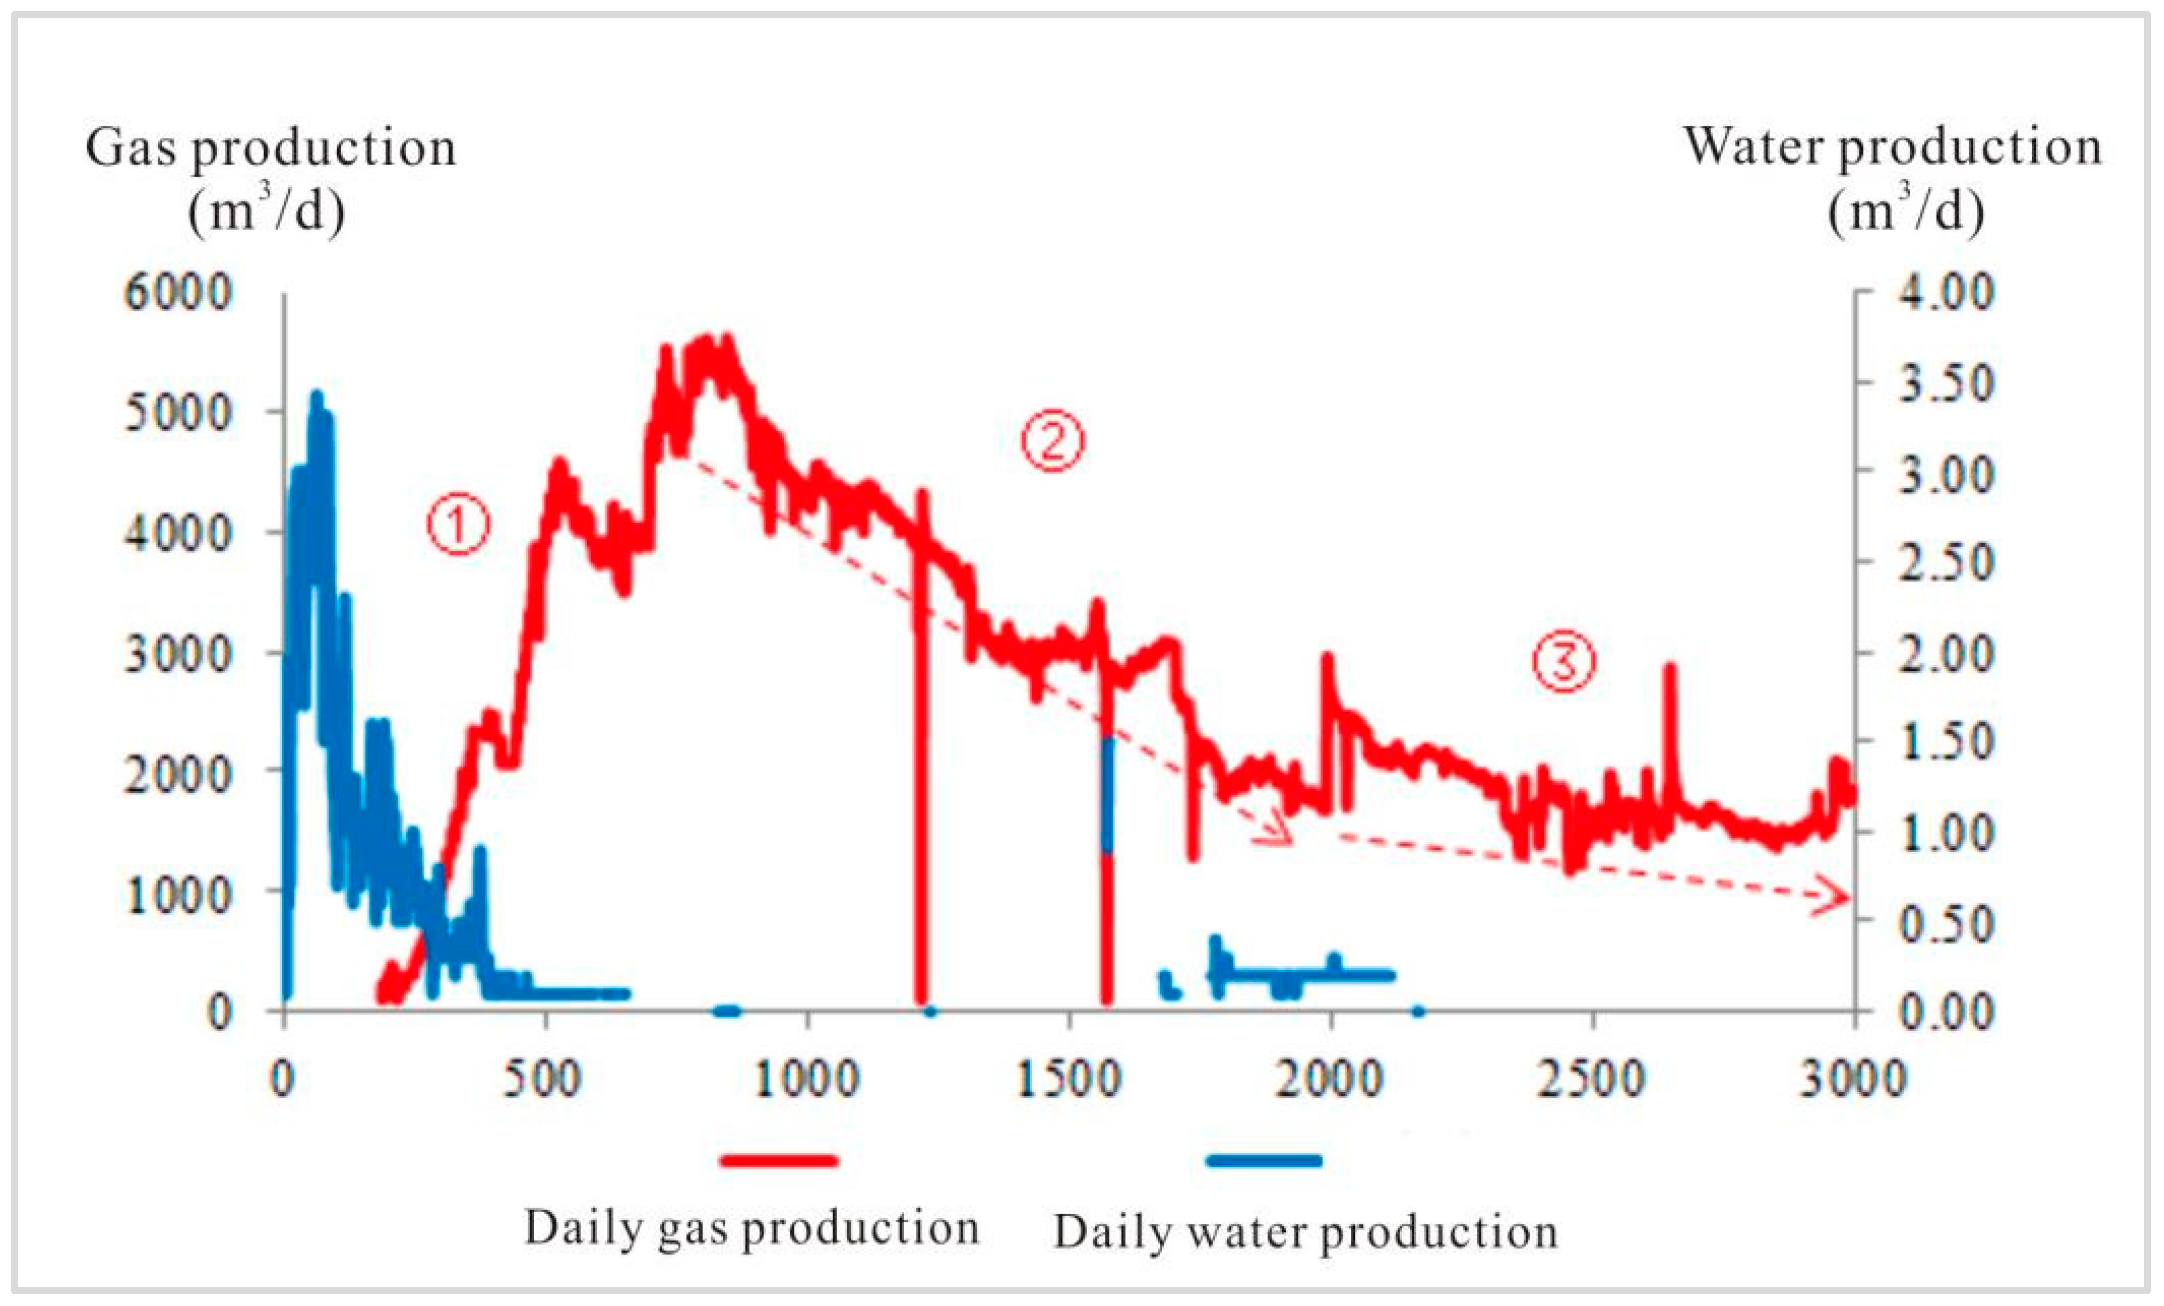
4.2. Characteristics of Coalbed Methane Production Capacity in the Research Area

To determine gas content, according to GB/T 19559-2008 “Method for determination of coalbed methane content” [49], select test samples on site for measurement. The gas content of coalbed methane wells in the research area mainly ranges from 8.0 to 30.4 m3/t, with an average of 19.6 m3/t. The daily gas production is between 15 and 6000 m3/d, and the average monthly gas production is 1100 m3/d. The production capacity gradient changes significantly.
In order to explore the production law of low-permeability and low-pressure coalbed methane reservoirs, based on the theory of planar radial seepage and referring to the coal rock characteristics of the reservoir in the study area, MATLAB R2010a software was used to simulate the variation characteristics of the reservoir pressure drop funnel within 2000 days of coalbed methane well production in the study area. The variation in reservoir pressure drop was explored, and the simulation parameters are shown in Table 3.
It can be seen from the relationship between pressure drop propagation distance and time (Figure 9), at different time stages, that there are certain differences in propagation speed. Although the range of pressure impact varies among different reservoirs, the overall trend shows that, as production time progresses, the range of pressure drop impact gradually increases. The maximum impact distance after 30 days of production is 70 m, the impact distance can reach 130 m after 100 days of production, and the distances after 130 days and 150 days are 150 m and 180 m. However, as time progresses, the impact distance changes slowly, and the curve tends to be horizontal.
Until the 800th day, the range of pressure drop influence can reach 300 m from the wellbore, the pressure drop funnel of the reservoir changes rapidly, and then until 2000 days of production, the propagation of the pressure drop funnel slows down and the change is not significant, with an impact range of only 100 m. Therefore, at different time periods, as production deepens, the degree of disturbance and damage to the reservoir caused by mining varies, resulting in changes in the permeability and pressure drop characteristics of the reservoir, which affects the efficiency of coalbed methane production.
In order to further explore the gas production characteristics of low-permeability and low-pressure reservoirs in the study area, based on the variation law of reservoir pressure drop and combined with the actual production curve of typical coalbed methane wells in the study area (Figure 10), the specific impact of energy change characteristics of coal reservoirs on coalbed methane production in the study area was analyzed. It can be seen that the production of coalbed methane in the research area has a clear phased production pattern, which is constrained by factors such as reservoir energy and resource abundance. The production curve shows a three-stage production characteristic of “one rise and two drops”.
In the early stage of coalbed methane extraction, the corresponding reservoir pressure drop funnel changes rapidly. Due to the fast propagation of reservoir pressure drop, high energy of the reservoir, sufficient gas production power, and high resource abundance in the early stage of extraction, the coalbed methane extraction curve shows a rapid upward trend. After about 800 days, it reaches the peak of gas production, and the gas production can reach 5600 m3/d, as shown in the first stage in Figure 10. As mining deepens, coalbed methane extraction enters the slow propagation stage of pressure drop funnel. During this stage, reservoir energy decreases, coalbed methane production power decreases, and coalbed methane extraction shows a rapid decline stage. Within the time range of 800–2000 days of extraction, gas production rapidly decreases from the peak to 2000 m3/d, as shown in the second stage in Figure 10. As the mining continues to deepen, the coalbed methane extraction enters its final stage, and the extraction curve shows a slow downward trend. At this stage, the pressure drop funnel of the reservoir is basically stable, mainly constrained by the resource reserves controlled by a single well. The gas production gradually decreases, and in the next 1000 days, the gas production slowly decreases to about 1000 m3/d. By the time the production reaches 3000 days, more than half of the resources controlled by a single well of coalbed methane are extracted, and ultimately the coalbed methane well will be shut down due to resource depletion.

4.3. The Influence of Reservoir Physical Properties on Coalbed Methane Production

4.3.1. The Impact of Pore and Fracture Structures on Productivity

The high-rank coal reservoirs in the research area have obvious low-permeability and low-pressure characteristics. Contrary to low-rank coal reservoirs, they have the characteristics of endogenous fractures and micropores development. Due to the different roles played by pore and fracture structures at different scales in gas desorption, diffusion, and seepage processes, the differential occurrence of pores and fractures at different scales leads to differences in the gas control ability of coal reservoirs, which affects the production efficiency of coalbed methane.
According to Equation (1), the fractal dimensions of different types of pores and fractures in the coal reservoir in the study area were calculated. From the relationship between lgVm and lg(1/r) (Figure 11), it can be seen that the results conform to the fractal dimension characteristics, with micropores having the highest fractal dimension with a mean of 2.5908, and mesopores having the lowest fractal dimension with a mean of 2.2411. The average fractal dimension of macropores and macropores (cracks) is 2.4117, which indicates that the micropore structure of coal reservoirs in the study area is relatively complex, while the complexity and heterogeneity of large and medium pores gradually weaken. The high fractal dimension of micropores indicates that the complex pore surface morphology of micropores can provide more adsorption sites for gases, providing favorable conditions for the enrichment and preservation of coalbed methane. However, the fractal dimension of macropores and mesopores (exogenous fractures) is relatively small, especially for the mesopores which have the lowest fractal dimension, indicating that the exogenous fractures, macropores, and mesopores in the reservoir are not developed, resulting in a lack of connection between the internal and external fractures during coalbed methane migration and production processes. This affects the migration of natural gas from micropores to macroscopic fractures, reduces the natural gas migration pathway, lowers the natural gas migration rate, affects reservoir permeability, and has a significant impact on coalbed methane production.
The relationship between the fractal dimension of pores at different scales and permeability can be observed in Figure 12 and shows that there is a clear linear relationship between them, indicating that the fractal characteristics of pores can reflect the permeability characteristics of reservoirs. Overall, permeability is positively correlated with macropores (external fractures) and mesopores, and negatively correlated with micropores. The negative correlation between micropores indicates that, due to the complexity of micropores, under external forces and other conditions, pore blockage and deformation are prone to occur, resulting in poor reservoir connectivity and a decrease in coal reservoir permeability.
In summary, the development pattern of micropores in the coal reservoir in the study area, where the development of macropores and mesopores (exogenous fractures) is lacking, results in the reservoir having high gas adsorption characteristics and low permeability. In addition, due to the different distribution patterns of pores and fractures, the degree of compression deformation of pores and fractures at different scales under stress is different. Therefore, the mechanical properties of different coal rocks and the development characteristics of pore fracture systems determine the stress sensitivity characteristics of coal reservoirs. Therefore, the impact of the reservoir’s physical properties on coalbed methane production capacity is indirectly reflected through aspects such as gas content and burial depth.

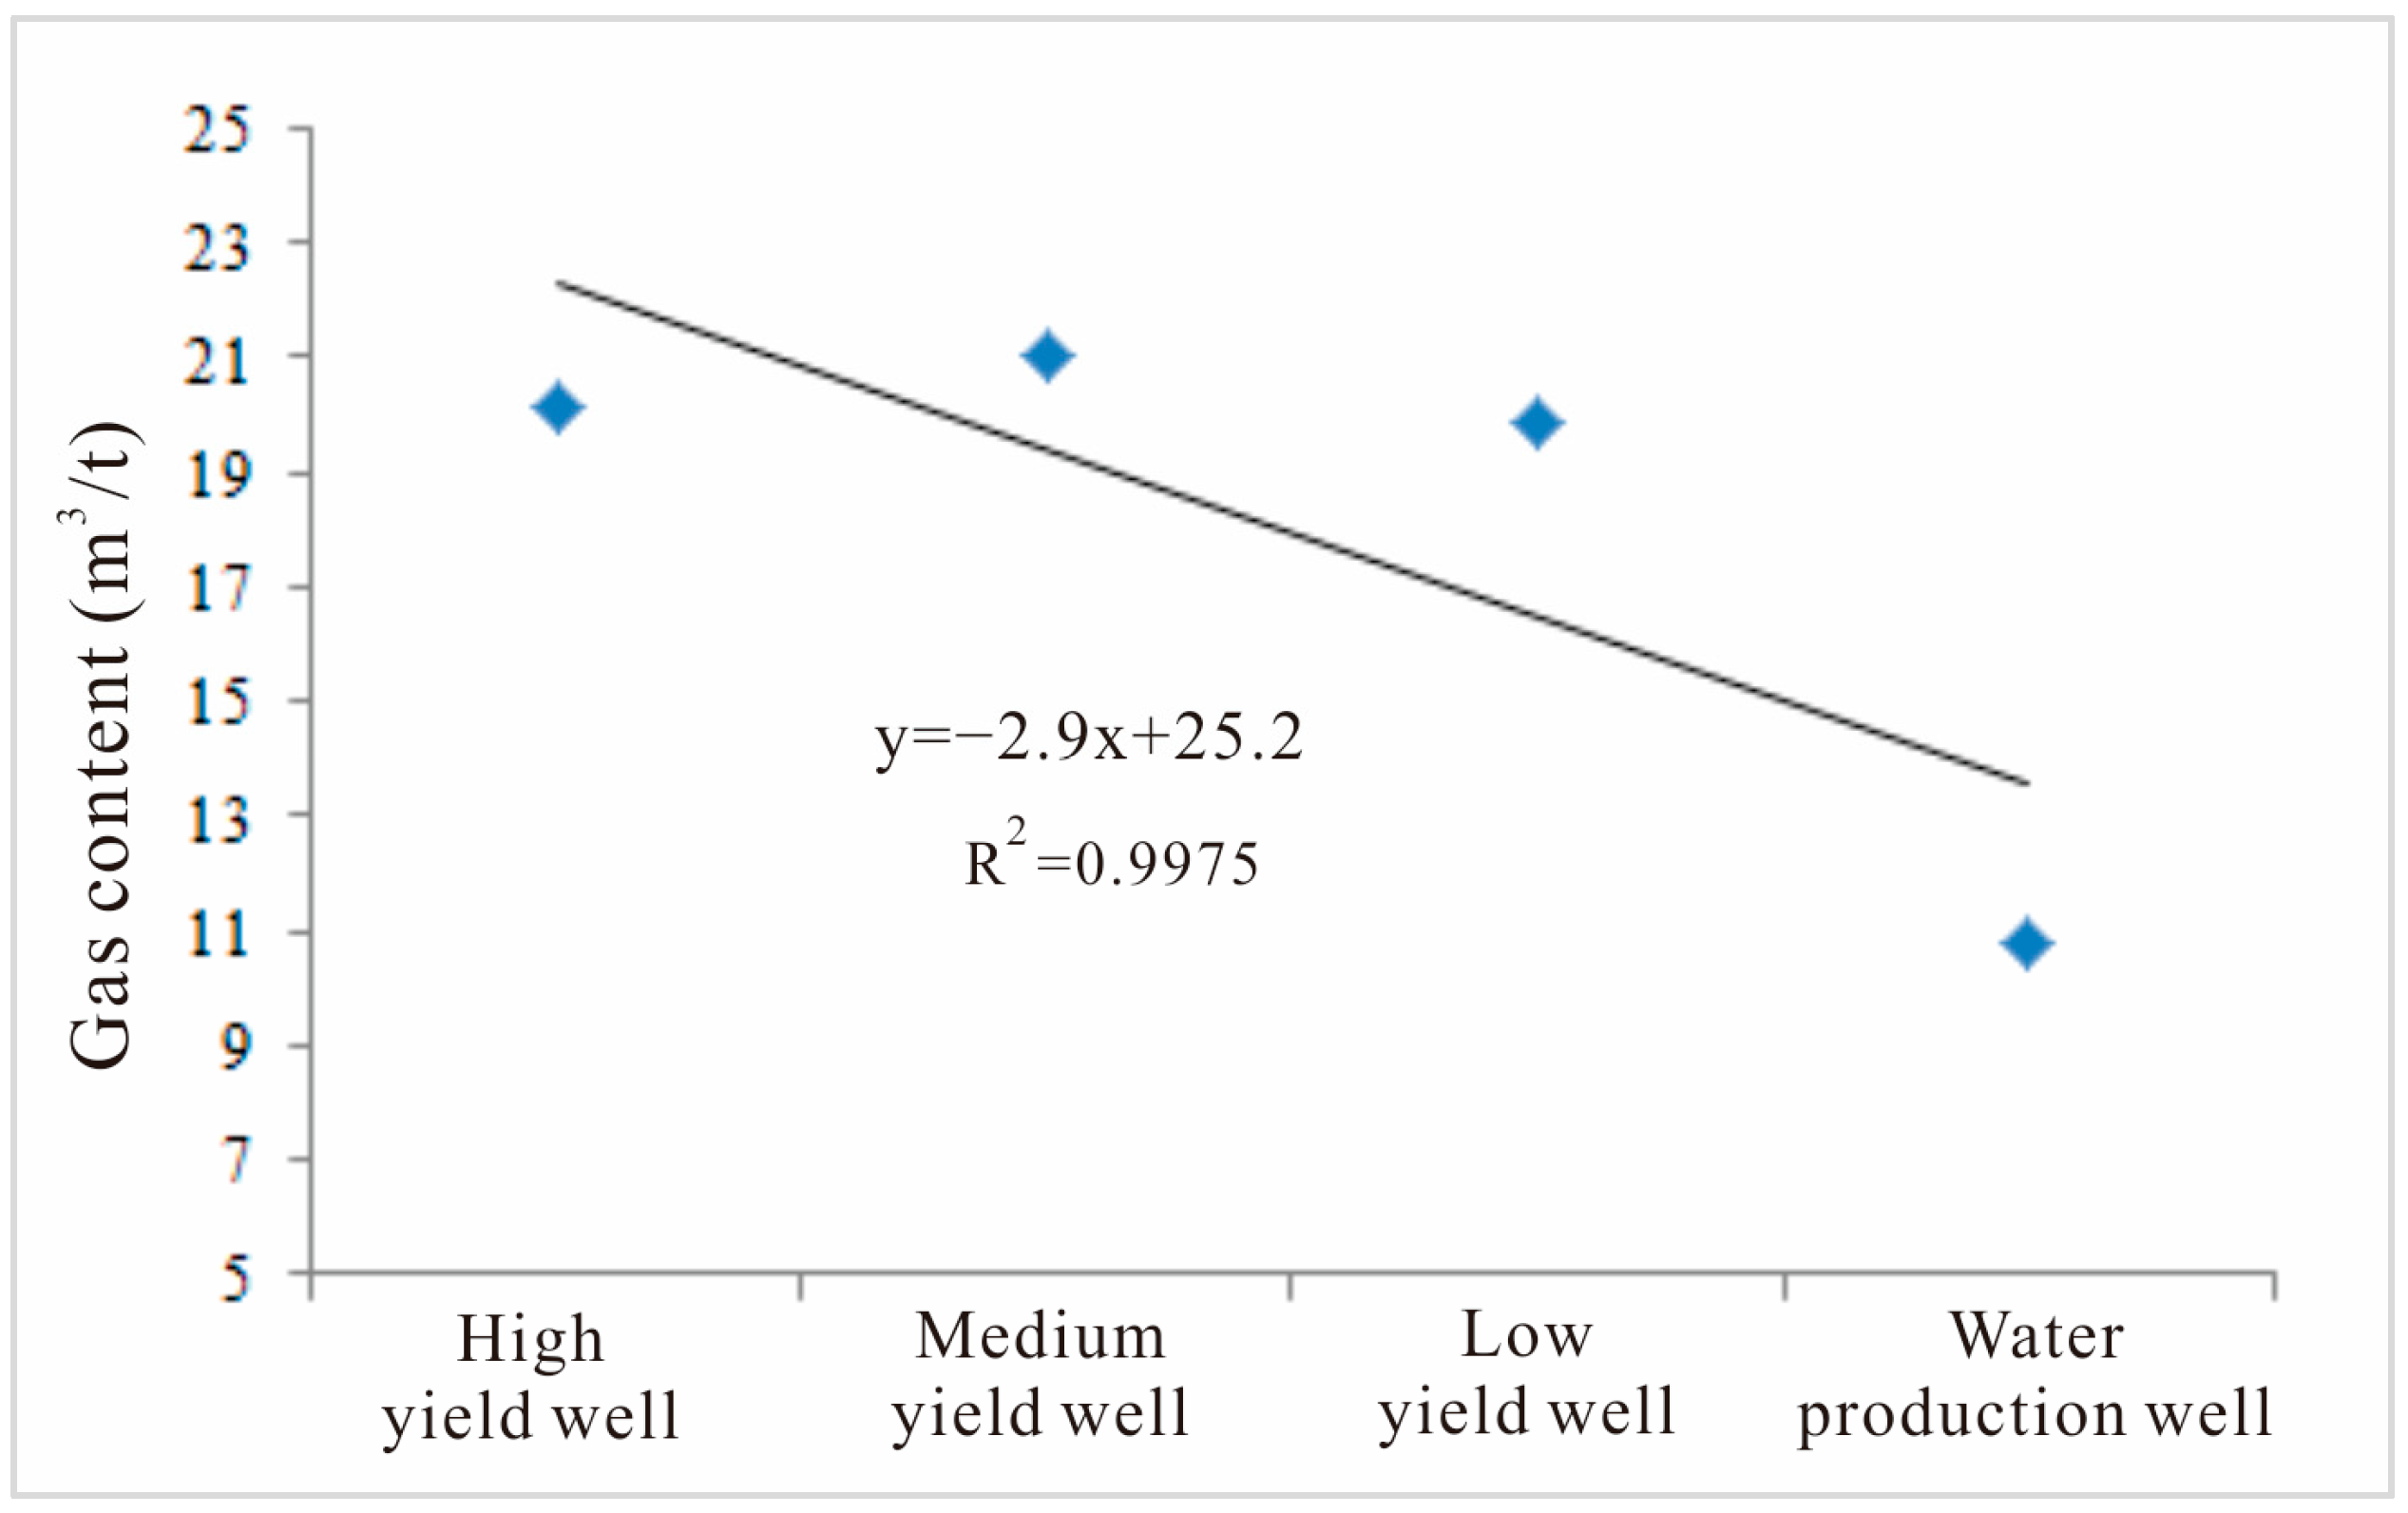
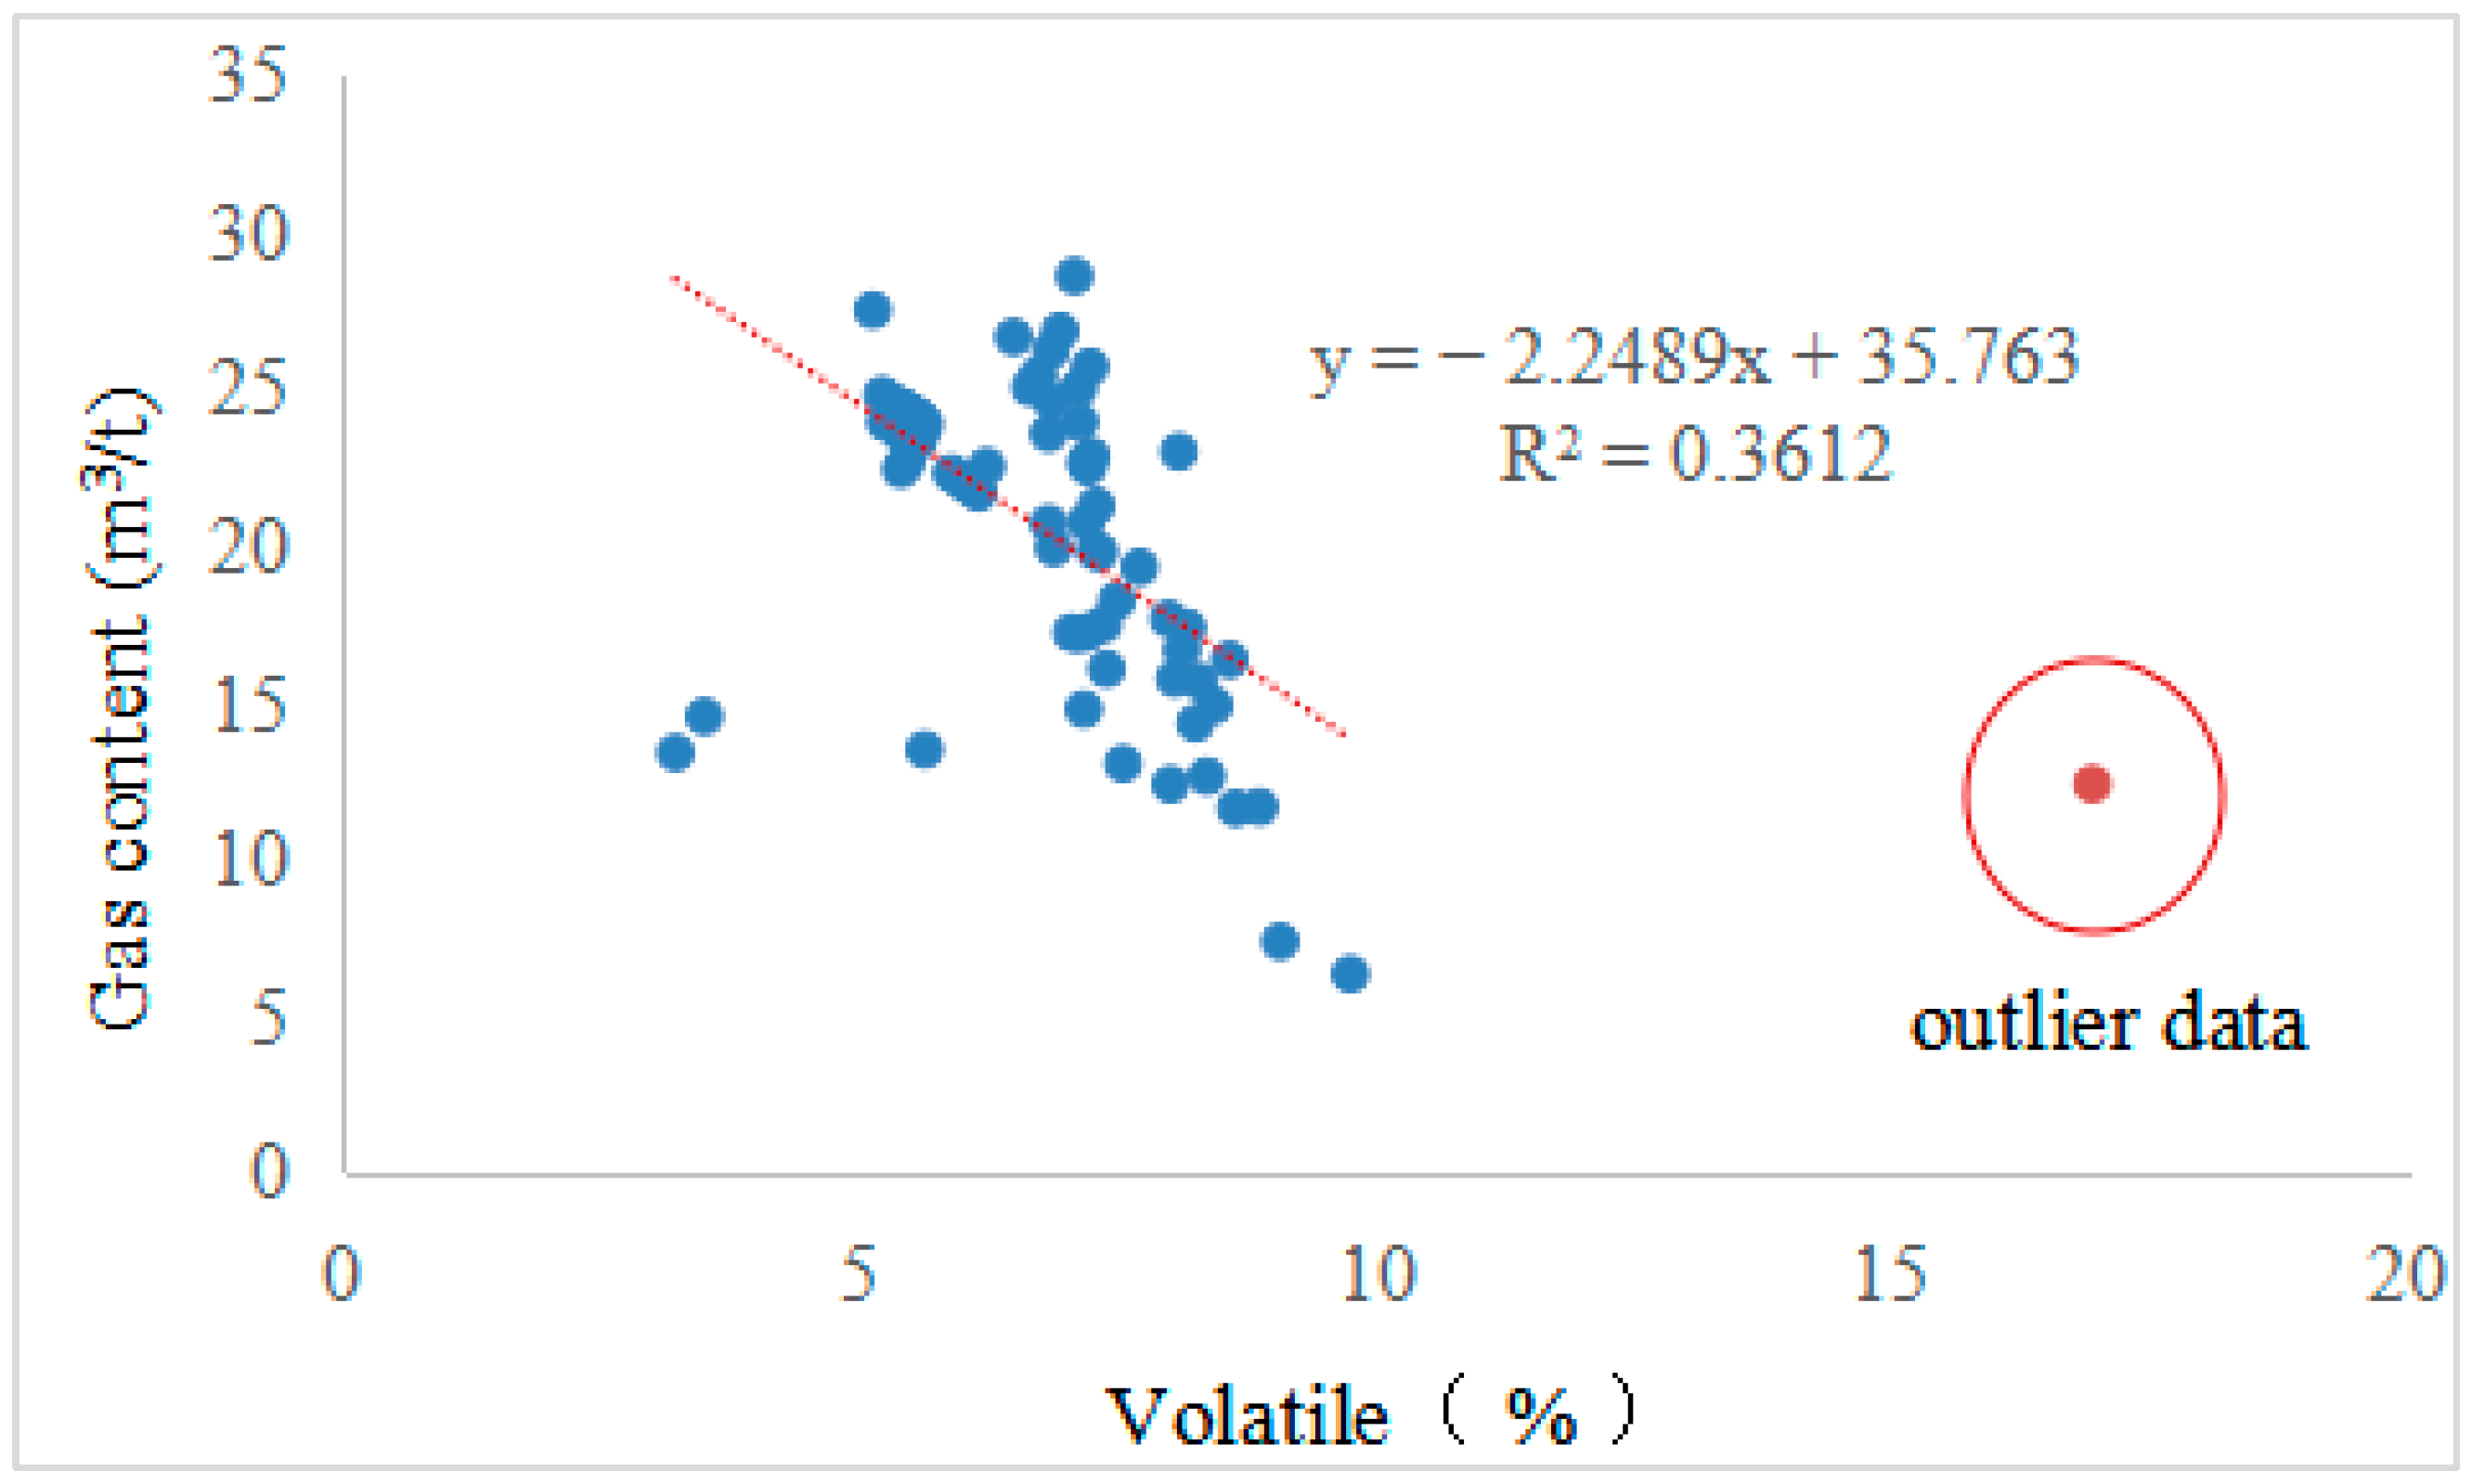
4.3.2. The Impact of Gas-Bearing Characteristics of Reservoirs on Productivity

The methane concentration in 3# coal of the research area ranges from 93.5% to 99.05%, with an average concentration of 97.54%. The gas saturation of coal seams ranges from 54.46% to 95.39%, with an average of 80.65%.
Gas content is an important parameter that reflects the gas-bearing characteristics of a reservoir. There is a certain correlation between the gas content of coalbed methane and the production capacity of coalbed methane wells in the research area (the classification parameters of coalbed methane well production capacity are shown in Table 4). The higher the gas content of coalbed methane wells, the greater the production capacity of coalbed methane wells (Figure 13 and Figure 14). The average gas content of coalbed methane in high-yield wells and medium-yield wells is significantly higher than that in low-yield wells and water-production wells.
Coal characteristics are important factors determining the physical properties of coal reservoirs and some of the important parameters determining the gas content of coalbed methane. The volatile matter and fixed carbon values of coal seams in the research area reflect the characteristics of high-order coal, and there is a weak negative correlation between volatile matter and gas content (Figure 15). Due to the fact that the coal in the research area belongs to high-rank coal, the overall volatile fraction is low, and it is influenced by the composition of coal rock components, with a high proportion of vitrinite and very little exinite (the exinite has the highest volatile matter, while the vitrinite component has less volatile matter) [50]. The distribution of volatile matter values is relatively concentrated, making the linear relationship between volatile matter and gas content unclear.
There is a positive correlation between fixed carbon and gas content (Figure 16); although the fixed carbon content is not the true carbon content, there is a certain correlation between them [51], which can also reflect the strong hydrocarbon generation potential of coal reservoirs and provide a certain gas source foundation for the enrichment of coalbed methane. Due to the significant coalbed methane adsorption characteristics of high-rank coal reservoirs, coalbed methane can easily accumulate, resulting in a higher gas content.

4.3.3. The Impact of Permeability Characteristics on Production Capacity

According to the physical properties of coal reservoirs in the research area (Table 5), based on the production data of well HG 17-2, COMET 3 was used to simulate the changes in permeability during the production process and analyzed the impact of permeability on productivity.
It can be seen that, with the progression of extraction (Figure 17), the fluid pressure of the coal reservoir decreases and the effective stress increases, resulting in a decrease in gas permeability first, reaching a low point. After 250 days of extraction, due to the main effect of coal matrix shrinkage, the gas permeability rapidly increases.
The total permeability of coal reservoirs generally decreases and then increases over time. In the initial stage of drainage, the reservoir permeability is relatively low and decreases. As the drainage progresses, the positive effect of coal matrix shrinkage increases, and the reservoir permeability increases (Figure 18).
The relationship between liquid permeability and gas production, seen in Figure 19, shows that the liquid level of HG 17-2 reached stability after 36 days of drainage, and thereafter the permeability of the reservoir fluid rapidly decreased, reaching a low point. This is due to the rapid decrease in fluid pressure in the coal seam. As further extraction progresses, the reservoir fluid pressure drops rapidly, there is a lag in the horizontal force acting on the coal seam, and the width of coal seam fractures begins to decrease and then increases, resulting in an increase in permeability. When the reservoir begins to produce gas, the liquid permeability begins to decrease.
Due to the positive effect of coal matrix shrinkage, the reservoir permeability increases, and the corresponding coalbed methane well production also increases. With the increase in permeability, the total permeability of coal reservoirs shows a good correlation with gas production (Figure 20), and as the total permeability increases, the gas production also increases.
Depth is a reflection of reservoir pressure, as pressure changes the physical properties of the reservoir, leading to changes in permeability and affecting coalbed methane production capacity.
The research area mainly focuses on the development of transitional coal structures. This type of structure has a large number of coal fractures, which can improve the permeability of coal reservoirs to some extent. The 3# coal in the research area is in a stress-sensitive permeability zone. As the burial depth increases, the fractures tend to close and the permeability decreases significantly. Therefore, as the burial depth increases, the production of coalbed methane shows a significant downward trend (Figure 21). The average gas production of coalbed methane wells within a depth range of 300~500 m is higher than 2000 m3/d. When the depth reaches 700 m or more, the average gas production of coalbed methane is less than 500 m3/d (Figure 22).

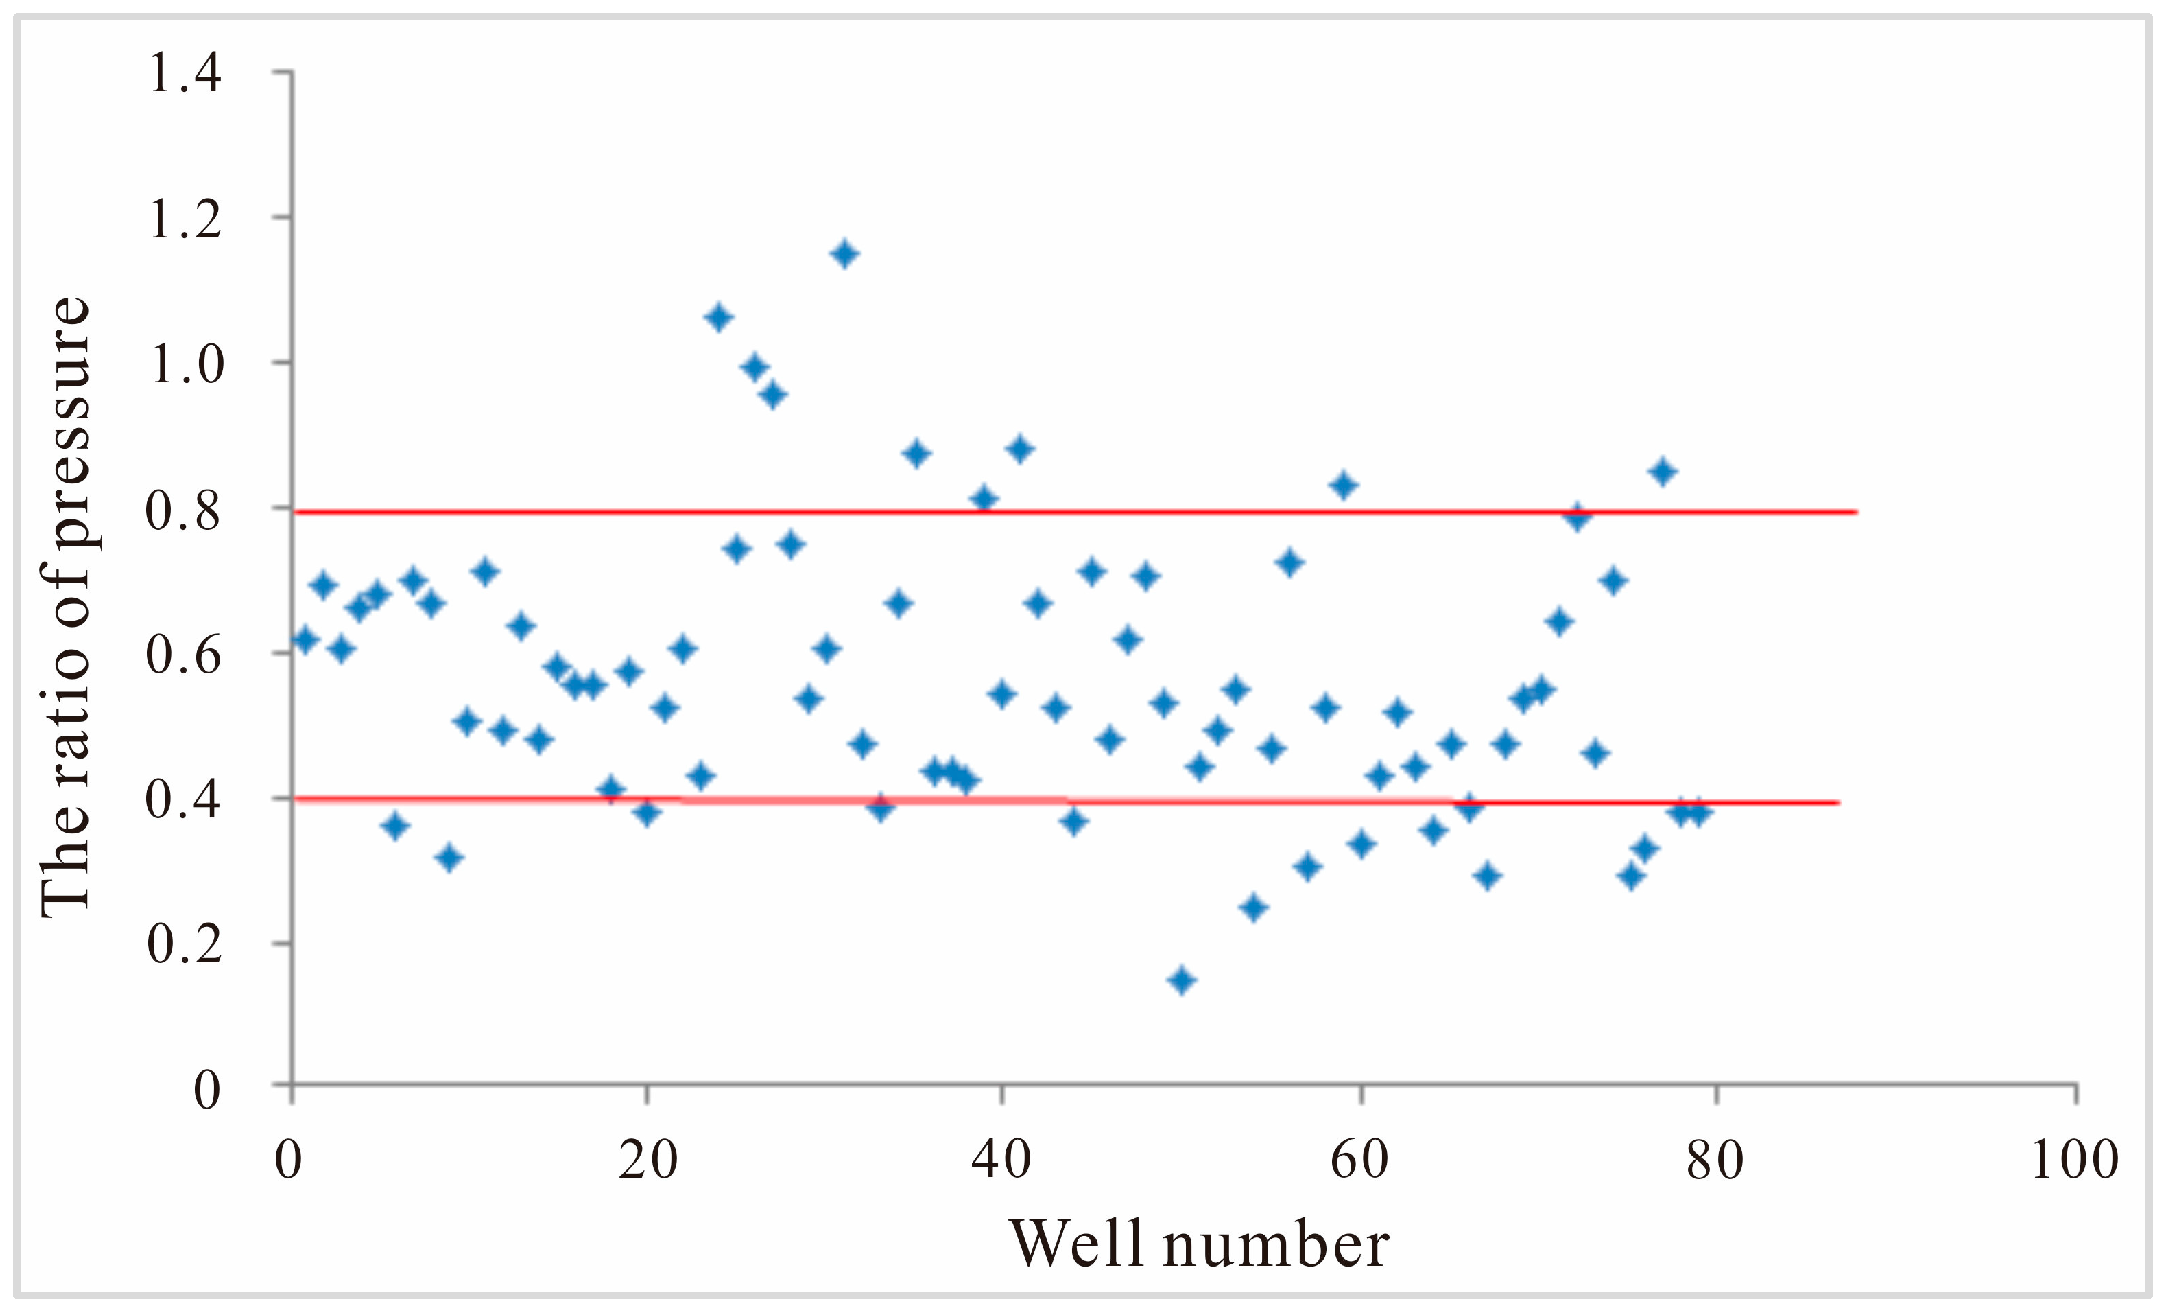
4.3.4. The Ratio of Critical Desorption Pressure to Reservoir Pressure

The ratio of critical desorption pressure to reservoir pressure in the research area mainly ranges from 0.40 to 0.80, with an average of about 0.57 (Figure 23). There is a certain positive correlation between the ratio and the average daily gas production (Figure 24), and as the ratio increases, the average daily gas production tends to increase accordingly. The ratio is negatively correlated with drainage time (Figure 25). Due to the relatively concentrated distribution of the ratio in the study area and the small differences between different coalbed methane wells, the correlation between the ratio and the average daily gas production and drainage time in the study area is not very obvious.
In order to study the impact of the ratio of coalbed methane wells on coalbed methane production capacity, the average ratio of different production wells was calculated. The ratio of high-yield gas wells was 0.59, the ratio of middle-production gas wells was 0.56, the ratio of low-production gas wells was 0.54, and the ratio of water-production wells was 0.44.
There is a certain correlation between the ratio and the productivity of coalbed methane wells (Figure 26); the larger the ratio, the higher the production capacity of coalbed methane wells. A larger ratio indicates that the critical desorption pressure is close to the original reservoir pressure, and coal reservoir pressure only requires a small amount of release to desorb coalbed methane. A smaller ratio indicates that the critical desorption pressure is much lower than the original reservoir pressure, and the coal reservoir pressure needs to be significantly reduced for coalbed methane desorption to occur.
Therefore, the higher the ratio, the smaller the pressure drop amplitude required for coalbed methane desorption in the production process of coalbed methane wells, and the shorter the drainage time of coalbed methane wells. Under the same pressure drop amplitude, the greater the desorption coalbed methane volume, the higher the gas production of coalbed methane wells.

4.4. Other Factors Affecting Production Capacity

4.4.1. Construction Conditions

The thickness of 3# coal mainly ranges from 4.5 to 8.0 m, and with an average thickness of 6.03 m, the distribution of coal seam thickness is stable. The research area is influenced by multiple tectonic movements, resulting in certain differences in the development characteristics of structures in different regions. Overall, the fault structures in the study area are not well-developed, while the fold structures have a certain degree of development, and the phenomenon of joint structures is particularly abundant.
In order to study the influence of structural conditions on coalbed methane production capacity, the structural curvature values of the contour lines of the 3# coal seam floor were calculated by Equation (2).
The relationship between coalbed methane production capacity and structural curvature values in different regions can be observed in Figure 27. As the curvature value increases, the production capacity tends to increase first and then decrease. The curvature values corresponding to high-yield wells are between 5 × 10⁻⁵ and 20 × 10−5, indicating that a curvature value that is too large or too small is not conducive to improving coalbed methane production capacity. If the curvature value is too small, the degree of coal reservoir transformation is weak, the fracture system is not developed, and the permeability of the coal reservoir is low. If the curvature value is too large, the structure of the coal reservoir may be damaged, affecting its permeability. The coal reservoir with a medium curvature value is moderately reformed, and the CBM productivity is relatively high.

4.4.2. Production Strategy

Reasonable control of production parameters is the key to the stable and high production of coalbed methane wells. Bottom hole flow pressure, casing pressure, and other parameters are important indicators reflecting the pressure difference between the bottom hole and the reservoir, which affect the productivity characteristics of coalbed methane wells. Statistics have found that there is a certain positive correlation between the average gas production of coalbed methane wells and casing pressure (Figure 28) within the range of 0–0.5 MPa. When the casing pressure is greater than 0.5 MPa, the trend of gas production with the increase in casing pressure value is not significant, and the casing pressure of high-yield wells is mainly between 0.05 and 0.5 MPa.
The bottomhole flow pressure parameters were obtained based on the downhole flow pressure detection device (pressure gauge) and helped to generate the variation curve of bottomhole flowing pressure. The variation in bottomhole flow pressure is an important parameter that determines the analysis and seepage of coalbed methane. Analyzing the changes in bottomhole flow pressure curves of wells with different production capacities in the research area, it was found that, as production deepens, the overall bottomhole flow pressure shows a downward trend which is negatively correlated with coalbed methane production (Figure 29). The bottomhole flow pressure of high-yield wells remains stable with no significant sudden pressure changes. In the early stage of mining, the pressure drop rate is relatively fast within 500–800 days, mainly ranging from 0.03 to 0.001 MPa/d, with an average of 0.007 MPa/d. Afterwards, the pressure drop changes tend to be gradual. The bottomhole flow pressure of low-yield wells fluctuates greatly, with obvious sudden changes. The rapid increase or decrease in pressure can cause serious stress sensitivity in coal reservoirs, resulting in coal powder gushing out, reducing the permeability of the reservoir and affecting gas production efficiency.
In the process of coalbed methane production, bottomhole flowing pressure is an independent parameter that affects gas production. Due to the different development conditions of coalbed methane wells, in the process of coalbed methane extraction, while effectively controlling the coal powder production rate, it is important to ensure a reasonable reservoir pressure differential; by controlling the height of the liquid level and the gas pressure (casing pressure) in the oil casing annulus, the control of bottomhole flow pressure can be achieved. Therefore, in terms of controlling bottomhole flow pressure, it is necessary to establish a reasonable and efficient dynamic control technology for coalbed methane development. For different extraction stages of coalbed methane wells, by controlling the water production rate and nozzle status for different extraction stages of coalbed methane wells, efficient development of coalbed methane can be achieved.
In addition to the parameters of casing pressure and bottomhole flow pressure, statistics show that the initial drainage should be controlled in the range of 1.0~5.0 m3/d, and the best drainage effect is achieved at a speed of about 3.0 m3/d. The cumulative drainage time for gas production should be controlled in the range of 50–150 days, with an average of 101 days. The cumulative water production should be controlled in the range of 200–800 m3, with an average of 500 m3 for the best drainage effect.

4.5. Gray Correlation Analysis

Based on actual production data and reservoir parameter data in the research area, taking into account geological factors such as gas content, burial depth, and structural complexity, as well as engineering factors such as bottomhole flow pressure and casing pressure, the gray correlation analysis method was used to explore the impact of these factors on production capacity.
Determine the daily gas production of coalbed methane as a reference sequence, and select eight factors that affect production capacity, including burial depth, coal thickness, porosity, gas content, structural curvature, total liquid volume, casing pressure, and bottomhole flow pressure as comparative sequences. Equation (3) is used to represent the analysis sequence.
Reference sequence:
Daily gas production, W0(k) = (624.21, 2119.35, 2076.31, ……, 219.16, 664.39).
Comparative sequences:
Burial depth, W1(k) = (704.7, 679.5, 704, ……, 483.5, 482.05);
Coal thickness, W2(k) = (5.4, 5.8, 5.7, ……, 6.1, 5.8);
Porosity, W3(k) = (4.1, 4.2, 4.2, ……, 4.1, 4.2);
Gas content, W4(k) = (20.5, 29.8, 24.1, ……, 16.46, 17.7);
Structural curvature, W5(k) = (8.96,15.23,9.65, ……, 5.63, 5.63);
Total liquid volume, W6(k) = (335.0, 297.9, 439.2, ……, 624.28, 572.99);
Casing pressure, W7(k) = (0.165, 0.142, 40.127, ……, 0.286, 0.394);
Bottom hole flow pressure, W8(k) = (1.627, 4.245, 2.51, ……, 1.223, 0.896).
Equation (4) is used for the dataization of variables. The dimensionless data results of the reference sequence and comparison sequence are as follows:
Reference sequence:
x0(k) = (0.5579, 1.8940, 1.8556, ……, 0.1958, 0.5938).
Comparative sequences:
x1(k) = (1.0549, 1.0173, 1.0540, ……, 0.9545, 0.9719);
x2(k) = (0.9296,1.0078,0.9904, ……, 1.0599, 1.0078);
x3(k) = (1.1648, 1.1932, 1.1932, ……, 1.1648, 1.1932);
x4(k) = (0.9548, 1.3891, 1.1243, ……, 0.7664, 0.8242);
x5(k) = (0.7942, 1.3501, 0.8553, ……, 0.4986, 0.4986);
x6(k) = (0.6470, 0.5753, 0.8482, ……, 1.2057, 1.1066);
x7(k) = (0.7942, 1.3501, 0.8553, ……, 0.4986, 0.4986);
x8(k) = (0.5895, 1.3558, 1.2968, ……, 1.0610, 1.0610).
Using Equations (5)–(8), the maximum and minimum differences can be calculated, as follows:
Δ 0 i ( max ) = max i   max k   Δ 0 i ( k ) = 5.2687
Δ 0 i ( min ) = min i   min k   Δ 0 i ( k ) = 0.00585
Then, the correlation coefficient and correlation degree were calculated by using Equations (9) and (10), and the calculation results of the gray correlation degree are as follows:
γ ( x 0 , x 1 ) = 0.7842
γ ( x 0 , x 2 ) = 0.7832
γ ( x 0 , x 3 ) = 0.7839
γ ( x 0 , x 4 ) = 0.7989
γ ( x 0 , x 5 ) = 0.7980
γ ( x 0 , x 6 ) = 0.7816
γ ( x 0 , x 7 ) = 0.7425
γ ( x 0 , x 8 ) = 0.7563
Based on the above, the gray correlation number between the comparison sequence and the reference sequence can be calculated. According to the order of association numbers, it is known that the main controlling factors affecting the production capacity of coalbed methane wells in the research area are in descending order: gas content, structural curvature, burial depth, porosity, coal thickness, total liquid content, bottomhole flow pressure, casing pressure.

4.6. Comprehensive Evaluation of CBM Development Effect

The production capacity of coalbed methane wells is the result of the combined effects of various geological and engineering factors. Through the above research, it has been found that there are numerous factors that affect coalbed methane production capacity and their relationships are complex. In addition, the degree of impact of different factors on production capacity varies. Therefore, the evaluation of coalbed methane production capacity cannot be simply based on the impact of a single factor. It is necessary to comprehensively consider the impact of various geological factors, determine their influence weights, and then achieve the evaluation of coalbed methane production capacity.
In view of this, the comprehensive evaluation of coalbed methane production capacity in the research area mainly considers the impact of eight factors on production capacity: gas content, structural curvature, burial depth, porosity, coal seams, total liquid cone, bottomhole flow pressure, and cashing pressure. Using the gray correlation method to determine the correlation degree of various influencing factors, it is possible to comprehensively calculate the weighted value of coalbed methane single well productivity, and determine the comprehensive weight of different coalbed methane wells. Based on the comprehensive weight values of each well, a comprehensive index distribution map of coalbed methane wells in the study area was drawn (Figure 30), thus achieving the evaluation of the development effect of coalbed methane in the study area. It can be seen that there are significant differences in the development effects of coalbed methane in different regions, presenting an overall pattern of west superior and east inferior, south superior and north inferior. The area with the best development effect in the research zone is located in the southern part of the block, where high-yield wells are mainly distributed, with a small number of low-yield wells and water-production wells. The average daily gas production is mainly in the range of 1000~6000 m3/d, with an average of 2300 m3/d. There are many types of coalbed methane production capacities in the northern part of the research area, and the development effect is average. Statistics show that the production capacity of coalbed methane wells in this area mainly ranges from 300 to 1000 m3/d, with an average production capacity of 700 m3/d. The development effect of coalbed methane in the central part of the research area is relatively poor, mainly distributed in low-yield wells and water-production wells, with only a few high-yield wells and medium-yield wells. The average daily gas production of coalbed methane wells is mainly less than 500 m3/d.

5. Conclusions

Based on the actual production data of coalbed methane wells, experimental testing methods were used to grasp the physical properties of the 3# coal reservoirs in the study area. By using simulation analysis, the impact of the physical parameters of the relevant coal reservoirs on production capacity was explored.
(1)
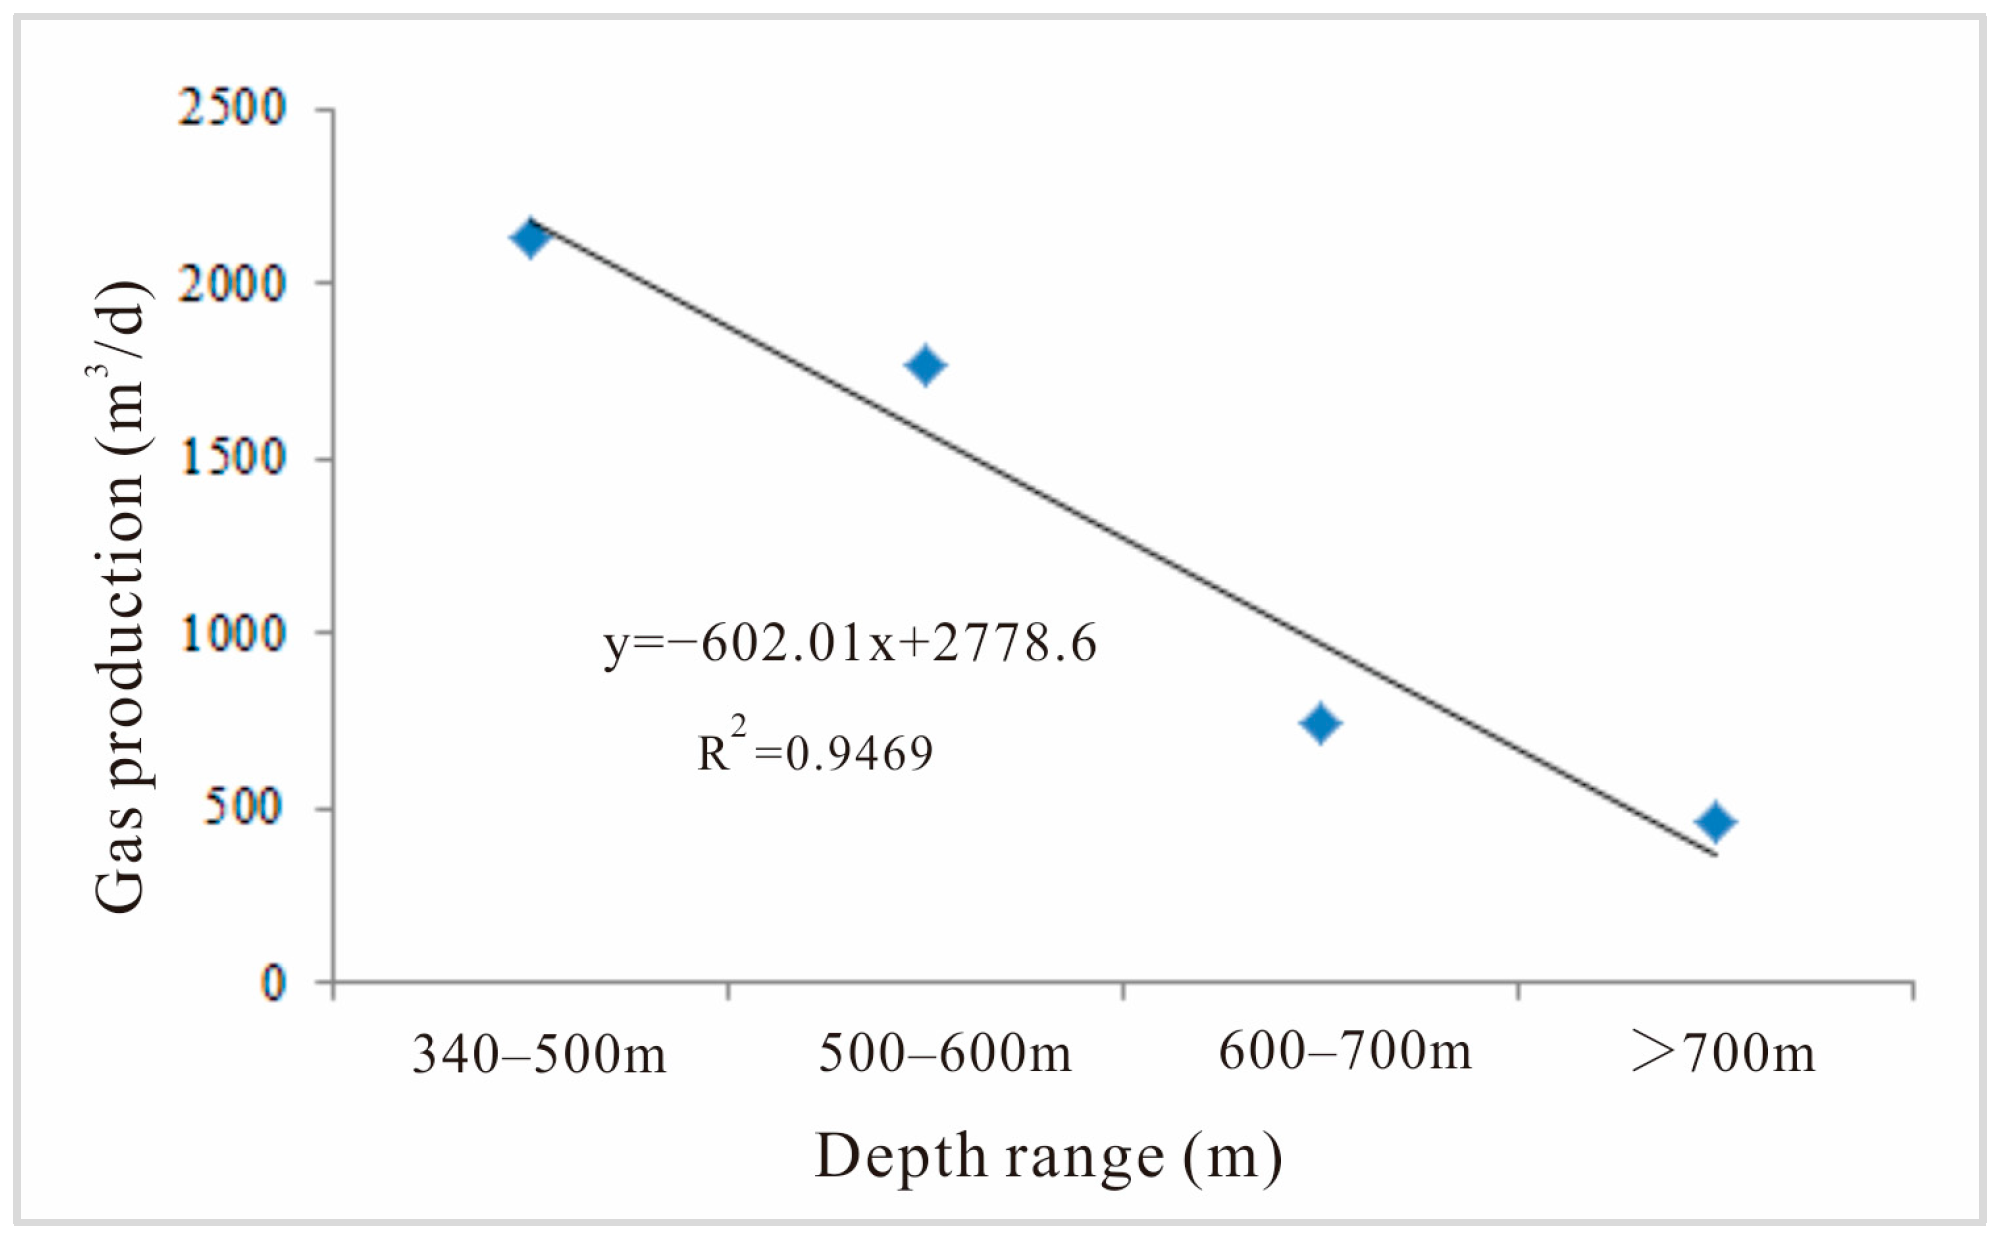
The micropores in high-rank coal seams are well-developed, while the macropores and mesopores (exogenous fractures) are underdeveloped. The coal seam has obvious reservoir characteristics of high gas adsorption and low permeability. The 3# coal seam is mostly located in the stress-sensitive permeability zone, and its permeability is significantly affected by the burial depth of the coal seam.
(2)
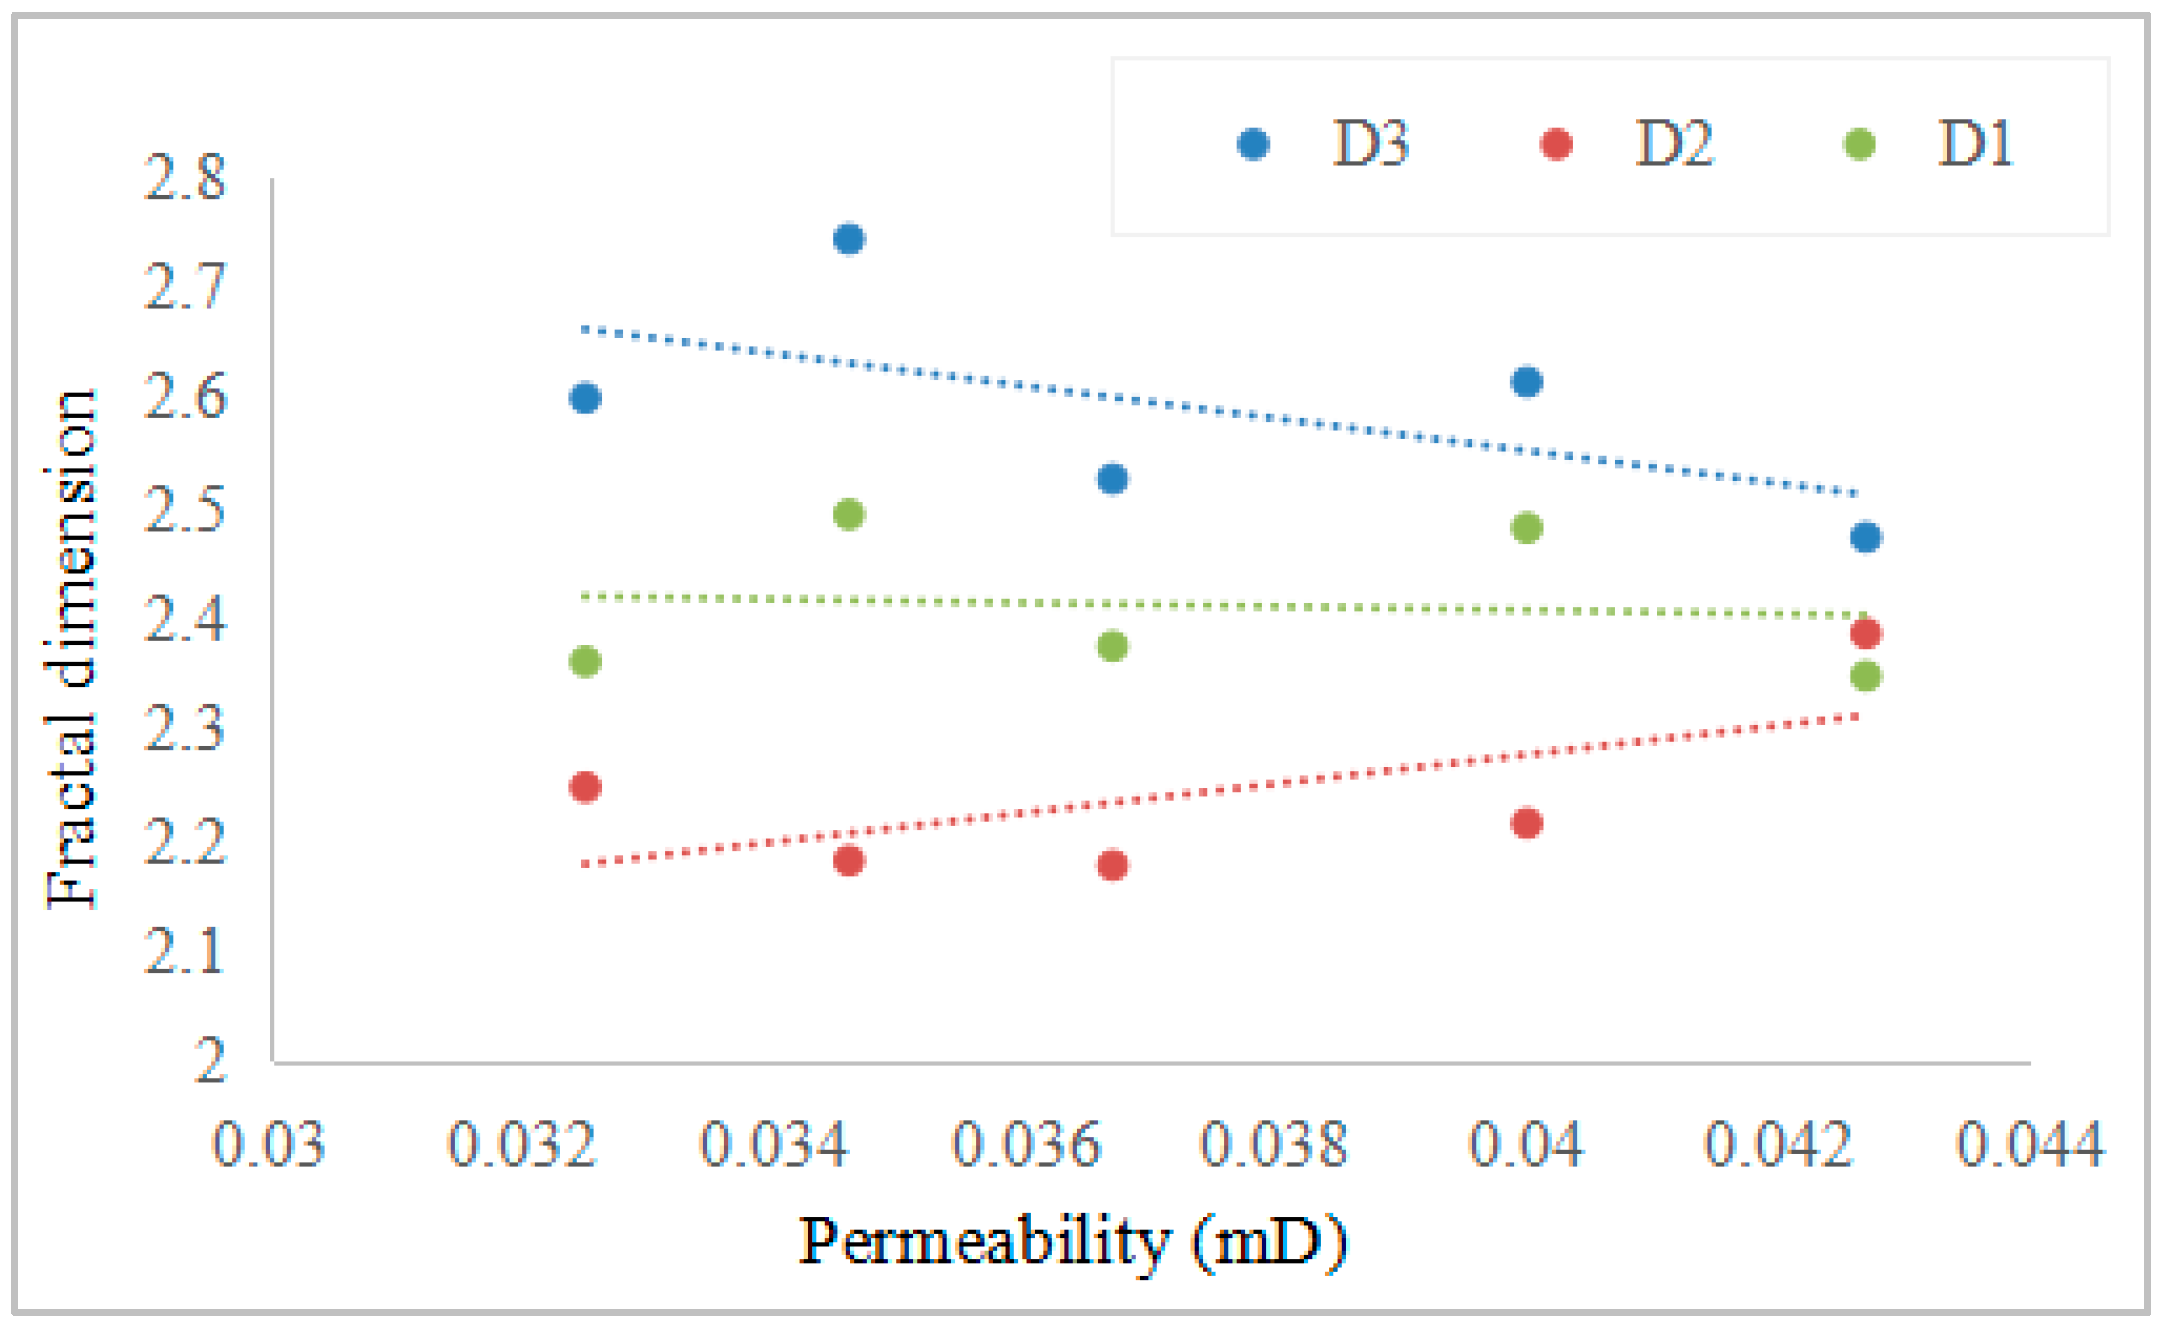
The fractal characteristics of coal seam pores and fractures can reflect the permeability characteristics of the reservoir. The fractal dimension of the micropores is relatively high, while the fractal dimension of the macropores and mesopores (exogenous fractures) is relatively small. The permeability is positively correlated with macropores (exogenous fractures) and mesopores, and negatively correlated with micropores.
(3)
Gas content, burial depth, and porosity are the main factors affecting productivity under the physical properties of high-rank coal reservoirs. Based on gray relational analysis, the coalbed methane production capacity in the study area was evaluated, dividing the research area mainly into a high-yield area, a medium-yield area, and a low-yield area.

Author Contributions

G.L.: Conceptualization, Formal analysis, Writing—review and editing. R.T.: Supervision, Methodology. C.M.: Validation, Formal analysis. X.L.: Resources, Project administration. J.Z.: Supervision. All authors have read and agreed to the published version of the manuscript.

Funding

This research was funded by the Shaanxi Provincial Department of Education Science and Technology Special Project (2023JK18); Key R&D Project in Xianyang City (L2023-CXNL-CXRC-20); Shaanxi Energy Vocational and Technical College Research Project (2022KY12KJP).

Data Availability Statement

Data are contained within the article.

Conflicts of Interest

The authors declare no conflicts of interest.

References

  1. Zhang, B.; Li, W.; Wang, G. Analysis of Coalbed Methane Production Characteristics and Influencing Factors of No. 15 Coal Seam in the Shouyang Block. Processes 2023, 11, 3269. [Google Scholar] [CrossRef]
  2. Wang, G.; Xie, Y.; Chang, H. Characteristics and Geological Impact Factors of Coalbed Methane Production in the Taiyuan Formation of the Gujiao Block. Processes 2023, 11, 2000. [Google Scholar] [CrossRef]
  3. Liu, L.; Jin, C.; Li, L. Coalbed methane adsorption capacity related to maceral compositions. Energy Explor. Exploit. 2020, 38, 79–91. [Google Scholar] [CrossRef]
  4. Sun, B.; Zeng, F.; Moore, T.A. Geochemistry of two high-lithium content coal seams, Shanxi Province, China. Int. J. Coal Geol. 2022, 260, 104059. [Google Scholar] [CrossRef]
  5. Zhang, X.D.; Du, Z.G.; Li, P.P. Physical characteristics of high-rank coal reservoirs in different coal-body structures and the mechanism of coalbed methane production. Sci. China Earth Sci. 2017, 60, 246–255. [Google Scholar] [CrossRef]
  6. Yao, Y.B.; Liu, D.M. Comparison of low-field NMR and mercury intrusion porosimetry in characterizing pore size distributions of coals. Fuel 2012, 95, 152–158. [Google Scholar] [CrossRef]
  7. Song, Y.; Jiang, B.; Qu, M. Macromolecular evolution and structural defects in tectonically deformed coals. Fuel 2019, 236, 1432–1445. [Google Scholar] [CrossRef]
  8. Li, L.; Liu, D.; Cai, Y. Coal structure and its implications for coalbed methane exploitation: A review. Energy Fuels 2020, 35, 86–110. [Google Scholar] [CrossRef]
  9. Yao, Y.B.; Liu, D.M.; Che, Y.; Tang, D.Z.; Tang, S.H.; Huang, W.H. Petrophysical characterization of coals by low-field nuclear magnetic resonance (NMR). Fuel 2010, 89, 1371–1380. [Google Scholar] [CrossRef]
  10. Li, Y.; Wang, Z.; Tang, S. Re-evaluating adsorbed and free methane content in coal and its ad-and desorption processes analysis. Chem. Eng. J. 2022, 428, 131946. [Google Scholar] [CrossRef]
  11. Duan, H.; Ma, Y.; Wang, J. Coal Structure Characteristics of the 2# Coal Seam in the Jiaozuo Mining Area and Its Geological Dependence. ACS Omega 2023, 8, 39242–39249. [Google Scholar] [PubMed]
  12. Tao, S.; Chen, S.D.; Tang, D.Z.; Zhao, X.; Xu, H.; Li, S. Material composition, pore structure and adsorption capacity of low-rank coals around the first coalification jump: A case of eastern Junggar Basin, China. Fuel 2018, 211, 804–815. [Google Scholar] [CrossRef]
  13. Wang, T.; Deng, Z.; Hu, H. Pore structure of deep coal of different ranks and its effect on coalbed methane adsorption. Int. J. Hydrogen Energy 2024, 59, 144–158. [Google Scholar] [CrossRef]
  14. Yan, J.; Meng, Z.; Zhang, K. Pore distribution characteristics of various rank coals matrix and their influences on gas adsorption. J. Pet. Sci. Eng. 2020, 189, 107041. [Google Scholar] [CrossRef]
  15. Sun, B.; Shao, Y.; Gao, Z. Coalbed methane enrichment characteristics and exploration target selection in the zhuozishan coalfield of the western Ordos Basin, China. ACS Omega 2022, 7, 43531–43547. [Google Scholar] [CrossRef] [PubMed]
  16. Shen, J.; Li, K.; Zhang, H. The geochemical characteristics, origin, migration and accumulation modes of deep coal-measure gas in the west of Linxing block at the eastern margin of Ordos Basin. J. Nat. Gas Sci. Eng. 2021, 91, 103965. [Google Scholar] [CrossRef]
  17. Guo, Z.; Cao, Y.; Zhang, Z. Geological controls on the gas content and permeability of coal reservoirs in the Daning Block, Southern Qinshui Basin. ACS Omega 2022, 7, 17063–17074. [Google Scholar] [CrossRef] [PubMed]
  18. Wang, Z.; Wang, G.; Hao, C. Chemical structure and hydrocarbon generation characteristics of tectonic coal with different metamorphic degrees: Implications for gas adsorption capacity. Gas Sci. Eng. 2023, 112, 204949. [Google Scholar] [CrossRef]
  19. Wei, Q.; Li, X.; Zhang, J. Full-size pore structure characterization of deep-buried coals and its impact on methane adsorption capacity: A case study of the Shihezi Formation coals from the Panji Deep Area in Huainan Coalfield, Southern North China. J. Pet. Sci. Eng. 2019, 173, 975–989. [Google Scholar] [CrossRef]
  20. Wang, Y.; Xie, H.; Chen, S. Petrophysical and Mechanical Properties of Complex Structure Coalbed Methane Reservoir: A Laboratory Investigation. Rock Mech. Rock Eng. 2023, 56, 69–87. [Google Scholar] [CrossRef]
  21. Cai, Y.; Li, Q.; Liu, D. Insights into matrix compressibility of coals by mercury intrusion porosimetry and N2 adsorption. Int. J. Coal Geol. 2018, 200, 199–212. [Google Scholar] [CrossRef]
  22. Lu, G.; Wei, C.; Wang, J. Influence of pore structure and surface free energy on the contents of adsorbed and free methane in tectonically deformed coal. Fuel 2021, 285, 119087. [Google Scholar] [CrossRef]
  23. Zhao, J.L.; Xu, H.; Tang, D.Z.; Mathews, J.P.; Li, S.; Tao, S. A comparative evaluation of coal specific surface area by CO2 and N2 adsorption and its influence on CH4 adsorption capacity at different pore sizes. Fuel 2016, 183, 420–431. [Google Scholar] [CrossRef]
  24. Tao, S.; Zhao, X.; Tang, D.Z.; Deng, C.M.; Meng, Q.; Cui, Y. A model for characterizing the continuous distribution of gas storing space in low-rank coals. Fuel 2018, 233, 552–557. [Google Scholar] [CrossRef]
  25. Hou, X.; Zhu, Y.; Wang, Y. Experimental study of the interplay between pore system and permeability using pore compressibility for high rank coal reservoirs. Fuel 2019, 254, 115712. [Google Scholar] [CrossRef]
  26. Lan, Y.; Davudov, D.; Moghanloo, R.G. Interplay between permeability and compressibility in shale samples. J. Pet. Sci. Eng. 2017, 159, 644–653. [Google Scholar] [CrossRef]
  27. Zhang, J.; Chu, X.; Wei, C. Review on the application of low-field nuclear magnetic resonance technology in coalbed methane production simulation. ACS Omega 2022, 7, 26298–26307. [Google Scholar] [CrossRef] [PubMed]
  28. Zhang, J.; Wei, C.; Ju, W. Stress sensitivity characterization and heterogeneous variation of the pore-fracture system in middle-high rank coals reservoir based on NMR experiments. Fuel 2019, 238, 331–344. [Google Scholar] [CrossRef]
  29. Guo, Z.; Zhao, J.; You, Z. Prediction of coalbed methane production based on deep learning. Energy 2021, 230, 120847. [Google Scholar] [CrossRef]
  30. Wang, Z.; Liu, S.; Qin, Y. Coal wettability in coalbed methane production: A critical review. Fuel 2021, 303, 121277. [Google Scholar] [CrossRef]
  31. Ouyang, Z.; Wang, H.; Sun, B. Quantitative prediction of deep coalbed methane content in Daning-Jixian Block, Ordos Basin, China. Processes 2023, 11, 3093. [Google Scholar] [CrossRef]
  32. Jia, Q.; Liu, D.; Cai, Y. Petrophysics characteristics of coalbed methane reservoir: A comprehensive review. Front. Earth Sci. 2021, 15, 202. [Google Scholar] [CrossRef]
  33. Zhou, F.; Yao, G.; Tyson, S. Impact of geological modeling processes on spatial coalbed methane resource estimation. Int. J. Coal Geol. 2015, 146, 14–27. [Google Scholar] [CrossRef]
  34. Laib, O.; Khadir, M.T.; Mihaylova, L. Toward efficient energy systems based on natural gas consumption prediction with LSTM Recurrent Neural Networks. Energy 2019, 177, 530–542. [Google Scholar] [CrossRef]
  35. Du, S.; Wang, M.; Yang, J. An enhanced prediction framework for coalbed methane production incorporating deep learning and transfer learning. Energy 2023, 282, 128877. [Google Scholar] [CrossRef]
  36. Dai, W.; Li, Y.; Cang, D. BOF slag glass-ceramics prepared in different atmospheres from parents glasses with various reduction degree. ISIJ Int. 2014, 54, 2672. [Google Scholar] [CrossRef]
  37. Jiang, T.; Jin, Z.; Liu, G. Investigating the pore structure characteristics and reservoir capacities of lower Jurassic continental shale reservoirs in the northeastern Sichuan Basin, China. Front. Earth Sci. 2022, 10, 886907. [Google Scholar] [CrossRef]
  38. Wang, M.; Dai, X.; Li, X. Pore and Permeability Characteristics and Regulation Mechanisms of Source Rocks in Coal Measure. J. Nanosci. Nanotechnol. 2017, 17, 6445. [Google Scholar] [CrossRef]
  39. Yin, G.; Jiang, C.; Xu, J. An experimental study on the effects of water content on coalbed gas permeability in ground stress fields. Transp. Porous Media 2012, 94, 87. [Google Scholar] [CrossRef]
  40. Wang, Q.; Su, X.; Su, L. CBM geological characteristics and exploration potential in the Sunan Syncline block, southern north China basin. J. Pet. Sci. Eng. 2020, 186, 106713. [Google Scholar] [CrossRef]
  41. Liang, Z.; Feng, Z.; Guang, X. Comparison of fractal dimension calculation methods for channel bed profiles. Procedia Eng. 2012, 28, 252. [Google Scholar] [CrossRef]
  42. Dubuc, B.; Zucker, S.W.; Tricot, C.; Quiniou, J.F.; Wehbi, D. Evaluating the fractal dimension of surfaces. Proc. R. Soc. Lond. A Math. Phys. Sci. 1989, 425, 113. [Google Scholar]
  43. Jiang, C.; Lu, Z.; Zhou, J. Evaluation of fractal dimension of soft terrain surface. J. Terramech. 2017, 70, 27. [Google Scholar] [CrossRef]
  44. Xue, K.; Sun, B.; Liu, C. Evaluation of Reconstruction Potential for Low-Production Vertical Wells of CBM in the Southern Qinshui Basin. Processes 2023, 11, 1741. [Google Scholar] [CrossRef]
  45. Aslan, N. Use of the grey analysis to determine optimal oil agglomeration with multiple performance characteristics. Fuel 2013, 109, 373. [Google Scholar] [CrossRef]
  46. Lin, S.; Lu, I.; Lewis, C. Grey relation performance correlations among economics, energy use and carbon dioxide emission in Taiwan. Energy Policy 2007, 35, 1948. [Google Scholar] [CrossRef]
  47. Kozlov, S.M. Averaging differential operators with almost periodic, rapidly oscillating coefficients. Math. USSR-Sb. 1979, 35, 481. [Google Scholar] [CrossRef]
  48. Foody, G.M. Thematic map comparison. Photogramm. Eng. Remote Sens. 2004, 70, 627. [Google Scholar] [CrossRef]
  49. Lei, B.; Fu, X.; Zhou, B. Estimation of correction coefficients for measured coal bed methane contents. Int. J. Min. Sci. Technol. 2012, 22, 493. [Google Scholar] [CrossRef]
  50. Ahamed, M.A.A.; Perera, M.S.A.; Matthai, S.K. Coal composition and structural variation with rank and its influence on the coal-moisture interactions under coal seam temperature conditions—A review article. J. Pet. Sci. Eng. 2019, 180, 917. [Google Scholar] [CrossRef]
  51. Solomon, P.R. Relation between coal aromatic carbon concentration and proximate analysis fixed carbon. Fuel 1981, 60, 3. [Google Scholar] [CrossRef]
Figure 1. Location and distribution of production wells in the research area.
Processes 12 01754 g001
Figure 2. Box plot of coal quality parameters.
Processes 12 01754 g002
Figure 3. Stage mercury intake varies with pore size.
Processes 12 01754 g003
Figure 4. Mercury migration curve with pore size variation.
Processes 12 01754 g004
Figure 5. Development characteristics of reservoir fractures ((A,B), external fractures; (C,D), endogenetic fractures; (E,F), micro fractures).
Processes 12 01754 g005
Figure 6. Sensitivity zoning of permeability under different effective stresses.
Processes 12 01754 g006
Figure 7. Pressure distribution of coal reservoir 3# in the research area.
Processes 12 01754 g007
Figure 8. Coal seam isothermal adsorption curve.
Processes 12 01754 g008
Figure 9. Propagation diagram of pressure drop funnel in coalbed methane reservoir.
Processes 12 01754 g009
Figure 10. Research area coalbed methane well discharge and production curve (①, first stage; ②, second stage; ③, third stage).
Processes 12 01754 g010
Figure 11. The relationship diagram between lgVm and lg(1/r).
Processes 12 01754 g011
Figure 12. The relationship between fractal dimension and permeability (D1, fractal dimension of macropores and fractures; D2, fractal dimension of mesopores; D3, fractal dimension of micropores).
Processes 12 01754 g012
Figure 13. Relationship between gas content and daily gas production.
Processes 12 01754 g013
Figure 14. Average gas content of different types of wells.
Processes 12 01754 g014
Figure 15. Relationship between volatile matter and gas content.
Processes 12 01754 g015
Figure 16. Relationship between fixed carbon and gas content.
Processes 12 01754 g016
Figure 17. Trends in liquid permeability and gas permeability changes.
Processes 12 01754 g017
Figure 18. Trend of total permeability change.
Processes 12 01754 g018
Figure 19. The relationship between liquid permeability and gas production.
Processes 12 01754 g019
Figure 20. The relationship between total permeability and gas production.
Processes 12 01754 g020
Figure 21. Buried depth of coal seam in different types of wells.
Processes 12 01754 g021
Figure 22. Average daily gas production of CBM wells with different buried depths.
Processes 12 01754 g022
Figure 23. Distribution of the ratio of critical desorption pressure and reservoir pressure.
Processes 12 01754 g023
Figure 24. The ratio of critical desorption pressure to reservoir pressure and its relationship with daily gas production.
Processes 12 01754 g024
Figure 25. The ratio of critical desorption pressure to reservoir pressure and its relationship with drainage time.
Processes 12 01754 g025
Figure 26. The ratio of critical desorption pressure to reservoir pressure of different types of wells.
Processes 12 01754 g026
Figure 27. Relationship between structural curvature and gas production.
Processes 12 01754 g027
Figure 28. Relationship between average gas production and average casing pressure.
Processes 12 01754 g028
Figure 29. Bottomhole flow pressure variation curves for wells with different production capacities.
Processes 12 01754 g029
Figure 30. Evaluation results of CBM development in the study area.
Processes 12 01754 g030
Table 1. Results of coal quality characteristics of 3# coal in study area.
Coal SeamAsh Content (%)Moisture Content (%)Fixed Carbon (%)Volatile (%)
MinMaxAveMinMaxAveMinMaxAveMinMaxAve
3#1.1248.5311.190.6313.781.3847.6190.3080.793.2316.946.58
Table 2. Coal reservoir porosity, pore volume, and specific surface area data.
Porosity (%)Minimum ValueMaximum ValueAverage Value
1.36.33.8
TypesExtra large holeMacroporeMesoporeTransition poresMicropore
Aperture (nm)>10,00010,000–10001000–100100–1010–3
Volume (ml/g)0.00410.00130.00150.01070.0244
Proportion (%)9.76193.09523.571425.476258.0952
Specific surface area (m2/g)0.00000.00200.02802.278018.8410
Proportion(%)0.00000.00950.132410.771289.0870
Table 3. The calculation parameters of coal reservoir pressure drop funnel.
ParameterNumerical ValueUnit
drainage speed8q/(m3/d)
coal seam thickness6h/m
initial permeability0.03k/mD
system compressibility0.0013C1/MPa−1
initial porosity0.04φ
fluid viscosity1.1μ/(mPa·s)
critical desorption pressure4Pc/MPa
Table 4. Classification of coalbed gas well productivity.
Capacity ClassificationAverage Daily Gas Production (m3/d)Average Daily Water Production (m3/d)d1000d1000/dt
High-yield well≥1000<1.5>100>0.5
Medium-yield well500~1000<5>50
Low-yield well100~500<50
Water-production well<100>100
d1000 represents the number of days when the daily gas production is above 1000 m3, d1000/dt represents the ratio of the number of days with a daily gas production of over 1000 m3 to the cumulative gas production time.
Table 5. 3# coal reservoir physical properties.
ParameterValue
Reservoir pressure/MPa3.36
Critical desorption pressure/MPa2.53
Langmuir pressure/MPa3.17
Langmuir volume/m3·t−144.27
Porosity/f0.02
Absolute penetration/×10−3 μm2kx3.4
ky1.7
kz0
Compression coefficient/MPa−10.062
Skin factor−3.2
Coal density/t·m−31.375
Disclaimer/Publisher’s Note: The statements, opinions and data contained in all publications are solely those of the individual author(s) and contributor(s) and not of MDPI and/or the editor(s). MDPI and/or the editor(s) disclaim responsibility for any injury to people or property resulting from any ideas, methods, instructions or products referred to in the content.

