
Regional Grid Power Supply Radius Planning—A Sensitivity Constraint-Based Approach
Abstract
:1. Introduction
2. Power System Line Protection and Sensitivity Factors
2.1. Primary and Backup Protection
2.2. Power System Line Protection Sensitivity
2.3. Parameters Affecting Sensitivity
3. Sensitivity-Based Power Supply Radius Planning Method for Regional Power Grids
3.1. Provisions Related to Power Supply Radius Planning
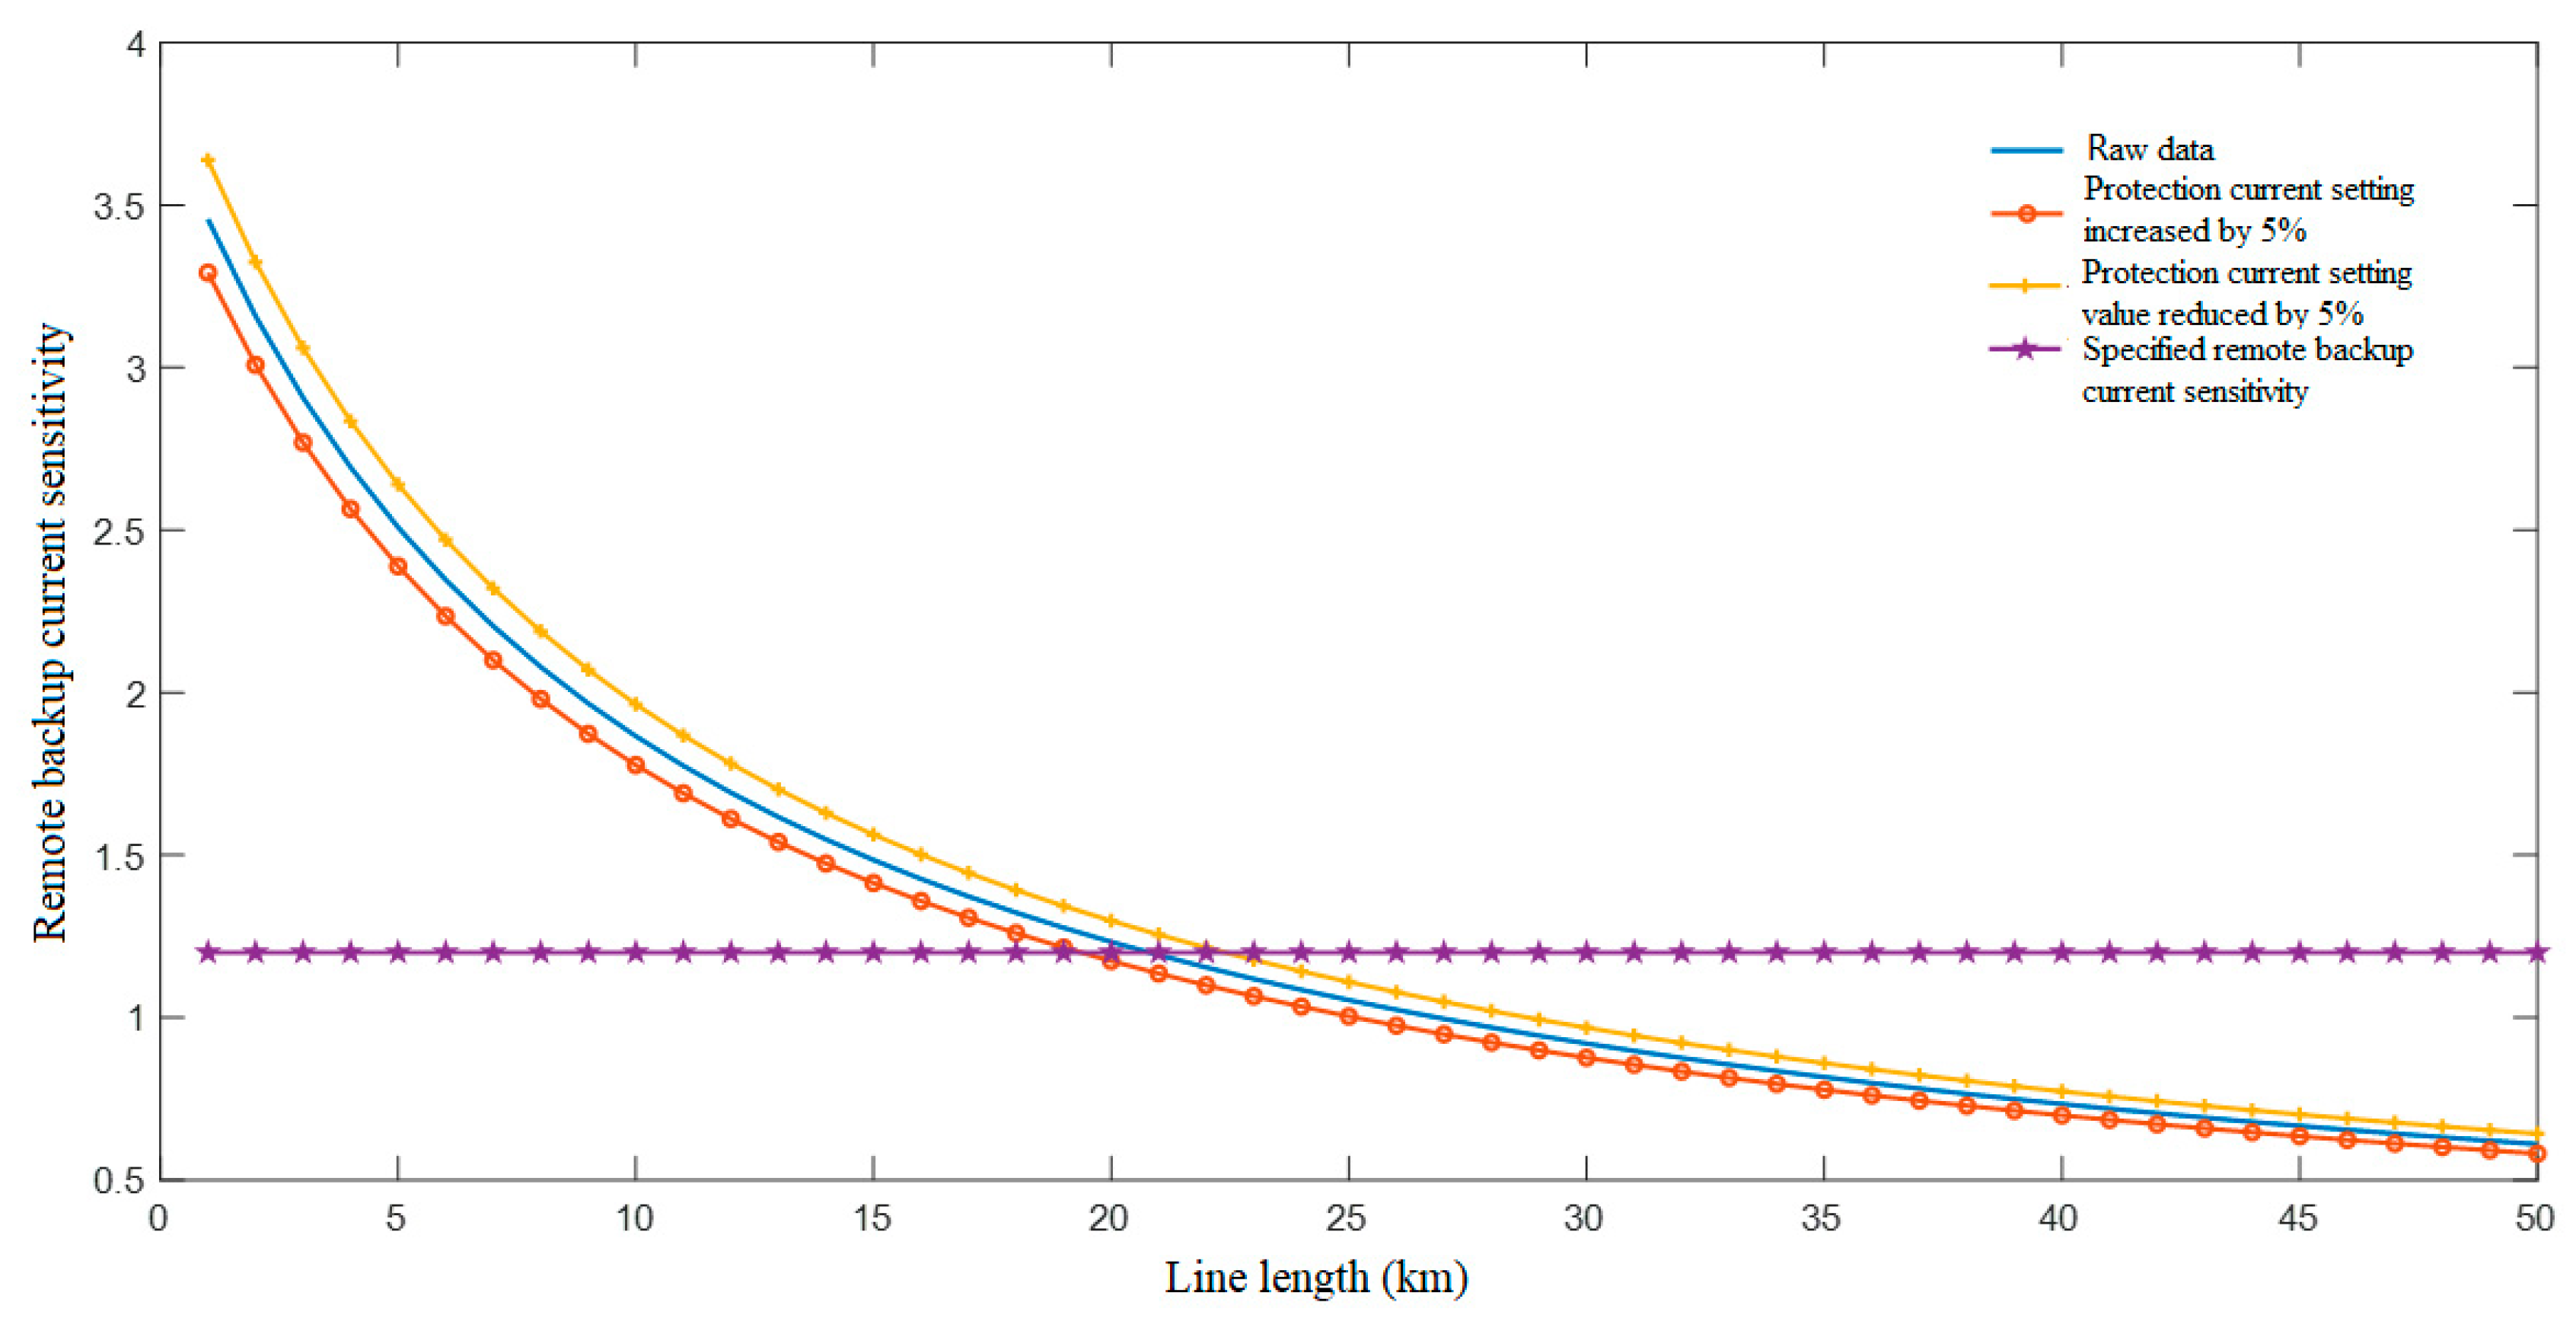
3.2. Far-Backup Protection Sensitivity Constraints
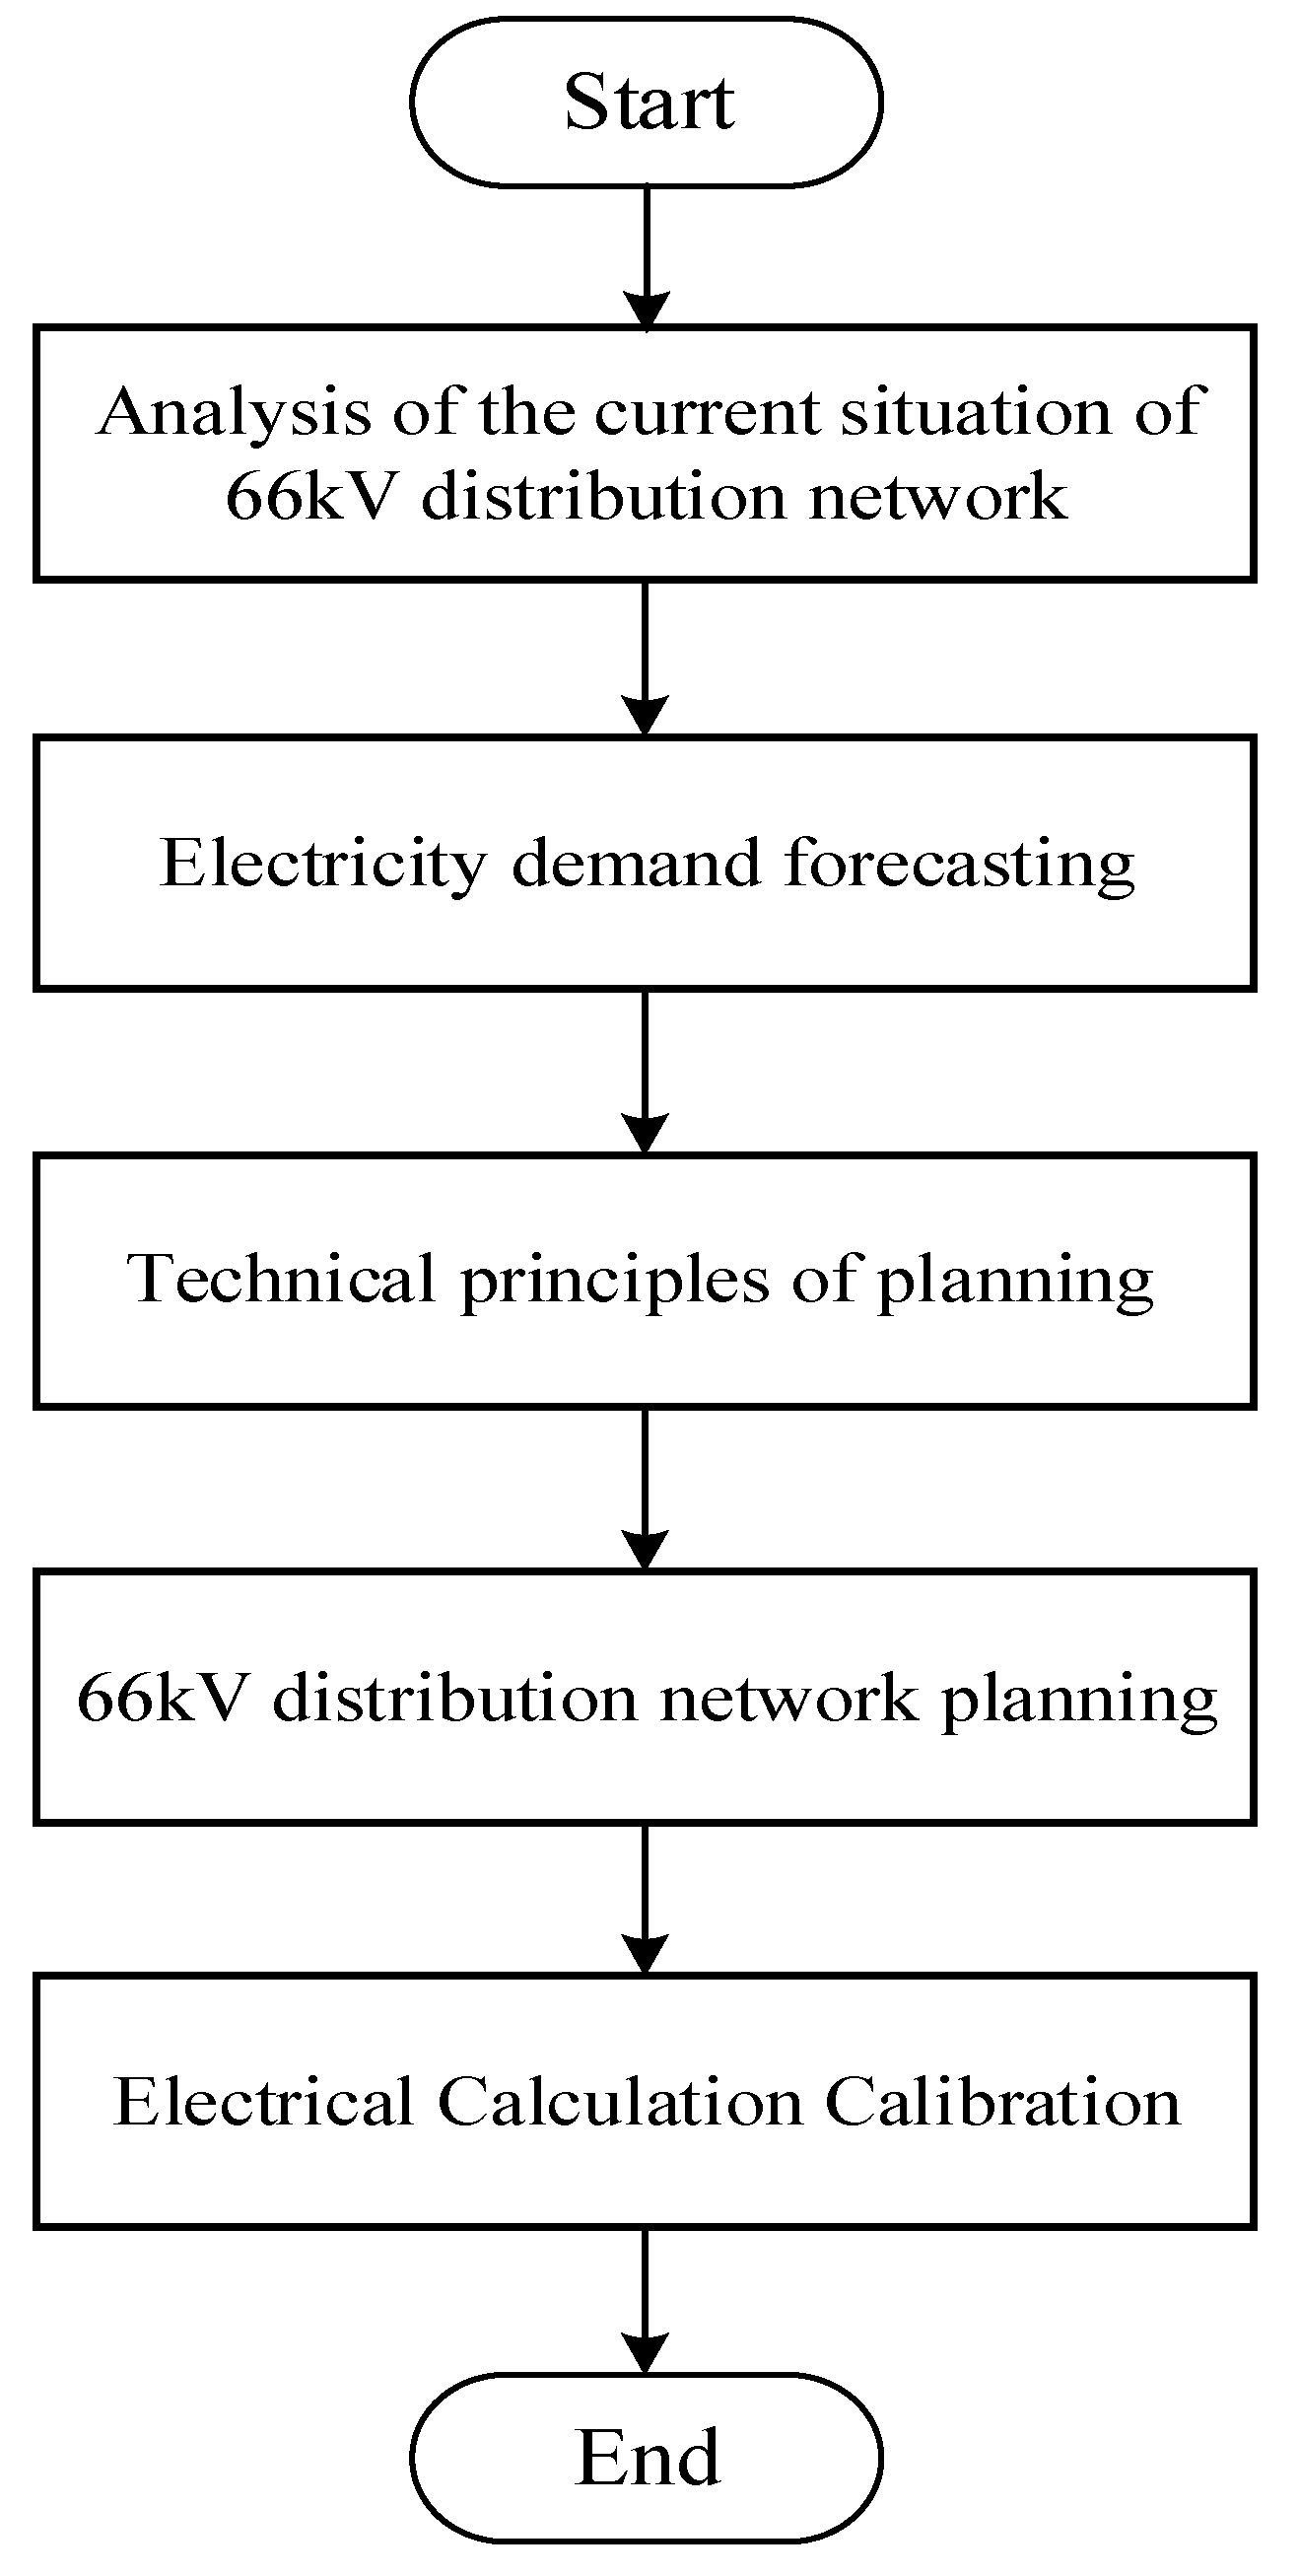
3.3. Sensitivity Constraint-Based Planning Method for Supply Radius
4. Example Analysis of the Radius of the Power Supply
4.1. Constraints on a local grid system
4.2. Values of Correlation Coefficients
4.3. Calculation Result
5. Conclusions
Author Contributions
Funding
Data Availability Statement
Conflicts of Interest
References
- Tang, Y.; Yi, J.; Xue, F. Planning and operation of new power system under the goal of “dual carbon”. Glob. Energy Internet 2024, 241–242. [Google Scholar]
- Jiang, Y.; Ren, Z.; Li, W. Committed Carbon Emission Operation Region for Integrated Energy Systems: Concepts and Analyses. IEEE Trans. Sustain. Energy 2024, 15, 1194–1209. [Google Scholar] [CrossRef]
- Zhang, Y.; Zhang, M.; Wang, Z.; Pang, X.; Wei, T. Coordinated Planning Scheme for Grid Structure of High- and Medium-Voltage Distribution Network. Autom. Electr. Power Syst. 2021, 45, 63–70. [Google Scholar]
- Qi, X.; Li, G. Optimal Selection of 10 kV Distribution Transformer Capacity and Low-voltage Line Cross-section and Power Supply Radius for Village-level Power Grid. J. Hebei High. Coll. Eng. Technol. 2015, 4, 18–21. [Google Scholar]
- Tan, X. Optimisation Analysis of Operation Strategies of Mountainous Distribution Networks. Integr. Circuit Appl. 2022, 39, 104–105. [Google Scholar]
- Wang, P.; Wang, C.; Zhang, Y.; Wang, G.; Chen, Y.; Kuai, S. Practical calculation method of optimal power supply radius and capacity of substation in urban distribution network planning. Electr. Appl. 2011, 30, 38–41. [Google Scholar]
- Cheng, J.; Li, F.; Mo, H.; Xu, M.; Yuan, Z. Study on economic power supply radius of distribution network substation. Power Syst. Prot. Control 2022, 50, 129–137. [Google Scholar]
- Liu, Z.; Xu, Y. Research on optimal power supply radius of power grid based on voltage system. Power Syst. Prot. Control 2010, 38, 87–91. [Google Scholar]
- Han, P.; Xu, Y. A review of wide-area backup protection algorithms for power systems. Shaanxi Electr. Power 2015, 43, 53–57. [Google Scholar]
- Chen, X.; Liu, K.; Hao, W. Improvement scheme of backup protection sensitivity for 110kV power grid. Sichuan Power Technol. 2010, 33, 74–76+94. [Google Scholar]
- Liang, L. Research on automatic adjustment method of line protection rectification calculation based on sensitivity constraints. Shandong Ind. Technol. 2013, 4, 47–48. [Google Scholar]
- Wang, F.; Xu, G.; Shao, C.; Bi, T. Optimisation method of synchronous unit transfer coefficient for new energy power system based on sensitivity analysis. Electr. Meas. Instrum. 2024, 61, 145–152. [Google Scholar]
- Xiong, Z.; Cheng, P. Economic analysis on powersupply scheme of medium voltage distributiong network. Proc. CSUEPSA 2010, 22, 150–155. [Google Scholar]
- Lin, D.; Chen, J.; Liao, J.; Chen, B.; Wang, H. Simplified Calculation of Maximum Reasonable Supply Radius for Distribution Network Load Access. Electrotech. Electr. 2023, 10, 7–11. [Google Scholar]
- Zheng, S.; Yang, X.; Ju, R.; Geng, G. Comparison and improvement of two heuristic algorithms for power network planning. Power Syst. Prot. Control 2019, 47, 109–116. [Google Scholar]
- Zhao, J.; Wang, Z.; Yue, H. Estimation Method for Electrical Calculation of Feeders in Middle Voltage Distribution Network Planning. Autom. Electr. Power Syst. 2008, 32, 98–102. [Google Scholar]
- Tan, X.; Wang, Z.; Shu, D.; Sun, J. Probabilistic Planning for the Number of Substations and Feeders Considering Distributed Generators. Autom. Electr. Power Syst. 2020, 44, 62–70. [Google Scholar]
- Zhao, J.; Yao, H.; Feng, Y.; Zhi, L. Research on reactive power planning method for 110 kV substation under overhead network. Electr. Power Sci. Eng. 2019, 35, 23–30. [Google Scholar]
- DL/T 684-2012; Guide of Calculating Setting of Relay Protection for Large Generator and Transformer. China Electric Power Press: Beijing, China, 2012.
- GB/T 14285-2006; Technical Code for Relaying Protection and Security Automatic Equipment. China Electric Power Press: Beijing, China, 2006.


| Load Density (MW/km2) | Conveyance Distance to Meet Voltage Requirements (km) | ||
|---|---|---|---|
| 66 kV | 20 kV | 10 kV | |
| 0.1–1 | 6.0–13.0 | 3.0–6.5 | 1.9–4.1 |
| 1–2 | 4.8–6.0 | 2.4–3.0 | 1.5–1.9 |
| 2–15 | 2.4–4.8 | 1.2–2.4 | 0.8–1.5 |
| Line Length | <=5 km | (5, 10] km | (10, 20] km | (20, 30] km | (30, 40] km | >40 km | |
|---|---|---|---|---|---|---|---|
| Satisfactory Rate | |||||||
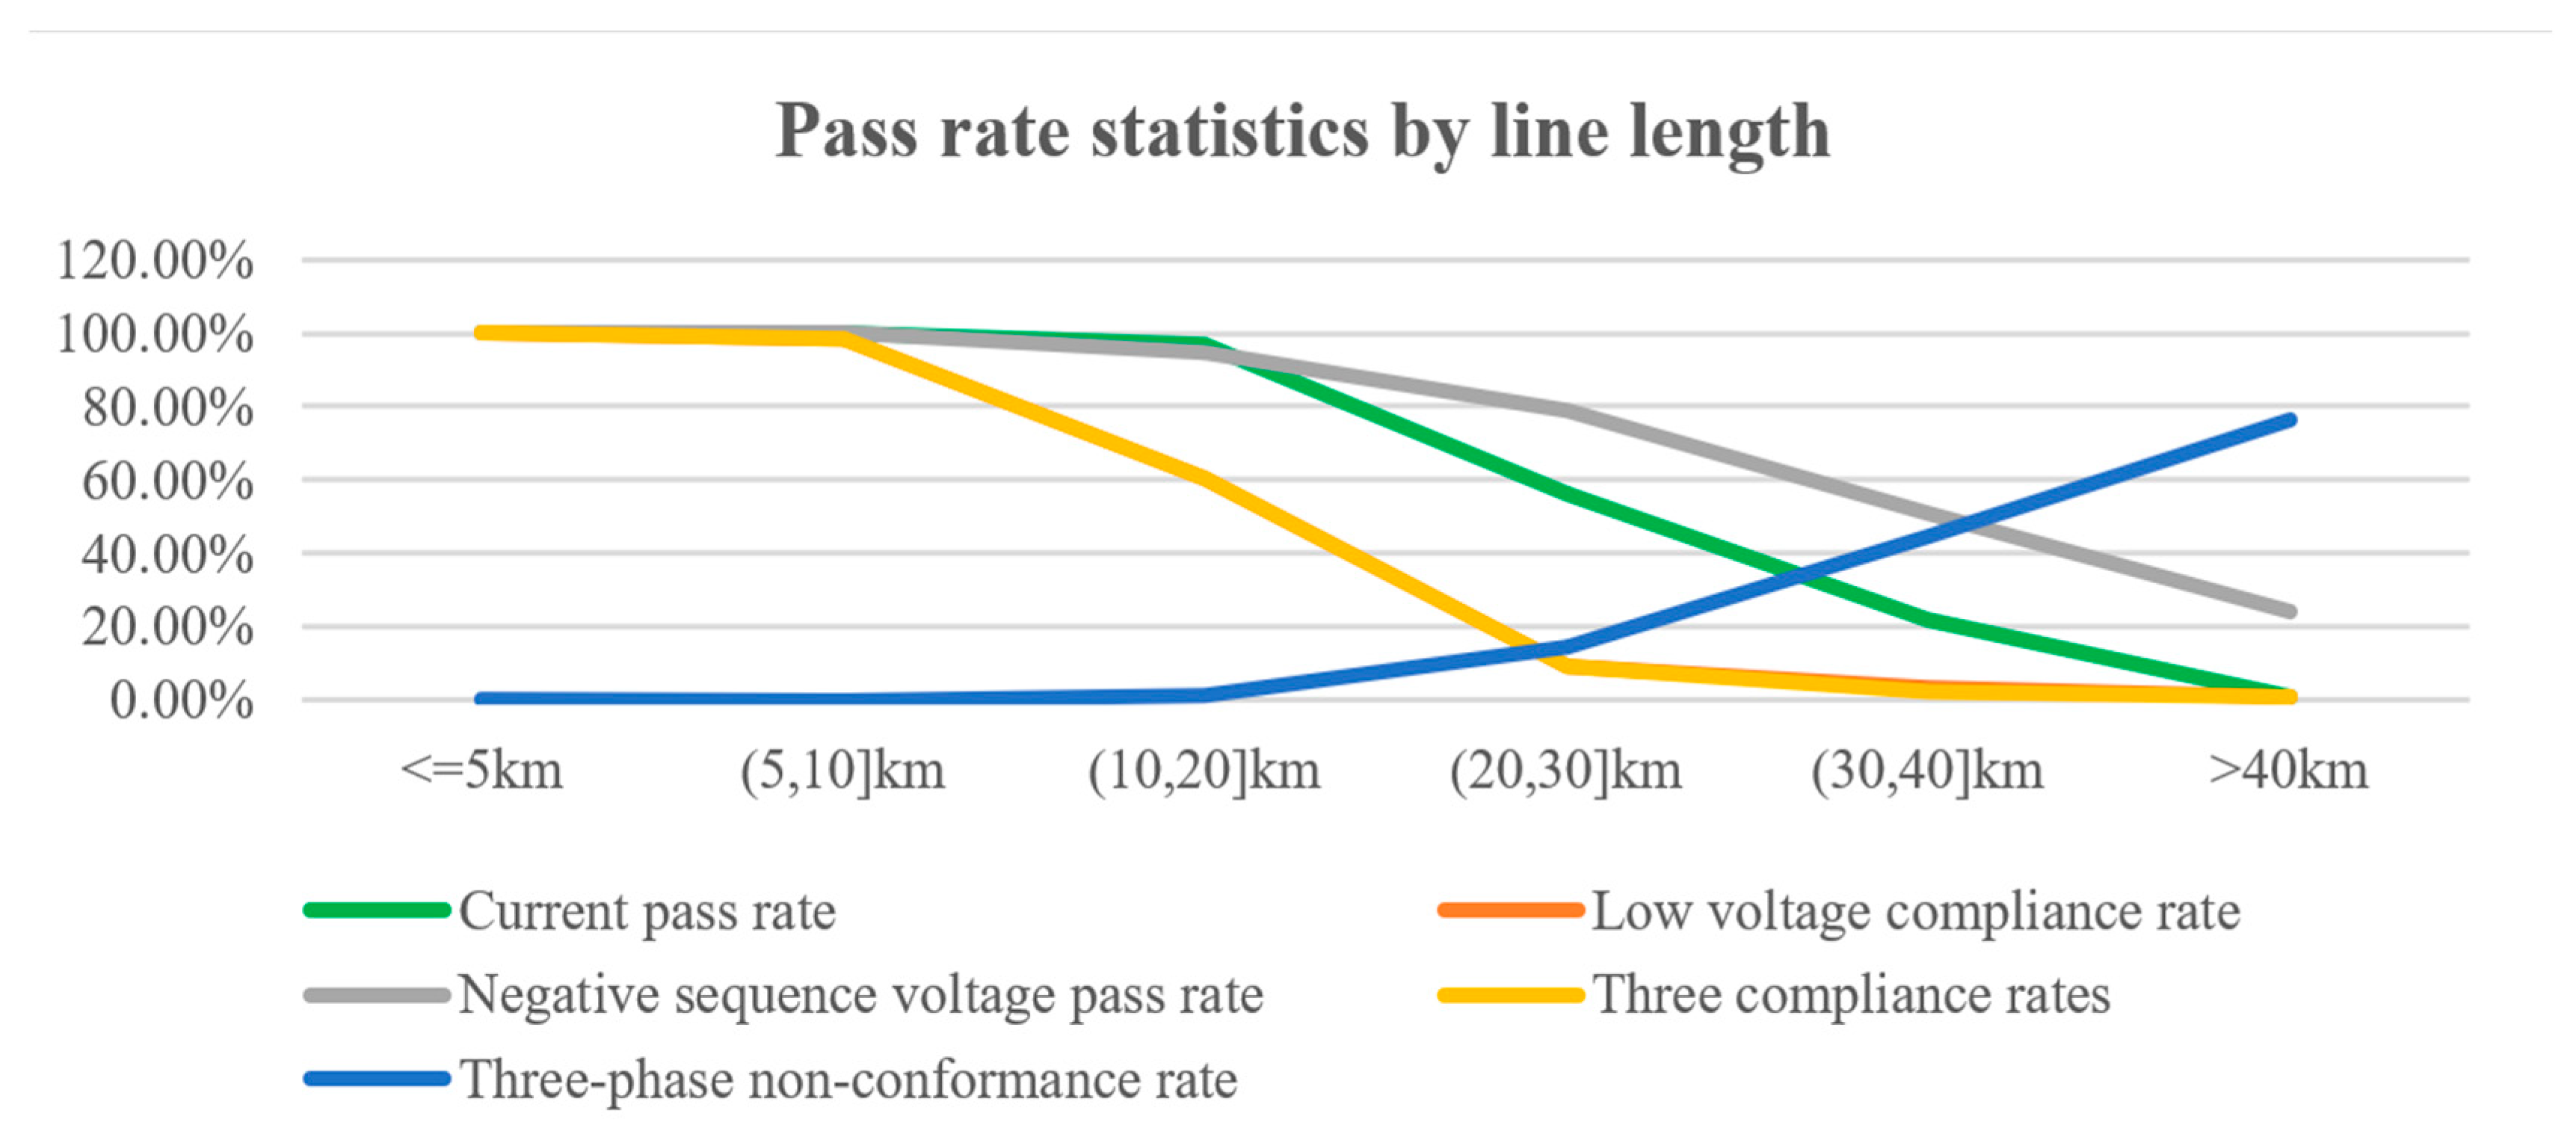
| Current pass rate | 100.00% | 99.89% | 96.78% | 56.21% | 21.76% | 0.84% | |
| Low-voltage compliance rate | 100.00% | 98.52% | 60.37% | 9.47% | 3.44% | 0.84% | |
| Negative-sequence voltage pass rate | 100.00% | 100.00% | 94.81% | 78.70% | 50.76% | 24.37% | |
| Three compliance rates | 100.00% | 98.52% | 60.37% | 9.17% | 2.29% | 0.84% | |
| Three-phase non-conformance rate | 0.11% | 0.00% | 1.45% | 14.50% | 44.66% | 76.47% | |
| Line Name | Line Length (km) | Equivalent Unit of Resistance | Equivalent Unit Reactance | 66 kV Small-Signal Impedance | Far-Backup Current Sensitivity | Far-Backup Low-Voltage Sensitivity | Far-Backup Negative-Sequence Voltage Sensitivity |
|---|---|---|---|---|---|---|---|
| Cheng bao No.2 | 101.723 | 0.0005 | 0.0021 | 0.0865 | 1.2 | 0.96 | 1.98 |
| Zhang mai yi | 47.631 | 0.0008 | 0.0046 | 0.0829 | 1.2 | 0.88 | 1.67 |
| Qiao lu zuo | 31.376 | 0.0011 | 0.0058 | 0.0854 | 1.2 | 1.01 | 1.79 |
| Shu liu yi | 40.310 | 0.0014 | 0.0062 | 0.0713 | 1.2 | 0.88 | 1.52 |
| Yi pei #1 | 30.766 | 0.0062 | 0.0092 | 0.1318 | 1.2 | 0.79 | 1.33 |
| Wen hai zuo | 27.574 | 0.0018 | 0.0060 | 0.098 | 1.2 | 1.02 | 1.88 |
| Qian wang | 102.505 | 0.0006 | 0.0015 | 0.0661 | 1.2 | 0.81 | 1.14 |
| Ying xi No.2 | 44.176 | 0.0022 | 0.0071 | 0.1374 | 1.2 | 0.94 | 1.92 |
| Xin huang No.2 | 55.248 | 0.0011 | 0.0031 | 0.127 | 1.2 | 0.92 | 1.50 |
| Lv shi #1 | 53.000 | 0.0025 | 0.0080 | 0.1702 | 1.2 | 0.94 | 1.88 |
| An fu | 26.325 | 0.0015 | 0.0059 | 0.1385 | 1.2 | 1.23 | 3.15 |
| Ping sun jia | 59.124 | 0.0012 | 0.0028 | 0.0935 | 1.2 | 1.01 | 2.36 |
| Hua kuan No.2 | 33.355 | 0.0015 | 0.0059 | 0.2239 | 1.2 | 1.21 | 3.09 |
| Line Name | Line Length (km) | Equivalent Unit of Resistance | Equivalent Unit Reactance | 66 kV Small-Signal Impedance | Far-Backup Current Sensitivity | Far-Backup Low-Voltage Sensitivity | Far-Backup Negative-Sequence Voltage Sensitivity |
|---|---|---|---|---|---|---|---|
| Cheng bao No.2 | 2.320 | 0.0005 | 0.0021 | 0.0865 | 4.00 | 12.41 | 6.82 |
| Zhang mai yi | 4.590 | 0.0008 | 0.0046 | 0.0829 | 3.50 | 3.06 | 4.95 |
| Qiao lu zuo | 3.830 | 0.0011 | 0.0058 | 0.0854 | 3.00 | 3.25 | 4.54 |
| Shu liu yi | 6.021 | 0.0014 | 0.0062 | 0.0713 | 3.59 | 1.93 | 4.64 |
| Yi pei #1 | 5.204 | 0.0062 | 0.0092 | 0.1318 | 3.00 | 1.82 | 3.41 |
| Wen hai zuo | 5.018 | 0.0018 | 0.0060 | 0.098 | 2.50 | 2.50 | 4.20 |
| Qian wang | 16.000 | 0.0006 | 0.0015 | 0.0661 | 3.03 | 2.03 | 2.96 |
| Ying xi No.2 | 11.770 | 0.0022 | 0.0071 | 0.1374 | 2.50 | 1.63 | 4.20 |
| Xin huang No.2 | 17.810 | 0.0011 | 0.0031 | 0.127 | 2.00 | 1.63 | 2.66 |
| Lv shi #1 | 23.515 | 0.0025 | 0.0080 | 0.1702 | 2.01 | 1.24 | 3.21 |
| An fu | 20.880 | 0.0015 | 0.0059 | 0.1385 | 1.35 | 1.36 | 3.56 |
| Ping sun jia | 33.286 | 0.0012 | 0.0028 | 0.0935 | 1.70 | 1.27 | 3.38 |
| Hua kuan No.2 | 30.100 | 0.0015 | 0.0059 | 0.2239 | 1.26 | 1.26 | 3.27 |
Disclaimer/Publisher’s Note: The statements, opinions and data contained in all publications are solely those of the individual author(s) and contributor(s) and not of MDPI and/or the editor(s). MDPI and/or the editor(s) disclaim responsibility for any injury to people or property resulting from any ideas, methods, instructions or products referred to in the content. |
© 2024 by the authors. Licensee MDPI, Basel, Switzerland. This article is an open access article distributed under the terms and conditions of the Creative Commons Attribution (CC BY) license (https://creativecommons.org/licenses/by/4.0/).
Share and Cite
Yu, Y.; Tian, J.; Li, T.; Sun, Z.; Ci, J.; Li, J.; Lai, Z.; Yao, Z.; Mo, J. Regional Grid Power Supply Radius Planning—A Sensitivity Constraint-Based Approach. Processes 2024, 12, 1769. https://doi.org/10.3390/pr12081769
Yu Y, Tian J, Li T, Sun Z, Ci J, Li J, Lai Z, Yao Z, Mo J. Regional Grid Power Supply Radius Planning—A Sensitivity Constraint-Based Approach. Processes. 2024; 12(8):1769. https://doi.org/10.3390/pr12081769
Chicago/Turabian StyleYu, You, Jingfu Tian, Tao Li, Zhenting Sun, Jianbin Ci, Jinming Li, Zengqiang Lai, Zhenji Yao, and Jingshan Mo. 2024. "Regional Grid Power Supply Radius Planning—A Sensitivity Constraint-Based Approach" Processes 12, no. 8: 1769. https://doi.org/10.3390/pr12081769