Article

Study on Wax Deposition Process of Crude Oil System under Shear Flow Field Conditions

1
Technology Inspection Center of Shengli Oilfield, SINOPEC, Dongying 257000, China
2
School of Petroleum Engineering, Guangdong University of Petrochemical Technology, Maoming 525000, China
3
School of Vehicle and Energy, Yanshan University, Qinhuangdao 066004, China
*
Author to whom correspondence should be addressed.
Processes 2024, 12(8), 1774; https://doi.org/10.3390/pr12081774
Submission received: 29 July 2024 / Revised: 19 August 2024 / Accepted: 20 August 2024 / Published: 21 August 2024
(This article belongs to the Topic Oil and Gas Pipeline Network for Industrial Applications)

Abstract

:
This paper adopted numerical simulation based on the MD method to research the effect of different shear rates and wax contents on wax deposition focused on crude oil. The findings indicated that under shear flow conditions, there were primarily four steps during deposition. Diffusion was the initial stage when wax diffused onto the metal surface. In the second stage, wax adsorbed onto a metal surface aligned itself parallel to the surface via Brownian motion, generating two different kinds of deposits. Subsequently, agglomerates were formed between the adsorbed deposits and the wax as a result of molecular interactions and bridging effects. Furthermore, the second and third deposited layers gradually showed peeling off and sliding under shear force. The wax deposition process was comparable for crude oil systems with varying shear rates and wax concentrations, and the deposited layer’s thickness on the metal surface was constant. The first, second, and third deposits were mainly adsorbed at 0.122 nm, 0.532 nm, and 1.004 nm away from the Fe surface, and the interaction energy between crude oil molecules and the Fe surface was mainly vdW force. The contact between Fe and wax progressively increased as the shear rate and wax content rose, promoting the wax adsorption on the metal surface and causing more of the wax to congregate in the deposited wax. The findings of the research can theoretically help a more thorough comprehension of the wax deposition.

1. Introduction

Waxy crude oil featured high viscosity, complex rheology, and low-temperature fluidity, which brought many difficulties to the production and transportation of crude oil [1,2]. Therefore, the safety assurance issues in the transportation of waxy crude oil have always been a hot and difficult problem both domestically and internationally. The wax deposits in pipelines can reduce the effective internal diameter of the pipeline and increase transportation resistance, which may lead to pipeline blockage accidents in severe cases, posing a great threat to the safe transportation of crude oil [3,4,5].
Singh et al. [6] proposed that wax deposition occurred through the diffusion and deposition of wax molecules onto the pipe wall, forming two layers. The layer closest to the wall was the initial immobile and turbidity deposition layer, where the temperature was lower than the turbidity point, leading to wax being deposited within this layer. In subsequent studies, the wax deposition mechanism described by Singh et al. had frequently been referred to as molecular diffusion. Early research mainly attributed wax deposition to molecular diffusion [7,8]. However, advanced research has indicated some different mechanisms in wax deposition [9,10]. For instance, the transfer of suspended wax particles from the mass transfer boundary layer to the oil deposition interface was noted by Soedarmo et al. [11].
Currently, the mechanisms of wax deposition are generally classified into four aspects [12,13]. However, there was still controversy regarding the specific mechanism of wax deposition. Assuming that the temperatures were kept unchanged, Arjun et al. [14] reported the wax deposition phenomena, indicating that molecular diffusion was not possible in this situation. In their experimental work, Yang et al. [15] showed that the current explanation cannot be consistent with wax deposition and proposed that when characterizing wax deposition using molecular diffusion, one should take into account the non-Newtonian features of waxy crude oil. Charlie et al. [16] conducted a thorough analysis of a substantial amount of experimental data to conclude that phase transition (heat transfer) was the primary limit on wax deposition. They also indicated that molecular diffusion was insufficient to explain the phenomenon of wax deposition thickness decreasing as the Reynolds number increased. Santos et al. [17] used microscopic in-situ visualization technology to demonstrate how flow rate affected the particle deposition mechanism, proving that wax deposition was not solely caused by molecular diffusion. Charlie et al. [18] noted that wax deposits took longer in pipelines and proposed that shear diffusion and Brownian diffusion should also be taken into account in order to fully explain the experimental finding. While the primary process of wax deposition was the molecular diffusion mechanism, additional mechanisms must also be investigated in order to resolve problems related to wax deposition.
A simulation of molecular dynamics (MDs) was grounded in classical Newtonian mechanics. As an addition to macroscopic experiments, it was possible to analyze changes in microscopic properties like molecular morphology and intermolecular force [19,20,21,22,23]. San-Miguel et al. [24] researched the deposition of C28 wax molecules on Fe2O3. The results showed that Fe2O3 (0001) was more conducive to the growth of wax crystals. On the contrary, Zhang et al. [25] put forward that ethylene/vinyl acetate can prevent the deposition of wax through the use of molecular dynamics simulations. In addition, scholars [25,26,27,28] described the interaction between polymer structural units and kaolinite surfaces, and the adsorption configuration of polymers at the interface can be accurately assisted by MD simulations, such as synergistic adsorption [29,30].
Nevertheless, there were few studies that used molecular dynamics simulations to examine the wax deposition process in systems of waxy crude oil with shear flow. This paper took the n-heptane/wax molecule/metal system as the research object, and used the MD method to study the microscopic process of wax deposition on the Fe surface under shear flow conditions. The mechanism of crude oil deposition on the metal surface was explained by combining the system energy and the relative concentration distribution. In addition, the effects of shear rate and wax content on wax deposition were investigated. System energy, molecular diffusion capacity, interaction energy, relative concentration distribution of the crude oil system, and the microscopic process of wax deposition all demonstrated the effect of shear and wax content on the process. Ensuring the safety of crude oil flow and comprehending the process of crude oil wax deposition were the major goals of this study project.

2. Experimental Methods

The software used for molecular simulation research was Materials Studio (MS 2019) software. The Amorphous Cell Tools module was used for modeling, and the Forcite Plus module was used for molecular dynamics simulation of wax deposition. The establishment of the crude oil system referred to the configuration method of the laboratory simulated wax oil, using the laboratory base oil n-heptane (C7H16) as the solvent oil. According to the carbon number of paraffin sections in the laboratory, n-26 alkane (C26H54) was selected as the wax molecule.
As shown in Figure 1d, the MD system used in this work consisted of a metal surface and an oil phase. First, a Fe surface of 1.433 nm was created. The structure of 19 × 19 was then established using a supercell function, resulting in a final Fe surface size of 5.446 × 5.446 × 1.433 nm, as shown in Figure 1a. It satisfied the periodic boundary condition because its length, width, and thickness were all more than two times the truncation radius of 1.25 nm. Second, n-heptane (C7H16), the basic oil utilized in the laboratory, was chosen to be the solvent oil. The typical C26H54 simulated wax molecule was chosen. Using the 200 n-heptane and 10 wax molecules found in the Amorphous Cell Tools module, an oil component system was built. Figure 1b depicts the molecules of crude oil. Finally, the Fe surface and the crude oil were joined, and a specific vacuum layer was positioned above the crude oil. The upper end of the system was configured with a 4.557 nm vacuum layer to obtain the final starting configuration.
Before conducting the kinetic simulation, all Fe atoms were fixed. Then, the structure of the wax deposition model was optimized using the Forcite module, with the optimization method being Smart Minimizer. The Forcite module enabled potential energy and geometric optimization of arbitrary molecular and periodic systems using classical mechanics. Subsequently, the optimized crude oil system was subjected to MD simulations using the shear module under the Forcite Plus module (the calculation principle was Couette flow, as shown in Figure 1c). Among them, the Fe layer was fixed, and the A-plane was sheared along the BC direction at a shear rate of 0.004 ps−1. The COMPASS was used as the force field, which was suitable for organic and inorganic covalent bond molecular systems [31,32,33]. The potential energy function is shown in Equation (1), with Anderson controlling the temperature to 293.15 K. The Ewald and atom-based methods were used for electrostatic interaction and van der Waals interaction, respectively. The Ewald method was used to calculate molecular configuration energy, especially for calculating the interaction energy of atoms or molecules in a molecule, including short-range interaction energy and long-range interaction energy. The atom-based method was focused on the total number of atoms, including one atom truncation distance, and one atom buffer width distance. It was a direct calculation method, that is, directly calculated the non-bond interaction between atom pairs; while the atom pair exceeds a certain distance (i.e., cutoff radius), the interaction between the atom pairs was considered to be zero. With a simulation time of 300 ps and a step size of 1 fs, the results were output every 100 fs during 300 ps.
Epotential = Ebond + Enon-bond
In the formula, Epotential was the total potential energy, Ebond was bond energy, Enon-bond was non-bond energy, Ebond was the bonding energy, and Enon-bond was the non-bonding energy, including van der Waals and Coulomb interactions.

3. Results and Discussions

3.1. The Feature of Wax Deposition

Figure 2 shows the wax deposition process configuration of the crude oil system under shear flow conditions, and Figure 3 shows the overhead configuration of the first sedimentary layer. The wax deposition, as shown in Figure 2, demonstrated a multi-layer adsorption process. This implied that, as the crude oil was being deposited on the inner wall of the pipeline, the first layer of molecules was being adsorbed as much as possible to the Fe surface, and then the following two layers of molecules were still being adsorbed. On the solid surface, paraffin deposits started to form at this phase as well. The first stage of the wax deposition process, based on the crude oil system described in this paper, involved the gradual adsorption of n-heptane and wax onto the Fe surface through Brownian motion, which was always used to adjust the corresponding configuration to form a parallel fit with the surface. In this phase, there were two types of deposition that occurred on the solid surface: one was the complete adsorption of the crude oil molecules, and the other was the adsorption of a portion of the wax chain on the Fe surface. The residual wax chain remained within the crude oil system, bridging the gap between the first and second layers. The second stage involved edge stacking and chain connecting wax to create flocculation between the ones that had been adsorbed on the solid surface and the rest of the crude oil molecules. A sedimentary layer was formed when wax molecules were enriched on the solid surface due to the adsorption effect. When enough crude oil molecules have been adsorbed on the Fe surface, the adsorption effect on the solid surface will no longer be significant, as shown in Figure 3. But wax molecules adsorbed on the Fe surface and in the crude oil system still aggregated, combining through bridging and intermolecular contacts with the previously created sedimentary layer.
Particles in the laminar or turbulent viscous bottom layer rotate under the influence of fluid velocity gradient, resulting in lateral migration and deposition on the pipe wall, known as shear dispersion [34]. As shown in Figure 2, under the action of the shear flow field, wax molecules close to the Fe surface migrated under a velocity gradient. The crude oil molecules not only moved along the flow direction, but also rotated, causing the crude oil molecules to gradually migrate laterally from high velocity to low velocity. As they approached the Fe surface, the velocity decreased, leading to the depositing.
Under the condition of shear flow, crude oil gradually formed three layers of sedimentary layers on the Fe surface. The adsorption layer molecules were strongly attracted by Fe atoms and can adsorb onto the Fe surface. The movement of the shear plane (A plane) will add shear to the crude oil molecules. Under the combined action of adsorption and shear, the crude oil molecules will move together with the shear plane. Due to the physical connectivity between the molecular chains, the oil layer molecules will flow together with the adsorption layer molecules, forming a certain velocity gradient in the entire crude oil system, presenting a state similar to Couette fluid; therefore, two types of velocity slip phenomena occurred when the shear action was strong. The position of the first sedimentary layer adsorbed on the Fe surface remained basically unchanged, forming a non-flowing layer. Under shear action, interlayer slip gradually occurred in the second and third sedimentary layers.
Figure 4 shows the energy variation curve of the system over time. The system equilibrium was judged by the energy equilibrium, and the energy deviation was within 5%, indicating that the system had reached equilibrium [35]. During the equilibrium trajectory in 300 ps, the potential energy was kept in a relatively stable range and fluctuations were within 5%, proving that the simulation system had reached an equilibrium state. There were four distinct stages of energy change. Because of the sharp increase in potential energy of the system with a concentration difference within 7 ps, it can be seen from Figure 2, showing the process of crude oil molecules gradually diffusing to the Fe surface under the action of molecular diffusion and shear dispersion (Stage I), the increase in system energy was mainly contributed by the vdW effect (van der Waals force effect) in non-bond energy. The adsorption of wax molecules started at the conclusion of the first stage. Simultaneously, Brownian motion modified the corresponding arrangement of crude oil molecules, causing them to adhere parallel to the surface. In 7–18 ps (Stage II), the potential energy dropped off sharply, and the vdW effect was primarily responsible for the system energy decrease. In conjunction with Figure 2, it was evident that the crude oil molecules located at a considerable distance from the oil–Fe interface experienced minimal disruption during this process, and their density variations were negligible. The decrease rate of potential energy slowed down at 18–300 ps (Stage III, IV). The third stage involved the combination of the sedimentary layer and un-deposited wax, reaching its maximum by the end of the third stage (18–173 ps).
The relative concentration distribution curve is displayed in Figure 5 along the Z-axis direction. This curve depicted position changes of wax with respect to surface direction. In the beginning, a small number of wax molecules were close to the Fe surface, while the others were far away from the Fe surface and exhibited a randomly distributed free state. At this time, the peak value of the first layer was 3.292, with a thickness of 0.616 nm. Within a period of 7–18 ps, the first layer exhibited a continuous increase, but the second layer exhibited a quick increase, and a third layer started to emerge. The gradual formation of the first, second, and third layers caused the thickness to continue decreasing. At the end of the second stage, the peak value of the first layer was 4.085, with a thickness of 0.565 nm, while the peak value of the second layer was 0.959, with a thickness of 0.462 nm. At 173 ps, the concentration distribution tended to stabilize, with many more wax molecules located on the Fe surface and forming a three-layer adsorption structure. The peak value of the first layer was 4.723 with a thickness of 0.565 nm, the peak value of the second layer was 3.533 with a thickness of 0.461 nm, and the peak value of the third layer was 2.607 with a thickness of 0.513 nm. The maximum concentration of the first deposition layer was much higher than that of the following two layers. During the fourth stage, the concentration of the first sedimentary layer remained basically unchanged, but the concentration of the second and third sedimentary layers gradually decreased under shear. The shear stripping effect mainly peeled off the crude oil molecules in the second and third sedimentary layers, with little impact on the first sedimentary layer. Near the Fe surface, crude oil molecules formed a weak second and third sedimentary layer, as seen by the relative concentration distribution curve. The transition zone including the second and third layers had a larger relative concentration of crude oil molecules than the un-deposited wax, but a lower concentration than the first sedimentary layer; the reason is that the shear stripping effect mostly removed the crude oil molecule, presenting less of an impact on the initial sediments.
The first, second, and third deposition layers were mostly adsorbed on the Fe surface at distances of 0.122 nm, 0.532 nm, and 1.004 nm by the end of the simulation. The literature review [36] stated that the elements C and Fe had van der Waals radii of 0.204 nm and 0.223 nm, respectively. As a result, whereas the second and third deposition layers produced vdW interactions, the initial deposition layer formed strong van der Waals interactions. This also explained why the second and third deposition layers gradually slip and peel off, whereas the position of the first deposition layer adsorbed on the Fe surface remains essentially fixed, forming a non-flowing layer.

3.2. Effect of Different Shear Rates on Wax Deposition in Crude Oil Systems

Taking C7H16 and C26H54 as an example, the effect of different shear rates of 0, 0.002 ps−1, 0.004 ps−1, and 0.008 ps−1 on wax deposition of crude oil system was studied.
The configuration of the crude oil system is depicted in Figure 6 for the Fe surface under various shear rates, and Figure 7 illustrates the system’s relative concentration distribution curve along the Z-axis direction at the conclusion of the simulation. When viewed together with Figure 6 and Figure 7, it is evident that the crude oil system’s deposition on the Fe surface demonstrated a multi-layer adsorption process under various shear rate conditions, leading to a consistent thickness of the deposition layer. Additionally, the deposition layer accumulated more crude oil molecules at higher shear rates. This was because both n-heptane and wax molecules were straight-chain alkanes with comparable structures. Additionally, the deposited wax molecules were arranged horizontally. Moreover, the wax deposition process was comparable with varying wax contents. According to Dickinson and Eriksson’s flocculation efficiency model, the flocculation efficiency and collision probability were positively connected when the polymer attached to adsorbed particles bridges to other particles [37]. As the shear rate increased, the collision probability between crude oil molecules increased, enhancing the bridging performance and resulting in a denser deposition layer. Simultaneously, as the shear rate increased, the number of crude oil molecules in the deposition layer and the relative concentration increased. This suggested that the deposition rate increased with the shear rate, which was consistent with the experimental results and the wax deposition pattern [38]. When a shear plane moved at a certain speed, the crude oil molecules moved along with the shear plane, and at a certain shear rate, the crude oil system will produce a velocity gradient along the Z-axis. As the shear rate changed, the velocity distribution of the crude oil system also changed accordingly. When the shear force is strong, the interlayer slip of the crude oil system will take place.
Figure 8 shows the variation of potential energy over time. As the shear rate increased, the time taken for wax deposition processes became shorter, indicating a faster wax deposition rate, which was consistent with the conclusions in references [39,40]. However, it was found that under different shear rate conditions, the time taken in the first stage was essentially the same, and as the shear rate increased, the time taken in the second and third stages became shorter. To elucidate these phenomena, mean square displacement (MSD) was extracted.
Figure 9 shows the MSD during wax deposition. When the shear rate was 0, the MSD changed very little, indicating that during the wax deposition process, wax molecules spontaneously diffused to the Fe surface to form a deposition layer, showing a process that was actually unrelated to shear. Under shear flow conditions, with increasing duration of action, the MSD exhibited an exponentially increasing change. On one hand, the constituent atoms began to depart from their original positions and underwent directional migration under the influence of external stress. On the other hand, the effect of the applied stress disrupted the dynamic equilibrium between relaxation and recovery, as well as between disentanglement and entanglement of the molecular chains. The former gradually takes precedence, manifesting in two aspects: (1) the directional migration of relaxed or entangled crude oil molecules along the direction of stress; (2) the orientation elongation of relaxed or disentangled crude oil molecules along the direction of the flow field. The MSD curve was the result of the coordinated movement of these two aspects. The prerequisite for bridging [41] was that segments of the flocculants had already been adsorbed on the particle surface. Wax molecules had the ability to spontaneously adsorb to the Fe surface under a variety of shear rate settings. Additionally, as the shear rate increased, so did the molecules’ self-diffusion coefficient. This suggested that the Fe surface was gradually adsorbed by crude oil molecules, enabling bridging. According to reference [42], the bridging effect can be partially reflected by the self-diffusion coefficient, meaning that the bridging effect gets stronger as the shear rate increases. The distribution of relative crude oil molecule concentration was supported by these findings.
We calculated the interaction energy between three types of systems and Fe in order to examine the impact of varying wax levels on the wax deposition in crude oil systems. The strength of the binding between molecules of crude oil and the Fe surface can be represented by the interaction energy. The greater the absolute value of the interaction energy, the stronger the interaction between the two substances. The expression is as follows:
EInter = Etotal − (EOil + EFe)
In the formula, EInter is the interaction energy between molecules and the Fe surface, Etotal is total energy, EOil is the energy of the crude oil after removing Fe, and EFe is the energy on the Fe surface after removing crude oil.
As shown in Figure 10, the composition of the contact energy between molecules of crude oil and Fe surfaces was calculated in this paper. Crude oil molecules and Fe surfaces had the electrostatic interaction energy of only 0.002–0.016 kcal/mol, meaning that there was very little Coulombic contact between the two and can be disregarded. Much larger than the electrostatic interaction energy, the van der Waals interaction energy between crude oil molecules and Fe surfaces increased gradually with an increase in wax content, with a change range of −4067.168~4147.862 kcal/mol. This suggested that van der Waals interactions account for the majority of the interaction energy between crude oil molecules and Fe surfaces. The interaction between crude oil molecules and the Fe surface steadily improved with an increase in shear rate, indicating that shear can encourage the deposition

3.3. Effect of Different Wax Content on Deposition

In this study, the influence of varying wax concentrations on deposition at the shear flow of 0.004 ps−1 was examined using C7H16 and C26H54 as an example. The ratio of n-heptane molecules to wax molecules was 200:1, 200:5, and 200:10, respectively.
Figure 11 shows the configuration of the deposition of five types of systems on the Fe surface, while Figure 12 depicts the relative concentration distribution curve of the crude oil systems along the Z-axis. Combining Figure 11 and Figure 12, it was possible to see that the Fe surface displayed a multi-layer adsorption process when various wax molecule compositions were deposited, and the thickness of different layers was consistent. This was because the n-heptane and wax molecules composing the crude oil systems in this study were both straight-chain alkanes, with similar structures. Most of the deposited wax was oriented horizontally, and procedures used to deposit wax in various crude oil systems were comparable. Denser deposition layers were produced when the bridging capability of crude oil systems improved with an increase in wax content. Simultaneously, as wax content grew, the number of deposited wax molecules increased, and the relative concentration of crude oil systems gradually declined. This suggested that as the amount of wax increased, the deposited rate decreased, and the pattern of wax deposition was in line with the findings of the experiment [43].
Three different crude oil systems’ potential energy curves over time are depicted in Figure 13. From the graph, it is evident that as wax content increased, the duration of the wax deposition process (phases I, II, III) became shorter, indicating a faster wax deposition rate, consistent with the conclusions in reference [43]. However, it was noted that in crude oil systems with varying wax compositions, phase I durations are nearly constant, and phase II and III durations decreased with increasing wax content in the systems. For this phenomenon, MSD was extracted.
The MSD during the wax deposition process is depicted in Figure 14. The MSD slope, self-diffusion coefficient, and bridging effect all rose with an increase in the amount of wax present in the crude oil system. The findings aligned with the distribution of relative concentrations of components in crude oil.
The distribution of interaction energy components between the Fe surface and molecules of crude oil is depicted in Figure 15. The electrostatic interaction energy was only −1.441~0.016 kcal/mol, suggesting that the Coulombic contact between the molecules of crude oil and Fe was negligible and can be disregarded. Conversely, the vdW force rose steadily as the wax content increased, ranging from −4088.323 to 4122.397 kcal/mol. This energy was significantly greater than electrostatic interaction energy, suggesting that vdW interaction was a significant influence on deposition, which was the reason that higher wax content encouraged the deposition.

4. Conclusions

(1)
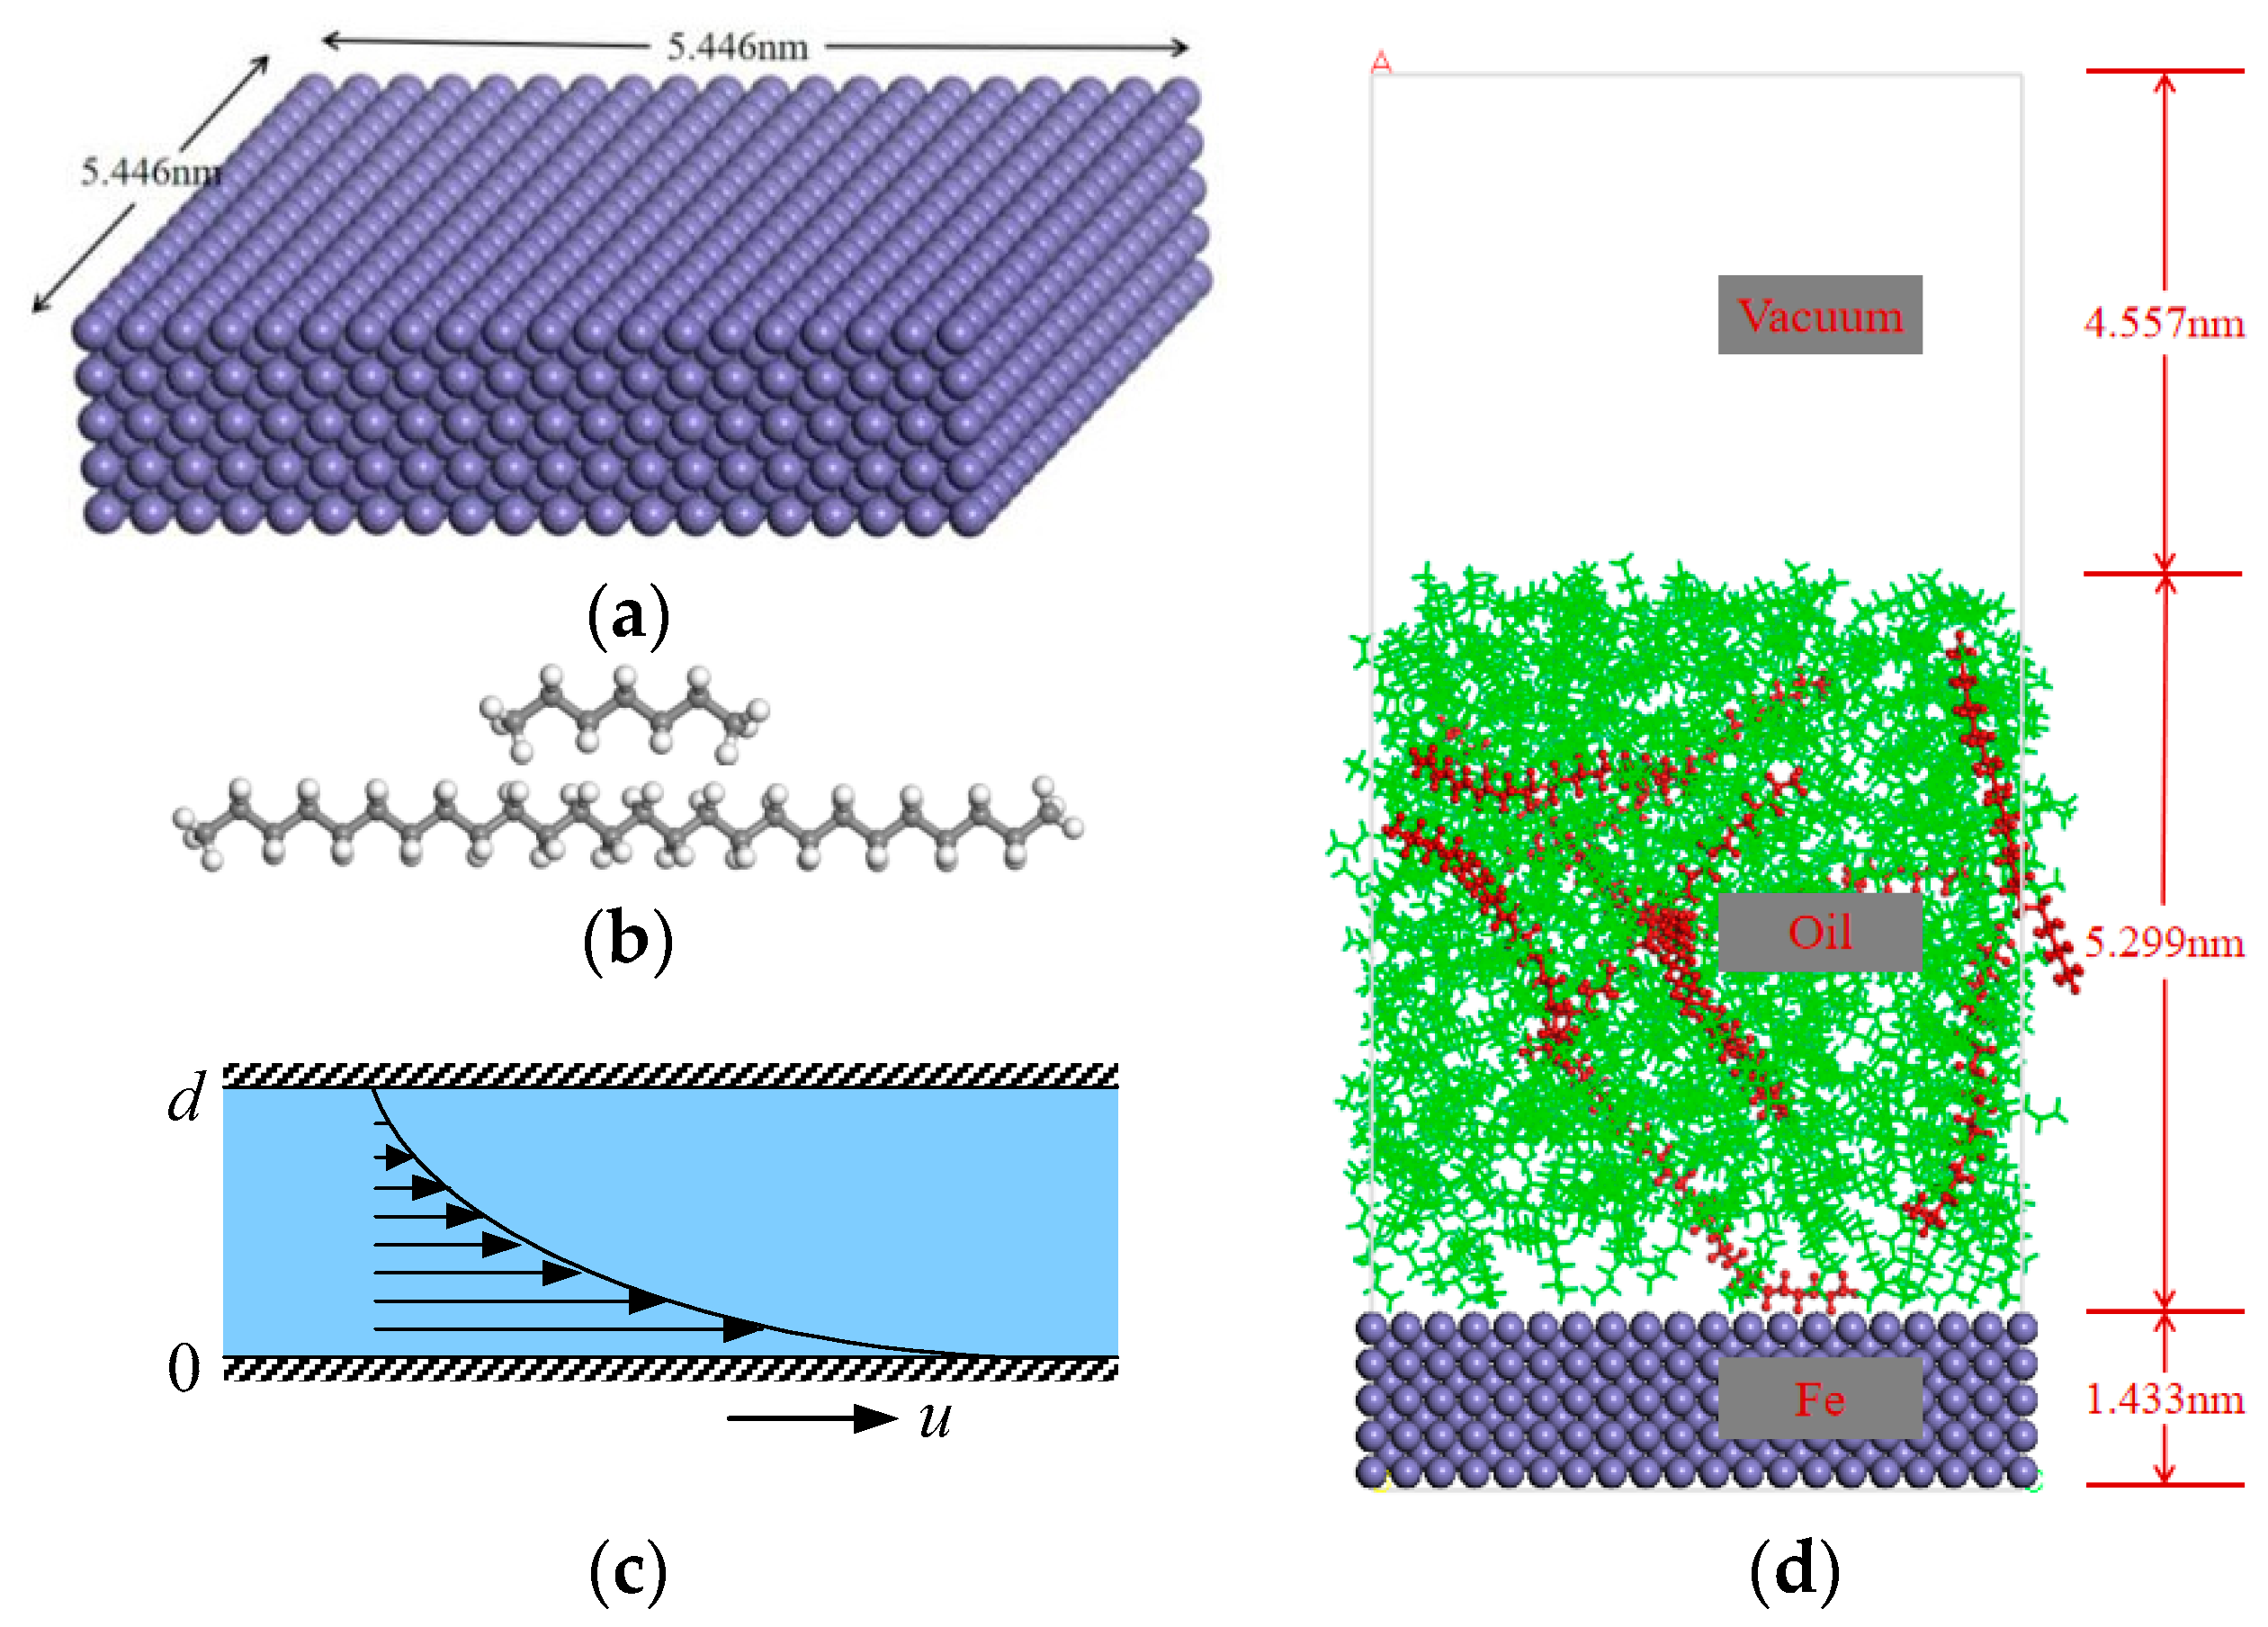
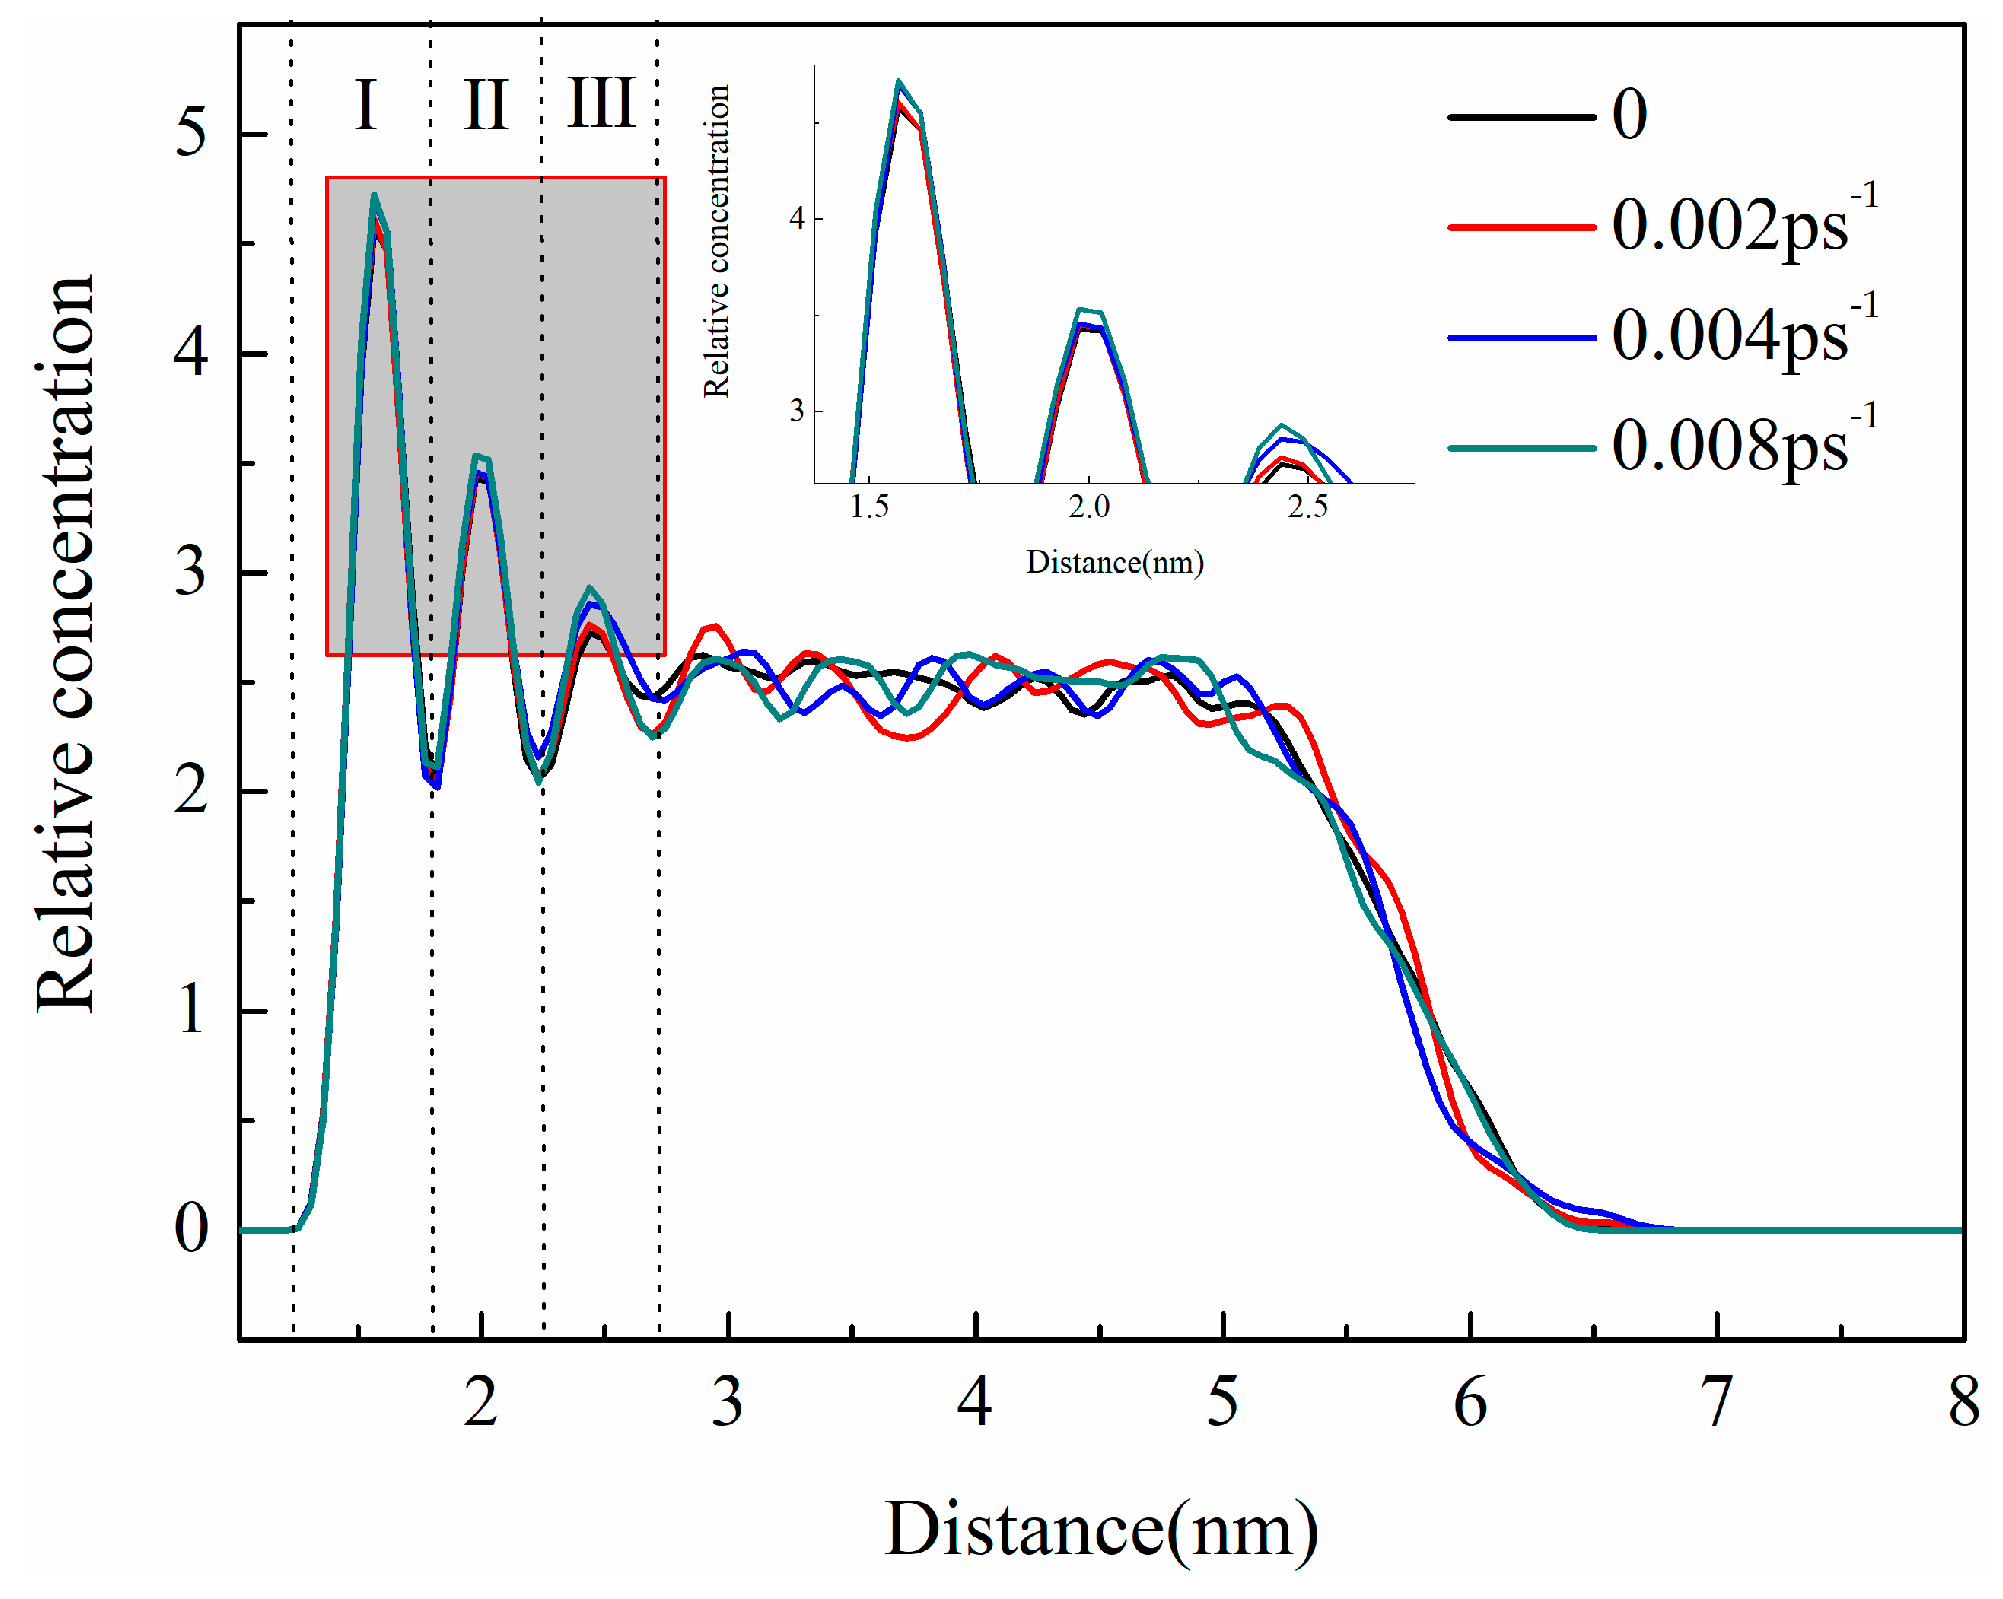
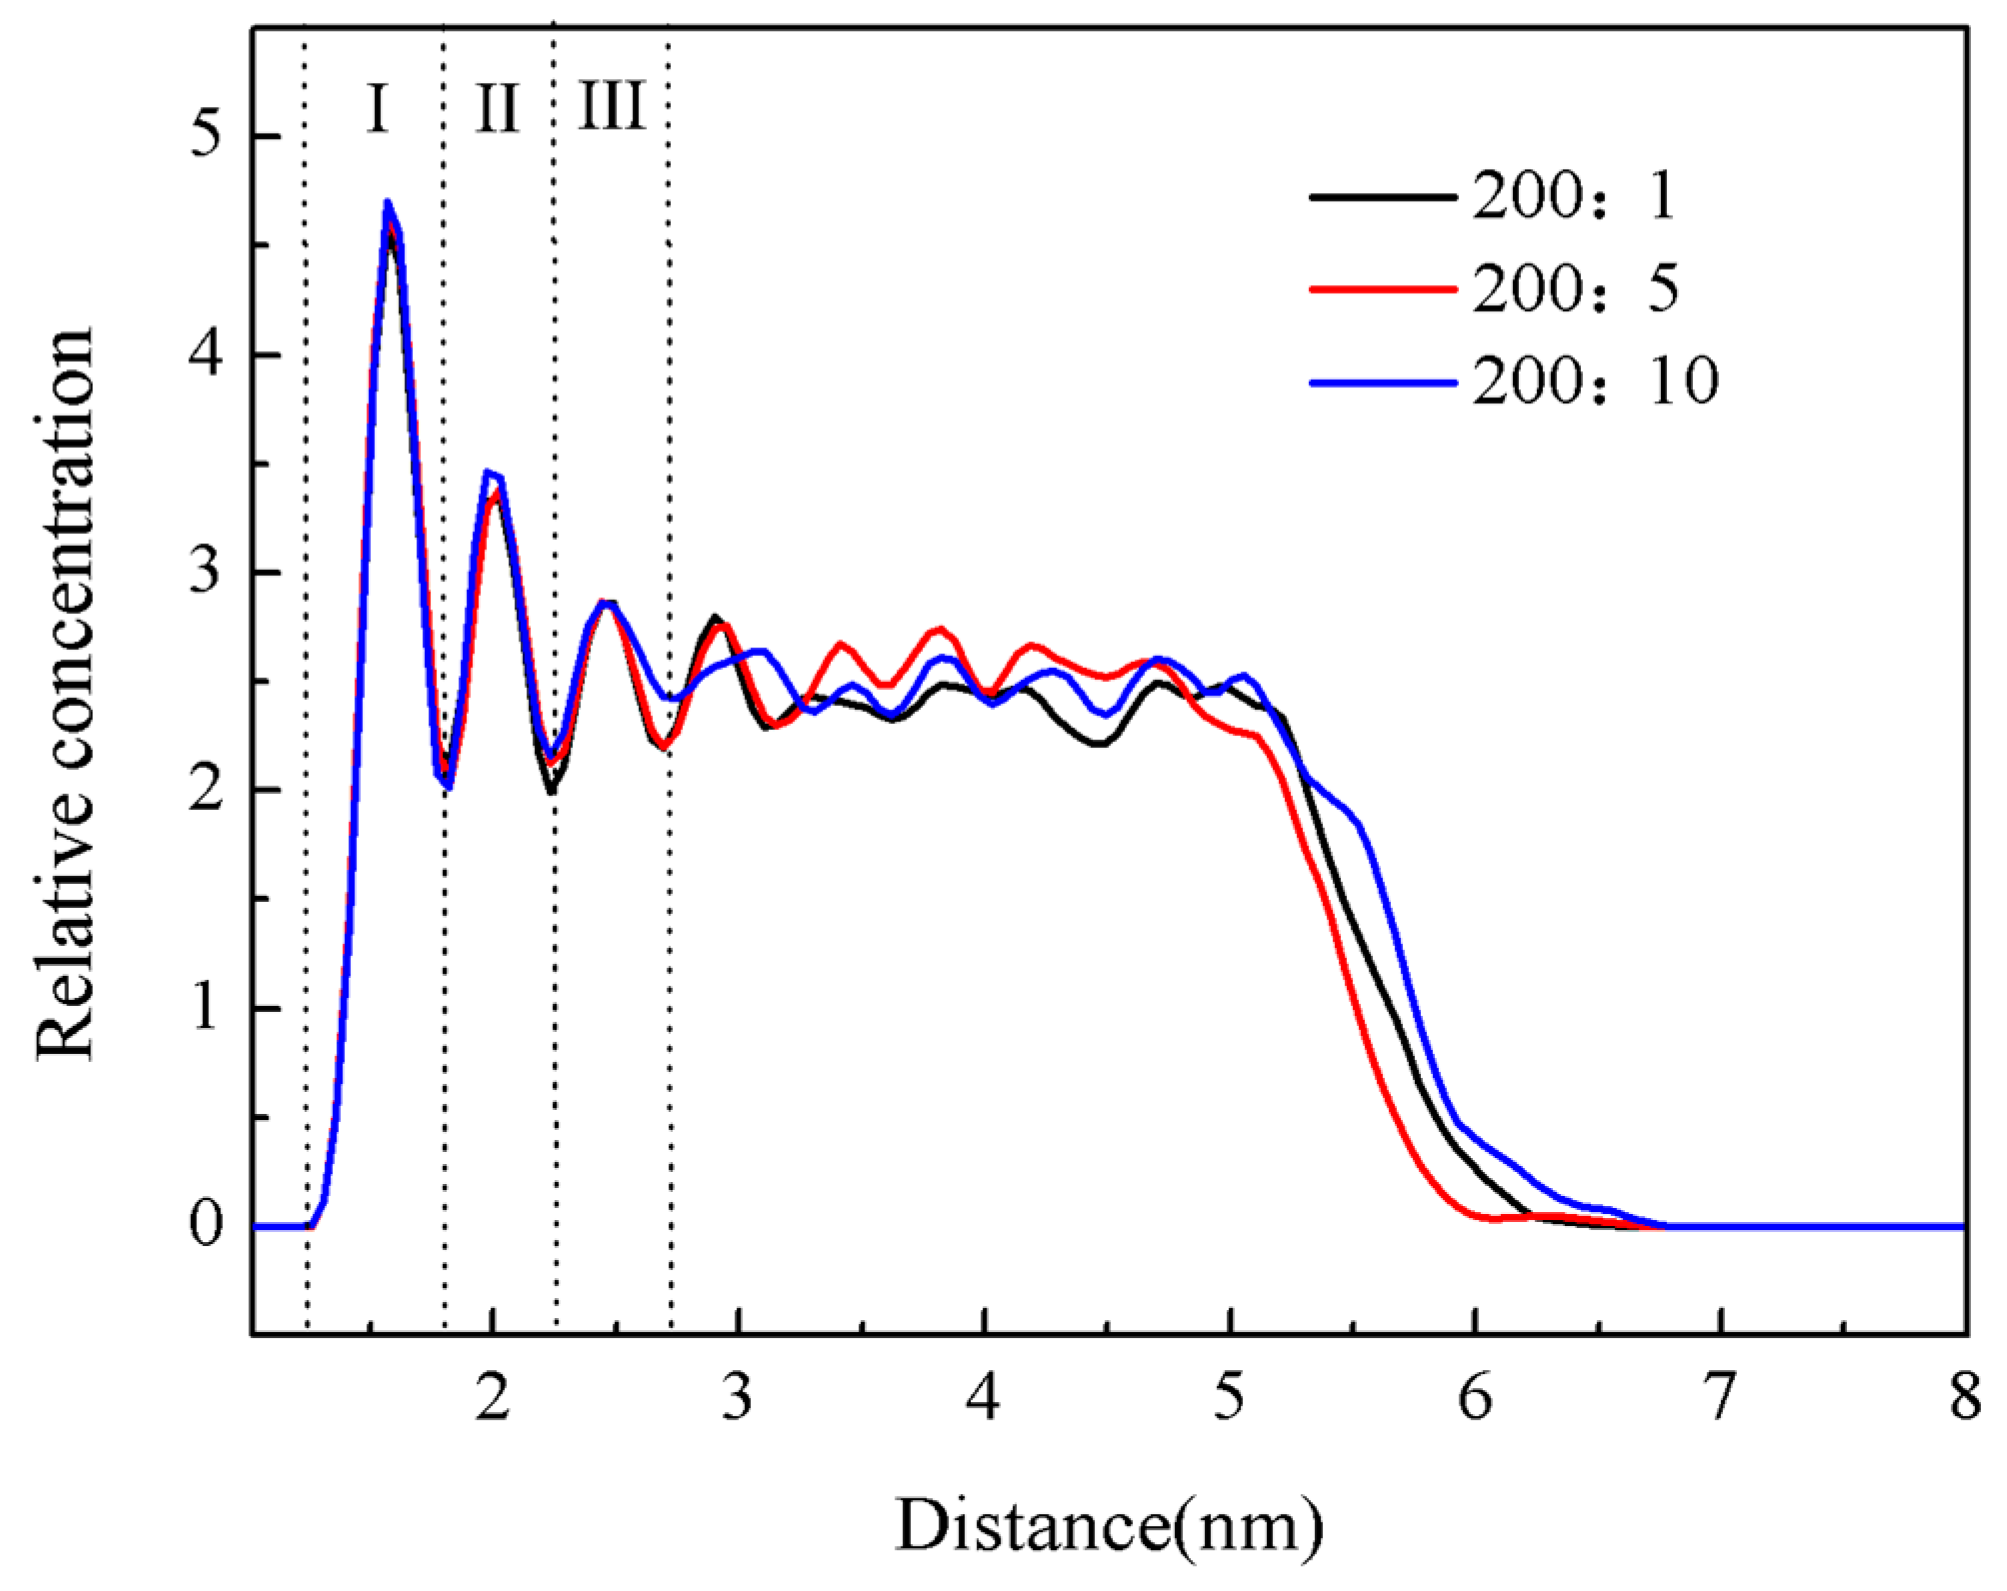
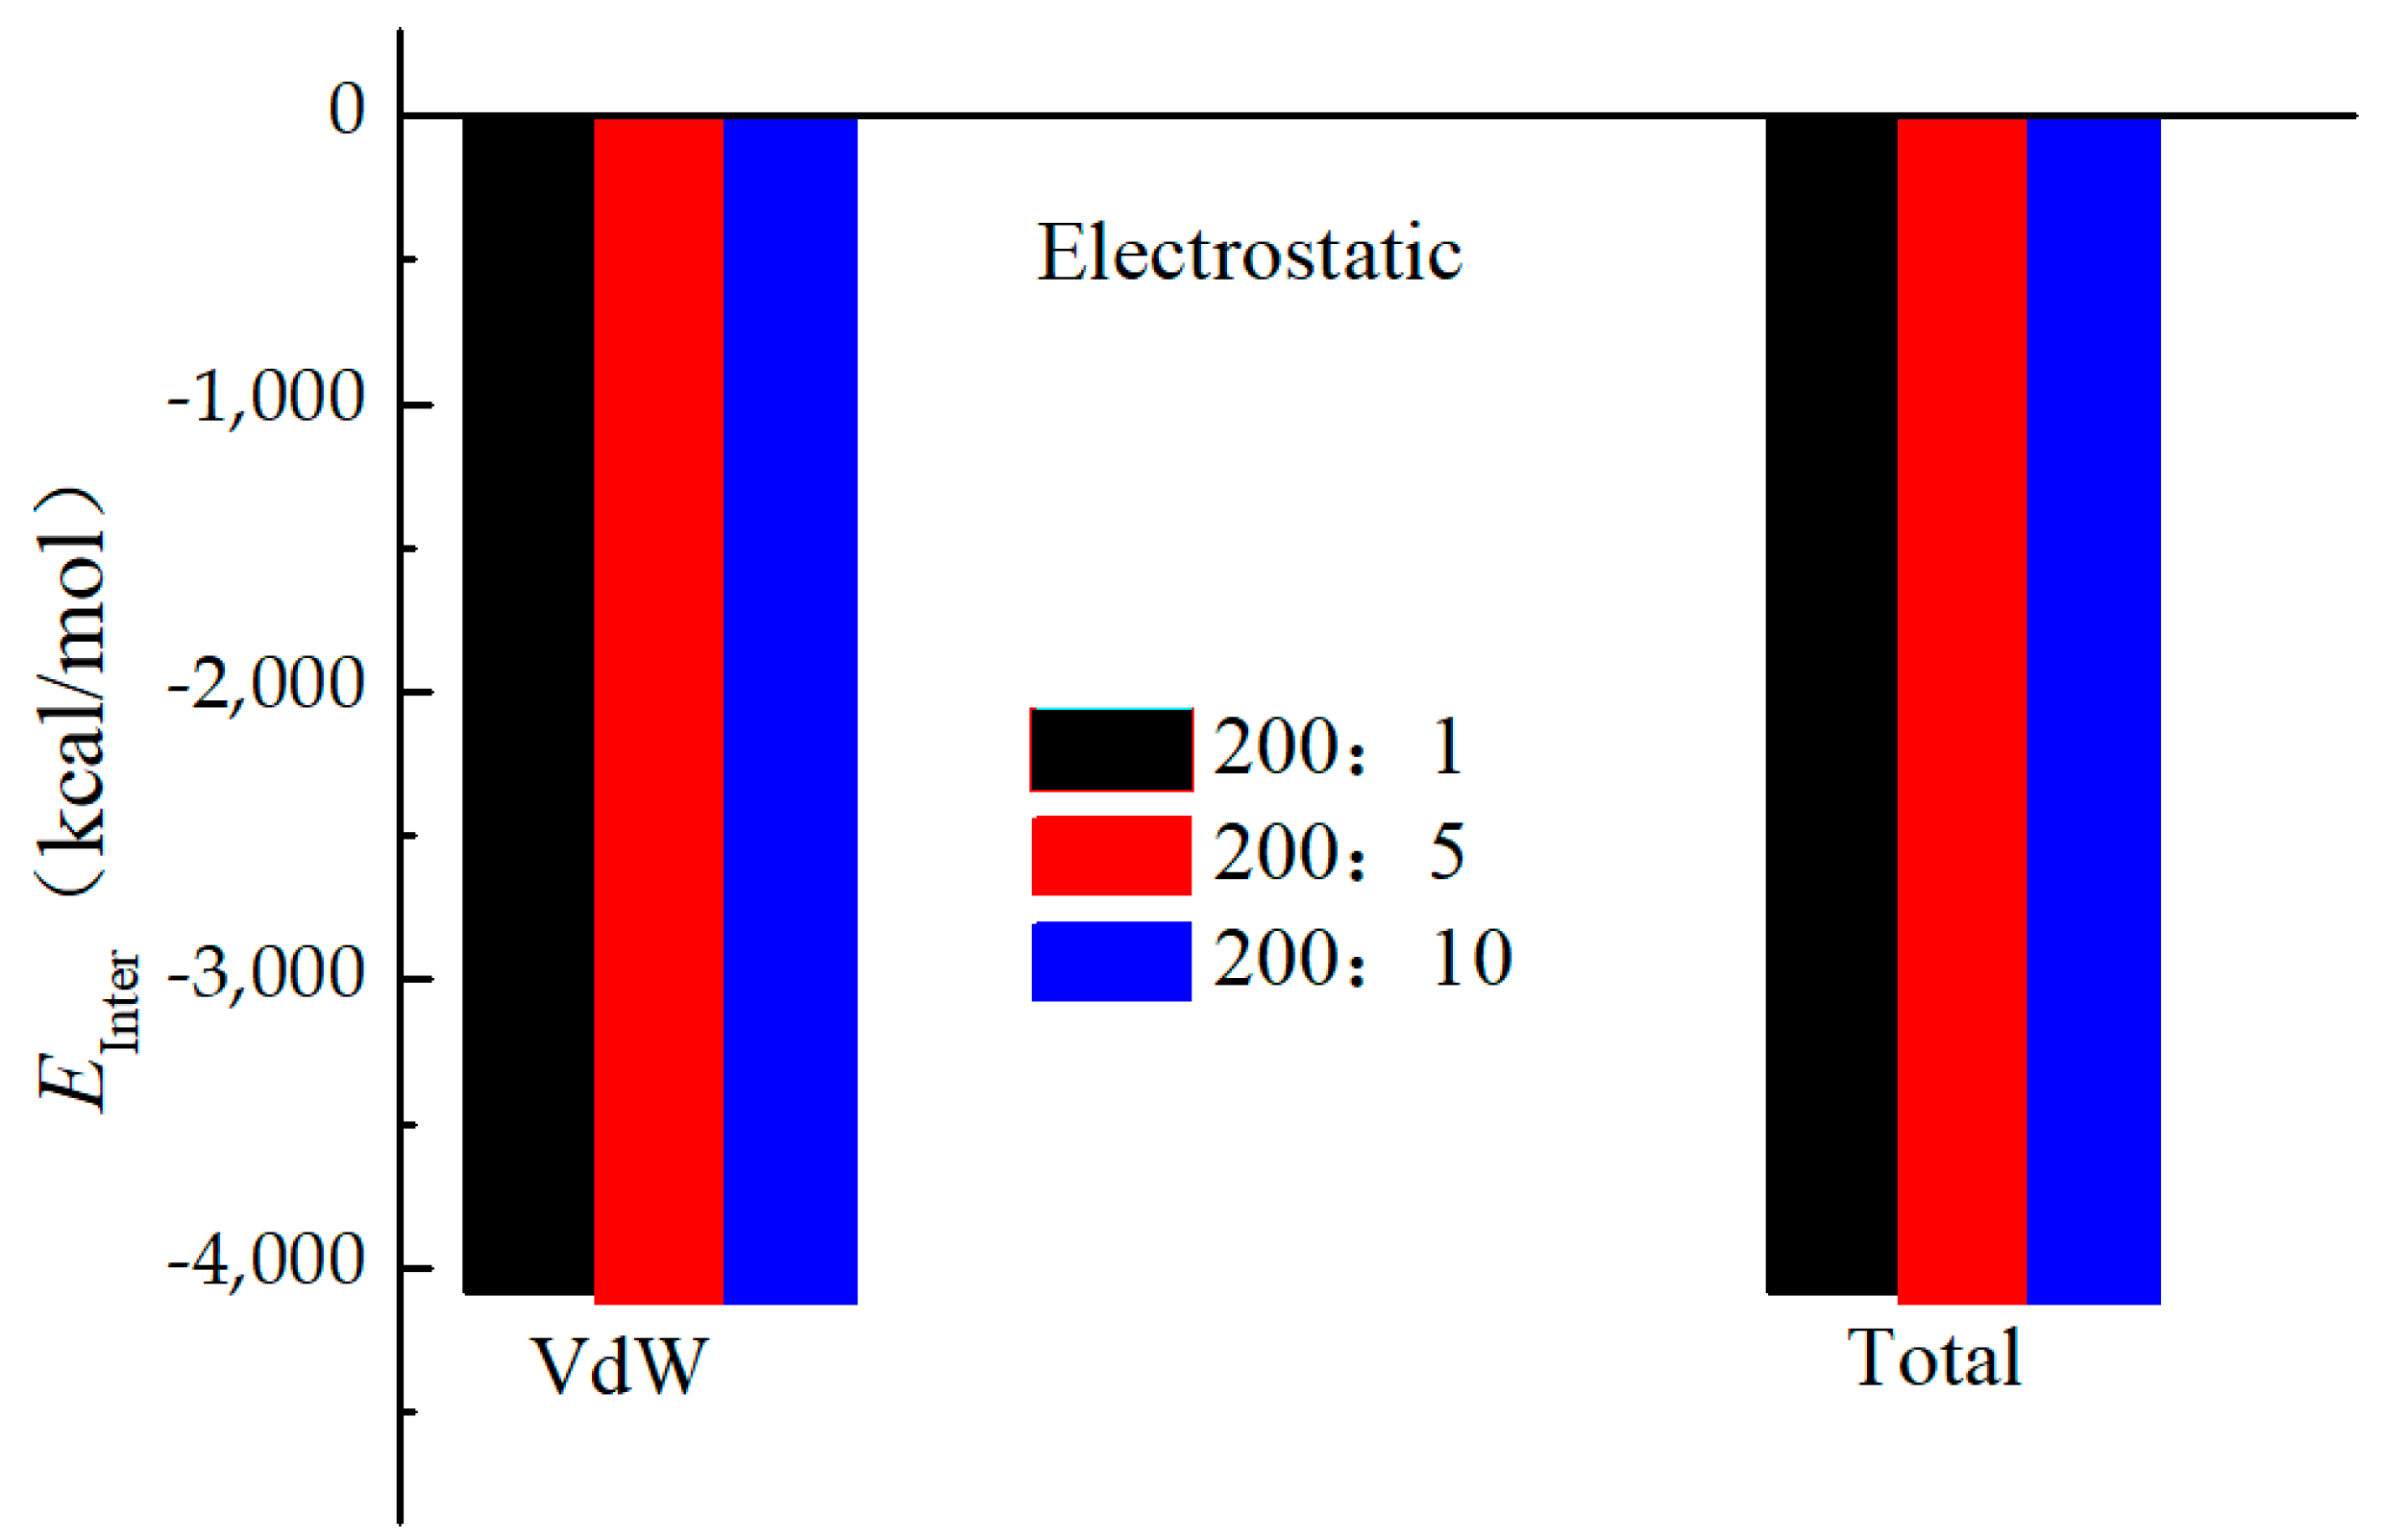
Three-layer adsorption was used to deposit wax on the Fe surface, and the vdW interaction was the primary force behind this process. The Fe surface was subjected to strong vdW interaction by the first deposition layer and weak vdW interaction by the second deposition layer. Between deposited and un-deposited molecules, the second and third layers provided a transition zone where the relative concentration of wax was higher than that in the free system but lower than that in the first deposition layer.
(2)
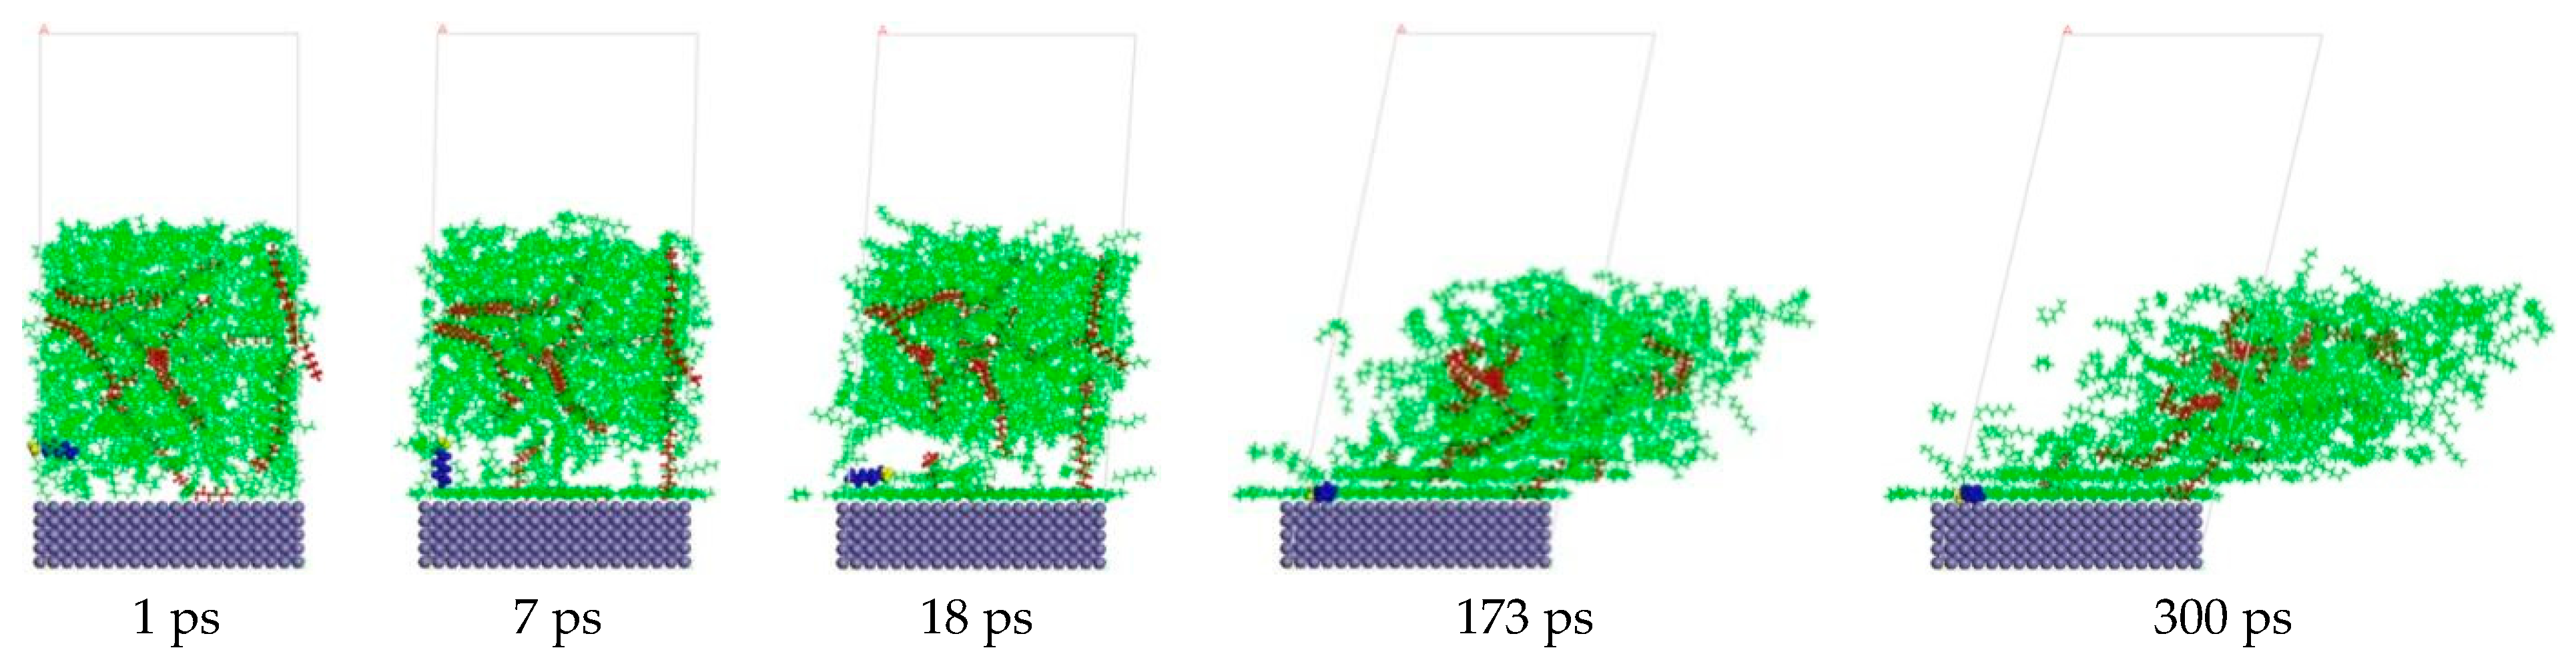
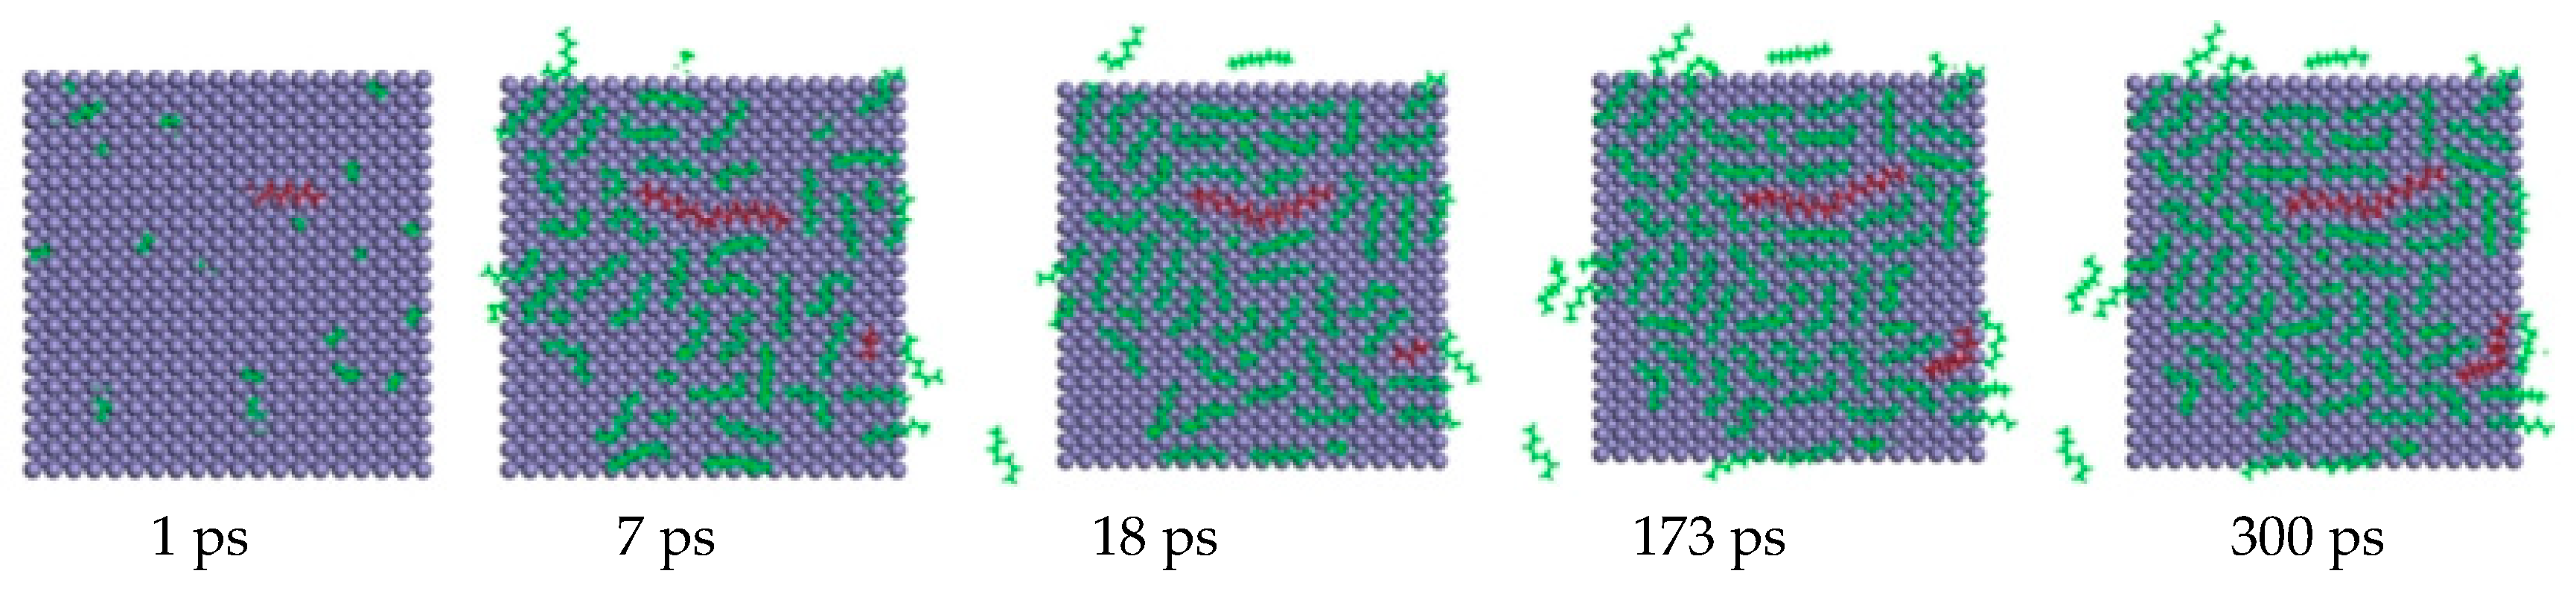
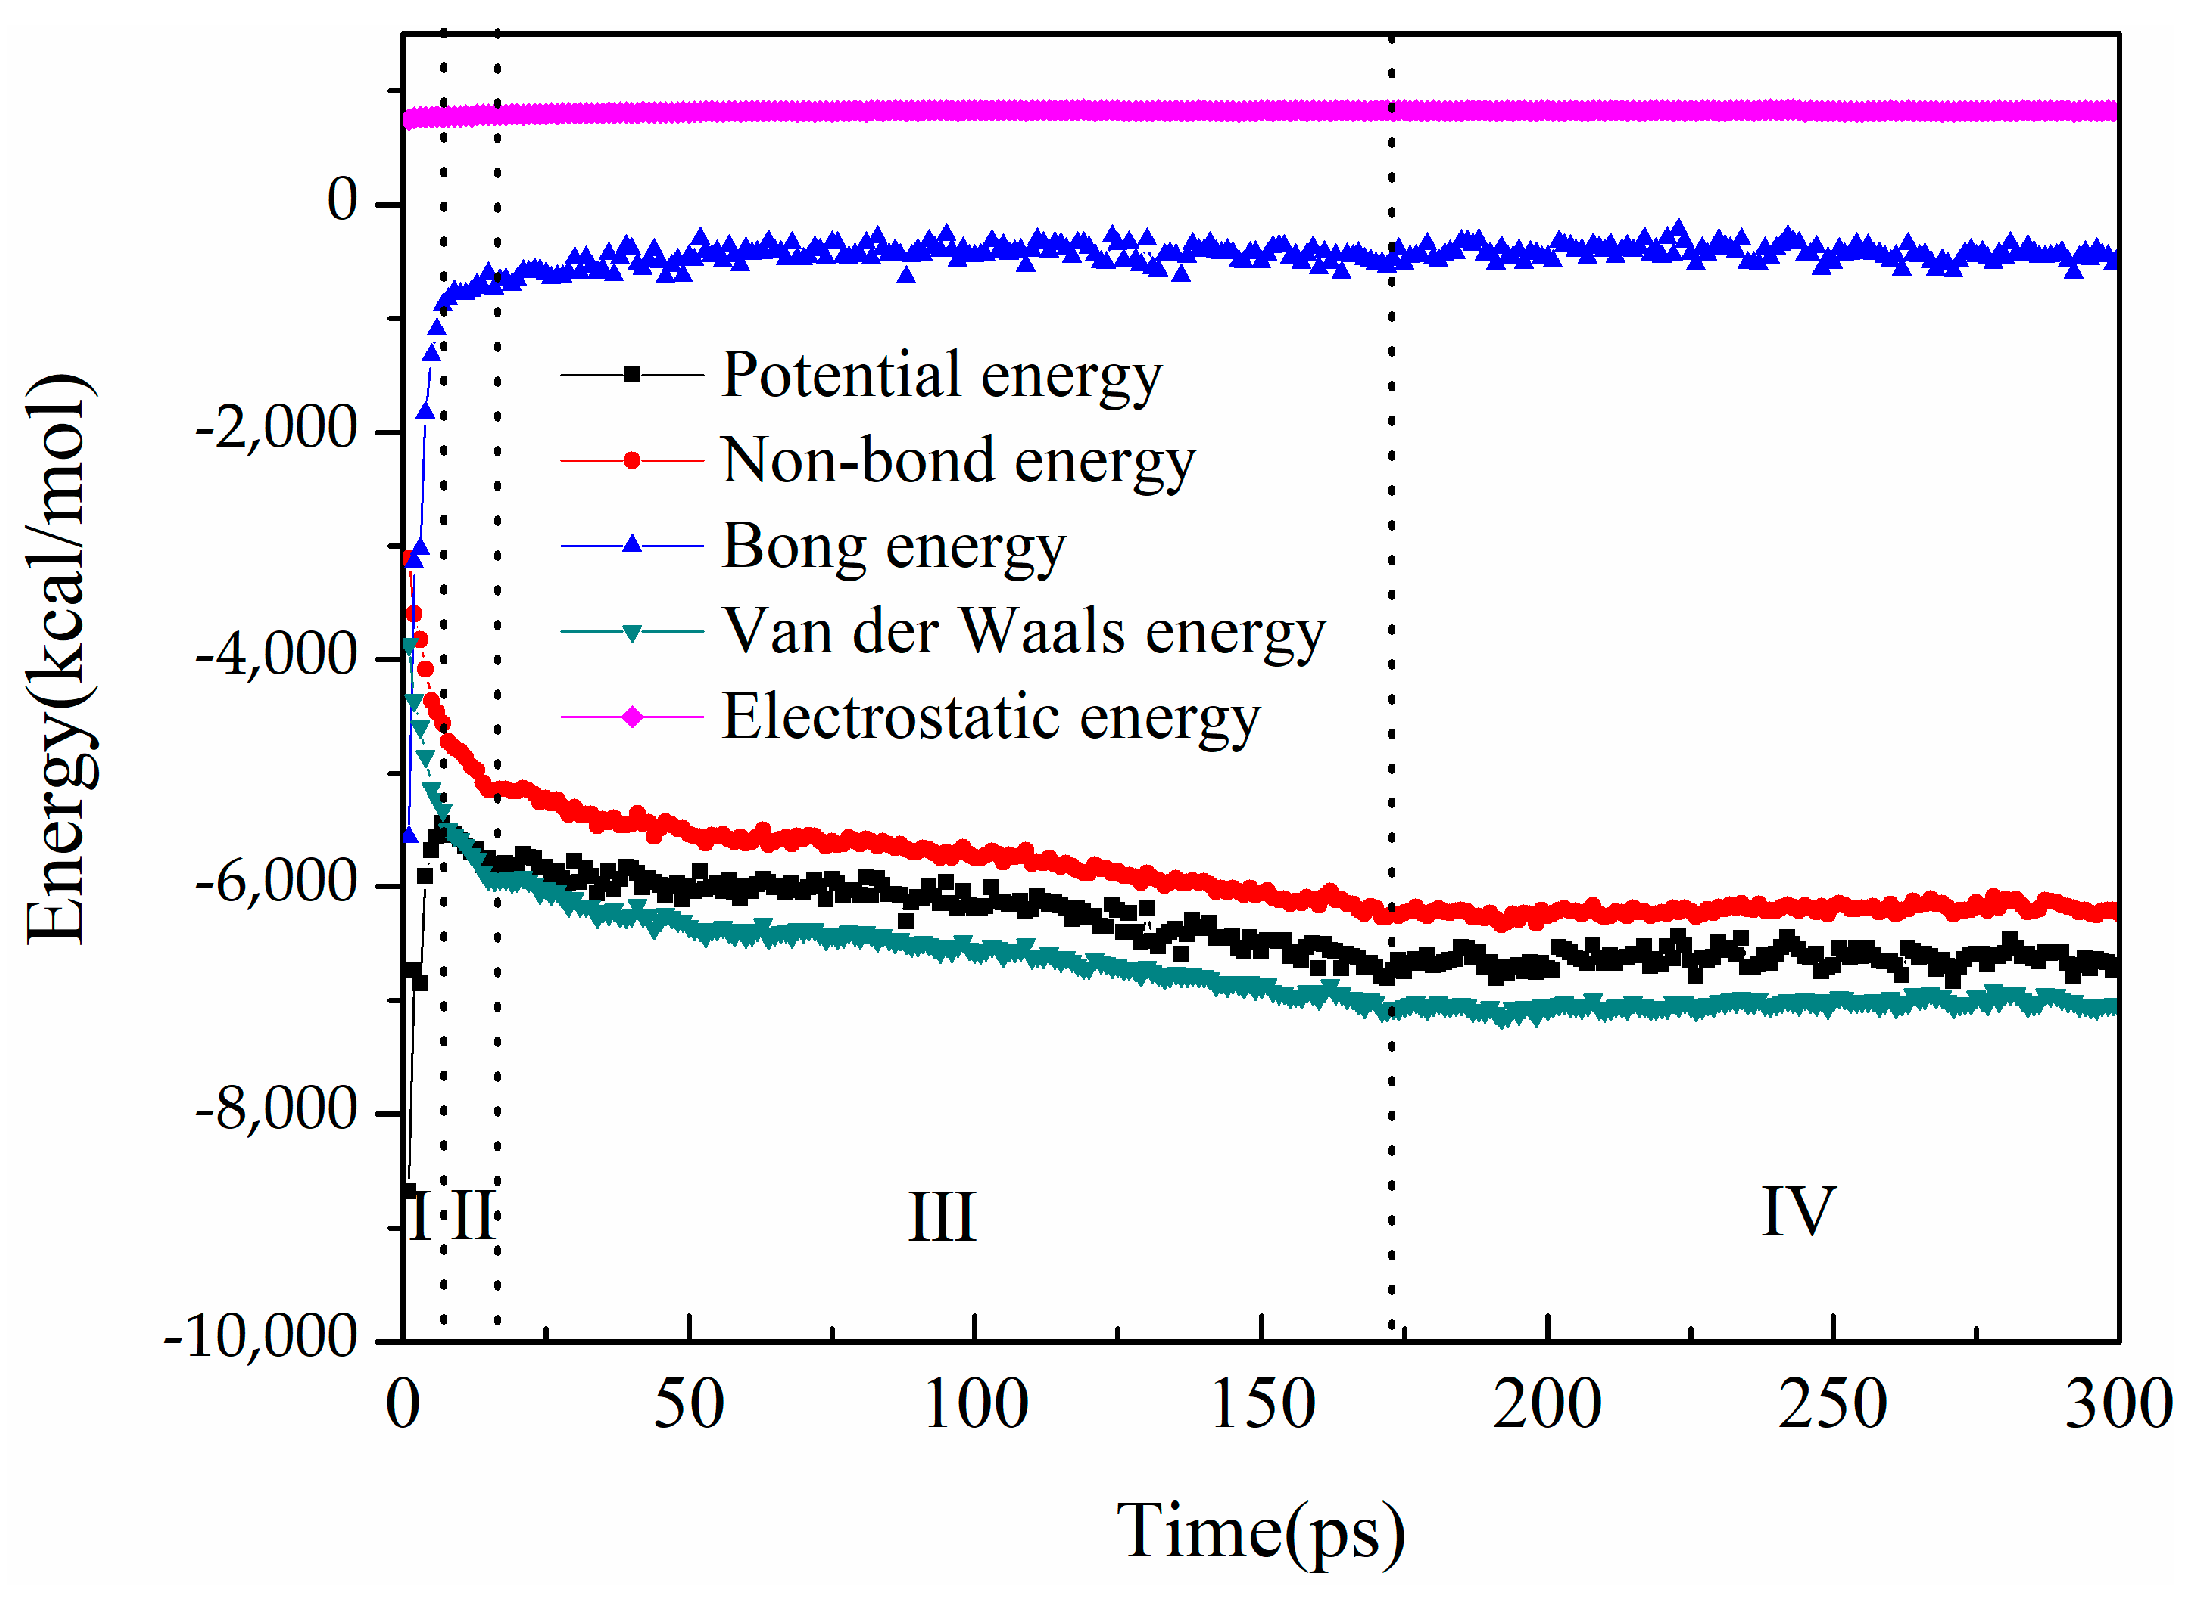
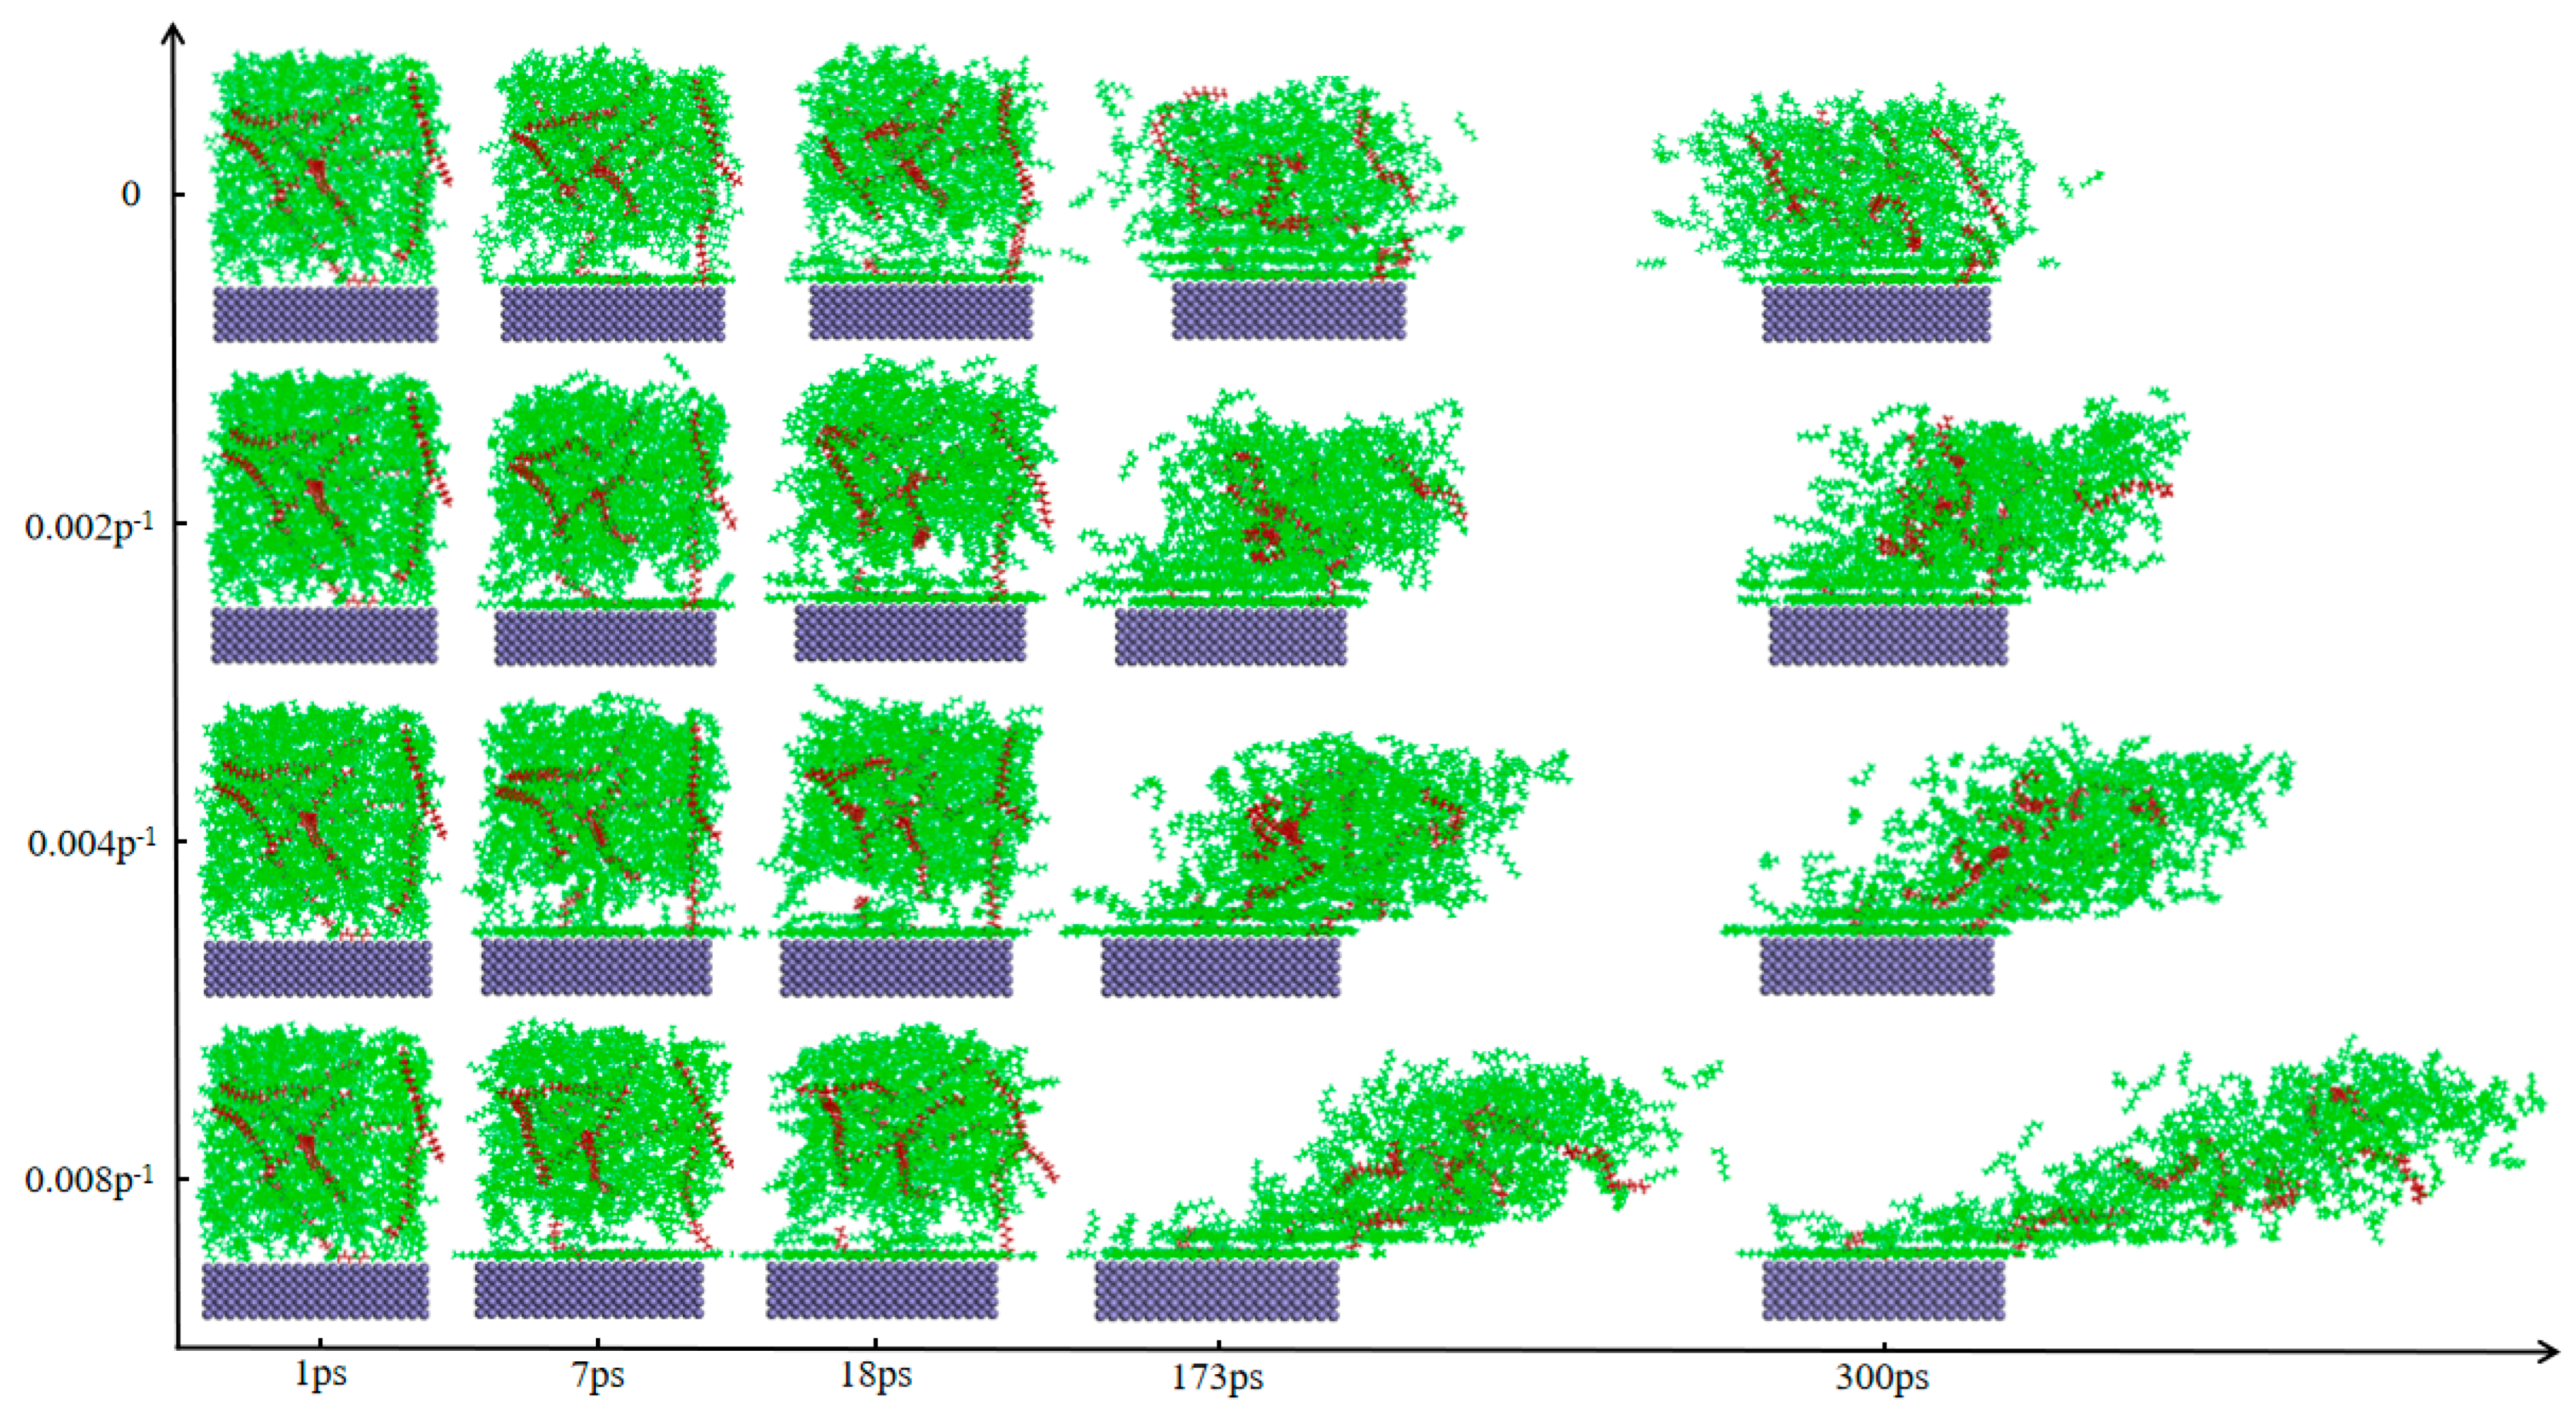
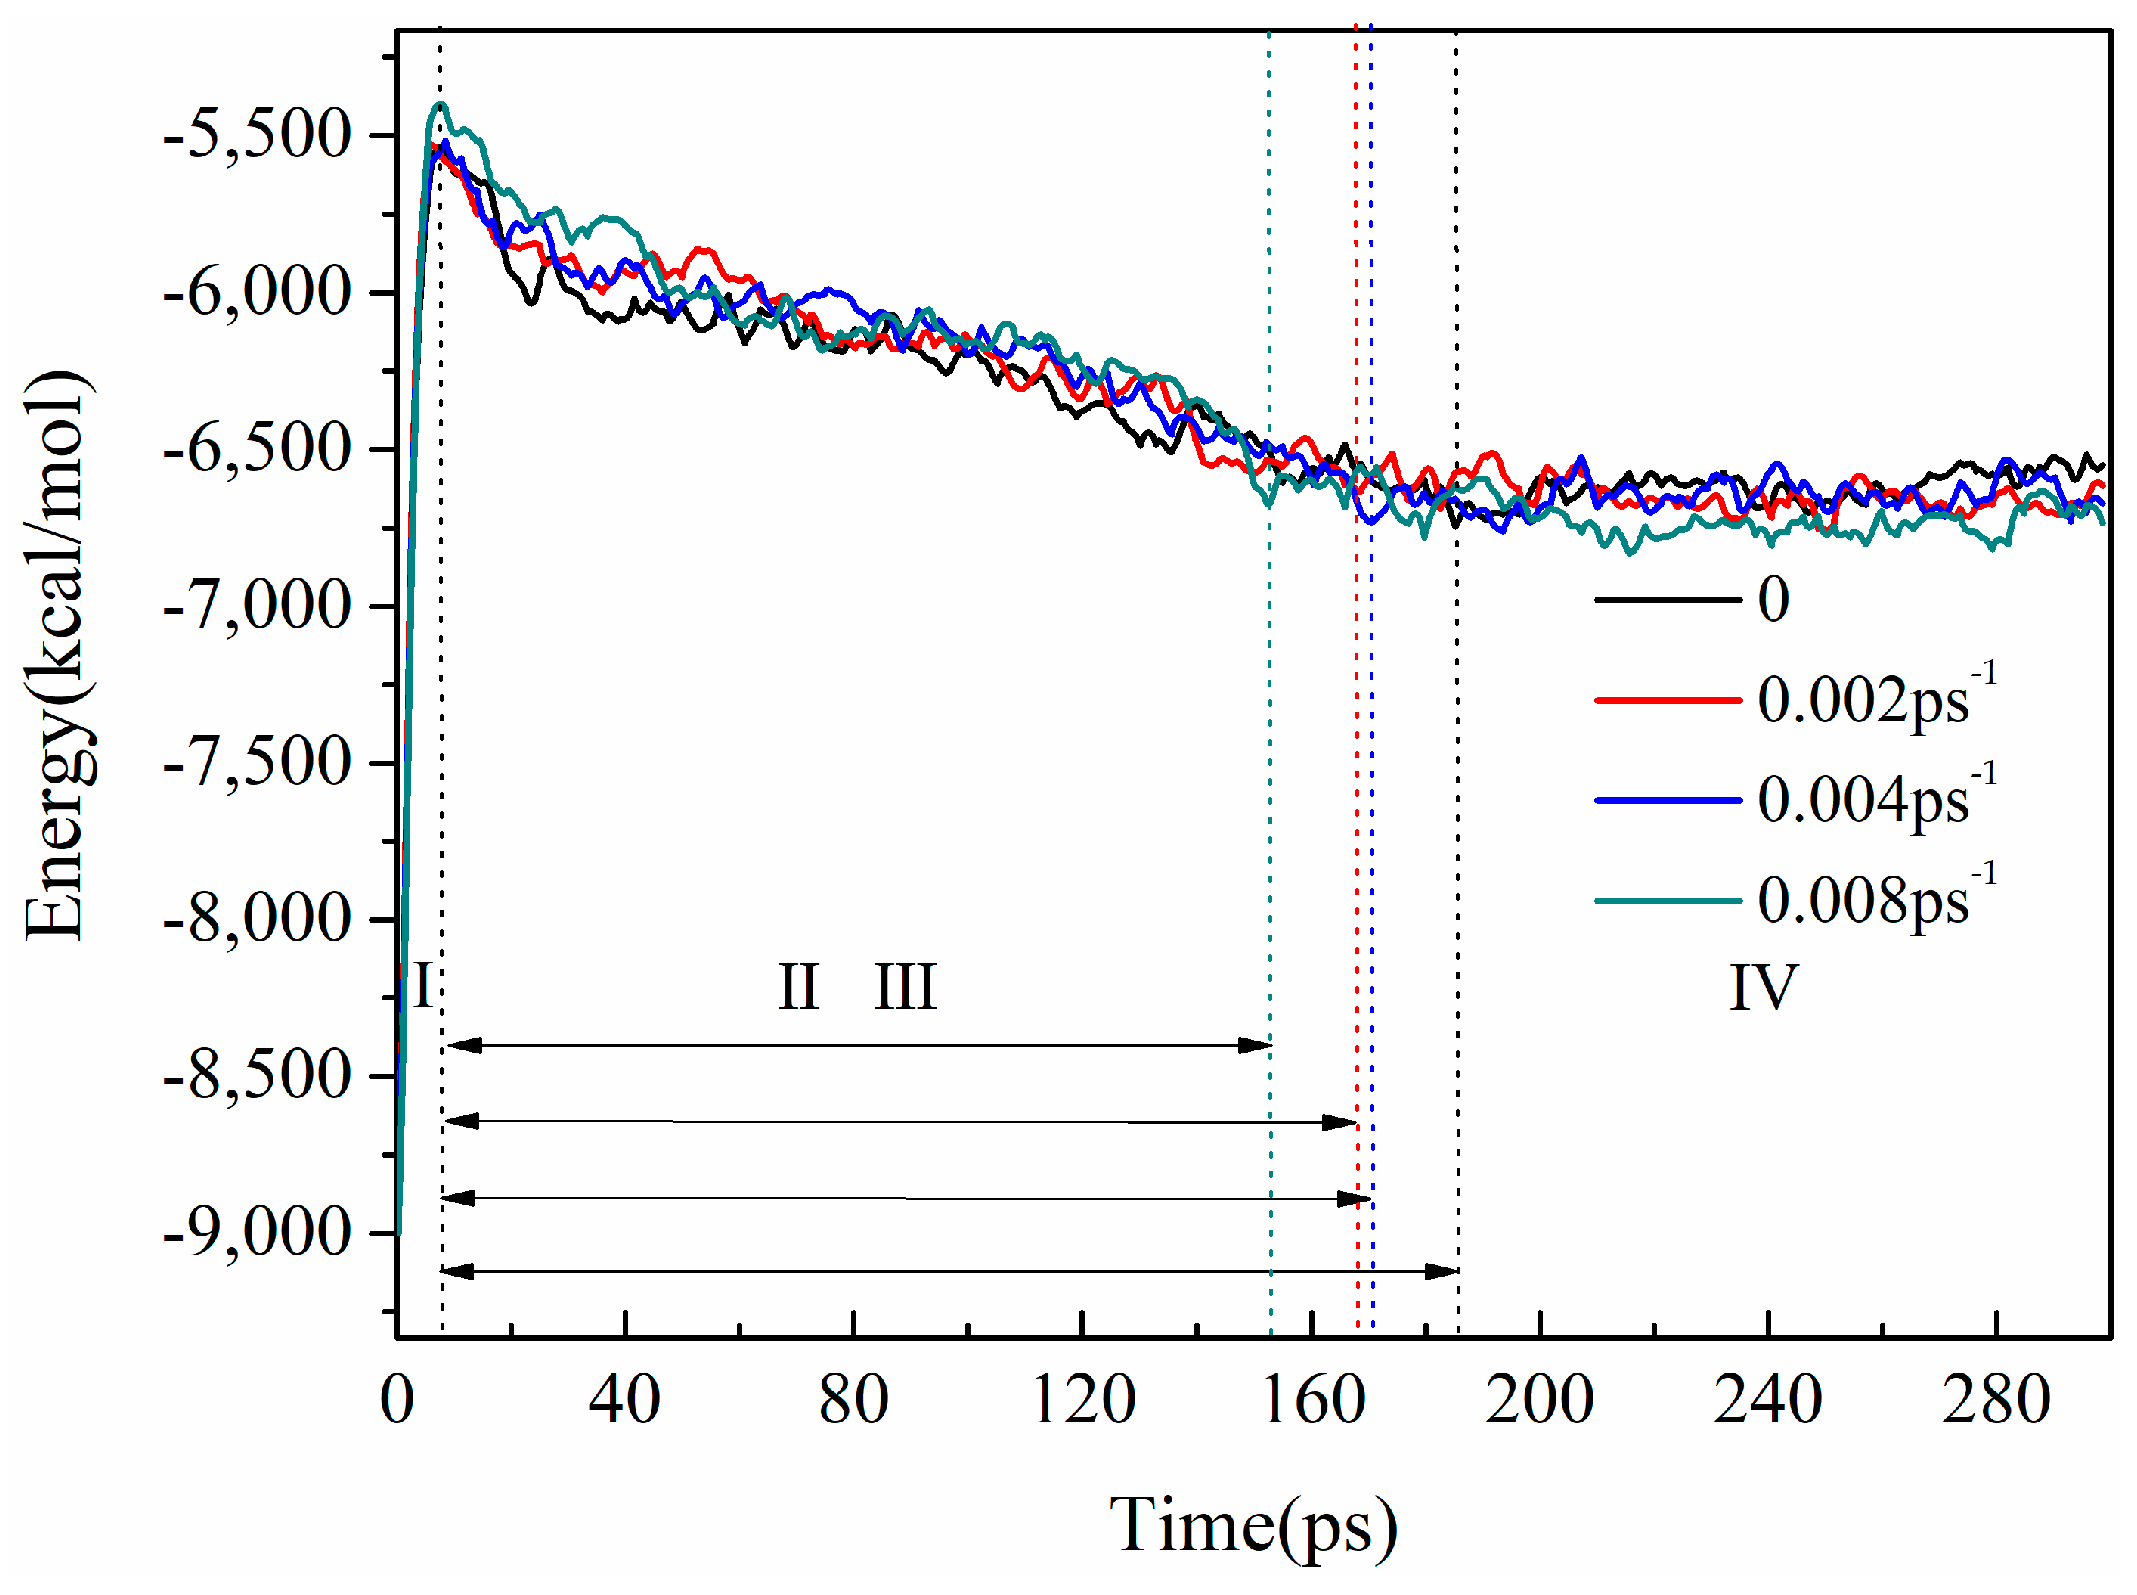
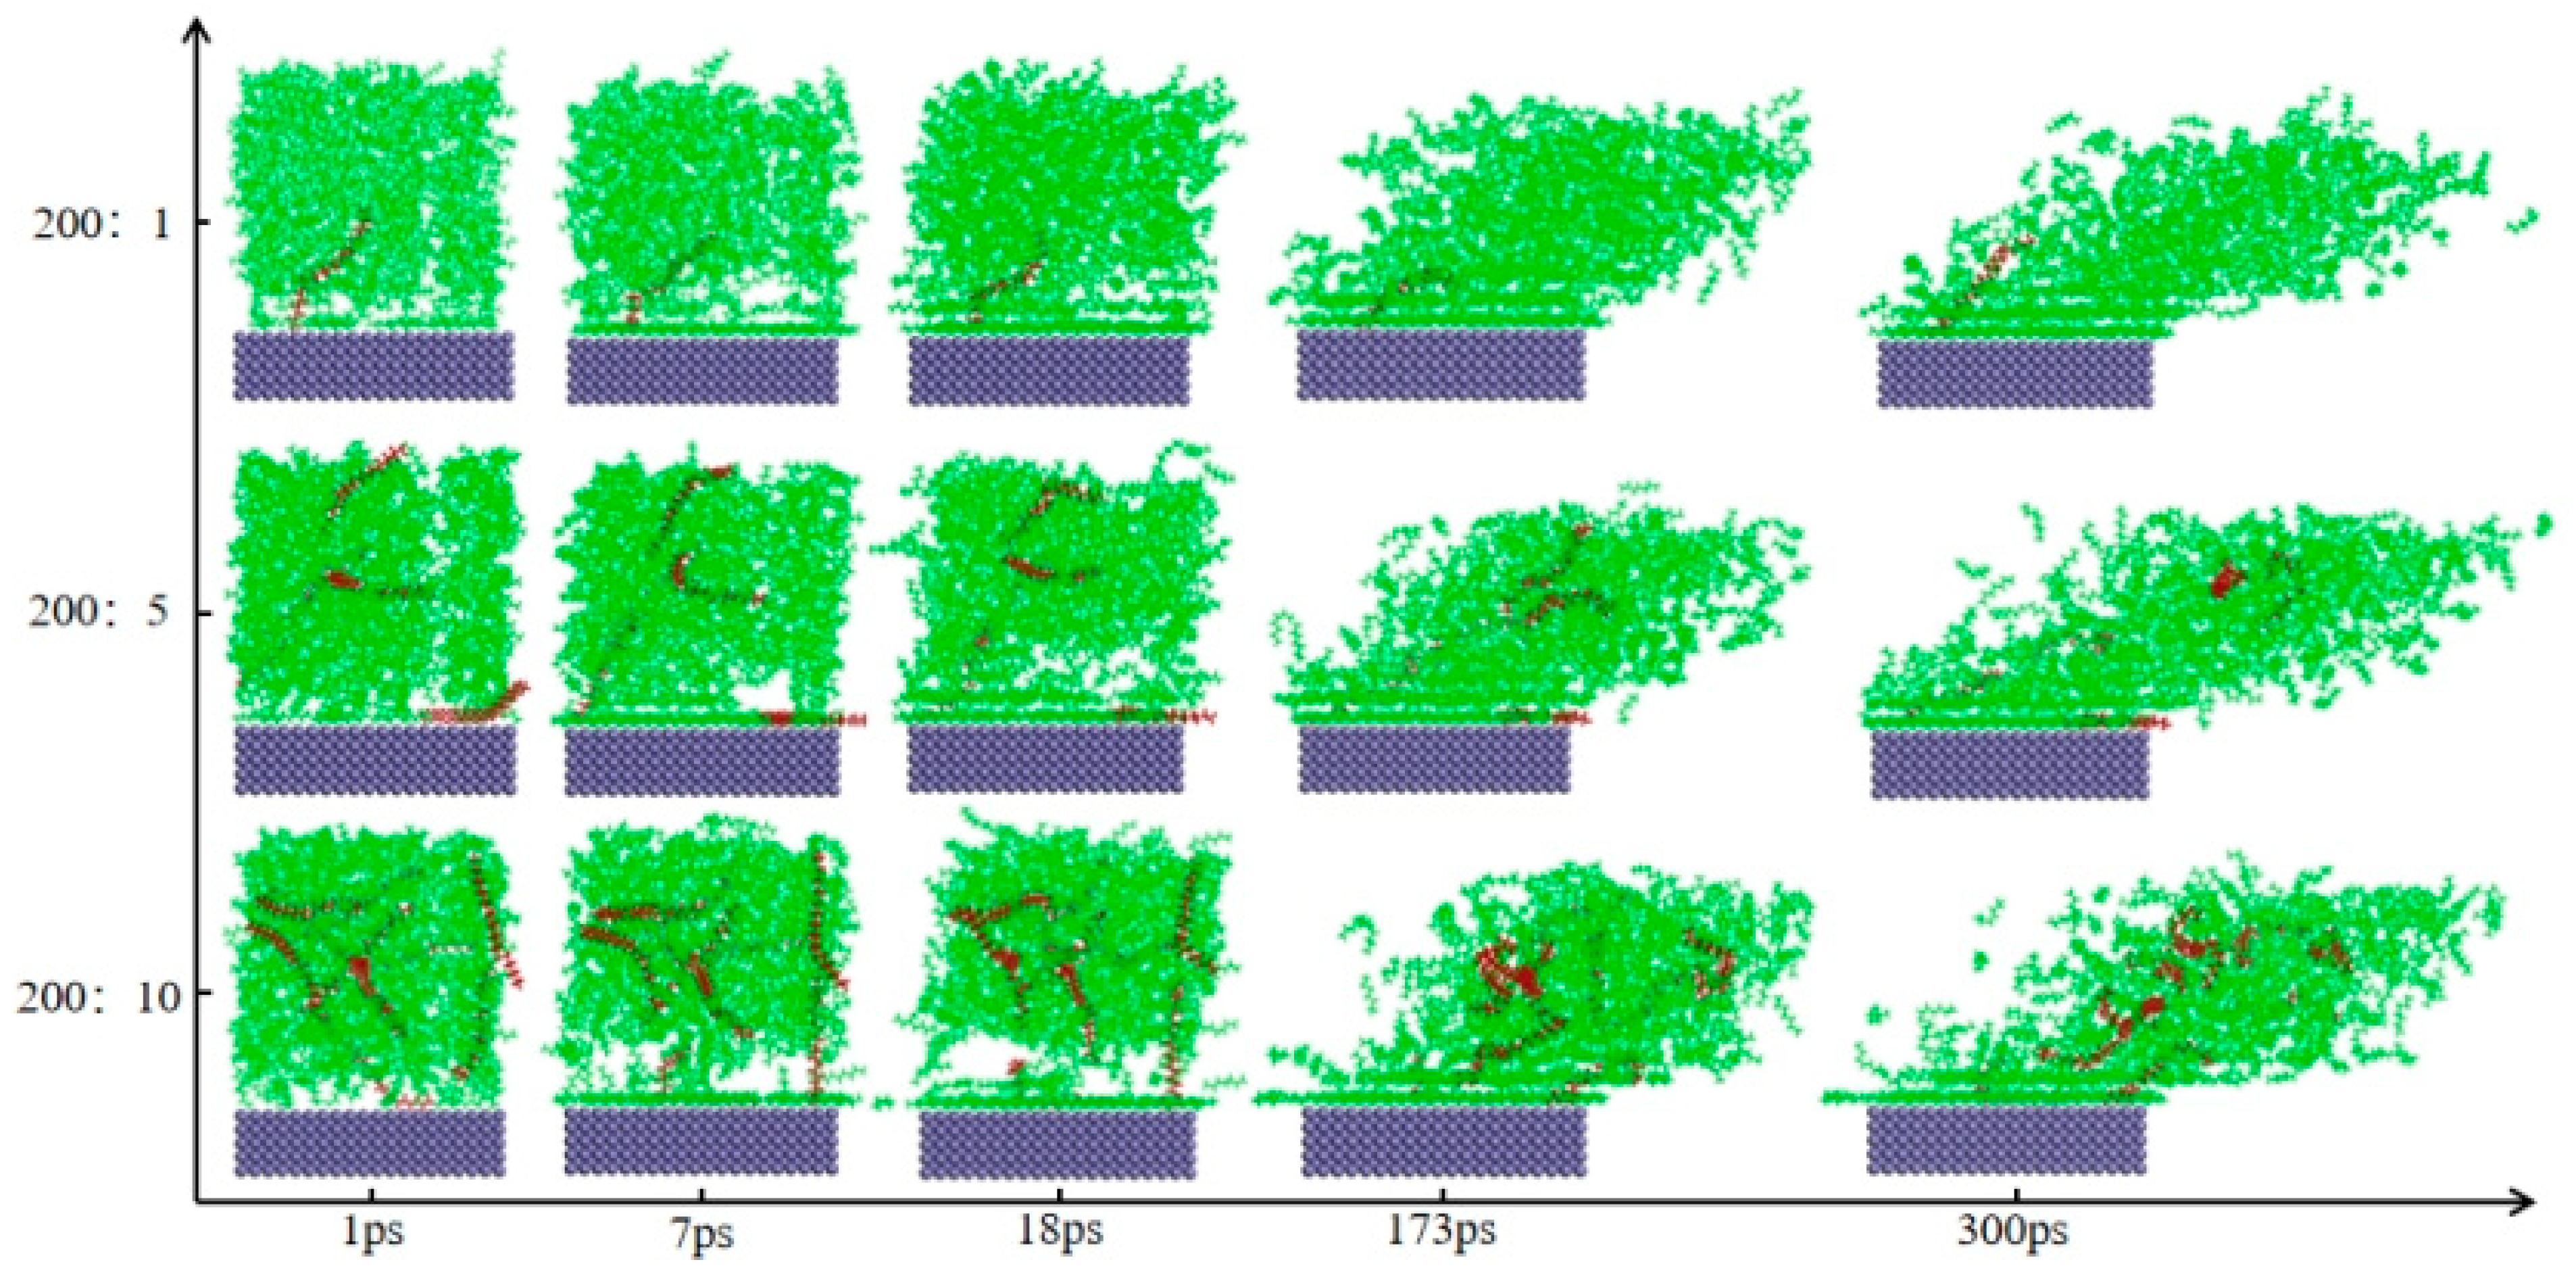
Four steps can be distinguished in the process of crude oil depositing on the surface of Fe when shear flow conditions are met. The molecules migrated onto the Fe surface during the first step of diffusion. During the second stage, two forms of deposition were formed when wax molecules were adsorbed onto a solid surface in parallel caused by Brownian motion. During the third and fourth phases, bridging effects and intermolecular interactions caused flocculants to form between the crude oil system and the deposited layer. The shearing motion causes the second and third deposition layers to gradually peel off and slip.
(3)
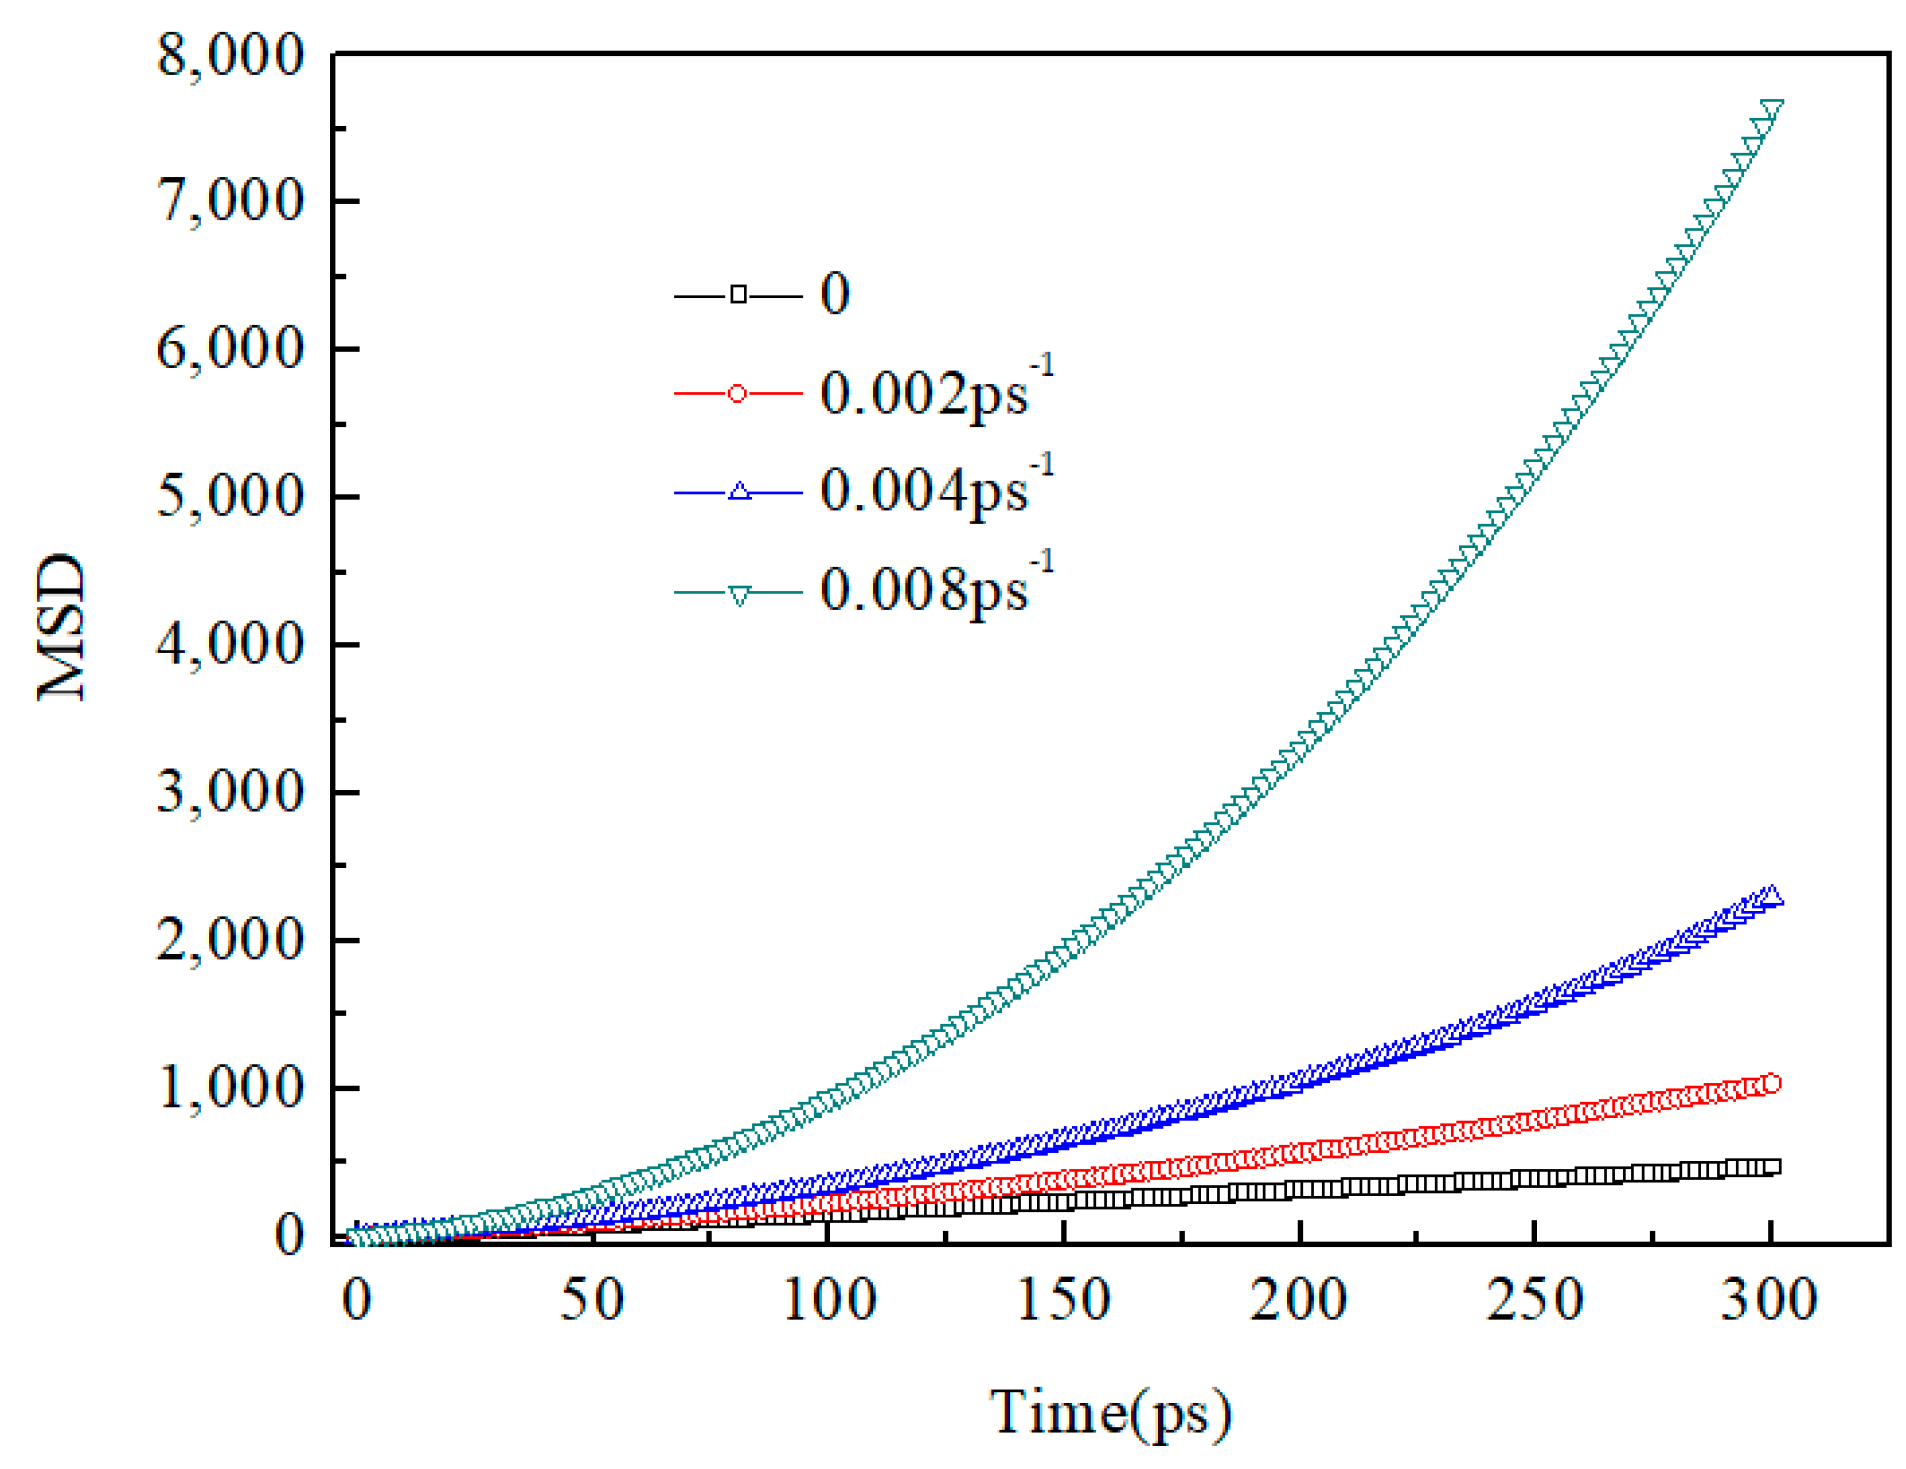
Under varying shear rates and wax contents, the process of crude oil systems’ wax deposition was comparable, and the thickness of different layers was constant. The vdW interaction was the primary force on deposition.
The interaction between molecules and Fe surface gradually strengthened with an increase in shear rate and wax content within the crude oil system. This promoted deposition and led to a higher accumulation of crude oil molecules within the deposition layer.

Author Contributions

Conceptualization, H.L. (Haibo Liu), C.Y., C.L. and B.L.; Methodology, H.L. (Haibo Liu), C.Y., J.Q., B.L. and H.L. (Haijun Luo); Writing—original draft, C.Y.; Writing—review & editing, C.Y. and B.L. All authors have read and agreed to the published version of the manuscript.

Funding

This work was supported by the Hebei Natural Science Foundation (E2023203064), the National Natural Science Foundation of China (42002162), the S&T Program of Qinhuangdao (202301A290), and the Natural Science Foundation of Guangdong Province (2023A1515030227).

Data Availability Statement

Data are contained within the article.

Conflicts of Interest

Authors Haibo Liu, Chao Yang and Chao Liu were employed by the company Technology Inspection Center of Shengli Oilfield. The remaining authors declare that the research was conducted in the absence of any commercial or financial relationships that could be construed as a potential conflict of interest.

References

  1. Li, B.; Guo, Z.; Du, M.; Han, D.; Han, J.; Zheng, L.; Yang, C. Research status and outlook of mechanism, characterization, performance evaluation, and type of pour point depressants in waxy crude oil: A Review. Energy Fuels 2024, 38, 7480–7509. [Google Scholar] [CrossRef]
  2. Azizollah, K. Asphaltene precipitation and inhibition in carbonate reservoirs. Pet. Sci. Technol. 2017, 35, 515–521. [Google Scholar]
  3. van der Geest, C.; Melchuna, A.; Bizarre, L.; Bannwart, A.C.; Guersoni, V.C. Critical review on wax deposition in single-phase flow. Fuel 2021, 293, 120358. [Google Scholar] [CrossRef]
  4. Ma, S.; Liu, Z.; Zheng, J.; Wu, Z.; Li, N.; Guan, X.; Han, J.; Yang, M.; Song, Y. Natural gas hydrate decomposition Characteristics at the exploitation anaphase via sediment warming. Energy Fuels 2024, 38, 14334–14342. [Google Scholar] [CrossRef]
  5. D’Avila, F.G.; Silva, C.M.F.; Steckel, L.; Ramos, A.C.S.; Lucas, E.F. Influence of asphaltene aggregation state on the wax crystallization process and the efficiency of EVA as a wax crystal modifier: A study using model systems. Energy Fuels 2020, 34, 4095–4105. [Google Scholar] [CrossRef]
  6. Singh, P.; Fogler, H.S.; Nagarajan, N. Prediction of the wax content of the incipient wax-oil gel in a pipeline: An application of the controlled-stress rheometer. J. Rheol. 1999, 43, 1437–1459. [Google Scholar] [CrossRef]
  7. Li, B.; Guo, Z.; Zheng, L.; Shi, E.; Qi, B. A comprehensive review of wax deposition in crude oil systems: Mechanisms, influencing factors, prediction and inhibition techniques. Fuel 2024, 357, 129676. [Google Scholar] [CrossRef]
  8. Matzain, A.; Apte, M.S.; Zhang, H.Q.; Volk, M.; Brill, J.P.; Creek, J.L. Investigation of paraffin deposition during multiphase flow in pipelines and well-bores-part 1: Experiments. J. Energy Resour. Technol. 2002, 123, 180–186. [Google Scholar] [CrossRef]
  9. Tinsley, J.F.; Prud’Homme, R.K.; Guo, X.; Adamson, D.H.; Callahan, S.; Amin, D.; Shao, S.; Kriegel, R.M.; Saini, R. Novel laboratory cell for fundamental studies of the effect of polymer additives on wax deposition from model crude oils. Energy Fuels 2007, 21, 1301–1308. [Google Scholar] [CrossRef]
  10. Hoffmann, R.; Amundsen, L. Single-phase wax deposition experiments. Energy Fuels 2010, 24, 1069–1080. [Google Scholar] [CrossRef]
  11. Soedarmo, A.A.; Daraboina, N.; Lee, H.S.; Sarica, C. Microscopic study of wax precipitation—Static conditions. Energy Fuels 2016, 30, 954–961. [Google Scholar] [CrossRef]
  12. Aiyejina, A.; Chakrabarti, D.P.; Pilgrim, A.; Sastry, M. Wax formation in oil pipelines: A critical review. Int. J. Multiph. Flow 2011, 37, 671–694. [Google Scholar] [CrossRef]
  13. Kannan, S.N.; Daraboina, N.; Venkatesan, R.; Sarica, C. Settling and re-entrainment of wax particles in near-gelling systems. AIChE J. 2017, 64, 765–772. [Google Scholar] [CrossRef]
  14. Janamatti, A.; Lu, Y.; Ravichandran, S.; Sarica, C.; Daraboina, N. Influence of operating temperatures on long-duration wax deposition in flow lines. J. Pet. Sci. Eng. 2019, 183, 106373. [Google Scholar] [CrossRef]
  15. Yang, J.; Lu, Y.; Daraboina, N.; Sarica, C. Wax deposition mechanisms: Is the current description sufficient? Fuel 2020, 275, 117937. [Google Scholar] [CrossRef]
  16. van der Geest, C.; Bizarre, L.; Melchuna, A.; Pinheiro, I.F.; Guersoni, V.C. Evidence that wax deposition is a phase transition rather than a molecular diffusion phenomenon. Fuel 2022, 313, 122940. [Google Scholar] [CrossRef]
  17. Santos, G.; Daraboina, N.; Sarica, C. Dynamic microscopic study of wax deposition: Particulate deposition. Energy Fuels 2021, 35, 12065–12074. [Google Scholar] [CrossRef]
  18. Van Der Geest, C.; Guersoni, V.C.B.; Merino-Garcia, D.; Bannwart, A.C. Wax deposition experiment with highly paraffinic crude oil in laminar single-phase flow unpredictable by molecular diffusion mechanism. Energy Fuels 2018, 32, 3406–3419. [Google Scholar] [CrossRef]
  19. Li, B.; Li, N.; Yang, M.; Liu, G.; Zheng, L.; Yang, C.; Qiao, W.; Jiao, T. Molecular dynamics simulation of yield thixotropy of crude oil systems. Colloids Surf. A Physicochem. Eng. Asp. 2022, 643, 128759. [Google Scholar] [CrossRef]
  20. Bai, S.; Kubelka, J.; Piri, M. Wettability reversal on dolomite surfaces by divalent ions and surfactants: An experimental and mo-lecular dynamics simulation study. Langmuir 2021, 37, 6641–6649. [Google Scholar] [CrossRef]
  21. Li, B.; Guo, Z.; Li, N.; Wang, D.; Li, G.; Zheng, L.; Qi, B.; Jiao, T. Molecular dynamics simulation of wax deposition in crude oil systems. Colloids Surf. A Physicochem. Eng. Asp. 2023, 674, 131965. [Google Scholar] [CrossRef]
  22. Gan, Y.; Cheng, Q.; Wang, Z.; Yang, J.; Sun, W.; Liu, Y. Molecular dynamics simulation of the nucleation and gelation process for a waxy crude oil multiphase system under different physical–chemical influencing factors. Energy Fuels 2019, 33, 7305–7320. [Google Scholar] [CrossRef]
  23. Gan, Y.; Cheng, Q.; Wang, Z.; Yang, J.; Sun, W.; Liu, Y. Molecular dynamics simulation of the microscopic mechanisms of the dissolution, diffusion and aggregation processes for waxy crystals in crude oil mixtures. J. Pet. Sci. Eng. 2019, 179, 56–69. [Google Scholar] [CrossRef]
  24. San-Miguel, M.A.; Rodger, P.M. Wax deposition onto Fe2O3 surfaces. Phys. Chem. Chem. Phys. 2002, 5, 575–581. [Google Scholar] [CrossRef]
  25. Zhang, J.; Zhang, M.; Wan, J.; Li, W. Theoretical study of the prohibited mechanism for Ethylene/Vinyl Acetate co-polymers to the wax crystal growth. J. Phys. Chem. B 2008, 112, 36–43. [Google Scholar] [CrossRef] [PubMed]
  26. Ren, B.; Min, F.; Liu, L.; Chen, J.; Liu, C.; Lv, K. Adsorption of different PAM structural units on kaolinite (001) surface: Density functional theory study. Appl. Surf. Sci. 2019, 504, 144324. [Google Scholar] [CrossRef]
  27. Quezada, G.R.; Jeldres, R.I.; Fawell, P.D.; Toledo, P.G. Use of molecular dynamics to study the conformation of an anionic polyelectrolyte in saline medium and its adsorption on a quartz surface. Miner. Eng. 2018, 129, 102–105. [Google Scholar] [CrossRef]
  28. Sun, W.Y.; Zeng, H.B.; Tang, T. Synergetic adsorption of polymers on montmorillonite: Insights from molecular dynamics simulations. Appl. Clay Sci. 2020, 193, 105654. [Google Scholar] [CrossRef]
  29. Xia, Y.; Rong, G.; Xing, Y.; Gui, X. Synergistic adsorption of polar and nonpolar reagents on oxygen-containing graphite surfaces: Implications for low-rank coal flotation. J. Colloid Interface Sci. 2019, 557, 276–281. [Google Scholar] [CrossRef]
  30. Jeldres, M.; Jeldres, R.I.; Toro, N.; Quezada, G.R.; Robles, P.; Toledo, P.G. Understanding the flocculation mechanism of quartz and kaolinite with polyacrylamide in seawater: A molecular dynamics approach. Colloids Surf. A Physicochem. Eng. Asp. 2021, 608, 125576. [Google Scholar] [CrossRef]
  31. Martin, M.G. Comparison of the AMBER, CHARMM, COMPASS, GROMOS, OPLS, TraPPE and UFF force fields for prediction of vapor-liquid coexistence curves and liquid densities. Fluid Phase Equilibria 2006, 248, 50–55. [Google Scholar] [CrossRef]
  32. Zhong, J.; Wang, X.; Du, J.; Wang, L.; Yan, Y.; Zhang, J. Combined molecular dynamics and quantum mechanics study of oil droplet adsorption on different self-assembly monolayers in aqueous solution. J. Phys. Chem. C 2013, 117, 12510–12519. [Google Scholar] [CrossRef]
  33. Sato, Y.; Hayami, R.; Miyase, Y.; Ideno, Y.; Yamamoto, K.; Gunji, T. Preparation and properties of methyl- and cyclohexylsilsesquioxane oligomers as organic-inorganic fillers. J. Sol-Gel Sci. Technol. 2020, 95, 474–481. [Google Scholar] [CrossRef]
  34. Burger, E.; Perkins, T.; Striegler, J. Studies of wax deposition in the Trans Alaska pipeline. J. Pet. Technol. 1981, 33, 1075–1086. [Google Scholar] [CrossRef]
  35. Zeng, J.P.; Dai, Y.; Shi, W.Y.; Shao, J.L.; Sun, G.X. Molecular dynamics simulation on the interaction between polymer inhibitors and anhydrite surface. Surf. Interface Anal. 2015, 47, 896–902. [Google Scholar] [CrossRef]
  36. Allinger, N.L.; Zhou, X.; Bergsma, J. Molecular mechanics parameters. J. Mol. Struct. Theochem. 1994, 312, 69–83. [Google Scholar] [CrossRef]
  37. Dickinsona, E.; Eriksson, L. Particle flocculation by adsorbing polymers. Adv. Colloid Interface Sci. 1991, 43, 1–29. [Google Scholar] [CrossRef]
  38. Fan, K.F. Wax Deposition of Waxy Crude Oil and Water-in-Oil Emulsion. Ph.D. Thesis, China University of Petroleum, Beijing, China, 2017. (In Chinese). [Google Scholar]
  39. Creek, J.; Lund, H.J.; Brill, J.P.; Volk, M. Wax deposition in single phase flow. Fluid Phase Equilibria 1999, 158–160, 801–811. [Google Scholar] [CrossRef]
  40. Venkatesan, R. The Deposition and Rheology of Organic Gels. Ph.D. Thesis, University of Michigan, Ann Arbor, MI, USA, 2004. [Google Scholar]
  41. Joanny, J. Polymers at interfaces. Interface Sci. 2003, 11, 157–158. [Google Scholar] [CrossRef]
  42. Ren, B.; Lv, K.; Min, F.; Chen, J.; Liu, C. A new insight into the adsorption behavior of NPAM on kaolinite/water interface: Experimental and theoretical approach. Fuel 2021, 303, 121299. [Google Scholar] [CrossRef]
  43. Li, C.X.; Bai, F.; Wang, Y. Influence of crude oil composition on wax deposition on tubing wall. CIESC J. 2014, 65, 4571–4578. [Google Scholar]
Figure 1. Wax deposition physical model. (a) Fe surface structure. (b) Crude oil molecular structures, (gray color for C and white for H). (c) Schematic diagram of the Couette flow shear model. (d) Computational model for wax deposition (green for C7H16 and red for C26H54 with molecules ratio of 200:10).
Processes 12 01774 g001
Figure 2. Feature of deposited wax in different simulated times (blue/green for C7H16 and red for C26H54).
Processes 12 01774 g002
Figure 3. Overhead conformation of the first deposited layer. (green for C7H16 and red for C26H54).
Processes 12 01774 g003
Figure 4. System energy with simulated time.
Processes 12 01774 g004
Figure 5. Concentration distributions curve along the Z-axis. (a) Concentration distribution at different times (b) Conformation at 300 ps (blue/green for C7H16 and red for C26H54).
Processes 12 01774 g005
Figure 6. Conformations of wax deposition for different shear rates.
Processes 12 01774 g006
Figure 7. Concentration distributions along the Z-axis.
Processes 12 01774 g007
Figure 8. Potential energy over time for different shear rates.
Processes 12 01774 g008
Figure 9. MSD over time.
Processes 12 01774 g009
Figure 10. Total and vdW interaction energies for different shear rates.
Processes 12 01774 g010
Figure 11. Conformations of wax deposition for different configurations.
Processes 12 01774 g011
Figure 12. Concentration distributions along the Z-axis.
Processes 12 01774 g012
Figure 13. Potential energy over time.
Processes 12 01774 g013
Figure 14. MSD curves over time.
Processes 12 01774 g014
Figure 15. Total and vdW interaction energies.
Processes 12 01774 g015
Disclaimer/Publisher’s Note: The statements, opinions and data contained in all publications are solely those of the individual author(s) and contributor(s) and not of MDPI and/or the editor(s). MDPI and/or the editor(s) disclaim responsibility for any injury to people or property resulting from any ideas, methods, instructions or products referred to in the content.

