Abstract
Steam flooding is easily induced to transverse flow, with a limited swept area and low displacement efficiency. Therefore, chemical agents have been used to assist in steam flooding for heavy oil extraction. However, research into the driving mechanisms and modes of occurrence of residual oil is insufficient. In this work, a flooding simulation was conducted to understand the occurrence mechanism of residual oil during the flooding process in heavy oil reservoirs. First, the foam properties of a novel DES (Deep Eutectic Solvent) and CTAB (Cetyltrimethyl Ammonium Bromide) composite system with ultra-low interfacial tension were tested. The optimal concentration and gas–liquid ratio of the foam agent solution were determined. Secondly, the NFAS (N2 foam-assisted steam flooding) was carried out after steam flooding, and the flow behavior of crude oil at different flow pathway zones was researched. In the end, the remaining oil morphology and distribution characteristics under different displacement times were analyzed, determining the mode of remaining oil occurrence during NFAS flooding. The results show that (1) the novel DES and CTAB system has good foam properties. The best concentration is 0.5 wt%, and the optimal ratio of gas to liquid is 1:1. (2) In the steam flooding stage, the columnar remaining oil in the narrow hole near the flow pathway increases, and the cluster remaining oil in the far flow channel changes into film and columnar. (3) During NFAS displacement, the residual oil primarily presents a state of fully mixing the O/W emulsion formed after blending and dispersing with oil, gas, and water. (4) After the NFAS flooding stage, the remaining oil was distributed in each throat. The remaining oil in the near passage is mostly blocked by foam in large holes with a pore coordination number of 4 and 5. The residual oil in the distant runner is distributed in the thick and middle throats. (5) NFAS flooding outperforms steam flooding by significantly decreasing residual oil in narrow passages of the main flow channel and near flow channels, resulting in a substantial 44.9% increase in overall recovery rate.
1. Introduction
Because of the distribution of heavy oil viscosity, over 60% of heavy oil reservoirs worldwide use thermal recovery due to viscosity exceeding 500 mPa·s. For complex conditions, single CO2 flooding is inadequate [1]. Multiple composite flooding technologies like steam-assisted gravity drainage, dissolver CO2 steam, and horizontal well dissolver CO2 steam have emerged [2]. International scholars developed a multi-component composite flooding with N2 and viscosity-reducing technology for heavy oil reservoirs. N2 assists in the steam flooding of heavy oil, enlarging the water phase swept zone and increasing oil phase permeability. Foam flooding, an important technique for improving recovery [3], includes foam-assisted gravity production in fractured reservoirs [4]. At the same time, it can be seen that the foam flooding effect depends on the gas volume fraction and increasing foam mass decreases foam quantity and strength [5,6]. Foam structure significantly affects foam viscosity and mobility in smooth crack models [7], with the surface tension gradient having minimal impact. Moreover, a high temperature and high-salinity conditions facilitate the low-tension foam system in porous media, making it easy to produce small and abundant foam with faster foaming but a longer duration. A good foam agent performs better under high-pressure conditions. Foam exhibits a trapping phenomenon in porous media; gas trapping decreases with a higher gas injection rate but not significantly with a higher liquid injection rate [8,9]. N2 foam tends to be smaller and more stable than CO2 foam and more efficiently recovers oil in porous media than CO2 foam in displacement experiments [10].
Sand pipe filling and visualization experiments have verified that N2 foam inhibits gas channeling, and improves swept volume and then heavy oil recovery [11,12,13]. For N2 huff-and-puff experiments, the enhancement in recovery efficiency decreases as the injection cycle lengthens [14,15]. Through the study of N2-assisted gravity flooding technology, it is found that this technology has a good recovery effect, and the water cut will be reduced [16]. Developing a potent blowing agent for harsh reservoirs, a high concentration and pressure boosts foam stability [17]. With the help of the mathematical model, it is found that the efficiency of the oil displacement of N2 flooding is related to the injection medium, density difference, gravity, and other factors at a constant temperature [18]. The mathematical simulation of N2 flooding in the heavy oil reservoir shows that it can improve oil and gas recovery [19]. Conducting lab tests, achieving an ultra-low interfacial tension and strong foaming with SDS addition, prepares composite displacement systems [20,21,22,23]. Tao et al. clarified injection rounds’ impact on N2 foam flooding with a viscosity-reducing agent, introducing a resistivity–oil saturation conversion method [24]. Similarly, Shi et al. have finished some displacement experiments on CO2 foam to help steam flooding and N2 foam-assisted chemical flooding [25,26]. Other scholars are also using different mathematical models to simulate the relationship of thermal conditions in different formations and to put forward optimization plans for mining [27,28,29,30,31,32,33].
The results of the study of the feasibility of N2 flooding in the Shengli oilfield, including laboratory tests and numerical simulations, show that N2 injection in the hyperpermeability layer can improve production rate [34]. In Karamay Oilfield, mixed injection had a significantly higher recovery than alternatives, and a gas–liquid ratio between 3:1 and 5:1 achieved peak oil displacement efficiency [35]. For low-output wells, low N2 injection and multiple production cycles reduced the water cut and improved oil recovery [36]. The impact of reservoir dynamic factors on oil displacement is researched by computer modeling. The results display that the dip angle and the specific gravity of crude oil are the key factors, and the top N2 injection can increase the recovery rate by 20% [37].
Currently, the EOR technology of N2 foam-assisted steam flooding is being used in heavy oilfields, such as Shengli and Xinjiang Oilfield. Field results show that adding an N2 foam viscosity reducer after steam flooding to assist steam flooding can effectively increase crude oil production. However, the mechanism by which foam-assisted steam flooding enhances heavy oil recovery remains ambiguous. To address this deficiency, our research began with an examination of the flow characteristics and the persistence of residual oil. In our work, the etched glass model was used to survey the flow behavior and condition of residual oil in different periods with the help of N2 foam in steam flooding, which provided a reference for the subsequent N2 foam experiment.
2. Materials and Methods
2.1. Formation Water
Water for the experiment, CaCl2, and MgCl2 are prepared to simulate strata conditions. The overall mineral content is 45,000 mg/L, with a Ca2+ concentration of 1500 mg/L, and an Mg2+ concentration of 450 mg/L.
2.2. Crude Oil
Experimental crude oil comes from the Shengli Oilfield and has been dehydrated. Its density is 0.958 g/cm3, with a composition of 32.33% saturated hydrocarbon, 31.87% aromatic, 27.06% resin, and 8.74% asphaltene.
2.2.1. Crude Oil Viscosity
An Anton Paar MCR 302 rheometer (Anton Paar Group, Graz, Austria) is used to measure the viscosity of crude oil. The instrument was configured with a 1.00 mm gap, a shear rate of 7 s−1, a normal force of 0.11 N, and a temperature ramp from 30 to 120 °C over 30 min. The resulting dataset (Figure 1) illustrates the viscosity–temperature relationship expressed by the equation μ = 6 × 10⁸T−3.535, where μ is viscosity in mPa·s and T is the temperature in °C.
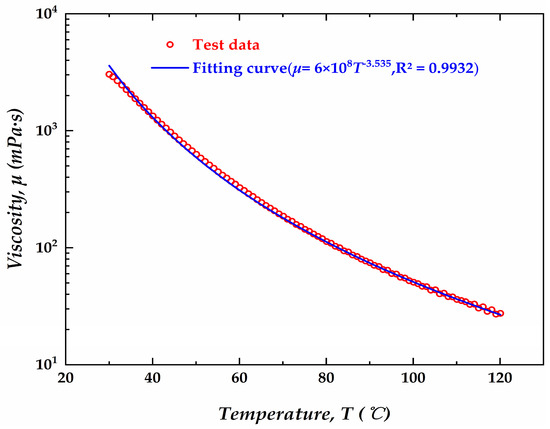
Figure 1.
Relationship between the viscosity and temperature.
2.2.2. Oil–Water Interfacial Tension (IFT)
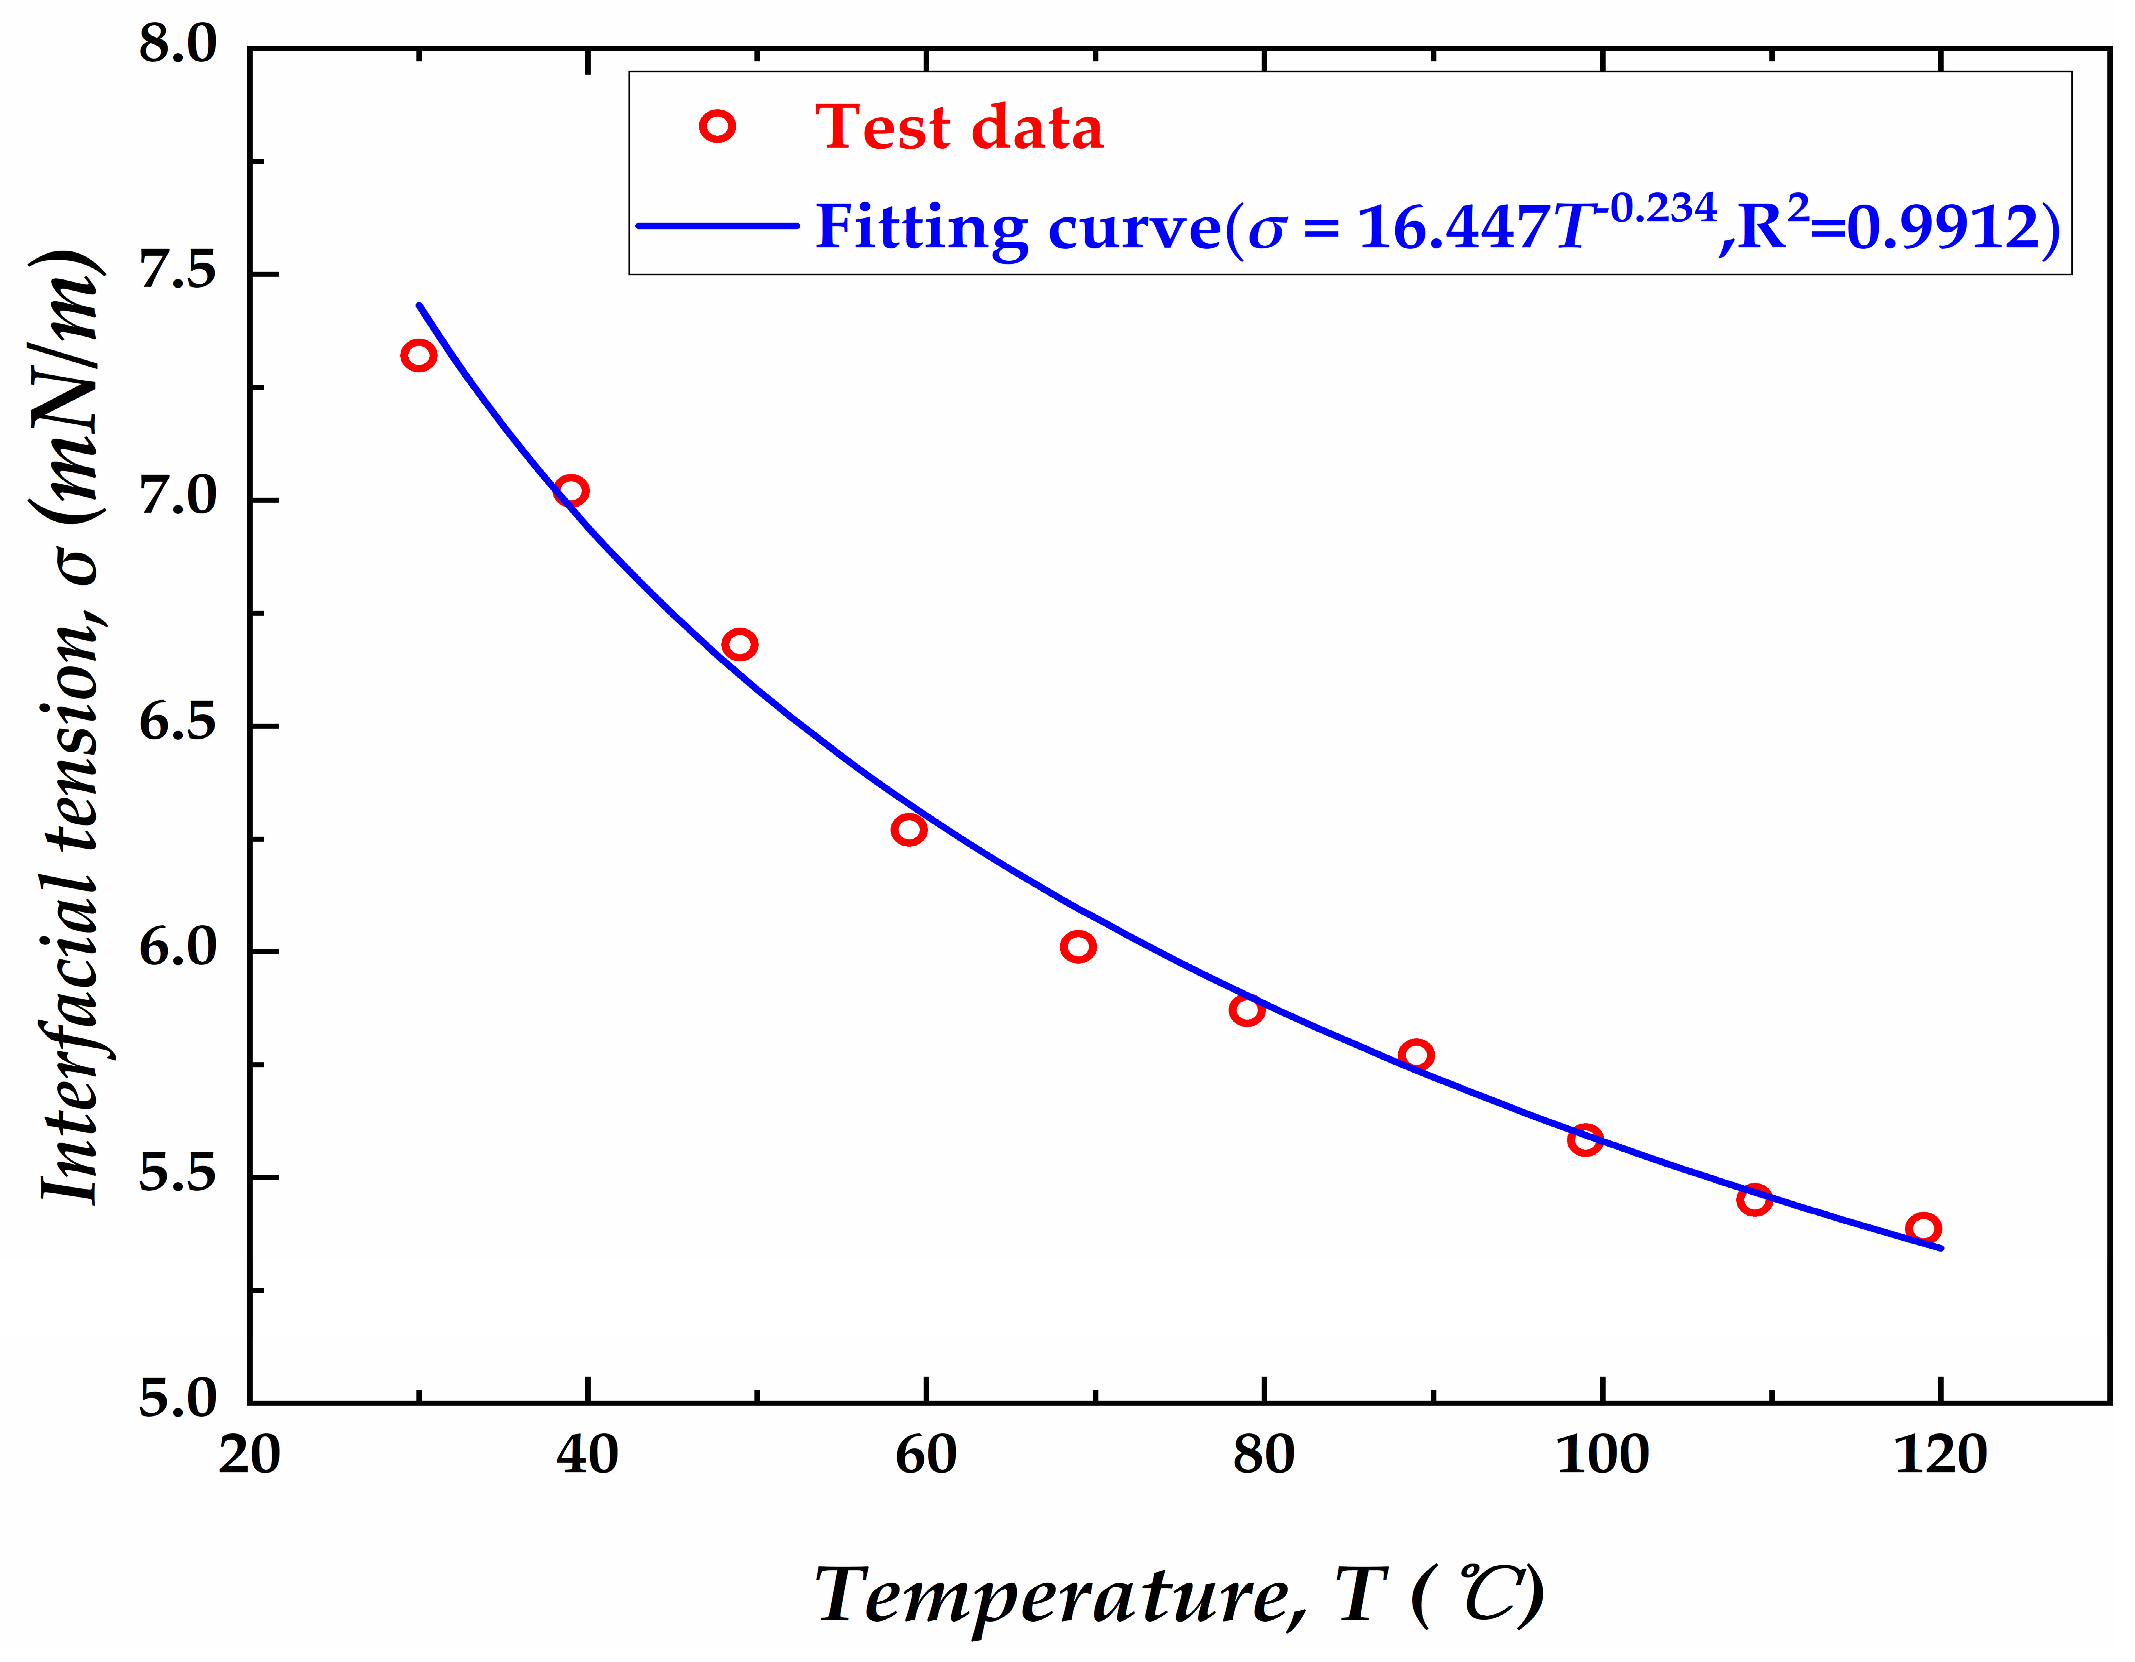
The following two steps should be followed: Introduce the mixture of formation water and crude oil into the TX-500C rotating IFT device (Shanghai Solon Information Technology Co., LTD., Shanghai, China). Conduct testing within a temperature range of 30 °C to 120 °C at 10 °C intervals, with a rotational speed set to 5000 rpm. Analysis of the test results reveals a mathematical correlation between oil–water interfacial tension and temperature (Figure 2), described by the equation σ = 16.447T−0.234, where σ denotes interfacial tension in mN/m and T represents temperature in °C.
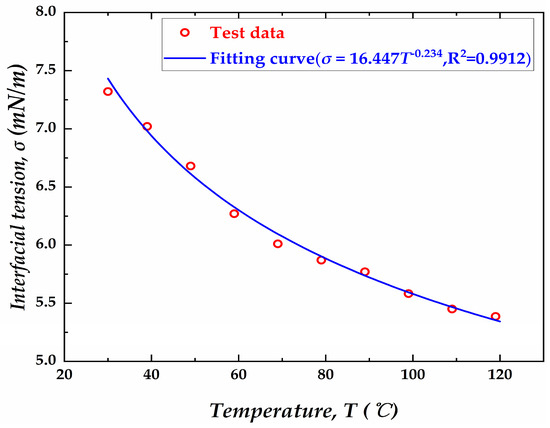
Figure 2.
The correlation between the interfacial tension and temperature.
2.3. Multi-Effect Surfactant
2.3.1. Preparation of Multi-Effect Surfactant
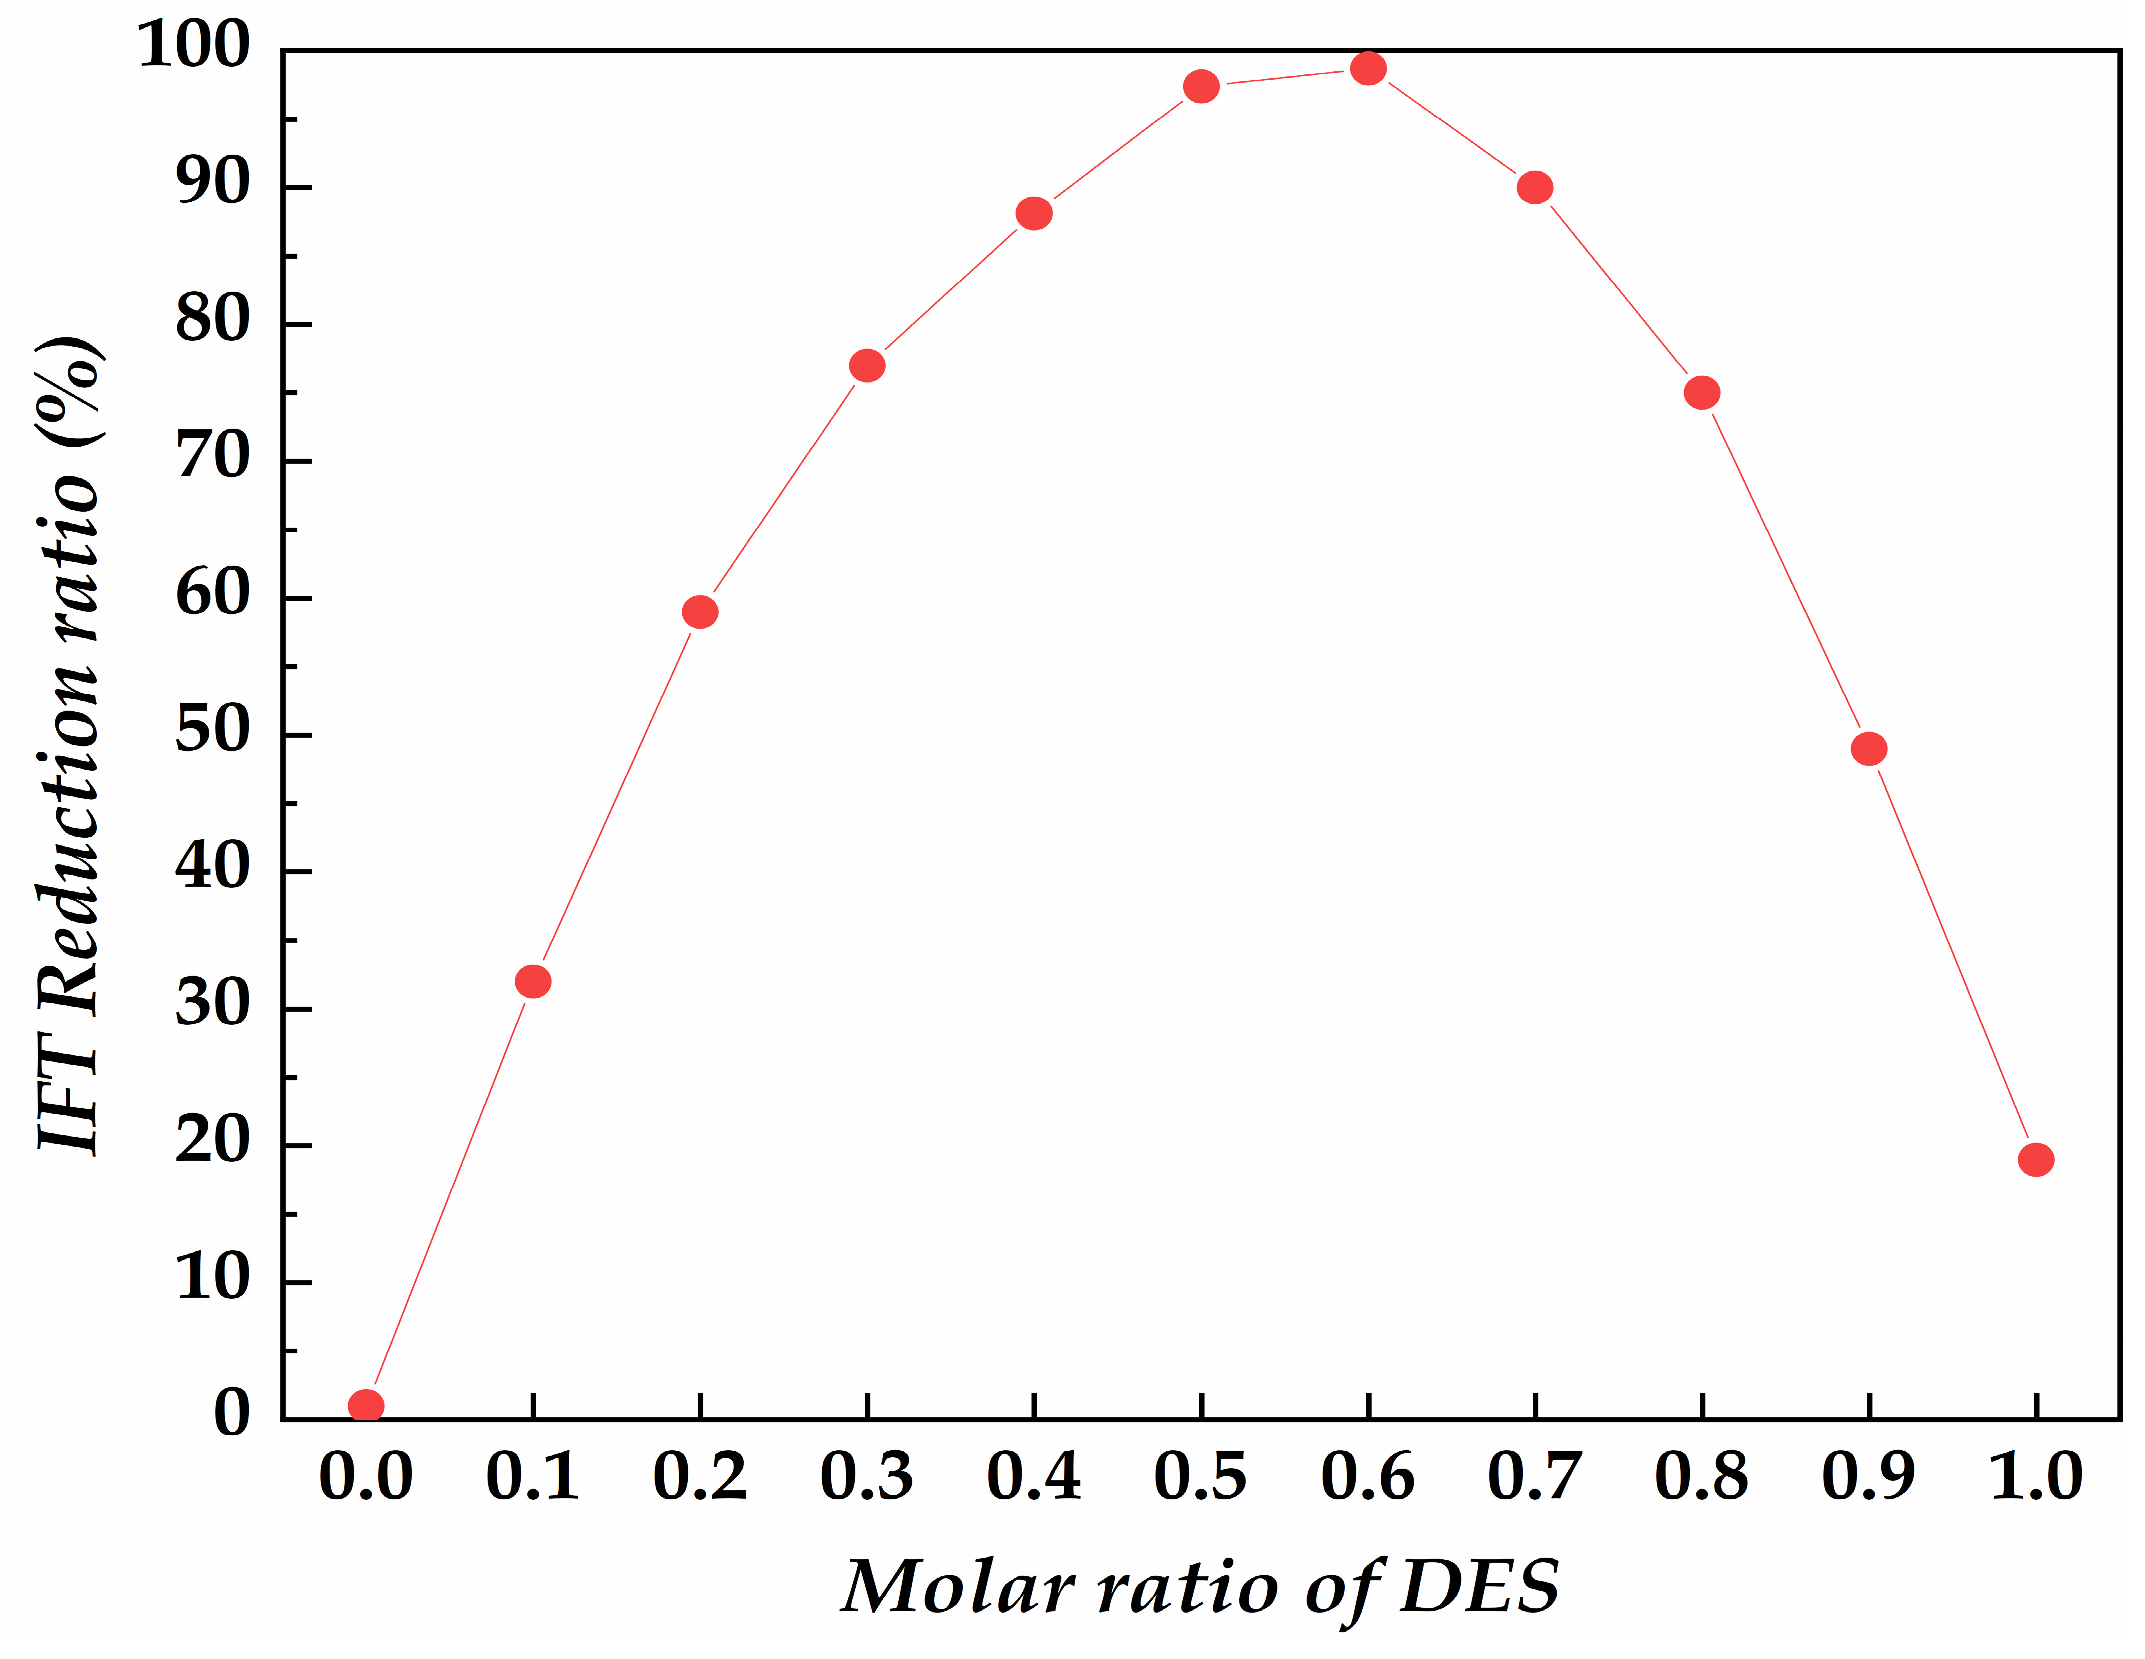
Here, the following steps are taken: First, weigh 0.6 g of citric acid (2.9 × 10⁻³ mol) and 0.4 g of choline chloride (2.9 × 10⁻³ mol) using a high-precision balance. Combine them in a beaker according to a 1:1 molar ratio, and stir at 80 °C for 2 h to prepare the Deep Eutectic Solvent (DES). Next, mix 352.38 g (1.0 mol) of the prepared DES with 370.37 g (1.0 mol) of Cetyltrimethylammonium Bromide (CTAB) in the same molar ratio. Add 100 g of formation water to the mixture. Conduct the test at a speed of 5000 rpm, with a temperature of 40 °C, and allow each interfacial tension (IFT) measurement to stabilize for 16 min. The results show that DES and CTAB alone cannot achieve ultra-low interfacial tension. However, when the molar ratio of DES reaches 0.5 or 0.6 (Figure 3), an ultra-low interfacial tension of 10−3 mN/m can be achieved. In our study, the optimal molar ratio of DES in the multi-effect surfactant was 0.6.

Figure 3.
IFT reduction effect of multi-effect solvent under different molar ratios of DES.
2.3.2. Foam Performance
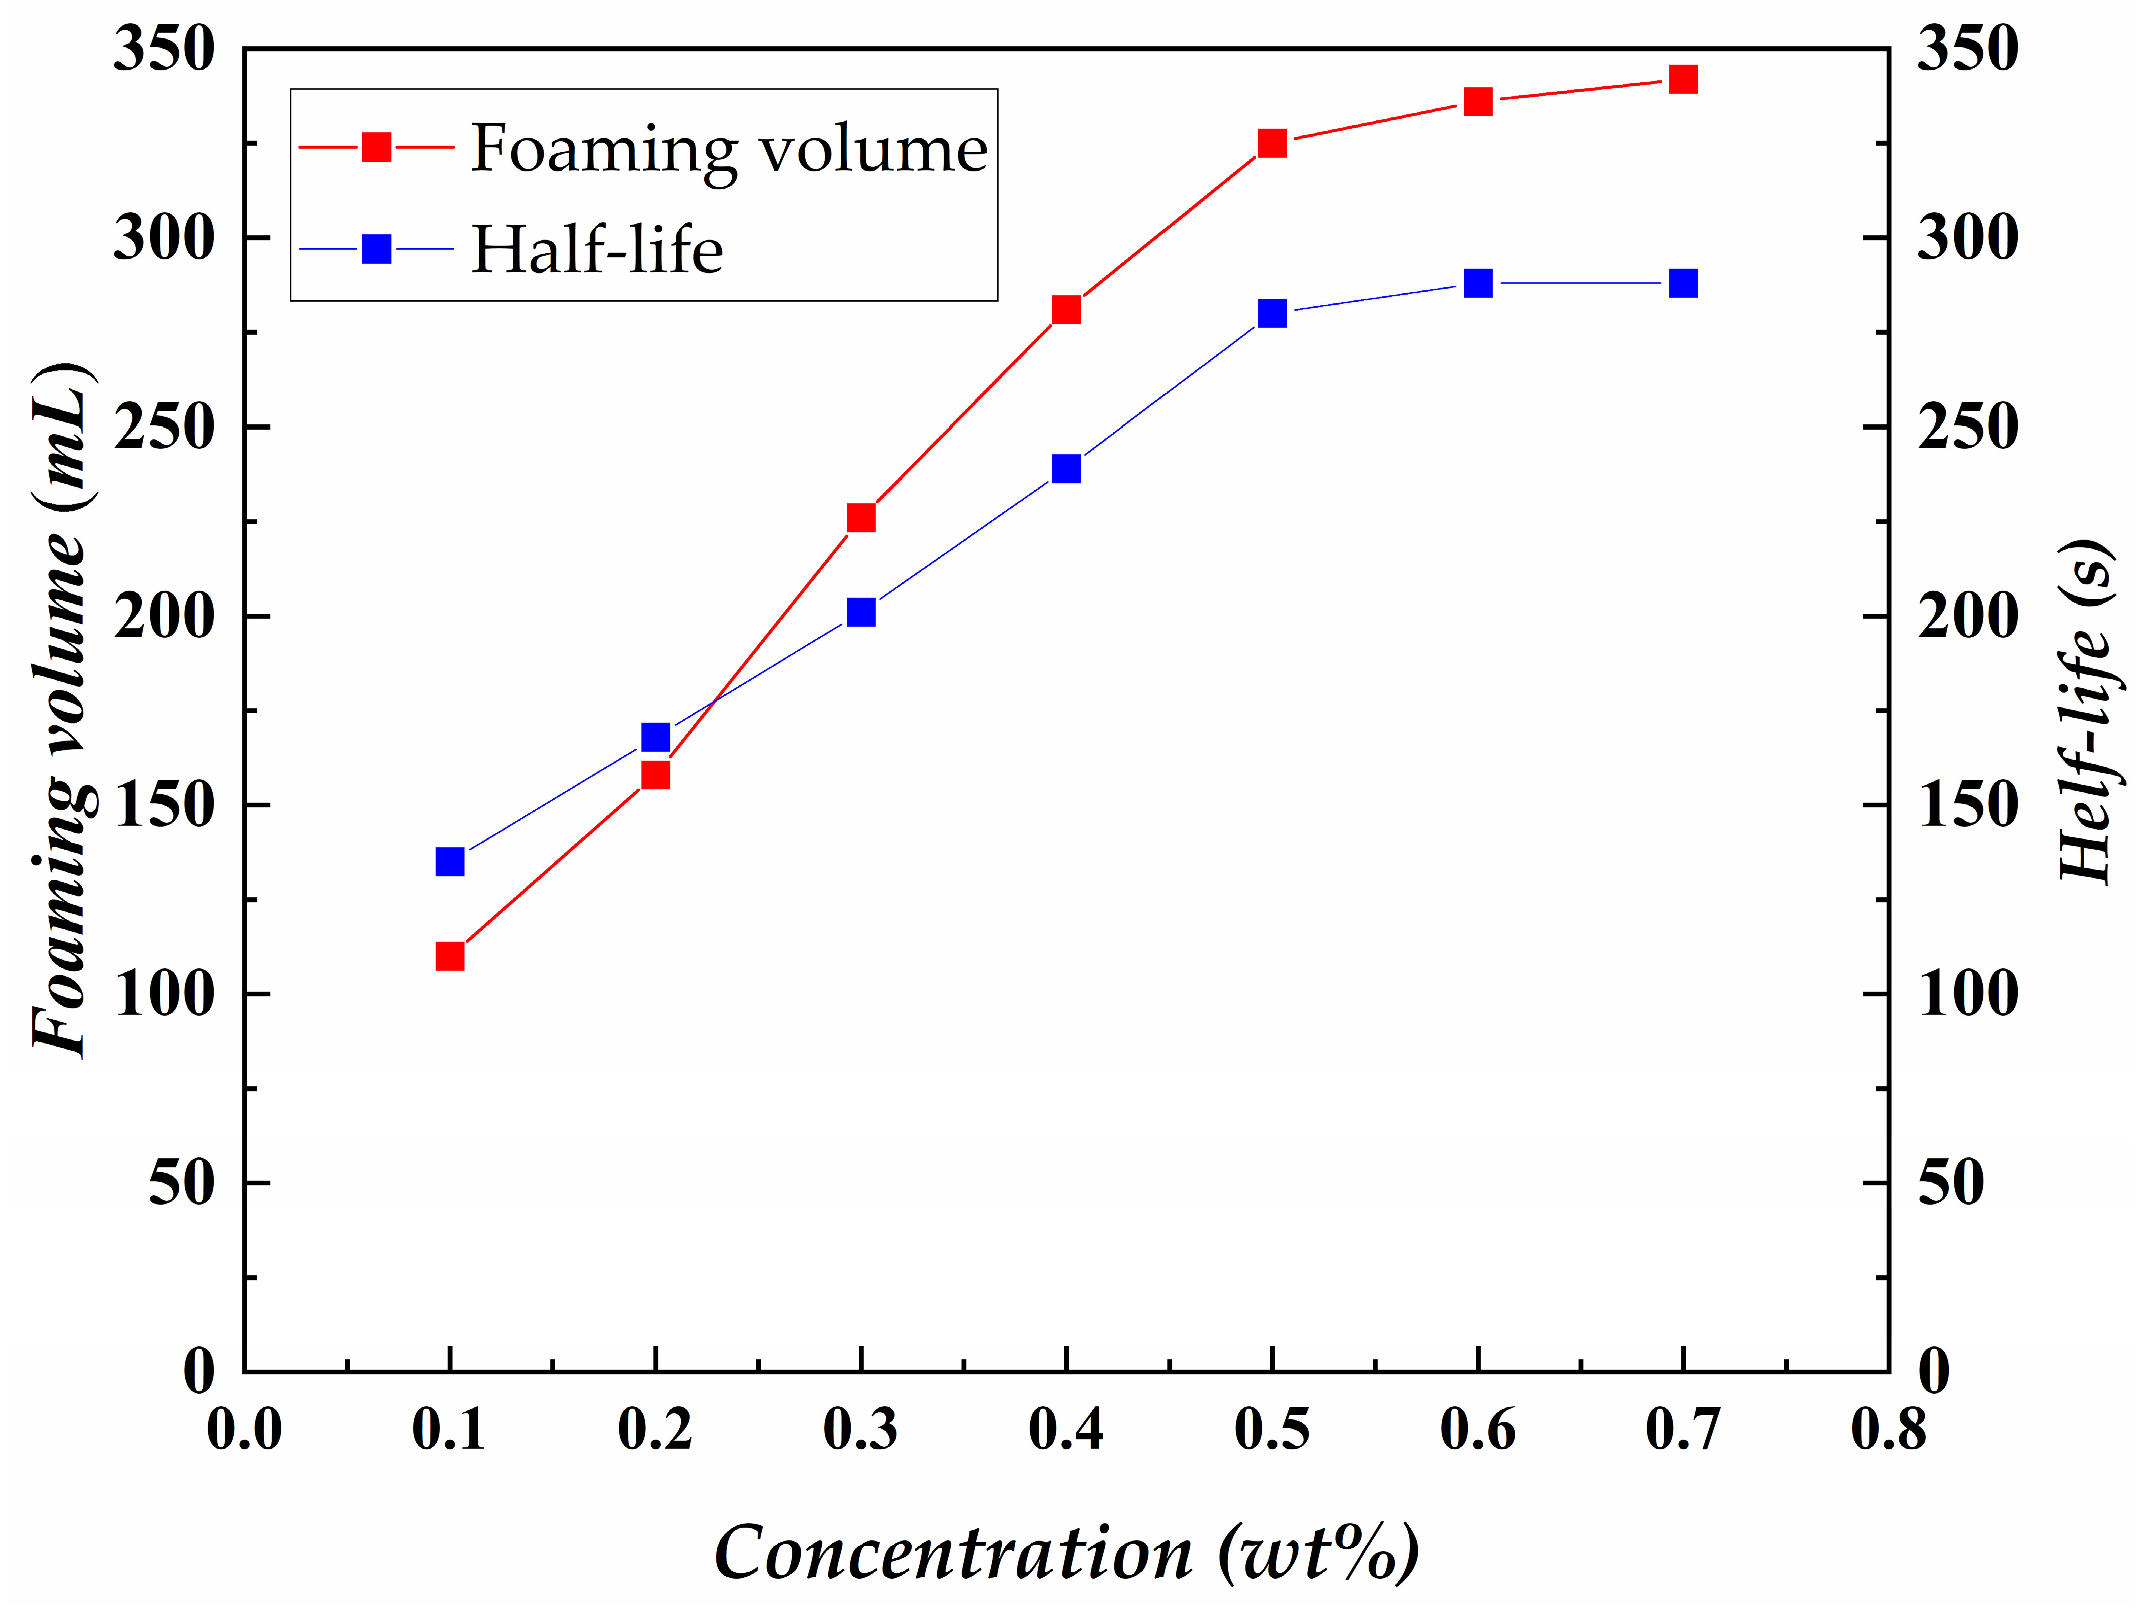
Foaming performance was compared for multi-effect surfactant solutions with concentrations ranging from 0.1 wt% to 0.7 wt% at 70 °C (speed 2000 rpm, time 10 min). The results showed that both the foam volume and foam half-life increased with higher concentrations. However, when the concentration reached 0.5 wt%, the rate of improvement diminished (Figure 4). Thus, 0.5 wt% was found to be the optimal concentration for multi-effect surfactants.

Figure 4.
Foam parameters with the concentration of multi-effect surfactant.
3. Experimental Methods and Procedures
3.1. Experimental Equipment
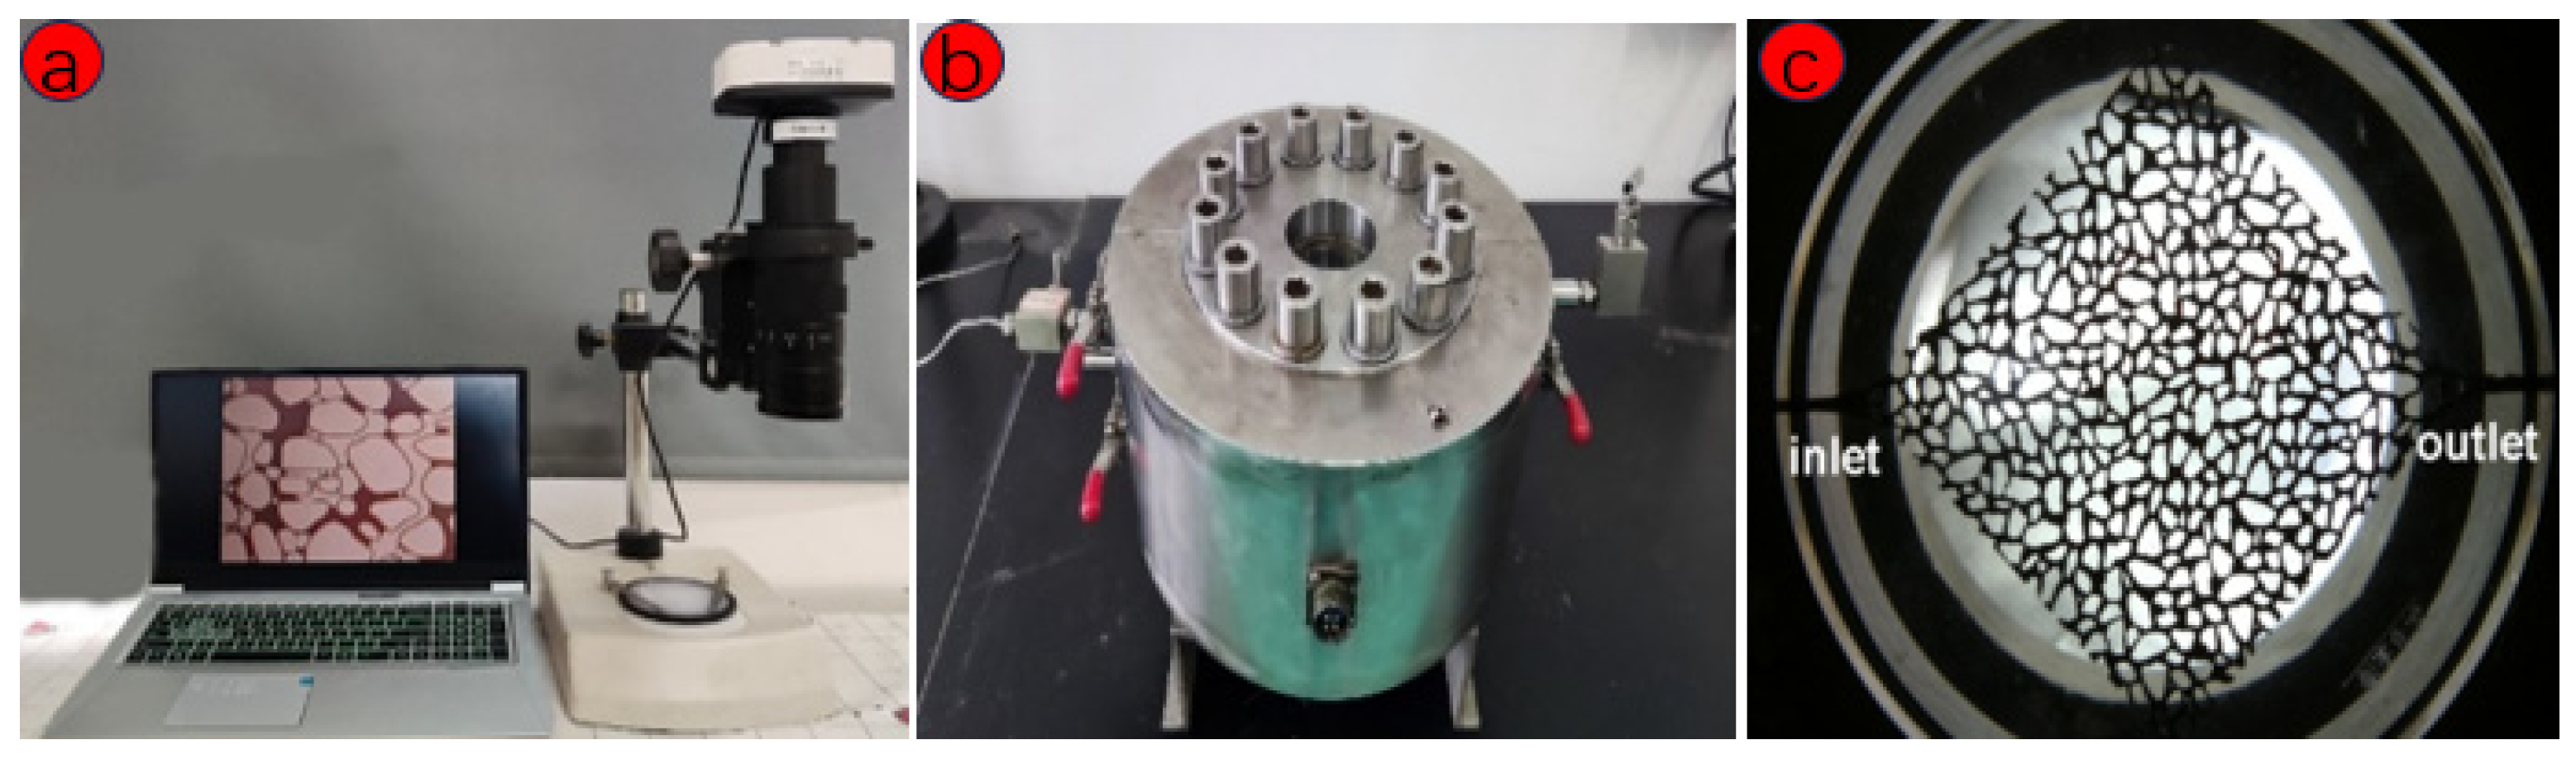
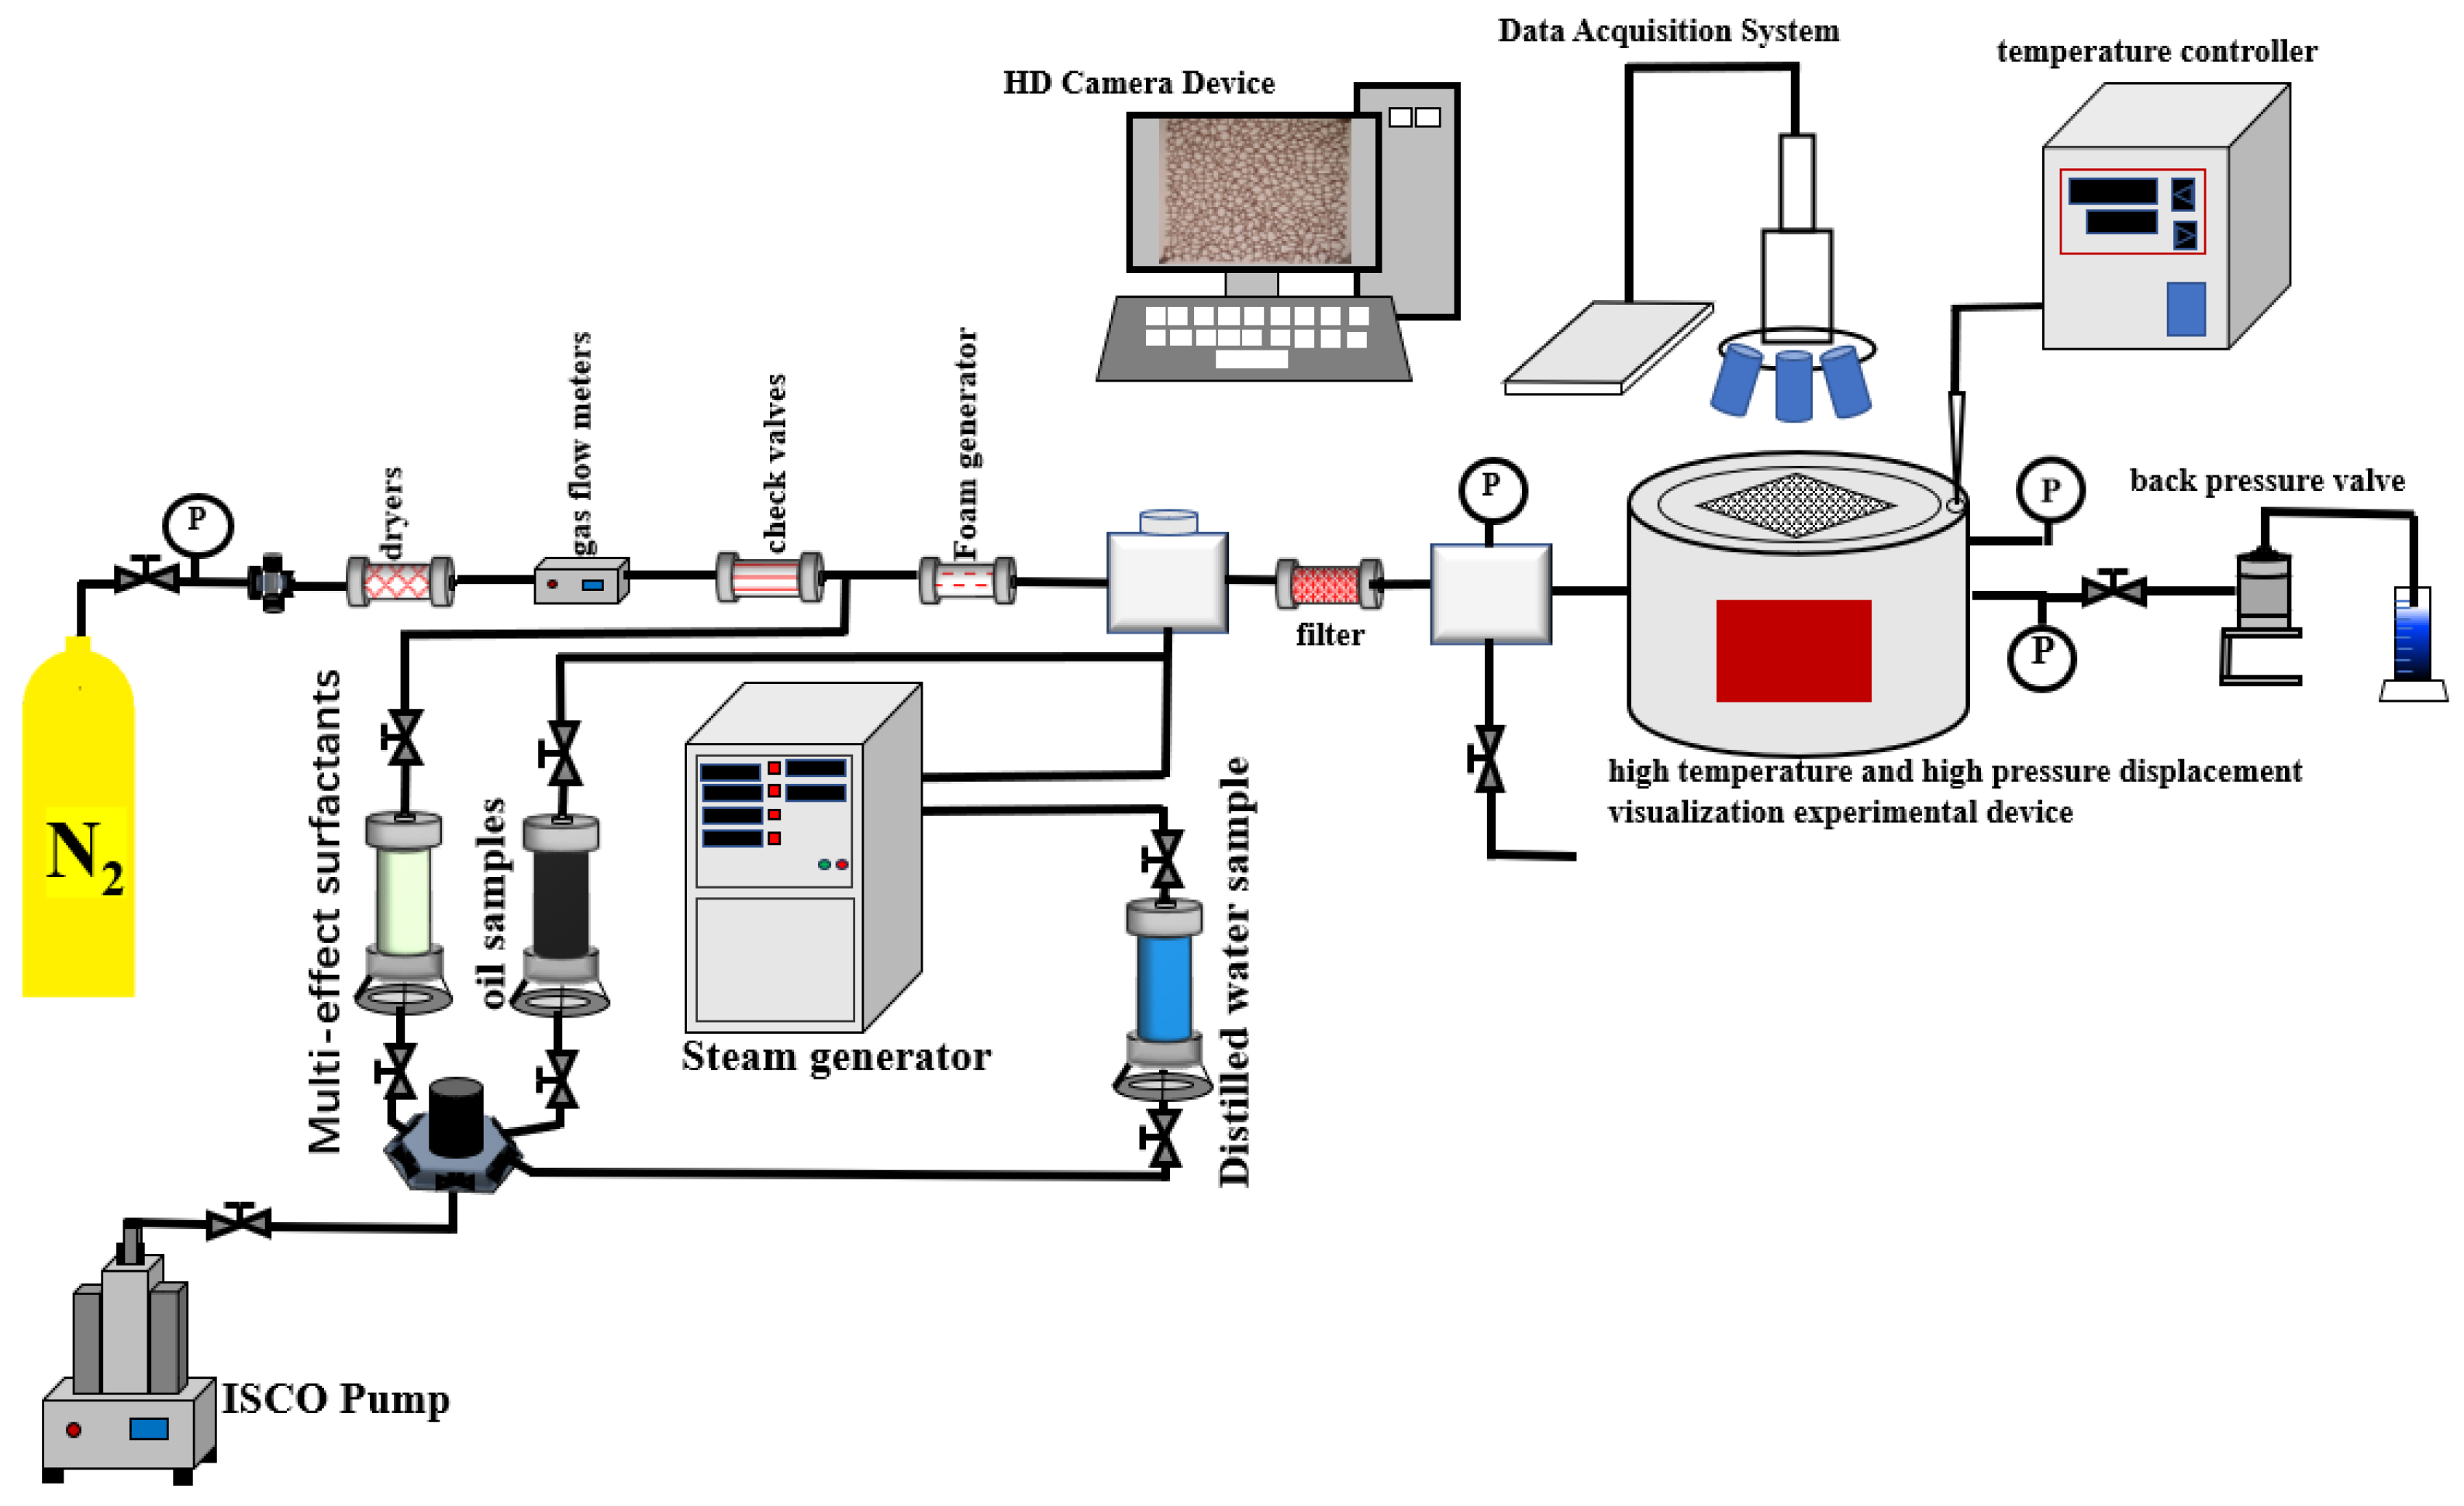
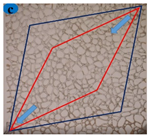
The gas flowmeter controls the gas injection rate, ranging from 0 to 50 mL/min. The temperature controller for the microscopic model can maintain temperatures up to 500 °C. The steam generator produces steam within a temperature range of 100 to 300 °C. The pressure supply system consists of an ISCO plunger pump and a hand pump: the ISCO pump provides a constant flow rate from 0.01 to 50 mL/min at the inlet, while the hand pump supplies backpressure at the output. The high temperature and high pressure microscope visualization platform was used in the experiment, which includes a camera system, an observation window, and an etched glass model. The high-definition, high-frequency camera system included a computer and a digital microscope camera. Images are captured and analyzed using Image software (Version 2.0) (Figure 5a). The observation window is designed to withstand pressures up to 32 MPa and temperatures up to 300 °C, and the temperature controller is used for adjustment (Figure 5b). The micro-etched glass model is placed within this window and measures 75 mm × 75 mm × 3.5 mm, with a pore area of 45 mm × 45 mm and an injection hole diameter of 2.5 mm (Figure 5c). The large white oval represents the glass, while the black zone indicates the pore volume filled with crude oil.
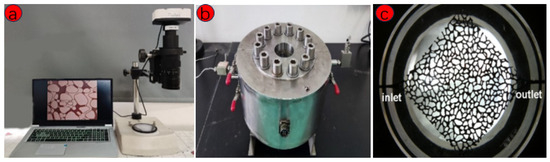
Figure 5.
Microscopic visualization experiment platform: (a) is the camera system, (b) is the observation window, and (c) is the etched glass model.
3.2. Experimental Procedures
The device and system used in this experiment are as follows (Figure 6). Here are the specific steps:

Figure 6.
Experimental system and workflow.
- (1)
- Connect the experimental apparatus and pipelines; in particular, some pipelines at the visualization device entrances.
- (2)
- To establish a confining pressure of 3 MPa, connect the pressure gauge to the confining pressure pipeline of the visualization experimental device. Then, incrementally introduce water at a flow rate of 0.01 mL/min until the desired pressure of 3 MPa is achieved.
- (3)
- An ISCO pump was set to 0.01 mL/min to saturate oil, and the pressure of the outlet end and the inlet end should not exceed 1 MPa.
- (4)
- Conduct a steam flooding simulation by employing a microscopic model temperature controller to elevate the visualization device temperature to 100 °C. Introduce hot steam into the micro-etched glass containing oil-saturated samples, utilizing an ISCO plunger pump set to an injection rate of 0.01 mL/min. Record the oil sample flow and state changes of the camera system.
- (5)
- Simulate NFAS flooding. Connect a unidirectional valve, desiccator, and gas flow meter to the N2 gas tank. Set the N2 injection rate to 0.015 mL/min and the multi-effect surfactant solution (0.5 wt%) to 0.015 mL/min and simultaneously conduct foaming with the foam generator.
3.3. Experimental Parameters
In accordance with the experiment’s scheme and the steps required to connect the device (Figure 6), Table 1 shows the experimental parameters used in the flooding process.

Table 1.
Experimental parameters of the flooding process.
3.4. Analytical Method
3.4.1. Flow Zone Division
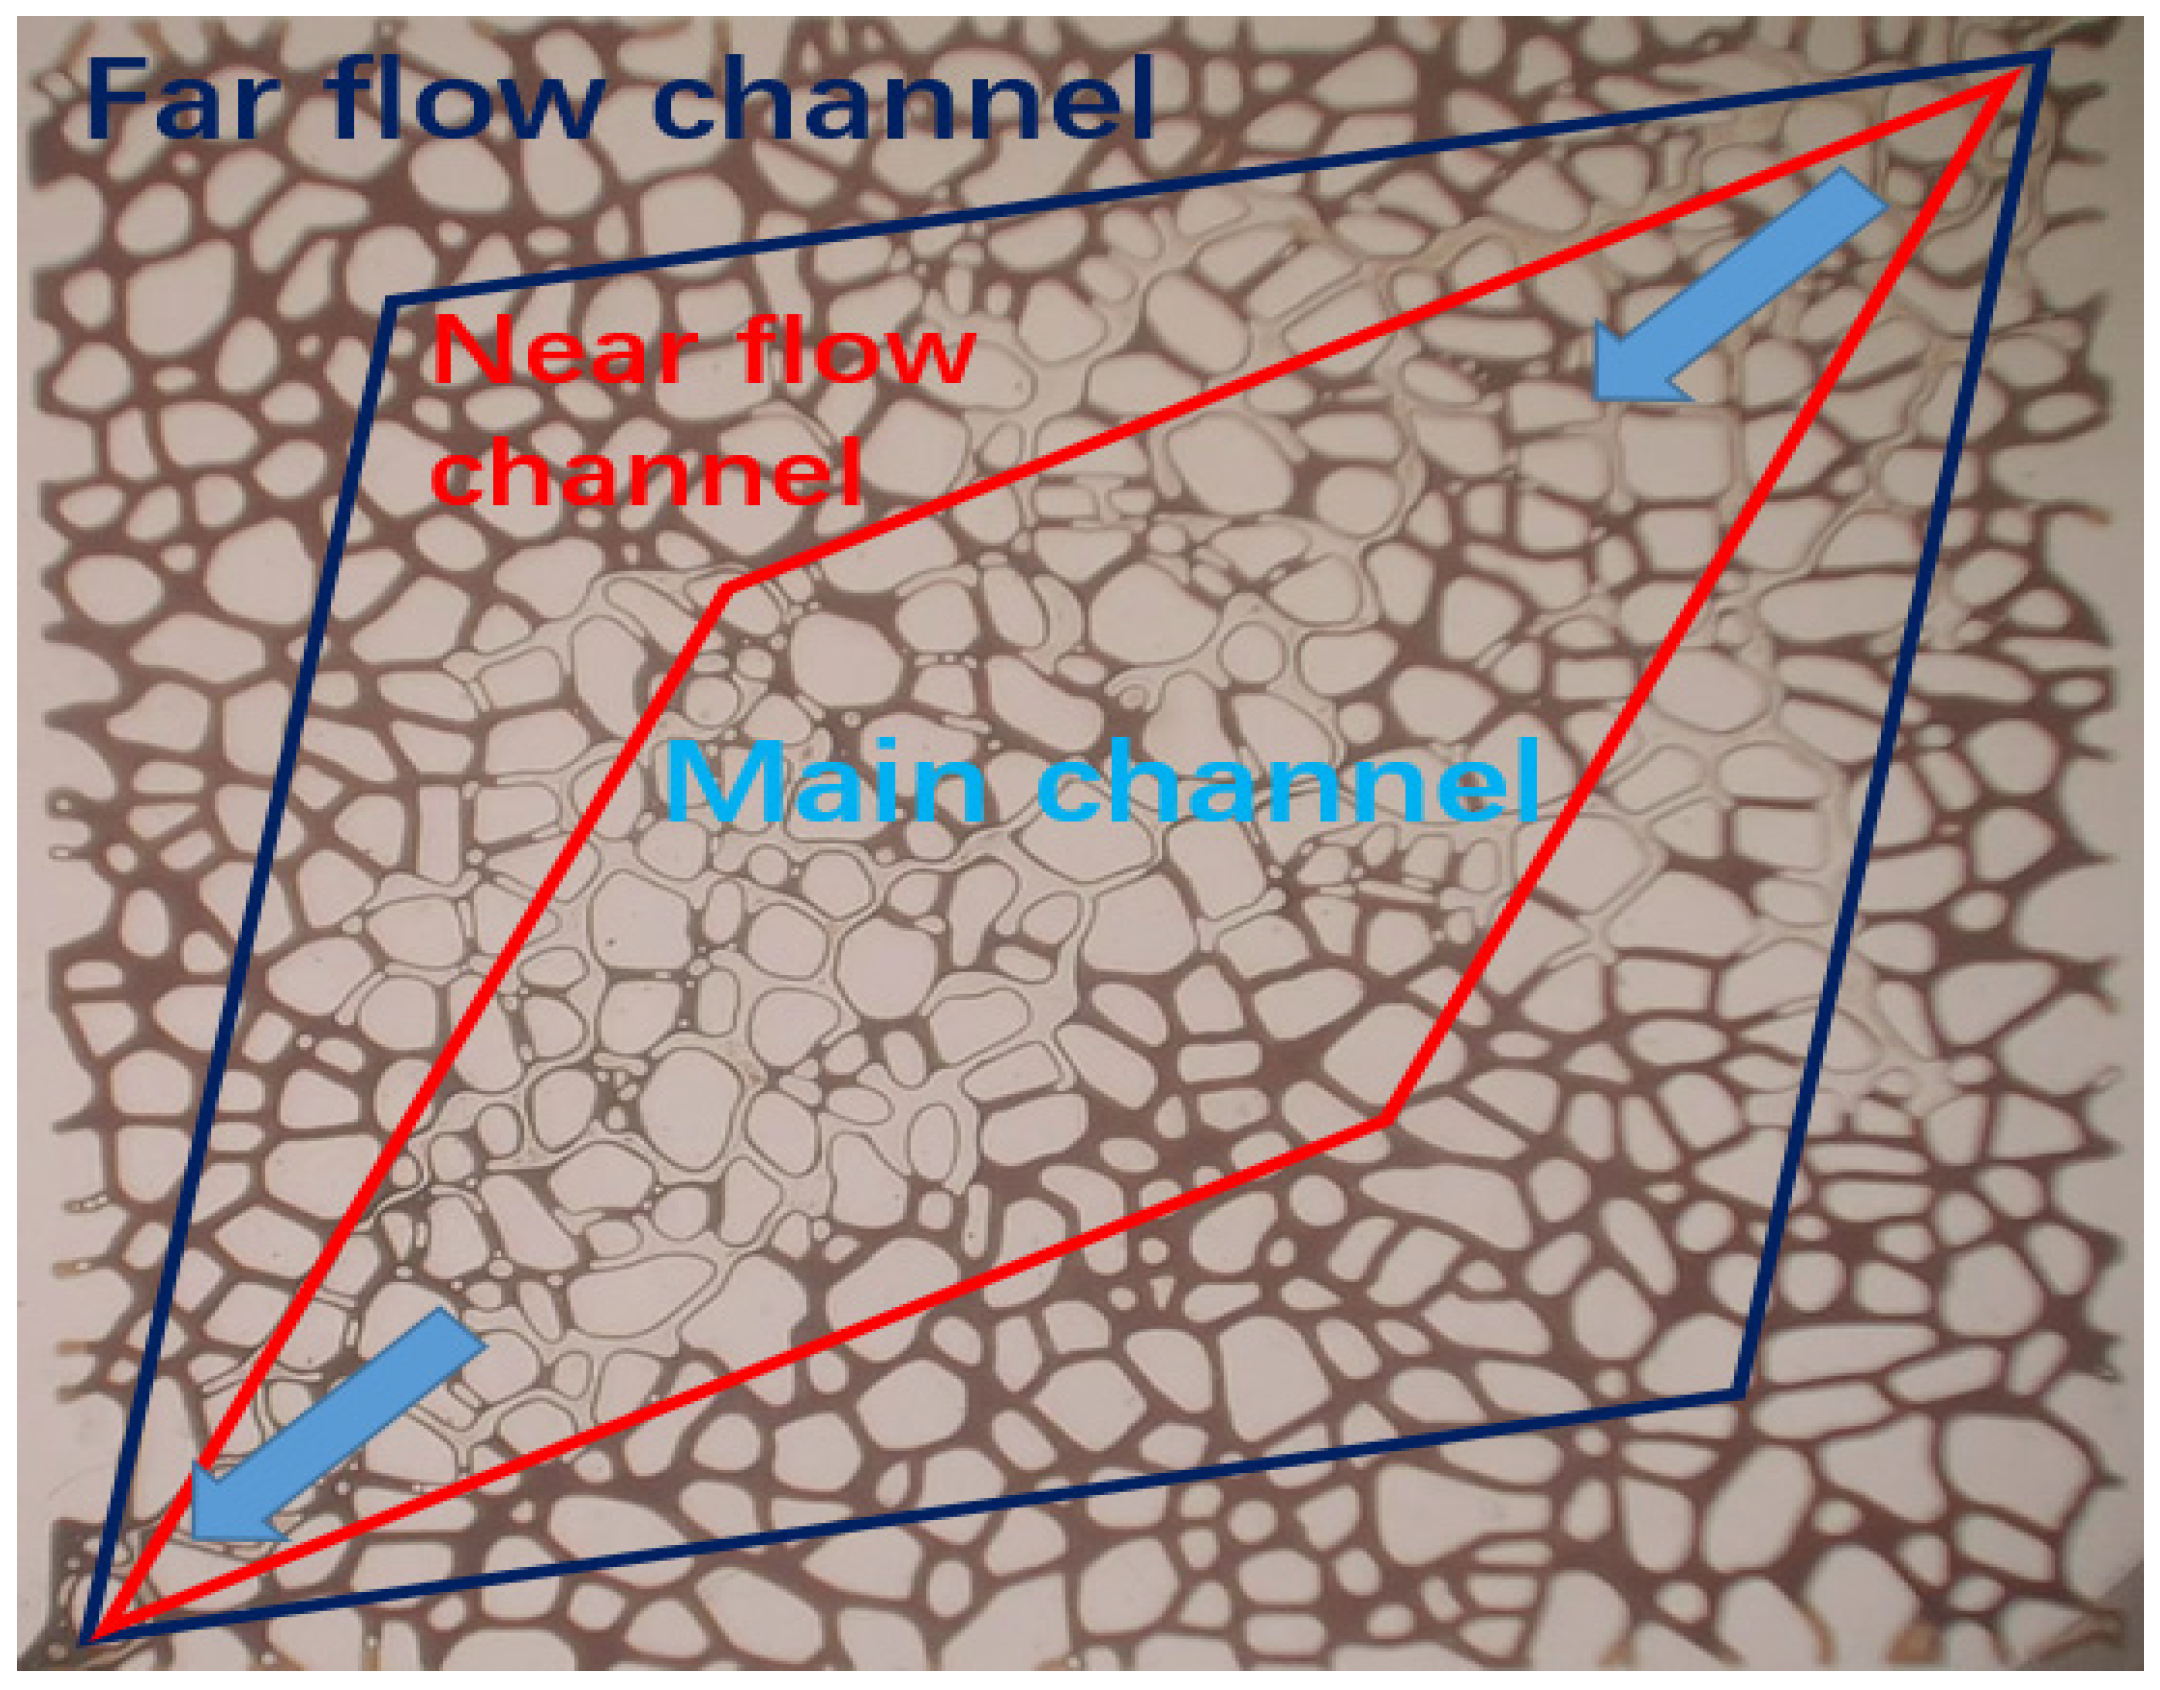
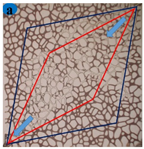
According to the flow pathway shape in the micro-etched glass model, the channels are divided into three zones (Figure 7). In the model, the large white ovals represent glass, the inner white zone represents the flooding fluid, and the black zone represents the pore volume occupied by crude oil. The etched glass model has a square shape, with diagonal lines connecting the corners. The center position is regarded as the focal point. The main channel occupies the middle third, the near channel occupies the second third, and the far channel encompasses the remaining area.
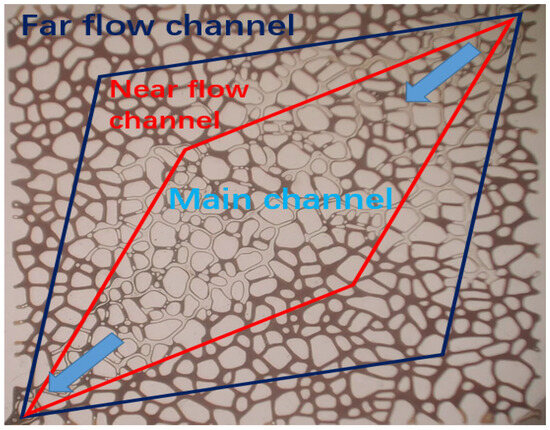
Figure 7.
Flow pathway division diagram.
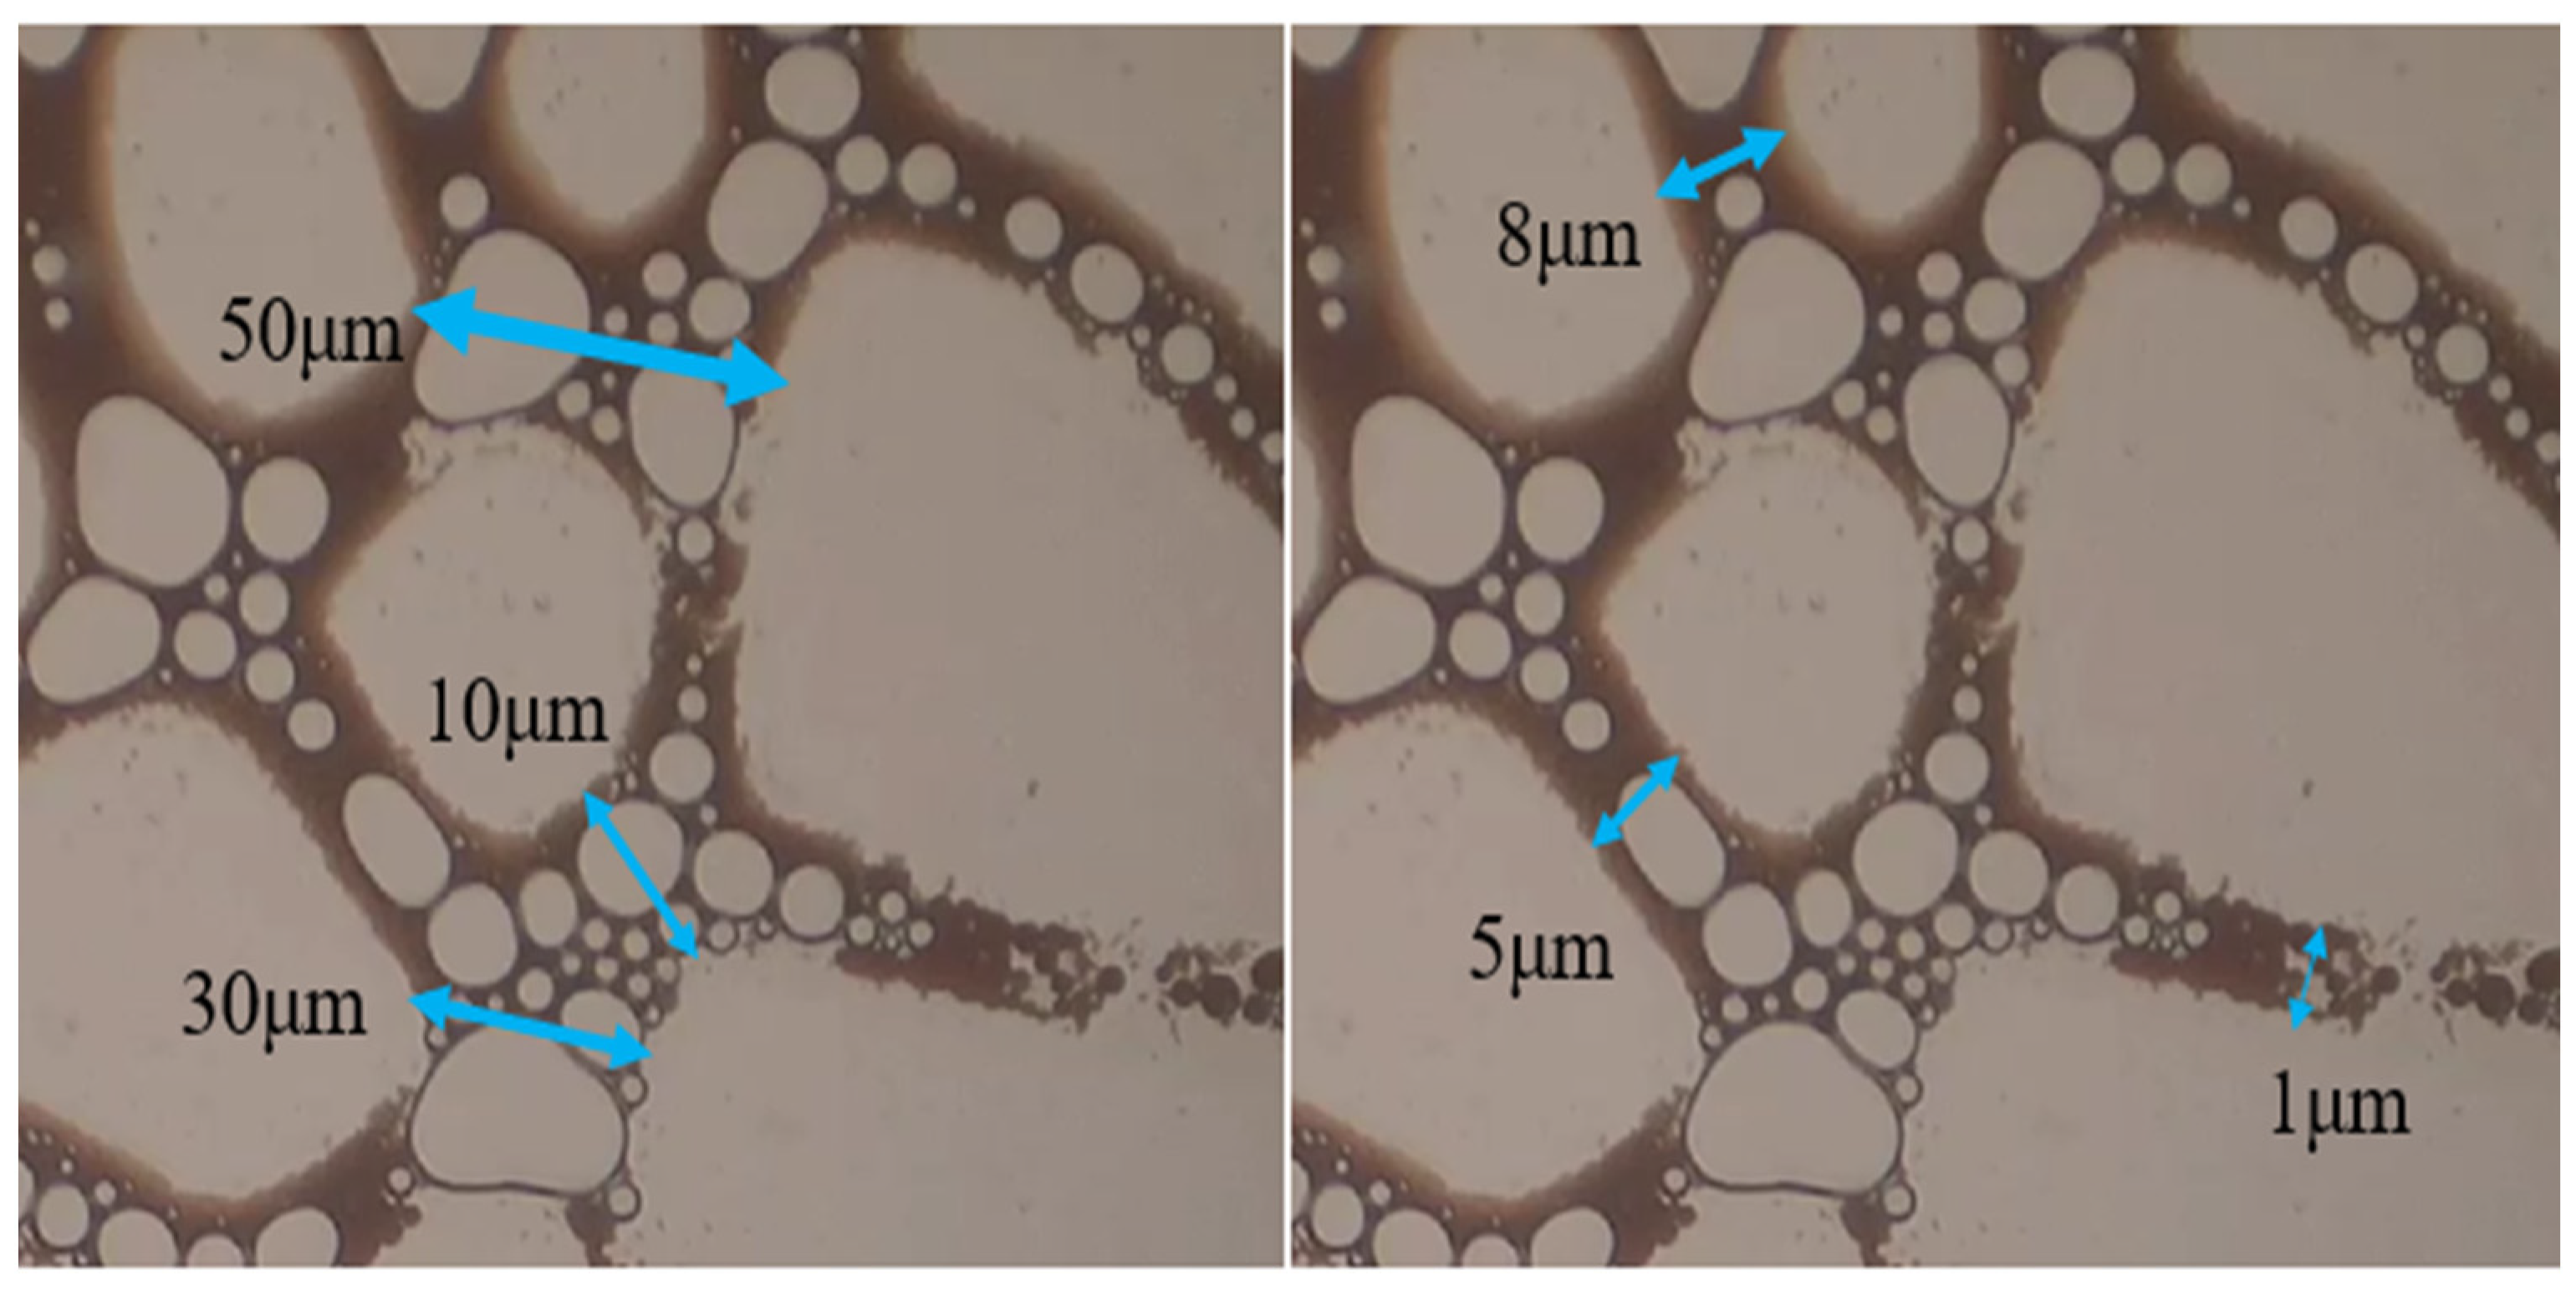
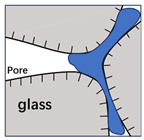
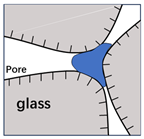
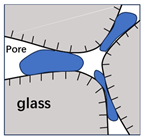
3.4.2. Pore Structure Division
The pore coordination number (PCN) describes the structural characteristics of the pore throat and pore channel. It indicates the number of pore channels connected to each pore throat (the large white ovals in Figure 8 represent glass, the small white oval represents foam, and the black zone represents oil). Pore channels are classified into three types based on radius: large pore channels (≥35 μm), medium pore channels (15~35 μm), and small pore channels (<15 μm). Pore throats are categorized into four types based on their mean size: coarse pore throats (≥7 μm), middle pore throats (1~7 μm), fine pore throats (0.1~1 μm), and micro-fine pore throats (<0.1 μm).
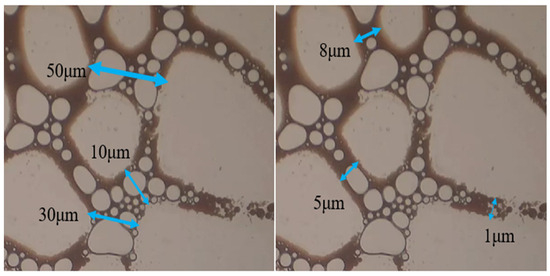
Figure 8.
Pore channel and throat size division. (Left) is the pore channel, (right) is the pore throat.
3.4.3. Residual Oil State Division
Based on the proportion of microscopic residual oil occupying pore space, residual oil is categorized into two primary types (Table 2). The first category is continuous residual oil, which occupies a relatively large volume in the pore and includes shapes such as long slugs and clusters. The second category is dispersed residual oil, which occupies a smaller pore volume and primarily exists in shapes such as columnar, film-like, corneal-like, and island-like shapes.
Table 2.
Type of the remaining oil.
4. Results
Table 3 shows that the recovery efficiency of both flooding processes increases with the injection volume. The ultimate recovery factor of steam displacement is 23.4%, while for NFAS flooding it is 68.3%. The experimental results indicate that NFAS flooding improves the recovery rate by 44.9% compared to steam flooding.
Table 3.
Experimental results.
4.1. Steam Flooding Phase
4.1.1. Main Flow Channel Zone
- (1)
- Remaining oil occurrence state
When steam is injected (Figure 9a), the higher viscosity oil is not being displaced by steam, leading to an increase in cluster and columnar remaining oil. With a constant injection rate, the water phase drives crude oil along the liquid film edge, bypassing droplets, and enabling the continuous forward movement of the remaining oil. As viscosity decreases (Figure 9b), crude oil in pore channels is gradually displaced. Steam flooding is prone to channeling, and fails to form effective water–gas slugs, leading to many continuous oil slugs. In the late stage (Figure 9c), steam flooding forms clusters of the remaining oil widely in pore channels. There is almost no continuous oil phase on one side and a continuous water phase on the other side. Steam primarily displaces crude oil in large pores, while the remaining oil in small pores is less affected when water channels form.
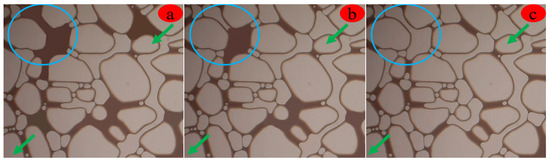
Figure 9.
Steam flooding at the main channel: (a) is 0.25 PV, (b) is 0.75 PV, and (c) is 1.0 PV.
- (2)
- Remaining oil occurrence pattern
In the main flow pathway area, the remaining oil primarily appears as a small columnar shape, with some film-like remaining oil mainly in the fine pore throat. Bubbles are well connected and fill the entire fine pore throat, with some mixed in pore channels and pore throats. As the PV increases, leading to a decrease in crude oil viscosity, the smaller bubbles will connect and aggregate in pore channels, while the bubbles in PCN 5 exhibit minimal impact. In PCN 3 to 4, the membrane gradually reduces the amount of remaining oil (Figure 10).
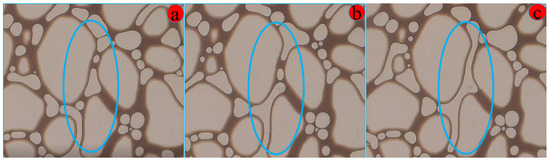
Figure 10.
The residual oil of steam flooding at the main channel zone: (a) is 0.25 PV, (b) is 0.75 PV, and (c) is 1.0 PV.
4.1.2. Near Flow Channel Zone
- (1)
- Remaining oil occurrence state
In the early stage (Figure 11a), a portion of the crude oil within the pore pathway undergoes displacement, and the columnar residual oil tends to change into clusters. In the middle stage (Figure 11b), the proportion of columnar residual oil becomes smaller, and a thick oil film adheres to the pore walls. In the late stage (Figure 11c), there is more columnar remaining oil in pore channels, and some “H”-shaped columnar oil. Air bubbles drive the oil out of the pore channels, while some of the oil droplets are trapped in the pore throat.
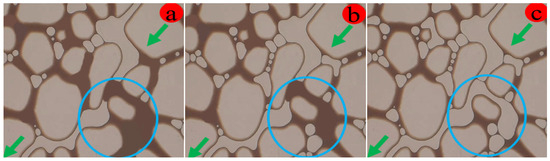
Figure 11.
Steam flooding at near channel zone. (a) is 0.25 PV, (b) is 0.75 PV, and (c) is 1.0 PV.
- (2)
- Remaining oil occurrence pattern
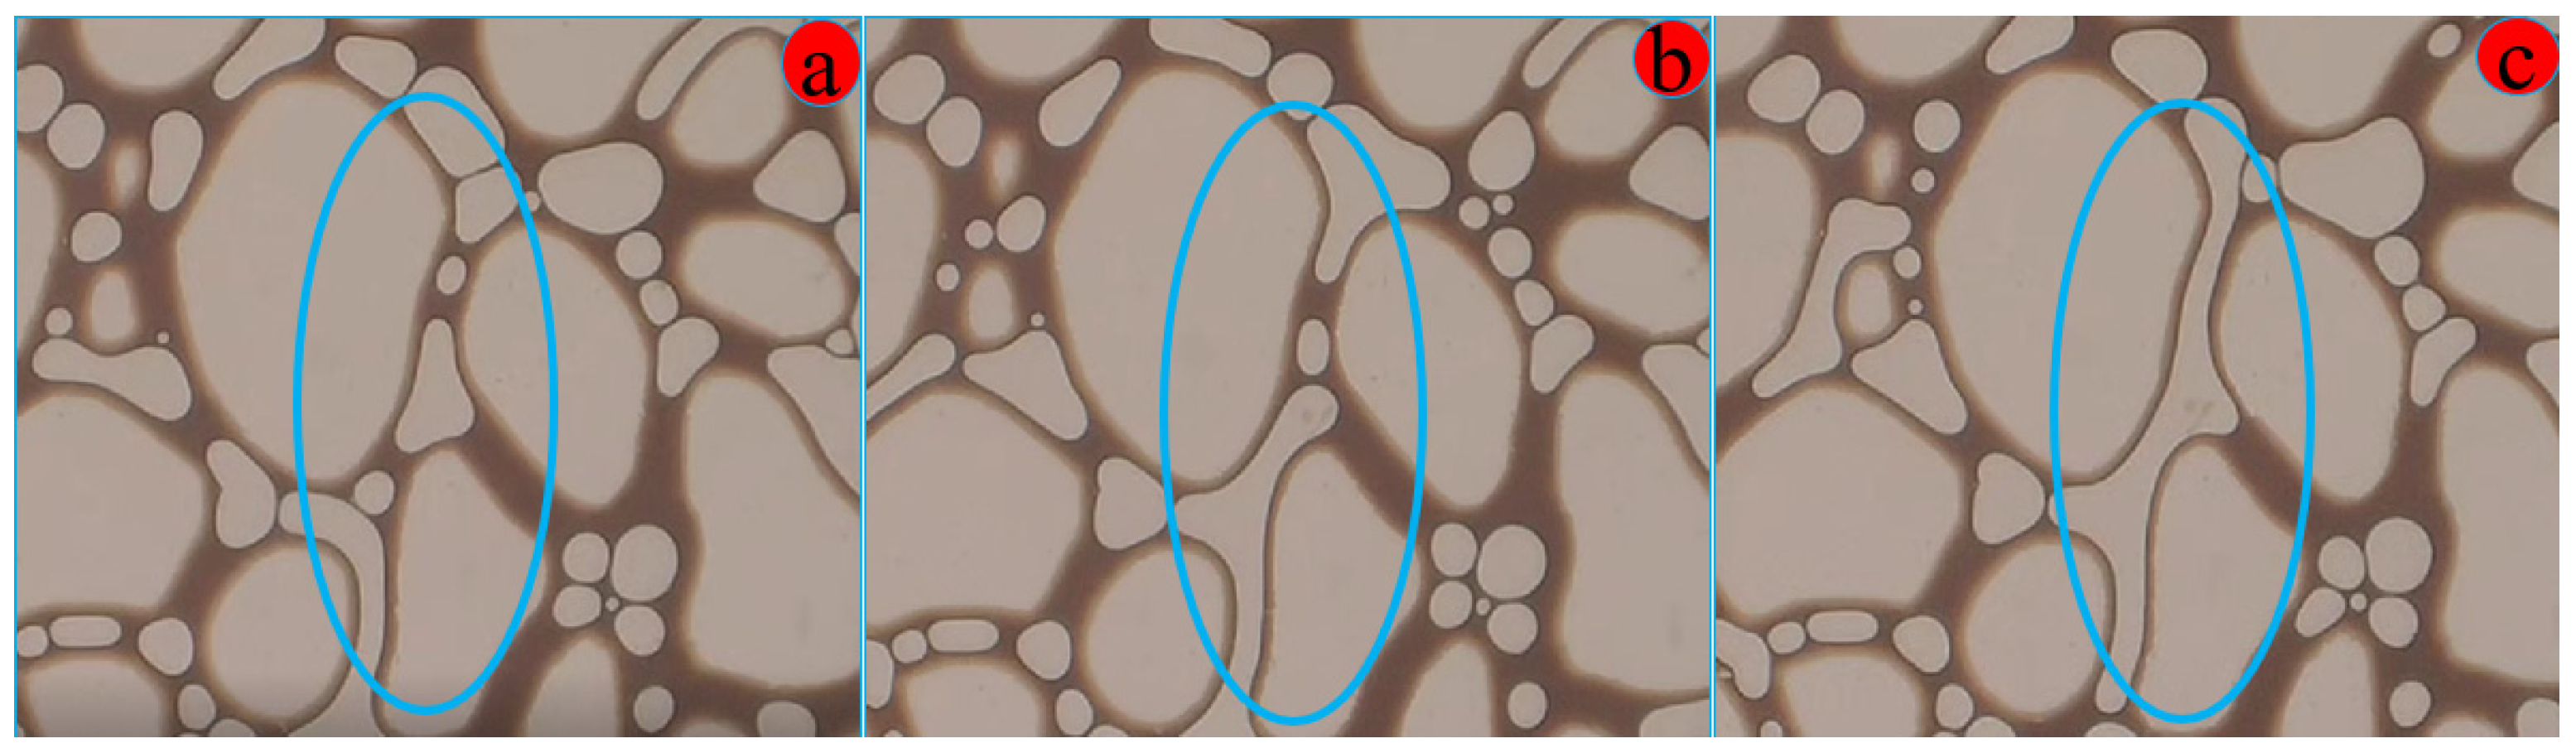
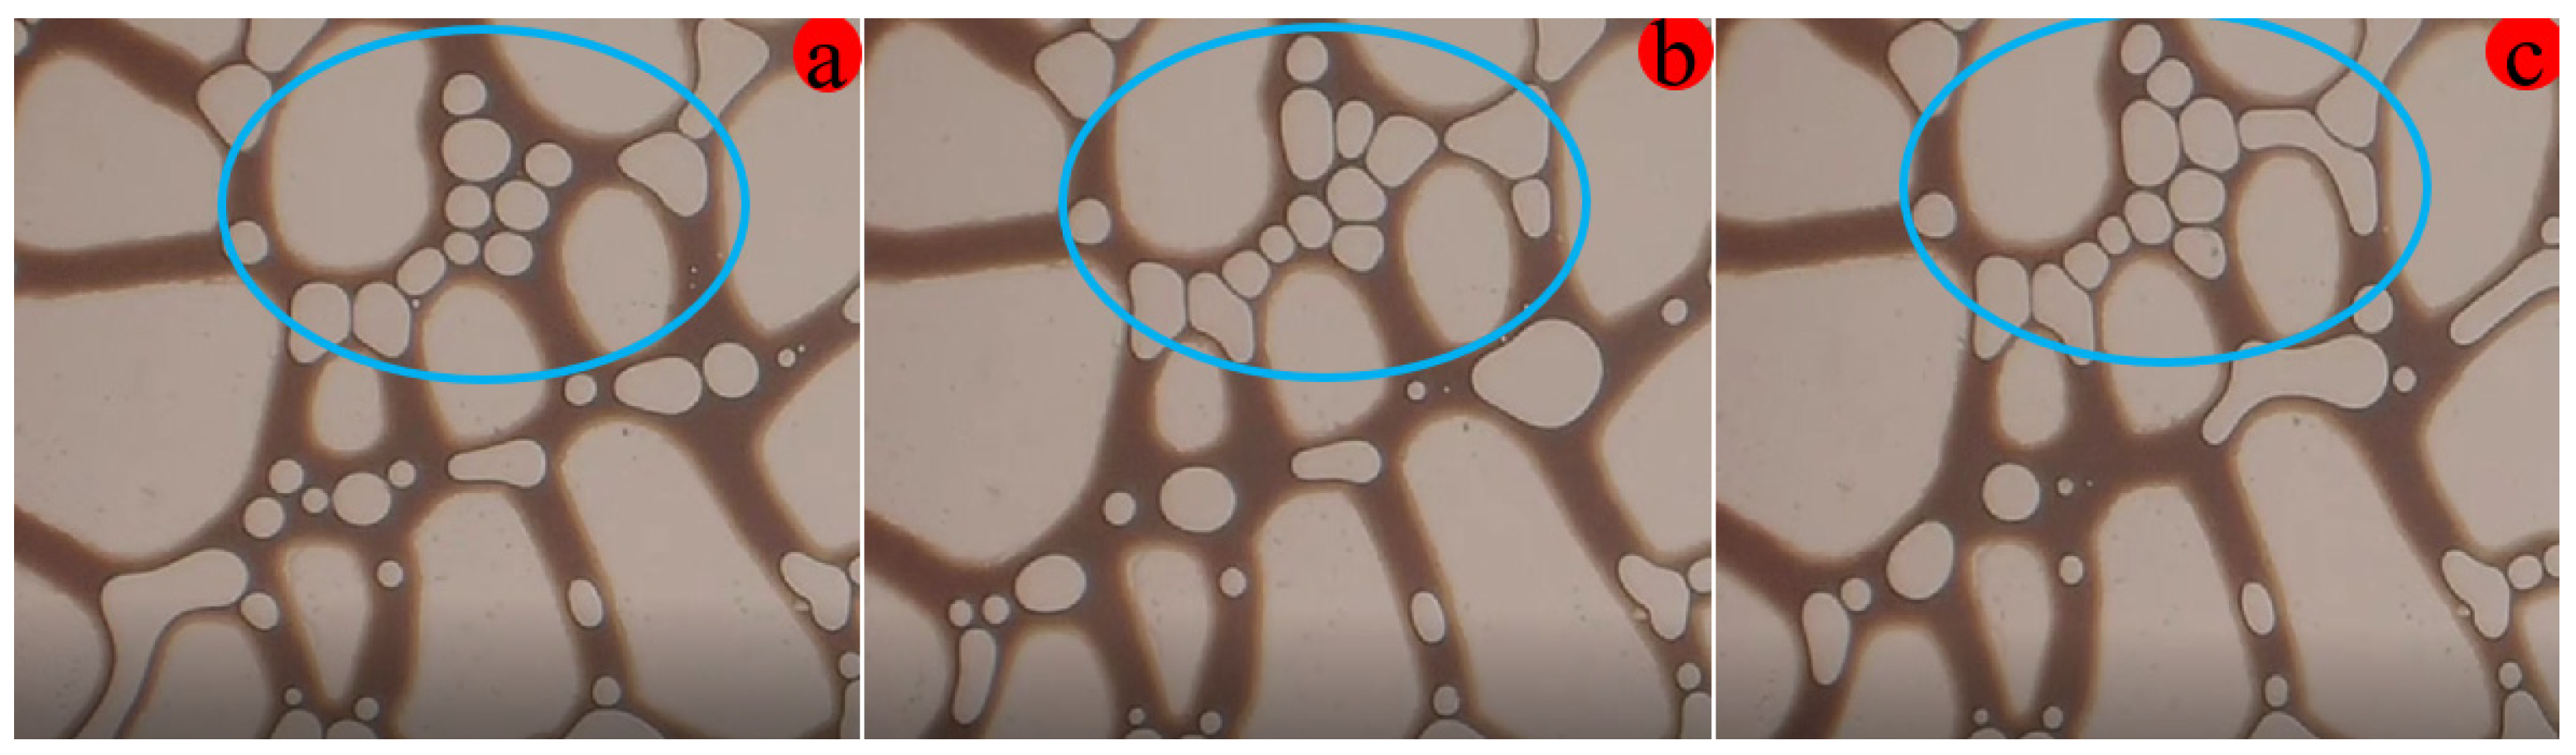
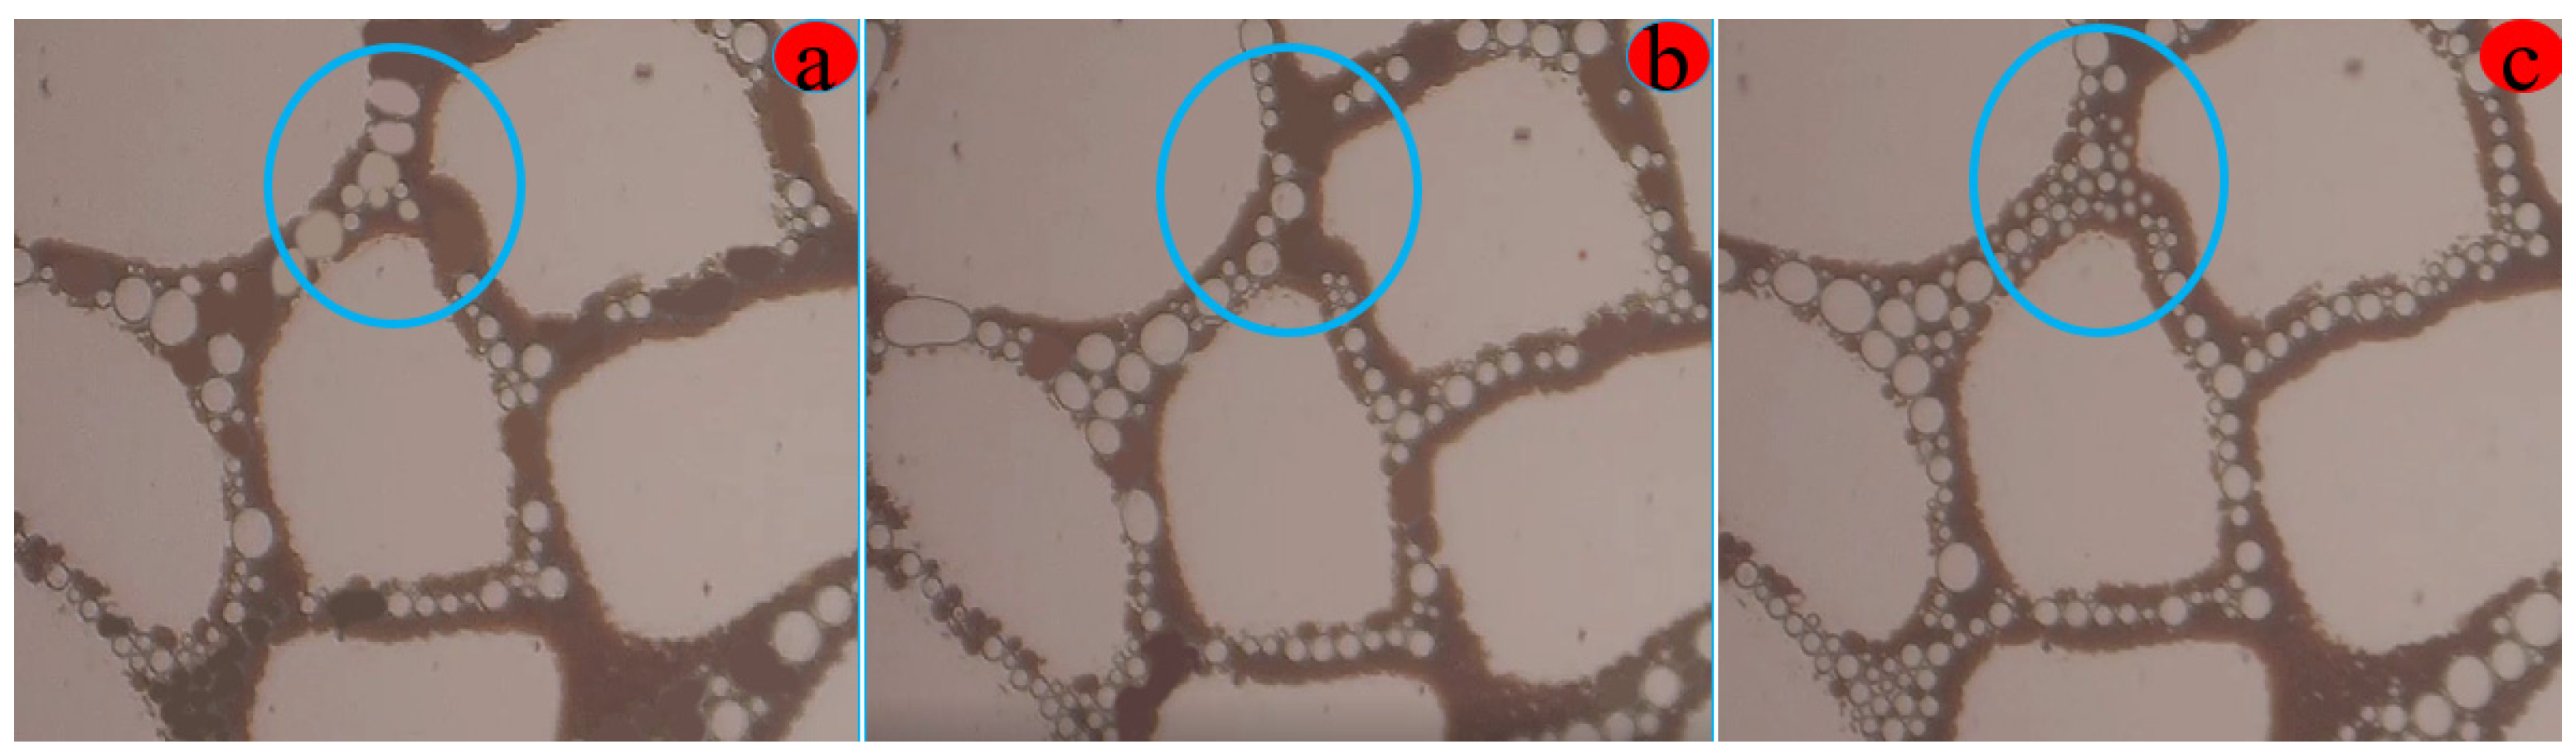
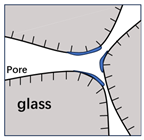
In the near flow pathway zone, the remaining oil appears as columnar, membranous, and very few continuous phases of cluster, with a small amount of film remaining oil in PCNs 3 to 4. The bubbles are concentrated in the pore throat and distributed between the fine and middle pore channels. In the pore throats, dense bubble tends to gather with adjacent bubbles, eventually forming stable long bubbles (light blue circle in Figure 12). The fine pore throat containing the remaining oil and bubbles are not affected. However, due to the filtration resistance, the bubbles in the pore throats become larger, leading to smaller bubbles.
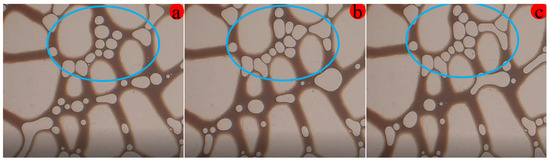
Figure 12.
Residual oil of steam flooding at near channel zone: (a) is 0.25 PV, (b) is 0.75 PV, and (c) is 1.0 PV.
4.1.3. Far Flow Channel Zone
- (1)
- Remaining oil occurrence state
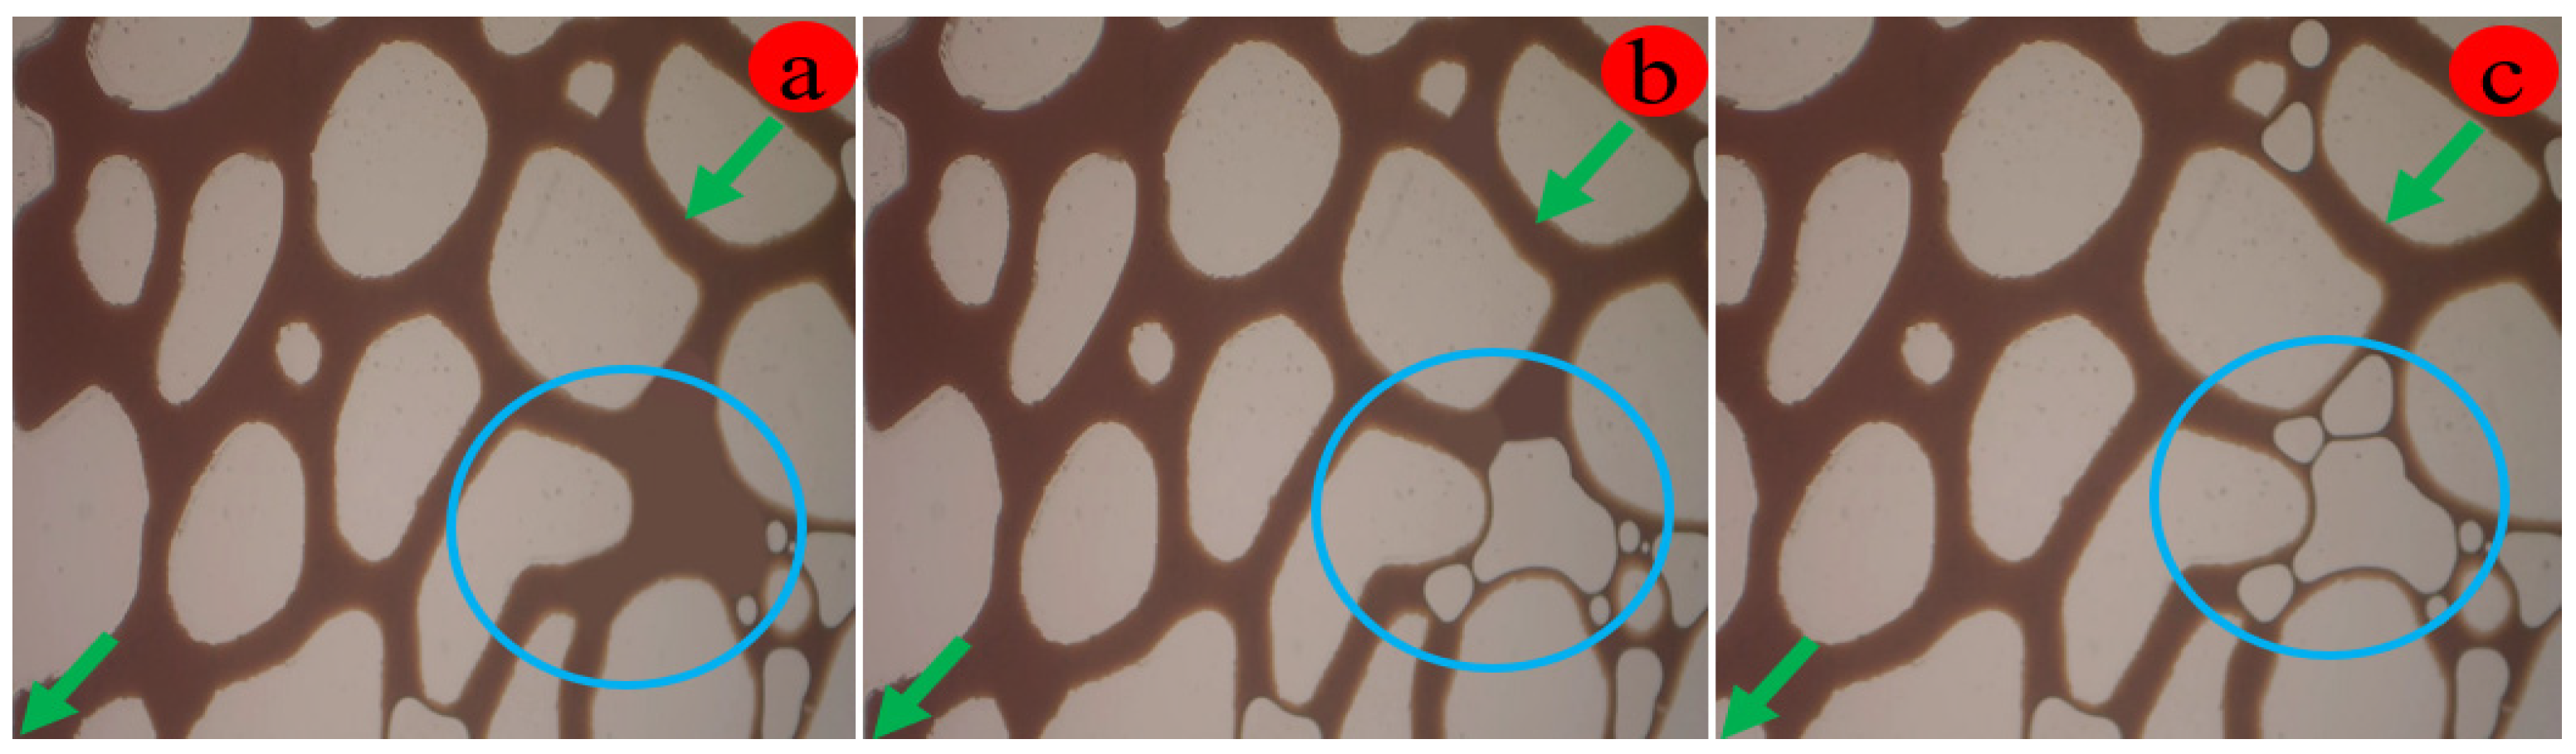
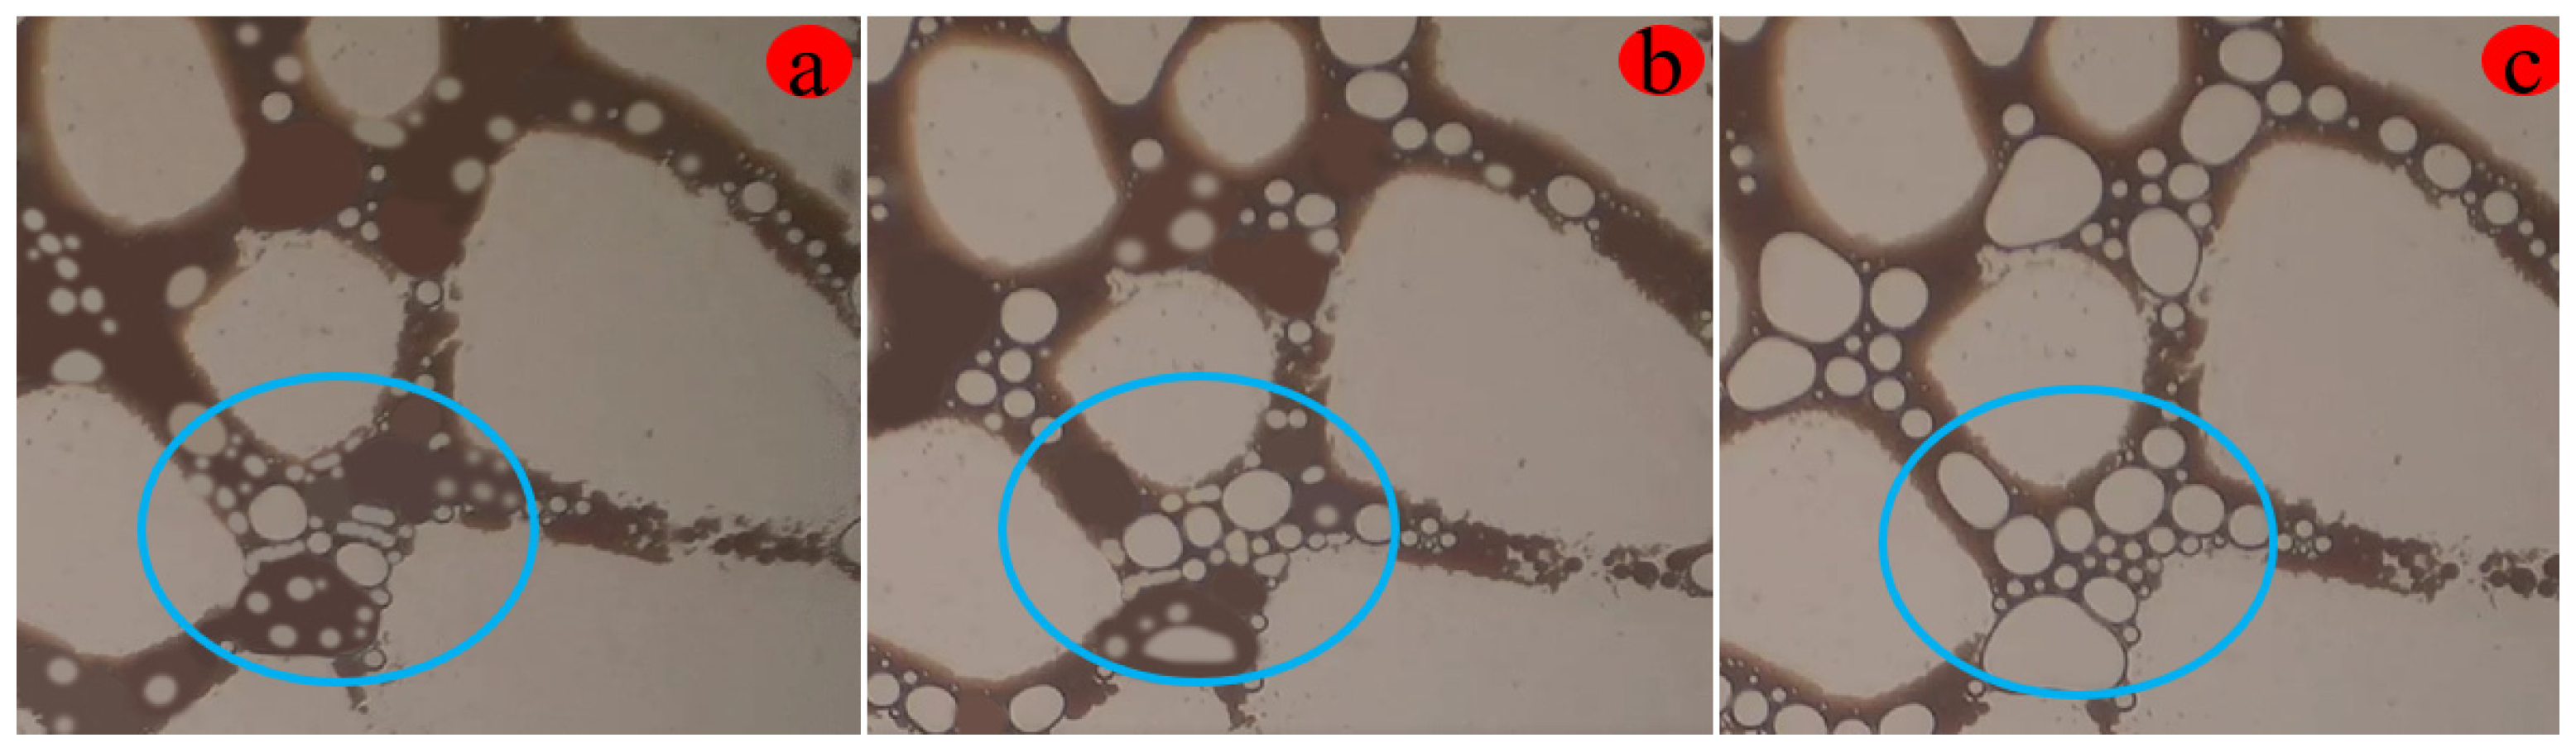
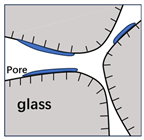
Initially, bubbles accumulate in a small pore throat (Figure 13a), and the remaining oil in the pore channels shows no significant change. The droplets in the pores remain stationary, and subsequent oil displacement has no noticeable effect. Then, the oil droplets gradually increase, and no clear oil–water slug forms in most areas (light blue circle in Figure 13b). Finally, the remaining oil mainly appears as continuous clusters, with a minor quantity of columnar and film-like oil in the near flow channel (Figure 13c).
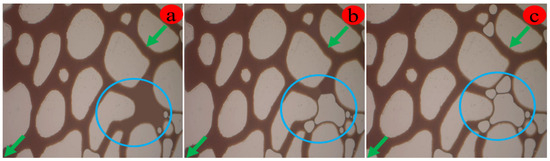
Figure 13.
Steam flooding at the far channel zone: (a) is 0.25 PV, (b) is 0.75 PV, and (c) is 1.0 PV.
- (2)
- Remaining oil occurrence pattern
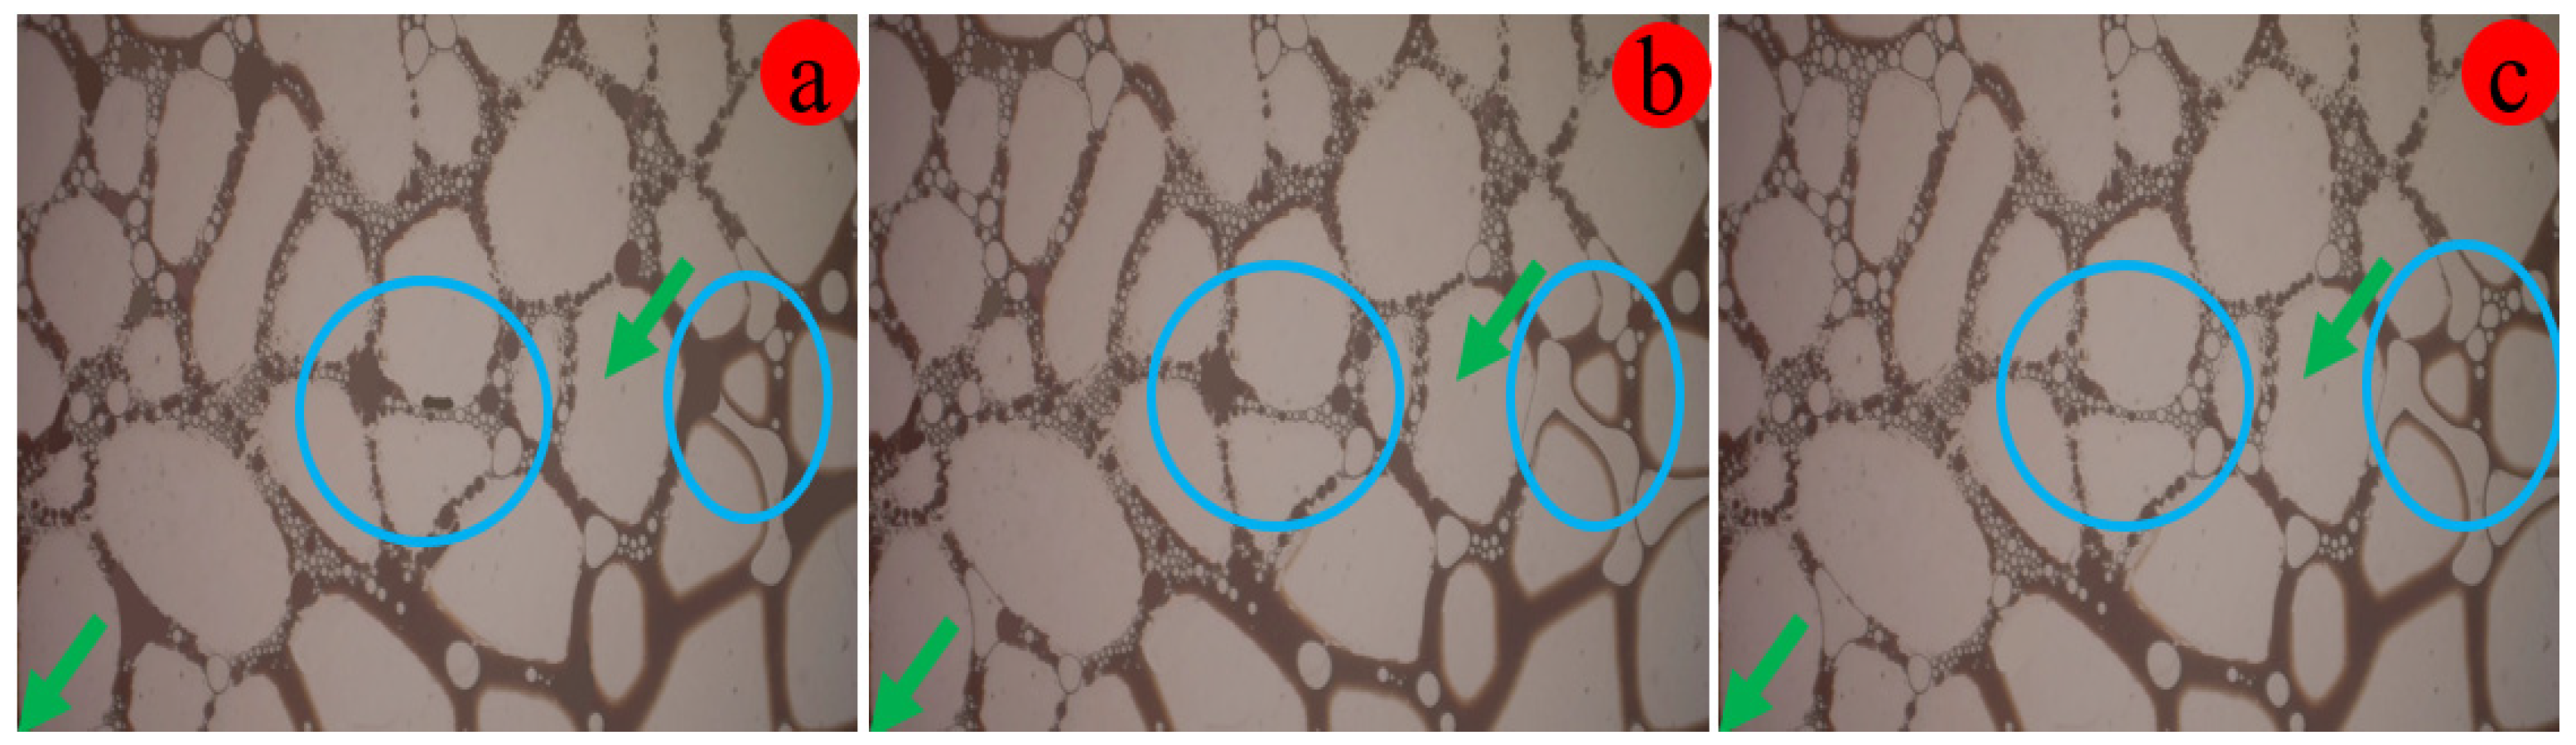
In the distant flow pathway, the residual oil primarily exists in continuous and clustered formations, accompanied by sparse columnar and film shapes. The phase of water accumulates gradually as dispersed droplets, and the steam scarcely penetrates into the distant flow pathway. In the structure of pores with a PCN of 3 to 5, the residual oil primarily forms continuous flakes and clusters, with some columnar and membranous shapes (light blue circle in Figure 14). Due to the limited steam penetration at the boundary, the residual oil within pores with a PCN of 5 remains unchanged. For a PCN of 3 to 4, the bubble volume increases, causing dispersed bubbles to connect. The longer columnar remaining oil reduces, the oil saturation in the middle pore throat decreases, and bubbles gather in the thick pore throat. Oil saturation decreases in the middle pore throat, while bubbles accumulate in the thick pore throats.
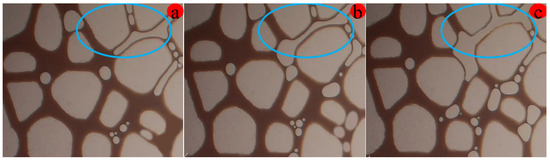
Figure 14.
Residual oil of steam flooding at far channel zone: (a) is 0.25 PV, (b) is 0.75 PV, and (c) is 1.0 PV.
4.2. NFAS Flooding Process
4.2.1. Main Channel Zone
- (1)
- Residual oil occurrence state
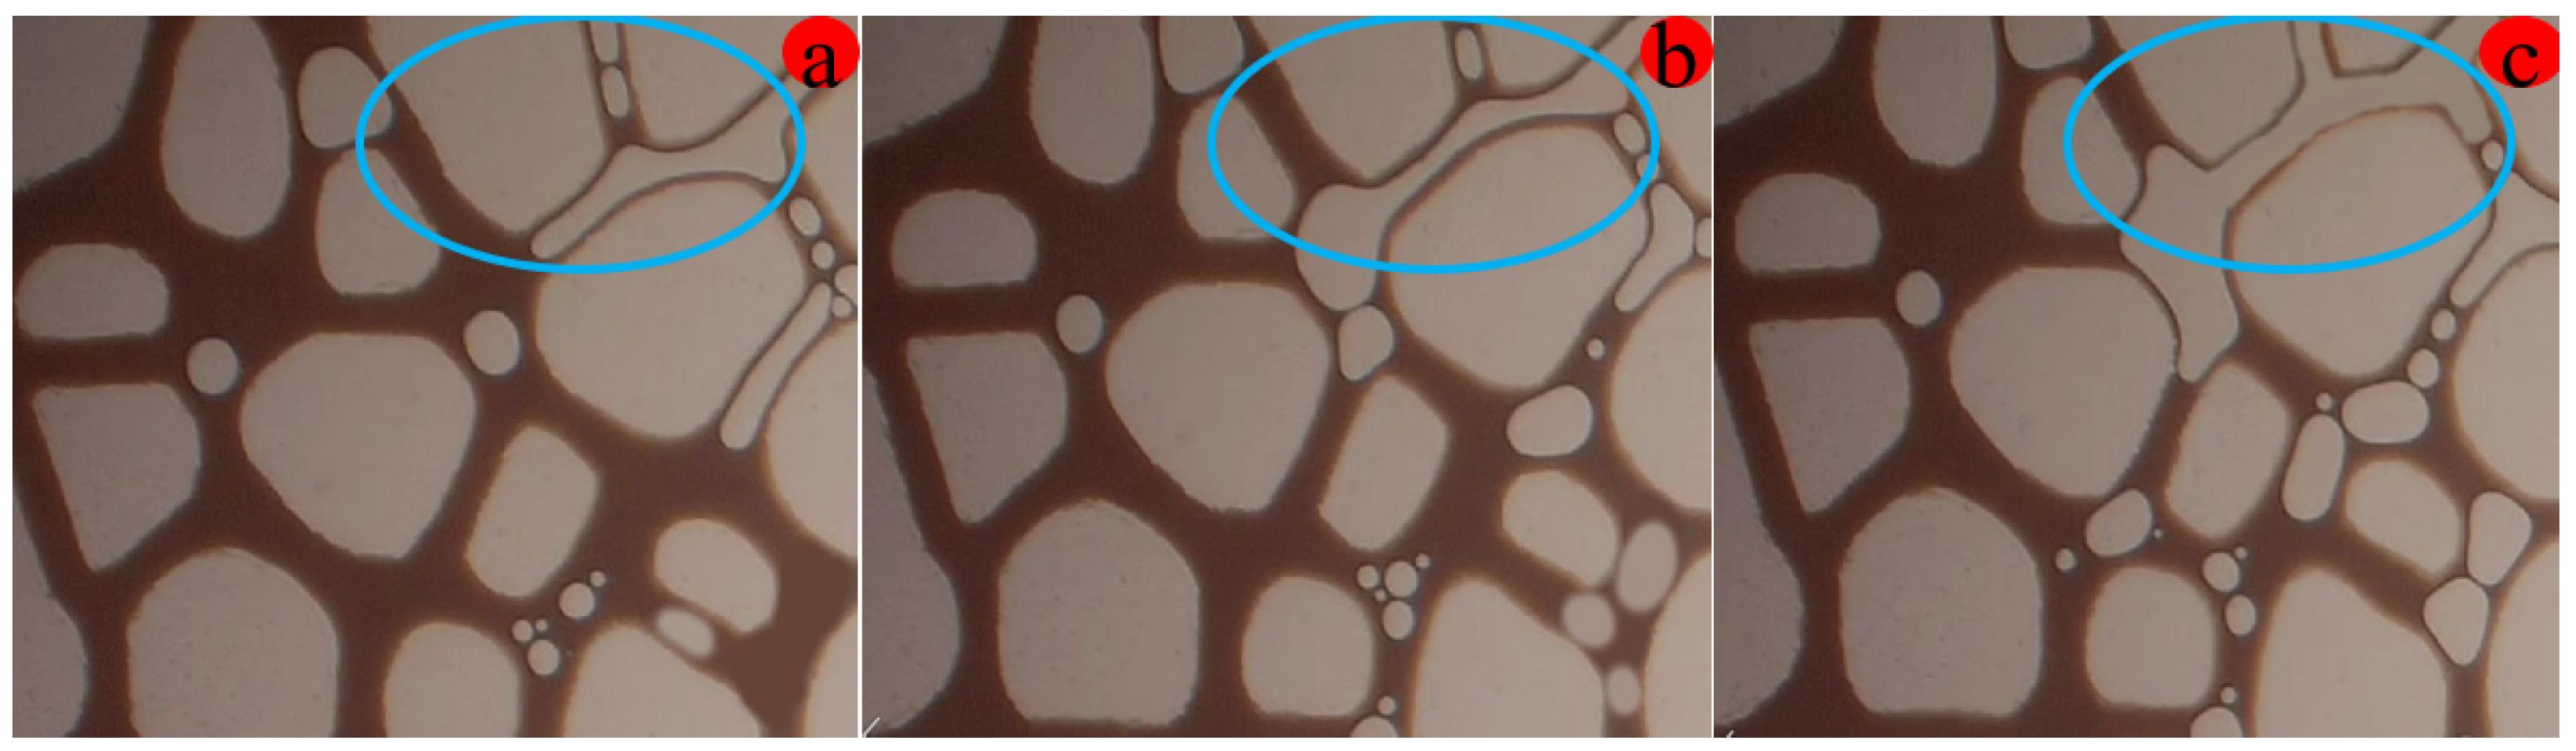
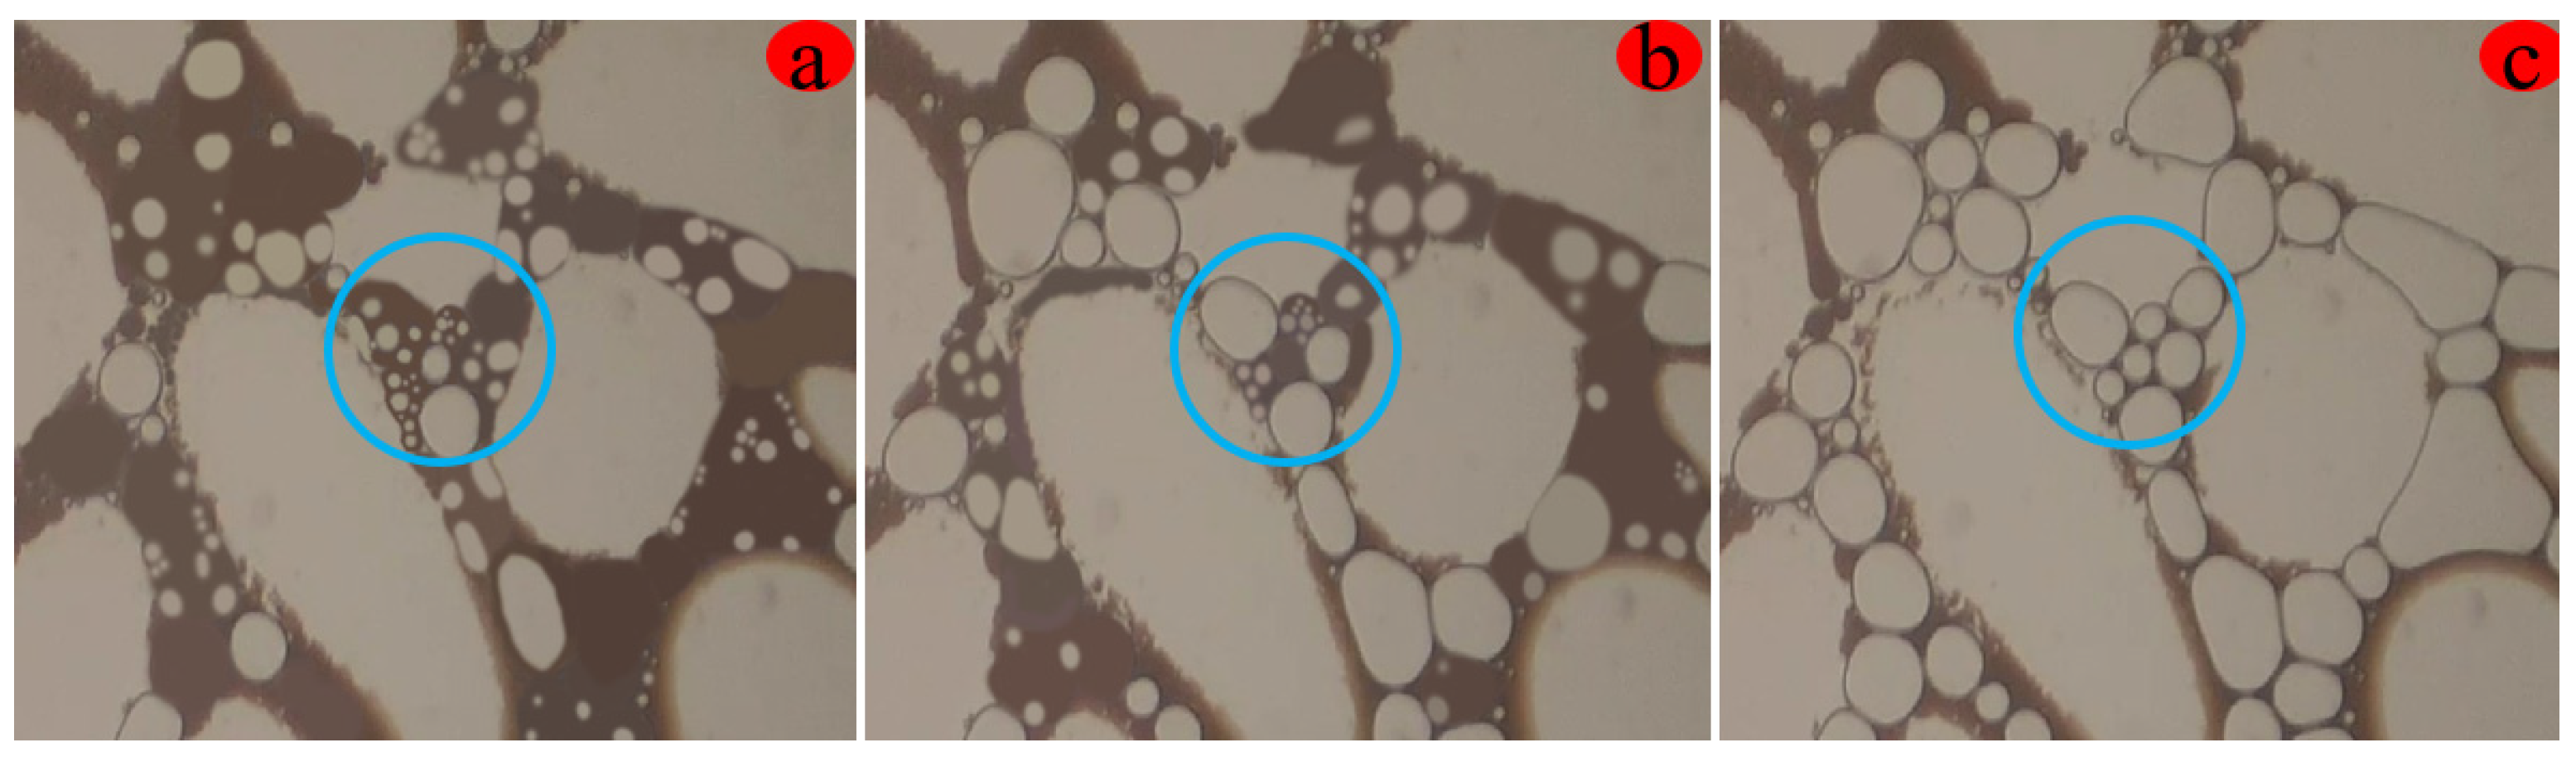
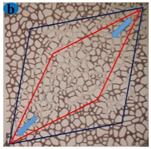
In the early stage, foam encounters greater resistance in pores, causing subsequent flow to shift towards paths with smaller pores, effectively removing remaining oil after steam flooding. In the middle stage, the foam initially enters the large pore throat, that with the least resistance. However, the foam tends to defoam, and the seepage state at the foam’s front is characterized by long and narrow large bubbles (light blue circle in Figure 15). Finally, numerous small bubbles enter the pores and merge into larger ones upon contact, altering the liquid flow direction. Foam breakage or defoaming during migration acts as a surfactant, reducing oil–water interfacial tension and resulting in minimal oil emulsification.
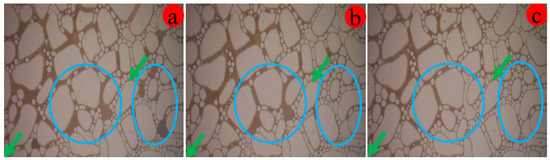
Figure 15.
NFAS flooding at the main channel zone: (a) is 1.5 PV, (b) is 2.0 PV, and (c) is 3.0 PV.
- (2)
- Residual oil occurrence pattern
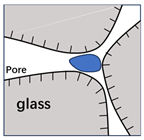
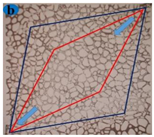
After NFAS flooding, the residual oil is predominantly an O/W emulsion resulting from emulsification and dispersion processes, and is found in a thoroughly mixed state (light blue circle in Figure 16). Dense tiny bubbles are present in the throat, with blister fluid entering the first small flow resistance of the high-permeability channels. As the number of bubbles increases, they move to low-permeability channels, expanding the swept front. Additionally, the foam increases crude oil viscosity and traps in the pore throat. In fine throats and pores, the residual oil undergoes emulsification and dispersion, and as the volume of O/W emulsion increases, the oil saturation decreases.

Figure 16.
Residual oil of main channel location of NFAS flooding: (a) is 1.5 PV, (b) is 2.0 PV, and (c) is 3.0 PV.
4.2.2. Near Channel Zone
- (1)
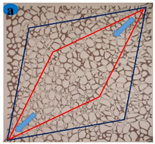
- Residual oil occurrence state
In the early stage, the amount of residual oil in long columns increases, and some foam is mixed with it. The remaining oil in the regions with poor mobility is approximately continuous-phase cluster. In the middle stage, O/W emulsion (light blue circle in Figure 17) exists in the pore channels on both sides of the pore throat, while island-type remaining oil is found in the pore throat. In the late stage, the pore channels with good circulation are filled with a large amount of O/W emulsion and residual oil in a fully mixed state. A large amount of O/W emulsion and thoroughly mixed residual oil, gas, and water occurs on one side close to the far flow channel, while a large volume of columnar residual oil mainly occurs on the other side.
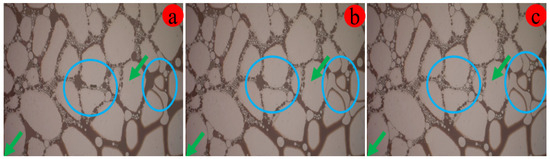
Figure 17.
NFAS flooding, at the near channel zone. (a) is 1.5 PV, (b) is 2.0 PV, and (c) is 3.0 PV.
- (2)
- Residual oil occurrence pattern
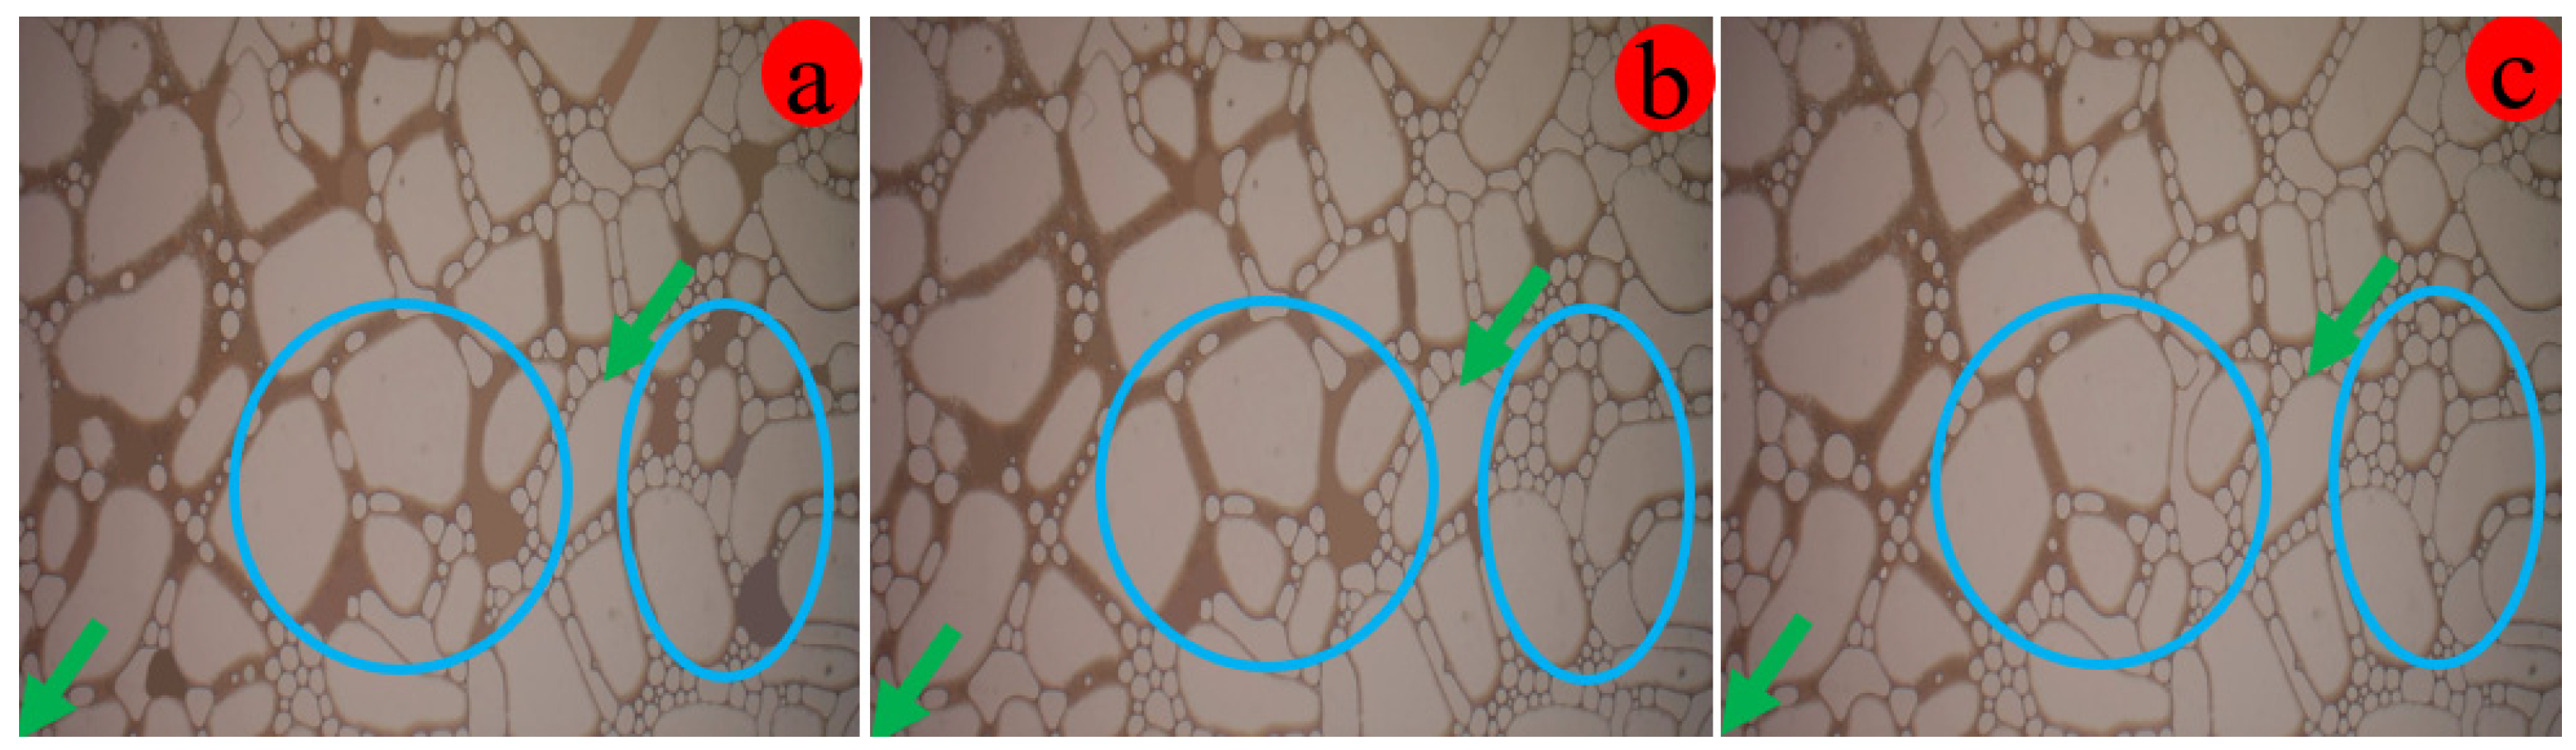
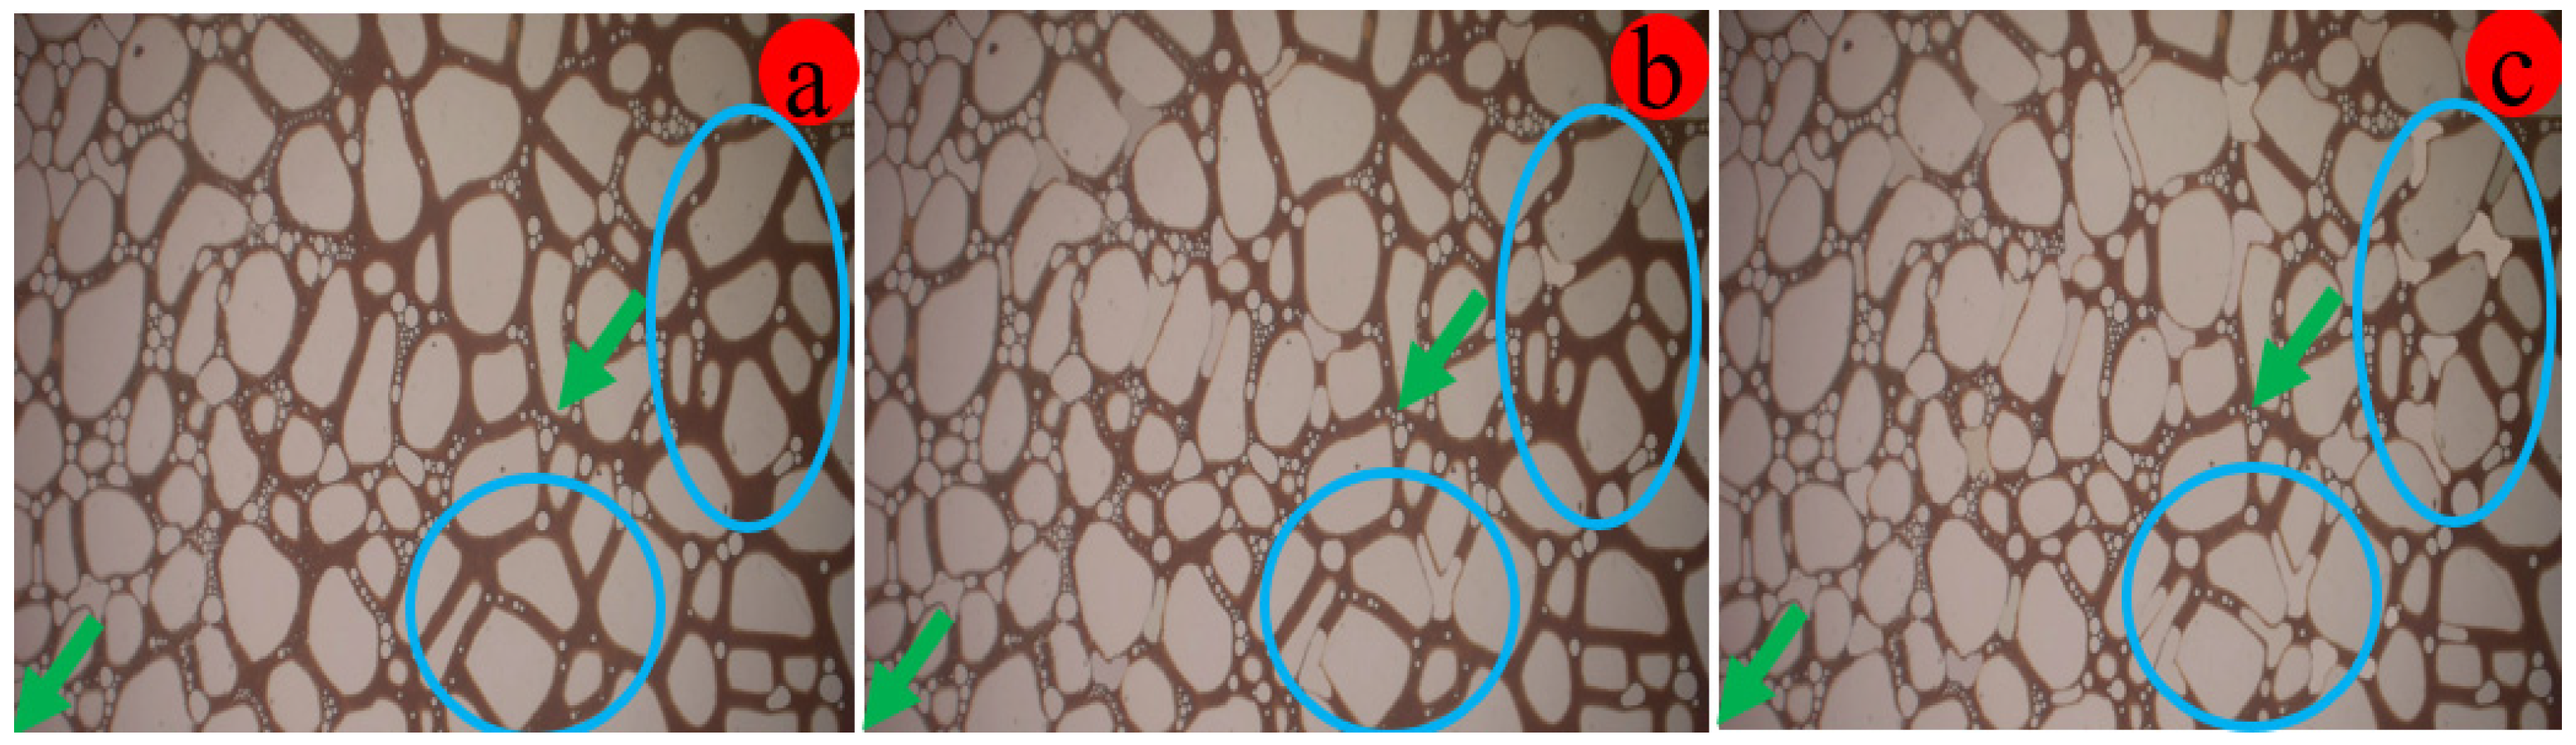
In the near flow channel, a large amount of the fully mixed residual oil in columnar and island form are formed in the pore channel. With the injection of surfactant, the foam formed can exist stably. In the far flow pathway, the oil saturation is relatively high, with a large volume of columnar residual oil. N2 foam emulsifies and disperses the oil, reducing oil–water interfacial tension, and improving oil-washing efficiency in the near channel. For a PCN of 3 to 5, oil is trapped in the O/W emulsion, blocked by foam. Foam fills the pore throats, and large foam blocks large pores, forcing fluid to low-permeability small pores. Oil remains as a film and an O/W emulsion (light blue circle in Figure 18). As the injection increases, the small foam in the mesopore accumulates and merges, reducing the amount of columnar remaining oil.
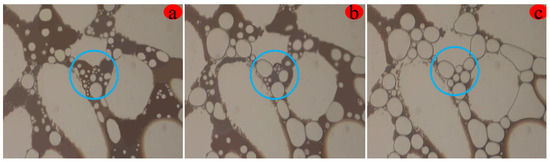
Figure 18.
Residual oil of near channel zone of NFAS flooding: (a) is 1.5 PV, (b) is 2.0 PV, and (c) is 3.0 PV.
4.2.3. Far Channel Zone
- (1)
- Residual oil occurrence state
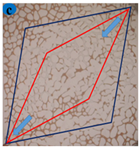
At first, the remaining oil in most areas is continuous or clustered, and many small foams exist in the pore throat. In the far flow pathway, there is mainly O/W emulsion seepage in the front of the flooding and fully mixed oil–gas–water seepage (light blue circle in Figure 19). Then, the volume of long columnar residual oil in the marginal area increases and gradually turns into a continuous cluster or sheet of remaining oil. Fine foam is included in the columnar remaining oil, mainly percolating along the pore wall. Finally, the oil saturation in the blind ends is relatively high, and an O/W emulsion forms to form the residual oil in a thoroughly mixed state of oil–gas–water.
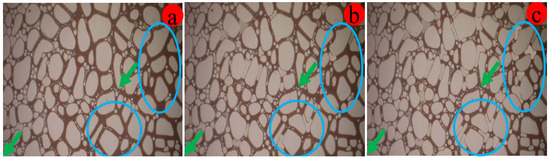
Figure 19.
NFAS flooding at the far channel zone: (a) is 1.5 PV, (b) is 2.0 PV, and (c) is 3.0 PV.
- (2)
- Residual oil occurrence pattern
Under NFAS flooding, in pore structures with a PCN of 3~4, the oil predominantly appears as an O/W emulsion after undergoing emulsification and dispersion, with a concurrent mixed phase of oil–gas–water predominantly located in the coarse and intermediate pore throats (light blue circle in Figure 20). For a PCN of 4, extensive foam formations aggregate, with the N2 foam action facilitating the stripping and emulsification of oil into filament-like emulsions, which in turn reduces interfacial tension. With increased injection, the large pore channel in the foam expands, the foam size in the larger pores stabilizes, and the quantity of O/W emulsion decreases.
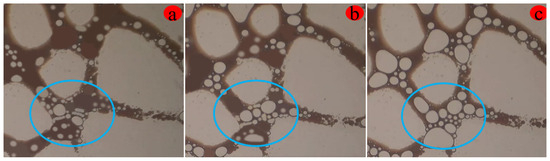
Figure 20.
Residual oil of far channel zone of NFAS flooding: (a) is 1.5 PV, (b) is 2.0 PV, and (c) is 3.0 PV.
4.3. Discussion
During the steam flooding process, the front of the flooding does not advance uniformly, and channeling is easily formed. The degree of oil flow variation is significant in the mainstream, but minimal near the port and its surrounding range. The oil–water interfacial tension is high, resulting in low oil displacement efficiency. The comprehensive distribution of residual oil within the microscopic model is presented in Table 4. NFAS flooding can improve the mobility ratio, inhibit fingering, and solve the issue of an uneven flooding front. N2 foam can block water flow channels, adjust streamlines, advance displacement fronts evenly, and expand the swept zone. The spread area of N2 foam increases significantly, with oil emulsification and dispersion at the edge. After NFAS flooding, minimal residual oil is present in the area swept by the N2 foam, significantly increasing oil flooding and recovery efficiency.
Table 4.
Overall remaining oil occurrence state in the microscopic model.
5. Conclusions
To address the limited understanding of N2 foam-assisted steam (NFAS) flooding, the flow processes of heavy oil under both steam flooding and NFAS flooding conditions were simulated using visualized etched micro-glass models. The features of residual oil in pore channels and the pore throat were studied in different channel zones and flooding stages. Based on the condition and mechanism of the residual oil at each stage of the oil displacement process, the following observations were made:
- (1)
- The parameters of N2 and the multi-effect surfactant were determined. The gas–liquid ratio of N2 and the multi-effect surfactant is 1:1, and the optimal concentration of the multi-effect surfactant is 0.5 wt%.
- (2)
- In the steam flooding stage, the residual oil assumes a columnar form, film-like, and continuous, and the remaining oil is clustered and flaky in different regions. The residual oil in the main channel is mostly distributed in the fine pore throat. In the near channel, it is mainly found in pore throats with a Pore Coordination Number (PCN) of 3 to 4. In the far flow channel, it is predominantly distributed in pore throats with a PCN of 4 to 5.
- (3)
- During NFAS flooding, there is an obvious emulsification and dispersion phenomenon, and the remaining oil in different regions is significantly different. The remaining oil appears as an O/W emulsion and in columnar, film, and island forms. After NFAS flooding, the remaining oil is dispersed in each throat of the main channel. In the near channel, the residual oil is mostly blocked by foam in pore throats with a PCN of 4 to 5. In the far channel, the remaining oil is distributed in the thick and middle pore throats.
Author Contributions
Conceptualization, Q.F.; methodology, Z.Y.; software, Z.Y.; investigation, Y.L.; data curation, M.C.; writing—original draft preparation, Z.Y.; project administration, Q.F.; funding acquisition, Q.F. All authors have read and agreed to the published version of the manuscript.
Funding
This research was funded by the Study on the National Natural Science Foundation of China (No. U22B2074).
Data Availability Statement
The original contributions presented in the study are included in the article; further inquiries can be directed to the corresponding authors.
Acknowledgments
The authors would like to thank Shengli Oilfield Huabin Chemical Co., Ltd for providing chemicals and its products.
Conflicts of Interest
The authors Qiang Fu, Yongfei Liu, and Mingqiang Chen are employed by the CNOOC Research Institute Ltd.; the remaining authors declare that the research was conducted in the absence of any commercial or financial relationships that could be construed as a potential conflict of interest.
References
- Whorton, L.P.; Brownscombe, E.R.; Dyes, A.B. Method for Producing Oil by Means of Carbon Dioxide. U.S. Patent No. 2,623,596, 30 December 1952. [Google Scholar]
- Mohan, H.; Carolus, M.; Biglarbigi, K. The Potential for Additional Carbon Dioxide Flooding Projects in the United States. In Proceedings of the SPE Symposium on Improved Oil Recovery, Tulsa, OK, USA, 19–23 April 2008. [Google Scholar]
- Romero, C.; Alvarez, J.M.; Müller, A.J.; Bolívar, U.S. Micromodel Studies of Polymer-Enhanced Foam Flow Through Porous Media. In Proceedings of the SPE/DOE Improved Oil Recovery Symposium, Tulsa, PK, USA, 13–17 April 2002. [Google Scholar]
- Farajzadeh, R.; Wassing, B.; Boerrigter, P. Foam Assisted Gas Oil Gravity Drainage in Naturally-Fractured Reservoirs. In Proceedings of the SPE Annual Technical Conference and Exhibition, Florence, Italy, 20–22 September 2010. [Google Scholar]
- Kovscek, A.R.; Radke, C.J. Fundamentals of Foam Transport in Porous Media. In Foams: Fundamentals and Applications in the Petroleum Industry; American Chemical Society: Washington, DC, USA, 1994; Volume 242, pp. 115–163. [Google Scholar]
- Pancharoen, M.; Fernø, M.A.; Kovscek, A.R. Modeling foam displacement in fractures. J. Pet. Sci. Eng. 2012, 100, 50–58. [Google Scholar] [CrossRef]
- Yan, W.; Miller, C.A.; Hirasaki, G.J. Foam sweep in fractures for enhanced oil recovery. Colloids Surf. A Physicochem. Eng. Asp. 2006, 282–283, 348–359. [Google Scholar] [CrossRef]
- Borchardt, J.K.; Bright, D.B.; Dickson, M.K.; Wellington, S.L. Surfactants for CO2 Foam Flooding. In Proceedings of the SPE Annual Technical Conference and Exhibition, Las Vegas, NV, USA, 22–15 September 1985. [Google Scholar]
- Nguyen, Q.P.; Rossen, W.R.; Zitha, P.L.J.; Currie, P.K. Determination of Gas Trapping with Foam Using X-ray Computed Tomography and Effluent Analysis. SPE J. 2009, 14, 222–236. [Google Scholar] [CrossRef]
- Roozbahani, A.; Soofivand, F.; Al-Tameemi, A.S.H.; Abdollahi, H.; Saatchi, S.; Ansari, A. A contrasting analysis of CO2 and N2 foam flood for enhanced oil recovery and geological storage of CO2. Pet. Res. 2024, 9, 55–60. [Google Scholar] [CrossRef]
- Pang, Z.; Liu, H.; Zhu, L. A laboratory study of enhancing heavy oil recovery with steam flooding by adding nitrogen foams. J. Pet. Sci. Eng. 2015, 128, 184–193. [Google Scholar] [CrossRef]
- Zhang, Y.; Li, B.; Lu, T.; Li, Z.; Zeng, X.; Song, Y. Adaptation study on nitrogen foam flooding in thick reservoirs with high water cut and high permeability. Colloids Surf. A Physicochem. Eng. Asp. 2023, 657, 130539. [Google Scholar] [CrossRef]
- Liang, T.; Hou, J. Fluids flow behaviors of nitrogen and foam-assisted nitrogen floods in 2D visual fault-karst carbonate reservoir physical models. J. Pet. Sci. Eng. 2021, 200, 108286. [Google Scholar] [CrossRef]
- Gamadi, T.D.; Sheng, J.J.; Soliman, M.Y. An Experimental Study of Cyclic Gas Injection to Improve Shale Oil Recovery. In Proceedings of the SPE Annual Technical Conference and Exhibition, Tulsa, OK, USA, 14–18 April 2013. [Google Scholar]
- Yu, Y.; Sheng, J.J. In An Experimental Investigation of the Effect of Pressure Depletion Rate on Oil Recovery from Shale Cores by Cyclic N2 Injection. In Proceedings of the SPE/AAPG/SEG Unconventional Resources Technology Conference, San Antonio, TX, USA, 20–22 July 2015. [Google Scholar]
- Naylor, P.; Frørup, M. Gravity-Stable Nitrogen Displacement of Oil. In Proceedings of the SPE Annual Technical Conference and Exhibition, San Antonio, TX, USA, 8–11 October 1989. [Google Scholar]
- Wei, P.; Pu, W.; Sun, L.; Wang, B. Research on nitrogen foam for enhancing oil recovery in harsh reservoirs. J. Pet. Sci. Eng. 2017, 157, 27–38. [Google Scholar] [CrossRef]
- Vicencio, O.A.; Sepehrnoori, K.; Miller, M.A. Simulation of Nitrogen Injection into Naturally Fractured Reservoirs. In Proceedings of the SPE International Petroleum Conference in Mexico, Puebla Pue, Mexico, 7–9 November 2004. [Google Scholar]
- Wu, X.; Ling, K.; Liu, D. Nitrogen Injection Experience to Development Gas and Gas Condensate Fields in Rocky Mountains. In Proceedings of the International Petroleum Technology Conference, Beijing, China, 26–28 March 2013. [Google Scholar]
- Rezaee, M.; Hosseini-Nasab, S.M.; Fahimpour, J.; Sharifi, M. New Insight on improving foam stability and foam flooding using fly-ash in the presence of crude oil. J. Pet. Sci. Eng. 2022, 214, 110534. [Google Scholar] [CrossRef]
- Yang, J.; Hou, J. Experimental study on gas channeling characteristics of nitrogen and foam flooding in 2D visualized fractured-vuggy model. J. Pet. Sci. Eng. 2020, 192, 107334. [Google Scholar] [CrossRef]
- Li, Y.; Di, Q.; Hua, S.; Jia, X.; Zhou, X.; Wang, W.; Chen, H. Visualization of Foam Migration Characteristics and Displacement Mechanism in Heterogeneous Cores. Colloids Surf. A Physicochem. Eng. Asp. 2020, 607, 125336. [Google Scholar] [CrossRef]
- Yu, Y.; García, B.F.; Saraji, S. Surfactant viscoelasticity as a key parameter to improve supercritical CO2 foam stability/foamability and performance in porous media. J. Non-Newton. Fluid Mech. 2020, 282, 104311. [Google Scholar] [CrossRef]
- Tao, L.; Liu, X.; Shang, H.; Zhang, N.; Shi, W.; Bai, J.; Xu, Z.; Zhu, Q.; Zhong, Y. Effects Evaluation on Multiround Injection of a N2 Foam & Viscosity Reducer to Improve the Recovery of Fault-Block Heavy Oil Reservoir with Edge-Bottom Water: A Two-Dimensional Visualization Experimental Study. Energy Fuels 2023, 37, 18785–18800. [Google Scholar]
- Shi, W.; Ma, Y.; Tao, L.; Zhang, N.; Ma, C.; Bai, J.; Xu, Z.; Zhu, Q.; Zhong, Y. Study of the Enhanced Oil Recovery Mechanism and Remaining Oil State of Heavy Oil after Viscosity-Reducer-Assisted CO2 Foam Flooding: 2D Microvisualization Experimental Case. Energy Fuels 2023, 37, 18620–18631. [Google Scholar] [CrossRef]
- Shi, W.; Xu, L.; Tao, L.; Zhu, Q.; Bai, J. Flow behaviors and residual oil characteristics of water flooding assisted by multi-effect viscosity reducer in extra heavy oil reservoir. Pet. Sci. Technol. 2022, 41, 1231–1249. [Google Scholar] [CrossRef]
- Jiang, Y.; Killough, J.E.; Wu, X.; Cui, Y. Transient Temperature Impact on Deep Reservoir Fracturing. Geofluids 2021, 2021, 6653442. [Google Scholar] [CrossRef]
- Jiang, Y.; Yuan, F.; Zhang, Y.; Wu, X. Transient Heat Behaviours in Well and Surrounding Formation. In Proceedings of the Second Thermal and Fluids Engineering Conference, Las Vegas, NV, USA, 2–5 April 2017. [Google Scholar] [CrossRef]
- Jiang, Y.; Killough, J.E.; Cui, Y. A Numerical Simulation Approach for Shale Fracture Network Characterization Using Hybrid EDFM Method. Lithosphere 2021, 2021, 4254028. [Google Scholar] [CrossRef]
- Jiang, Y.; Killough, J.E.; Cui, Y. EDFM-based Multi-Continuum Shale Gas Simulation with Low Velocity Non-Darcy Water Flow Effect. In Proceedings of the SPE Reservoir Simulation Conference, On-Demand, Online, 4–6 October 2021. SPE-203988-MS. [Google Scholar] [CrossRef]
- Jiang, Y. Transient Temperature Behavior in Wellbore and Surrounding Formation. 12 May 2017. Available online: https://hdl.handle.net/11244/50876 (accessed on 17 June 2024).
- Bondarenko, A.V.; Islamov, S.R.; Mardashov, D.V. Features of oil well killing in abnormal carbonate reservoirs operating conditions. In Proceedings of the 15th Conference and Exhibition Engineering and Mining Geophysics, Gelendzhik, Russia, 22–26 April 2019; pp. 629–633. [Google Scholar] [CrossRef]
- Islamov, S.; Islamov, R.; Shelukhov, G.; Sharifov, A.; Sultanbekov, R.; Ismakov, R.; Agliullin, A.; Ganiev, R. Fluid-Loss Control Technology: From Laboratory to Well Field. Processes 2024, 12, 114. [Google Scholar] [CrossRef]
- Babadagli, T.; Al-Bemani, A.; Boukadi, F.; Iyoho, A.W. EOR Possibilities for Development of a Mature Light-Oil Reservoir in Oman. In Proceedings of the SPE Asia Pacific Improved Oil Recovery Conference, Kuala Lumpur, Malaysia, 20–21 October 2001. [Google Scholar]
- Srivastava, M.; Zhang, J.; Nguyen, Q.P.; Pope, G.A. A Systematic Study of Alkaline-Surfactant-Gas Injection as an EOR Technique. In Proceedings of the SPE Annual Technical Conference and Exhibition, New Orleans, LA, USA, 4–7 October 2009. [Google Scholar]
- Denoyelle, L.; Bardon, C.; de Murville, E.C. Interpretation of a CO2/N2 Injection Field Test in a Moderately Fractured Carbonate Reservoir. SPE Reserv. Eng. 1988, 3, 220–226. [Google Scholar] [CrossRef]
- Nafisi, F.; Tavakoli, V. The role of textural parameters of industrial core CT scan images in detecting the petrophysical characteristics of carbonate reservoirs, Permian Dalan Formation, the central Persian Gulf. Geoenergy Sci. Eng. 2023, 230, 212277. [Google Scholar] [CrossRef]


Disclaimer/Publisher’s Note: The statements, opinions and data contained in all publications are solely those of the individual author(s) and contributor(s) and not of MDPI and/or the editor(s). MDPI and/or the editor(s) disclaim responsibility for any injury to people or property resulting from any ideas, methods, instructions or products referred to in the content. |
© 2024 by the authors. Licensee MDPI, Basel, Switzerland. This article is an open access article distributed under the terms and conditions of the Creative Commons Attribution (CC BY) license (https://creativecommons.org/licenses/by/4.0/).