Article

Investigation into the Variation Law of Network Fracture Conductivity in Unconventional Oil and Gas Reservoirs

1
Petroleum Engineering Technology Research Institute, Sinopec Southwest Oil and Gas Company, Deyang 618000, China
2
School of Petroleum Engineering, Yangtze University, Wuhan 430100, China
3
Key Laboratory of Drilling and Production Engineering for Oil and Gas, Wuhan 430100, China
*
Author to whom correspondence should be addressed.
Processes 2024, 12(9), 1803; https://doi.org/10.3390/pr12091803 (registering DOI)
Submission received: 28 July 2024 / Revised: 19 August 2024 / Accepted: 21 August 2024 / Published: 25 August 2024
(This article belongs to the Special Issue Recent Advances in Hydrocarbon Production Processes from Geoenergy)

Abstract

:
The network fracturing technique is a key technology for increasing effective reservoir volume and enhancing production in shale oil and gas. The fracture network’s conductivity is one of the crucial factors affecting the efficient development of shale gas. To evaluate the variation patterns and influencing factors of the conductivity of network fractures, this study employed a proppant conductivity evaluation system and an equivalent theory testing method. It investigated the conductivity of propped and self-propped fractures under different angles and numbers of fractures. Experimental results showed that fractures with proppant support had higher conductivity than unsupported fractures. Smaller angles between secondary and main fractures resulted in greater conductivity. The conductivity of multi-fracture structures increased with the number of fractures. Under low-closure pressure conditions, self-propped fractures exhibited significantly higher conductivity than propped fractures, but this trend reversed under high closure pressure. This experimental research provides guidance for constructing network fractures with high conductivity in unconventional oil and gas reservoir fracturing.

1. Introduction

China possesses enormous shale gas resource potential, yet exploration and development are still in their infancy, with hydraulic fracturing technology continuously evolving and improving [1]. Currently, the prevalent method involves multi-stage hydraulic fracturing in horizontal wells, adjusting fluid and proppant volumes to enhance artificial fracture complexity and improve reservoir fluid flow dynamics [2]. The degree of fracture development is crucial to shale gas reservoir quality, as fractures provide storage space and serve as primary pathways for gas migration within shale formations.
Different types and scales of fractures play varying roles in shale development [3]. Previous studies by Cui Mingyue [4] and others have characterized reservoir modification through complex fracture networks, analyzing factors influencing the formation of these networks. Research indicates that the hydraulic complexity index of reservoirs is influenced by both geological and engineering factors. Han Huifen [5] and Sun Chen [6], among others, simulated supported and self-propping artificial core fractures with varying fracture porosity. They utilized API (American Petroleum Institute) shale permeability testing to reveal degradation patterns in hydraulic conductivity under factors such as fluid type, fracture slip and number of fractures. Fredd [7], Zhang J [8], Cipolla [9] and others characterized the effects of fracture conductivity through measurements of electrical conductivity across fractures, and conducted tests on varying fracture spacings and proppant distributions, discovering that certain natural fracture spacings can lead to enhanced electrical conductivity, thus demonstrating improved flow capabilities. Researchers including Gao Shuaiqiang [10], Liu Jiajie [11], Ning Wenxiang [12], Cao Haitao [13], Zhu Haiyan [14], Wen Qingzhi [15] and others undertook conductivity testing on single fracture types under different effective stress conditions, comparing and analyzing variations in conductivity between supported and self-propping fractures. Zhang Han [16], applying principles of hydrodynamic similarity, categorized post-fracturing complex fracture networks into supported and self-propping types. They proposed the concept of equivalent fractures, establishing an optimization model for conductivity based on fracture morphology and elucidating the relationships between the conductivity of these two fracture types. Notably, these studies did not consider variations in the conductivity of self-propping and proppant-supported fractures under different closure pressures.
This study employs a proppant long-term conductivity system evaluation device, utilizing an API standard flow chamber and experimentally fabricated shale samples with varying angles and numbers of fissures. By comparing the conductivity differences between propped fractures and self-propped fractures at different closure pressures, the impact of fracture network morphology on conductivity is analyzed. This research aims to provide guidance and reference for optimizing parameters in fracture network fracturing processes.

2. Experimental Installation and Experimental Procedures

2.1. Experimental Installation

In this research, a device for long-term proppant conductivity capacity system evaluation was used to conduct experiments on testing fracture conductivity. This device consists of a model testing system, a pressure compensation system, a fluid injection system, a data collection system (computer) and other auxiliary devices. The maximum closing pressure in the diversion chamber is 100 MPa, the maximum working temperature is 150 °C and the maximum liquid flow rate is 0.2 L/min. Laboratory equipment is shown in Figure 1.

2.2. Cutting Plan for the Experimental Rock Plate

In this paper, the effects of the closure pressure, the angle of branching joints and the number of branching joints on the fracture conductivity were comprehensively considered, indoor tests on the conductivity of fractures were carried out to compare the conductivity difference between the two types of fractures (proppant-supported fracture and sliding self-supported fracture) and 12 sets of experiments were carried out. The specific experiment scheme is shown in Table 1.
The self-supported and proppant-supported experimental slabs were processed based on the experimental scheme. The cutting schemes for the main joint and branching joint of the two types of crack test rock slabs are the same, and both of them were processed by the line-cutting method. The splitting method was adopted for the main joint of the self-supported crack to simulate cracking. The angle between the branching joint and the main joint (hereinafter abbreviated as the branching joint angle) and the amount of branching joints are consistent with the proppant crack test scheme. Taking a proppant crack as an example, the rock slab was cut into two sections of 176 mm in length, 37 mm in width and 25 mm in height. Sand was spread evenly in the middle of the rock slabs, and this group (without branched joint) was set as the basic control group (Figure 2aA).
The position 19 mm to the right of the inlet end of the test fluid (the position without radian) shall be deemed the starting point of measurement. The setting method of the branch seam should be the main seam, which is the bottom symmetrical cut on the datum plane. One branch seam is set at the position 69 mm away from the starting point, and the branch seam angle should be 30°. Two branch seams shall be set and, on the basis of this seam, a branch seam shall be added with an angle of 30° at the starting point and branch seam. Three branch seams shall be set at locations of 0 mm, 46.5 mm and 93 mm away from the starting point, and the branch seam angle shall be 30°. Four branch seams shall be set at locations of 0 mm, 34 mm, 68 mm and 102 mm away from the starting point, and the branch seam angles should all be 30°. One branch seam shall be set at the same location as that in Figure 2aC, and the branch seam angle shall be 60°.

2.3. Experimental Procedures

The systematic evaluation device for proppant long-term conductivity was used to evaluate the conductivity of netted fractures. The main steps are as follows: (1) Install the lower cover plate and the lower rock plate in the diversion chamber in turn, spread the proppant evenly on the lower rock plate of the diversion chamber and install the upper rock plate and the upper cover plate of the diversion chamber. (2) Install the flow guide chamber on the hydraulic press, and adjust the closing pressure to 14 MPa. (3) Put fresh water into the pumping liquid container, set a liquid flow rate of 5 mL/min and start pumping liquid. (4) After pumping the liquid for 15 min, wait for the pressure difference to stabilize and record the upstream and downstream pressure difference. Adjust the closing pressure to 27 MPa. Record the pressure difference again when the pressure difference stabilizes after 15 min. (5) Keep changing the closing pressure until the slab displacements and upstream and downstream pressure difference under all target closing pressures have been recorded. (6) Shut down the pumps and release the sealing pressure. The rock slab was taken out and the proppant on the surface was brushed away; photos were taken to record the changes in the rock surface.
The proppant used in the experiment was configured by proportioned mixing; 70/140 mesh and 40/70 mesh ceramisite were mixed at 3:2 (Figure 3 right). The concentration of sanding in the main joint was 5 kg/m2, and the concentration of sanding in the support joint was 3 kg/m2.

3. Analysis of Conductivity Experiments

3.1. Experimental Principle

The propping cracks were filled with proppant in the flow diversion chamber to form a proppant filling layer flow diversion channel. The self-supporting cracks relied on the rough protrusion of the cracks caused by the shear sliding of the split surface to support the cracks and establish the flow diversion channel. Using the equivalence theory, the flow diversion ability of the cracks of different seam network structures could be equivalent to the flow diversion ability of the main seam. Under different closing pressures, the test fluid passed through the flow conducting channel, the flow rate and pressure difference at both ends of the test rock plate were recorded and the fluid viscosity was found; the principle of flow conducting capacity testing can be expressed as Darcy’s law:
k = Q μ L A Δ P
In the equation, (k) [17] represents the permeability of supported or self-supporting fractures, μm2; (Q) stands for the flow rate within the fracture, cm3/s; (μ) denotes fluid viscosity, mPa·s; (L) is the distance between pressure measurement points (test ports), cm; (A) represents the cross-sectional area of the fracture, cm2; and (ΔP) indicates the pressure differential between the two ends of the test section, kPa.
The proppant long-term conductivity system evaluation device utilizes an API standard diversion chamber. The equivalent fracture network conductivity can be expressed as
k = 5.555 Q μ Δ P w f
In the equation, Wf represents the width of the fracture, cm.
The equivalent conductivity of the fracture can be expressed as
k W f = 5.555 Q μ Δ P
In the experiments, the conductivity of the fracture can be determined based on the measured pressure differential and flow rate using the equation above.

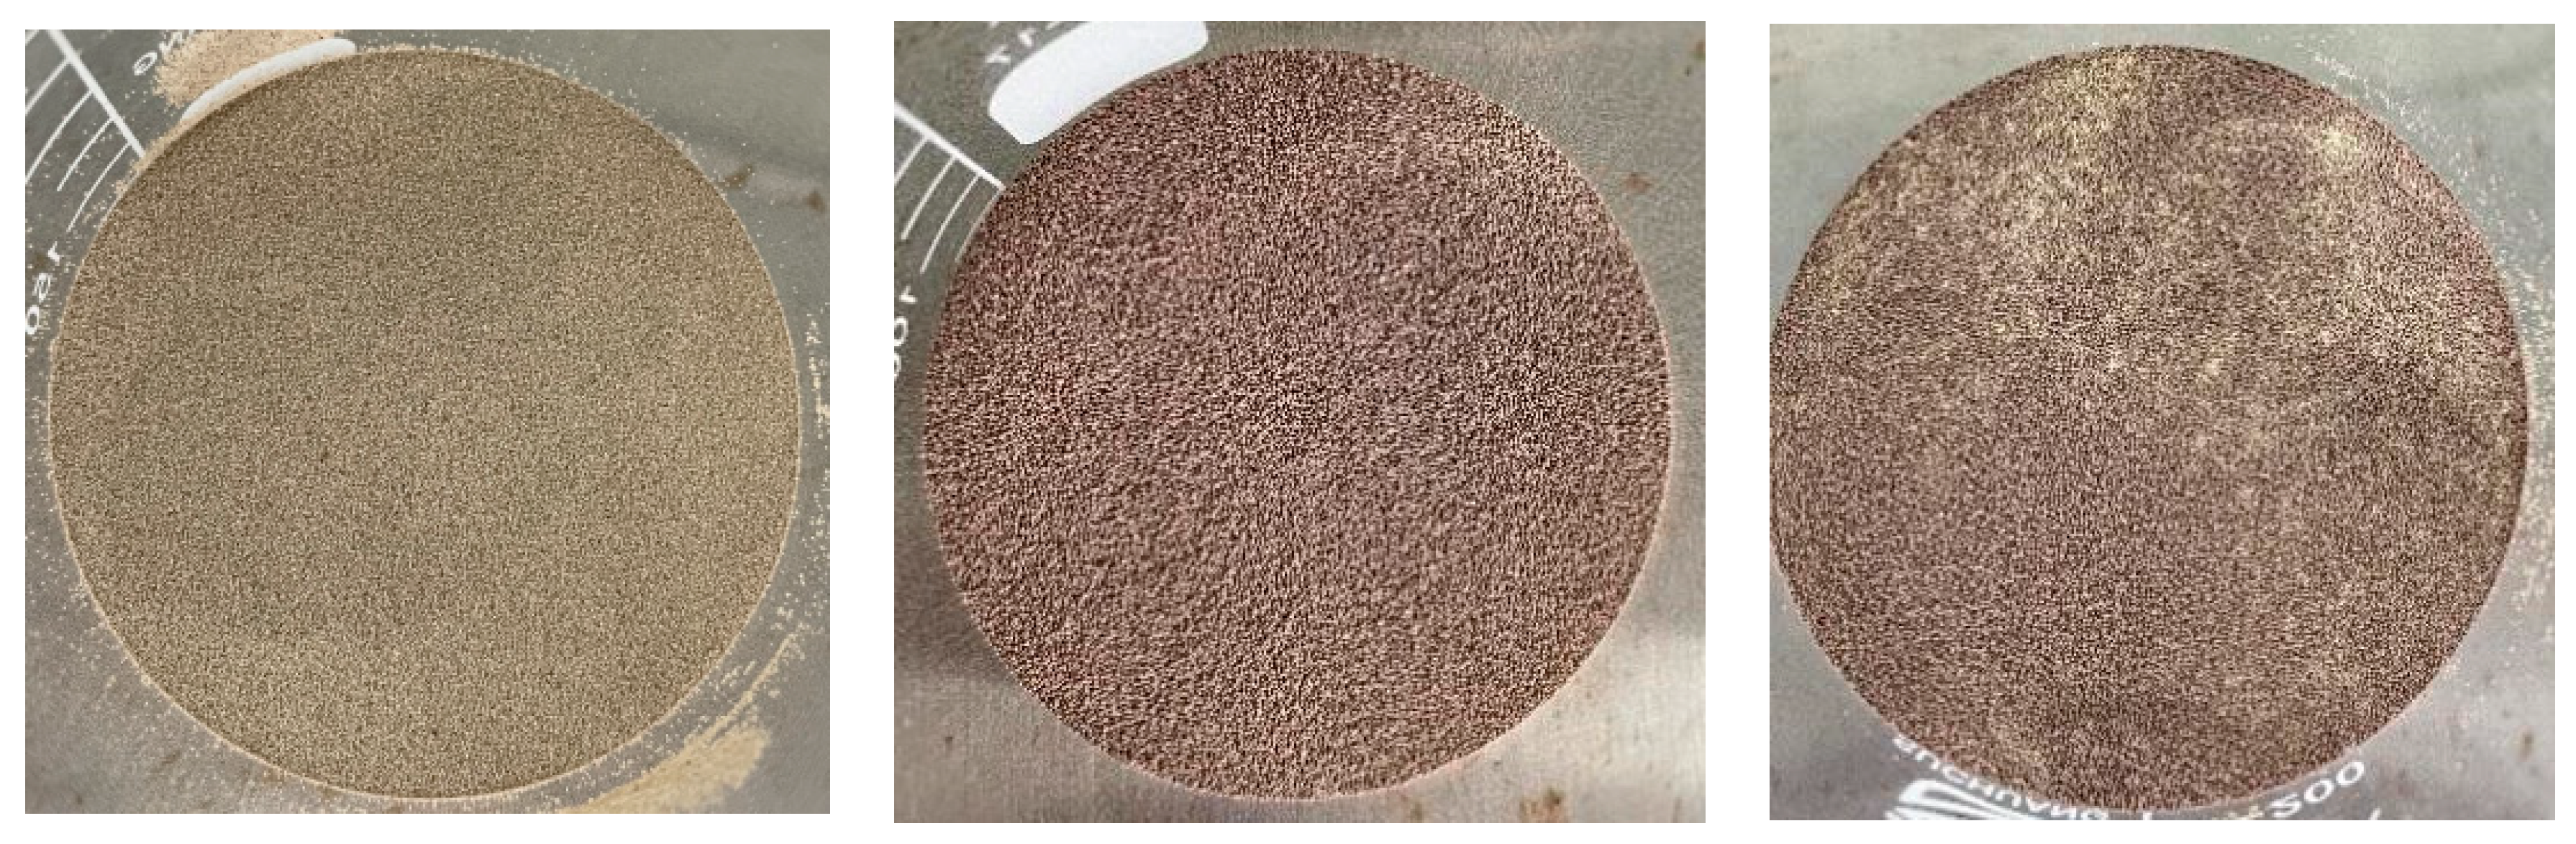
3.2. The Experiment on Proppant Fracture Conductivity

To investigate the variation in fracture conductivity of proppants with different fracture network structures, six pairs of propped fracture experimental rock plates were prepared. The fracture network structures consisted of one primary fracture at 60° (no branching fractures), one primary fracture at 30° with branching fractures, two branching fractures at 30°, three branching fractures at 30°, four branching fractures at 30° and two branching fractures at 60°. Proppants used were a 3:2 mixture of 70/140 and 40/70 ceramics, with a sand concentration of 5 kg/m2 for the primary fracture and 3 kg/m2 for each angled branching fracture, uniformly applied. The rock plate with one primary fracture at 0° (no branching fractures) was selected as the experimental control group. Water was used as the testing fluid, and the fracture conductivity was tested under five different closure pressures: 14 MPa, 27 MPa, 41 MPa, 55 MPa and 69 MPa. Experimental results are shown in Figure 4.
Based on experimental data, plots were created to illustrate the variations in proppant fracture conductivity with different numbers and angles of branching fractures. From the conductivity trends in proppant fractures in Figure 5, the following observations can be made: (1) The trend in fracture conductivity of the supported joint structure and unsupported joint structure with increasing closure pressure was the same, and the fracture conductivity of both structures decreased gradually with increasing closure pressure. (2) The fracture conductivity capacity decreased significantly at low closure pressure (less than 41 MPa) and decreased slightly at high closure pressure (more than 41 MPa). (3) Regardless of the number of supported joints and the angle between the main supported joints, the conductivity of fractures with supported joints was always higher than that of fractures without supported joints. (4) The higher the number of branched fractures, the greater the conductivity, and the conductivity of the fracture network with two branched fractures was significantly higher than that of the fracture with only one branched fracture. However, when the number of branch joints was further increased, that is, when the number of branch joints was more than two, the change in conductivity was not obvious. (5) If there were also two branching joints, the measured fracture conductivity in support of the 30° jointed structure was clearly higher than that of the 60° jointed structure.

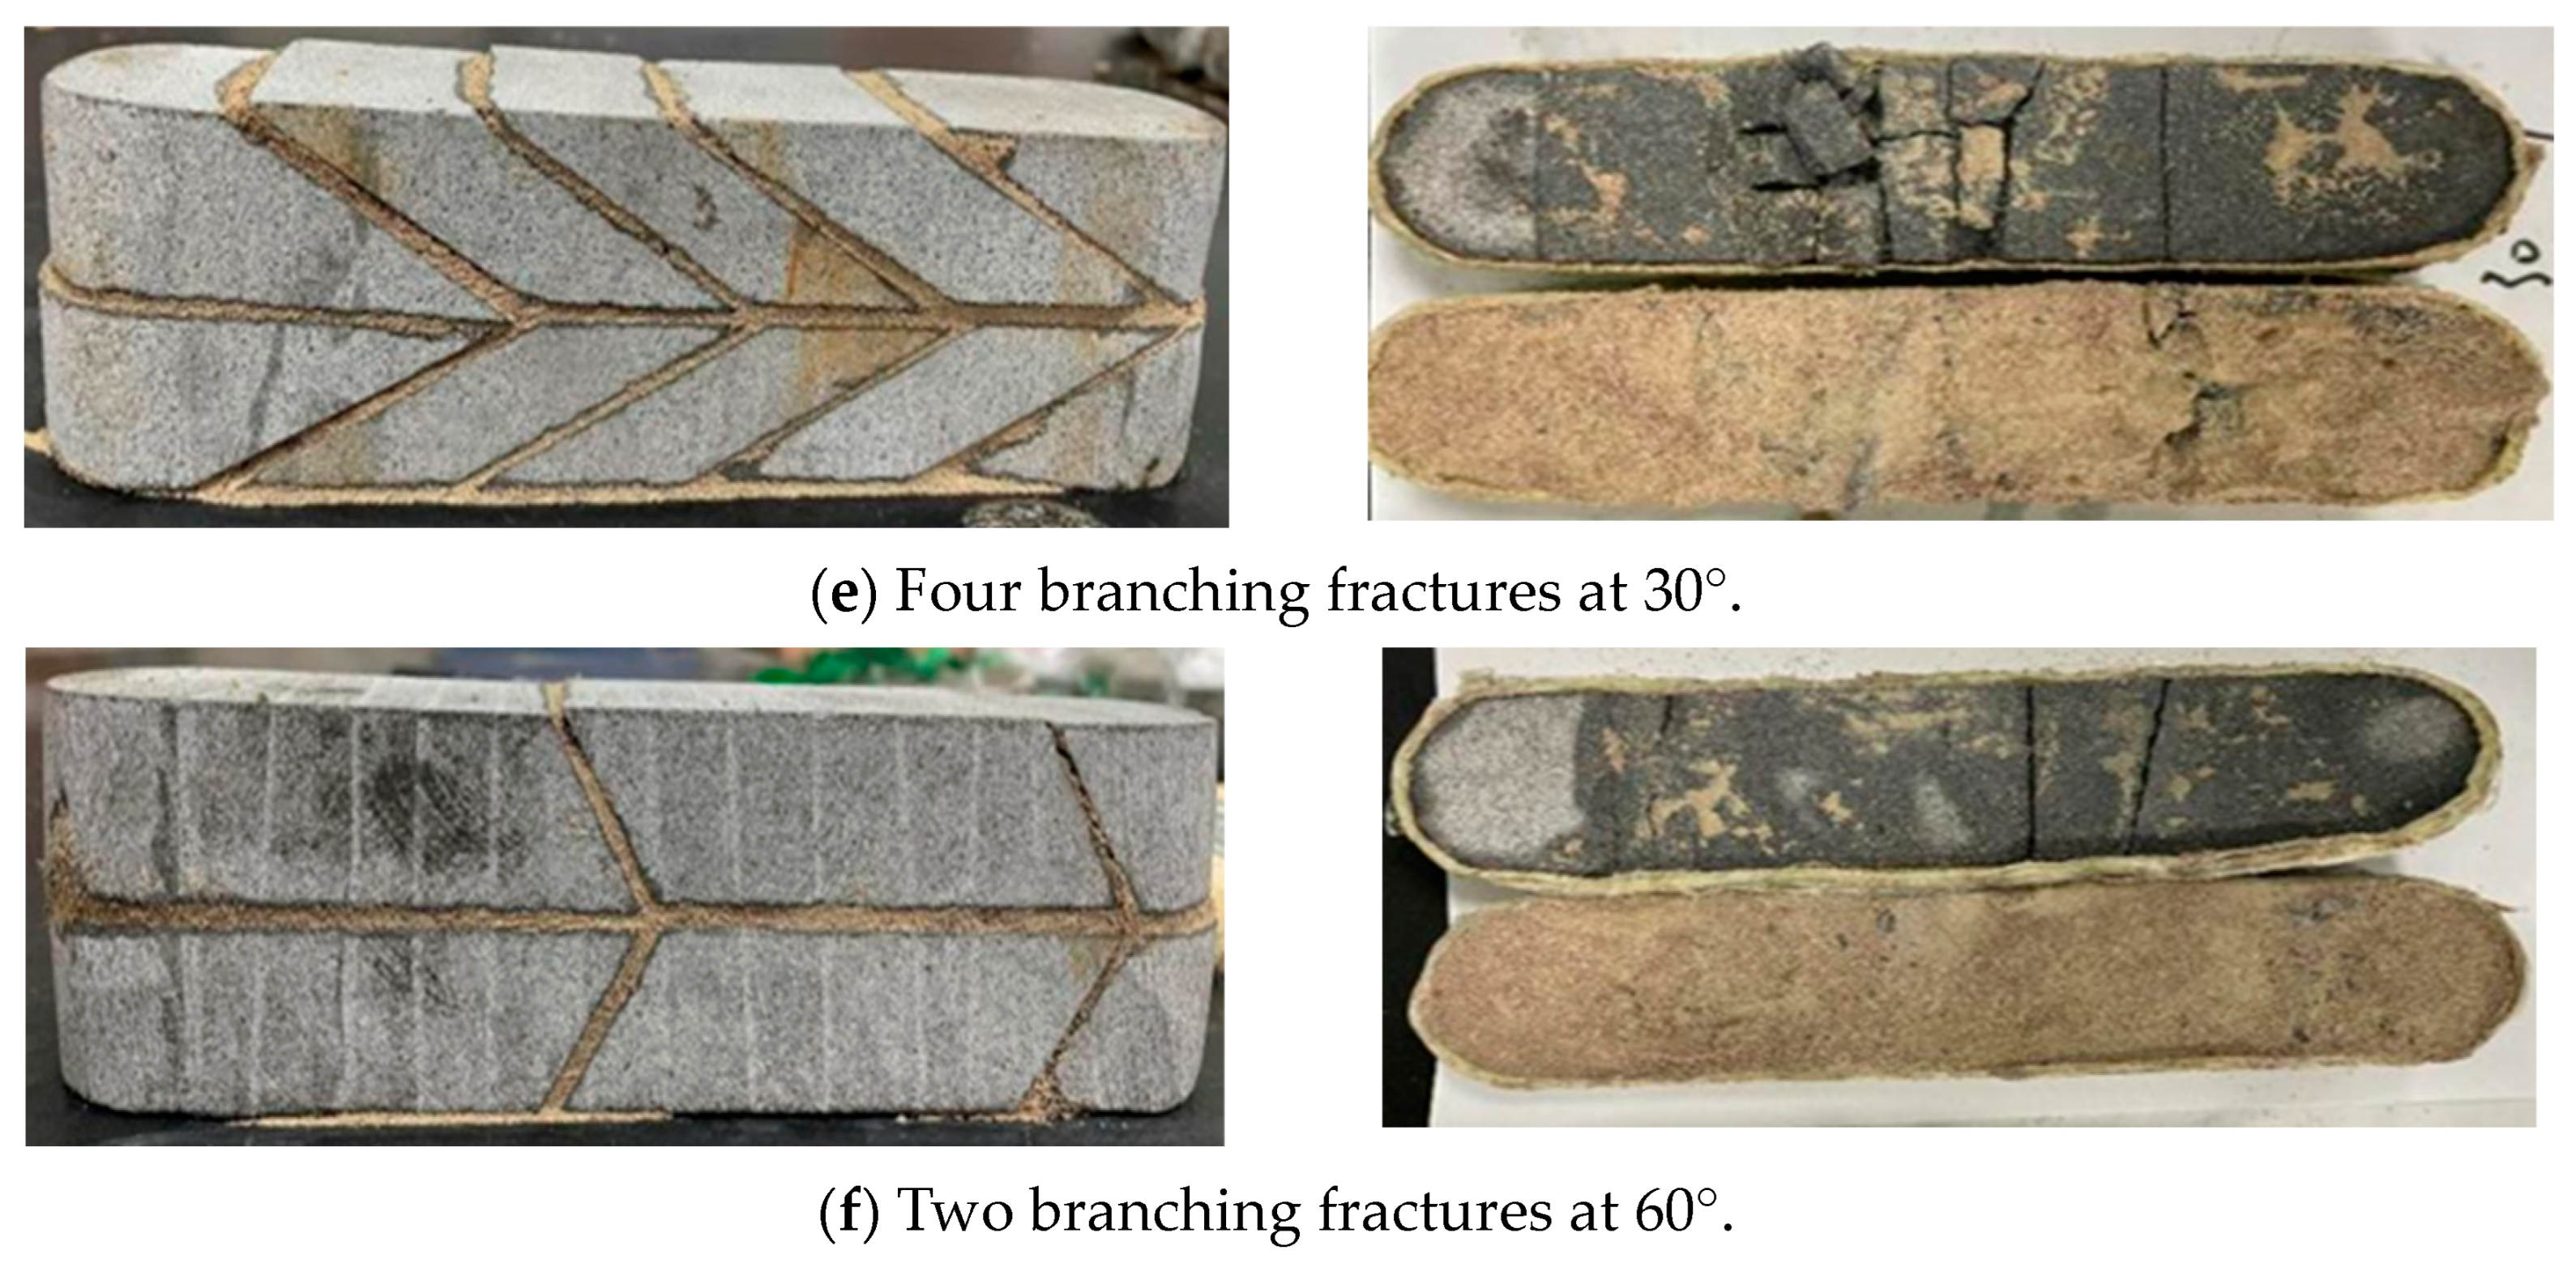
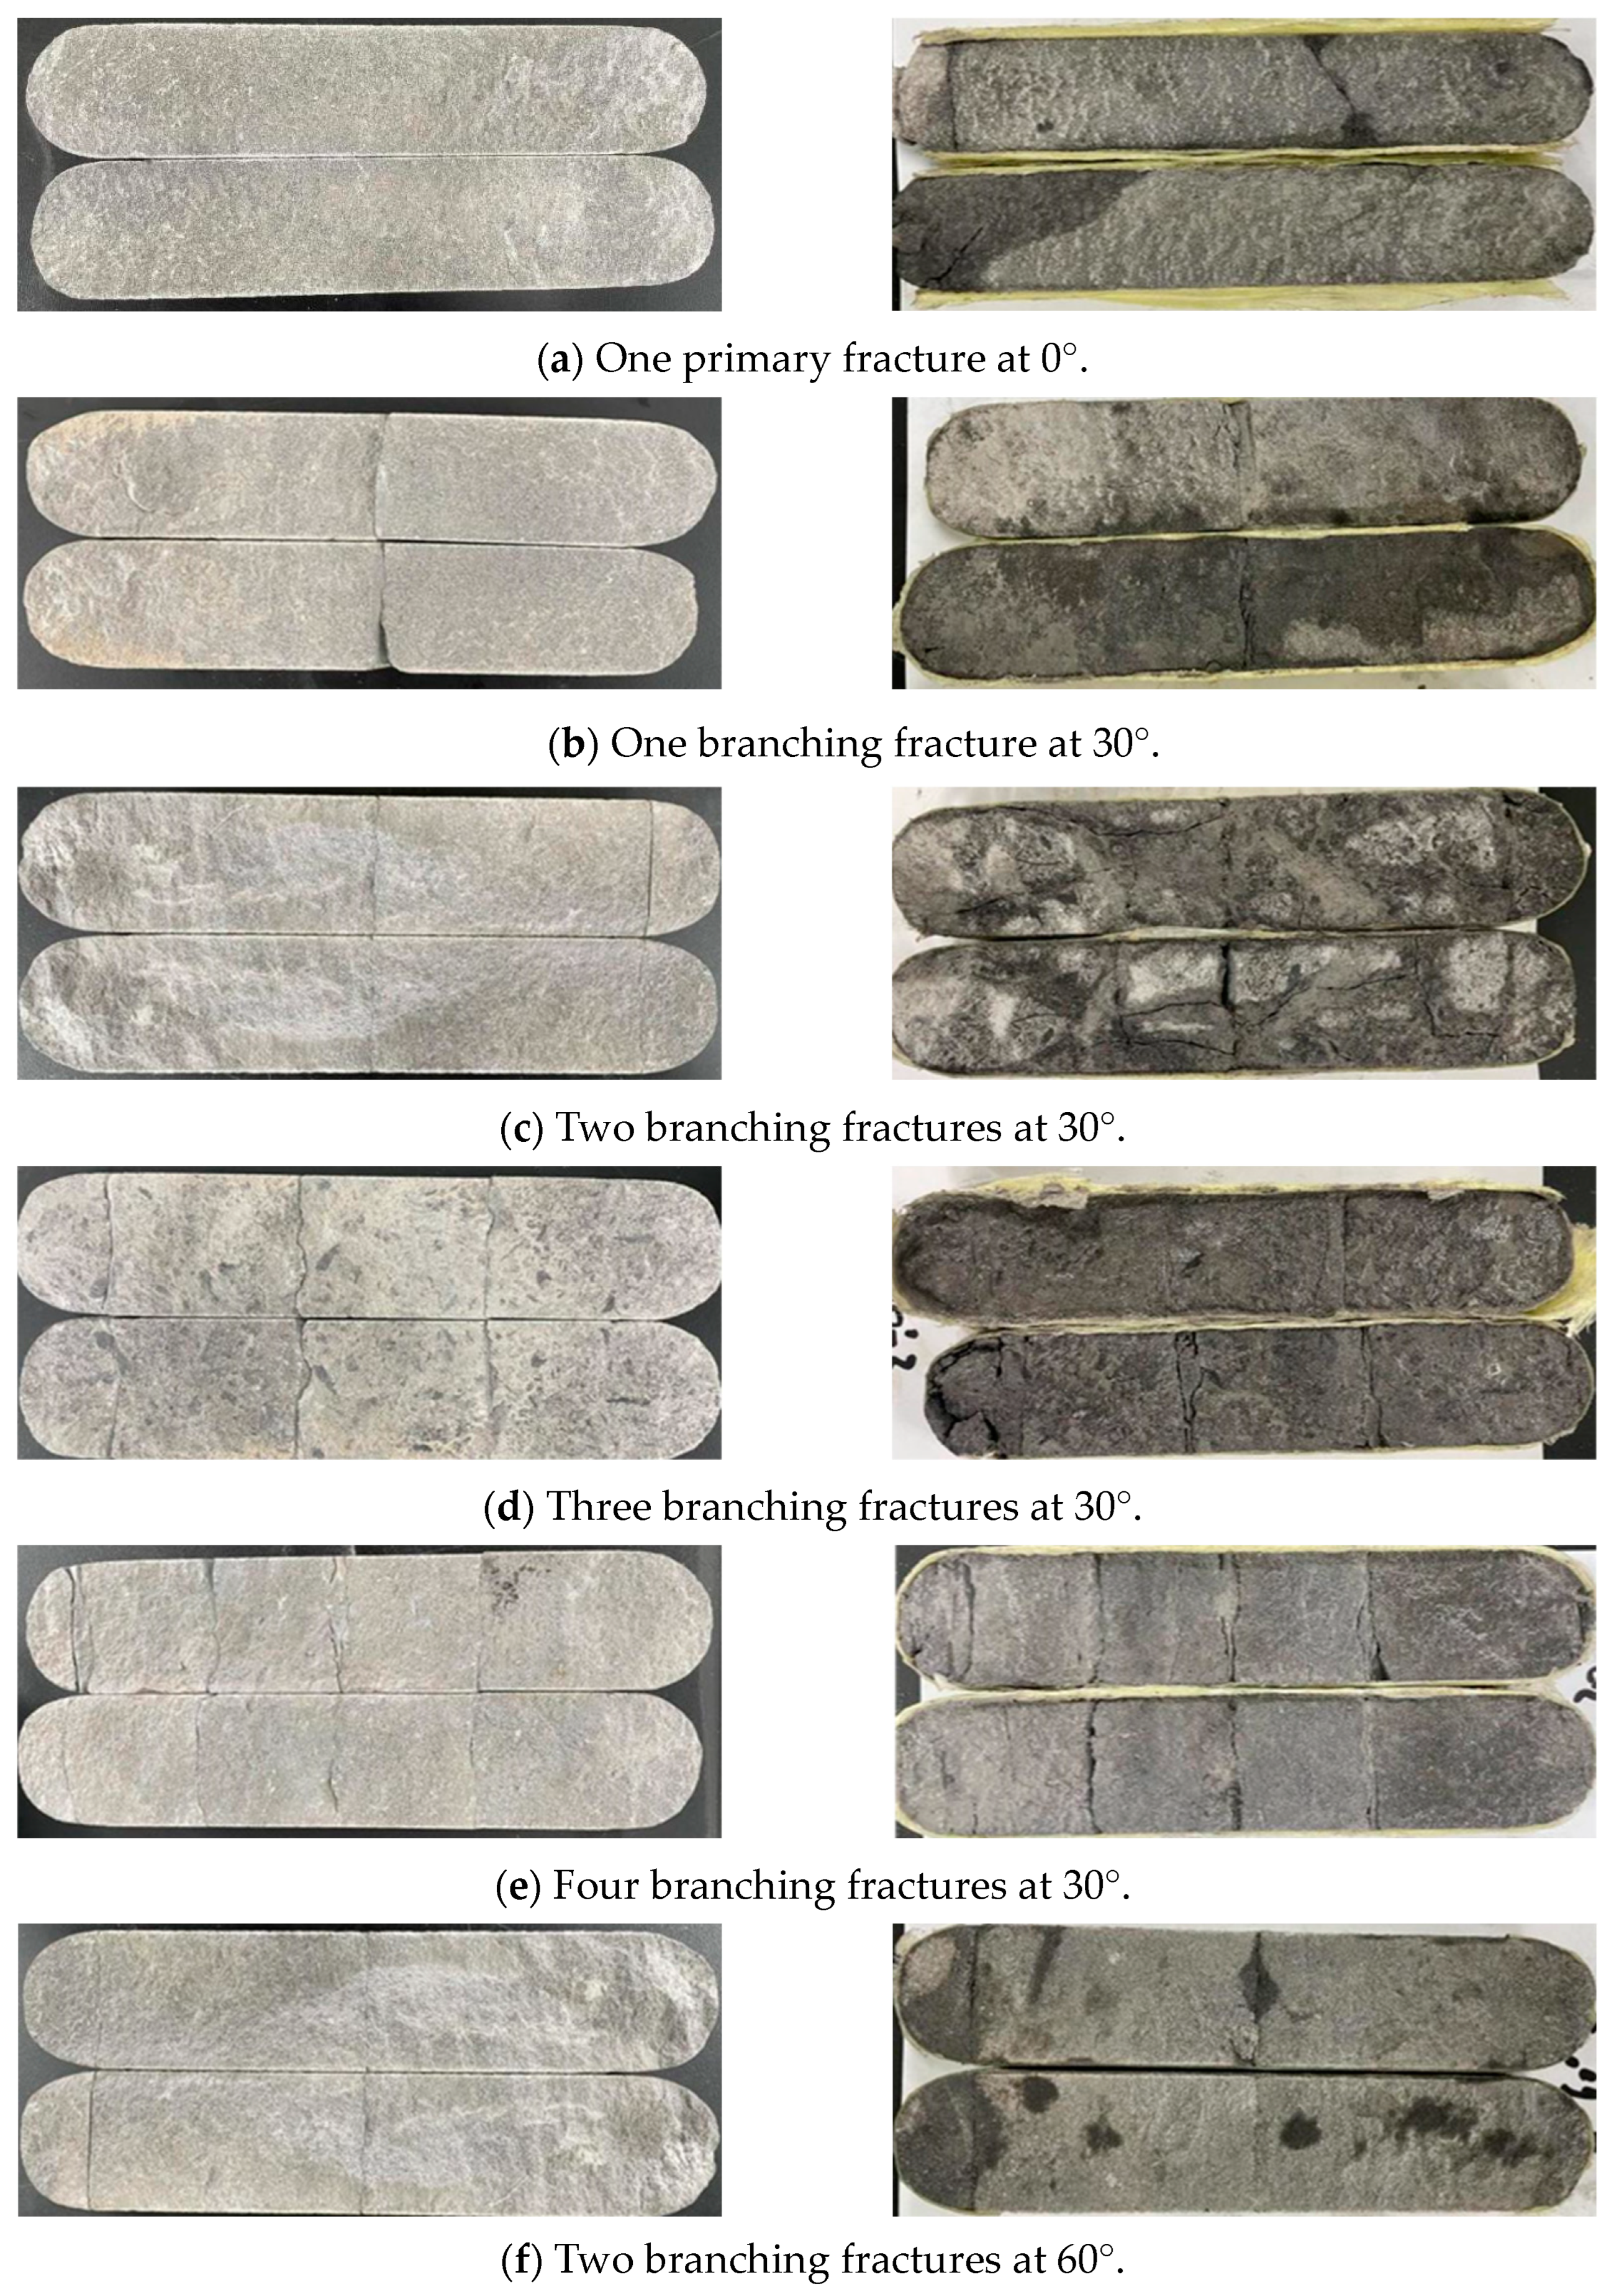
3.3. Experimental Study on the Conductivity of Self-Propping Fractures

To further investigate the variations in conductivity of self-propping fractures with different numbers of branching fractures, six pairs of self-propping fractures were set with the upper and lower rock plates moved relative to each other by 1 mm. These fractures relied on rough fractures with shear sliding along the fracture surface to protrude and support them. The 0° primary fracture panel was used as the basic control group. The fracture network configurations included one primary fracture (no branching fractures), one branching fracture at 30°, two branching fractures at 30°, three branching fractures at 30°, four branching fractures at 30° and two branching fractures at 60°. Water was used as the testing fluid to measure the conductivity of self-propping fractures under five different closure pressures: 14 MPa, 27 MPa, 41 MPa, 55 MPa and 69 MPa. The experimental results are shown in Figure 6, and conductivity variation curves (Figure 7) were plotted based on the experimental data.
According to Figure 7, the following were found: (1) The flow conductivity of the self-supporting crack with the supported joint was similar to that of the self-supporting crack with the unsupported joint, but the flow conductivity of the self-supporting crack with the supported joint was significantly higher than that of the self-supporting crack with the unsupported joint. (2) Under different closing pressures, the conductivity of multi-supported joints increases with the increase in the number of supported joints. Under medium and low closing pressures (less than 55 MPa), the support joints have a significant effect on increasing the conductivity, about 2–5 times, while under high closing pressures, the effect of supporting joints on increasing the conductivity is less; about 1–3 times. (3) Under different closure pressures, the conductivity of self-supporting fractures with different buttressed angles has different characteristics. The conductivity of two 30° buttressed fractures is a little higher than that of two 60° buttressed fractures. (4) As the closure pressure increases from 14 MPa to 27 MPa, there is a significant decrease in the conductivity of self-propping fractures, with a decrease of approximately 1–2 orders of magnitude at each pressure point.

3.4. Comparison and Discussion of Proppant and Self-Propping Fracture Conductivity

As shown in Figure 8, the experimental results of the conductivity of proppant fractures and those of self-proppant fractures were compared and analyzed in detail. The results show that the conductivity of proppant fractures decreases linearly with the increase in the closure pressure. However, the conductivity of self-proppant fractures decreases sharply with the increase in the closure pressure. When the value of self-proppant fractures reaches 41 MPa, the conductivity of self-proppant fractures decreases to less than 1D · cm. It is noteworthy that the conductivity of self-proppant fractures is superior under the condition of low closure pressure, even surpassing that of proppant fractures. However, the fracture is extremely sensitive to the change in pressure, and the conductivity of self-proppant fractures is negligible when the closure pressure exceeds 41 MPa. This indicates that self-proppant fractures cannot provide sufficient conductivity under the condition of high closure pressure.
In the multiple branch seam structure, with the increase in the number of joints, the overall conductivity is also enhanced, because the fluid can flow through the joints and enhance the conductivity. When the angle between the main and secondary joints decreases, the flow resistance decreases and the conductivity increases as the angle between the main and secondary joints decreases.

4. Conclusions and Recommendations

Previous research endeavors on fracture conductivity, particularly pertaining to varied fracture network architectures, have predominantly concentrated on individual factors, for instance, the angle or the count of branch fractures. In contrast, this study undertakes an experimental investigation into the fracture conductivity of two distinct fracture types: proppant-supported fractures and slip self-supported fractures. Furthermore, it delves into the variation in fracture conductivity across varying levels of closure pressure. The influence of fracture network shape on fracture conductivity is analyzed, so as to provide reference for the optimization of fracture network fracturing parameters.
(1)
As closure stress escalates, the conductivity of self-supported fractures significantly diminishes, whereas the conductivity of proppant fractures experiences a more gradual reduction. At low closure pressures, self-supported fractures demonstrate superior conductivity compared to proppant fractures; however, at medium to high closure pressures, proppant fractures exhibit greater conductivity than their self-supported counterparts.
(2)
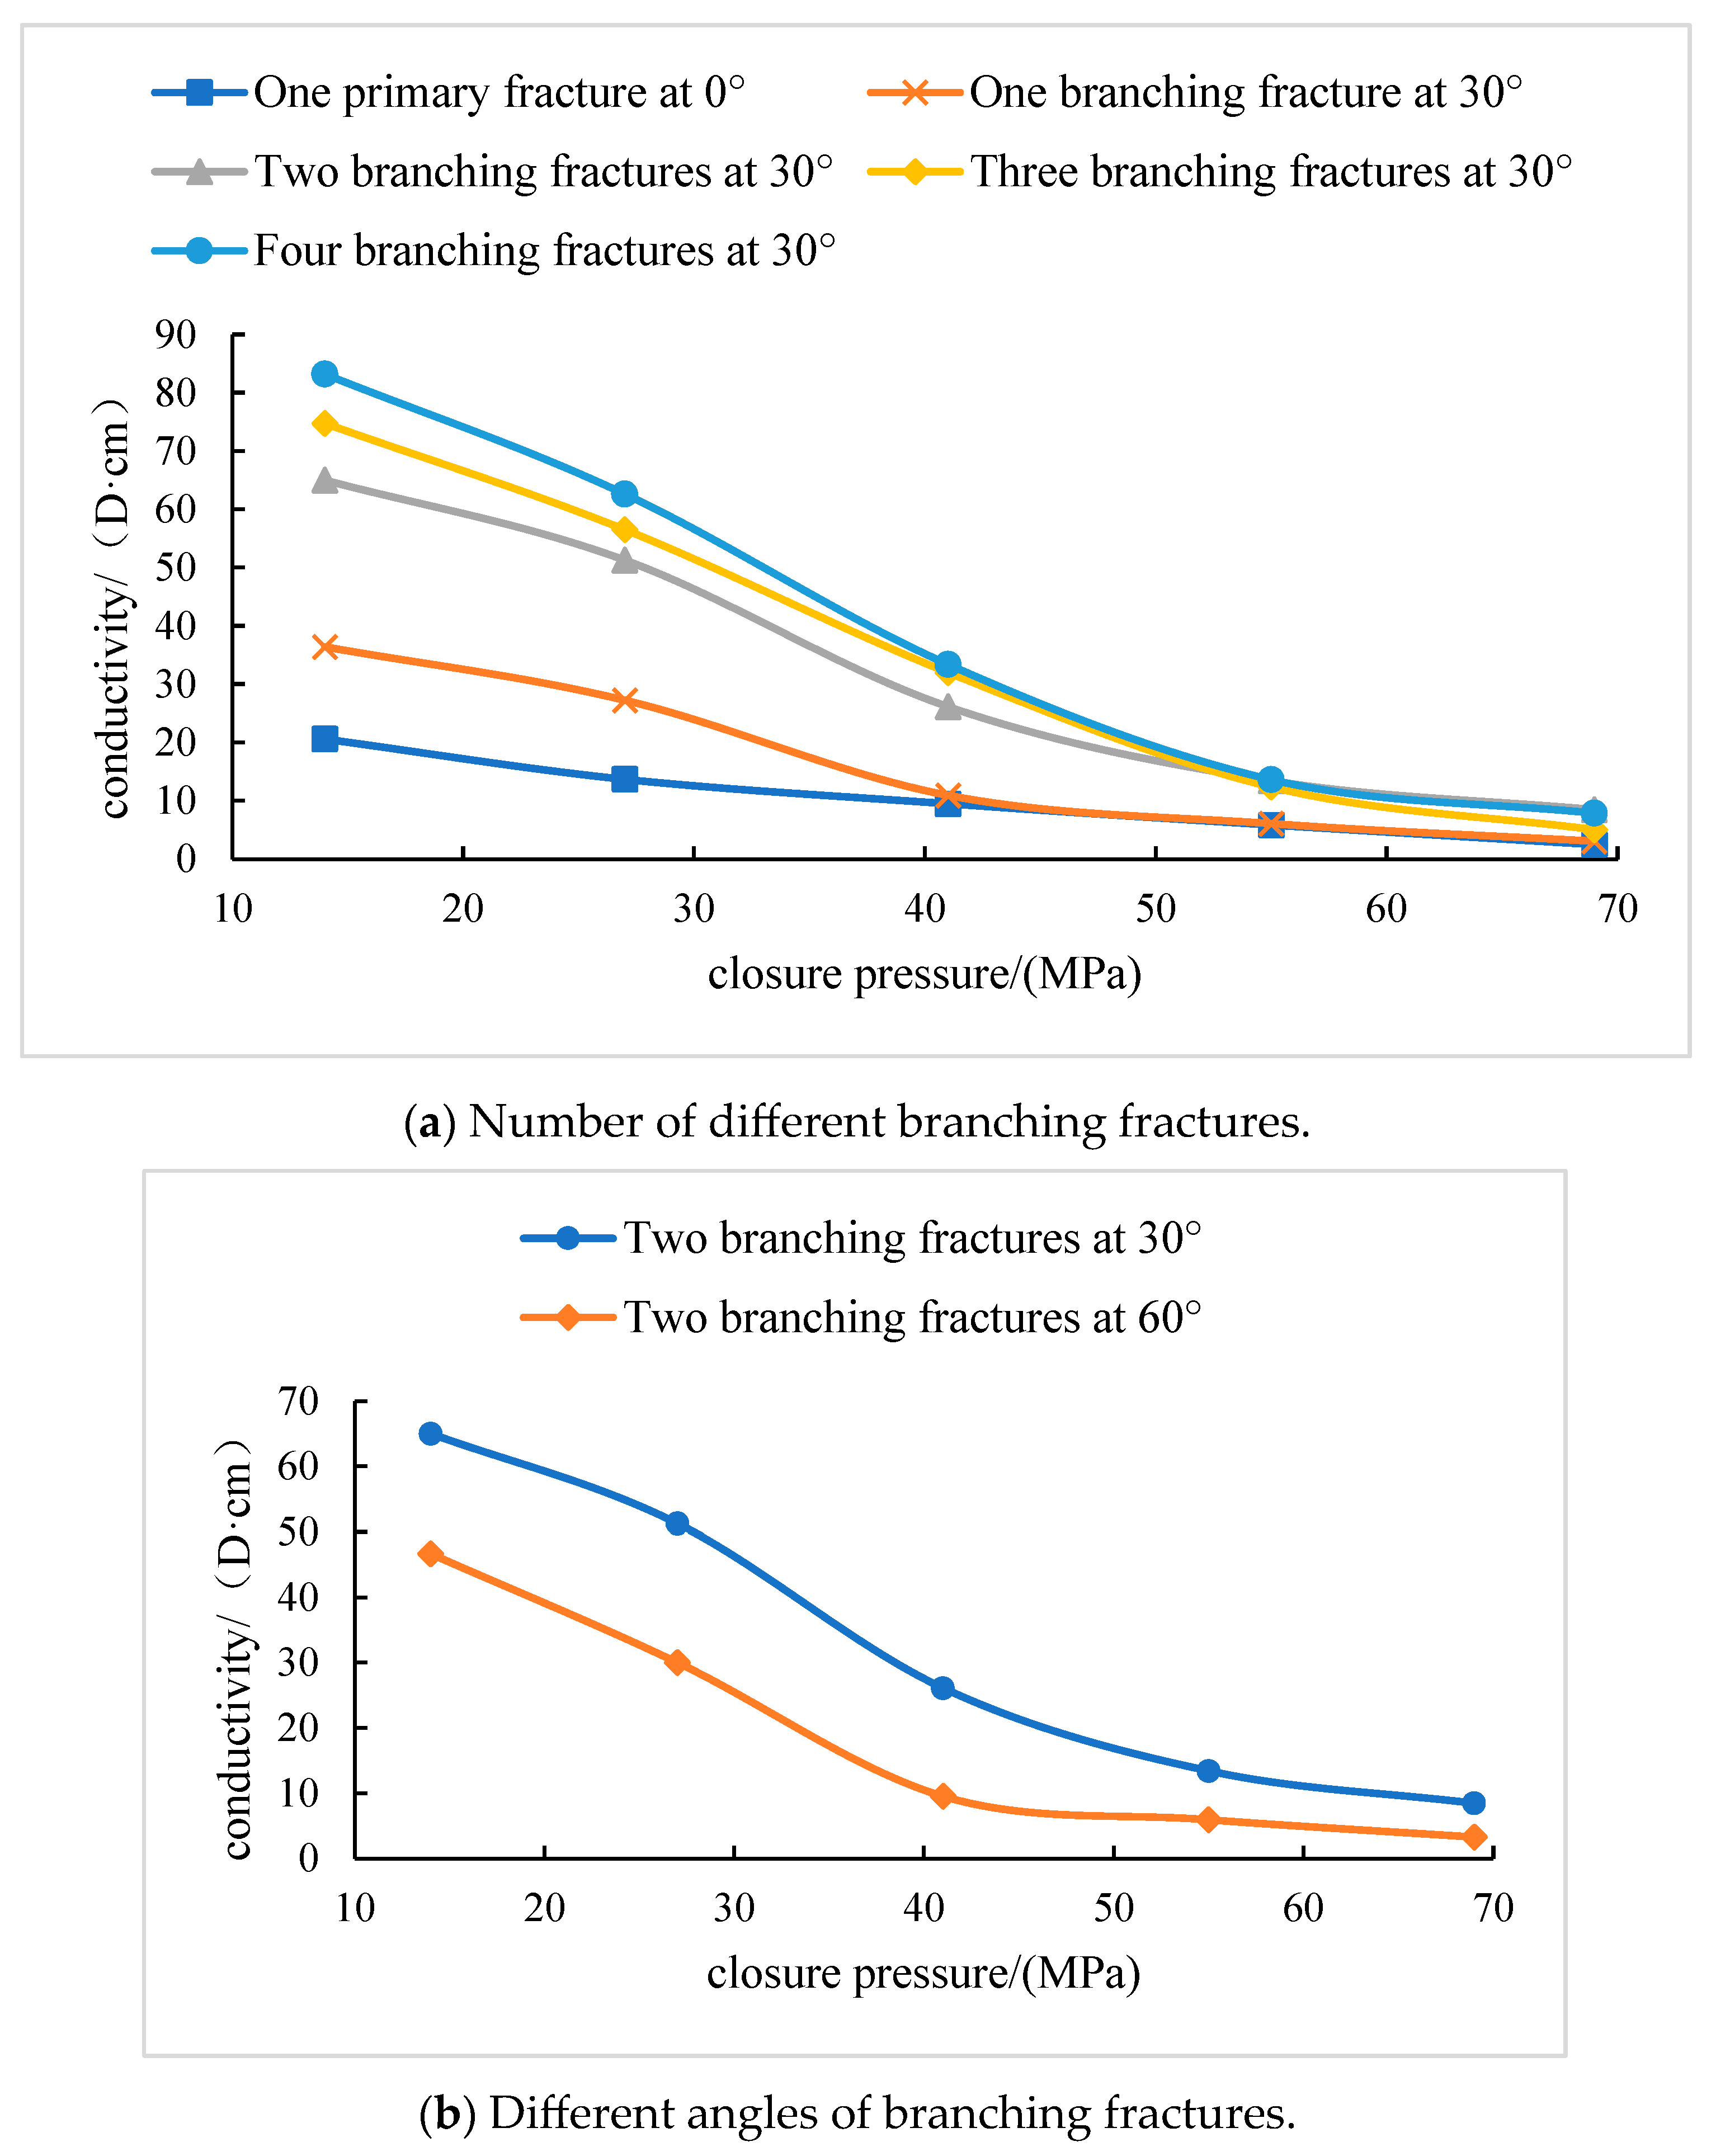
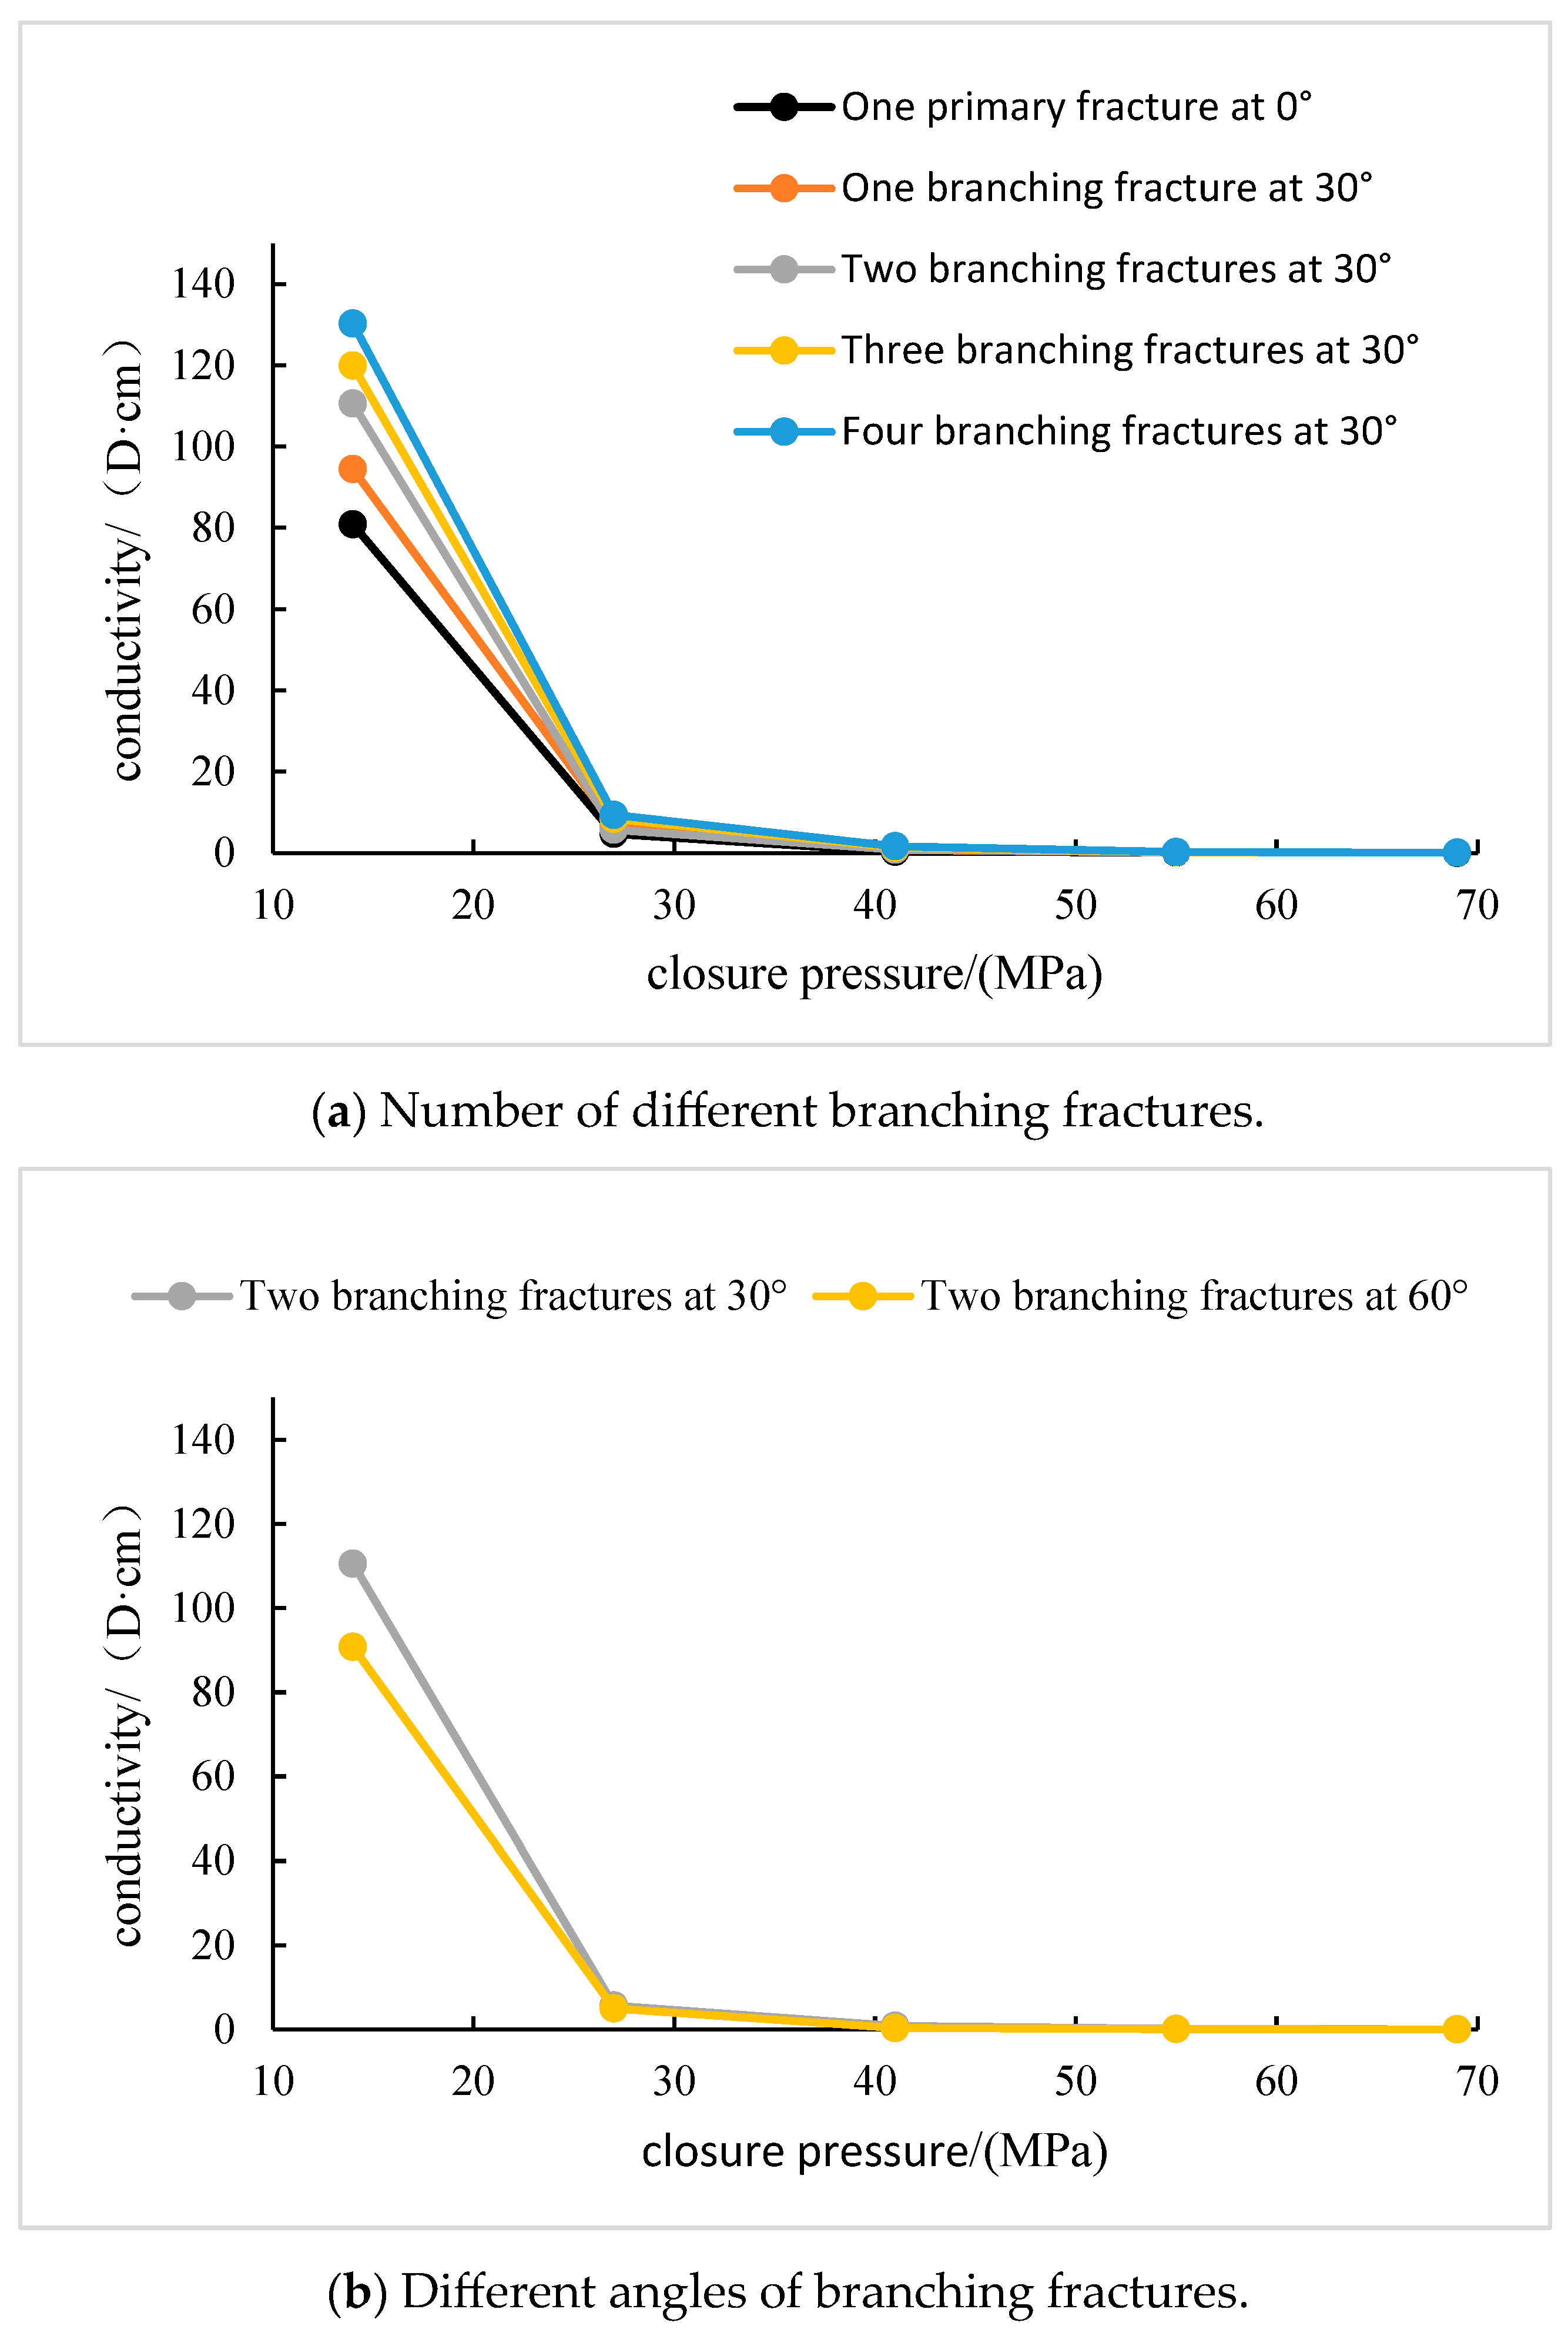
The flow-conducting capacity of cracks with multiple branch seams increases with the number of branch seams, and the branch seams have a significant effect on enhancing the flow-conducting capacity at low and medium closure pressures, while the effect of branch seams on enhancing the flow-conducting capacity is small at high closure pressures.
(3)
When the closure pressure and the quantity of branch seams are identical, the inflow capacity is influenced by the angle of the branch seams. Specifically, an increase in the angle of the branch seams correlates with a decrease in the inflow capacity of the fractures. This is attributable to the fact that a larger angle between the secondary seams and the primary seams results in greater resistance to fluid flow, thereby reducing the inflow capacity.
(4)
Under the condition of low closure pressure, increasing the number of self-supporting fractures can be considered by increasing the amount of slippery water and optimizing the sand-adding parameters. Under the condition of high closure pressure, attention should be paid to optimizing the proppant placement by means of full-scale sand-spreading, so that all the fractures can develop effective fracture conductivity.
(5)
In order to increase the number of branch joints, more complex joints should be adopted in the process of reconstruction. At the same time, the angle between branch joints and main joints can be reduced by means of temporary blocking and turning, so as to improve the overall flow capacity.

Author Contributions

Investigation, J.C.; methodology, L.W.; project administration, L.W.; writing—original draft, F.X.; revising—original draft, Y.Z. All authors have read and agreed to the published version of the manuscript.

Funding

This study was funded by the SINOPEC Science and Technology Research Project ‘Key Technology of Gas Accumulation Fracturing in Lake-phase Shale’, Grant number P19025-1.

Data Availability Statement

The original contributions presented in the study are included in the article; further inquiries can be directed to the corresponding author.

Conflicts of Interest

Author Jianfa Ci is employed by the Sinopec company. The remaining authors declare that the research was conducted in the absence of any commercial or financial relationships that could be construed as potential conflicts of interest.

References

  1. Zheng, J.W.; Sun, D.Q.; Li, X.Y.; Zhang, J. Advances in Exploration and Exploitation Technologies of Shale Gas. Nat. Gas Geosci. 2011, 22, 511–517. [Google Scholar]
  2. Liang, S.; Wan-Yi, Z.; Xiao-Ling, L. The Key Reservoir Fracturing Transformation Technology and Development Trend about the Shale Gas. Geol. Sci. Technol. Inf. 2013, 32, 156–162. [Google Scholar]
  3. Nie, H.; Zhang, J. Types and characteristics of shale gas reservoir: A case study of Lower Paleozoic in and around Sichuan Basin. Pet. Geol. Exp. 2011, 33, 219–250. [Google Scholar]
  4. Mingyue, C.U.; Yuzhang, L.I.; Nailing, X.I.; Yunhong, D.I.; Xuemei, Y.A.; Jingjing, D.O.; Haifeng, F.U. Analysis of factors affecting the formation of effective stimulated reservoir volume (ESRV). Oil Drill. Prod. Technol. 2014, 36, 82–87. [Google Scholar]
  5. Huifen, H.; Junliang, P.; Jian, W. Test method for long-term flow conductivity of propped shale fractures and modifications made on test equipment. Drill. Prod. Technol. 2018, 41, 55–58. [Google Scholar]
  6. Sun, C. Study on the Decline Characteristics and Influencing Factors of Hydraulic Fractures Conductivity in Shale Reservoirs. Master’s Thesis, Xi’an Shiyou University, Xi’an, China, 2023. [Google Scholar]
  7. Fredd, C.N.; McConnell, S.B.; Boney, C.L.; England, K.W. Experimental study of fracture conductivity for water-fracturing and conventional fracturing applications. SPE J. 2001, 6, 288–298. [Google Scholar] [CrossRef]
  8. Zhang, J.; Kamenov, A.; Hill, A.D.; Zhu, D. Laboratory Measurement of Hydraulic-Fracture Conductivities in the Barnett Shale. SPE Prod. Oper. 2014, 29, 216–227. [Google Scholar] [CrossRef]
  9. Cipolla, C.L.; Lolon, E.P.; Mayerhofer, M.J.; Warpinski, N.R. Fracture Design Considerations in Horizontal Wells Drilled in Unconventional Gas Reservoirs. In Proceedings of the SPE Hydraulic Fracturing Technology Conference, The Woodlands, TX, USA, 19–21 January 2009. [Google Scholar]
  10. Gao, S. Study on Conductivity of Different Artificial Fracture Types in Shale. Master’s Thesis, University of Petroleum, Beijing, China, 2023. [Google Scholar]
  11. Liu, J.; Ning, W.; Wang, P. Influence of the Fracture Intersection Angle on Conductivity of Fracture Network: A Case Study of “Bu” Type Structure. Sci. Technol. Eng. 2023, 23, 15465–15472. [Google Scholar]
  12. Ning, W. Research on Conductivity of Shale “Y”-Shaped cross Fractures. Master’s Thesis, Sichuan University, Chengdu, China, 2021. [Google Scholar]
  13. Cao, H.T.; Zhan, G.W.; Zhao, Y.; Yu, X.Q. Comparative of conductivity between support fracture and self-support fracture of deep shale reservoir in southern Sichuan basin. Sci. Technol. Eng. 2019, 19, 164–169. [Google Scholar]
  14. Zhu, H.; Shen, J.; Zhou, H. Numerical simulation on propped fracture conductivity. Acta Pet. Sin. 2018, 39, 1410. [Google Scholar]
  15. Qingzhi, W.; Shuting, W.; Jinjian, G.; Xiaofei, D.; Feng, W.; Xinjia, L.; Liu, Y. Research on flow conductivity experiment in complex fracture network. Pet. Geol. Recovery Effic. 2016, 23, 116–121. [Google Scholar]
  16. Zhang, H. Conductivity optimization research of complex network fractures in shale reservoirs of Long maxi Formation in Sichuan Basin. Nat. Gas Geosci. 2019, 30, 955–962. [Google Scholar]
  17. Yan, G.; Shi, H.; Ma, Y.; Scheuermann, A.; Li, L. Intrinsic permeabilities of transparent soil under various aqueous environmental conditions. Géotechnique Lett. 2022, 12, 225–231. [Google Scholar] [CrossRef]
Figure 1. Equipment photos.
Processes 12 01803 g001
Figure 2. Cutting sketch of rock plate for testing conductivity capacity.
Processes 12 01803 g002
Figure 3. Images show 70/140 mesh ceramic beads (left), 40/70 mesh ceramic beads (center) and 3:2 mixture (right).
Processes 12 01803 g003
Figure 4. Comparison image of proppant fracture conductivity before (left) and after (right) experimental testing.
Processes 12 01803 g004aProcesses 12 01803 g004b
Figure 5. Variation curve of proppant fracture conductivity with closure pressure.
Processes 12 01803 g005
Figure 6. Comparison images of the conductivity of self-propping fractures before (left) and after (right) experimental testing.
Processes 12 01803 g006
Figure 7. The conductivity curve of self-propping fractures as a function of closure pressure.
Processes 12 01803 g007
Figure 8. Comparison of conductivity between propped fractures and self-propping fractures in different fracture network structures.
Processes 12 01803 g008
Table 1. Experimental plan for different fracture network structures.
NumberMain Fracture and Secondary Fracture Angles/DegreesNumber of Secondary FracturesProppant
100Mixing 70/140 and 40/70 ceramic beads in a 3:2 ratio, with a main fracture sand concentration of 5 kg/m2 and secondary fracture concentration of 3 kg/m2
2301
3302
4303
5304
6602
700Self-supporting fractures do not add proppants
8301
9302
10303
11304
12602
Disclaimer/Publisher’s Note: The statements, opinions and data contained in all publications are solely those of the individual author(s) and contributor(s) and not of MDPI and/or the editor(s). MDPI and/or the editor(s) disclaim responsibility for any injury to people or property resulting from any ideas, methods, instructions or products referred to in the content.

