Article

AI-Based Integrated Smart Process Sensor for Emulsion Control in Industrial Application

by
Inga Burke
1,*,
Sven Salzer
2,
Sebastian Stein
3,
Tom Olatomiwa Olakunle Olusanya
1,
Ole Fabian Thiel
1 and
Norbert Kockmann
1,*
1
Laboratory of Equipment Design, Department of Biochemical and Chemical Engineering, TU Dortmund University, Emil-Figge-Straße 68, 44227 Dortmund, Germany
2
Ark Vision Systems GmbH & Co. KG, Limburger Straße 51, 35799 Merenberg, Germany
3
SystemKosmetik Produktionsgesellschaft für Kosmetische Erzeugnisse mbH, Raiffeisenstraße 2, 86692 Münster, Germany
*
Authors to whom correspondence should be addressed.
Processes 2024, 12(9), 1821; https://doi.org/10.3390/pr12091821
Submission received: 31 July 2024 / Revised: 19 August 2024 / Accepted: 23 August 2024 / Published: 27 August 2024

Abstract

:
In industry, reliable process supervision is essential to ensure efficient, safe, and high-quality production. The droplet size distribution represents a critical quality attribute for emulsification processes and should be monitored. For emulsion characterization, image-based analysis methods are well-known but are often performed offline, leading to a time-delayed and error-prone process evaluation. The use of an integrated smart process sensor to characterize the emulsification process over time enables the real-time evaluation of the entire system. The presented integrated smart process sensor consists of an optical measurement flow cell built into a camera system. The overall system is placed in a bypass system of a production plant for emulsification processes. AI-based image evaluation is used in combination with a feature extraction method (You Only Look Once version 4 (YOLOv4) and Hough circle (HC)) to characterize the process over time. The sensor system is installed in the plant and tested with different cosmetic products. Various iteration, prototyping, and test steps for the final sensor design are performed prior to this in a laboratory test setup. The results indicate robust and accurate detection and determination of the droplet size in real time to improve product control and save time. For benchmarking the integrated smart process sensor, the results are compared with common analysis methods using offline samples.

1. Introduction

In industrial production, process monitoring is crucial to ensure efficient, safe, and high-quality processes. Continuous monitoring ensures early detection and correction of deviations, thus securing high product quality as well as high efficiency and economic production [1,2]. In the food, chemical, and cosmetic industries, emulsions are often involved, and the accurate estimation of the droplet concentration and size distribution is crucial for the stability of the emulsion. The morphology and droplet size distribution significantly affect this stability. Consequently, a thorough understanding of the emulsification conditions and the resulting droplet characteristics is crucial for product assessment and process control. In particular, for the emulsification process, the droplet size distribution emerges as a critical quality attribute that requires continuous monitoring [2,3,4]. Established methods for determining the droplet size distribution, such as manual image analysis or light diffraction, are often time-consuming or labor-intensive, which is not practical for many applications. Specifically, the quality evaluation of highly dispersed products can be challenging and the implementation of real-time analysis is difficult [5,6,7,8,9]. Nevertheless, optical image analysis has proven to be a cost-effective and easy-to-use method that can extract features with high spatial and temporal resolution. The detection of such features enables the determination of droplet sizes and droplet size distributions [4,10,11,12,13,14]. Image characteristics such as contrast, edges, and color (grey-scale) are used for this detection, resulting in distinctive features. Offline analysis of process images has some limitations in particular. These include the lack of representativeness due to sampling, resulting in a temporal offset, as well as a location dependence of the measurement due to the sampling point. In the worst-case scenario, this leads to a poor representation of the overall system and possibly reduced product quality and lower process control due to a delay in time [5,6,15]. Another challenge in the optical image analysis of emulsification processes is the segmentation of overlapping droplets [6,9,16,17]. Real-time online analysis offers many advantages over sampling, including reduced risk of contamination and the ability to integrate into the production process by using real-time data to adjust production parameters [5,6,7]. In addition, automation and standardization of optical analysis reduce the number of sources of error, resulting in a more robust and representative analysis while reducing costs. Since sampling and analysis are performed simultaneously, time-dependent effects such as coalescence and droplet agglomeration do not occur [8,18,19,20].
Automated online analysis methods are increasingly popular in the process industry, and their potential can also be used to determine characteristic emulsion parameters [4,8,15,21]. New potentials arise due to more efficient methods and progress in artificial intelligence (AI) research and development [4,22]. The combination of traditional measurement instruments with AI algorithms that feature increasingly powerful network architectures enables the processing of large amounts of data with high precision in a short time [11,14,15,23,24,25,26,27,28,29]. New network architectures offer opportunities for real-time analysis and, consequently, process analysis, especially in the field of image-based process evaluation [22]. The use of smart camera systems enables advanced, precise, and fast evaluation and characterization of processes. These integrated sensors enable users to influence process control and result in potentially more efficient process management. These so-called intelligent or smart sensors are attracting growing attention in pharmaceutical and chemical process engineering [18,30]. The development of an innovative, noninvasive optical smart sensor is inspired by the design thinking method [31], wherein a final classification of the sensor system is completed based on the Technology Readiness Level (TRL) [32]. Design thinking is a creative approach to problem solving that aims to develop innovative solutions that meet user needs. This approach is user-centered and iterative, involving interdisciplinary teams to understand and solve complex problems [31]. These are defined in advance and are focused on in this publication as the real-time characterization of industrial emulsification processes. To evaluate the sensor design and development level, the Technology Readiness Level is used. This framework ensures systematic advancement and validation and helps to refine the sensor design at each stage, ensuring it meets industry standards and user requirements. The TRL is a scale (1–9) to assess the level of development of new technologies based on a systematic analysis. It was developed in 1988 by NASA for the evaluation of space technologies and has become an evaluation standard for other areas of technology [32].
Abidin et al. [8] presents a comprehensive overview of the existing measurement techniques for emulsion characterization. These are divided into in situ and external methods, making a distinction between indirect and direct methods. Since the focus of this work is on real-time monitoring and process control, the in situ image analysis methods such as particle vision microscope (PVM), stereo-microscope, and endoscope are of special interest [5,8]. A PVM is an invasive measurement technique that is used to characterize particulate systems. The PVM probe uses six near-IR lasers focused through a hexagonal lens array to illuminate particles, with back-scattered light collected and relayed to a charge-coupled device (CCD) array, capturing digital images. This illumination enhances the grey-scale structure, aiding with fully automatic image recognition [8]. In stereo-microscopy, the process images are captured with an external camera. This is in sync with the flashing in the vessel. Measurements are limited to droplets near the wall of the vessel and can be affected by the curvature of the wall. Depending on the camera used, blurring and low contrast may occur, so the image evaluation may be subject to errors [8]. For in situ image analysis, an endoscope with a camera is inserted into the dispersion. The camera captures images of droplets near the glass window of the endoscope, allowing real-time measurement of droplet sizes, especially in areas with high breakage rates, such as the impeller zone. Sharp images are ensured by integrating a light source into the endoscope with a fiber-optic-guided stroboscopic flash. A cover tube at the tip of the endoscope prevents droplet interference and allows precise analysis of droplet size [8]. SOPAT, for example, designs and develops photo-optical image-based measurement systems to characterize multi-phase systems. Depending on the probe system, which is based on the endoscope technique, particles with size ranges of 1.5 to 7700 μ m can be analyzed [33]. In addition to the usage of probe systems, measurement flow cells provide the opportunity for the characterization of multi-phase systems [16,34,35,36]. Schmalenberg et al. [36] presented a temperature-controlled minichannel flow-cell for non-invasive particle measurements in solid–liquid flow. Burke et al. [16] designed a 3D-printed modular optical flow cell for image-based droplet size measurements in emulsification processes.
In order to combine the advantages of image-based methods and automated evaluation methods based on AI, in this contribution, the measurement cell presented in [16] is further developed and integrated into a smart camera system. In general, the optical sensor system should provide optical accessibility to the industrial emulsification process and combine it with a direct evaluation system that allows real-time process monitoring. Therefore, AI-based image analysis is combined with a new methodology for non-invasive droplet size measurement and integrated into an emulsification process. In addition to that, the developed camera setup, including its processor board, image sensor board, and optics, is presented and combined with the optical measurement flow cell. To enable process evaluation, integration of the final system into the process plant is necessary. Together, these steps enable the evaluation of emulsions in a bypass system and provide a measurement system for droplet size characterization within an industrial process plant. For the integration of a sensor system as well as for its development, different key aspects are considered and discussed in this work. In particular, this work aims to develop, validate, and integrate an optical smart sensor to automate the analysis and control of an industrial emulsification process and enable real-time analysis of industrial emulsions. For this, an AI-based object detection approach is transferred to an edge device and its usage in industrial processes is evaluated. Embedding the smart sensor in the system and evaluating the process on an edge device constitutes an innovative approach that guarantees straightforward installation and replacement.

2. Materials and Methods

The development of a smart optical sensor involves several design steps, including optical accessibility to the emulsion, the development of a camera system that provides suitable resolution, an automated online method for the determination of the emulsion droplet size, and the integration of the measurement system into an industrial production plant. This section deals with the sensor development strategy and the industrial plant in which the smart optical sensor is integrated. The working principle and the evaluation strategy of AI-based optical detection are explained here, and the development and application of an analytical strategy is described.

2.1. Sensor Development Strategy

The development of an applicable smart measurement system in the form of an optical sensor to monitor emulsification processes is based on several requirements. These include:
  • Optical access to the product, allowing a large number of different formulations to be optically resolved and evaluated;
  • No influence on process performance due to the integrated intelligent sensor;
  • Simple integration into the industrial plant and user-friendliness;
  • Robust design.
The sensor development strategy requires an iterative approach based on the design thinking process. Parts of this process use a rapid prototyping method using additive manufacturing to enable rapid adaptation. This iterative workflow is visualized in Figure 1.
Firstly, critical process conditions and quality attributes were identified, and specifications for the smart optical sensor were defined. Based on the available process information, a laboratory-scale test setup was constructed to represent the industrial process. A description of the test setup is given in [16]. The design of an optical flow measurement cell was iteratively developed and evaluated in the test setup to allow optical accessibility to the emulsion [16]. The focus is on optical accessibility and the use of optical methods to evaluate the images of the resulting emulsion. Here, a general proof of the concept is shown, and it builds the foundation for the next step of the camera integration. Based on these results and the sensor requirements, the key aspects were defined:
  • Optical sensor and flow cell design;
  • Automated droplet size analysis;
  • Integration into the production plant.
For the transition of the optical evaluation of the emulsification process from the laboratory to the production scale, optimization of the individual key aspects is performed. For this purpose, we adapt the measurement flow cell presented in [16], and the development and integration into the camera system are iteratively advanced. In this optimization framework, the periphery and the requirements are defined, and the design of the prototype is adapted, tested, and integrated. The optimization of the other main aspects is done simultaneously.
The automated analysis method for process characterization includes AI-based droplet detection. The first optimization steps are presented in [17]. The implementation of AI-based evaluation requires some adaptations to execute this method on the embedded sensor board of the camera system. The integration of the complete measurement system into the production plant is the last step to transfer the measurement principle from the laboratory to the production plant. The prototype solution is evaluated by comparing its performance with the originally used evaluation method.

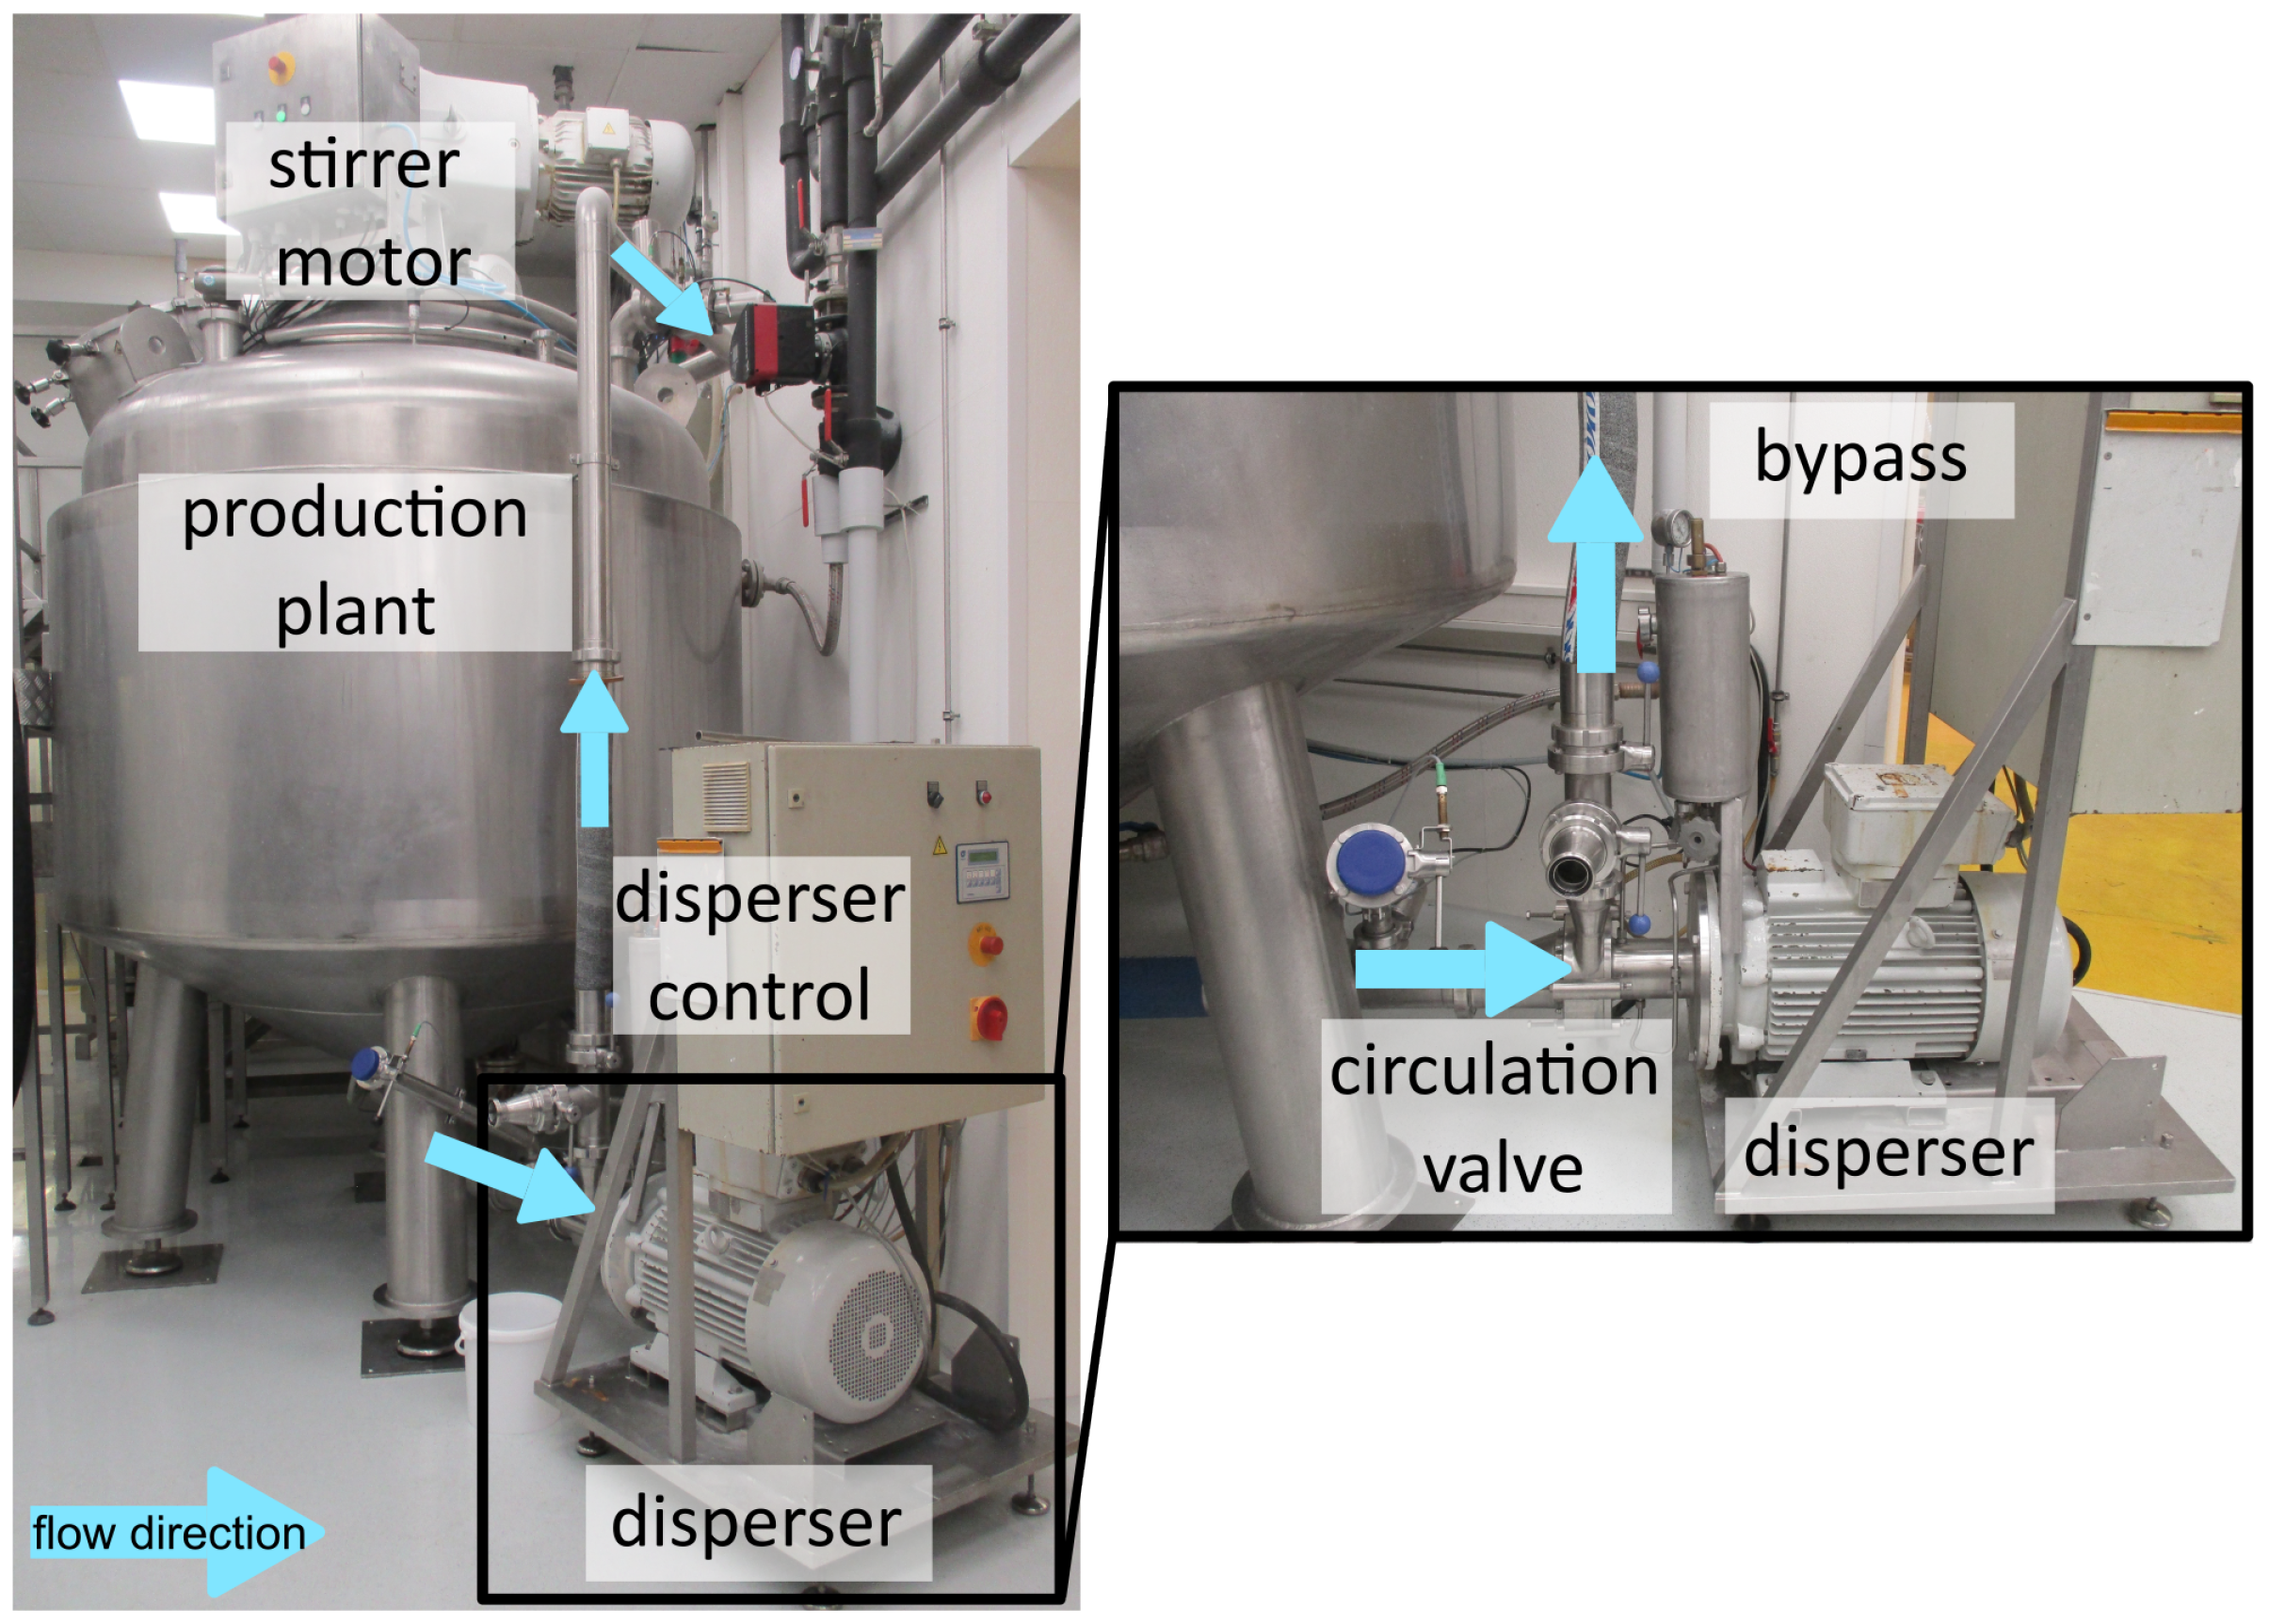
2.2. Industrial Emulsification Process

The smart optical process sensor is integrated into an existing industrial production plant for emulsions that focus on cosmetic and medical products, as illustrated in Figure 2. This plant has a total volume of 4 tons and is equipped with a temperature control system in the form of a double jacket. A bypass pipe is integrated at the lowest point of the stirred vessel. The bypass consists of an DN 80 pipe section, to which the disperser (Unimix S-Jet, EKATO HOLDING GmbH, Freiburg, Germany) is connected. At this point, a toothed-ring disperser performs both the conveying through the bypass and the dispersion of the emulsion ingredients. After the disperser, a steel recirculation pipe is transferred to a hose section then reverts to a steel pipe and is fed back into the vessel. This reduces the vibrations caused by the emulsification process.
Depending on the different formulations, the emulsion process proceeds as follows. First, the water and oil phases are heated externally and fed to the heated vessel after reaching the process temperature. Then, the emulsification process starts by starting the disperser. Once a pre-emulsion has been achieved, additional components such as emulsifiers, additives, etc., are added, and the emulsification process continues. As soon as the emulsion has the desired properties, the process temperature is decreased, the emulsion is cooled down, and the filling process is initiated. The entire system is then cleaned.

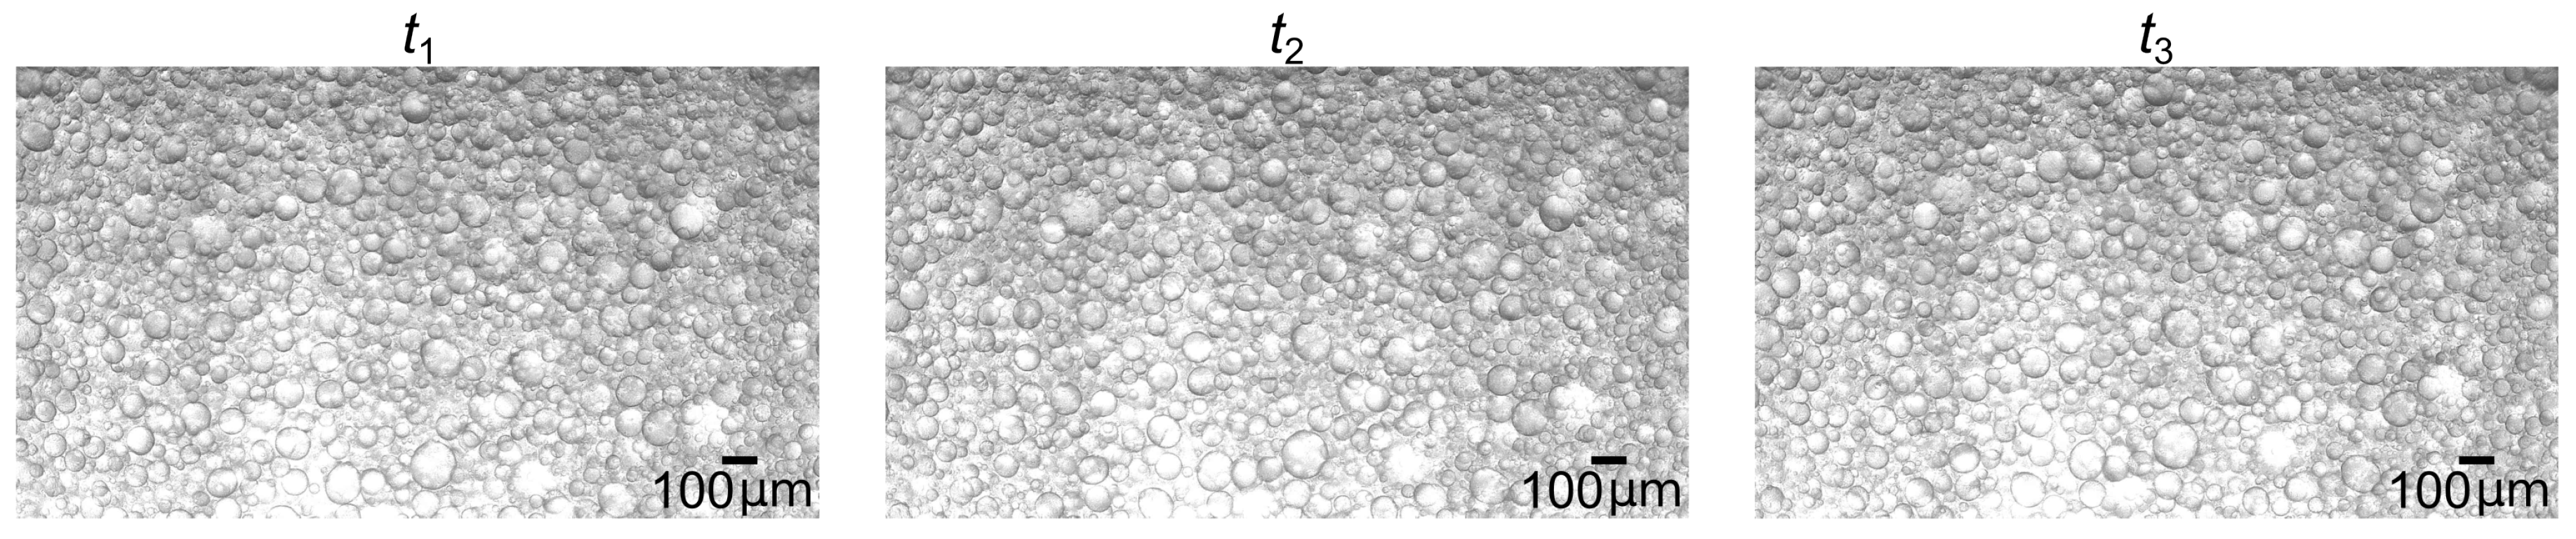
2.3. AI-Based Droplet Size Determination

The AI-based droplet size determination uses the object detection algorithm You Only Look Once (YOLO) version v4 (v4). This is a real-time single-stage detector that localizes and classifies objects in a single step. Based on previous contributions, this method ensures a precise and reliable determination of droplet sizes [17,37]. This approach is examined for its application in industrial emulsions. The used model is converted to enable its application to the used embedded smart sensor. The detection accuracy and detection time of the configuration for the present smart sensor is performed based on statistical evaluation of the detected droplet sizes (see Section 3.1). For detection, a confidence score (CS) of 0.6 and image input sizes of (640 × 540 pixels) are investigated to evaluate their influence on detection performance.

2.4. Validation of Droplet Size Determination

A comparative independent image analysis methodology is used to validate the AI-based droplet size determination. For this, manual image evaluation is performed using ImageJ (version 1.53k; Java 1.8.0_172) [39]. The results of this statistical evaluation are compared with the results of the AI-based image analysis to confirm its trustworthiness and accuracy. Further, a comparison of the different observed process states during an emulsification process is performed. Here, the resulting DSD captured within the optical measurement flow cell and the DSD from analyzing a corresponding sample under a microscope are compared. This analytical strategy offers the possibility of evaluating the process at different points in time and determining the progress of the process over time. The accuracy and applicability of the sensor are evaluated.

3. Results

The next section deals with the results of the design process of the integrated smart process sensor and its characterization in terms of the first test runs.

3.1. Optical Smart Process Sensor

The integrated optical smart process sensor is briefly discussed. The resulting individual components along with the design-thinking process and the final integration of the entire measurement system into the plant are evaluated. The resulting total measurement system is illustrated in Figure 3.
The measurement system is organized into three key functional units:
  • Camera unit, including the processor board, optical sensor, and focusable lens;
  • Optical measurement flow cell;
  • LED illumination unit.
The individual components of the measurement system are independent and interchangeable. This enables rapid adaptation to changes in processes such as color, turbidity, and formulation of emulsions containing different additives. The individual components and their development are described in more detail in the following.

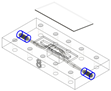
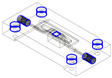
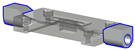
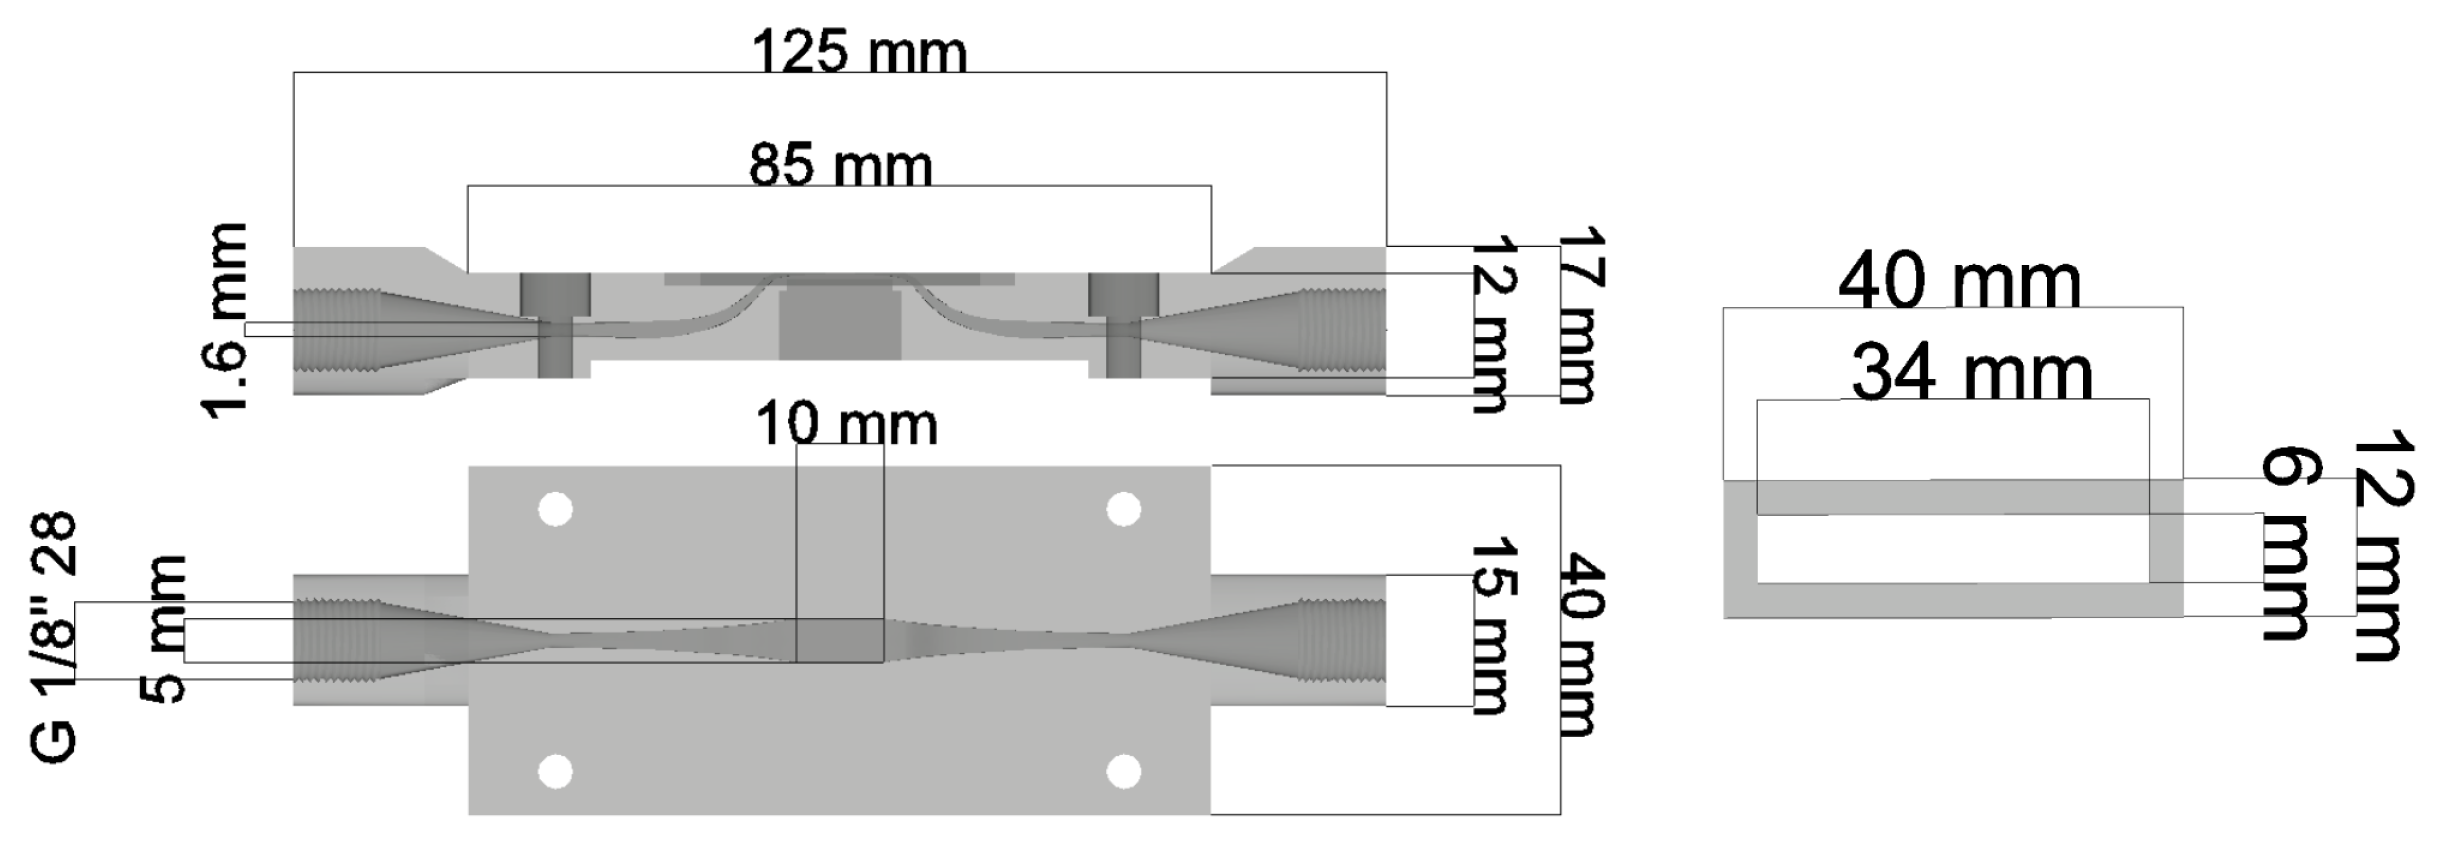
3.1.1. Optical Measurement Flow Cell

The design of an optical flow cell for droplet size measurement in laboratory emulsification processes is described in [16]. Transferring this measurement system from laboratory to production scale and integrating the measurement cell into a camera system requires further adaptation and iteration steps, which are illustrated in Figure 4.
For this adaptation and optimization of the measurement system, the following requirements were formulated:
  • Reduction of complexity;
  • Reduction of components to simplify handling and minimize leakages;
  • Minimization of the distance between the emulsion and the camera lens;
  • Applicability for the evaluation of industrial emulsions;
  • Integration into industrial system—focus on fluid connections.
The test system measurement flow cell is designed with a modular structure, allowing the adjustment of channel depth within the observation window. The developed optical flow cell showed a first feasibility in optical process accessibility and provides the opportunity for optical process evaluation. The modular structure of the flow cell results in different channel depths, as well as high complexity. The new design intends to solve these challenges by the flow cell frame being manufactured as a single part, thus reducing the complexity and the number of components. The integration of the flow cell into the developed camera setup requires a minimum distance between the measurement flow cell channel and the objective lens for focusing. The front part of the camera housing seals the measurement flow cell against the view glass with a flat gasket when fitted. The detailed housing concept of the camera is described in Section 3.1.2.
The iterative development process requires the application and evaluation of the adapted measurement cell design for industrial emulsions, which was examined in the laboratory test setup. This led to modifications to the channel width and exposure strategy. In addition, the fluidic connections for integrating the sensor system into the production plant were defined and adapted. In particular, the position and nominal width of the fluidic connections are crucial for achieving a tight, pressure-resistant system and simple handling during operation. For a deeper understanding, the key iterations of the measurement flow cell are summarized in Table A1.
The final measurement flow cell design has the following specifications. The dimension of the measurement flow cell is 85 × 40 × 10 mm (length × width × height) with a minimal channel diameter of d = 1.6 mm. The fluid connections are set to 1/ 8 threads at both sides, providing the connection of the bypass hose. An expansion of the cross section is slowly performed within the measurement cell frame. The circular cross section broadens and is changed to a rectangular cross section to allow the emulsion to flow optimally in relation to the observation window. Here, the channel depth slowly tapers from 0.25 mm to 0.025 mm, resulting in a channel depth of 0.025 mm, while the width and length of the channel are 5 mm and 3 mm, respectively, at the observation window. The optical measurement flow cell features a symmetric design, allowing the emulsion to flow in either direction. To ensure a watertight seal, a fitting gasket is printed with a dimension of 40 × 12 × 1.5 mm. This gasket is designed to perfectly fit into the measurement flow cell frame. The flow cell design boasts a cutout at the bottom of the flow cell that improves translucency and provides a defined place for the LED. A sketch of the optical measurement flow cell and the gasket is shown in Figure 5. CAD sketches are provided here: https://github.com/TUDoAD/AI-based-integrated-smart-process-sensor-for-emulsion-control-in-industrial-application (accessed on 30 July 2024).

3.1.2. Camera System and Illumination Strategy

The camera system was developed on the basis of the results of the laboratory tests. During development, special focus was paid to the image sensor, the optics, the exposure, and the processor board. The following requirements for the integration and application of the optical measurement system for industrial emulsification processes were defined:
  • Adequate magnification and visualization of the emulsion droplets;
  • Definable and reproducible focusing;
  • Exposure time, exposure mode, and light temperature;
  • Hardware of the embedded processor for real-time evaluation;
  • Housing concept and gasket.
The final setup consists of a Sony IMX327 (FRAMOS GmbH, Taufkirchen, Germany) image sensor, which is combined with a TB4M-220-4 (Lensation GmbH, Karlsruhe, Germany) lens. This combination demonstrates the basic visualization capabilities of an emulsion. The choice of lens produces a distortion-free and perspective-correct image. The selected lens has an optical magnification factor of 2.22 and focuses at a working distance of 1 to 4 mm. The image sensor was selected on the basis of resolution, light sensitivity, availability, and sensor size and is from the machine vision and automotive sectors. The specifications of the image sensor can be found in Table 1 below.
Initial lighting tests with a ring-shaped arrangement of eight LEDs were followed by the use of a single high-power LED with a color temperature of 5000 Kelvin (daylight) and a Color Rendering Index (CRI) CRI = 70 for the demonstrator. This was confirmed as a result of the test setup. Thus, a light capacity of a maximum of 135 lm is achieved. The LED is mounted centrally in the channel in front of the measurement flow cell for transmitted light illumination and can also be placed outside the image center for testing purposes. This also allows comparative measurements between direct and indirect illumination. A piezoelectrically adjustable focus module is used for precise electronic focusing of the lens to the desired image plane. The hardware concept of the camera is based on an NXP iMX8M Plus processor core, which is particularly suitable for an intelligent camera platform due to its MIPI/CSI2 interface to a high-resolution image sensor and its hardware blocks for graphics processing and machine learning. The selected embedded processor i.MX8M Plus already contains blocks for machine learning hardware acceleration (NPU with 2.3 TOPS) and a graphics processing unit (GPU).
The newly developed Ark Vision hardware consists of a base board, system-on-module (SOM) board, and sensor board. The baseboard contains the following components:
  • Power supply unit for input voltage of 9–60 V DC;
  • Interfaces to sensor board and electronic focus module;
  • Ethernet PHY;
  • USB interface;
  • Digital inputs and outputs for triggering and signaling;
  • LED driver for controlling the lighting.
The SOM board is equipped with the NXP embedded processor iMX8M Plus, while the sensor board has the image sensor and a mounting option for lens mounts or electronic focus modules.
The components of the demonstrator board are installed in a housing. The housing components are manufactured using a 3D-printing rapid prototyping process for verification purposes, allowing quick changes and adjustments after construction or testing. The housing concept is adapted constructively to ensure that the components used fit the modular concept of the demonstrator. The back part (see Figure 3), which serves as a base for the main board, including the SOM board and the sensor board, is used for this purpose. The focus module is placed on the sensor board. The middle section is placed on top, which closes off the electronics with a sealed glass pane. The front part with the integrated measurement flow cell and LED lighting forms the final part. The measurement flow cell presented in Section 3.1.1 is inserted into the demonstrator case. The challenge is to seal all components, which is achieved with two circumferential tongue-and-groove seals between the three housing parts, and to seal the measurement flow cell against the camera electronics. For this purpose, the middle and back sections form a self-contained unit with a sight glass. The front part with the measurement flow cell seals against the window with a flat gasket and can be removed as a separate block for cleaning. Finally, the sealed electrical connection between the LED assembly (front part) and the main assembly (back part) through the housing walls must be considered.

3.1.3. AI-Based Evaluation for Edge Device

Based on the YOLOv4 model presented in [17], the AI-based image evaluation is examined with respect to its use on the selected i.MX8M embedded processor mentioned in Section 3.1.2. The YOLOv4 architecture is divided into a backbone, neck, and head. The backbone is in charge of feature extraction, the neck collects feature maps from the previous stage, and the head predicts different object classes and bounding boxes. Here, for the backbone, CSPDarknet53 is chosen, the neck comprises a spatial pyramid pooling (SPP) block and a path aggregation network (PAN) block, and the head uses three YOLO blocks. This is based on the originally presented YOLO model [40]. The customized and optimized model for droplet detection is presented in [17]. For this contribution, this model is transferred for use on an edge device to build a smart sensor system. The camera system (see Section 3.1.2), including its processor, is used for this since the process monitoring and characterization are implemented on it. A conversion of the openCV-based model into the TensorFlow framework is necessary for the use of the hardware acceleration blocks for ML (NPU with 2.3 TOPS) and the graphics processing unit (GPU) installed on the processor [41]. The script described in [42] is used for this purpose. Besides the framework conversion—and, thus, the transfer from an openCV-based model to a TensorFlow lite (tflite) model—no further changes to the AI-model were performed. In order to ensure simple and good handling for the operator, it is necessary to create application software (App), which simply starts the camera to enable the evaluation of the droplet images.
An environment containing libraries for Python 3.10 and the Linux system must first be set up on the camera to run the image analysis on the edge device. Due to a limited main memory (2 GB RAM), the dependencies for numpy, pandas, openCV, and especially tflite libraries were reduced in order to save main memory when creating the app version for the AI-based image analysis.
Image evaluation using a tflite model also requires an image input size of around 640 × 640 pixels. Larger input images are scaled down to this size and vice versa, which results in a reduction in resolution and consequently a degradation in droplet detection and size determination. However, in order not to lose any image information, the input images (1920 × 1080 pixels) are cut into smaller image sections, resulting in a total of six sub-images for the AI-based image evaluation. The app version of the image analysis enables for simple operation. The image analysis process is started by the operator by starting the app. The required memory to load the model is around 10 MB, while the buffer memory (250 MB) for the image data in the tensor format occupies the most memory and depends on the amount of data. Also, the memory for prediction requires 10 MB. These values refer to the evaluation of five emulsion images. The location of the processing videos is defined so that the ML pipeline uses these videos for processing. The following steps are performed in a loop:
  • Reading the video and extracting one frame per second;
  • Cutting the individual images into six sub-images;
  • Optional: adjustment of contrast;
  • Starting AI-based droplet detection using YOLO and size determination using HC;
  • Saving the determined droplet diameters and statistical parameters in a .csv file;
  • Requesting if a new video is available in the folder to restart at Step 1.
In addition to the detection images, the output of the detection is the statistical evaluation of the resulting droplet sizes. This statistical evaluation enables process characterization and process control for different process time steps.

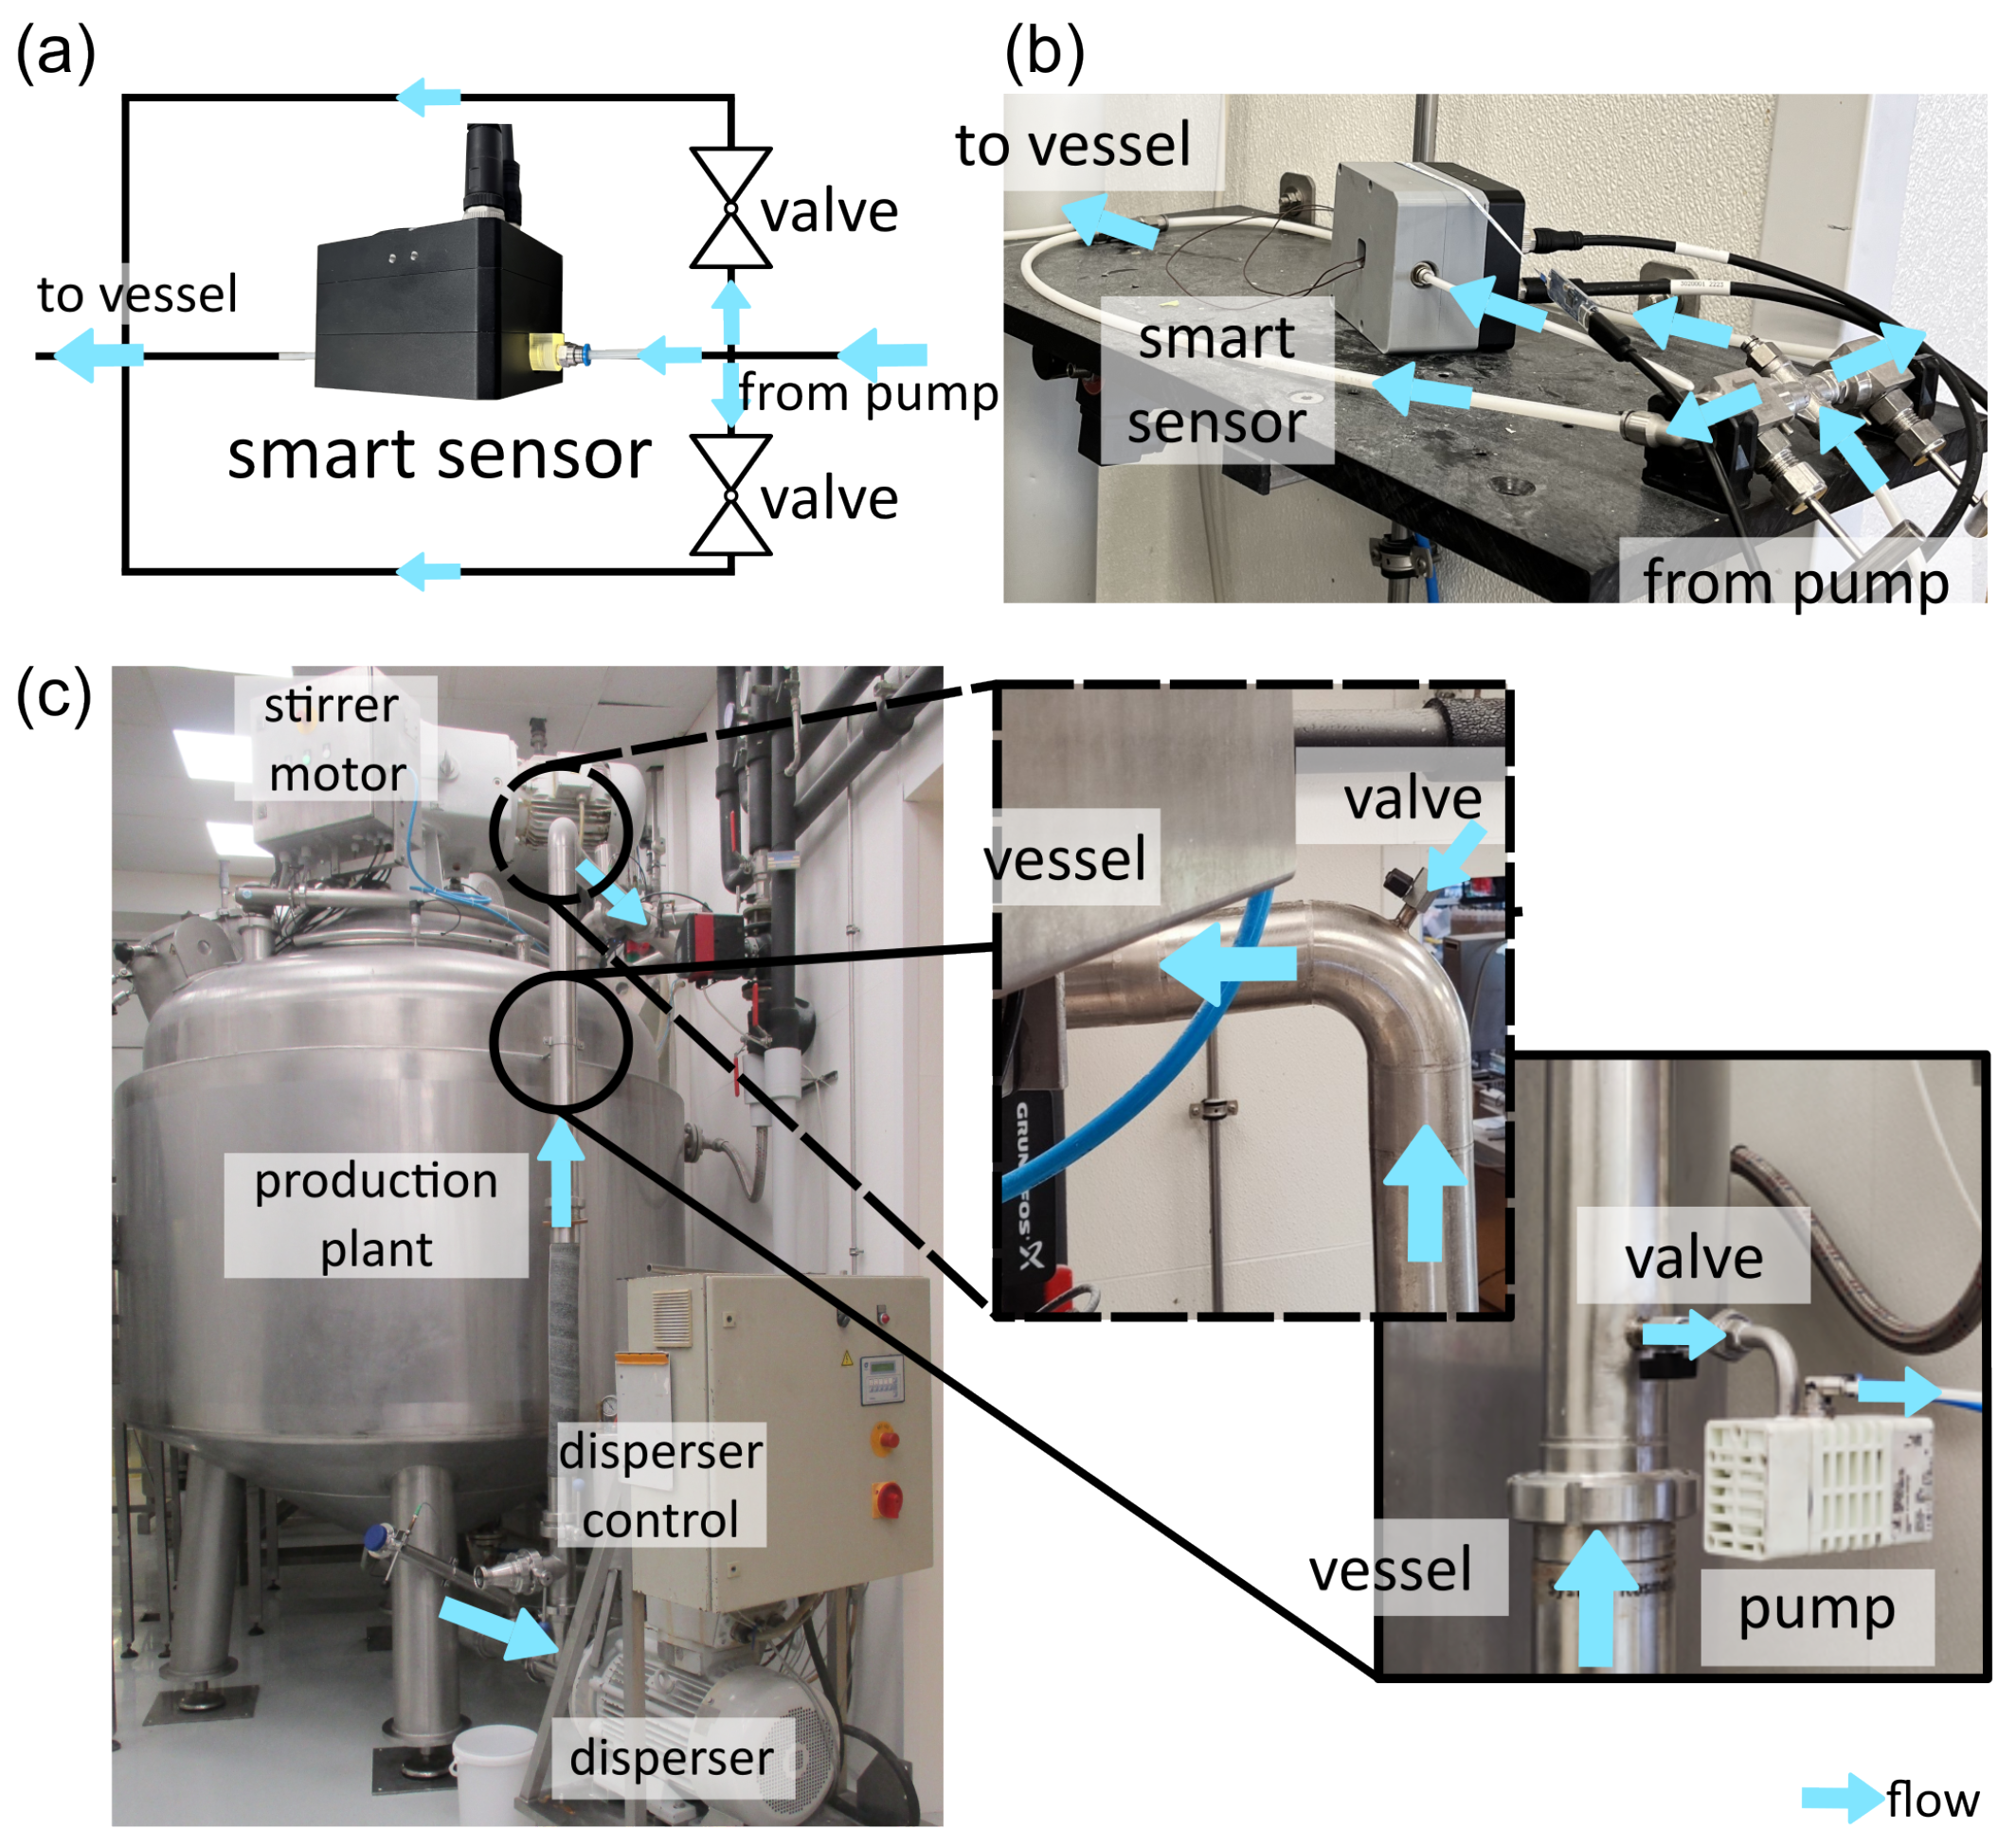
3.2. Sensor Integration

The integration of the optical sensor (see Figure 3) into the system requires several requirements that have been taken into account. These are defined below:
  • Installation of a bypass system with flow control;
  • Representative sampling;
  • GMP-based hygiene requirements with regard to cleaning/maintenance;
  • Connection to the system control unit;
  • Reduction of vibrations on the measurement system as well as simple maintenance and servicing.
Based on the knowledge of the laboratory test setup, a bypass system is installed to integrate the optical sensor in the production plant. This involves a pipe system for the flow and reflux of the optical sensor system connected to the circulation pipe of the test system. The design ensures a high flow rate in the cleaning phase and has little impact on the flow of the emulsion. An influence on the resulting droplet size was not measured. The flow to the measurement system is integrated into the bypass after the flexible hose pipe to ensure that the vibrations caused by the disperser are removed from the system and not transferred by the bypass to the optical smart process sensor. The reflux is located just before the stirred vessel. A ball valve is installed on the flow pipe to enable maintenance and intensive cleaning work and to regulate the flow during the test phase. A flexible hose system is used to connect the bypass to the smart process sensor to reduce additional vibrations.
A diaphragm pump (Midgetbox, Debem Deutschland GmbH, Holzkirchen, Germany) is installed in the feed to ensure a constant and controllable flow rate. To regulate the flows of different formulations with different viscosities through the optical sensor, a multiple bypass system was developed in which several hose connections that are closable by valves are installed in series. This multiple bypass system is shown in Figure 6. The bypass significantly reduces the flow velocity, which is necessary to enable the optical analysis of the emulsion using the optical sensor. The general setup is located close to the processing plant.
The control unit of the system is used to supply the measurement system with power and to ensure an Ethernet connection. This is required for data transmission. In addition, the camera is connected to the bypass diaphragm pump, provides the signal to the bypass, and initiates pumping through the bypass. This signal is triggered electrically via a General Purpose Output (GPO) of the camera system. In the future, the data on the quality of the processed emulsion will be utilized to manage the entire process. This will be achieved through direct communication between the camera system and the control unit using an Ethernet connection.

3.3. Validation of Measurement System

Diverse industrial emulsions, Probio body lotion (batch number: 2329005), and collagen cream (batch number: 2335213) were measured at different process times to validate the smart process sensor described in Section 3.1. For benchmarking, the results are compared with common analysis methods using offline samples or reference values. In addition to a qualitative evaluation of the resulting emulsion images, the reproducibility of the AI-based measurement method is assessed. Droplet sizes are determined for an example emulsion at three different time steps. These time steps represent the same state during the emulsification process, as they are recorded with a Δ t of 1 s, with no direct flow in the measurement cell at the time of recording.
Figure 7a illustrates the ML-pipeline used for emulsion image processing and analysis. Here, the first step is the cutting of the 1920 × 1080 pixel input image into six sub-images. An additional contrast adjustment can also be performed here. Next, the system performs AI-based droplet detection using YOLOv4, size determination using HC, as well as generation of the .csv file, which contains the droplet diameters and statistical parameters. In Figure 7b, the detection of the three example images is shown, while Figure 7c illustrates the corresponding statistical evaluation. The results are presented in boxplots with additional information about the number of droplets. The images show a high-contrast representation of the emulsion, which enables an automated method for droplet size analysis. In addition, the total image is in focus, and the used telecentric objective ensures that no perspective distortion is present.
The detection results (Figure 7c) were evaluated with a confidence score of CS = 0.6, which was identified in previous studies [16]. Given that the three selected images show a very similar state of the emulsification process, it is expected that the number of droplets detected and the statistical evaluation will be consistent. This evaluates and validates the reproducibility of the analysis method. The number of droplets detected fluctuates between 427, 403, and 430 droplets per input image for the states t1, t2, and t3, respectively. Statistical analysis demonstrates an approximation of the results with a CS of 0.6. Both the median and the mean deviate by a maximum of Δ d50 = 1.95 μ m and Δ d ¯ = 1.09 μ m, respectively. These deviations are observed between the states t1 and t2. When considering the interquartile range (IQR), a maximum deviation of 3.3 μ m is again observed between the first two states. These minor fluctuations are not solely attributable to detection and size determination errors. Due to the very low flow rate and movement within the measurement cell, the three recorded states (see Figure A1) are very similar but not identical.
Additional time steps and industrial emulsions were measured in order to validate the measurement system and to evaluate the application possibilities for process monitoring and control. In addition to the validation of the resulting droplet size, the evaluation time was assessed. Figure 8 presents three distinct emulsion images captured within the measurement system and analyzed using the AI-based evaluation method implemented in the camera’s processor. The resulting droplet sizes are compared with reference values from the produced batches from SystemKosmetik Produktionsgesellschaft für kosmetische Erzeugnisse mbH, Münster, Bavaria, Germany. For this comparison, samples from the same time states examined for this analysis were observed under a microscope and evaluated. In addition, a comparative analysis using ImageJ was performed, assessing at least 100 droplets per image.
Figure 8a shows the comparison of the manual and AI-based statistical evaluation in the form of a histogram for Figure 7 time step t3 to evaluate the trustworthiness of the AI-based droplet size evaluation. Comparative analysis of the distributions reveals a consistent trend in the DSDs. In total, 400 droplets were labeled for this comparison. The median of the distribution as determined using the AI-based method is d50 = 43.55 μ m, whereas the median from manual evaluation is d50 = 42.41 μ m, resulting in a deviation of Δ d 50 = 1.14 μ m. Furthermore, the mean values of both distributions were analyzed, with YOLOv4 + HC producing d ¯ YOLOv4 = 46.31 μ m and ImageJ d ¯ ImageJ = 45.01 μ m. The IQR shows a difference of Δ d = 0.52 μ m. Overall, the measured droplet sizes are credible, with minor deviations attributed to the droplet labeling process. Given the camera resolution, where one pixel corresponds to 1.2 μ m, the assigned label length for each droplet significantly impacts the measurement, especially for smaller droplets.
Figure 8b presents again the validation of the AI-based method for a later time step than that presented in Figure 8a. This leads to smaller droplet sizes and probably to a narrower distribution. The median of the distribution, which was determined using the AI method, is d50 = 28.71 μ m. The median of the manual evaluation is d50 = 24.07 μ m. The deviation is therefore Δ d 50 = 4.74 μ m. In addition, the mean values of both distributions were calculated ( d ¯ YOLOv4 = 29.65 μ m and d ¯ ImageJ = 25.69 μ m), as were the IQRs, which differ by a delta of Δ d = 7.74 μ m. The number of evaluated droplets using YOLOv4 + HC was 134, while 100 droplets were labeled manually. At this point, the gap between manual and AI-based evaluation is more pronounced than before, mainly due to the influence of image resolution. Motion blur further complicates the AI-based evaluation, as the edges of the droplets are less prominent. In addition, the AI-based method shows lower sensitivity for smaller droplets than the manual method, as can be seen from histograms and IQRs. This lower sensitivity is particularly noticeable if the droplet classes are widely scattered in one image. Nevertheless, this lower sensitivity is a consequence of the pixel-to-micrometer ratio as a result of the small magnification and sensor resolution. The last comparison focuses on the final product of an emulsion that has already been cooled. Thus, a very narrow and small droplet size distribution is expected. The number of droplets detected was 427, while 100 droplets were labeled for the ImageJ evaluation. The median between the distributions differs by Δ d 50 = 1.59 μ m, the mean differs by Δ d ¯ = 1.75 μ m, and the IQR differs by Δ d = 0.06 μ m. The histogram shown in Figure 8c has a class width of 0.54 μ m, indicating the importance of accurate labeling. Consequently, small differences in the defined pixel length of a droplet have a large influence on the resulting droplet size. Therefore, only those droplets whose edges were 100% recognized were evaluated manually. The reference value, which was evaluated for this end product in the laboratory of SystemKosmetik Prduktionsgesellschaft, is a value of d50 = 9.02 μ m, indicating a deviation in the AI-based results ( Δ d 50 = 2.11 μ m). However, the overall deviations in the median and mean values are again explained by the pixel-to-micrometer ratio, which has a large influence on the resulting droplet size. If the flow speed is too high for the chosen shutter speed, motion blur occurs, amplifying the effect of the pixel-to-micrometer ratio as the droplet edges become noticeably blurred. The measurement system itself shows no influence on the droplet size and does not affect droplet measurement. Increasing the image resolution and the use of a greater magnification are recommended for further studies.
Considering the processing time of the individual images, the single droplet detection and evaluation of a single image using the ML pipeline, which is running on the camera’s processor, is completed within approximately four seconds, plus approximately 30 s to initialize the detection’s interpreter. However, this processing time depends on the number of droplets detected per image and may therefore differ. In comparison, the manual evaluation of approximately 100 droplets takes at least 10 min. The acceleration of the process evaluation in this way enables real-time evaluation and characterization of an emulsification process and provides the possibility of process control. For this, further optimization of AI-based image evaluation can be performed on the edge device. Here, the accuracy of the model and the detection time can be considered. In general, performance optimization can be achieved by hardware and software changes. Improvement in detection performance, particularly for small droplets, can be achieved with further training, higher image resolution, and greater magnification. The conversion of YOLOv4 weights for implementation in a TensorFlow framework may have resulted in a reduction in accuracy. Direct training based on a TensorFlow model is a conceivable approach. Additionally, adapting the methodology to a YOLOv7 model is planned, which is expected to not only enhance accuracy but also reduce detection time. This finding has been supported by initial studies and is well-documented in the literature [43,44]. The current investigations utilize only the camera’s CPU for the evaluation methodology, indicating that leveraging the GPU or the processor’s NPU would accelerate the evaluation process.
Overall, the integrated smart process sensor is suitable for process monitoring and potential process control. However, optimizing detection performance is desirable, as it can substantially expand the sensor’s range of applications further. Based on the TRL level, a level-7 sensor is presented since it is a system prototype demonstration in an operational environment showing first validated results.

4. Conclusions and Outlook

This contribution presents the development, testing, and validation of an integrated smart process sensor. The design strategy represents an iterative approach that considers a measurement flow cell for optical accessibility to the emulsion, a camera system as the optical sensor, the coupling of these two components, and the integration of the total measurement system into an industrial emulsion production plant. In addition to the development of the sensor, AI-based droplet size determination for application on the camera processor was modified and validated with respect to the accuracy and applicability for the characterization of the emulsification process. The integration of the sensor system into a production plant for emulsions—more precisely cosmetic products—shows the possibility of evaluation of the product and process during operation without delay in time. The validation of the measurement system shows that the system produces consistent and reproducible results. In addition, the applicability of the measurement system was validated using a benchmark method. The developed bypass system and the sensor system do not influence the droplet size. The resulting DSDs differed only slightly, and the system is sufficiently accurate to be used on an industrial scale. The first application of the measurement system shows its usability for different types of industrial emulsions focusing on cosmetic products. Here, its use to determine different droplet size ranges is shown. In particular, the detection of smaller droplet sizes and the investigation in flow, resulting in motion blur, show an increasing deviation from the manual method and require critical consideration. However, future steps are intended to optimize this deviation and include both hardware and software adaptations. These optimization steps increase the accuracy of the detection itself and the image resolution. The general measurement concept as well as the combination of the optical measurement cell and the camera system, shows a reliable evaluation of the emulsification process, allows faster process evaluation, and provides a basis for process control. Furthermore, the optical measurement cell must be tested for long-term use. Consequently, the durability and pressure resistance of fluidic connections in particular should be investigated. However, the measurement system is sealed against dust and water by the camera housing, ensuring that the measurement is not affected. The camera housing is usable for total operating temperatures up to 85 °C and a humidity up to + 95 % r.h.
For future investigations, the focus will be on adapting AI-based evaluation methods for explicit use on an edge device. A later version of the YOLO evaluation algorithm will be considered for this purpose. In addition, the camera system is to be equipped with a larger sensor (5 MP instead of 2 MP) to achieve a higher resolution of the emulsion images. The evaluation using the TRL level includes a further qualification of the methodology, which is achieved by comparing a variety of emulsions. Further, a material and production study needs to be performed to test and possibly increase the lifetime of the optical measurement cell. Further validation of the presented approach considering the longevity allows for a higher classification of the measurement system based on the TRL level. Finally, the real-time data obtained by the sensor can be used for process control. The evaluation of intermediate and end products is relevant here. Current knowledge indicates that an increase in efficiency is expected for process execution, allowing an increase in plant availability.

Author Contributions

Conceptualization, I.B., S.S. (Sven Salzer), S.S. (Sebastian Stein) and N.K.; methodology, I.B. and N.K.; software, I.B., S.S. (Sven Salzer) and T.O.O.O.; validation, I.B., S.S. (Sven Salzer), S.S. (Sebastian Stein) and N.K.; formal analysis, I.B., S.S. (Sven Salzer) and S.S. (Sebastian Stein); investigation, I.B., S.S. (Sven Salzer), S.S. (Sebastian Stein), T.O.O.O. and O.F.T.; resources, given in the text; data curation, I.B., S.S. (Sven Salzer), S.S. (Sebastian Stein), T.O.O.O. and O.F.T.; writing—original draft preparation, I.B.; writing—review and editing, I.B., S.S. (Sven Salzer), S.S. (Sebastian Stein) and N.K.; visualization, I.B.; supervision, I.B. and N.K.; project administration, S.S. (Sven Salzer), S.S. (Sebastian Stein) and N.K.; funding acquisition, N.K. All authors have read and agreed to the published version of the manuscript.

Funding

The authors thank the German Federal Ministry for Economic Affairs and Climate Action (BMWK) for funding this research as part of AiF (support codes: KK5168501 PR0, KK5173701 PR0, and KK5057302 PR0).

Data Availability Statement

The associated CAD sketches for this article are available on GitHub at https://github.com/TUDoAD/AI-based-integrated-smart-process-sensor-for-emulsion-control-in-industrial-application (accessed on 30 July 2024). The repository may be subject to changes due to further contributions. Thus, the state of the repository as described in this paper is available on Zenodo: https://zenodo.org/doi/10.5281/zenodo.12819799 (accessed on 30 July 2024). The adaptions for the AI-based droplet detection are based on: https://github.com/TUDoAD/DropletDetection_YOLOv4; https://zenodo.org/doi/10.5281/zenodo.10938289 (accessed on 30 July 2024).

Acknowledgments

The authors would like to thank Carsten Schrömges (TU Dortmund University, BCI Laboratory of Equipment Design), Michael Wagner and Thomas Pelz (SystemKosmetik Produktionsgesellschaft für kosmetische Erzeugnisse mbH), as well as Jens Clees (Ark Vision Systems GmbH & Co. KG for their technical support, and Patrick Becker (Ark Vision Systems GmbH & Co. KG for his support during the software integration on the Ark Vision SmartCam. Additionally, we would like to thank Robin Fortmann (TU Dortmund University, BCI Laboratory of Equipment Design) for the further adaption and preparation of the 3D-printed measurement flow cell.

Conflicts of Interest

Author Sven Salzer is employed by the company Ark Vision Systems GmbH & Co. KG. Author Sebastian Stein is employed by the SystemKosmetik Produktionsgesellschaft für Kosmetische Erzeugnisse mbH. The authors declare that the research was conducted in the frame of the iSPS project in the absence of any commercial or financial relationships that could be construed as a potential conflict of interest. The funding agency had no role in the design of the study; in the collection, analyses, or interpretation of data; in the writing of the manuscript, or in the decision to publish the results.

Abbreviations

The following abbreviations are used in this manuscript:
AIArtificial Intelligence
AppApplication Software
CCDCharge-Coupled Device
CPUCentral Processing Unit
CSConfidence Score
CRIColor Rendering Index
DCDirect Current
DSDDroplet Size Distribution
GMPGood Manufacturing Practice
GPOGeneral Purpose Output
GPUGraphics Processing Unit
HHeight
HCHough Circle
IQRInterquartile Range
LLength
LEDLight-Emitting Diode
MLMachine Learning
NPUNeural Processing Unit
PANPath Aggregation Network
PDFProbability Density Function
PHYPhysical Layer
PVMParticle Vision Microscope
RAMRandom-Access Memory
SOMSystem-on-Module
SPPSpatial Pyramid Pooling
TFLITETensorFlow Lite
TOPSTrillions or Tera Operations per Second
TRLTechnical Readiness Level
USBUniversal Serial Bus
WWidth
v4Version 4
YOLOYou Only Look Once

Appendix A

Table A1. History of the measurement flow cell designs that were iteratively generated. Changes compared to the preceding prototype are marked in blue in the images. The first prototype is related to [16], while the last is used for the presented work. For the experimental setup, consider the test setup [16].
CAD SketchNo. of Components
(Total)
Channel Dimension/
mm × mm × mm *1
Fluid ConnectionChange *2
Processes 12 01821 i00173 × 3 × 0.025–0.2501/ 8 -
Processes 12 01821 i00243 × 3 × 0.025hose nozzleReduction in complexity;
Changes fluid connection for faster testing in test setup
Processes 12 01821 i00333 × 5 × 0.0255 mm/M5
inside camera housing
Wider channel;
Changes fluid connection + screwing for camera/plant integration
Processes 12 01821 i00433 × 5 × 0.0258 mm/M8
outside camera housing
Fluid connection outside camera housing;
Multiple threads for longer lifetime
*1 At the observation window (W × L × H); *2 Changes to previous prototype.
Figure A1. Input images for reproducibility test of the AI-based measurement using the smart process sensor. From left to right, the different time steps t1, t2, and t3 are presented.
Processes 12 01821 g0a1

References

  1. Jiang, Z. Online Monitoring and Robust, Reliable Fault Detection of Chemical Process Systems. In Proceedings of the 33rd European Symposium on Computer Aided Process Engineering (ESCAPE33), Athens, Greece, 18–21 June 2023; pp. 1623–1628. [Google Scholar] [CrossRef]
  2. Tadros, T. Emulsions—Formation, Stability, Industrial Applications; De Gruyter: Berlin, Germany; Boston, MA, USA, 2016. [Google Scholar] [CrossRef]
  3. Hunter, T.; Pugh, R.; Franks, G.; Jameson, G. The Role of Particles in Stabilising Foams and Emulsions. Adv. Colloid Interface Sci. 2008, 137, 57–81. [Google Scholar] [CrossRef] [PubMed]
  4. Khosravi, H.; Thaker, A.; Donovan, J.; Ranade, V.; Unnikrishnan, S. Artificial Intelligence and Classic Methods to Segment and Characterize Spherical Objects in Micrographs of Industrial Emulsions. Int. J. Pharm. 2024, 649, 123633. [Google Scholar] [CrossRef]
  5. Panckow, R.; Reinecke, L.; Cuellar, M.; Maaß, S. Photo-Optical In-Situ Measurement of Drop Size Distributions: Applications in Research and Industry. Oil Gas Sci. Technol. 2017, 72, 14. [Google Scholar] [CrossRef]
  6. Maaß, S.; Rojahn, J.; Hänsch, R.; Kraume, M. Automated Drop Detection Using Image Analysis for Online Particle Size Monitoring in Multiphase Systems. Comput. Chem. Eng. 2012, 45, 27–37. [Google Scholar] [CrossRef]
  7. Emmerich, J.; Tang, Q.; Wang, Y.; Neubauer, P.; Junne, S.; Maaß, S. Optical Inline Analysis and Monitoring of Particle Size and Shape Distributions for Multiple Applications: Scientific and Industrial Relevance. Chin. J. Chem. Eng. 2019, 27, 257–277. [Google Scholar] [CrossRef]
  8. Abidin, M.; Raman, A.; Nor, M. Review on Measurement Techniques for Drop Size Distribution in a Stirred Vessel. Ind. Eng. Chem. Res. 2013, 52, 16085–16094. [Google Scholar] [CrossRef]
  9. Brás, L.; Gomes, E.; Ribeiro, M.; Guimarães, M. Drop Distribution Determination in a Liquid-Liquid Dispersion by Image Processing. Int. J. Chem. Eng. 2009, 2009, 746439. [Google Scholar] [CrossRef]
  10. Bowler, A.; Bakalis, S.; Watson, N.A. Review of In-line and On-line Measurement Techniques to Monitor Industrial Mixing Processes. Chem. Eng. Res. Des. 2020, 153, 463–495. [Google Scholar] [CrossRef]
  11. Neuendorf, L.; Müller, P.; Lammers, K.; Kockmann, N. Convolutional Neural Network (CNN)-Based Measurement of Properties in Liquid–Liquid Systems. Processes 2023, 11, 1521. [Google Scholar] [CrossRef]
  12. Wu, Y.; Gao, Z.; Rohani, S. Deep Learning-based Oriented Object Detection for In situ Image Monitoring and Analysis: A Process Analytical Technology (PAT) Application for Taurine Crystallization. Chem. Eng. Res. Des. 2021, 170, 444–455. [Google Scholar] [CrossRef]
  13. Huo, Y.; Zhang, F. In-situ Detection of Micro Crystals During Cooling Crystallization Based on Deep Image Super-Resolution Reconstruction. IEEE Access 2021, 9, 31618–31626. [Google Scholar] [CrossRef]
  14. Lins, J.; Harweg, T.; Weichert, F.; Wohlgemuth, K. Potential of Deep Learning Methods for Deep Level Particle Characterization in Crystallization. Appl. Sci. 2022, 12, 2465. [Google Scholar] [CrossRef]
  15. Unnikrishnan, S.; Donovan, J.; MacPherson, R.; Tormey, D. An Integrated Histogram-Based Vision and Machine-Learning Classification Model for Industrial Emulsion Processing. IEEE Trans. Ind. Inform. 2020, 16, 5948–5955. [Google Scholar] [CrossRef]
  16. Burke, I.; Assies, C.; Kockmann, N. Rapid Prototyping of a Modular Optical Flow Cell for Image-Based Droplet Size Measurements in Emulsification Processes. J. Flow Chem. 2024. [Google Scholar] [CrossRef]
  17. Burke, I.; Dhayaparan, T.; Youssef, A.S.; Schmidt, K.; Kockmann, N. Two Deep Learning Methods in Comparison to Characterize Droplet Sizes in Emulsification Flow Processes. J. Flow Chem. 2024. [Google Scholar] [CrossRef]
  18. Kockmann, N. Digital Methods and Tools for Chemical Equipment and Plants. React. Chem. Eng. 2019, 4, 1522–1529. [Google Scholar] [CrossRef]
  19. Kadlec, P.; Gabrys, B.; Strandt, S. Data-driven Soft Sensors in the Process Industry. Comput. Chem. Eng. 2009, 33, 795–814. [Google Scholar] [CrossRef]
  20. Neto, J.; Mota, A.; Lopes, G.; Coelho, B.; Frazão, J.; Moura, A.; Oliveira, B.; Sieira, B.; Fernandes, J.; Fortunato, E.; et al. Open-source Tool for Real-Time and Automated Analysis of Droplet-Based Microfluidic. Lab Chip 2023, 23, 3238–3244. [Google Scholar] [CrossRef] [PubMed]
  21. Unnikrishnan, S.; Donovan, J.; Tormey, D.; Macpherson, R. Emulsion Quality Evaluation Using Automated Image Analysis. EasyChair Prepr. 2022, 8762. [Google Scholar] [CrossRef]
  22. Habib, G.; Qureshi, S. Optimization and Acceleration of Convolutional Neural Networks: A Survey. J. King Saud Univ.—Comput. Inf. Sci. 2022, 34, 4244–4268. [Google Scholar] [CrossRef]
  23. Neuendorf, L.; Khaydarov, V.; Schler, C.; Kock, T.; Fischer, J.; Urbas, L.; Kockmann, N. Artificial Intelligence-based Module Type Package-compatible Smart Sensors in the Process Industry. Chemie-Ingenieur-Technik 2023, 95, 1546–1554. [Google Scholar] [CrossRef]
  24. Sibirtsev, S.; Zhai, S.; Neufang, M.; Seiler, J.; Jupke, A. Mask R-CNN Based Droplet Detection in Liquid–Liquid Systems, Part 2: Methodology for Determining Training and Image Processing Parameter Values Improving Droplet Detection Accuracy. Chem. Eng. J. 2023, 473, 144826. [Google Scholar] [CrossRef]
  25. Sibirtsev, S.; Zhai, S.; Jupke, A. Mask R-CNN Based Droplet Detection in Liquid–Liquid Systems, Part 3: Model Generalization for Accurate Processing Performance Independent of Image Quality. Chem. Eng. Res. Des. 2024, 202, 161–168. [Google Scholar] [CrossRef]
  26. Schäfer, J.; Schmitt, P.; Hlawitschka, M.; Bart, H. Measuring Particle Size Distributions in Multiphase Flows Using a Convolutional Neural Network. Chemie-Ingenieur-Technik 2019, 91, 1688–1695. [Google Scholar] [CrossRef]
  27. Liu, J.; Kuang, W.; Liu, J.; Gao, Z.; Rohani, S.; Gong, J. In-situ Multiphase Flow Imaging for Particle Dynamic Tracking and Characterization: Advances and Applications. Chem. Eng. J. 2022, 438, 135554. [Google Scholar] [CrossRef]
  28. Manee, V.; Zhu, W.; Romagnoli, J. A Deep Learning Image-Based Sensor for Real-Time Crystal Size Distribution Characterization. Ind. Eng. Chem. Res. 2019, 58, 23175–23186. [Google Scholar] [CrossRef]
  29. Gao, Z.; Wu, Y.; Bao, Y.; Gong, J.; Wang, J.; Rohani, S. Image Analysis for In-line Measurement of Multidimensional Size, Shape, and Polymorphic Transformation of l -Glutamic Acid Using Deep Learning-Based Image Segmentation and Classification. Cryst. Growth Des. 2018, 18, 4275–4281. [Google Scholar] [CrossRef]
  30. Kockmann, N.; Bittorf, L.; Krieger, W.; Reichmann, F.; Schmalenberg, M.; Soboll, S. Smart Equipment—A Perspective Paper. Chem. Ing. Tech. 2018, 90, 1806–1822. [Google Scholar] [CrossRef]
  31. Bundesministerium des Innern und für Heimat. Design Thinking. Available online: https://www.orghandbuch.de/Webs/OHB/DE/OrganisationshandbuchNEU/4_MethodenUndTechniken/Methoden_A_bis_Z/Design_Thinking/Design%20Thinking_node.html (accessed on 12 July 2024).
  32. Manning, C. Technology Readiness Levels. Available online: https://www.nasa.gov/directorates/somd/space-communications-navigation-program/technology-readiness-levels/ (accessed on 12 July 2024).
  33. Sopat. Available online: https://www.sopat.de/de/ (accessed on 18 July 2024).
  34. Dinter, R.; Helwes, L.; Vries, S.; Jegatheeswaran, K.; Jibben, H.; Kockmann, N. 3D-Printed Open-Source Sensor Flow Cells for Microfluidic Temperature, Electrical Conductivity, and pH Value Determination. J. Flow Chem. 2024, 14, 469–479. [Google Scholar] [CrossRef]
  35. Glotz, G.; Kappe, C. Design and Construction of an Open Source-based Photometer and its Applications in Flow Chemistry. React. Chem. Eng. 2018, 3, 478–486. [Google Scholar] [CrossRef]
  36. Schmalenberg, M.; Sallamon, F.; Haas, C.; Kockmann, N. Temperature-Controlled Minichannel Flow-Cell for Non-Innvasive Particle Measurements in Solid-Liquid Flow. In Proceedings of the ASME 2020 18th International Conference on Nanochannels, Microchannels, and Minichannels (ICNMM2020), Orlando, FL, USA, 12–15 July 2020. [Google Scholar] [CrossRef]
  37. Burke, I.; Youssef, A.S.; Kockmann, N. Design of an AI-supported Sensor for Process Relevant Parameters in Emulsification Processes. In Proceedings of the Dresdner Sensor-Symposium, Dresden, Germany, 5–7 December 2022; pp. 218–223. [Google Scholar] [CrossRef]
  38. Analytics, H. Durchfluss-Küvette 137-QS, Quarzglas High Performance, 1 mm Schichtdicke. Available online: https://www.analytics-shop.com/de/hl137-1-40 (accessed on 18 July 2024).
  39. Schneider, C.; Rasband, W.; Eliceiri, K. NIH Image to ImageJ: 25 years of image analysis. Nat. Methods 2012, 9, 671–675. [Google Scholar] [CrossRef] [PubMed]
  40. Bochkovskiy, A.; Wang, C.; Liao, H. YOLOv4: Optimal Speed and Accuracy of Object Detection. arXiv 2020, arXiv:2004.10934. [Google Scholar] [CrossRef]
  41. IMXMLUG_6.6.23_2.0.0—i.MX Machine Learning User’s Guide. Available online: https://www.nxp.com/docs/en/user-guide/IMX-MACHINE-LEARNING-UG.pdf (accessed on 16 July 2024).
  42. Laskowski, P. GitHub Repository—Convert_Darknet_YOLO_to_TensorFlow (patryklaskowski). Available online: https://github.com/patryklaskowski/Convert_Darknet_YOLO_to_TensorFlow (accessed on 16 July 2024).
  43. Wang, C.; Bochkovskiy, A.; Liao, H. YOLOv7: Trainable Bag-of-freebies Sets New State-of-the-art for Real-time Object Detectors. arXiv 2022, arXiv:2207.02696. [Google Scholar]
  44. Durve, M.; Orsini, S.; Tiribocchi, A.; Montessori, A.; Tucny, J.; Lauricella, M.; Camposeo, A.; Pisignano, D.; Succi, S. Benchmarking YOLOv5 and YOLOv7 Models with DeepSORT for Droplet Tracking Applications. Eur. Phys. J. 2023, 46, 32. [Google Scholar] [CrossRef]
Figure 1. Schematic overview of the iterative sensor development strategy, including the optimization steps for sensor development and plant integration. The strategy includes the progress from the idea and requirements definition over the design of a test setup to the integration of the sensor system into the production plant. This requires continuous validation and evaluation of the state of the system. In particular, the measurement flow cell design, the components and composition of the camera parts, the integration of the measurement flow cell into the camera, the evaluation option of the resulting droplets, and the integration of the system were decisive [37,38].
Processes 12 01821 g001
Figure 2. Image of the industrial plant for emulsification processes, including a closer view of the disperser unit and the flow direction of the emulsion, at SystemKosmetik Produktionsgesellschaft für kosmetische Erzeugnisse mbH, Münster, Bavaria, Germany.
Processes 12 01821 g002
Figure 3. Explosion view of the optical sensor design, including the measurement flow cell as well as the camera setup in (a) and an image of the assembled sensor in (b).
Processes 12 01821 g003
Figure 4. Schematic overview of the iterative measurement flow cell design, including the optimization steps for camera integration. The strategy includes the progress from the idea [16] and the defining of the requirements for the design of a test setup to the integration of the measurement flow cell into the production plant. This requires continuous validation and evaluation of the design and possible system integration strategies.
Processes 12 01821 g004
Figure 5. Technical drawing of the final design of the measurement cell frame and gasket, including important dimensions.
Processes 12 01821 g005
Figure 6. (a) Schematic sketch of the multiple bypass system and the integrated optical sensor and (b) an image of the bypass setup, including the optical sensor, at SystemKosmetik Produktionsgesellschaft für kosmetische Erzeugnisse mbH, Münster, Bavaria, Germany. (c) Image of the industrial plant for emulsification processes, including the position of the bypass with the integrated optical sensor.
Processes 12 01821 g006
Figure 7. (a) The ML-pipeline for an example emulsion image. (b) Three examples of images, including their detection at different time steps t during an industrial emulsification process. The time steps presented show the same state during the emulsification step since they are recorded with a Δ t of 1 s with no flow in the measurement cell at the time of recording. (c) The corresponding boxplots for the three different time steps. The droplet size is on the primary y-axis, while the total number of detected droplets is illustrated as bars that correspond to the secondary y-axis.
Processes 12 01821 g007
Figure 8. The statistical evaluation of various industrial emulsions. Here, the input image and an example of the sub-image after the detection are illustrated. The statistical evaluation is presented as a histogram, which shows the results of the AI-based evaluation using YOLOv4 and HC as well as the comparison results of a manual evaluation method. (ac) Three different examples. (a,b) The same formulation (collagen cream) for different time steps and (c) a different formulation (Probio bodylotion) for final products. Dark grey: evaluation using YOLOv4 and HC with a CS of 0.6, and light blue: manual evaluation using ImageJ.
Processes 12 01821 g008
Table 1. Properties of the used image sensor for the camera system.
PropertiesSony IMX327
Resolution/pixel1920 × 1080 (2 MP)
Sensor size / 1/2.8
Pixel size/ μ m2.9
Max. image diagonal/mm6.46
Shutter/-Rolling
Disclaimer/Publisher’s Note: The statements, opinions and data contained in all publications are solely those of the individual author(s) and contributor(s) and not of MDPI and/or the editor(s). MDPI and/or the editor(s) disclaim responsibility for any injury to people or property resulting from any ideas, methods, instructions or products referred to in the content.

