Article

Study on S-N Curve and Fatigue Limit of Drill Pipe in Offshore Short-Radius Sidetracking Process

1
Marine Engineering College, Dalian Maritime University, Dalian 116026, China
2
College of Petroleum Engineering, Xi’an Shiyou University, Xi’an 710065, China
*
Authors to whom correspondence should be addressed.
Processes 2024, 12(9), 1828; https://doi.org/10.3390/pr12091828
Submission received: 28 May 2024 / Revised: 2 July 2024 / Accepted: 5 July 2024 / Published: 28 August 2024
(This article belongs to the Section Process Control and Monitoring)

Abstract

:
To evaluate the fatigue reliability of different types of drill pipes during an offshore short-radius sidetracking process, the fatigue life and limit of G105, S135, and V150 steel and a new titanium alloy drill pipe were studied in air, high-temperature conditions, drilling fluid, and drilling fluid containing H2S. First, the chemical composition, microstructure, and tensile properties of four kinds of drill pipe materials were tested. Secondly, the fitting effects of different S-N models were evaluated and identified, a fatigue test of four kinds of drill pipe under different environments (air, high temperature, drilling fluid, and H2S drilling fluid) was carried out, and the S-N curves and fatigue limits of different drill pipes under different environments were obtained. Finally, the fatigue sensitivity of drill pipes to different factors was studied, and the potential corrosion fatigue mechanism was explained. The research results show that the fatigue life of a drill pipe in a non-corrosive environment (air and high temperature) is mainly related to steel grade, and the fatigue life of a titanium alloy drill pipe is better than that of a steel drill pipe in a corrosive environment. The dense passivation film on the surface of a titanium alloy drill pipe is an important reason for its better corrosion fatigue life than that of a steel drill pipe. This study provides important data support for selecting drill pipes in offshore short-radius sidetracking.

1. Introduction

The remaining oil resources in offshore oil fields are abundant. How to efficiently develop the remaining oil in old wells has become an urgent problem that needs to be solved. Short-radius side drilling is a high-benefit and low-cost remaining-oil-exploitation technology [1,2]. This technology opens a window in the original wellbore to make an inclination, directly drilling to the target layer, makes full use of the original well section of the old well, avoids invalid footage, directly acts on the exploitation of the old well reservoir, increases the exposed area of the oil reservoir, greatly improves the recovery rate and production, and is of great significance for reservoir potential exploitation and increased stable production and secondary reconstruction [3].
It is worth noting that although the development of short-radius side drilling has brought high economic benefits, compared with traditional vertical wells, short-radius side drilling has a small curvature radius during drilling, difficult construction, a large dogleg degree, and high construction slope requirements. The high curvature of the lateral drilling section causes the bending stress, friction resistance, and torque of the drill pipe to increase. When there are corrosive media such as CO2 and H2S at the bottom of the well, the drill pipe is prone to fatigue failure under the coupling action of high cyclic stress and a harsh corrosive environment [4].
To reduce the fatigue failure of drill pipes, a large number of scholars have carried out research on the fatigue life and limit of drill pipes. Speller et al., for the first time, took a sample of a D-class drill pipe with an outer diameter of 101.6 mm into a small-sized round rod to study the fatigue life. The research results showed that fatigue cracks of the drill pipe easily occurred at the transverse scratches on the specimen surface, so it was suggested that maintenance should be performed during the use of a drill pipe to avoid surface scratches [5]. Morgan et al. tested the fatigue life of class D and class E drill pipes in air by using the round rod fatigue test method, and the experimental results showed that the fatigue life of the class E drill pipe in air was higher than that of the class D drill pipe [6]. Zamani et al. conducted a comprehensive analysis of drill pipe failure cases in the literature and believed that fatigue crack was the root cause of drill pipe failure. They put forward targeted measures to extend the fatigue life of drill pipes [7]. Luo et al. conducted an experimental study on the fatigue life of G105 and S135 steel drill pipes and proposed an improved S-N data model to reveal the correlation between fatigue life and fatigue limit. The equivalent stress amplitude reflects the influence of the stress ratio and can be used to predict fatigue damage [8]. Zou et al. deduced the equivalent load according to the stress level of the actual work test, carried out a constant-amplitude load test of the drill pipe on the bench, and obtained the fatigue life of the drill pipe under the constant-amplitude load [9]. Yu et al. studied the fatigue life of a V150 drill pipe in different environments by using experimental and numerical simulation methods, obtained the S-N of the V150 drill pipe in different environments, and analyzed the fracture mechanism [10]. Peng et al. studied the fatigue life of a titanium alloy drill pipe and an S135 drill pipe through fatigue experiments, established a quantitative evaluation model of drill pipe fatigue damage, and analyzed the mechanism difference in corrosion fatigue between titanium and steel drill pipes [11]. Zeng et al. studied the fatigue behavior of a small-sized S135 drill pipe sample according to the notch, temperature, and cyclic alternating load, and found that the notch, pre-corrosion, and temperature coupling factors had the most significant impact on the fatigue life of the drill pipe. Among the single factors, the notch had the greatest impact on fatigue. This was followed by pre-corrosion and temperature [12]. Some scholars have also studied the low-cycle-fatigue properties, corrosion, and passivation behaviors of other metal alloys, which can provide a reference for fatigue life research on drill pipe materials [13,14,15]. Although a large number of scholars have conducted a lot of research on the fatigue life of drill pipes, the existing research focuses on the factors of a single type of drill pipe. In fact, short-radius sidetrack drilling in offshore oil fields involves G105, S135, V150, and titanium alloy drill pipes and a downhole multi-environment. It is necessary to carry out a comprehensive study on the fatigue life of the above drill pipes under different working conditions to guide safe and efficient operations in offshore oil fields.
In view of this, this paper studied the fatigue life and limit of G105, S135, V150, and titanium alloy drill pipes in air, high-temperature conditions, drilling fluids, and H2S drilling fluids. Firstly, chemical composition and tensile tests of four kinds of drill pipe materials were carried out. Secondly, the S-N curve model suitable for the drill pipe material was optimized. Finally, fatigue tests of four kinds of drill pipe under different stress levels and different environments were carried out, and the S-N curve equations and fatigue limits of different types of drill pipe under different environments were obtained, providing important data support for the selection of drill pipes in oil and gas fields.

2. Materials and Properties

2.1. Chemical Components

The chemical composition of G105, S135, V150, and titanium alloy drill pipe samples was determined by a photoelectric direct reading spectrometer, and the test results are shown in Table 1. It can be seen from Table 1 that the chemical compositions of the four drill pipe materials all meet the standard requirements of API Spec5D, and all drill pipe materials have a P element weight percentage of less than 0.03%. For titanium alloy drill pipe material, the Al element of its composition is an α-phase-stable element, which can expand the α-phase region, promote the β-phase transition, and provide conditions for two-phase regulation. The Mo element is an isomorphic β-stable element that can regulate the β-phase stability, improve the stress corrosion resistance and heat resistance of alloy, inhibit the eutectoid reaction of alloying element Fe, reduce the tendency of hydrogen embrittlement of titanium alloy, and provide conditions for heat treatment strengthening [16].

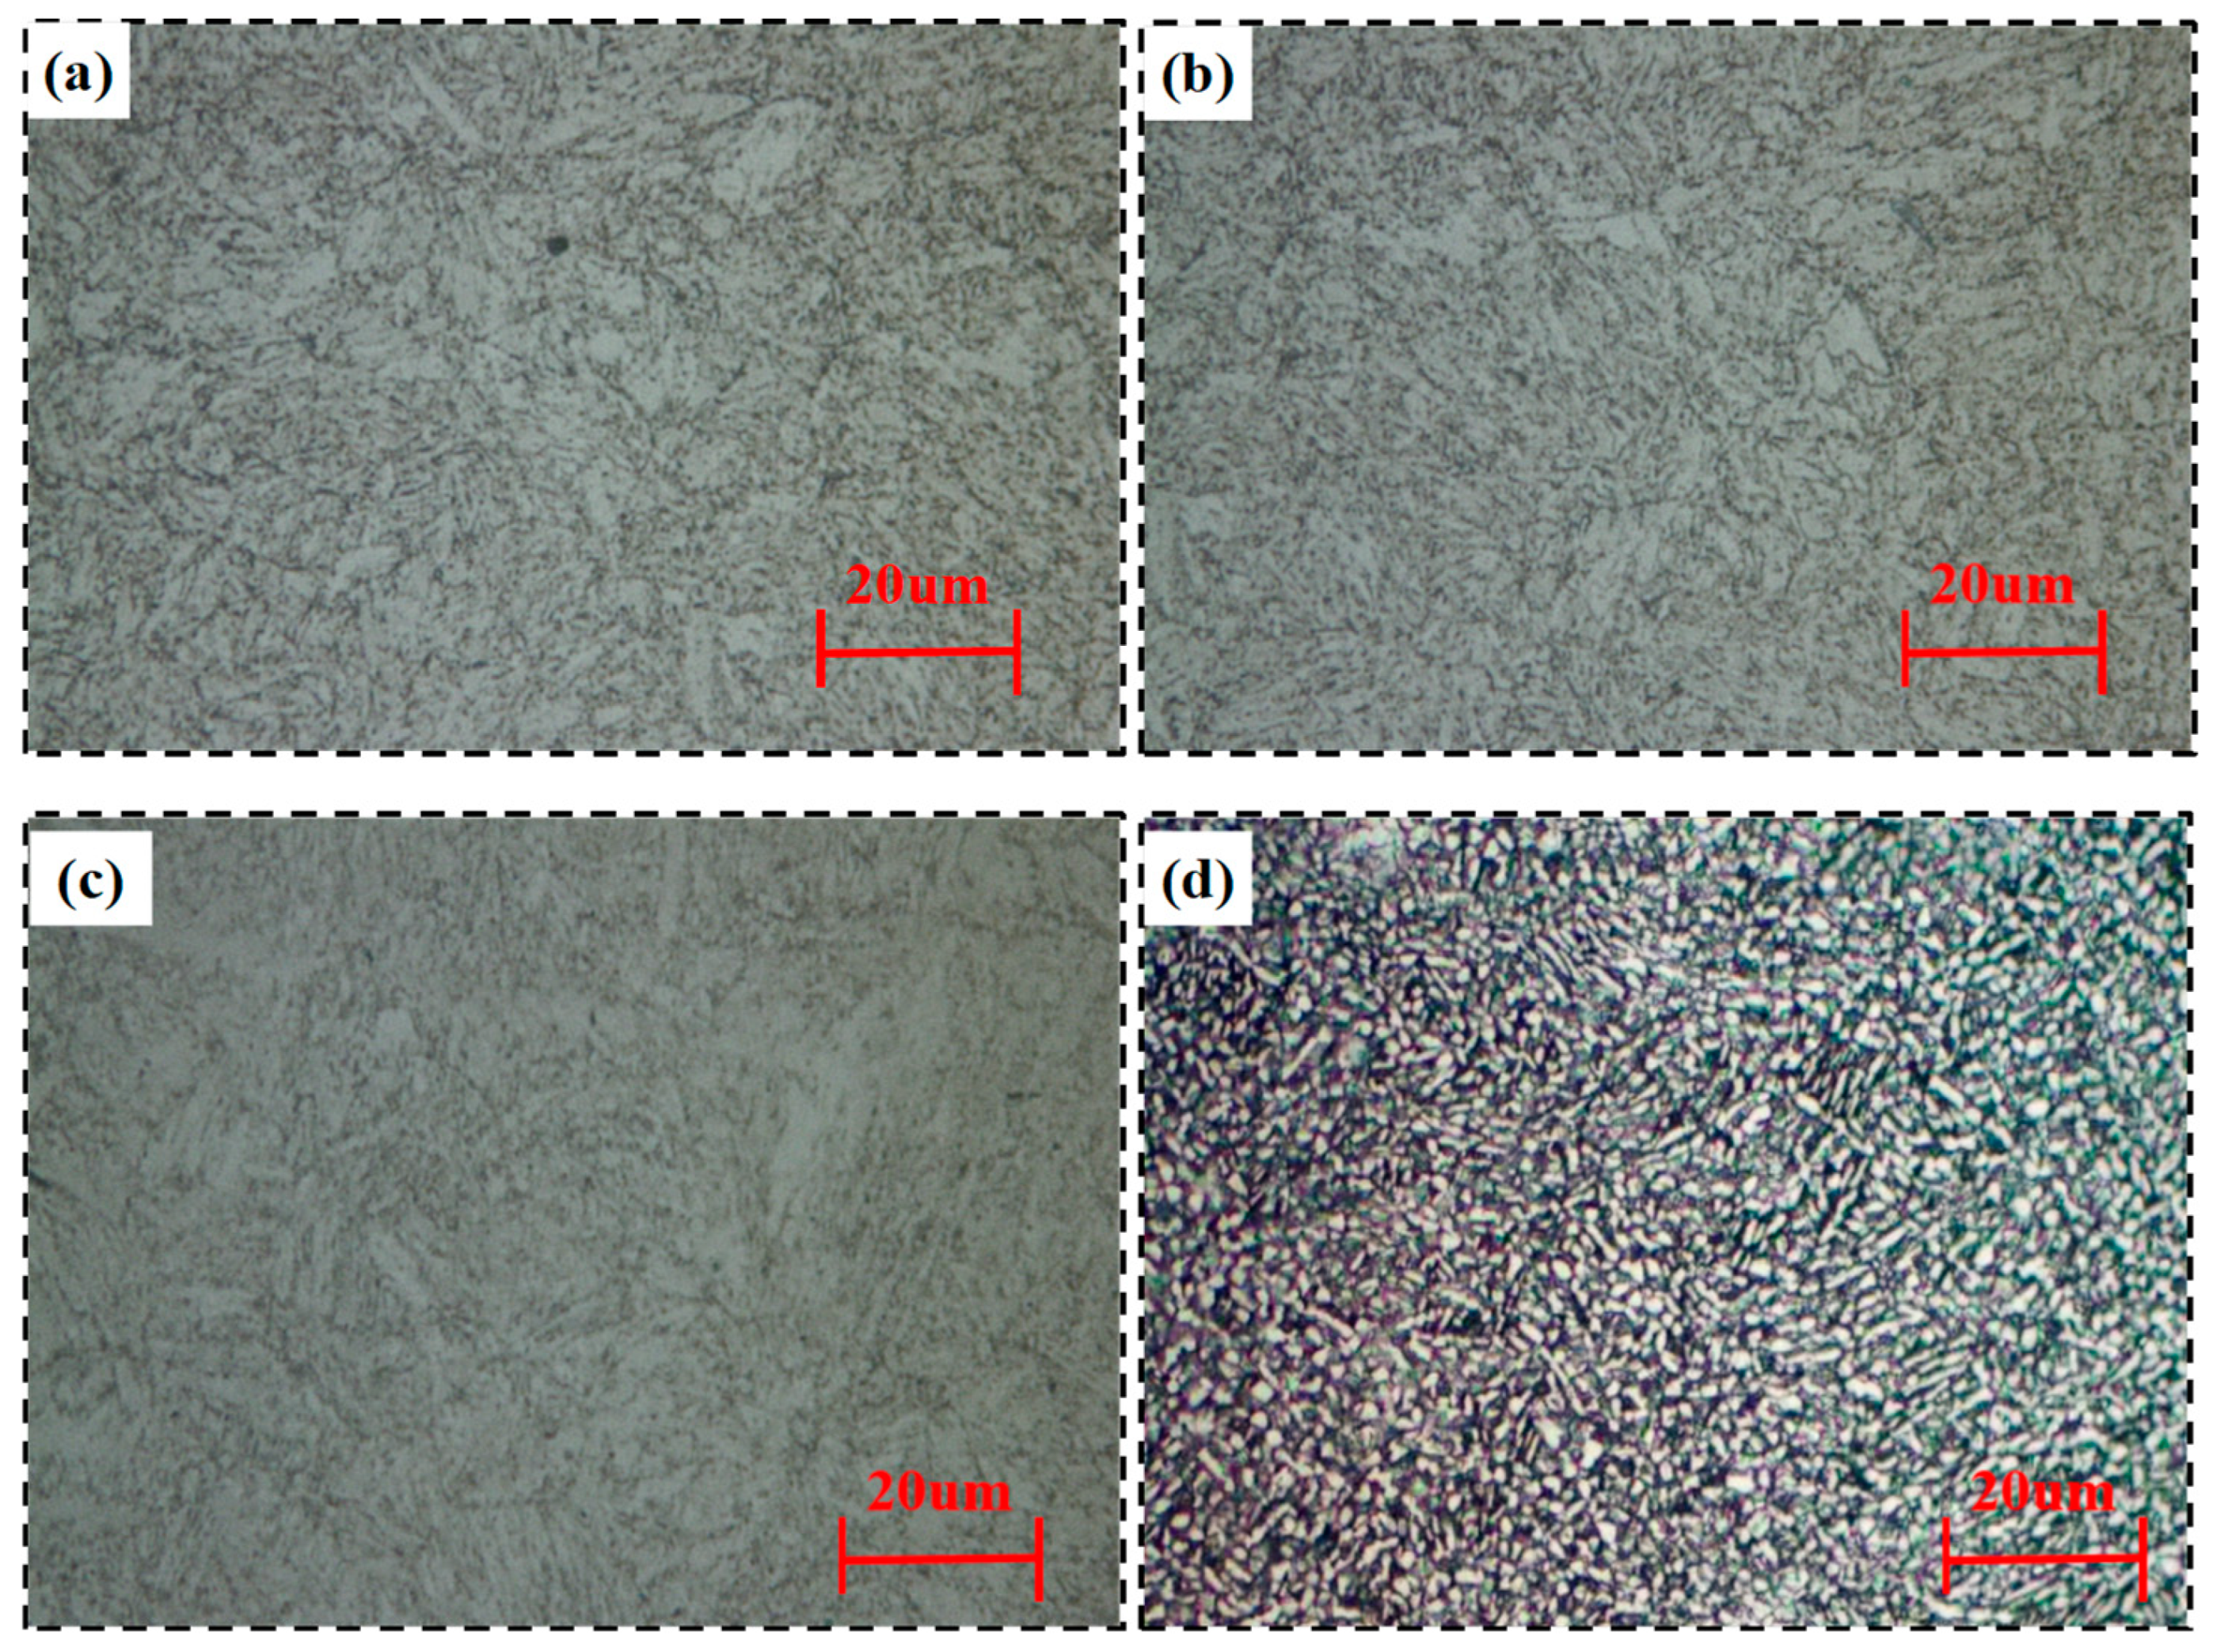
2.2. Microstructure Test

The metallographic structure of four drill pipe samples was analyzed using a ZEISS HAL-100 metallographic microscope, and the results are shown in Figure 1. The metallographic structure of the G105 and S135 samples was tempered sorbite composed of a small amount of isometric and slender ferrite, while the V150 sample was tempered sorbite with interlayer ferrite and cementite. The metallographic structure of the titanium alloy drill pipe sample is a strip (α + β) Ti structure, which has the advantages of both α- and β-titanium alloys, high strength at room temperature, and good thermal stability, and can be strengthened by heat treatment [17]. Considering the difference in metallographic structure among different drill pipe types, the mechanical properties and fatigue properties of these drill pipe types may be different.

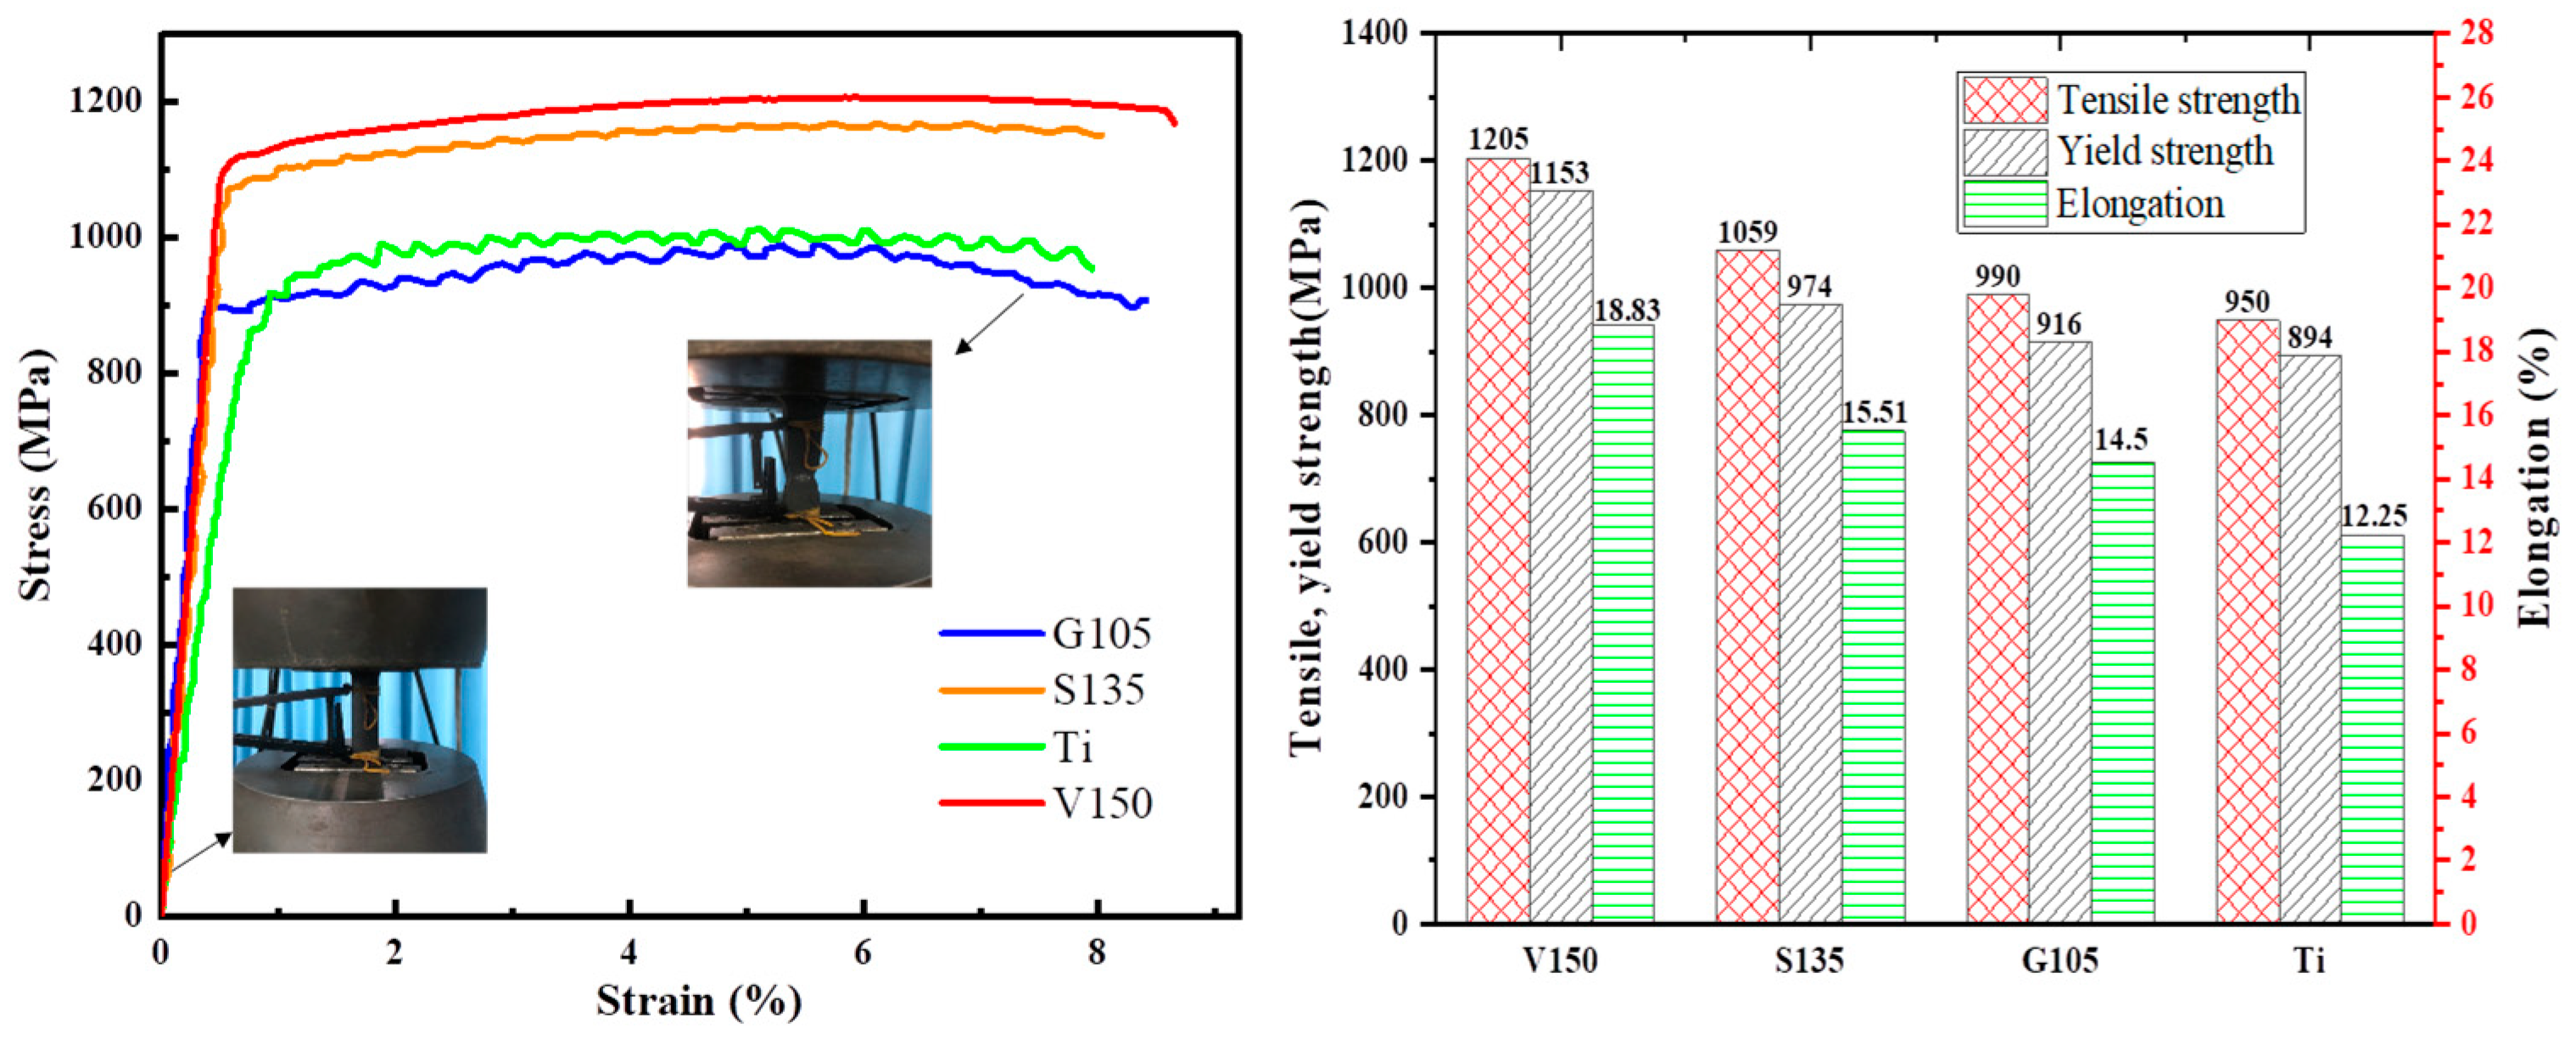
2.3. Tensile Property Test

For drill pipes, yield, tensile strength, and elongation are three extremely important indexes, and they are important references for drilling engineering design. Therefore, according to the national standard GB/T 228.1-2010 “Metal materials—Tensile test—Part 1: room temperature test method” [18], a tensile test of 4 kinds of drill pipe materials was carried out on the MTS810 test machine. To ensure the accuracy of the tensile test results, three parallel samples were measured in each group, and the average value was then taken. The tensile test results are shown in Figure 2.
It can be seen from Figure 2 that the tensile strength of the four kinds of drill pipe is as follows: V150 (1205 MPa) > S135 (1059 MPa) > G105 (990 MPa) > Ti (950 MPa). These tensile test results will provide the necessary basic data support for follow-up research of drill pipe fatigue life.

3. Fatigue Test and S-N Curve Model

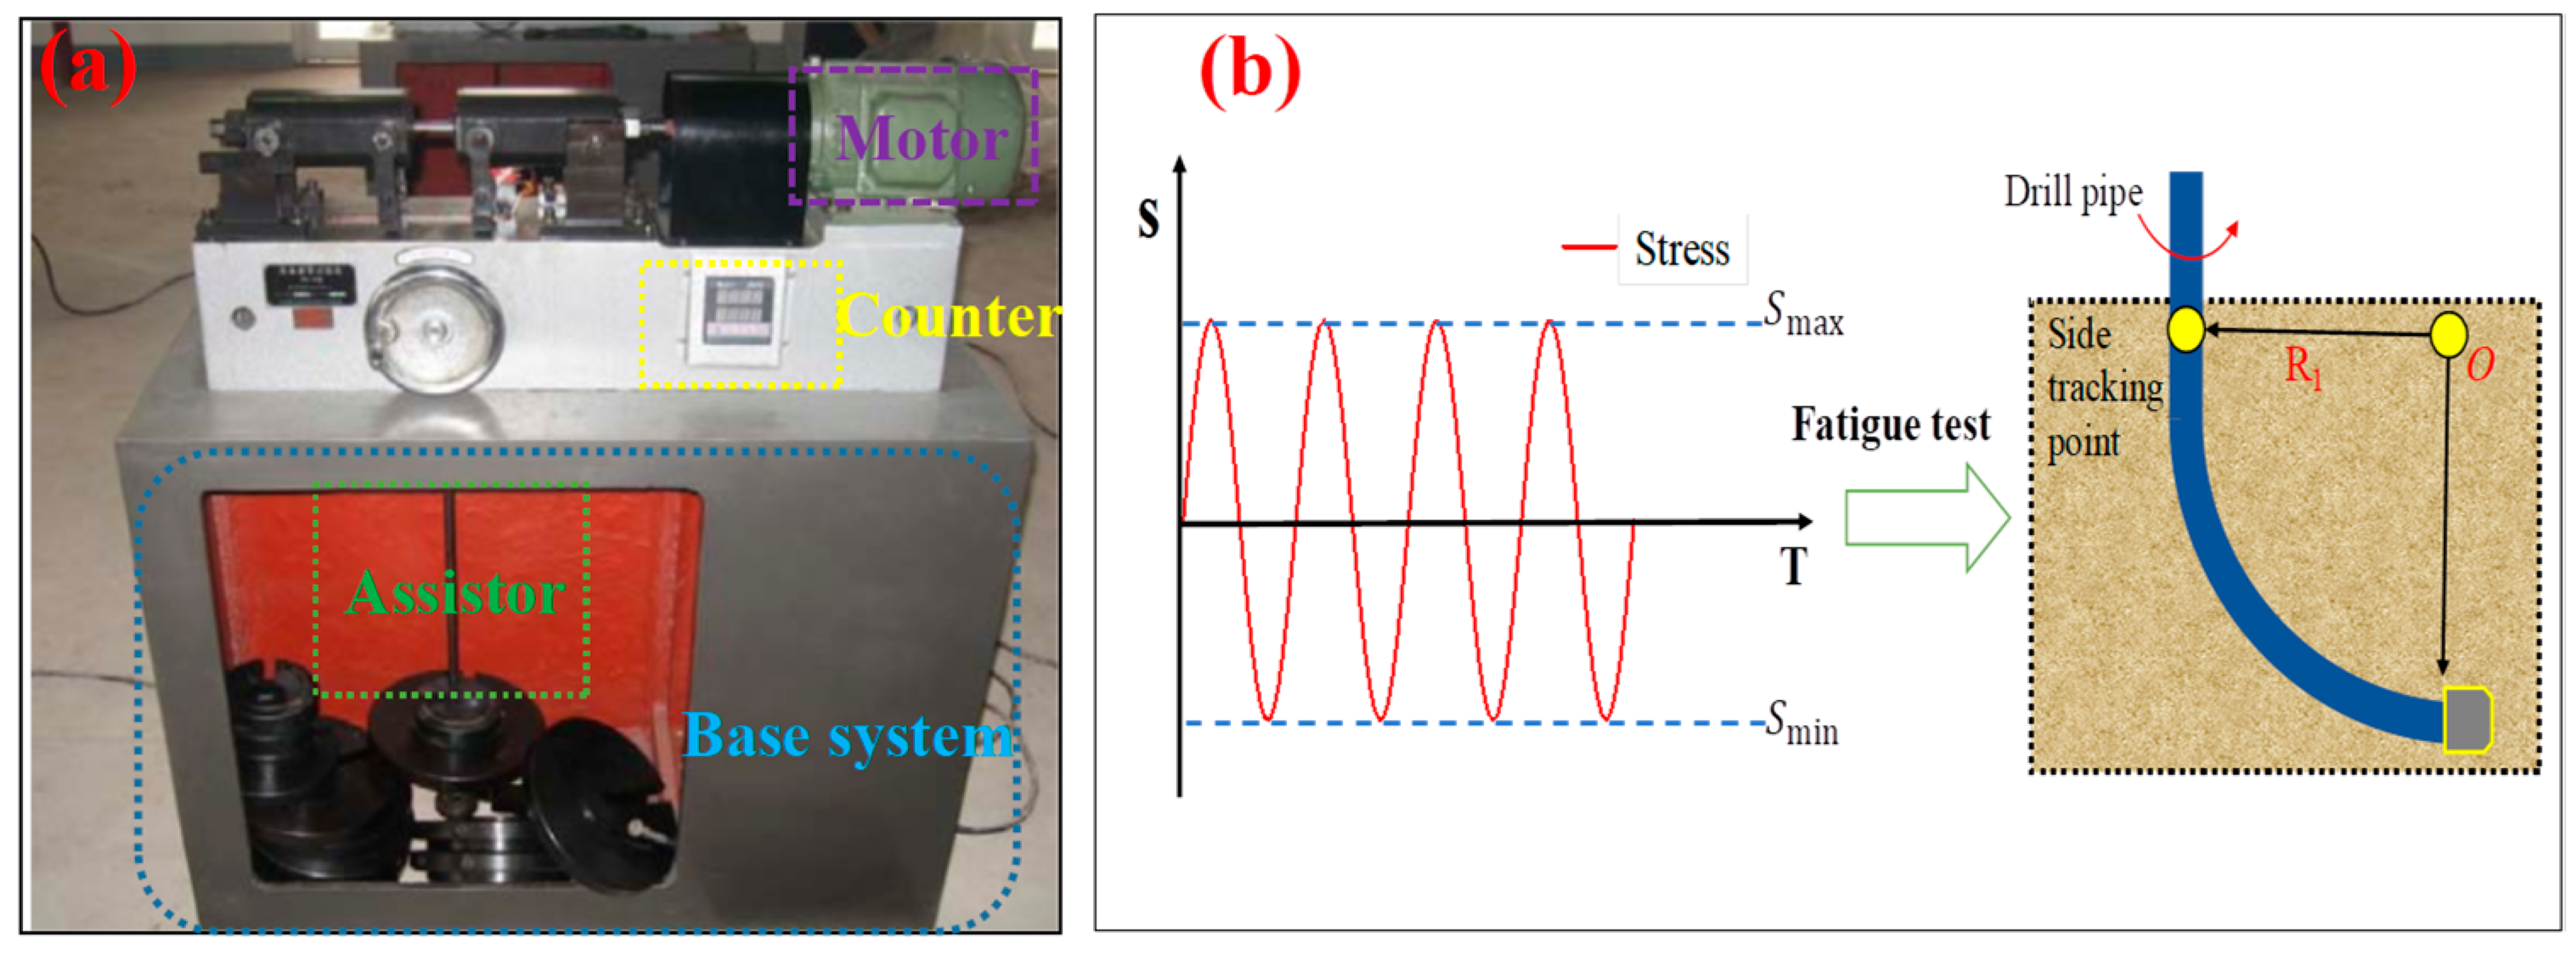
3.1. Fatigue Specimen

The offshore short-radius sidetracking process usually requires a high fatigue life of the drill pipe to prevent failure due to fatigue fracture. The fatigue performance of a drill pipe is an essential index of the drilling process. To study the fatigue properties of G105, S135, V150, and titanium alloy drill pipes, a drill pipe fatigue sample was taken from the pipe body in the axial direction. The sample was a smooth cylindrical shape, and the middle part was funnel-shaped. The sampling method and shape size are displayed in Figure 3.
Figure 4 shows the PQ-6 rotary bending fatigue test machine. To simulate the real downhole environment of short-radius sidetracking as much as possible, we further improved the rotary testing machine and added a thermal radiation device and mud storage to simulate the rotary bending fatigue test under different temperatures and with H2S mud. During the operation of the drill pipe, due to the continuous rotation of the drill pipe, its surface will bear the action of cyclic alternating stress. To simulate the cyclic and alternating load of the drill pipe during short-radius sidetracking, a constant-amplitude load is applied to the sample through the rotation of the electric motor and the weight load in the actual fatigue test.

3.2. Fatigue Test Condition

The fatigue test of drill pipe samples was carried out according to the standard GB/T 4337-2015 “Rotating Bending Method for Fatigue test of Metal Materials” [19]. The fatigue test was carried out by a group method, usually using 4 to 5 stress levels. Three parallel samples were measured at each stress level, and the test data were then processed. Under normal circumstances, the maximum bending stress of the fatigue test is about 60% of the yield strength, and the metal fatigue strength is then determined according to the paired lift method. According to the tensile test results and the operating guide of the PQ-6 testing machine, a total of five stress levels of 210, 315, 420, 525, and 630 MPa are taken for the fatigue test. During the test under H2S mud, H2S gas should be fully dissolved in the mud. According to the actual bottom hole temperature data of Bohai Oilfield, the temperature should be set at 160 °C under a high-temperature environment, and the test frequency is set to 50 Hz (corresponding rotation speed is 3000 r/min). The experiment is divided into a non-corrosive environment (air, high temperature) and corrosive environment (drilling fluid, H2S drilling fluid). The specific test scheme is shown in Table 2.

3.3. S-N Curve Model

Fatigue test data need to be expressed visually in the form of charts, and the S-N curve is usually used to characterize the fatigue performance of materials. The S-N curve takes fatigue strength (stress) S as the longitudinal coordinate and fatigue life N as the horizontal coordinate, representing the relationship between the fatigue strength and fatigue life of standard specimens under certain cyclic characteristics. Also known as the stress–life curve [20], the S-N curve is of great significance to guide the actual use of drill pipes and for fatigue life prediction. For ferrous steel materials, the maximum stress of non-fatigue fracture under 107 cycles is usually specified as the fatigue limit.

3.4. S-N Model Optimization
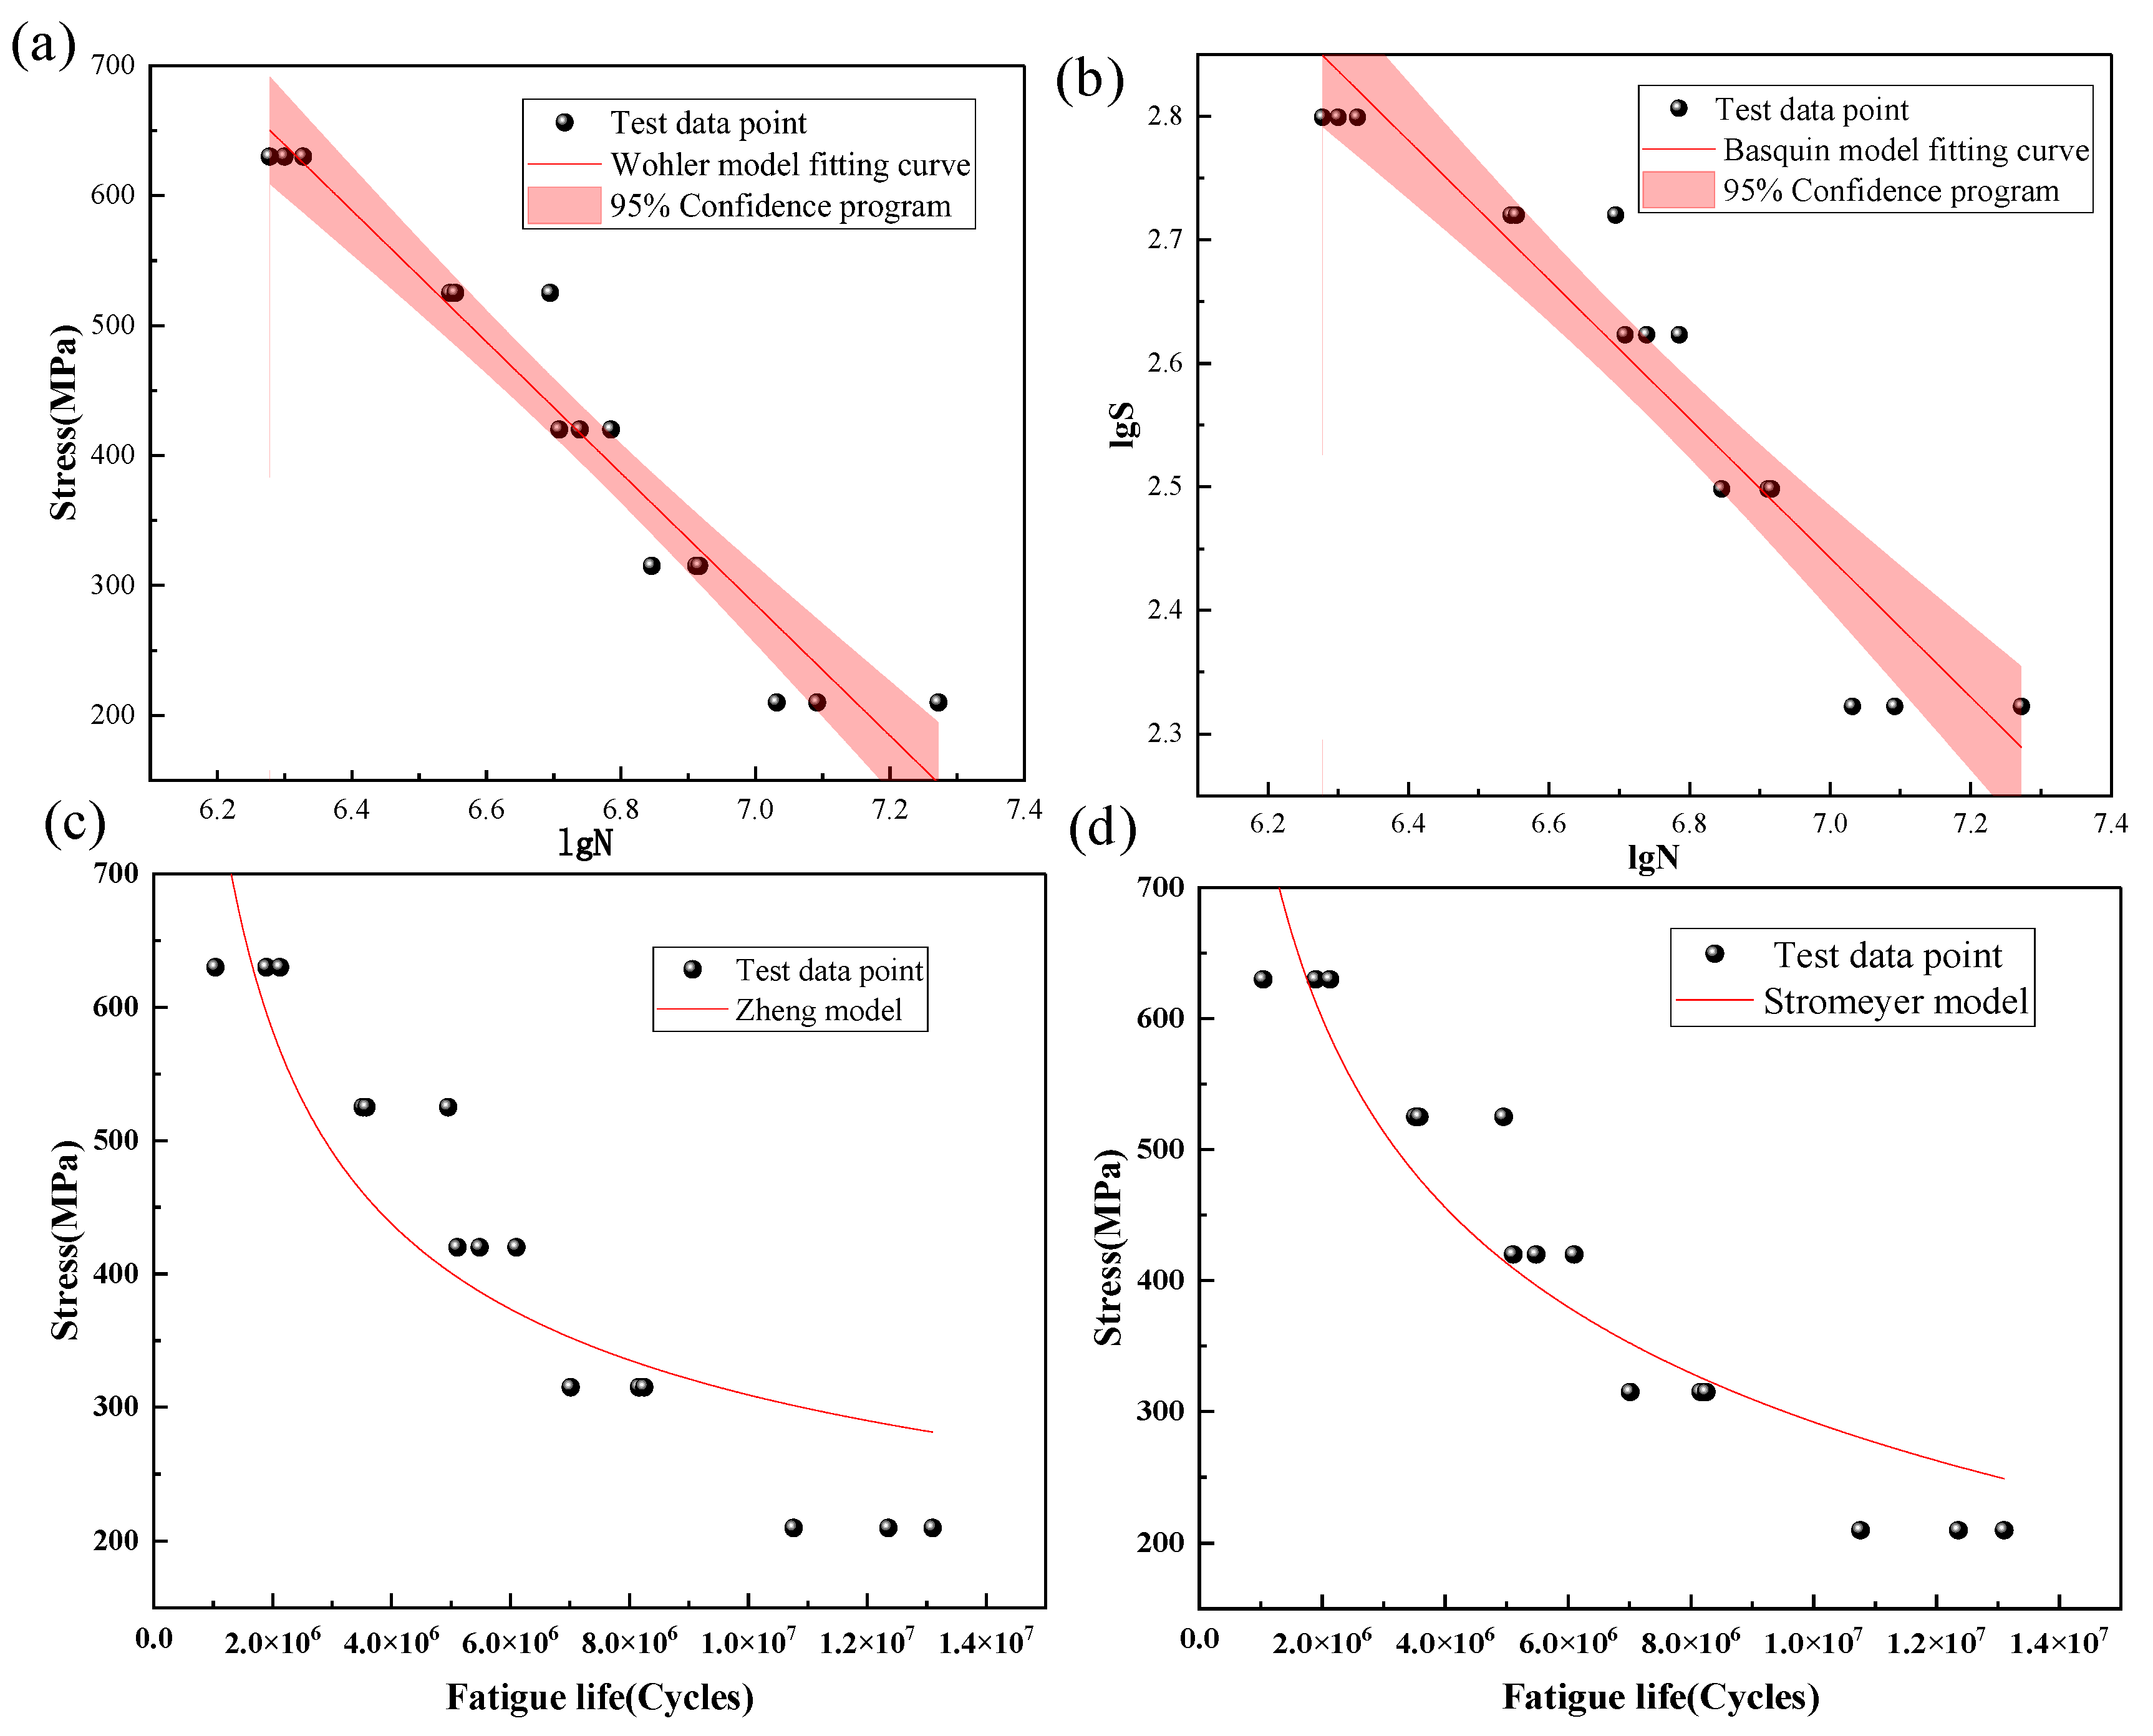
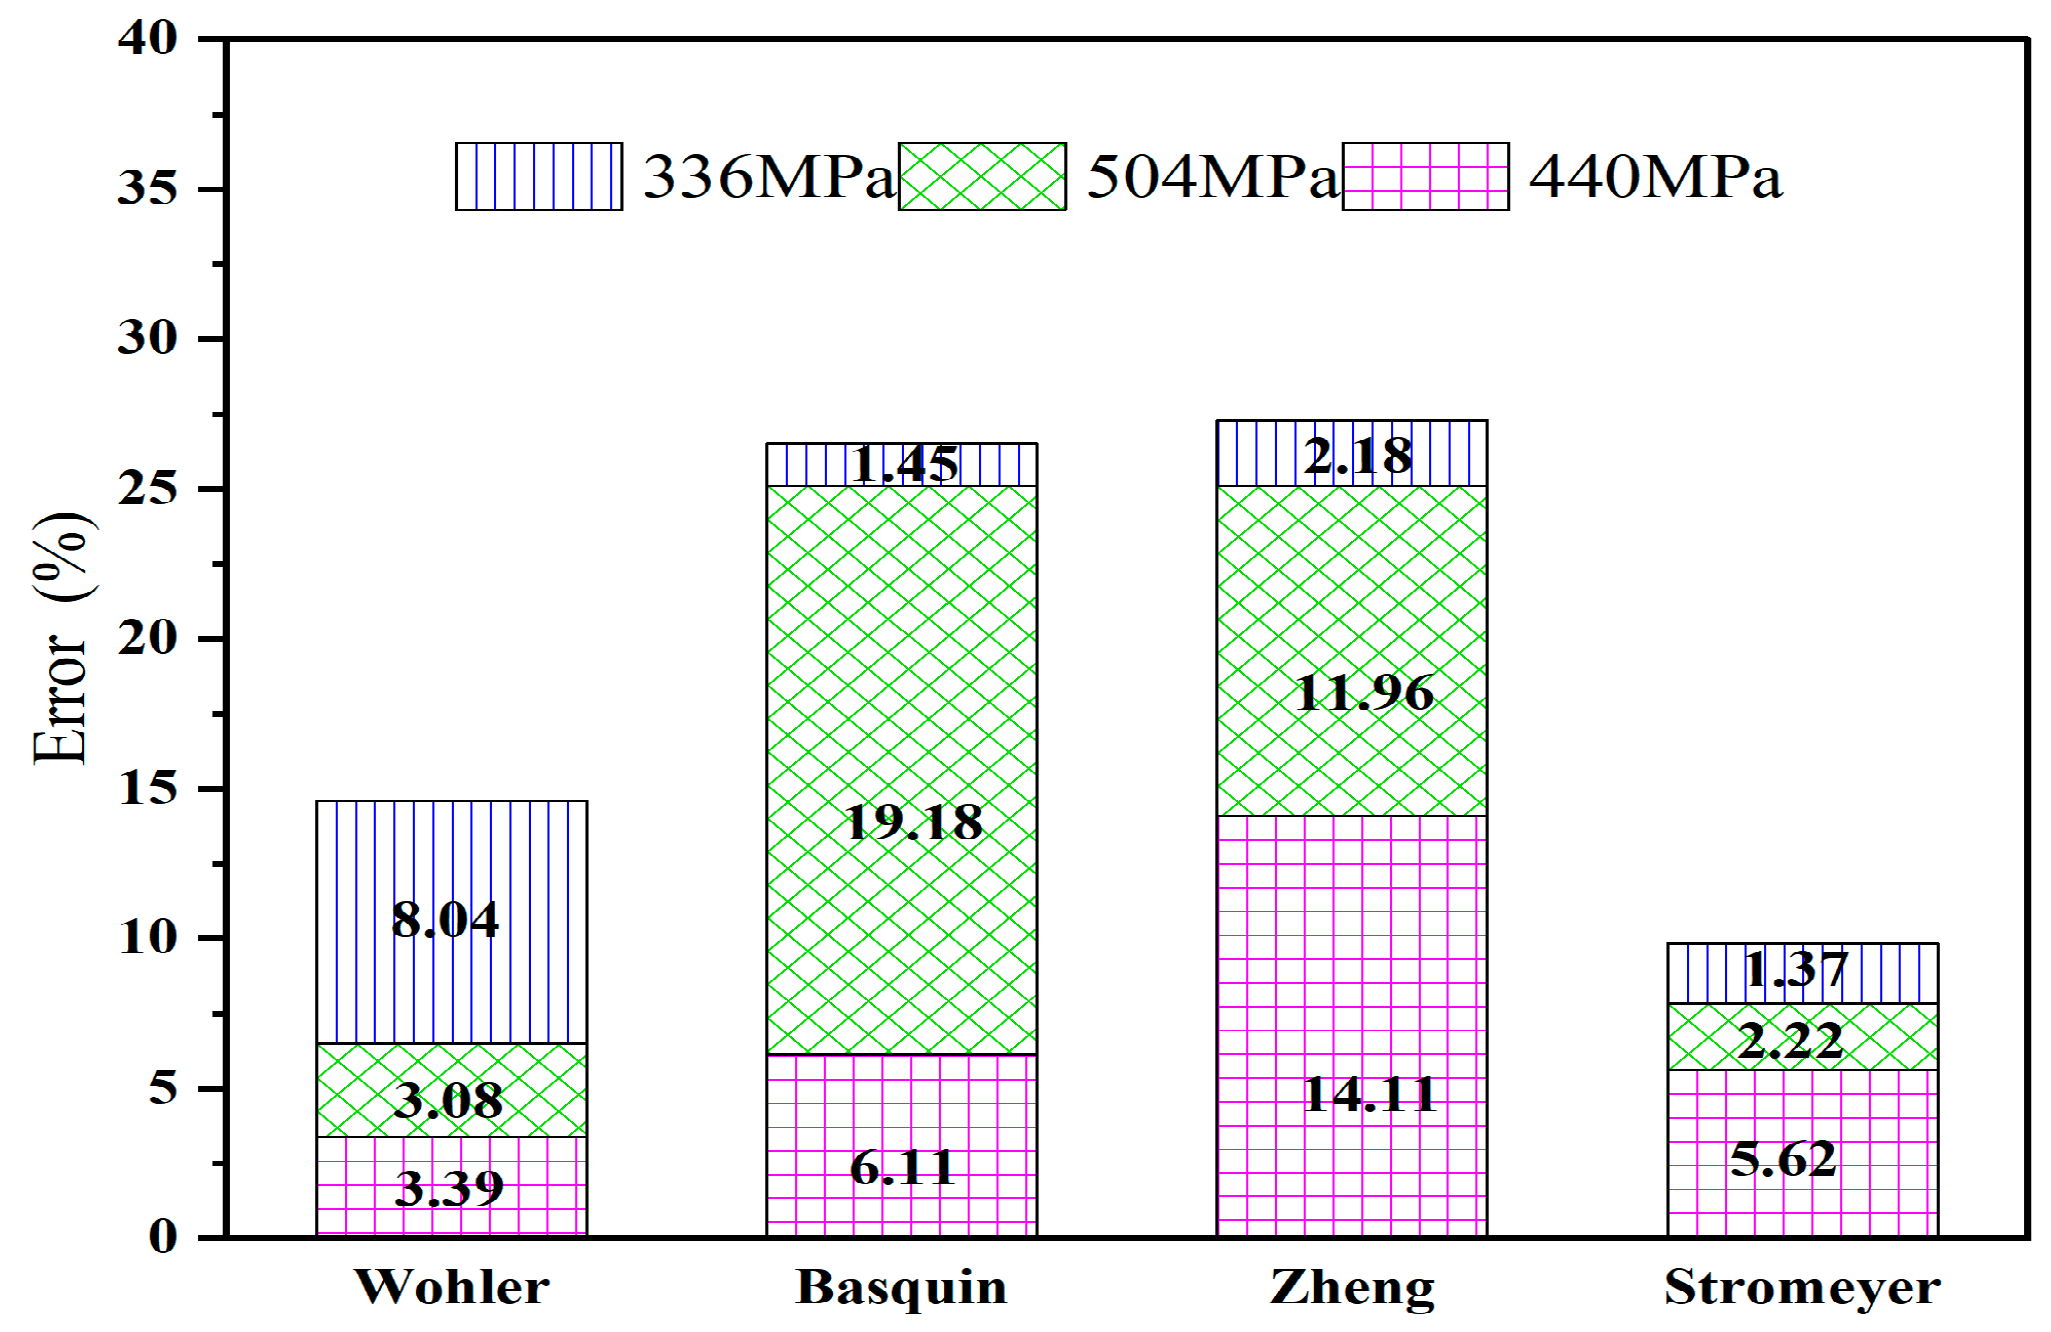
Up to now, there are many S-N curve models commonly used in the literature, which include the Wohler, Basquin, Zheng, and Stromeyer models. Each S-N curve model has a different fitting degree and characterization ability for fatigue test data. To select the curve model most suitable for drill pipe materials, four common S-N models were fitted for the same set of experiments, and the fitting effect of the different models on the fatigue life of drill pipe materials was evaluated. R-square was used to evaluate the fitting effect, and the value was between 0 and 1. The closer the value was to 1, the more accurate the model and the more accurate the fitting effect. The fatigue life of the G105 drill pipe in air was taken as an example to evaluate the fitting effect of the curve models.
To facilitate calculations and statistics, a fatigue life model is generally linearized first; the specific expression of the Wohler model is [21]
e m S N = c
where m and c are parameters related to the material and stress ratio. The logarithm of both sides of Formula (1) can be obtained as follows:
S = a + b log N
In Formula (2), a = log c m log e , b = 1 m log e .
The Wohler model presents a linear relationship in the coordinate axis with lg N as the horizontal coordinate and stress S as the vertical coordinate.
The specific expression of the Basquin model is [22]
S m N = c
Logarithms of both sides of the Basquin model formula are obtained as follows:
log S = a + b log N
In Formula (4), a = log c m , b = 1 m .
The Basquin model is linear in the axes lg N-lg S, and the Stromeyer model is expressed as follows [23]:
N = C f S S a c β
The expression of the Zheng model is as follows [24]:
N f = C f S a S a c 2
where Cf, Sac, and β were determined by experiments and based on material properties.
There is an (Sa − Sac) term in the Stromeyer and Zheng models, which is difficult to deal with after the logarithm is taken, and linear processing is not carried out. A comparison of the fitting effects after fitting the experimental data according to different S-N models is demonstrated in Figure 5.
It can be seen from Figure 5 that the fitting effects of different S-N models are different, and the following conclusions can be drawn according to the fitting result:
(1)
The Wohler model has the best fitting degree for the fatigue data of the G105 drill pipe material, and its R square is 0.94. This model indicates that there is a linear relationship between S and lg N. However, the Wohler model cannot describe the fact that there is a horizontal progressive line in the S-N curve, and mainly describes the relationship between fatigue life and stress within a certain range. The variation trend of fatigue life with stress cannot be directly reflected.
(2)
After fitting, the R-square value of the Basquin model is 0.90, and its fitting method is simple, with a good effect. This model indicates that there is a linear relationship between lg S and lg N, making it the most commonly used S-N curve model in various literature studies. However, similar to the Wohler model, the Basquin model cannot account for the presence of a horizontal asymptotic line in the S-N curve.
(3)
The fitting effect of the Zheng model is generally good, with an R-squared value of 0.77. The Zheng model is actually a special form of the Stromeyer model. It can represent the presence of a fatigue limit and indicates the existence of a horizontal asymptote in the S-N curve. This means that as the test stress Sa approaches the fatigue limit Sac infinitely, the fatigue life N tends to infinity. However, the application of this model is limited, and it does not fit well with the drill pipe fatigue test data.
(4)
The Stromeyer model has a fitted R-square of 0.88, indicating a good fit. This model effectively depicts the relationship between fatigue life and stress level, showing the trend of fatigue life as stress changes. Overall, the model’s effectiveness is satisfactory.
Table 3 shows the fitting formulae of the different models. It can be seen from Table 3 that the fatigue limits of the G105 drill pipe in air obtained by different models are different, and their order is as follows: Zheng model (309.30 MPa) > Basquin model (294.44 MPa) >Stromeyer model (287.86 MPa) > Wohler model (263.47 MPa). The fatigue limit of metal materials such as drill pipes is difficult to obtain from limited tests. However, from the trend of the experimental data, the fatigue limit obtained by the Wohler model and the Stromeyer model is most consistent with the test trend, while the fatigue limit obtained by the Zheng model and the Basquin model is larger.
To further optimize the prediction ability of the fitted curve, the prediction comprehensive deviation φ of the S-N model is derived, which is defined as
φ = N s N y N s × 100 %
where Ns is the fatigue life under a certain stress level S, and Ny is the fatigue life under a certain stress predicted by the S-N curve model. Based on the original test, fatigue tests were conducted on drill pipe G105 at stress levels of 336, 440, and 504 MPa, and the corresponding average fatigue life values were obtained. By inputting the stress levels into the fatigue life model in Table 3, fatigue life values predicted by different S-N curve models can be obtained. The comprehensive deviation can be seen in Figure 6. Among the four commonly used S-N models, the Stromeyer model shows good prediction accuracy for the fatigue life of drill pipe materials, with a prediction error of less than 5.62%, which is the closest to the measured value. Therefore, the Stromeyer model is chosen for fitting analysis of the fatigue test results.

4. Results and Discussion

4.1. Results

All raw data for fatigue tests under different conditions can be found in the Supplementary Materials in this paper.

4.1.1. In Air

The fatigue test results and fitted S-N curve in air at room temperature are shown in Figure 7. It can be seen from Figure 7 that the fatigue life of drill pipe material decreases significantly with the increase of stress in air, and the stress is inversely related to fatigue life. Therefore, stress is the main factor leading to fatigue failure of a drill pipe during drilling. When the stress level is constant, the fatigue life of different drill pipes in air is as follows: V150 > S135 > Ti110 > G105. That is, the higher the steel grade of the drill pipe, the longer the fatigue life in air.

4.1.2. In High-Temperature Conditions

The fatigue test results and fitted S-N curve of different drill pipe types under a high-temperature air environment are presented in Figure 8. It can be seen from Figure 8 that the fatigue life of each drill pipe at 160 °C is slightly lower than that in air at room temperature, and the overall decline is not large. Hence, the underground temperature has little influence on the fatigue life of the drill pipe. It is worth noting that the increase in temperature may slightly reduce the strength of the material. However, the underground temperature of offshore oil field generally does not exceed 200 °C, which has no obvious influence on the fatigue life of drill pipes in the underground setting.

4.1.3. In Drilling Fluid

The fatigue test results and fitted S-N curve in drilling fluid are shown in Figure 9. In the drilling fluid environment, the fatigue life of steel drill pipes G105, S135, and V150 decreased significantly compared with that in air at room temperature, while the fatigue life of the titanium alloy drill pipe sample in drilling fluid decreased slightly compared with that in air. It is worth noting that, unlike in air, when the stress level is constant, the order of fatigue life is as follows: Ti110 > V150 > S135 > G105. The titanium alloy drill pipe has better fatigue performance than the traditional steel drill pipe in drilling fluid, which is related to the corrosion resistance of the titanium alloy drill pipe. It also proves that the influence of drilling fluid on the fatigue life of drill pipe material cannot be ignored and deserves attention.

4.1.4. In H2S Drilling Fluid

The fatigue test results in H2S-containing drilling fluid are shown in Figure 10. It can be seen from Figure 10 that the fatigue life of different types of drill pipe decreases to different degrees compared with that of pure drilling fluid, indicating that different materials have different sensitivity to H2S. In down-hole corrosion systems, the presence of H2S significantly reduces the fatigue life of drill pipe materials. When the stress level is constant, the fatigue life of the drill pipe in H2S drilling fluid is as follows: Ti110 > V150 > S135 > G105.

4.2. Fatigue Factor Sensitivity Analysis

Drill pipes are faced with a variety of environmental media during the sidetracking of offshore oil and gas wells, and different drill pipe materials have different sensitivity to the same environmental media. To verify the sensitivity of different drill pipe materials to environmental media, a fatigue sensitivity coefficient I was defined:
I = S i S f S i × 100 %
where Si is the fatigue limit of the drill pipe under the initial conditions (defined in this paper as air) in MPa; and Sf is the fatigue limit after introducing a certain test medium (temperature, drilling fluid, etc.) in MPa. The greater the sensitivity coefficient, the greater the sensitivity of the material to the medium. Fatigue limits of drill pipes under different environments can be obtained according to S-N curves under different environments. It can be seen from Figure 11 that there are obvious differences in the fatigue limits of different drill pipe materials under different environments.
The fatigue limit value obtained is substituted into Formula (8) to obtain the sensitivity of different drill pipe materials to different environments. As can be seen in Figure 12, the order of sensitivity of different drill pipes to temperature is as follows: Ti110 (4.65%) > G105 (4.21%) > V150 (3%) > S135 (1.58%). The sensitivity of the drilling fluid is as follows: S135 (34.2%) > V150 (33.04%) > G105 (19.76%) > Ti110 (4.55%). The sensitivity to H2S drilling fluid is as follows: V150 (40.13%) > S135 (37.51%) > G105 (29.62%) > Ti110 (15.04%).
From the fatigue sensitivity analysis, it is evident that the fatigue limit of drill pipes does not increase with higher steel grades but is closely related to the environmental medium. In air, drill pipes of different steel grades have an infinite fatigue life, with the fatigue life being positively correlated with the steel grade. It is important to note that the fatigue life of high-steel-grade drill pipes decreases significantly under drilling fluid and H2S media. Furthermore, when corrosion and fatigue occur simultaneously, the combined effect has a much greater impact on the corrosion fatigue life of drill pipes compared with a single factor.

4.3. Fatigue Failure Mechanism

Oxygen corrosion is the primary type of corrosion that leads to the corrosion fatigue failure of drill pipes during short-radius side drilling at sea. When drilling, the circulating system of drilling fluid is not completely sealed. This allows oxygen from the atmosphere and surface water to mix into the drilling fluid through the circulation system, such as the mud pool, and become free oxygen. Some of the oxygen will also dissolve in the drilling fluid. When the oxygen content in the drilling fluid reaches a certain level, it causes oxygen corrosion in the drill pipe. Oxygen can exacerbate corrosion via two main routes: by promoting oxygen depolarization, and by causing serious electrochemical reactions when O2 from the atmosphere and wellbore dissolves in the drilling fluid, leading to anode reactions [25,26,27]:
F e F e 2 + + 2 e
F e 2 + + 2 H 2 O F e O H 2 + 2 H +
4 F e O H 2 + O 2 + 2 H 2 O 4 F e O H 3
The cathode reaction is
O 2 + 4 H + + 4 e 2 H 2 O
In addition to O2, there is also a large amount of CO2 in the wellbore and formation, and CO2 will lead to the occurrence of carbon dioxide corrosion. The reaction equation is
F e + C O 2 + H 2 O F e + H 2 C O 3 F e C O 3 + H 2
Finally, H2S gas also exists in some harsh offshore side drilling, and H2S corrosion mainly occurs with electrochemical corrosion and hydrogen-induced cracking. After H2S is dissolved in water, a secondary hydrolysis reaction will occur, causing electrochemical corrosion of the pipe and resulting in pitting of the surface of the drill pipe or wall thickness reduction. Its cathode reaction is
H 2 S H + + H S
H S S 2 + H +
As shown in Figure 13a, the XRD (X-ray Diffraction) test results at the fracture of four drill pipe materials show that the corrosion products of fatigue fracture of steel drill pipe materials such as G105, S135, and V150 are mainly Fe2O3, FeS, and FeCO3, among which Fe2O3 and FeCO3 are the main components of the corrosion product film. This film is essential for the corrosion fatigue resistance of steel drill pipes. On the other hand, there are basically no corrosion products with the fracture of titanium alloy drill pipe material, and the products are mainly α- and β-Ti. It is worth noting that when the mechanical load environment is consistent, fatigue corrosion is closely related to the failure mechanism of the passivation film on the surface of the material. As shown in Figure 13b, compared with a titanium alloy drill pipe, the corrosion product film FeCO3 is more likely to be destroyed. The corrosion product film of a steel drill pipe can be destroyed in two main ways. One way is that, under the action of high-velocity drilling fluid, the corrosion product film is washed off or peeled off from the metal surface of the substrate; the other way is to dissolve the corrosion product film under the action of carbonic acid, and the reaction equation is as follows [20]:
F e C O 3 + H C O 3 F e ( C O 3 ) 2 2 + H +
F e C O 3 + H 2 C O 3 F e ( H C O 3 ) 2
In addition, there are obvious gaps between the FeCO3 crystals of the corrosion product film formed on the surface of the steel drill pipe, which greatly reduces the protective effect of the corrosion product film on the matrix and induces further pitting and local corrosion.
The corrosion mechanism of titanium alloy and steel drill pipes is different in that titanium is a typical passive metal that is easy to react with oxygen to form a passivation film, and the passivation film on the surface of a titanium alloy drill pipe is the main source of corrosion resistance [28]. Many studies have been carried out on the properties of titanium-passivated films, including the structure, thickness, elemental composition, and damage evolution process of oxide films [29,30]. The main component of titanium surface passivation films is TiO2. In most cases, the passivation film can maintain passivation and shows excellent corrosion resistance. Therefore, the possibility of uniform corrosion of a titanium alloy drill pipe in most corrosion environments is very low [31]. It is worth noting that during the actual service of the material, a titanium alloy drill pipe will be subjected to external physical and chemical effects. These complex effects may lead to the falling off, stripping, and destruction of the titanium passivation film, thus exposing the internal matrix of the titanium alloy drill pipe to the external environment again. However, in the down-hole corrosion environment, the damaged part will re-form a new dense passivation film. The bare matrix is covered and protected, which inhibits further corrosion and allows the titanium alloy drill pipe to continue to serve safely, which is the main reason for the high corrosion fatigue life of a titanium alloy drill pipe compared with a steel drill pipe.

5. Conclusions

(1)
The results of the evaluation of the S-N curve model indicate that the Wohler, Basquin, and Stromeyer models can effectively describe the fatigue test results of the drill pipe. The fitting correlation coefficients for all three models are above 0.86. The prediction error of the Stromeyer model is less than 5.62%, which is the closest to the measured value. This model provides a more accurate and intuitive description of the fatigue behavior of drill pipe materials.
(2)
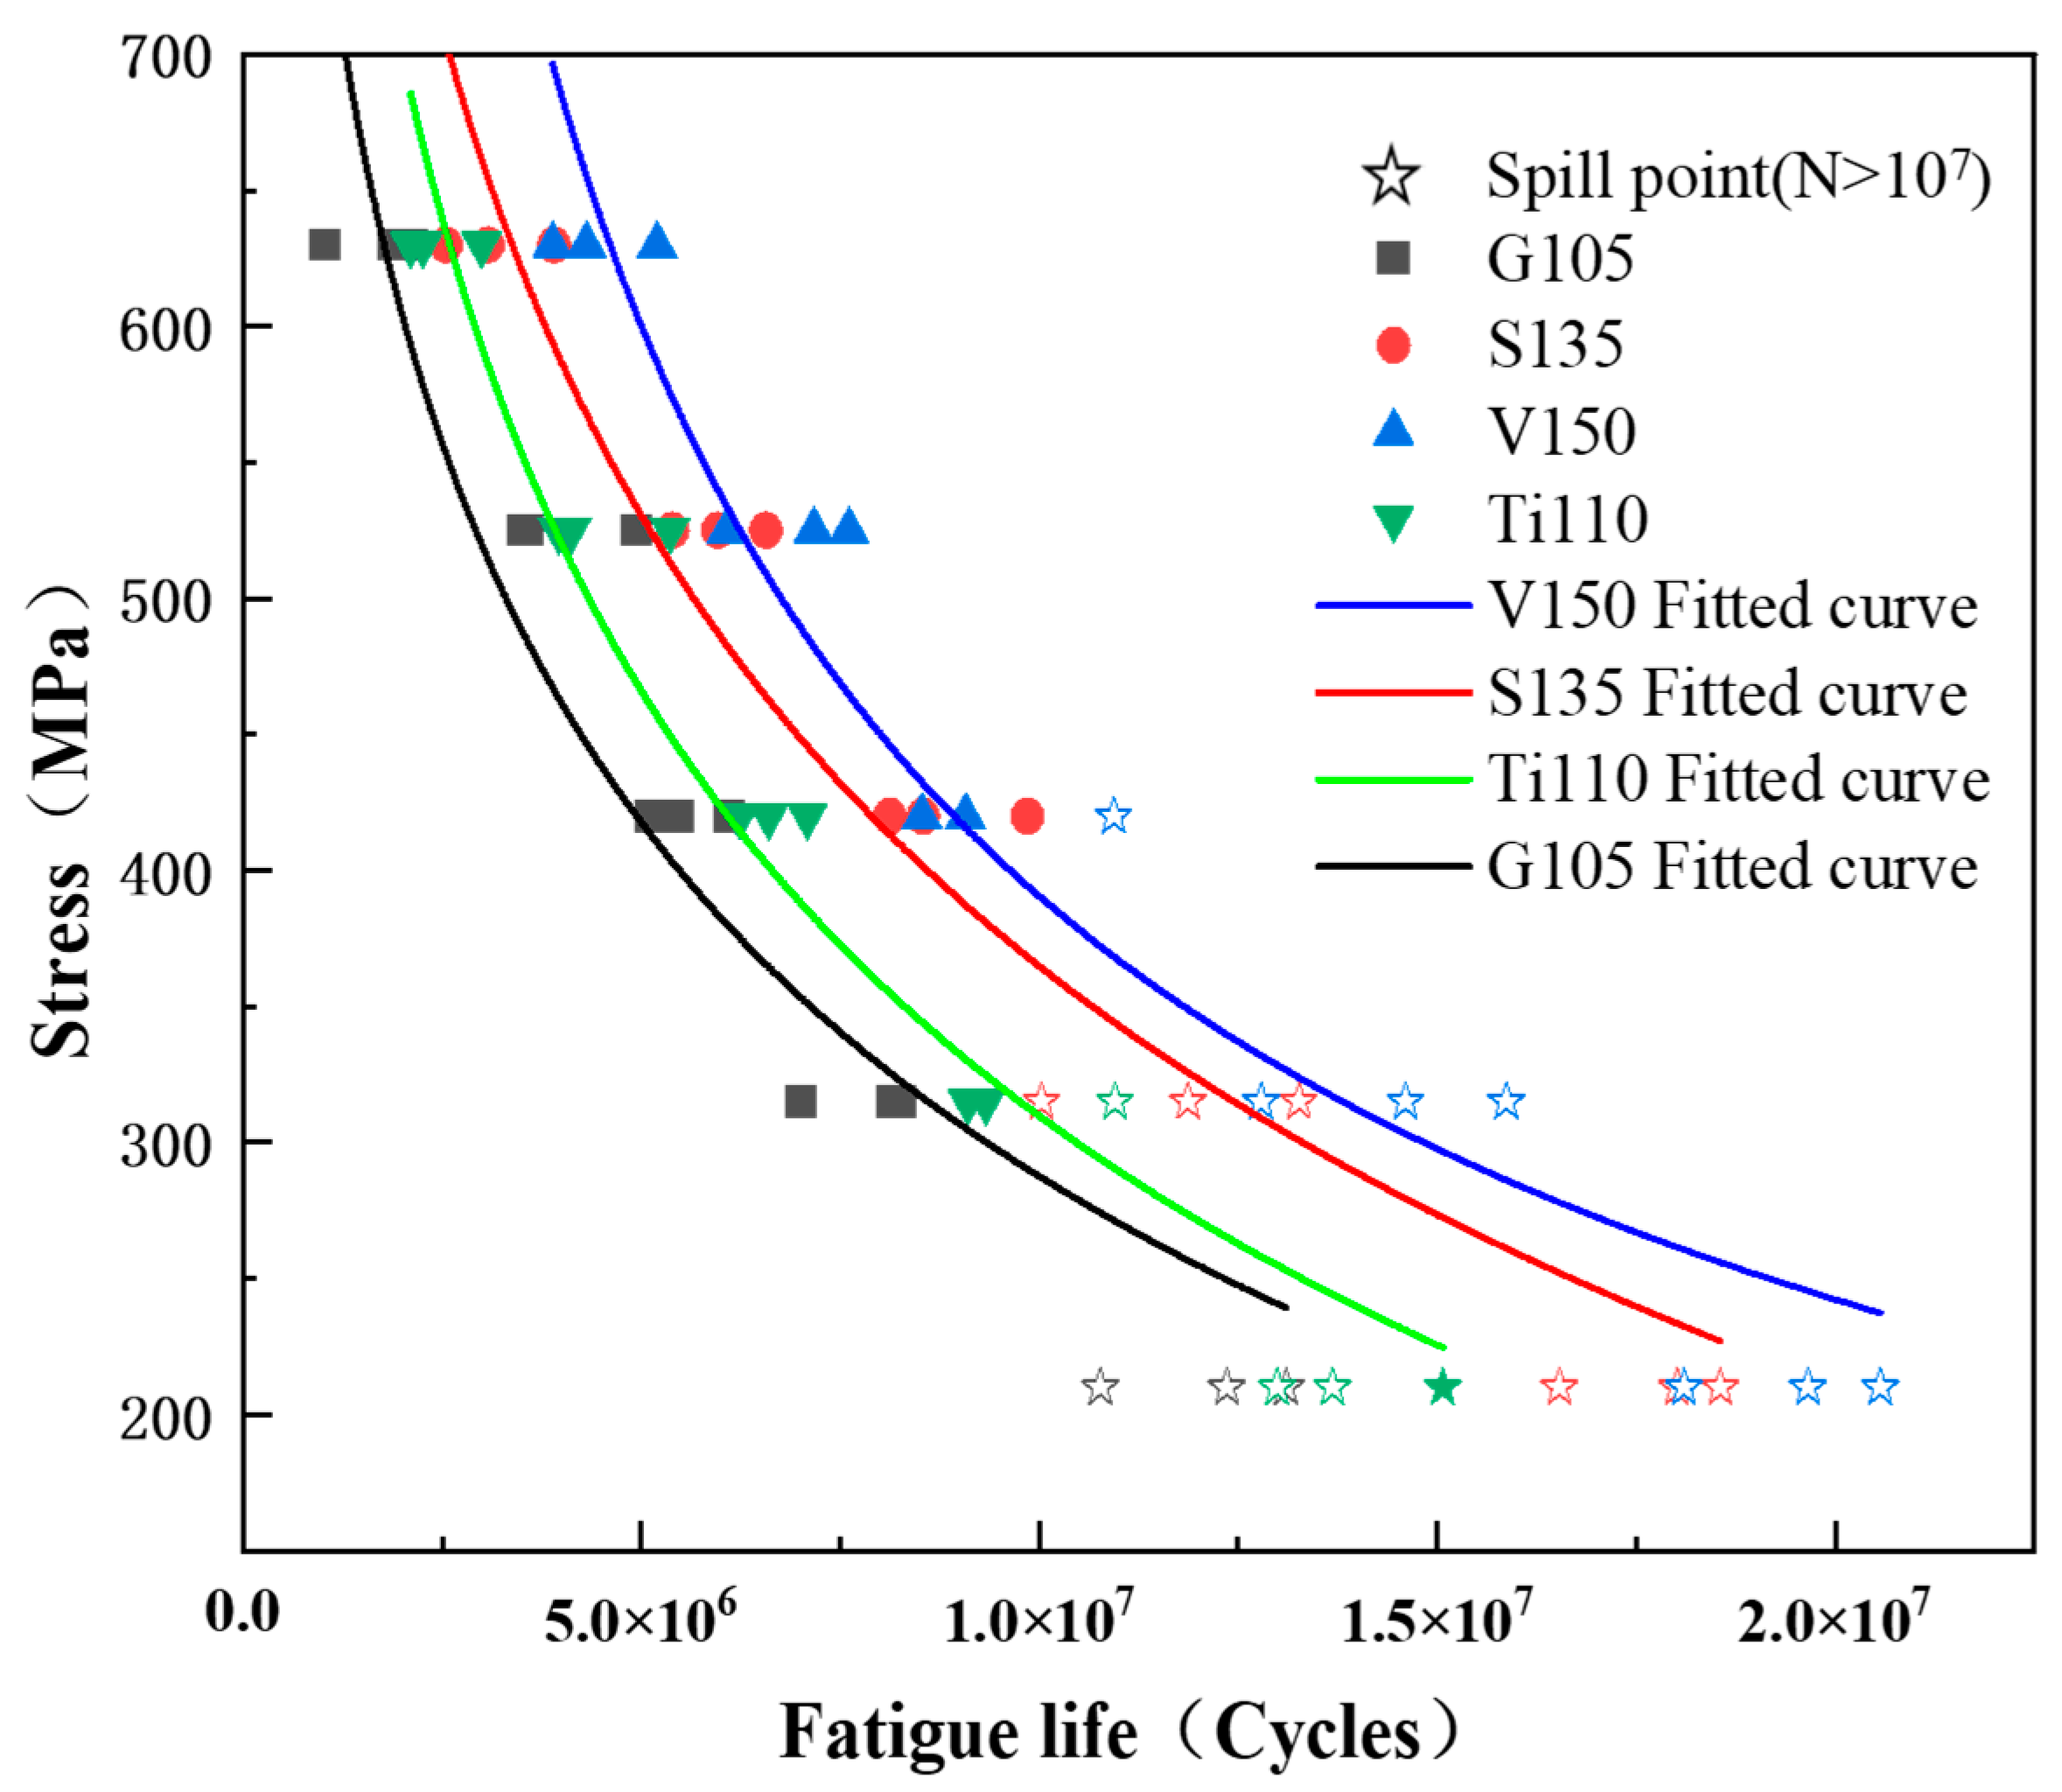
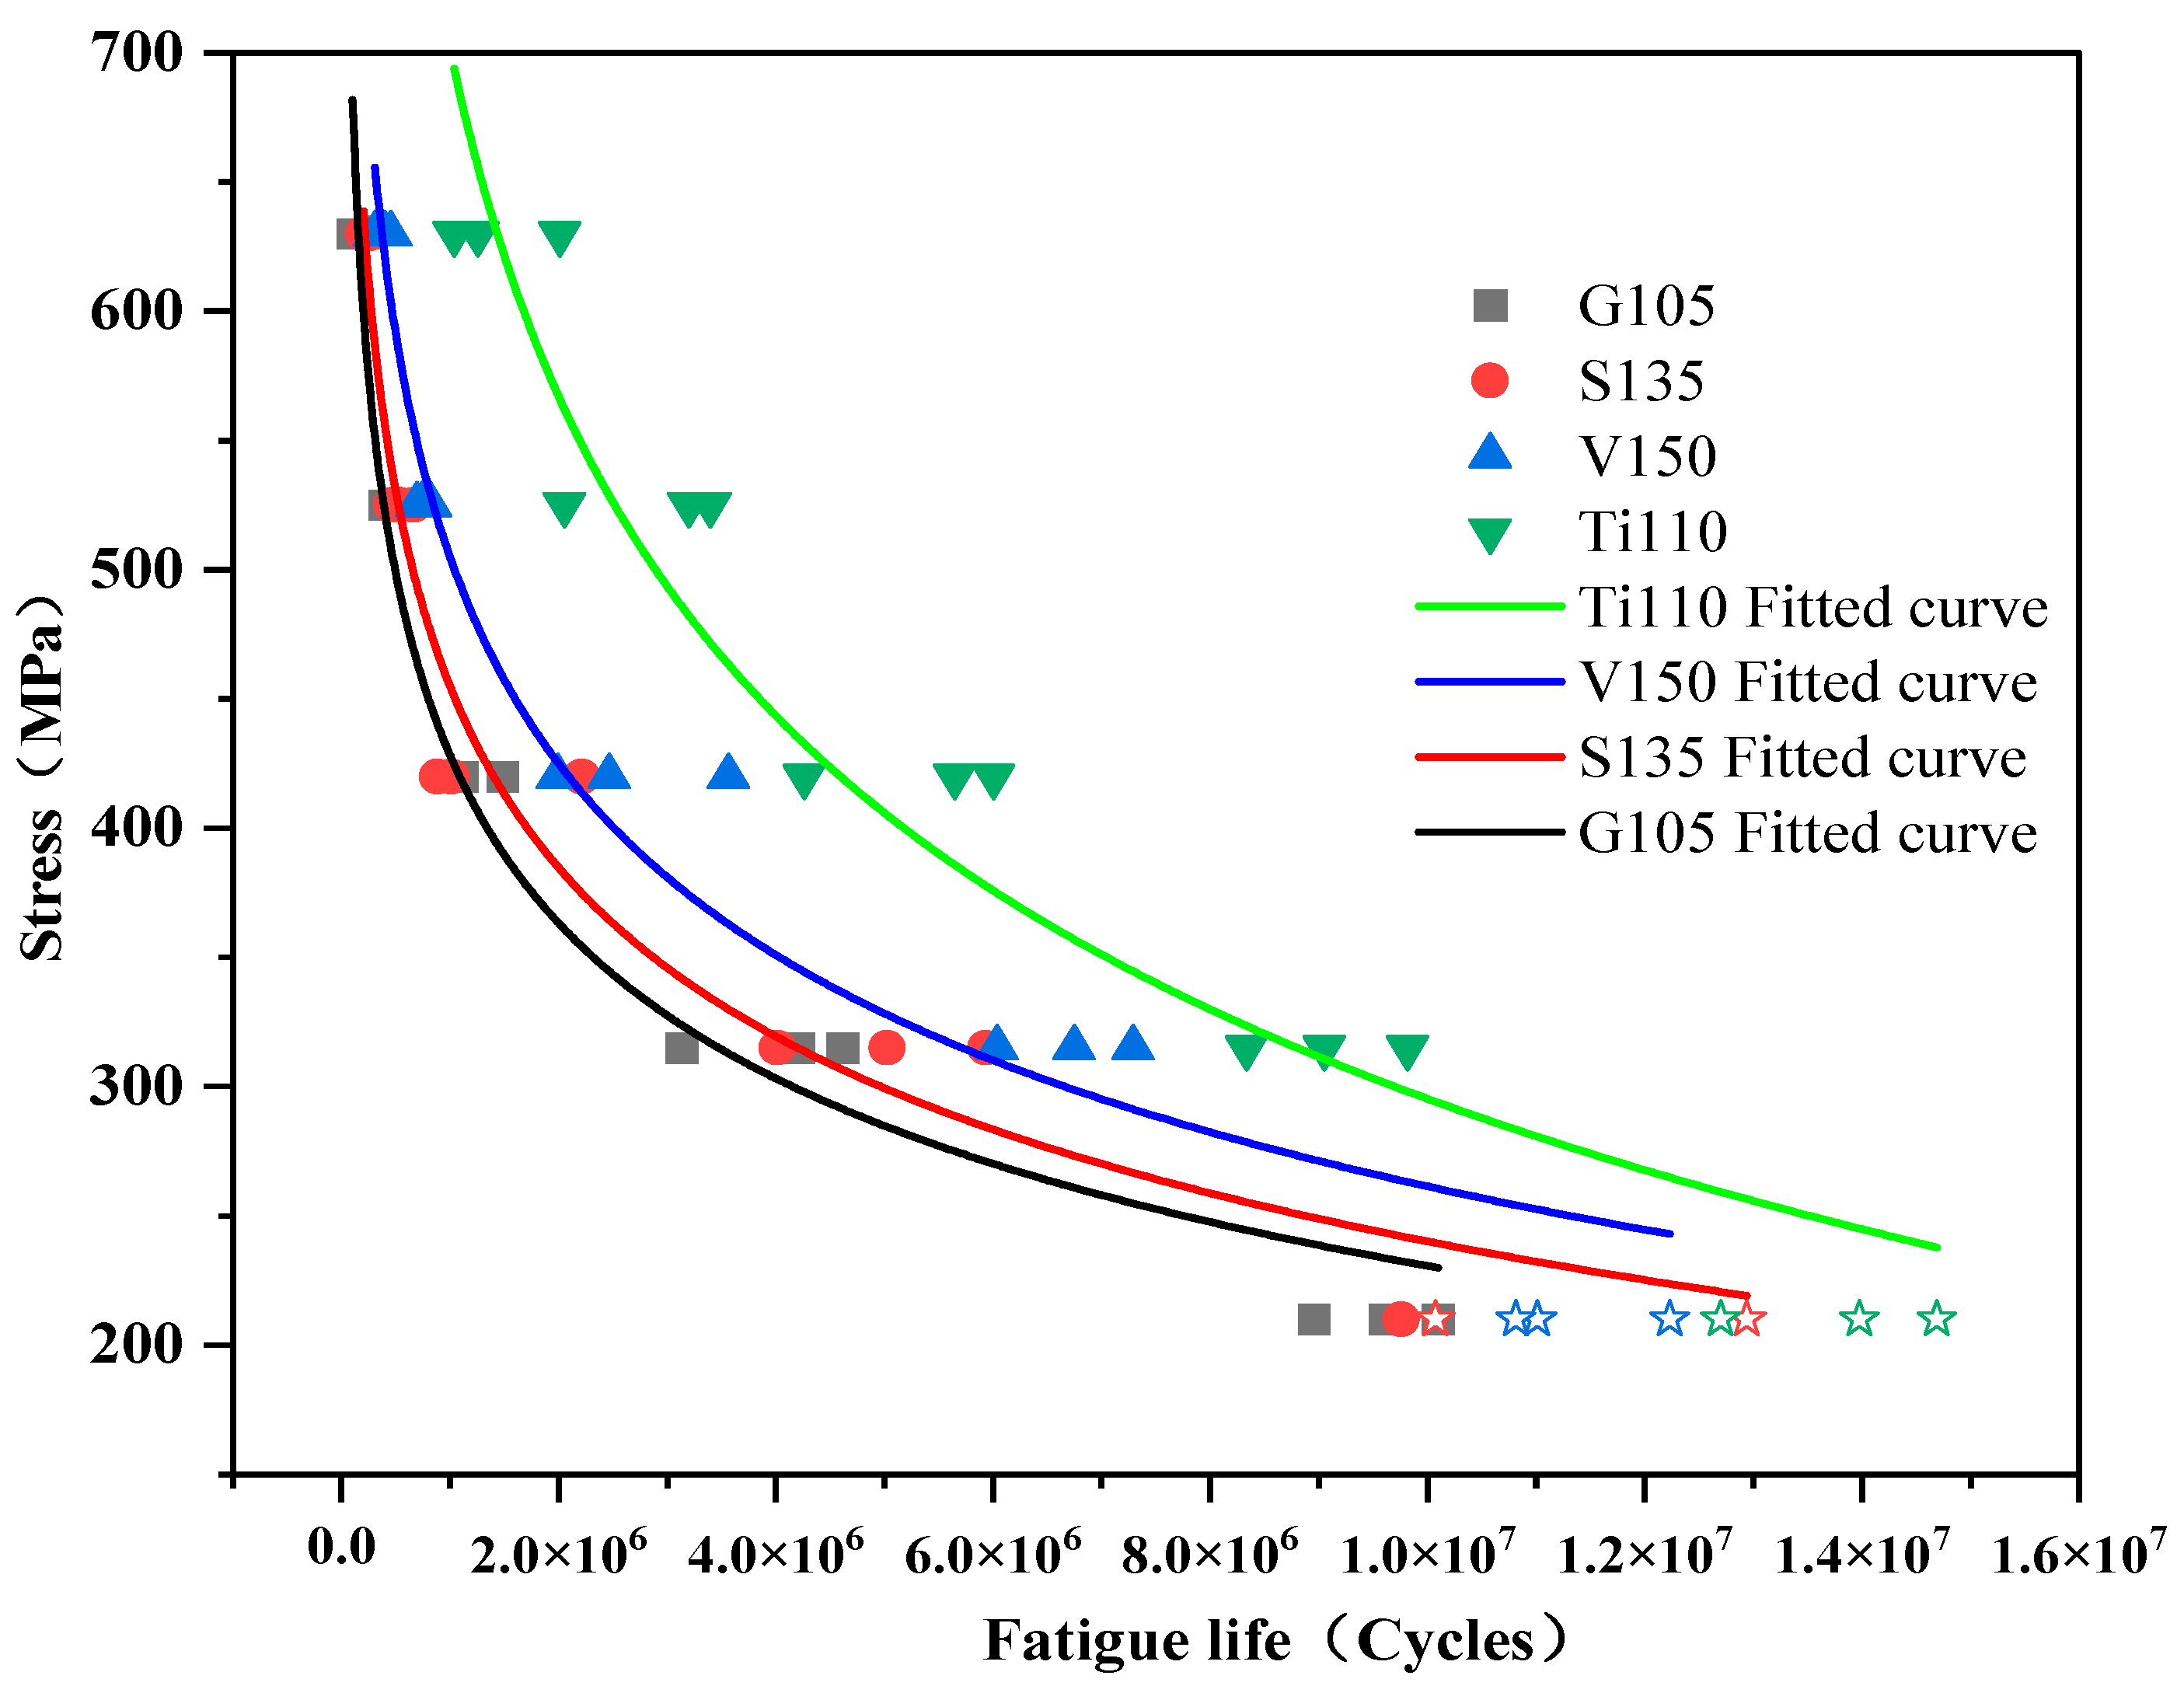
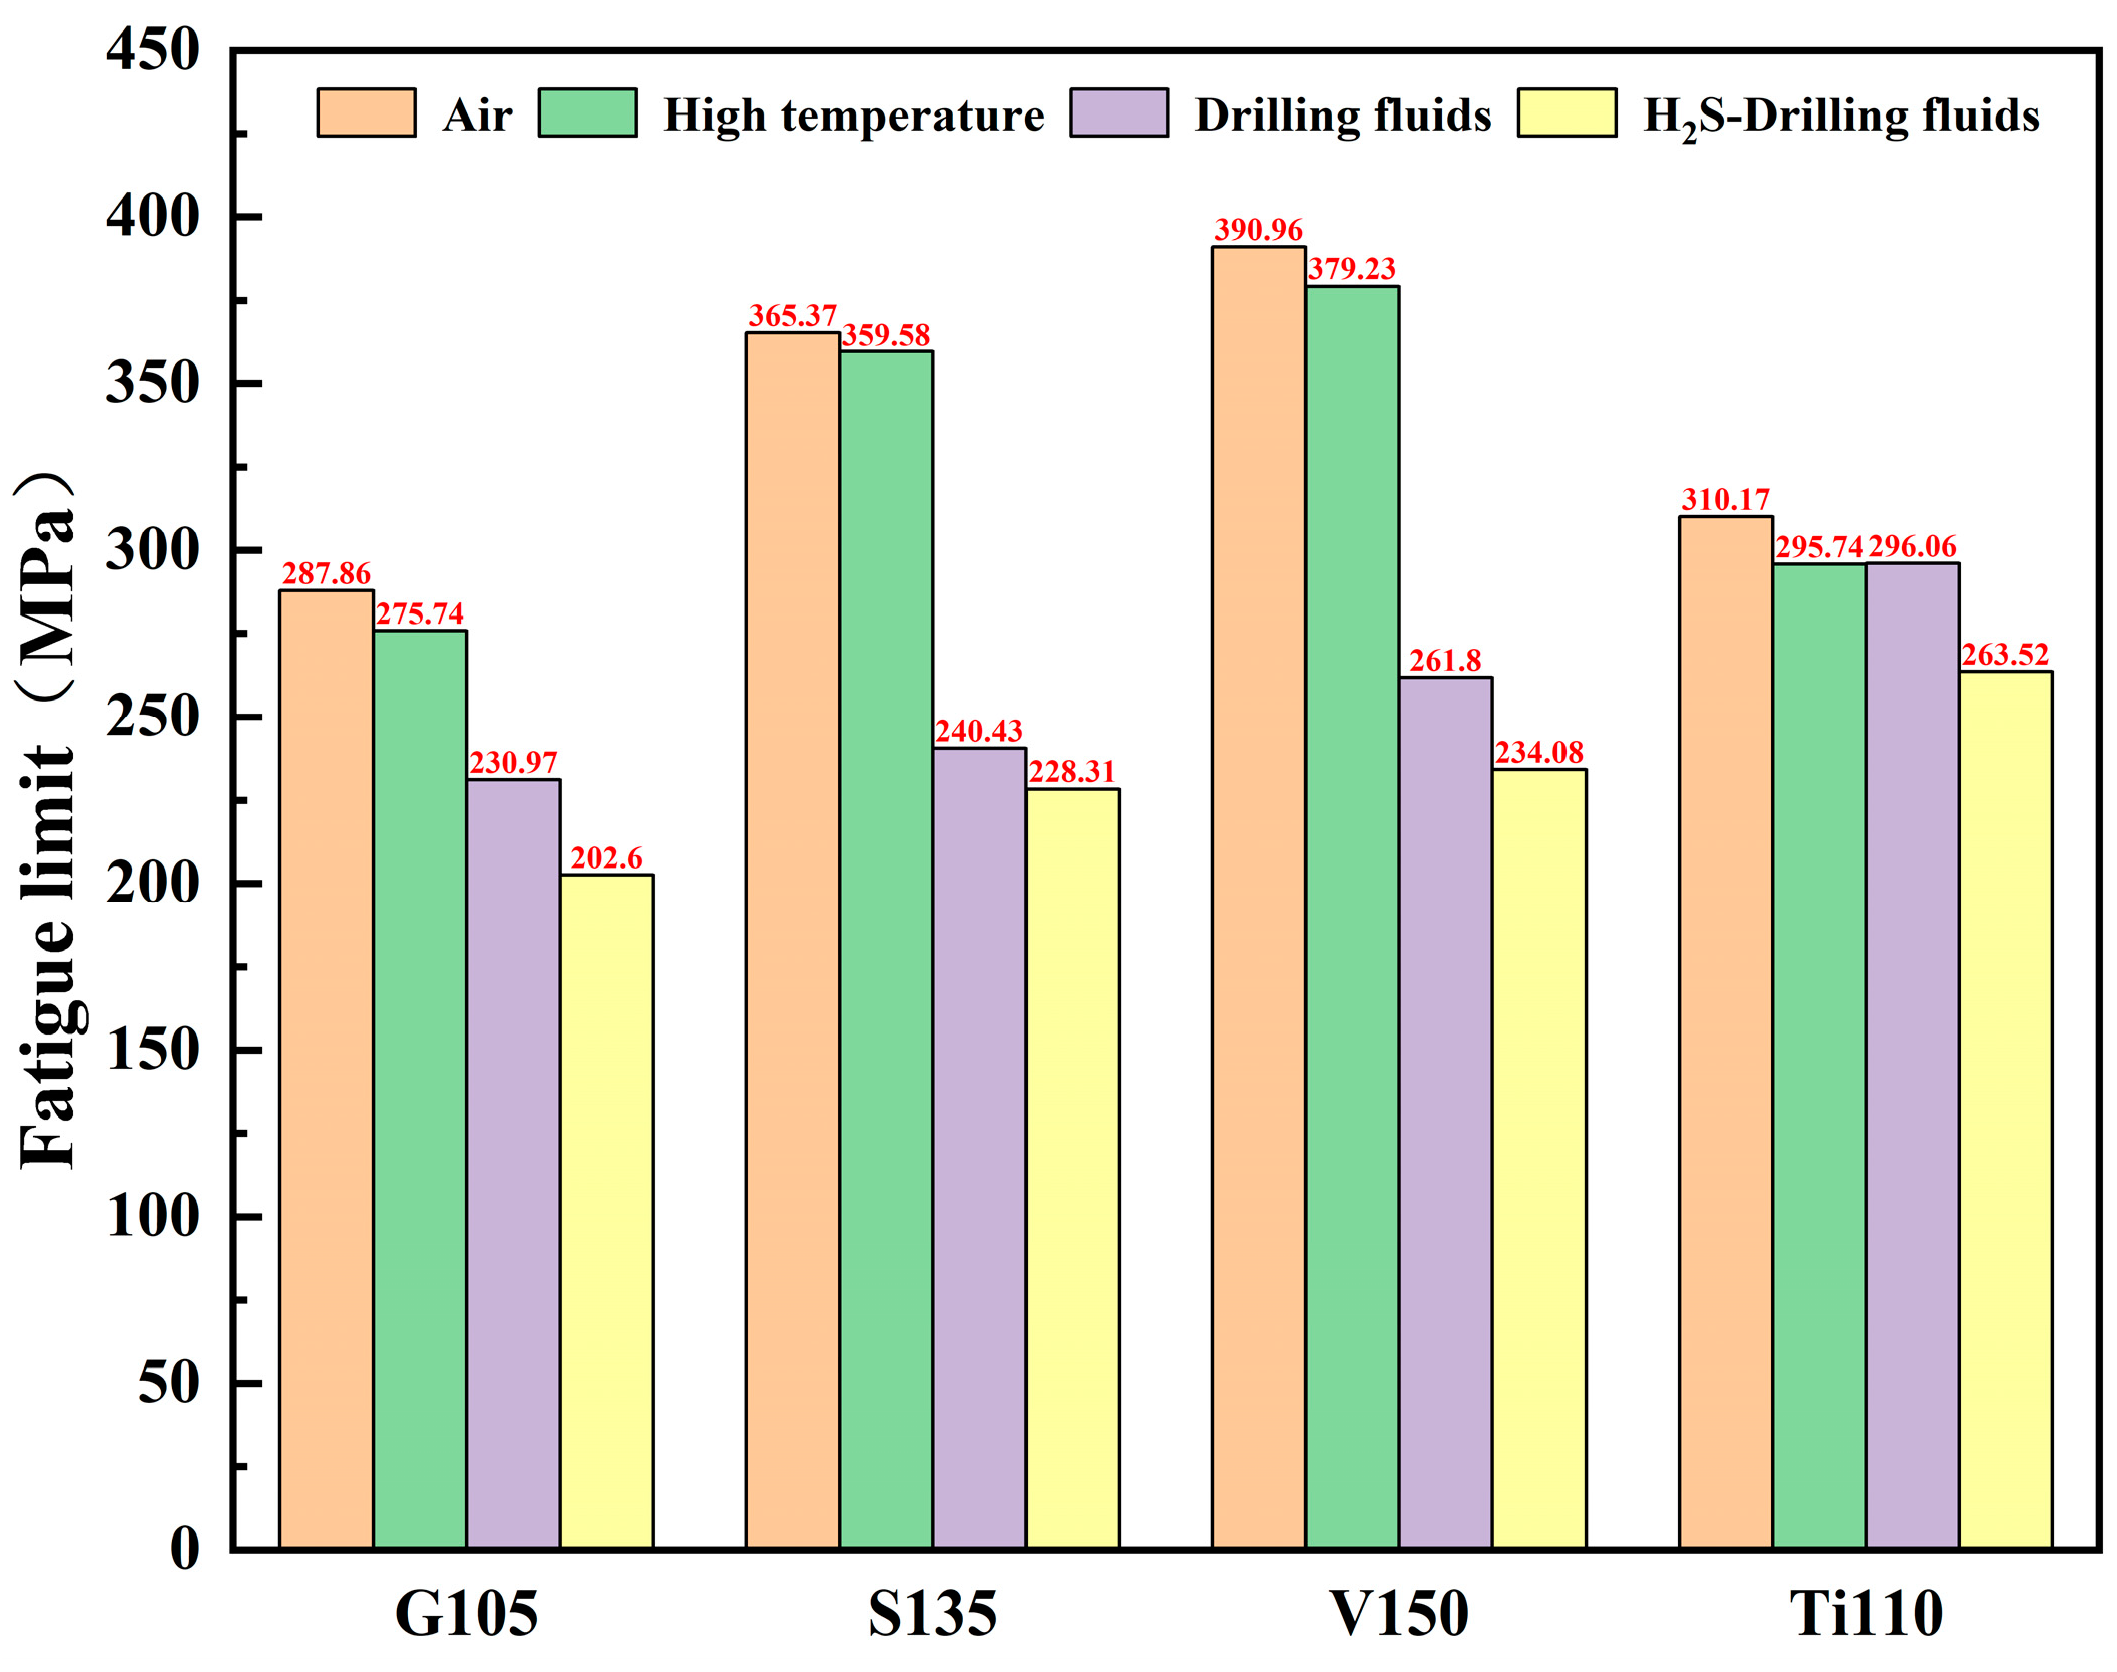
The fatigue test results indicate that the mechanical fatigue life of a drill pipe in a non-corrosive environment is primarily influenced by the steel grade. However, in a corrosive environment with the same stress level, the corrosion fatigue life of a titanium alloy drill pipe outperforms that of a steel drill pipe. Furthermore, when corrosion and fatigue happen simultaneously, the combined effect on drill pipe life is significantly greater than that of either factor acting alone.
(3)
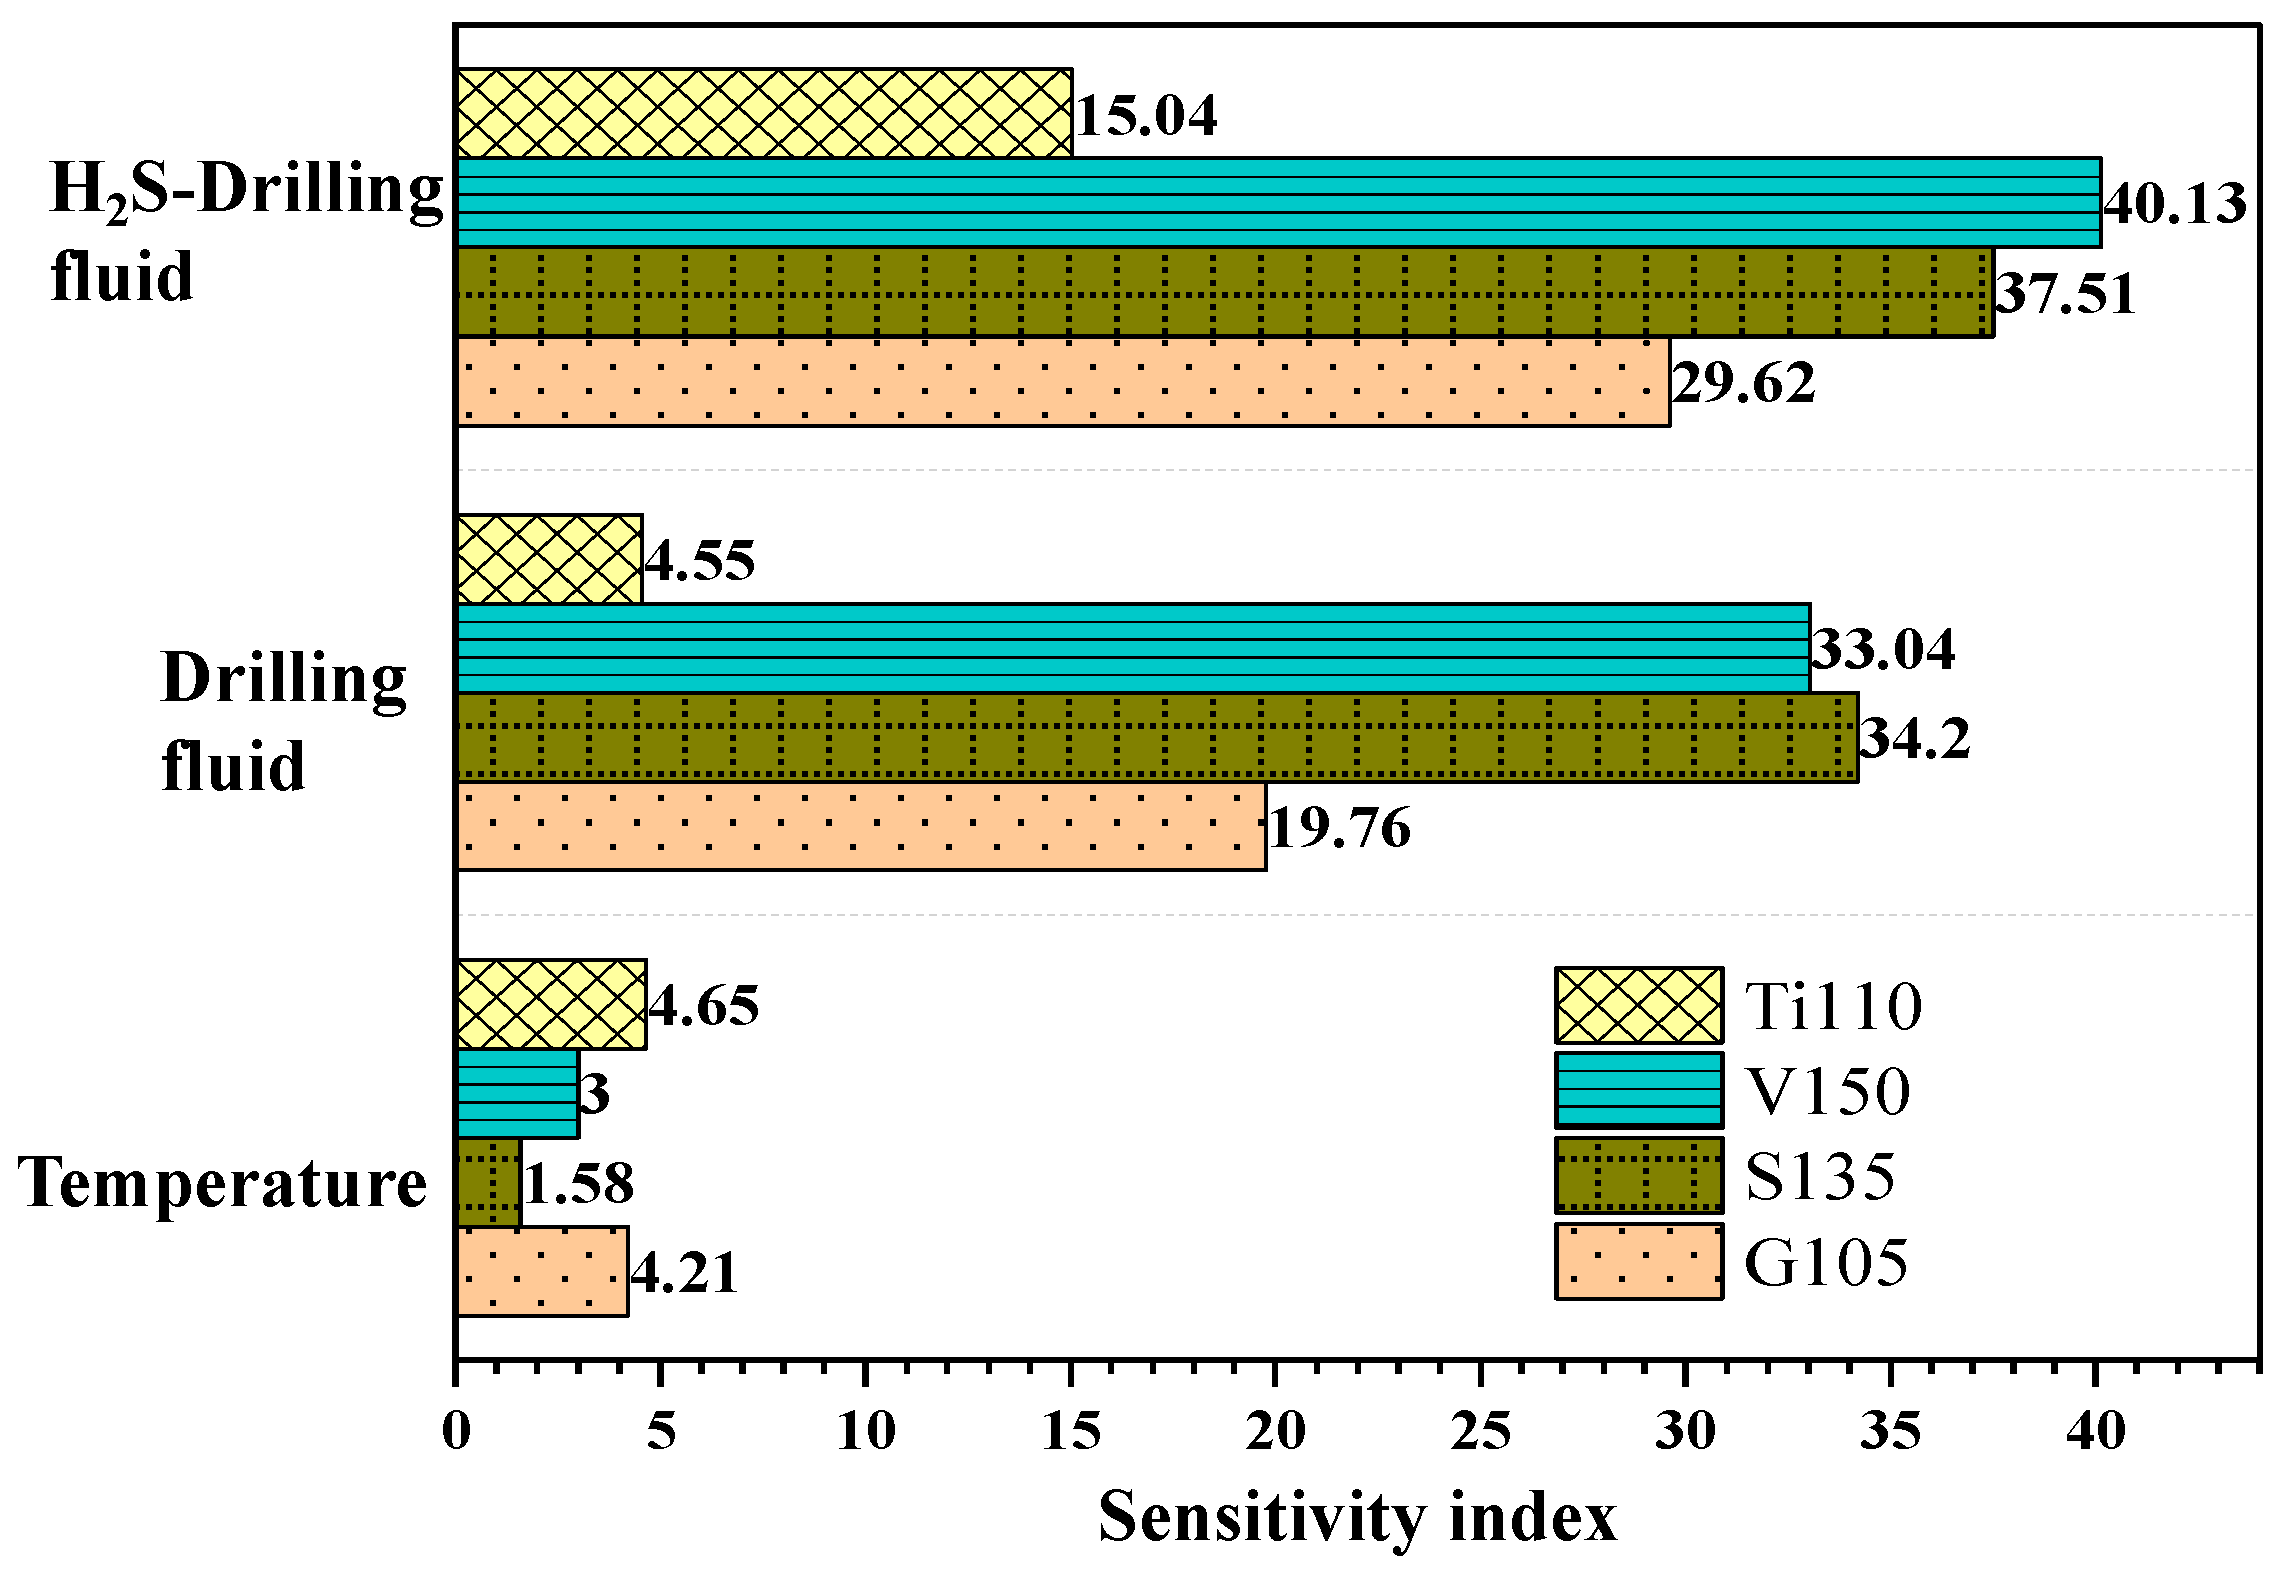
During short-radius sidetracking, the sensitivity sequence of different types of drill pipe to environmental media is as follows: for temperature: Ti110 (4.65%) > G105 (4.21%) > V150 (3%) > S135 (1.58%); for drilling fluid, S135 (34.2%) > V150 (33.04%) > G105 (19.76%) > Ti110 (4.55%). for H2S—drilling fluid: V150 (40.13%) > S135 (37.51%) > G105 (29.62%) > Ti110 (15.04%).
(4)
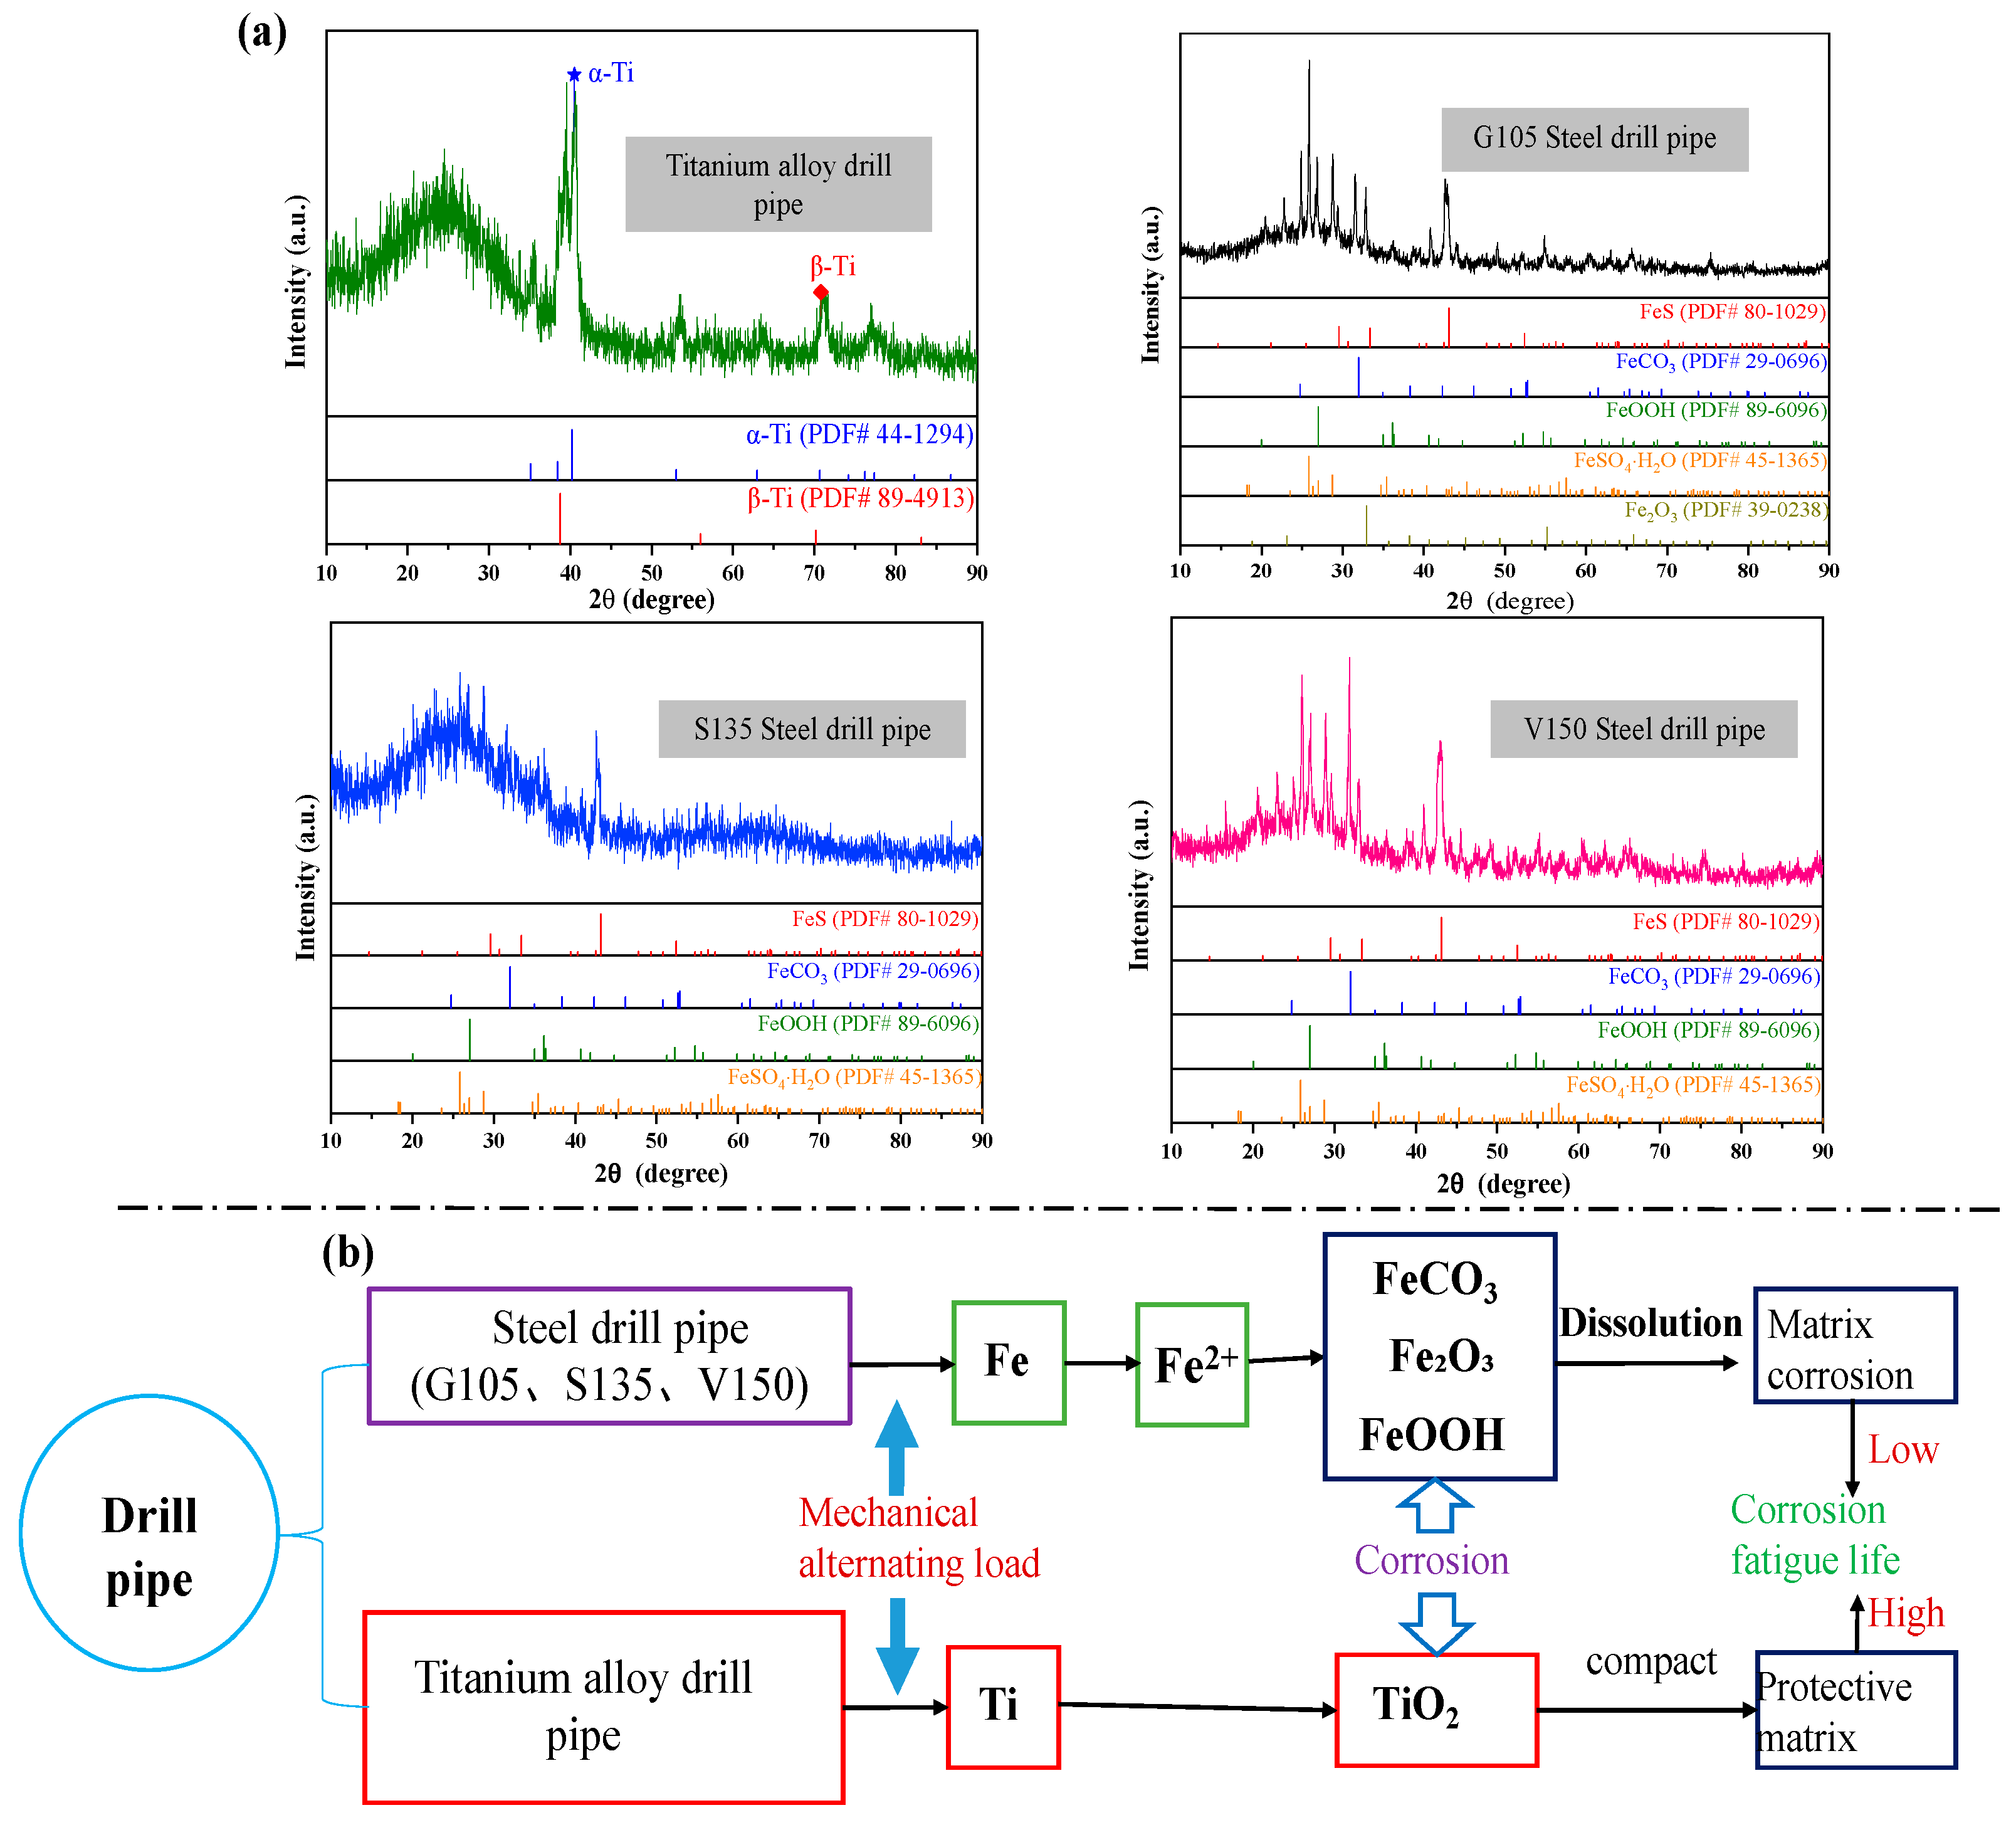
During the process of corrosion fatigue, the protective film on the surface of a titanium alloy drill pipe helps to safeguard the internal structure and prevent corrosion. In contrast, the protective film on a steel drill pipe is more prone to damage, leading to internal corrosion of the structure and exacerbating the formation and spread of micro-cracks. This is the primary factor contributing to the difference in fatigue life between titanium and steel drill pipes.

Supplementary Materials

The following supporting information can be downloaded at: https://www.mdpi.com/article/10.3390/pr12091828/s1, Table S1: fatigue test results in air; Table S2: fatigue test results in High-Temperature Conditions; Table S3: fatigue test results in Drilling Fluid; Table S4: fatigue test results in H2S Drilling Fluid.

Author Contributions

Writing—original draft, Y.S.; Methodology, X.P.; Investigation, G.B. All authors have read and agreed to the published version of the manuscript.

Funding

This study was funded by the Shaanxi Province Postdoctoral Research Project (2023BSHYDZZ163).

Data Availability Statement

The data presented in this study are available on request from the corresponding author. The data are not publicly available due to ongoing proprietary research and analysis, which requires the preservation of data integrity and confidentiality for further in-depth studies.

Acknowledgments

This work was financially supported by the Shaanxi Province Postdoctoral Research Project (2023BSHYDZZ163). We gratefully acknowledge this.

Conflicts of Interest

The authors declare no conflicts of interest.

References

  1. Peng, X.; Yu, H.; Lian, Z.; Zhang, Q. Experimental and theoretical study on the mechanical properties of titanium alloy drill pipe in short radius and long horizontal wells. J. Braz. Soc. Mech. Sci. Eng. 2021, 43, 416. [Google Scholar] [CrossRef]
  2. Zhong, H. Research and application of drilling and completion technology of ultra-short radius sidetracking horizontal well. West. Explor. Eng. 2023, 35, 37–40. [Google Scholar]
  3. Chen, X.; Zhang, Q.; Li, Y.; Liu, J.; Liu, Z.; Liu, S. Investigation on enhanced oil recovery and CO2 storage efficiency of temperature-resistant CO2 foam flooding. Fuel 2024, 364, 130870. [Google Scholar] [CrossRef]
  4. Peng, X.; Yu, H.; Lian, Z.; Dong, B.; Zhong, W.; Zhang, Y.; Hu, Z. Material optimization of drill pipe in complex wellbore environments by comparing fatigue life and cost. Energy Rep. 2021, 7, 5420–5430. [Google Scholar] [CrossRef]
  5. Speller, F.N. Corrosion fatigue of drill pipe. In Proceedings of the Sixteenth Annual Meeting of API, Los Angeles, CA, USA, 1935; p. 239. [Google Scholar]
  6. Morgan, R.P.; Roblin, M.J. A method for the investigation of fatigue strength in seamless drillpipe. In Proceedings of the 1969 ASME Conference, Tulsa, OK, USA, 21–23 August 1969; Volume 227. [Google Scholar]
  7. Zamani, S.M.; Hassanzadeh-Tabrizi, S.A.; Sharifi, H. Failure analysis of drill pipe: A review. Eng. Fail. Anal. 2016, 59, 605–623. [Google Scholar] [CrossRef]
  8. Luo, S.; Liu, M.; Zheng, X. Characteristics and life expression of fatigue fracture of G105 and S135 drill pipe steels for API grade. Eng. Fail. Anal. 2020, 116, 104705. [Google Scholar] [CrossRef]
  9. Zou, H.; Tan, Z. Fatigue life analysis of rotary drill pipe. Int. J. Press. Vessel. Pip. 2023, 201, 104874. [Google Scholar] [CrossRef]
  10. Yu, H.; Peng, X.; Lian, Z.; Shi, T.; Wang, J.; Zhao, Z. Experimental and numerical simulation of fatigue corrosion behavior of V150 high-strength drill pipe in air and H2S-dilling mud environment. J. Nat. Gas Sci. Eng. 2022, 98, 104392. [Google Scholar] [CrossRef]
  11. Peng, X.; Yu, H.; Lian, Z.; Liu, T.; Shi, J.; Yang, D. Study on Fatigue Behavior of S135 Steel and Titanium Alloy Drillpipes: Experiment and Modeling. SPE Drill. Complet. 2023, 38, 261–272. [Google Scholar] [CrossRef]
  12. Zeng, D.; Li, H.; Tian, G.; Liu, F.; Li, B.; Yu, S.; Shi, T. Fatigue behavior of high-strength steel S135 under coupling multi-factor in complex environments. Mater. Sci. Eng. A 2018, 724, 385–402. [Google Scholar] [CrossRef]
  13. Qi, H.Y.; Zheng, X.L.; Ma, L.Q.; Li, S.L.; Yang, X.G.; Shi, D.Q. Low-cycle fatigue behavior of DZ125 superalloy under prior exposure conditions. Rare Met. 2023, 42, 2028–2036. [Google Scholar] [CrossRef]
  14. Wu, Z.Y.; Liu, Y.J.; Wu, X.; Liu, X.C.; Wang, J.C.; Wang, Q. Fatigue performance of beta titanium alloy topological porous structures fabricated by laser powder bed fusion. J. Mater. Res. Technol. 2024, 29, 4772–4780. [Google Scholar] [CrossRef]
  15. Lu, W.Q.; Liu, Y.J.; Wu, X.; Liu, X.C.; Wang, J.C. Corrosion and passivation behavior of Ti-6Al-4V surfaces treated with high-energy pulsed laser: A comparative study of cast and 3D-printed specimens in a NaCl solution. Surf. Coat. Technol. 2023, 470, 129849. [Google Scholar] [CrossRef]
  16. Lu, J.; Ge, P.; Zhao, Y. Recent development of effect mechanism of alloying elements in titanium alloy design. Rare Met. Mater. Eng. 2014, 43, 775–779. [Google Scholar] [CrossRef]
  17. Kolli, R.P.; Devaraj, A. A review of metastable beta titanium alloys. Metals 2018, 8, 506. [Google Scholar] [CrossRef]
  18. GB/T 228.1-2010; Metal Materials—Tensile Test—Part 1: Room Temperature Test Method. Standards Press of China: Beijing, China, 2010.
  19. GB/T 4337-2015; Rotating Bending Method for Fatigue Test of Metal Materials. Standards Press of China: Beijing, China, 2015.
  20. Burhan, I.; Kim, H.S. SN curve models for composite materials characterisation: An evaluative review. J. Compos. Sci. 2018, 2, 38. [Google Scholar] [CrossRef]
  21. Wöhler, A. Über die Festigkeitsversuche mit Eisen und Stahl; Ernst & Korn: Berlin, Germany, 1870. [Google Scholar]
  22. Basquin, O.H. The exponential law of endurance tests. Proc. Am. Soc Test Mater. 1910, 10, 625–630. [Google Scholar]
  23. Aeran, A.; Siriwardane, S.C.; Mikkelsen, O.; Langen, I. A new nonlinear fatigue damage model based only on SN curve parameters. Int. J. Fatigue 2017, 103, 327–341. [Google Scholar] [CrossRef]
  24. Zheng, X.; Wang, H.; Yan, J. Material Fatigue Theory and Engineering Application; Science Press: Beijing, China, 2013. [Google Scholar]
  25. Chen, L.; Liu, W.; Zhang, T.; Dong, B.; Li, H.; Sun, Y.; Li, W. Interaction of silty sand and preformed corrosion products on N80 carbon steel in CO2 environment. Corros. Sci. 2022, 205, 110467. [Google Scholar] [CrossRef]
  26. Wang, Y.; Wang, B.; He, S.; Zhang, L.; Xing, X.; Li, H.; Lu, M. Unraveling the effect of H2S on the corrosion behavior of high strength sulfur-resistant steel in CO2/H2S/Cl environments at ultra high temperature and high pressure. J. Nat. Gas Sci. Eng. 2022, 100, 104477. [Google Scholar] [CrossRef]
  27. Wei, L.; Pang, X.; Gao, K. Corrosion of low alloy steel and stainless steel in supercritical CO2/H2O/H2S systems. Corros. Sci. 2016, 111, 637–648. [Google Scholar] [CrossRef]
  28. Zhang, L.C.; Chen, L.Y.; Wang, L. Surface modification of titanium and titanium alloys: Technologies, developments, and future interests. Adv. Eng. Mater. 2020, 22, 1901258. [Google Scholar] [CrossRef]
  29. Sartale, S.D.; Ansari, A.A.; Rezvani, S.J. Influence of Ti film thickness and oxidation temperature on TiO2 thin film formation via thermal oxidation of sputtered Ti film. Mater. Sci. Semicond. Process. 2013, 16, 2005–2012. [Google Scholar] [CrossRef]
  30. Tao, Q.; Ding, W.; Chen, G.; Qu, X.; Qin, M. Towards an atomic-scale understanding of oxide film in the Ti powder surface. Scr. Mater. 2022, 210, 114471. [Google Scholar] [CrossRef]
  31. Bodunrin, M.O.; Chown, L.H.; Van Der Merwe, J.W.; Alaneme, K.K.; Oganbule, C.; Klenam, D.E.; Mphasha, N.P. Corrosion behavior of titanium alloys in acidic and saline media: Role of alloy design, passivation integrity, and electrolyte modification. Corros. Rev. 2020, 38, 25–47. [Google Scholar] [CrossRef]
Figure 1. Metallographic structure diagram of different drill pipe materials ((a) is G105; (b) is S135; (c) is V150; (d) is titanium alloy).
Processes 12 01828 g001
Figure 2. Drill pipe material tensile test results.
Processes 12 01828 g002
Figure 3. Sampling method and size of fatigue sample (unit: mm).
Processes 12 01828 g003
Figure 4. PQ-6 fatigue machine and relation of loading stress of fatigue testing machine with time: (a) Fatigue test machine; (b) Schematic diagram of load-time variation law.
Processes 12 01828 g004
Figure 5. Comparison of fitting results of different S-N curve models: (a) Wohler model; (b) Basquin model; (c) Zheng model; (d) Stromeyer model.
Processes 12 01828 g005
Figure 6. Comparison of fitting error of S-N curve models under different stress conditions.
Processes 12 01828 g006
Figure 7. S-N curves of different drill pipe materials in air.
Processes 12 01828 g007
Figure 8. S-N curves of different drill pipe materials in high-temperature conditions.
Processes 12 01828 g008
Figure 9. S-N curves of different drill pipe materials in drilling fluid.
Processes 12 01828 g009
Figure 10. S-N curves of different drill pipe materials in H2S drilling fluid.
Processes 12 01828 g010
Figure 11. Fatigue limits of different types of drill pipe under different factors.
Processes 12 01828 g011
Figure 12. Sensitivity coefficients of different types of the drill pipe in different factors.
Processes 12 01828 g012
Figure 13. XRD results and fatigue life difference analysis of drill pipe materials. (a) XRD results; (b) Corrosion fatigue mechanism.
Processes 12 01828 g013
Table 1. Test results of chemical composition of drill pipe sample material (wt, %).
Drill PipeCSiMnPAIMoNiCrFeTi
G1050.370.270.130.020.0190.130.110.08Balance0.01
S1350.370.240.960.0110.0230.320.081.14Balance0.01
V1500.250.300.580.0090.030.870.691.09Balance0.02
Ti0.0150.05//5.442.80/1.290.02Balance
API Spec5D///<0.03//////
Table 2. Fatigue test schemes.
Drill Pipe MaterialStress LevelTest EnvironmentRemark
G105
S135
V150
Ti
210 MPa
315 MPa
420 MPa
525 MPa
630 MPa
Room temperature in airEach drill pipe sample should be subjected to 5 groups of fatigue tests at different stress levels under different test environments.
High temperature
Drilling fluid
H2S drilling fluid
Table 3. Fitting results of different models.
ModelFitting FormulaR-SquaredFatigue Limit (MPa)
Wohler e 0.0046 · S N = 3.36 × 10 7 0.94263.47
Basquin S 1.79 · N = 2.63 × 10 11 0.90294.44
Zheng N = 4.88 × 10 11 S 88.40 2 0.77309.30
Stromeyer N = 4.98 × 10 40 S + 1581 10.3 0.88287.86
Disclaimer/Publisher’s Note: The statements, opinions and data contained in all publications are solely those of the individual author(s) and contributor(s) and not of MDPI and/or the editor(s). MDPI and/or the editor(s) disclaim responsibility for any injury to people or property resulting from any ideas, methods, instructions or products referred to in the content.

