Article

A New Approach to a Fracturing Sweet Spot Evaluation Method Based on Combined Weight Coefficient Method—A Case Study in the BZ Oilfield, China

1
CNOOC Research Institute Co., Ltd., Beijing 100028, China
2
Hubei Key Laboratory of Oil and Gas Drilling and Production Engineering, Yangtze University, Wuhan 430100, China
3
School of Petroleum Engineering, Yangtze University, Wuhan 430100, China
*
Author to whom correspondence should be addressed.
Processes 2024, 12(9), 1830; https://doi.org/10.3390/pr12091830
Submission received: 22 July 2024 / Revised: 22 August 2024 / Accepted: 26 August 2024 / Published: 28 August 2024
(This article belongs to the Topic Enhanced Oil Recovery Technologies, 3rd Volume)

Abstract

:
The Sha3 member of the BZ Oilfield in Bohai Sea represents a typical ultra-low permeability thin interbedding reservoir. Hydraulic fracturing is an effective method for increasing oil and gas production. However, the complex geological conditions make it difficult to screen out the optimal frac spot. Consequently, the design of hydraulic fracturing exhibits certain limitations. A novel method for evaluating sweet spots is proposed, based on a refined geological reservoir model that considers the varying degrees of influence that geological and engineering factors have on fracturing effectiveness. This method utilizes grey correlation and hierarchical analysis to quantify and characterize the weight coefficients of each factor, ultimately leading to a combined weight coefficient approach. The results indicate that permeability and fracturing scale are the primary factors that impact the post-frac production of the BZ oilfield, with their respective combined weights being 0.33 and 0.25. The average weight for geological factors is 0.18, while for engineering factors it is 0.15. This suggests that geological factors have a greater influence on production than engineering factors. Furthermore, the correlation coefficient between the dual sweet spot index and the production is 0.96, indicating a strong positive correlation between the two variables. After comparing the predicted and actual production of each well, it was determined that the anastomosis rate is 80%. This finding holds significant guiding significance for selecting the optimal fracturing spot.

1. Introduction

The efficient development of offshore low permeability oil fields holds significant practical and far-reaching strategic importance. Currently, the proven reserves of offshore low-permeability crude oil are nearly 500 million tons, and those of natural gas are nearly 500 billion cubic meters, which are important replacement resources for conventional oil and gas (e.g., Sun et al. 2024; Xu et al. 2023) [1,2]. While extensive research has been conducted on reservoir stimulation in onshore low-permeability oilfields, leading to a relatively comprehensive technical and theoretical framework, it is not feasible to directly apply the mature development model of onshore oilfields to offshore oilfields due to various factors, such as economic and environmental considerations. The BZ Oilfield is located at the boundary of the Bohai Bay Basin, the western end of Bo-nan Low Bulge, and the Yellow River Estuary Depression. The primary reservoirs of the area include Sha 2 Member and Sha 3 Member, with a permeability range of 0.8–53.6 × 10⁻³ μm2 and porosity ranging from 10.4–16% (e.g., Guo 2022) [3]. The horizontal and longitudinal physical properties vary significantly within these reservoirs, leading to apparent differences in productivity among them. Some reservoirs exhibit low natural productivity, making it difficult for conventional perforation methods to meet production conditions. In order to enhance reservoir connectivity, increase reserve utilization, and improve single well productivity, there is an urgent need for fracturing testing to economically develop ultra-low permeability reservoirs within the Sha3 Member.
The lack of proper alignment between engineering strategies and geological conditions in targeted blocks leads to significant variations in the effectiveness of post-frac operations. The production of oil and gas wells serves as a direct indicator of the effectiveness of the fracturing process. Through the analysis of various geological and engineering factors on post-fracturing production, it is possible to mitigate potential blind spots in hydraulic fracturing design and improve the efficient implementation of such processes. Generally, tight reservoirs are characterized by low porosity, low permeability, limited abundance, strong heterogeneity, and significant variations in sand body distribution. The evaluation criteria for identifying geological sweet spots in these reservoirs are based on their physical properties. The physical characteristics of low permeability reservoirs are closely linked to tectonic activity, sedimentary environment, and rock formation. Variations in provenance and sedimentation environment result in differences in the composition and content of clastic and interstitial materials, as well as the particle size, abrasion, and sorting of sandstone reservoirs. These factors exert varying degrees of influence on the physical properties of the reservoirs (e.g., Shi et al. 2021) [4]. In order to evaluate the extent of impact that different factors have on post-fracture production, professionals in the industry primarily utilize a variety of statistical methods and machine learning techniques to quantify such influence (e.g., Vikara 2020; Sui et al. 2016) [5,6]. Commonly utilized research methods include Analytic Hierarchy Process (AHP), which is a weighted evaluation method capable of resolving complex issues across multiple levels and with multiple indicators through its combination of qualitative and quantitative analysis techniques (e.g., Zhang et al. 2021; Zeng et al. 2017) [7,8]. The random forest algorithm, a classifier containing multiple decision trees, whose output category is determined by the mode of each decision tree output category, integrates all classification voting results and designates the category with the most votes as the final output (e.g., Chen et al. 2022) [9]. Gradient Boosting Decision Tree (GBDT) is an iterative machine learning algorithm that builds a weak model in stages by optimizing an arbitrarily differentiable loss function at each stage (e.g., Han et al. 2018) [10]. Wang et al. (e.g., Wang et al. 2021; Qu et al. 2014; Nie et al. 2013) utilized the grey correlation method to analyze the factors impacting the fracturing effect, and identified displacement, sand addition intensity, effective formation thickness, and porosity as significant influences on post-fracture production after a single well [11,12,13]. Hongquan et al. (2017) employed logging data to optimize reservoir parameters sensitive to shale geological factors, and established discriminant vectors for identifying these factors (e.g., Xia et al. 2017; Liao et al. 2019; Zhang et al. 2024) [14,15,16]. Shanyong et al. (2019) conducted a component analysis to examine the primary controlling factors influencing the productivity of fractured horizontal wells in tight sandstone gas reservoirs [17]. Shuai et al. (2020) utilized numerical simulation methods to conduct a comparative analysis of the changes in shale gas productivity under various fracturing parameters (e.g., Li et al. 2020; Tang et al. 2020) [18,19]. Currently, there is limited research on comprehensively considering geological and engineering factors for offshore low permeability reservoirs. This paper employs the Analytic Hierarchy Process (AHP) in combination with the grey correlation method to quantitatively assess and identify the primary control factors that impact production, based on field data. A geology–engineering dual sweet spot model is established based on the combined weights to provide a reference for the classification evaluation of sweet spots and the design of fracturing optimization for offshore low permeability reservoirs. This model aims to provide a reference for the classification and evaluation of sweet spots in offshore low permeability reservoirs, as well as for the optimized design of fracturing.

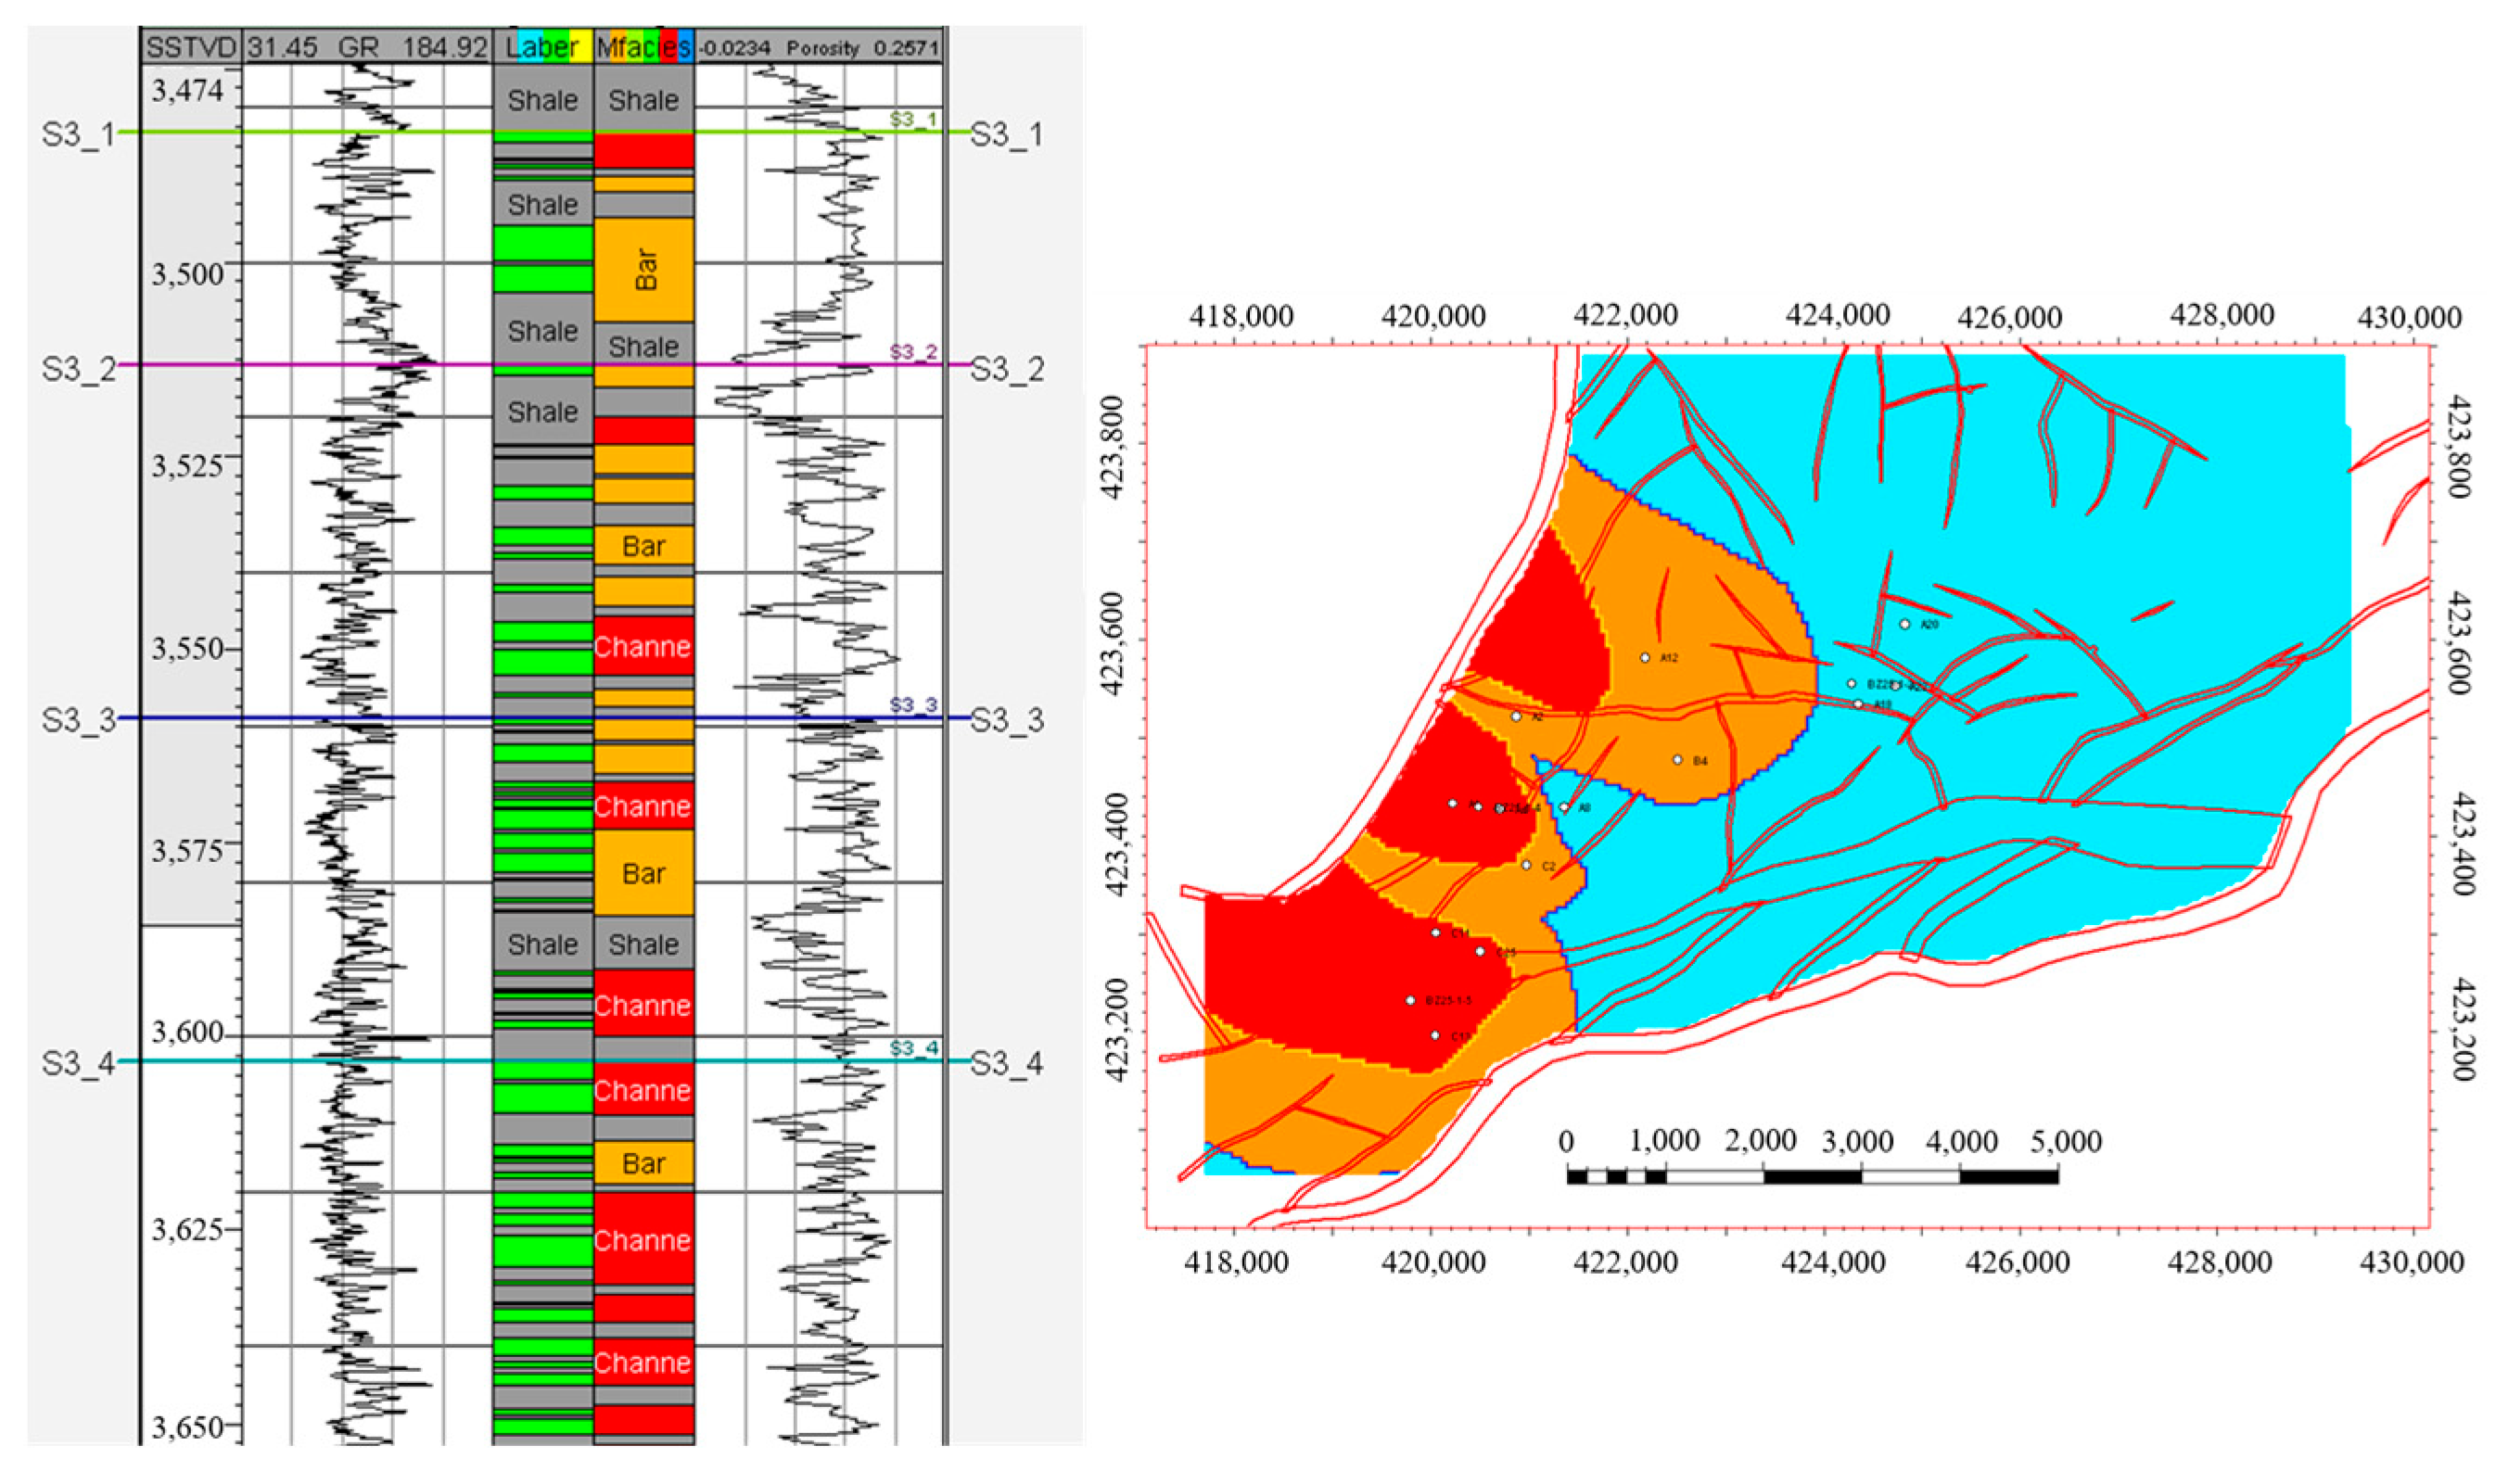
2. Geological Settings

The target zone is Sha3 Member in BZ Oilfield, which is a low permeability reservoir, with depth ranging from 3700 m to 3900 m, and the fan delta sedimentary facies is predominantly developed. As shown in Figure 1, the reservoir exhibits a significant longitudinal span of 3474–3650 m, comprising numerous small layers with an average thickness of 3.0 m. This characteristic denotes a typical sand and mud interlayer reservoir (e.g., Wang et al. 2022) [20].
A geological reservoir model was built and supported by the local oil company. The physical properties of the reservoir are poor, with an average porosity of 14.5% and an average permeability of 1.0 × 10⁻³ μm2 (as shown in Figure 2). The original formation pressure is 57.0 MPa and the pressure coefficient is 1.59. To sum up, the experimental area is a typical abnormally high temperature, high pressure and low permeability reservoir.

3. Analysis of Geology–Engineering Parameters

For low permeability oil and gas reservoirs, there are numerous parameters that influence the effectiveness of fracturing. These parameters can be categorized into geological factors and engineering factors based on their control factors. The geological factors refers to an area abundant in oil and gas resources with favorable physical properties, highlighting the inherent potential for reservoir development. The engineering factor is characterized by its ability to facilitate the formation of a complex fracture network after fracturing, highlighting the reservoir’s potential for future stimulation. Based on 3D seismic, well logging, and drilling data, a geological model of reservoir structure, physical properties, and lithology has been built. Considering the numerous factors that impact post-fracture production, parameters, such as porosity, permeability, and horizontal in situ stress difference, are selected based on formation lithology, physical properties, gas-bearing property and mechanical characteristics (e.g., Qiao et al. 2019) [21]. The ability to form a complex fracture network after fracturing is used as a reference for selecting parameters such as brittleness index, fracturing scale, and slurry rate (e.g., Liu, 2019) [22]. According to the logging data, construction data and relevant research literature provided by the target block, porosity, permeability and horizontal stress difference are selected as the main geological factors, and fracturing scale, construction displacement and brittleness index are selected as the main engineering factors.

3.1. Geological Parameters Analysis

The Shahejie Formation is the primary formation for fracturing. According to the data provided by the oilfield company, this formation consists of three members, and the focus of this study is to discuss the Sha3 member. The specific descriptions of the lithology of each member are shown in Table 1.

3.1.1. Study of the Reservoir’s Physical Property Parameters

The reservoir’s physical properties reflect the reservoir’s capacity and fluid percolation ability, which is mainly manifested as porosity and permeability. According to 38 data points from nine wells, the reservoir porosity in the BZ area is mainly distributed in the range of 0.3~23.5% with an average porosity of 14.5%. The average permeability was 1.0 × 10⁻³ μm2 (see Figure 3).

3.1.2. Study of In Situ Stress

In the process of hydraulic fracturing, horizontal in situ stress is one of the most important parameters. It is generally believed that the fracture occurs because the fluid pressure at the fracture tip exceeds the in situ stress, pore pressure and rock mass strength. For unconventional reservoirs, horizontal stress differences have a more obvious impact on the formation and development of the fracture network: when the horizontal in situ stress difference is small, an additional stress will be imposed in the direction of the original minimum horizontal in situ stress due to the interference effect, making the stress in that direction greater than the original maximum horizontal in situ stress, and then the fracture may turn and eventually produce complex fractures. The in situ stress in the BZ area was tested through an indoor Kaiser experiment, and the test results are shown in Table 2.

3.2. Engineering Factors Analysis

3.2.1. Study of the Brittle Index

Brittleness plays a crucial role in characterizing reservoir fracability, particularly for unconventional reservoirs. It holds significant importance in optimizing fracturing de-sign, enhancing fracturing efficiency, and reducing development costs. Currently, the evaluation methods for rock brittleness can be categorized into three groups. First, there are evaluation methods for rock brittleness based on mineral components (e.g., Cipolla et al. 2010) [23]. Second, there are methods for evaluating rock brittleness based on elastic properties, including the evaluation method using a stress–strain curve, the evaluation method based on elastic parameters, and the evaluation method based on modulus. (e.g., Tarasov et al. 2013) [24]. Last but not least, there is an evaluation method for the brittleness of rock based on strength parameters. (e.g., Rickman et al. 2008) [25]. Now, it is widely accepted that, the higher the brittleness index, the more complex a fracture network can be created, leading to a larger volume of stimulation and increased productivity (e.g., Zhang et al. 2016) [26].

3.2.2. Pump Rate

The larger the pump rate in frac treatment, the greater the net pressure within the fracture and the more significant the kinetic energy for fracture extension. In relation to the conditions for the target formation, an increase in slurry rate allows for a suitable increase in the sand ratio. This, in turn, enables an increase in proppant placement concentration within the fracture, thereby enhancing fracture quality. Similarly, increasing the pump rate can improve the effective stimulation reservoir volume. Furthermore, when encountering a natural fracture development zone, the artificial fracture will intersect with the natural fracture to form a complex fracture network. However, the current offshore fracturing capacity is generally limited to less than 5 m3/min due to the restrictions on offshore operating conditions.

3.2.3. Fracturing Scale

The fracturing scale has an important relationship with the length and width of fracture propagation in volumetric fracturing. It is generally believed that the larger the fracturing scale and the longer the hydraulic fracture length, the better the reservoir reconstruction effect. Micro-seismic monitoring of the Barnett Shale in North America shows that, the larger the reservoir volume, the higher the production. The amount of pumped fracturing fluid is directly related to the area of reconstruction. The greater the volume of fracturing fluid injected into the formation, the more intricate the morphology of fracture propagation and the longer the total length of the fracture network (e.g., Cipolla et al. 2008) [23]. For a low permeability reservoir, the fracture conductivity is not the main factor that influence the production. To create a large stimulation volume is much more important. The findings indicate that, as the volume of fracturing fluids and sands increase, the length of fracture, propped fractures, and transverse sweep width of fractures also increase. Consequently, the pattern of fracture expansion becomes more complicated. Currently, the volume of liquid used in block BZ ranges from 200 m3 per section to 350 m3 per section, and the amount of sand added in a single section is approximately 40 t~70 t. With the same displacement, an increase in the amount of liquid used and sand added leads to an increase in reached fracture length, supported fracture length, and transverse sweep width of fracture. Additionally, there is an increase in fracture reconstruction volume.

4. Construction of Combinatorial Weight Evaluation Model

Geological and engineering factors are used to construct the comprehensive influence factors of the reservoir, which are used as the key indicators to quantify the comprehensive sweetness of the reservoir, and to quantitatively characterize the reservoir quality. The evaluation process is shown in Figure 4. After the main geological and engineering factors are normalized, the combined weight coefficient of each factor is obtained by the grey correlation method and analytic hierarchy process, so as to obtain the comprehensive impact factor and establish its relationship with the yield and build the yield prediction model based on the combined weight.

4.1. Standardized Processing of Raw Data

The dimensions, effective ranges and orders of magnitude of different geological or engineering factors are very different. In order to make the data more comparable, range transformation is used to standardize the original data. The factors are categorized into positive factors and reverse factors. A positive factor signifies that production increases with the rise of a specific geological or engineering factor. Conversely, if an increase in the factor results in a decrease in output, it is considered a reverse factor. The higher the value of the positive factor the better, while the reverse factor represents a trend in the opposite direction.
For positive factors, standardize the i well after the j with respect to:
x i j ¯ = x i j min x i j max x i j min x i j
For the inverse factors:
x i j ¯ = max x i j x i j max x i j min x i j
In Equations (1) and (2), i = 1, 2,…, m; j = 1,2,…, n. After factor standardization, the index values are 0~1, the optimal value is 1, and the worst value is 0.

4.2. Model Construction

The weight is the relative importance of the factors’ contribution to the overall value, and its accuracy will directly affect the evaluation effect. Currently, there are numerous methods available for determining weight, each possessing unique characteristics and applicability. The commonly used methods to determine the weight coefficient include the correlation coefficient model and hierarchical analysis model, which have achieved good application results in different oil fields. The correlation coefficient model only considers the correlation between a single sample and the target production index, ignoring the potential correlation between different factors. However, geological or engineering factors are often intrinsically related to each other, so the links between different factors should be considered in the analysis. Therefore, we propose a comprehensive weight model that combines the grey correlation method with an importance correlation between factors.
The combined weight coefficient method aims to couple the two weight coefficients obtained by the grey correlation method and analytic hierarchy process, respectively. By coupling the two weight coefficients, the weight coefficients of each parameter can be corrected by the analytic hierarchy process on the basis of the grey correlation method to obtain a more accurate weight coefficient, i.e., a combined weight coefficient.
(1) Grey correlation method (e.g., Sun 2010) [27]
The grey correlation method is a straightforward and practical statistical analysis technique that utilizes the grey correlation degree as a quantitative index. It is employed to assess the correlation degree between a comparison sequence and a reference sequence. By comparing the geometric relationship between the comparison sequence and the reference sequence, the proximity of the comparison sequence to the reference sequence in the multi-factor is determined. A higher degree of proximity indicates a stronger correlation between the two sequences. First and foremost, it is essential to establish the reference sequence and comparison sequence. The production after fracturing serves as the reference sequence, while geological and engineering factors serve as the comparison sequence, as depicted in Equations (3) and (4):
X 0 = ( X 01 , X 02 , X 03 , X 0 j ) ,   where   j = 1 , 2 , 3 ,   m
X i = ( X i 1 , X i 2 , X i 3 , X i j ) ,   where   i = 1 , 2 , 3 ,   n
In Equations (3) and (4), X0 represents the reference sequence; represents the comparison sequence; m denotes the number of sample groups; n is the sequence number of the comparison sequence; and Xij refers to the j th data of the i th comparison sequence.
After obtaining each sequence, dimensionless processing is necessary to standardize the influencing factors, as illustrated in Equation (5). Then, the correlation coefficient and correlation degree between the reference sequence and the comparison sequence are calculated. This involves determining the correlation coefficient and correlation degree between the production after fracturing and various factors, as shown in Equations (6) and (7). Subsequently, the weight coefficient of each factor is obtained, representing the influence degree of a certain factor on the production after fracturing, as demonstrated in Equation (8). Following these steps, the gray weight coefficients of each influencing factor are obtained and presented in Table 3.
X i j = X i j 1 m j = 1 m X i j
r X 0 , X i = ( A 2 + ξ A 1 ) / i j + ξ A 1
r o i = 1 m i = 1 n r X 0 , X i
W A ( i ) = r o i i = 1 m r o i
In Equations (5)–(8), Δij represents the difference sequence between the i-th comparison sequence and the reference sequence. A1 denotes the largest difference, while A2 indicates the minimum difference. r[X0, Xi] stands for the correlation coefficient between the i-th comparison sequence and the reference sequence. ξ is the resolution coefficient, typically set at 0.5. roi signifies the correlation degree between the i-th comparison sequence and the reference sequence. WA(i) represents the weight of influencing factors calculated using the grey correlation method.
(2) Analytic Hierarchy Process(AHP) (e.g., Wang et al. 2023) [28]
The Analytic Hierarchy Process (AHP) is a straightforward and effective method for addressing multi-criteria decision-making problems. It can quantitatively analyze those problems, which are not easy to quantify. First and foremost, it is essential to construct a judgment matrix by subjectively assessing the importance of each factor and representing the judgment results with numerical values, as illustrated in Table 4. Following normalization, the weight of each factor can be determined, as shown in Equations (9) and (11). Through the aforementioned steps, the weight coefficient of the analytic hierarchy process is derived, as presented in Table 5.
a i j ¯ = a i j j = 1 n a i j
W B ( i ) = i = 1 m a i j ¯ m
In Equations (9) and (10), a _ ij represents the element in the normalized judgment matrix, while WB(i) denotes the weight of each influencing factor.

4.3. Construction of Combinatorial Weight Model

The weight coefficients of each parameter, obtained through the grey correlation method and analytic hierarchy process, are multiplied respectively and then normalized to obtain the final weight coefficient. This approach effectively avoids the influence of a single weight on the evaluation results and allows for the determination of combined weight coefficients for the final influencing factors according to Equation (11). The final results for BZ oilfield are presented in Table 6.
W ( i ) = W A i W B i i = 1 6 W A i W B i
In Equation (11), W(i) represents the weight coefficient of the combination method, WA(i) represents the weight coefficient of each influencing factor obtained by the grey correlation method, and WB(i) represents the weight coefficient of each influencing factor obtained by the analytic hierarchy process.
As illustrated in Figure 5, the permeability exhibits the highest weight among various influencing factors, indicating a significantly greater influence compared to other factors. The average combined weight of geological factors is calculated to be 0.178664, while that of engineering factors is 0.154669. This suggests that geological factors have a higher impact on production than engineering factors.

5. Result Analysis and Discussion

5.1. Application

Based on the fracturing statistical data of BZ oilfield, the post-frac production serves as the benchmark for evaluating the effectiveness of the fracturing process. The impact of each factor was analyzed based on the weighted coefficients calculated for each combination of influencing factors (as shown in Table 7). The dual sweet spot index Z is calculated by multiplying the normalized influence factors and the combined weight coefficients (as shown in Equation (12)). This factor can be utilized to characterize the degree of influence of multiple factors on the final production.
Z = i = 1 6 W i · α i
In Equation (12), α1 represents the normalized permeability; α2 stands for the normalized porosity; α3 reflects the normalized horizontal in situ stress difference; α4 represents the normalized fracturing scale; α5 represents the normalized slurry rate; while α6 represents the normalized brittleness index.
According to Table 7, a regression model is established to fit the comprehensive influence factor and the production after fracturing, as shown in Figure 6. The analysis of Figure 5 indicates a strong correlation between the production after fracturing and dual sweet spot index Z. There is a strong positive correlation between Z and production. In other words, the higher the Z value, the better the production.
Q = 4188.22 Z 2 + 3223.77 Z 512.15
In Equation (13), Q represents post-frac production. On the one hand, it can be utilized to assist in the selection of frac zones. On the other hand, the dual sweet spot index can be employed for production prediction.
Based on Equation (12), relevant geological and engineering data of fractured wells in the target area were collected. The dual sweet spot index of each individual well was calculated, and the results were then imported into the geological model. The dual sweet spot distribution in the BZ oilfield is determined through interpolation, as illustrated in Figure 7. It is evident that the optimal fracturing zones are situated on the northern and southern sides of the block. The research findings can assist the oilfield company in making more informed decisions when selecting fracturing zones.

5.2. Verification

According to the productivity fitting regression model (Equation (13)), the production prediction of fractured wells (as shown in Table 8) is conducted, with a maximum error of 5%. Higher accuracy is achieved when the error is less than 5%, while lower accuracy is indicated when the error exceeds this threshold. The analysis of the post-fracturing fracturing effect on a single well revealed a strong correlation between post-fracturing production and the comprehensive influence factor Z. Based on Equation (13), the production of each well was predicted and compared with actual production, resulting in an 80% coincidence rate. Clearly, the geological and engineering factors chosen through the combined weight analysis method exhibit a strong correlation with production rates. The model demonstrates high reliability for the BZ oilfield, providing a crucial foundation for optimizing fracturing plans in the BZ area in subsequent stages.

6. Conclusions

Because of the insufficient data and oil company confidentiality policy, six parameters were selected for the analysis. The grey correlation method and analytic hierarchy process were introduced to calculate the combined weight. The quantitative correlation between geological and engineering characteristics was established. Subsequently, an evaluation method based on comprehensive analysis of the dual sweet spot is proposed. The conclusions are as follows:
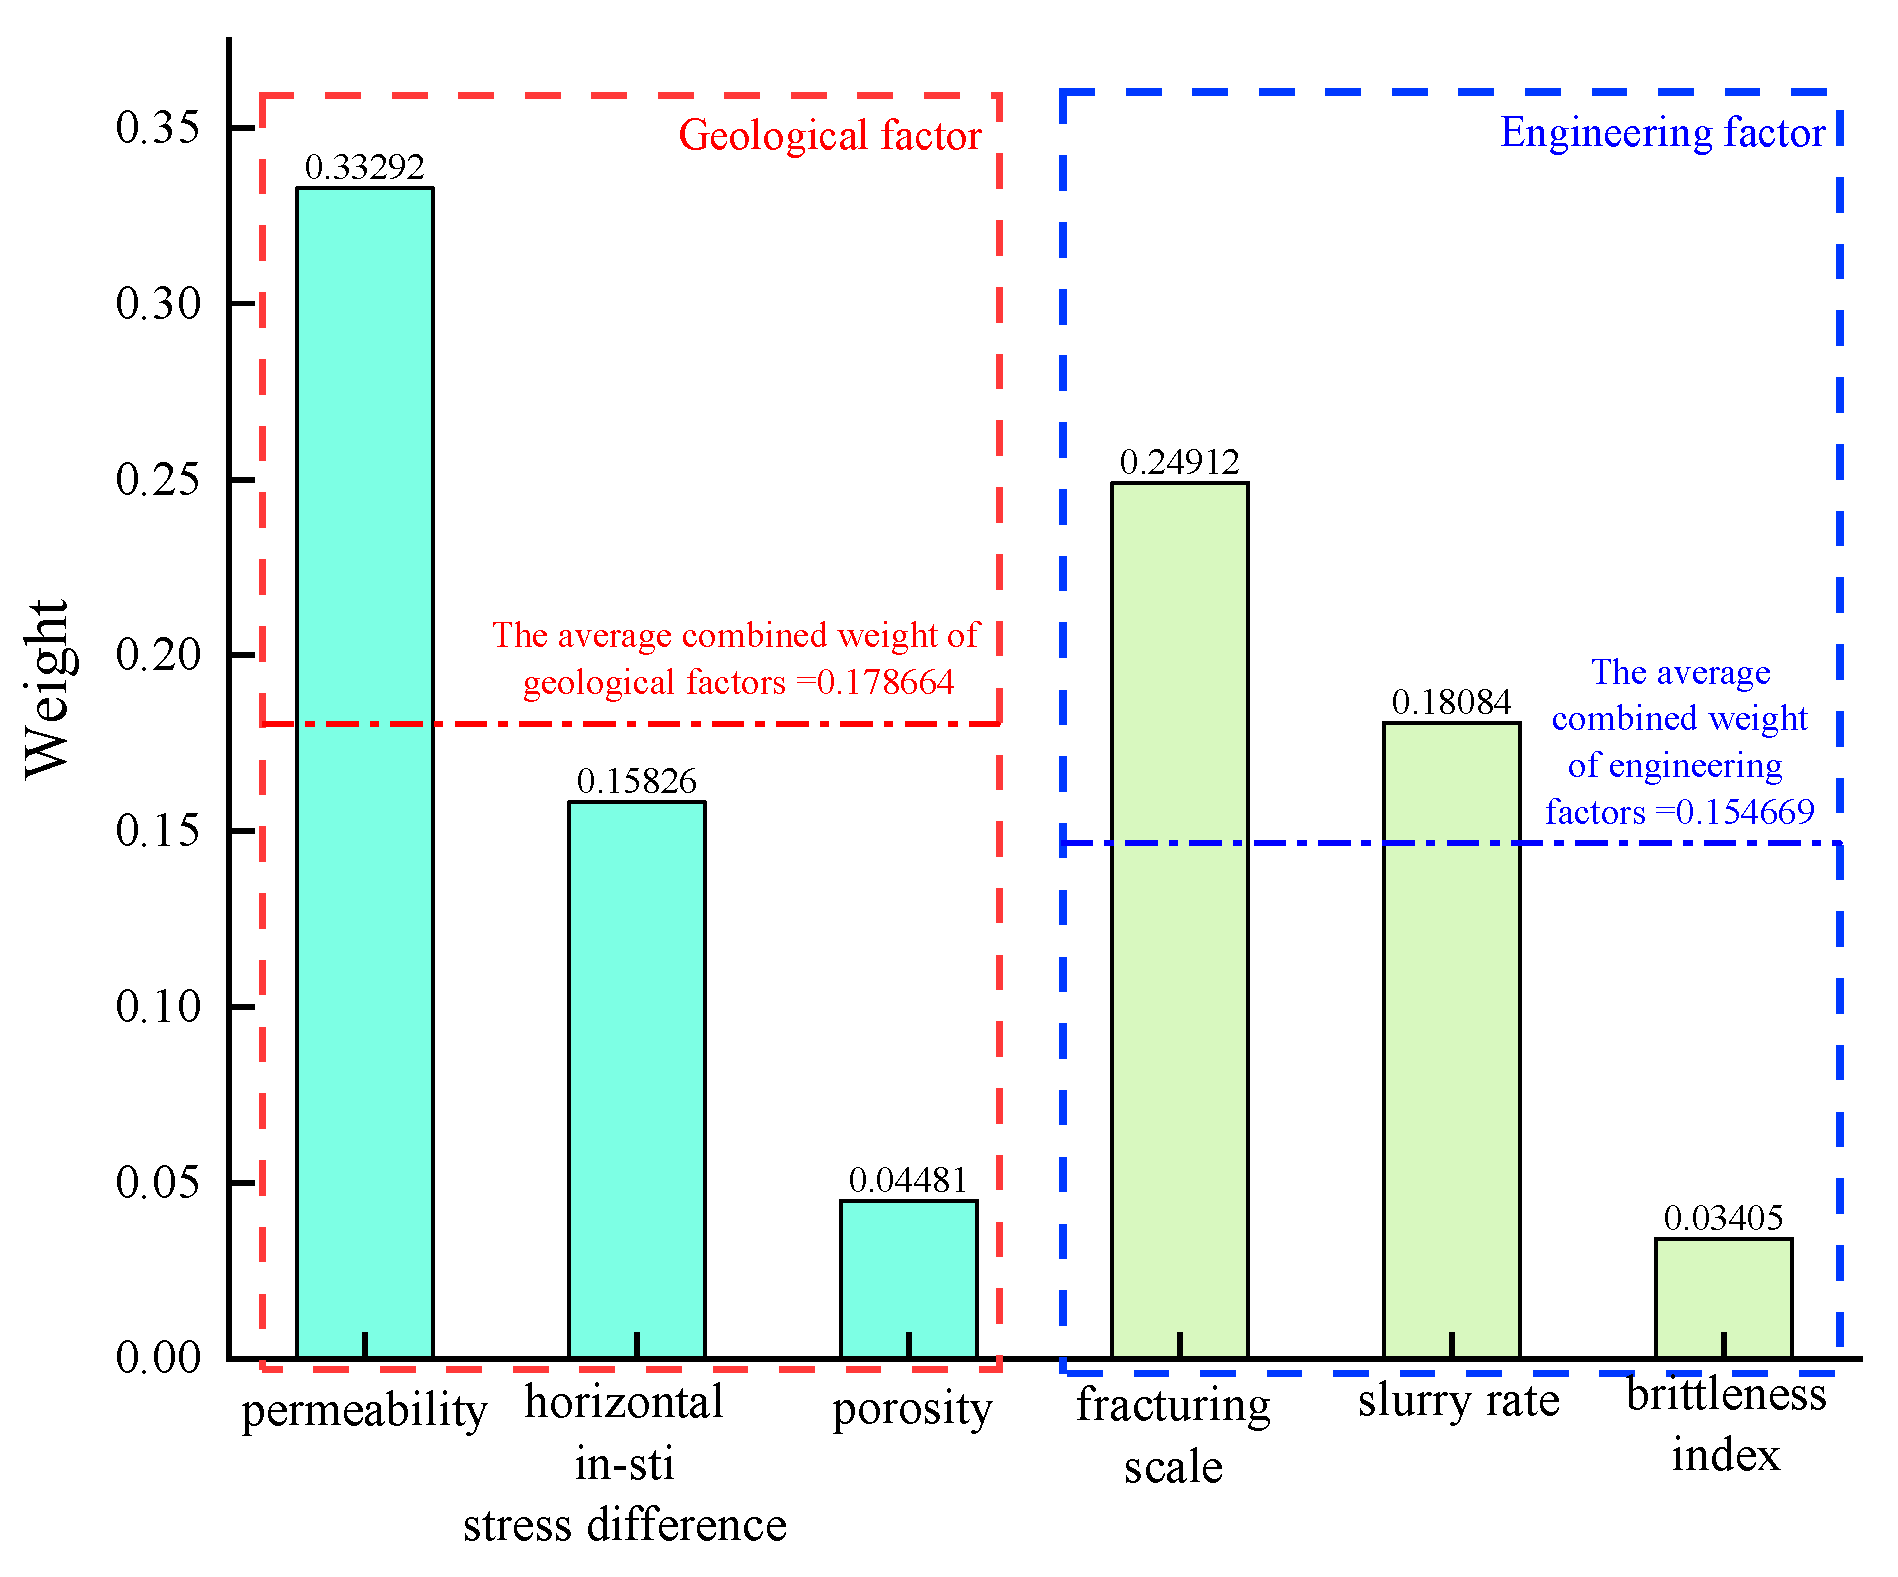
  • Based on combination weights, the most influential factors on post-frac production, are, successively, permeability, fracturing scale, slurry rate, horizontal principal stress difference, porosity, and brittleness index. The corresponding weight coefficients are 0.33, 0.25, 0.18, 0.16, 0.045 and 0.034.
  • The geological factors have a greater impact on production than engineering factors.
    The average weight of geological factors is 0.18, while that of engineering factors is 0.15.
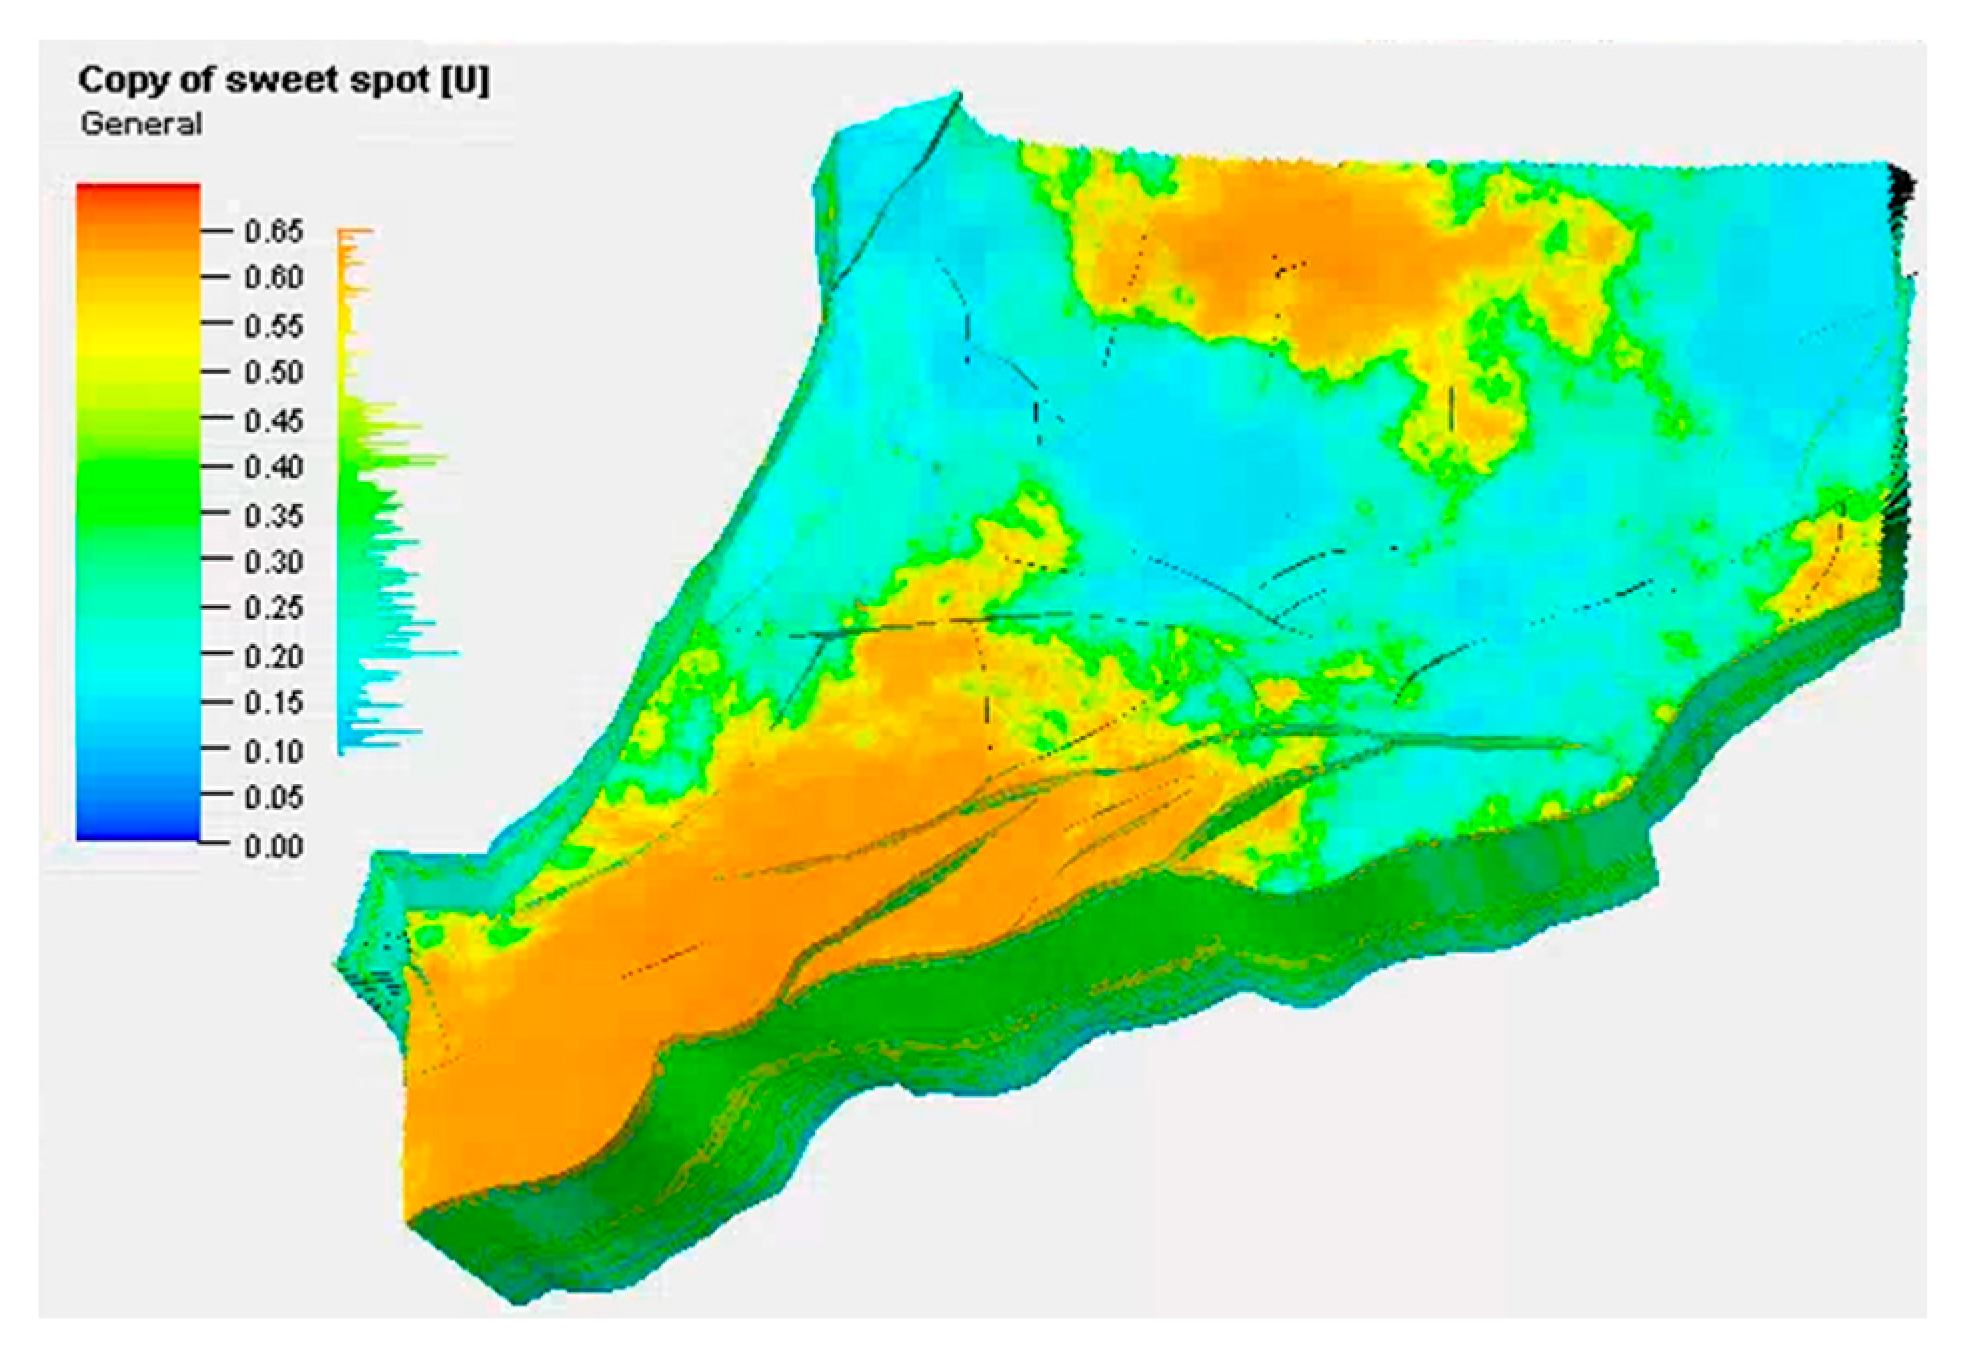
  • There is a strong correlation between production and the dual sweet spot index Z which the correlation coefficient is 0.96. The anastomosis rate is 80% after comparing predicted and actual production from each well.
  • To achieve better fracturing effects, it is recommended to select the fracturing spots in formations with good reservoir physical properties. Additionally, the fracturing treatment design should consider the limit of equipment and string performance while increasing fluid and sand volumes for optimal fracturing scale.

Author Contributions

Conceptualization, C.P.; methodology, M.J.; software, Y.L.; validation, Z.W.; formal analysis, J.W.; investigation, B.Z. and Y.Z.; resources, M.J.; data curation, M.J.; writing—original draft preparation, Y.L.; writing—review and editing, Y.L.; visualization, Y.L.; supervision, M.J. All authors have read and agreed to the published version of the manuscript.

Funding

This research was funded by the CNOOC Research Institute Co., Ltd. under grant number KJGG2022-0701.

Data Availability Statement

Data available on request from the authors.

Conflicts of Interest

Authors Mao Jiang, Chengyong Peng and Jianshu Wu were employed by the company CNOOC Research Institute Co., Ltd. The remaining authors declare that the research was conducted in the absence of any commercial or financial relationships that could be construed as a potential conflict of interest.

References

  1. Sun, F.; Xu, W.; Jiang, W.; Zhen, Q. Progress and prospect of reservoir reconstruction technology for low-permeability and unconventional offshore oil reservoirs in China. China Offshore Oil Gas 2024, 36, 109–116. [Google Scholar]
  2. Xu, C.; Lai, W.; Zhang, X.; Zhang, J. New progress in oil and gas exploration of CNOOC and thinking about future exploration. China Offshore Oil Gas 2023, 35, 1–12. [Google Scholar]
  3. Guo, X.; Liu, Q.; Wang, Z.; Wang, X.; Han, L.; Wang, J. Optimal design method of the scale of pressure and fracture plugging in the offshore unconsolidated sandstone reservoir. J. Xi’an Shiyou Univ. (Nat. Sci. Ed.) 2022, 37, 53–59. [Google Scholar]
  4. Shi, J.; Jin, Z.; Liu, Q.; Fan, T.; Gao, Z. Sunspot cycles recorded in Eocene lacustrine fine-grained sedimentary rocks in the Bohai Bay Basin, eastern China. Glob. Planet. Chang. 2021, 205, 103614. [Google Scholar] [CrossRef]
  5. Vikara, D.; Remson, D.; Khana, V. Machine learning-informed ensemble framework for evaluating shale gas production potential: Case study in the Marcellus Shale. J. Nat. Gas Sci. Eng. 2020, 84, 103679. [Google Scholar] [CrossRef]
  6. Sui, L.; Ju, Y.; Yang, Y.; Yang, Y.; Li, A. A quantification method for shale fracability based on analytic hierarchy process. Energy 2016, 115, 637–645. [Google Scholar] [CrossRef]
  7. Zhang, C.; Xia, F.; Xia, Y.; Zhou, X. Comprehensive evaluation of compressibility of tight sandstone reservoirs based on analytic hierarchy process. Drill. Prod. Technol. 2021, 44, 61–64. [Google Scholar]
  8. Zeng, F.; Cheng, X.; Guo, J.; Tao, L.; Chen, Z.; Wang, M. Hybridising Human Judgment, AHP, Grey Theory, and Fuzzy Expert Systems for Candidate Well Selection in Fractured Reservoirs. Energies 2017, 10, 447. [Google Scholar] [CrossRef]
  9. Chen, Y.; Wang, L.; Li, F.; Zhang, L.; Yang, F.; Ma, Z.; Gao, Z. Prediction of low-rank coalbed methane development constituency based on random forest algorithm. Pet. Reserv. Eval. Dev. 2022, 12, 596–603+616. [Google Scholar]
  10. Han, Q.; Zhang, X.; Shen, W. Lithology identification based on gradient lifting decision tree (GBDT) algorithm. Bull. Mineral. Petrol. Geochem. 2018, 37, 1173–1180. [Google Scholar]
  11. Wang, Y.; Zhou, Y.; Yuan, H.; Li, X.; Ma, L.; Lu, C. Analysis of influencing factors of fracturing effect in Bin 425 block based on grey correlation method. Well Test. 2021, 30, 73–78. [Google Scholar]
  12. Qu, Z.; Huang, D.; Mao, D.; Li, H.; Yang, Y.; Yan, J.; An, S. Analysis of influencing factors of fracturing effect of low permeability gas reservoir based on grey correlation method. J. Northwest Univ. (Nat. Sci. Ed.) 2014, 44, 603–609. [Google Scholar]
  13. Nie, L.; Zhou, D.; Guo, X.; Hui, J.; Bian, J.; Gao, L. The influencing factors of fracturing in low permeability gas reservoir are analyzed by grey correlation method. Fault Block Oil Gas Field 2013, 20, 133–136. [Google Scholar]
  14. Xia, H.; Wang, H.; Zhao, H. Identification of Shale Gas Geological “sweet spot” by Logging Multi-parameter two-vector Method. Nat. Gas Ind. 2017, 37, 36–42. [Google Scholar]
  15. Liao, D.; Lu, B.; Chen, Y. Evaluation method of shale gas geological sweet spot: A case study of Jiaoshiba shale gas field in Sichuan Basin. Acta Pet. Sin. 2019, 40, 144–151. [Google Scholar]
  16. Zhang, W.; Xiao, Z.; Yi, H.; Jiang, M.; Zhu, Y. Application of “double sweet spot” identification method for tight sandstone reservoirs in Paleogene reservoirs in Lufeng area, eastern South China Sea. Geophys. Prospect. Pet. 2024, 63, 217–228. [Google Scholar]
  17. Liu, S.; Chen, G.; Lou, Y.; Zhu, L.; Ge, D. A novel productivity evaluation approach based on the morphological analysis and fuzzy mathematics: Insights from the tight sandstone gas reservoir in the Ordos Basin, China. J. Pet. Explor. Prod. Technol. 2019, 10, 1263–1275. [Google Scholar] [CrossRef]
  18. Li, Y.; Zhang, Y.; Liu, G.; Yu, J.; Yang, Z. Analysis of factors affecting production of coalbed methane Wells after fracturing based on combination weights. Spec. Oil Gas Reserv. 2020, 27, 115–120. [Google Scholar]
  19. Tang, S.; Zhu, W.; Zhang, J. Productivity analysis and optimization of fracturing parameters of transitional phase shale gas reservoirs in Zhongmu Block. Chin. J. Eng. 2020, 42, 1573–1587. [Google Scholar] [CrossRef]
  20. Wang, Q.; Deng, Q.; Zhou, J.; Zhang, Y.; Geng, H. Evaluation of the development effect of fractured horizontal Wells in offshore ultra-low permeability reservoirs: A case study of Well area 5, Member 3 of Sha-3 Member, BZ Oilfield, Bohai Sea. Complex Hydrocarb. Reserv. 2022, 15, 74–77+104. [Google Scholar]
  21. Qiao, J.; Zeng, J.; Jiang, S.; Feng, S.; Feng, X.; Guo, Z.; Teng, J. Heterogeneity of reservoir quality and gas accumulation in tight sandstone reservoirs revealed by pore structure characterization and physical simulation. Fuel 2019, 253, 1300–1316. [Google Scholar] [CrossRef]
  22. Liu, S. A New Fracability Evaluation Approach for Shale Reservoirs Based on Multivariate Analysis: A Case Study in Zhaotong Shale Gas Demonstration Zone in Sichuan, China. Acta Geol. Sin. (Engl. Ed.) 2019, 93, 1005–1014. [Google Scholar] [CrossRef]
  23. Cipolla, C.L.; Warpinski, N.R.; Mayerhofer, M.J.; Lolon, E.P.; Vincent, M.C. The relationship between fracture complexity, reservoir properties, and fracture treatment design. SPE Prod. Oper. 2008, 25, 438–452. [Google Scholar]
  24. Tarasov, B.; Potvin, T.Y. Universal criteria for rock brittleness estimation under triaxial compression. Int. J. Rock Mech. Min. Sci. 2013, 59, 57–69. [Google Scholar] [CrossRef]
  25. Rickman, R.; Mullen, M.; Petre, J.; Grieser, B.; Kundert, D. A practical use of shale petrophysics for stimulation design optimization: All shale plays are not clones of the Barnett shale. In Proceedings of the SPE Annual Technical Conference and Exhibition, Denver, CO, USA, 21–24 September 2008. [Google Scholar]
  26. Zhang, D.; Ranjith, P.G.; Perera, M.S.A. The brittleness indices used in rock mechanics and their application in shale hydraulic fracturing: A review. J. Pet. Sci. Eng. 2016, 143, 158–170. [Google Scholar] [CrossRef]
  27. Sun, F. The method of grey relational degree analysis and its application are briefly discussed. Sci. Technol. Inf. 2010, 17, 880–882. [Google Scholar]
  28. Wang, H.; Liu, Y.; Zhang, X.; Gou, W.; Yu, R.; Sun, Y.; Liang, P.; Kang, L. Evaluation of integrated geological engineering of shale gas reservoir desserts based on analytic Hierarchy process: A case study of well X area in Haiba area of Taiyang Shale Gas Field, Zhaotong Shale Gas Demonstration Zone. Earth Sci. 2023, 48, 92–109. [Google Scholar]
Figure 1. Geological characterization of Sha3 Member in BZ oil field.
Processes 12 01830 g001
Figure 2. Distribution of porosity and permeability in BZ oilfield. (a) Distribution of porosity; (b) Distribution of permeability.
Processes 12 01830 g002
Figure 3. Distribution of porosity and permeability in BZ oilfield.
Processes 12 01830 g003
Figure 4. BZ block comprehensive sweet spot evaluation process.
Processes 12 01830 g004
Figure 5. Comparison of combined weight coefficients of each factor.
Processes 12 01830 g005
Figure 6. Relationship between comprehensive influence factors and post-frac production of 5 fractured wells in BZ oilfield.
Processes 12 01830 g006
Figure 7. Dual sweet spot distribution in BZ oilfield.
Processes 12 01830 g007
Table 1. Stratification data sheet.
FormationMemberBottom Depth (m)Thickness (m)Petrographic Summary
ShahejieSha 1 3717.0/3342.071.0/69.0It is a large set of gray mudstone segments. Two layers of phosphor siltstone are seen below.
Sha 2 3797.0/3420.080.0/78.0Fluorescent fine sandstone and mudstone are interbedded with unequal thickness.
Sha 3 4134.0/3746.62337.0/326.62Mudstone is interbedded with fine sandstone, fluorescent fine sandstone and fluorescent pebbly sandstone with varying thickness.
Table 2. Results of in situ stress test in BZ area.
Core GroupLithologyWellDepth
(m)
Maximum Horizontal In Situ Stress (MPa)Minimum Horizontal In Situ Stress (MPa)Vertical Principal Stress (MPa)
1sandstoneBZ-B43725.7567.258.486.8
23721.3668.658.988.5
33738.0369.459.189.3
43727.2367.557.987.5
53728.1567.458.587.7
6mudstone3648.1269.258.985.6
73650.2168.358.485.5
83710.2467.959.286.7
93700.5468.458.786.1
103690.3669.057.686.4
Table 3. Grey weight coefficient.
Influencing FactorThe Weight of Grey
Correlation Method
Sort
(From Large to Small)
Geological factorPermeability (mD)0.1536712
Porosity (%)0.1386366
Horizontal in situ stress difference (MPa)0.1407345
Engineering factorBrittleness index0.153
Slurry rate (m3/min)0.1487764
Fracturing scale0.2681821
Table 4. Evaluation table of the importance of influencing post-fracturing production indicators.
Importance IndexRepresentationImportance IndexRepresentation
1Equally important1/3Slightly unimportant
3Slightly important1/5Rather unimportant
5Quite important1/7Obviously not important
7Obvious importance1/9Absolutely not important
9Absolutely importance1/2, 1/4, 1/6, 1/8The middle of two adjacent judgments
2, 4, 6, 8The middle of two adjacent judgments//
Table 5. Analytic hierarchy process weight coefficient.
Influencing FactorThe Weight of AHP Sort
(From Large to Small)
Geological factorPermeability (md)0.3130631
Porosity (%)0.0467785
Horizontal in situ stress difference (MPa)0.1626824
Engineering factorBrittleness index0.0327446
Slurry rate (m3/min)0.1758493
Fracturing scale0.2688842
Table 6. Combined weight.
Influencing FactorCombined WeightSort
(From Large to Small)
Geological factorPermeability (md)0.3329221
Porosity (%)0.0448135
Horizontal in situ stress difference (MPa)0.1582574
Engineering factorBrittleness index0.0340516
Slurry rate (m3/min)0.180843
Fracturing scale0.2491182
Table 7. Comprehensive influencing factors and post-fracturing production of 5 fracturing wells in BZ oilfield.
WellC13C37HC38HA22A4
Comprehensive influencing factor Z0.33920.36810.3496260.3599320.232443
Actual production (m3/d)9710110211511
Table 8. Production forecast and error.
WellActual Production
(m3/d)
Forecast Production
(m3/d)
Error
(%)
Satisfy or Not
C139799.469692.55%
C37H101107.02555.97%×
C38H102103.00220.98%
A22115105.59928.17%
A41110.90340.88%
Disclaimer/Publisher’s Note: The statements, opinions and data contained in all publications are solely those of the individual author(s) and contributor(s) and not of MDPI and/or the editor(s). MDPI and/or the editor(s) disclaim responsibility for any injury to people or property resulting from any ideas, methods, instructions or products referred to in the content.

