Article

Skin Factor Test Experiment of the Combined Structure of Blind and Screen Pipes

1
CNOOC (China) Limited Shenzhen Branch, Shenzhen 518000, China
2
Hubei Key Laboratory of Oil and Gas Drilling and Production Engineering, Yangtze University, Wuhan 430100, China
3
Western Research Institute, Yangtze University, Karamay 834000, China
*
Author to whom correspondence should be addressed.
Processes 2024, 12(9), 1835; https://doi.org/10.3390/pr12091835
Submission received: 18 July 2024 / Revised: 16 August 2024 / Accepted: 20 August 2024 / Published: 28 August 2024
(This article belongs to the Section Materials Processes)

Abstract

:
During the drilling process of horizontal wells in offshore oil fields, when encountering highly clayey shale or sandy shale sections, a common practice is to use a combination of blank pipes and screen pipes in the completion column to isolate high clay content layers. This helps prevent significant clay blockage in the screen pipes or wellbore, thereby reducing production loss. However, when blank pipes cannot effectively isolate clayey or sandy shale sections, the migration of clay content can lead to screen pipe blockage, adversely affecting production capacity. Given the current lack of evaluation methods for the impact of combined blank and screen pipe completion columns on production capacity, an experiment was designed to evaluate the skin factor of the completion column with a combination of blank and screen pipes. Through the calculation of the skin factor, the variation patterns of the skin factor for completion columns with blank and screen pipes under different conditions were obtained. These findings were then applied to a production evaluation. The research results revealed the following: (1) As the proportion of blind pipes increases, the skin factor of the combination of blind pipes and screen pipes in the completion tubing also increases. Excessive blind pipe ratios reduce production capacity. (2) In cases where the annular space is not completely filled, the influence of the blind pipe proportion on production capacity can be negligible. However, when the annular space is 100% filled, a higher proportion of blind pipes and silt content results in a larger skin factor, which leads to reduced production. In the application of the XH horizontal well case study, using the calculated model for the skin factor of the combination of blind pipes and screen pipes in the completion tubing established in this paper, it was determined that when the annular space was not completely blocked and 20 m of blind pipes were not placed in the designated position, the impact on the production index was 0.73%. However, when the blind pipes were not placed in the designated position for 100 m, the impact on the production index reached 1.47%. The method developed in this paper provides theoretical guidance for the optimization of completion tubing in mudstone and sandy mudstone sections and for production evaluation.

1. Introduction

In the XH Oilfield Block of the South China Sea, there are many interbedded layers of mudstone and sand–mudstone, and drilling through these layers is often required during the drilling of horizontal wells. To effectively prevent the collapse of sand–mudstone, mudstone, or highly silty formations, which could lead to the blockage of the circulation path, blind pipes are commonly used to isolate these interbedded layers of mudstone and sand–mudstone. This helps prevent a significant amount of silt from entering the wellbore, clogging the screens, and reducing production capacity [1,2,3,4,5,6]. However, the extensive use of blind pipes to isolate mudstone and sand–mudstone formations can increase operational time. Sometimes, during operations, some blind pipes may have difficulty reaching their designated positions and, as a result, they may fail to effectively isolate the mudstone. Thus, the intended purpose of isolating the mudstone by lowering blind pipes may not be achieved [7,8,9,10,11]. It is generally believed that if blind pipes cannot reach their designated positions, this will inevitably affect production capacity. However, there is currently no definitive conclusion on this matter. The impact of the blind pipe segment on production capacity needs to be evaluated when the blind pipes and screens are considered together. However, there is currently no established theoretical framework for evaluating the impact of blind pipe and screen combinations on production capacity [12,13,14,15]. The variation in production capacity caused by blind pipe and screen combinations mainly depends on changes to the external sand permeability of blind pipes and screens, as well as the degree of screen clogging.
Although there have been numerous studies on the permeability of completion columns, such as the experiments conducted by Deng Jingen and others [8], which established experimental setups to investigate the impact of different particle sizes on the sand control pipe’s permeability and fitted the corresponding screen pipe permeability for different particle sizes. Dong Changyin and others [9] studied turbulent pressure drop and skin factor calculation methods for perforated completion columns and sand control completion columns. Through skin factor analysis, they obtained production capacity values for different completion methods. Li Bo, Wu Xiaodong, and others [10] conducted a study on the fluid flow process around the wellbore under the precision sand filter completion method. They established a skin factor calculation model under reservoir pollution and conducted a sensitivity analysis on various influencing factors such as pore density, pore phase angle, and fracture penetration ratio. Geng Wenshuang and others [11], based on modern unstable well testing theory, developed a multi-stage horizontal fracturing well testing interpretation software, which considers the fracture characteristics and skin contamination effects of horizontal low-permeability reservoir wells, and achieved good results in field applications. Trond Unneland [12] tested the permeability of screen pipes, and the results showed that even when the screen pipes were blocked, the permeability could still range from 924 mD to 35,126 mD. They provided an empirical formula for calculating screen pipe permeability. Zuo Meiling and others [13] established the relationship between water saturation and the relative permeability of the oil phase. They used a numerical simulation model of oil layers to study the impact of drilling fluid viscosity and pressure difference on the damage to horizontal well reservoirs. Gao Dingxiang and others [14] optimized the skin factor parameters of fracture screens, selected the fracture shape using a skin factor model, and conducted an analysis of the effects of fracture width, length, and density on resistance strength and skin factor. They established an optimized design model for fracture screen completion. Lin Haichun and others [15], based on Joshi’s conventional well sand control capacity modeling, considered factors such as different formation parameters and completion methods in offshore oil fields. They considered various secondary sand control methods, adjusted the skin damage coefficient during drilling, completion, and workover processes, and established a model for predicting the production capacity of horizontal wells in offshore oil fields. However, these studies mainly focus on screen pipe permeability and skin factor, without providing a calculation method for the annular permeability and annular skin factor of a completion column with a combination of blank and screen pipes [16,17,18]. It is also impossible to calculate the impact of a combination of blank and screen pipes on production capacity. Blank pipes for sand control may experience blockage during the running-in process or during operation, leading to reduced production capacity. On the other hand, screen pipes for sand control pose the risk of solid particles entering the screen holes, causing screen pipe blockage, which may also affect production capacity and lead to operational interruptions. Therefore, a combined completion sand control method can compensate for the shortcomings of a single completion with blank or screen pipes. Therefore, the author designed an experimental setup for testing annular permeability and skin factors for the combination of blind pipes and screens in well completion. Various tests on the permeability of different conditions of blind pipe and screen pipe combinations in well completion were conducted. Based on these experiments, the skin factors for the combination of blind pipes and screens in well completion were determined. The analysis of production capacity patterns for different conditions of blind pipe and screen pipe combinations in well completion was also carried out. This study provides a theoretical basis for predicting the production capacity of a combination of blind pipes and screens in well completion tubing.

2. Experimental Method

The main purpose of blind pipe completion is to isolate mudstone sections. If blind plates are not used at the connection point between the blind pipe and screen pipe, the silt particles from the mudstone section, upon collapse, can move with the fluid, leading to blockages in the annular space and screen pipe, resulting in reduced production capacity. Whether the silt particles in the screen pipe and blind pipe combination affect production capacity depends on the annular skin factor of the blind pipe and screen pipe combination and the skin factor of the screen pipe itself. There have been numerous experiments on the skin factor of the screen pipe itself, which are not elaborated here. This paper primarily focuses on the testing of the annular permeability and skin factors of blind pipes and screen pipes.

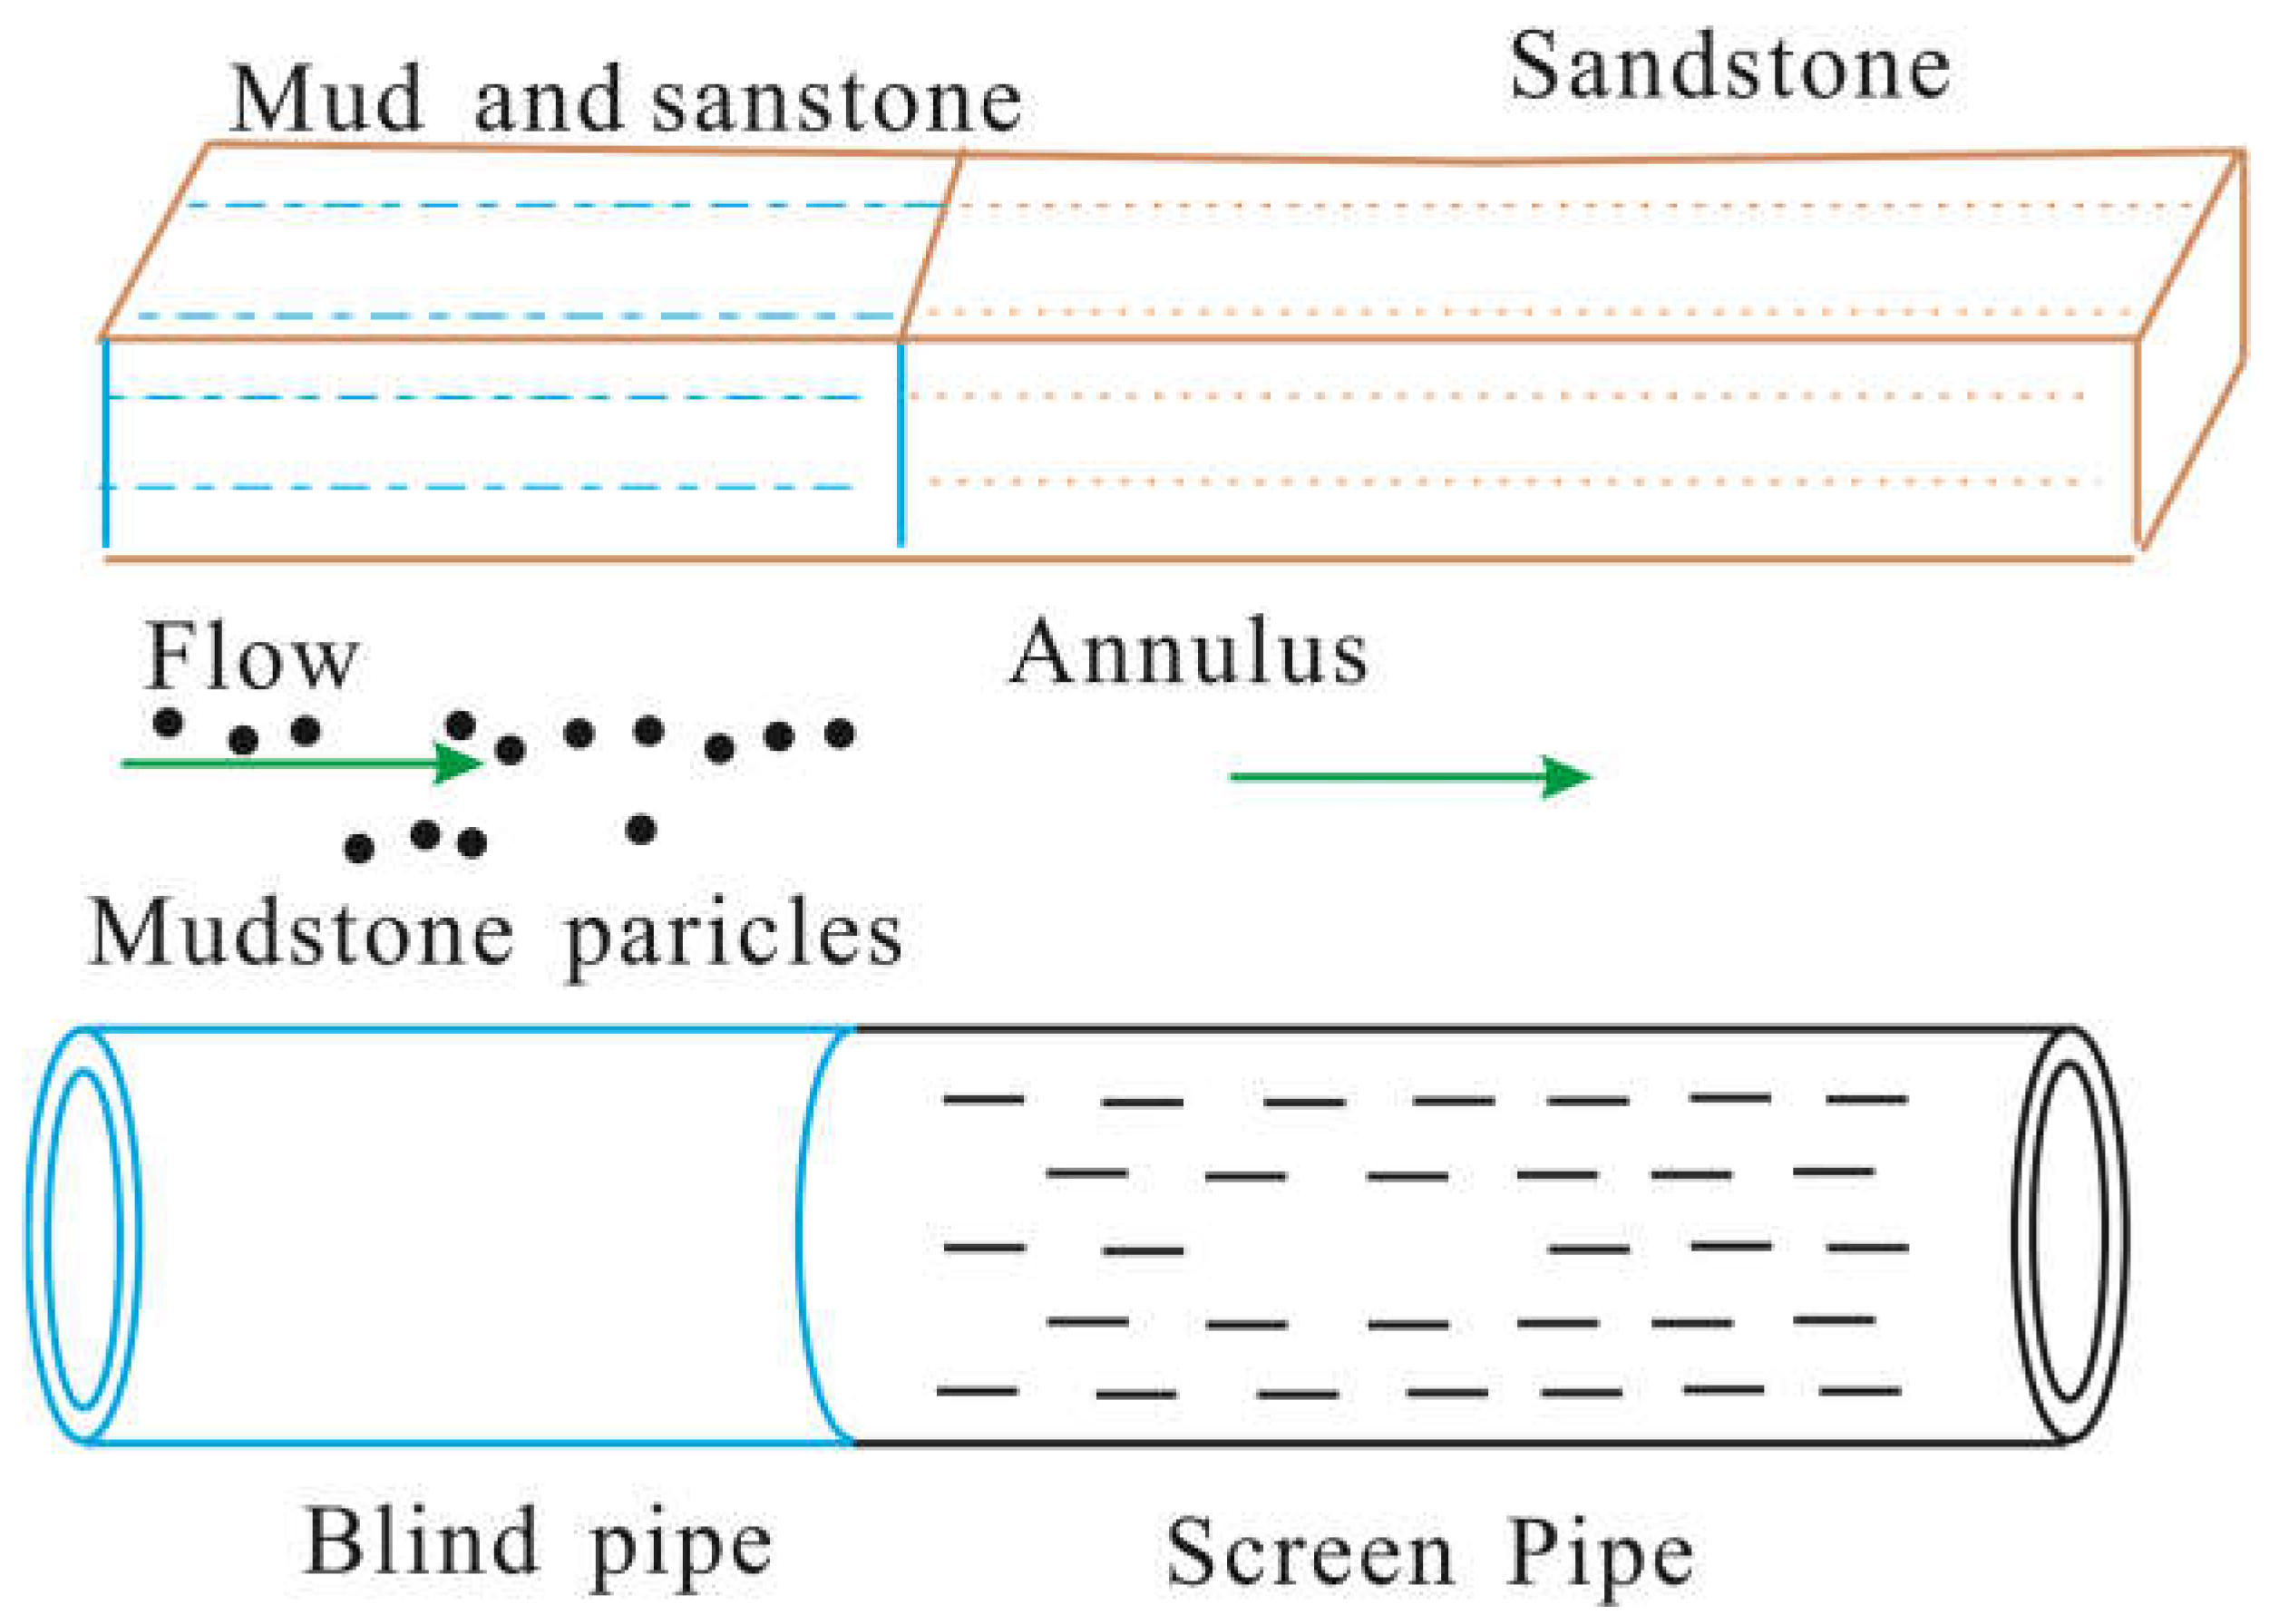
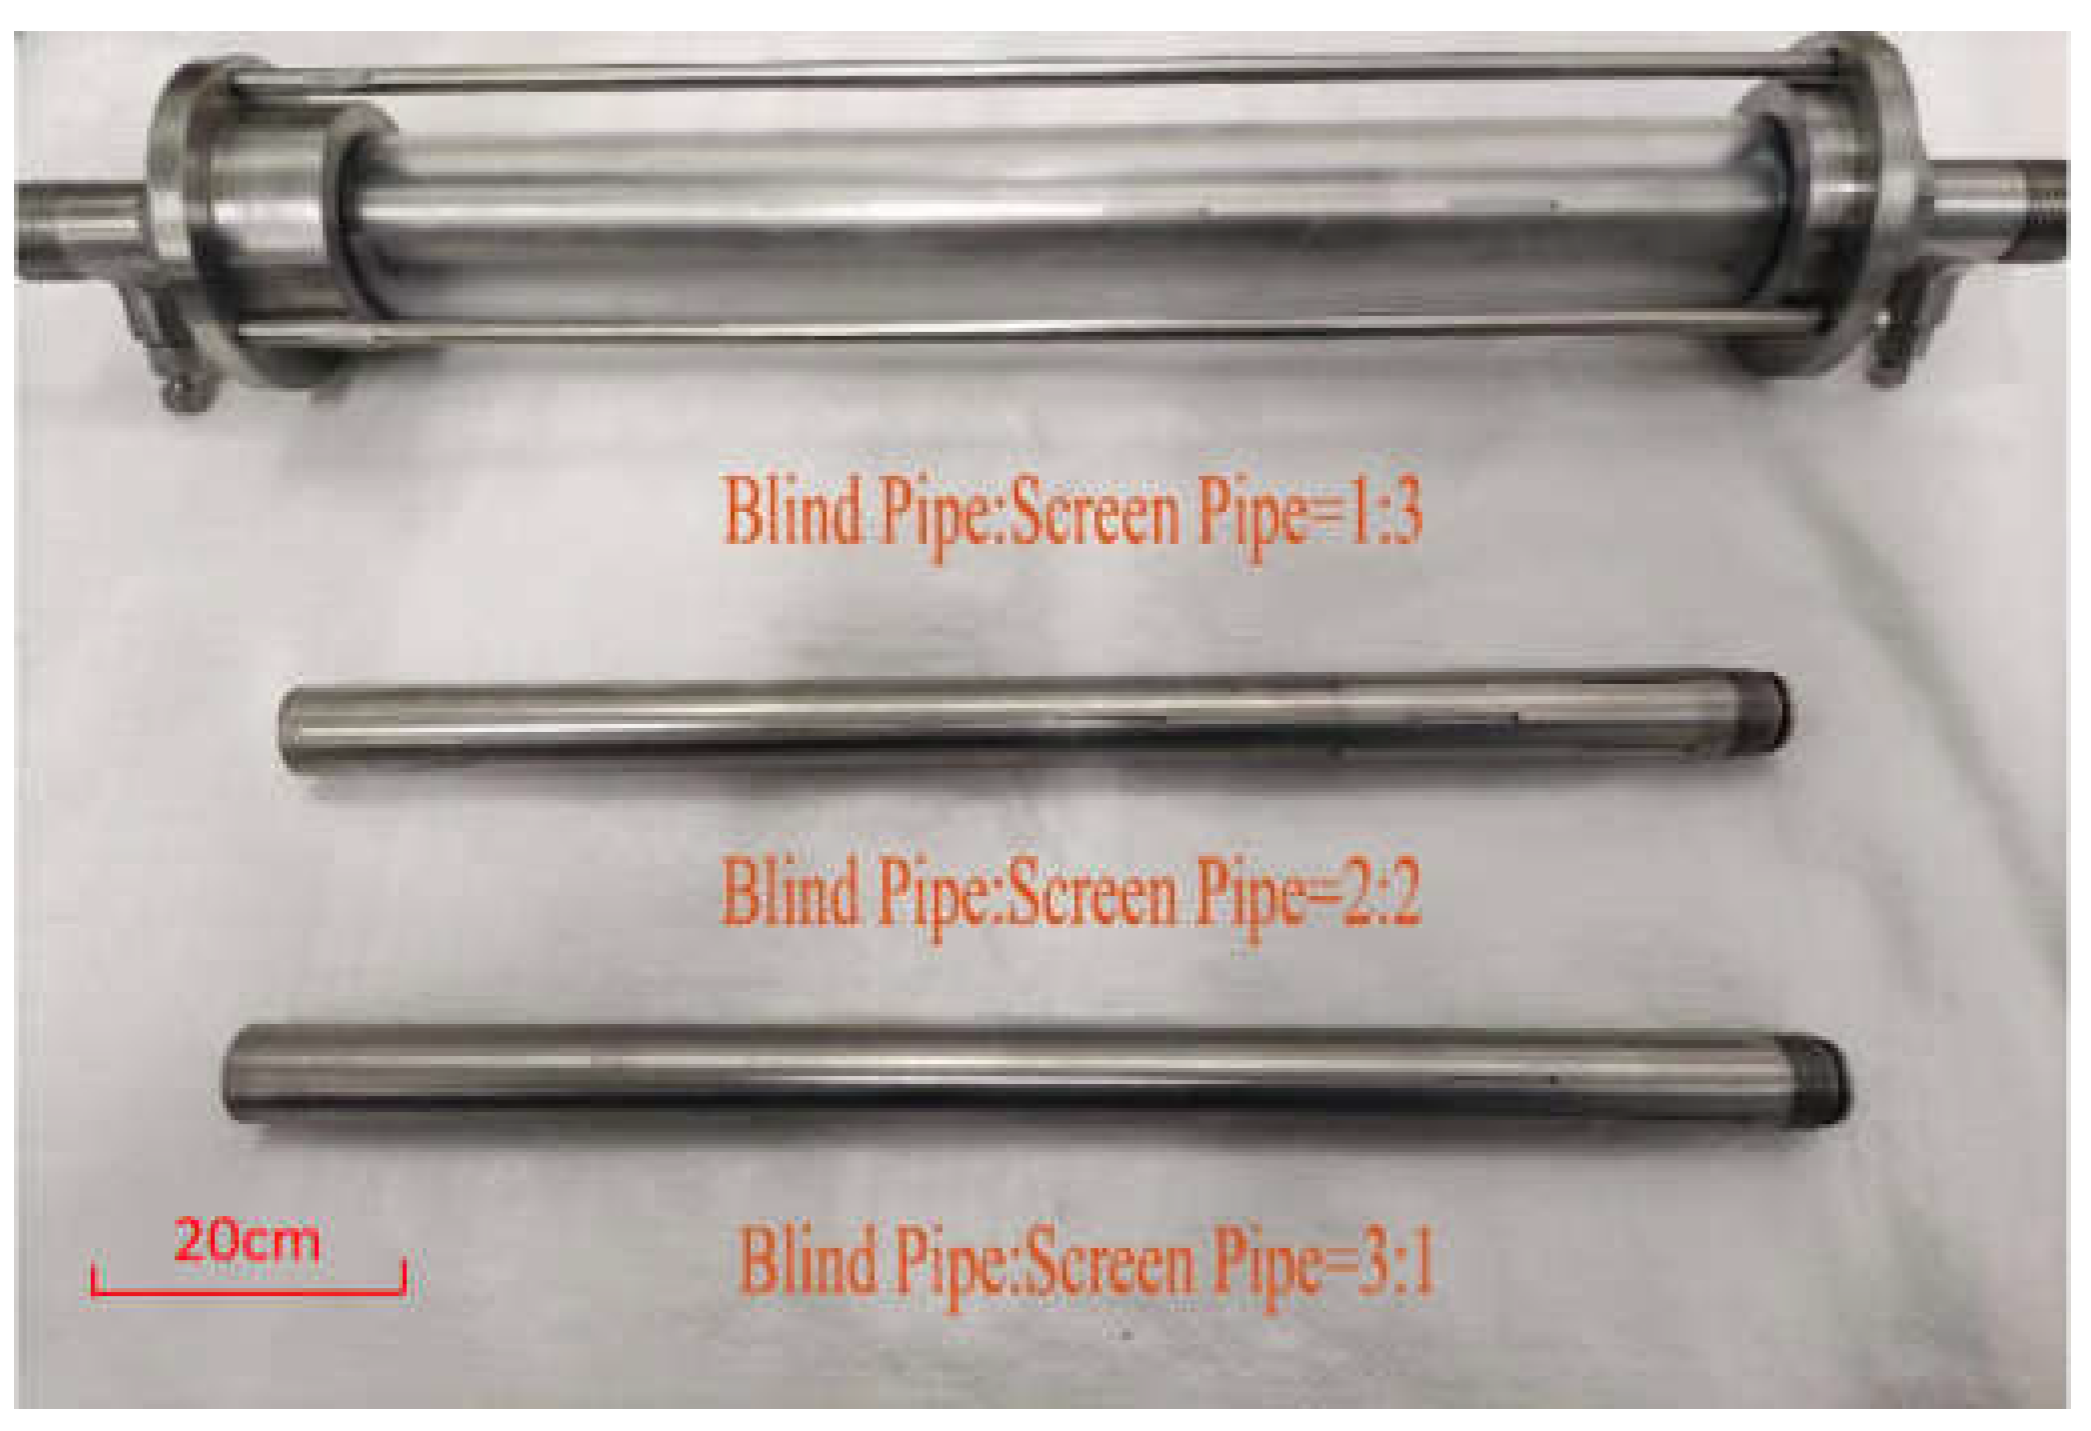
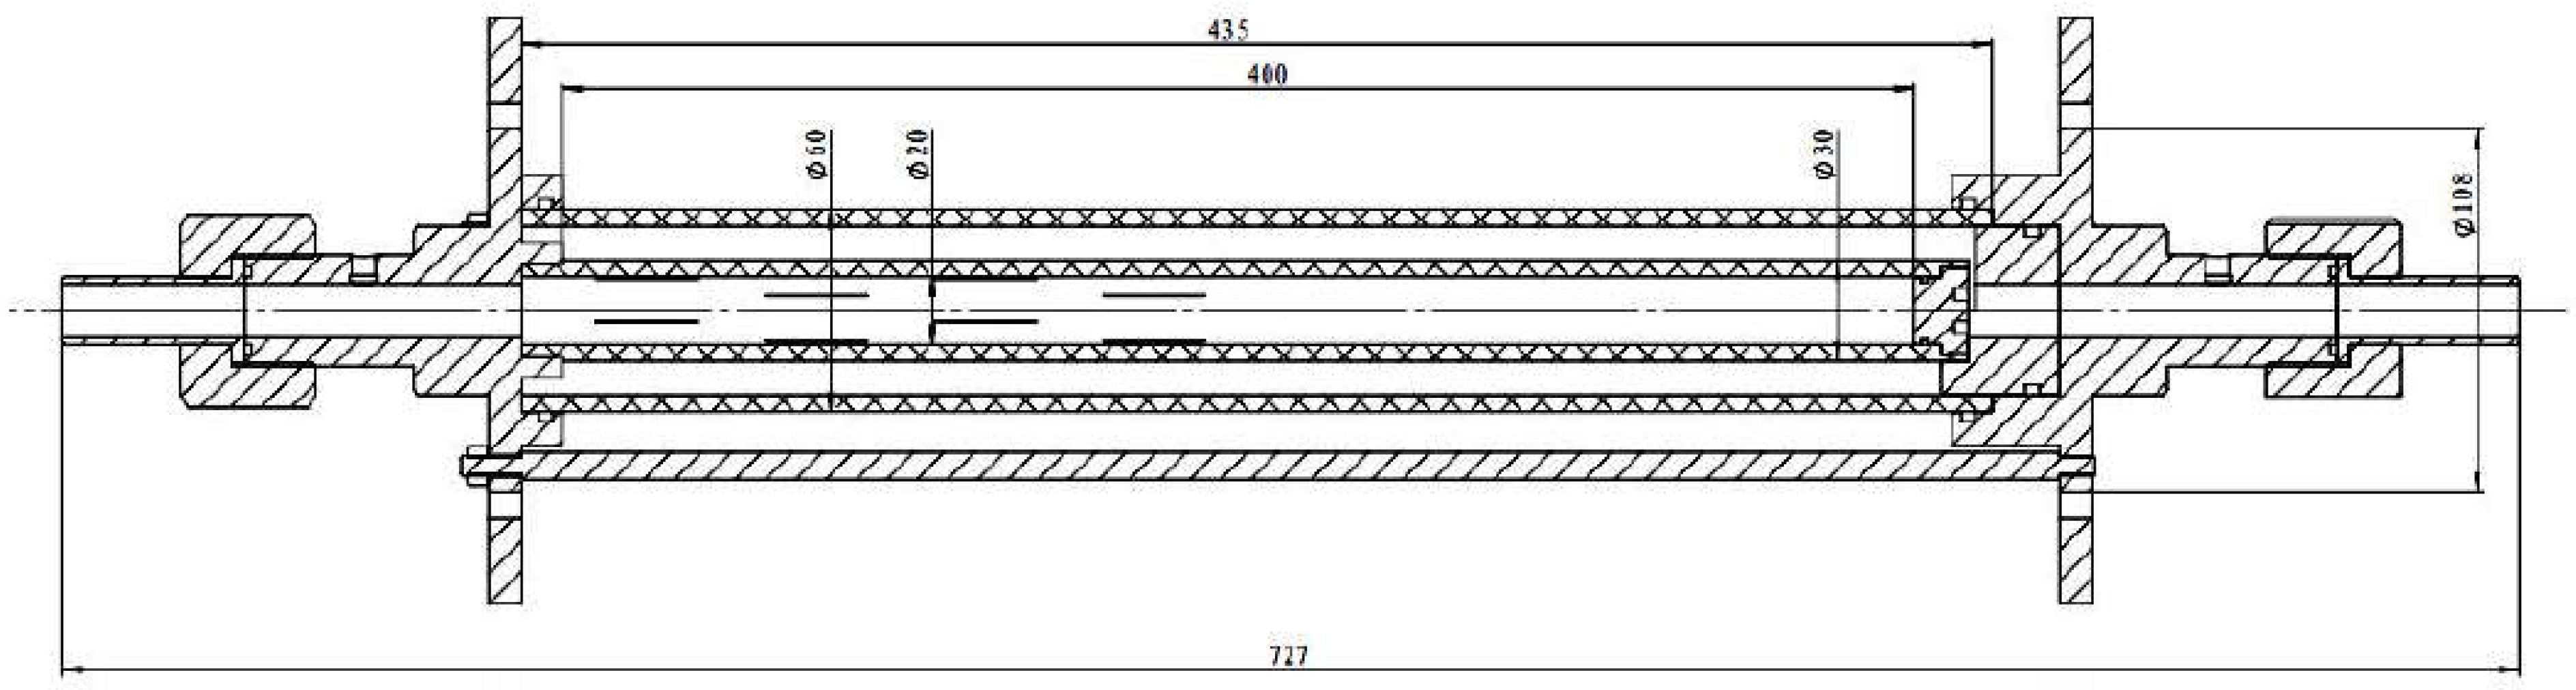
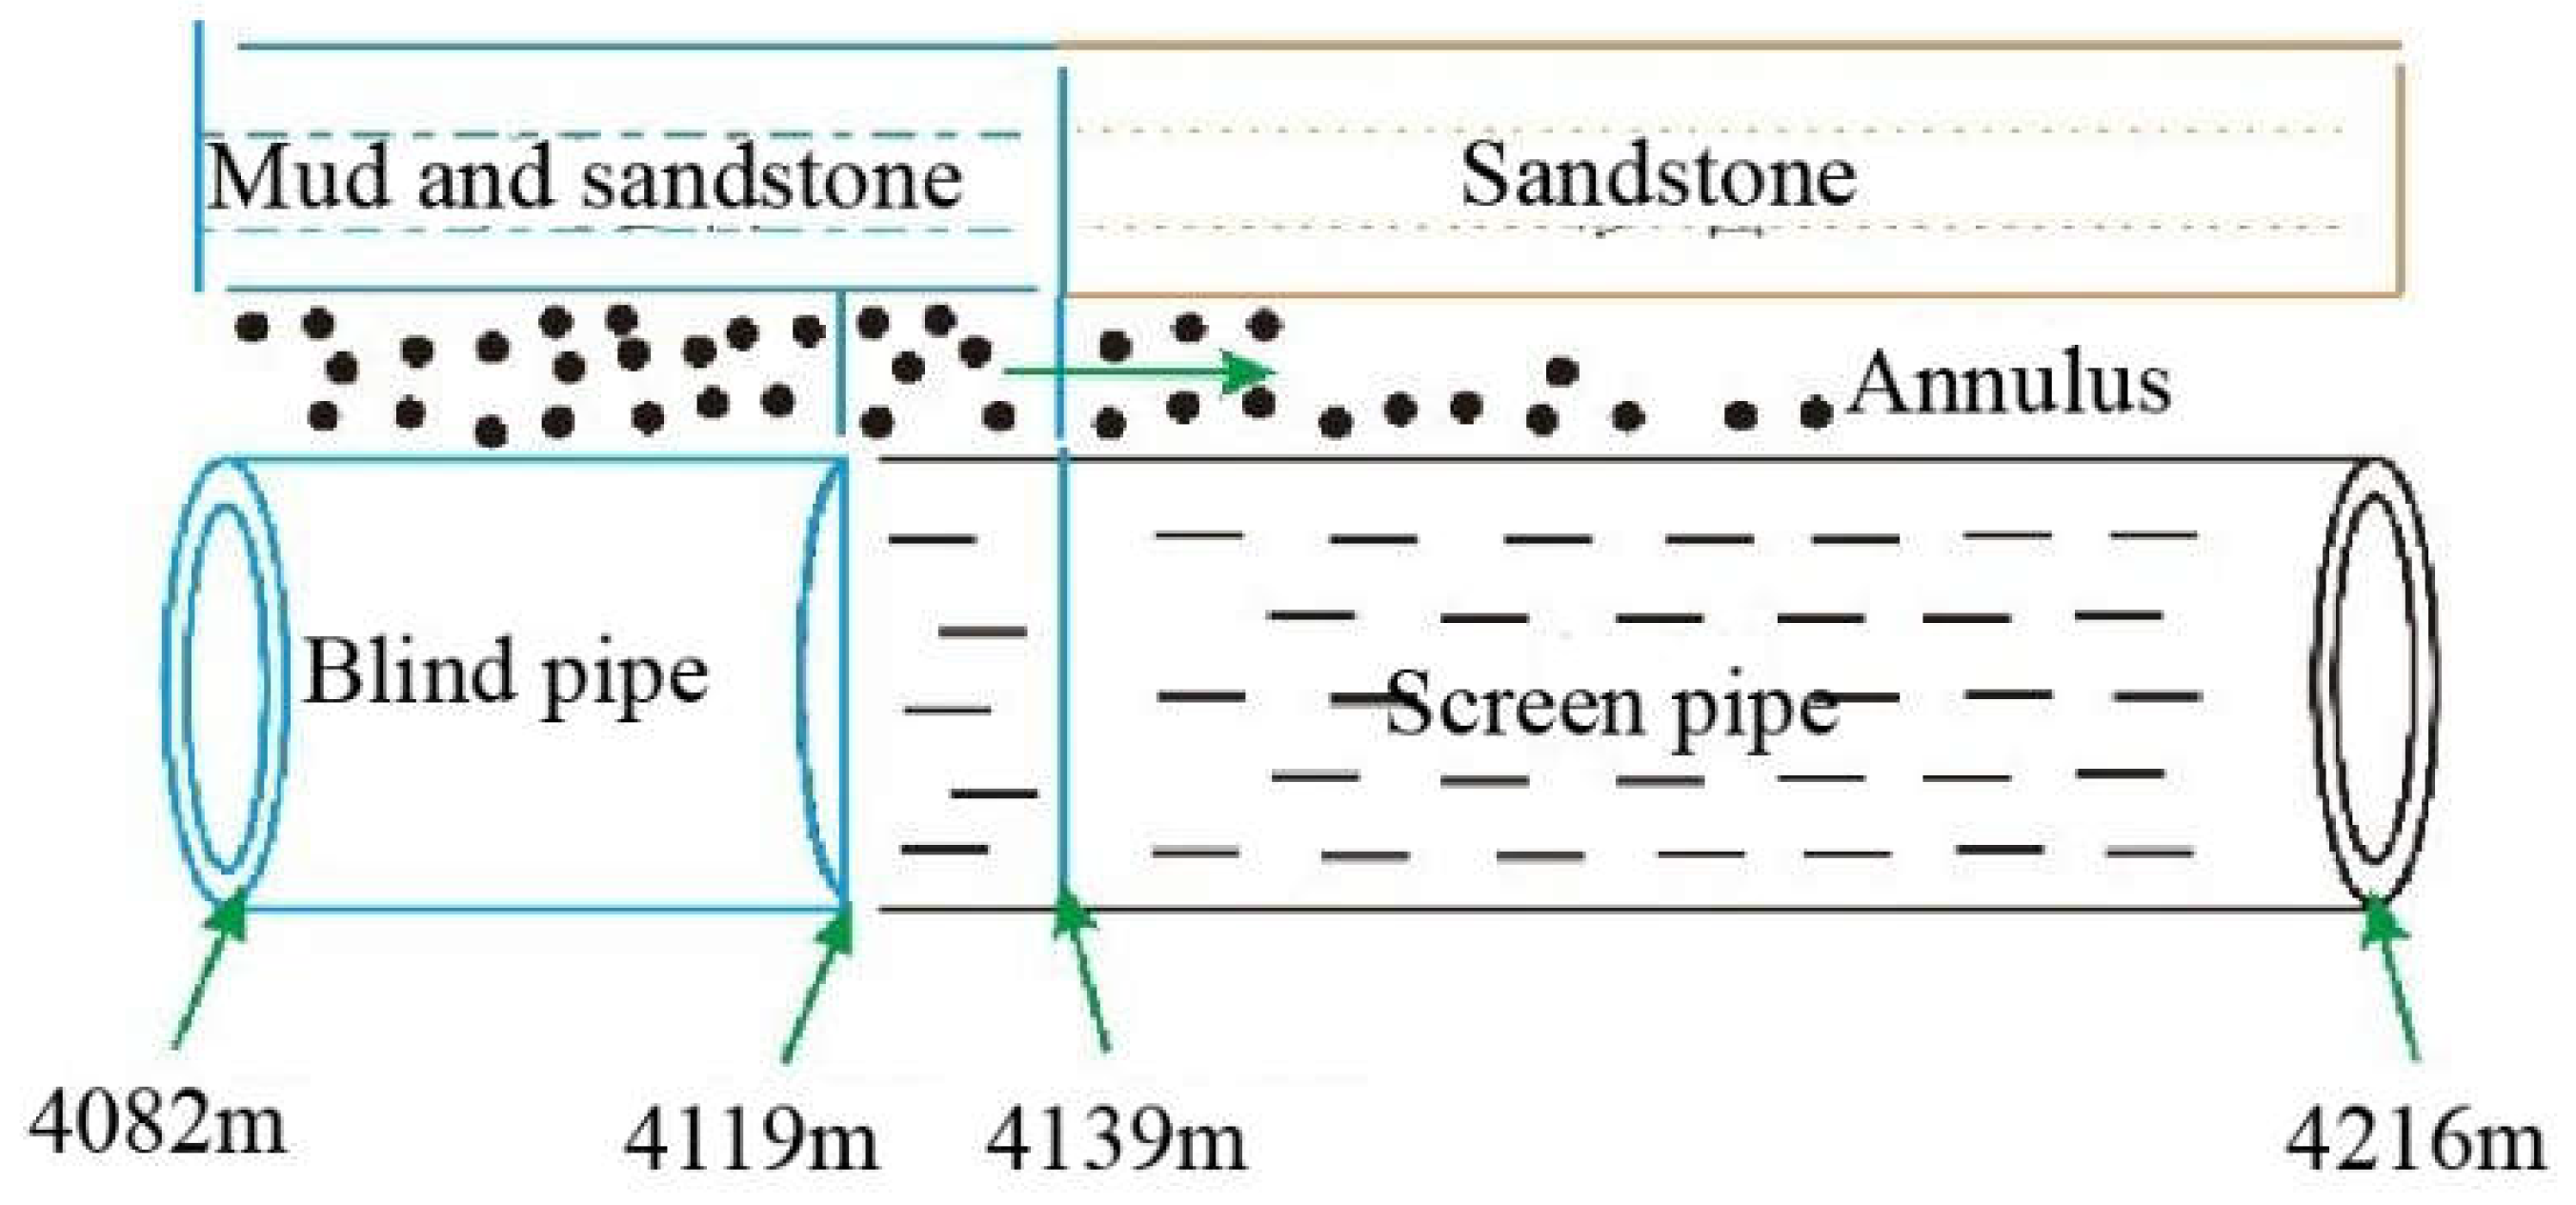
2.1. Blind Pipe and Screen Pipe Combination Structure

The research subject of the paper is the completion tubing of the XH Oilfield Block in the South China Sea. In this block, the open-hole wellbore has a diameter of 8.5 inches (216 mm), and the outer diameter of the blind pipe and screen pipe combination used is 6.625 inches (168 mm), with an inner diameter of 5.921 inches (150 mm). The configuration of the blind pipe and screen pipe combination and the isolated geological layers are illustrated in Figure 1.

2.2. Experimental Principles and Equipment

According to the structure of the blind pipe and screen pipe combination in a scaled-down experimental model based on similarity criteria, the experimental model is scaled at a ratio of 2:1 compared to the actual tubing model. Following the design method, the open-hole section is made from transparent organic glass, with an inner diameter of 108 mm in the physical model. The physical model of the blind pipe and screen pipe combination has outer and inner diameters of 84 mm and 75 mm, respectively, and a total length of 400 mm. To study the impact of the blind pipe and screen pipe proportions on annular permeability and skin factors, three different proportions of blind pipes and screen pipes were designed. These proportions have length ratios of blind pipe to screen pipe as follows: 1:3, 2:2, and 3:1, as shown in Figure 2.
The permeability testing of the combination structure of a completion column with blank and screen pipes adopts the conventional permeability testing method. The blank and screen pipes are treated as a single entity, with the entrance end of the internal diameter portion of the blank pipe sealed, allowing the experimental fluid to flow only through the annulus. The specific experimental conditions and requirements are outlined in Table 1.
The permeability testing of the blind pipe and screen pipe combination tubing structure is conducted using traditional permeability testing methods. In this approach, the blind pipe and screen pipe are treated as a single unit. The entrance end of the blind pipe section is blocked off, allowing the experimental testing fluid to only flow through the annular space. The annular permeability of the blind pipe and screen pipe combination tubing structure is calculated using the classical permeability formula [14]:
k p a c = Q μ Δ L A Δ p
In the equation: k p a c is the annular permeability, mD; Q is the flow rate through the annular cross-section under; Δ p certain pressure differential a during the experimental process, cm3/s; is the viscosity of the test fluid, mPa · s; Δ L is the total length of the blind pipe and screen pipe, cm; A is the annular cross-sectional area between the blind pipe and screen pipe, cm2; Δ p is the pressure differential measured at both ends of the annular space, 10−1 MPa.
To obtain the permeability k p a c , input it into Equations (2)–(4) to calculate the skin factor S p a c for the blind pipe and screen pipe combination. The calculation for the skin factor S p a c is as follows [13,15]:
S p a c = 0 . 536 K h K v L Δ p q o B o μ o
In the equation: K h —horizontal permeability, mD; K v —vertical permeability, mD; L—the length of the horizontal well in meters, m; B 0 —fluid volume coefficient, dimensionless; q 0 —flow rate through the annular section under a certain pressure drop. μ 0 —the oil viscosity, mPa · s; Δ p —additional pressure drop when crude oil flows through the reservoir’s sand accumulation layer, which is calculated as follows:
Δ p = μ o B o Δ L 0.5877 k p a c A q o + 4.468 × 10 13 λ ρ B o 2 Δ L A 2 q o 2
In the equation: ρ —fluid density, kg/m3; Δ L —thickness of the reservoir’s sand accumulation layer, m; λ —turbulence coefficient; A —seepage area of the well wall. The calculation formulas are as follows:
λ = 1.47 × 10 7 0.3048 k p a c 0.55
A = c D p 2 4 × D en × L p
Δ L = d 1 d 2 2
In the equations: Den—screen density; L p —screen length, m; d 1 , d 2 are the borehole, straight hole, and screened outside diameter, respectively.
I have made the following modifications to this section: The experimental process is shown in Figure 3, and the apparatus consists of four main systems. Monitoring System: This includes pressure sensors, pressure difference sensors, and flow meters. Its main function is to monitor pipeline pressure, pressure difference, and flow to prevent pump pressure from exceeding the maximum load of the well, thus avoiding accidents. Pressurized Liquid Supply Circulation System: This comprises a variable frequency motor, polymer diaphragm pump, return pipeline, safety valve, and liquid–sand mixing tank. The motor and polymer diaphragm pump provide power for the circulation pipeline, the return pipeline prevents pump pressure overload to ensure experimental safety, and the liquid–sand mixing tank stores liquid and thoroughly mixes sand and liquid to prevent a large amount of sand from entering the diaphragm pump and damaging the diaphragm. Data Acquisition and Processing System: This includes a computer and data collector, primarily responsible for collecting real-time data, adjusting pump frequency in a timely manner, and obtaining better experimental data. Wellbore Simulation System: This mainly refers to the blind pipe–screen pipe combination annular particle transport structure. This part is the most important structure of the device, consisting of a simulated wellbore, a blind pipe, and a slotted screen pipe in three-column groups. This section is designed with transparent organic glass for clear observation of the movement and accumulation of particles in the annular space of the blind pipe and screen pipe. The specific dimensions of the inner and outer diameters of the blind pipe–screen pipe combination column are shown in Figure 4. The structure includes an organic glass wellbore, three different combinations of blind pipe–slotted screen pipe sand control columns, and a clamping device. The structure is 50 cm long, with a simulated wellbore outer diameter of 60 mm, blind and screen pipe diameters of 30 mm, an annular size of 10 mm, and a maximum pressure capacity of 5 MPa.

2.3. Experimental Materials and Experimental Conditions

Based on the analysis of formation rock particle size and mud content, it was determined that quartz sand with a particle size distribution between 250 μm and 300 μm would be used in the experiments, and montmorillonite would be used to simulate mud content.
This experiment primarily focuses on studying the variation patterns of the annular permeability of the blind pipe and screen pipe combination completion tubing concerning three aspects: the ratio of blind pipe and screen pipe lengths, the proportion of annular accumulated gravel, and the proportion of mud content. The experimental settings are as follows:
(1)
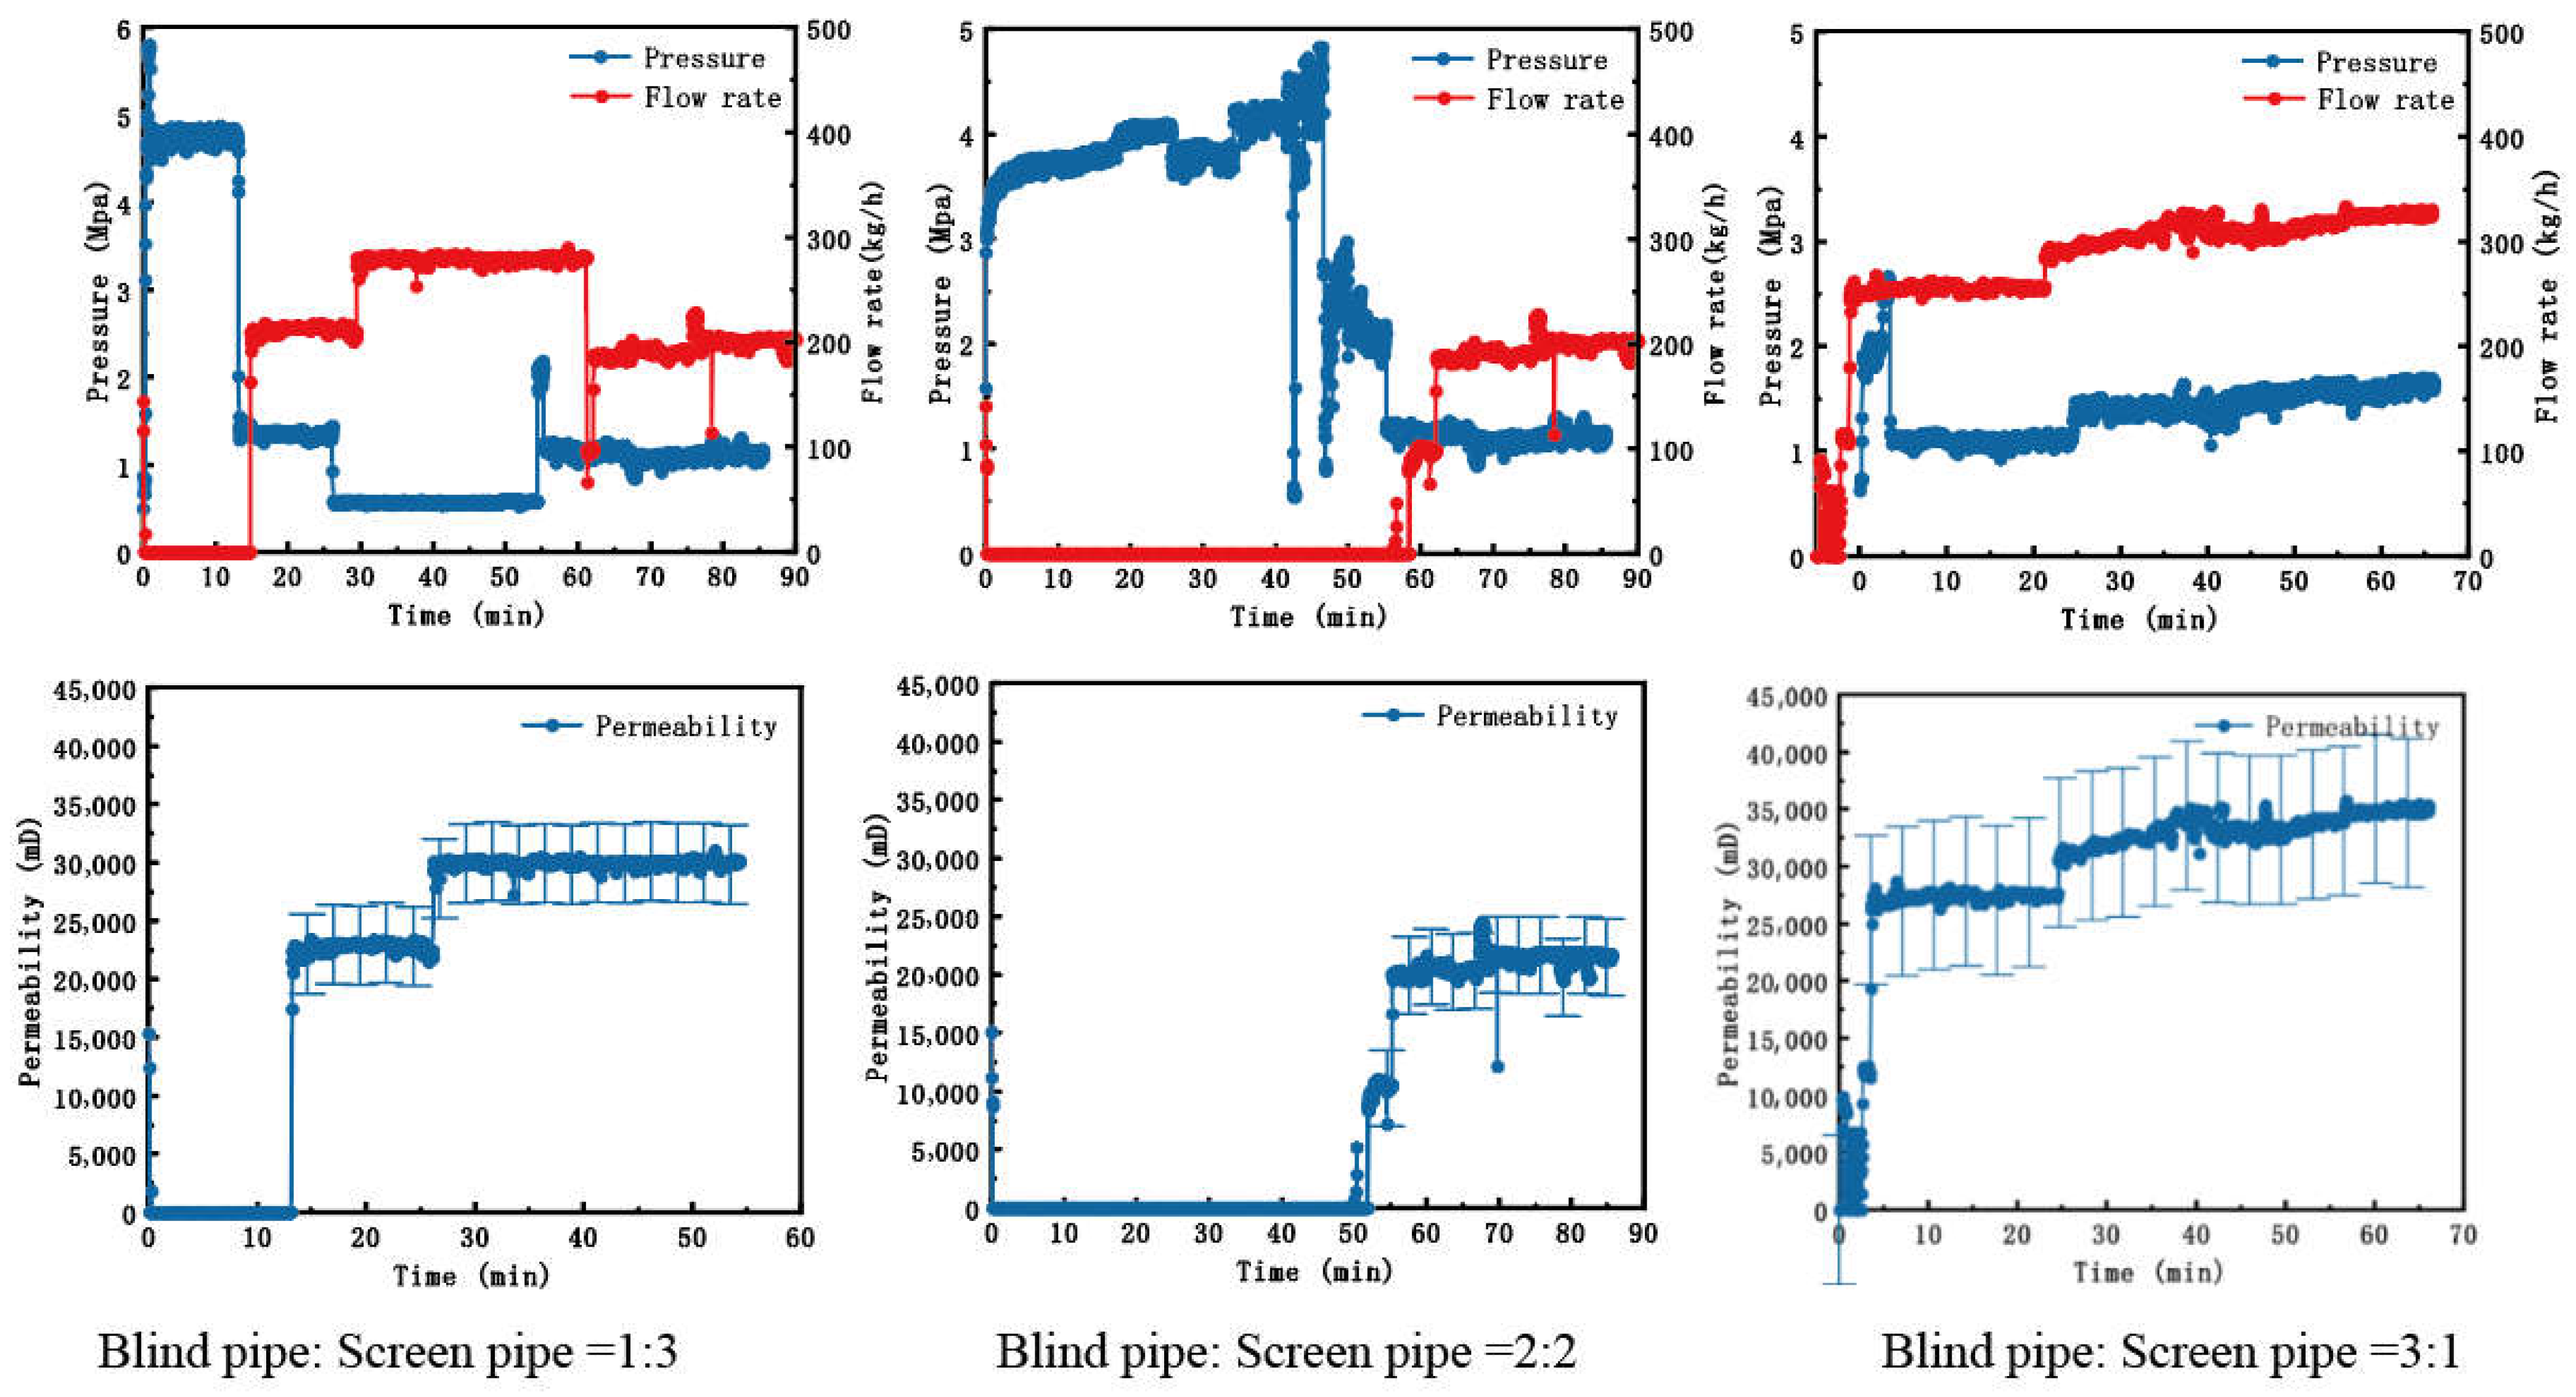
The ratio of blind pipe and screen pipe lengths affects permeability. The ratio of blind pipe and screen pipe lengths:
T h e   l e n g t h   o f   t h e   b l i n d   p i p e T h e   l e n g t h   o f   t h e   S c r e e n   p i p = 1 3 , 2 2 , 3 1
The mud content is 12.5%.
(2)
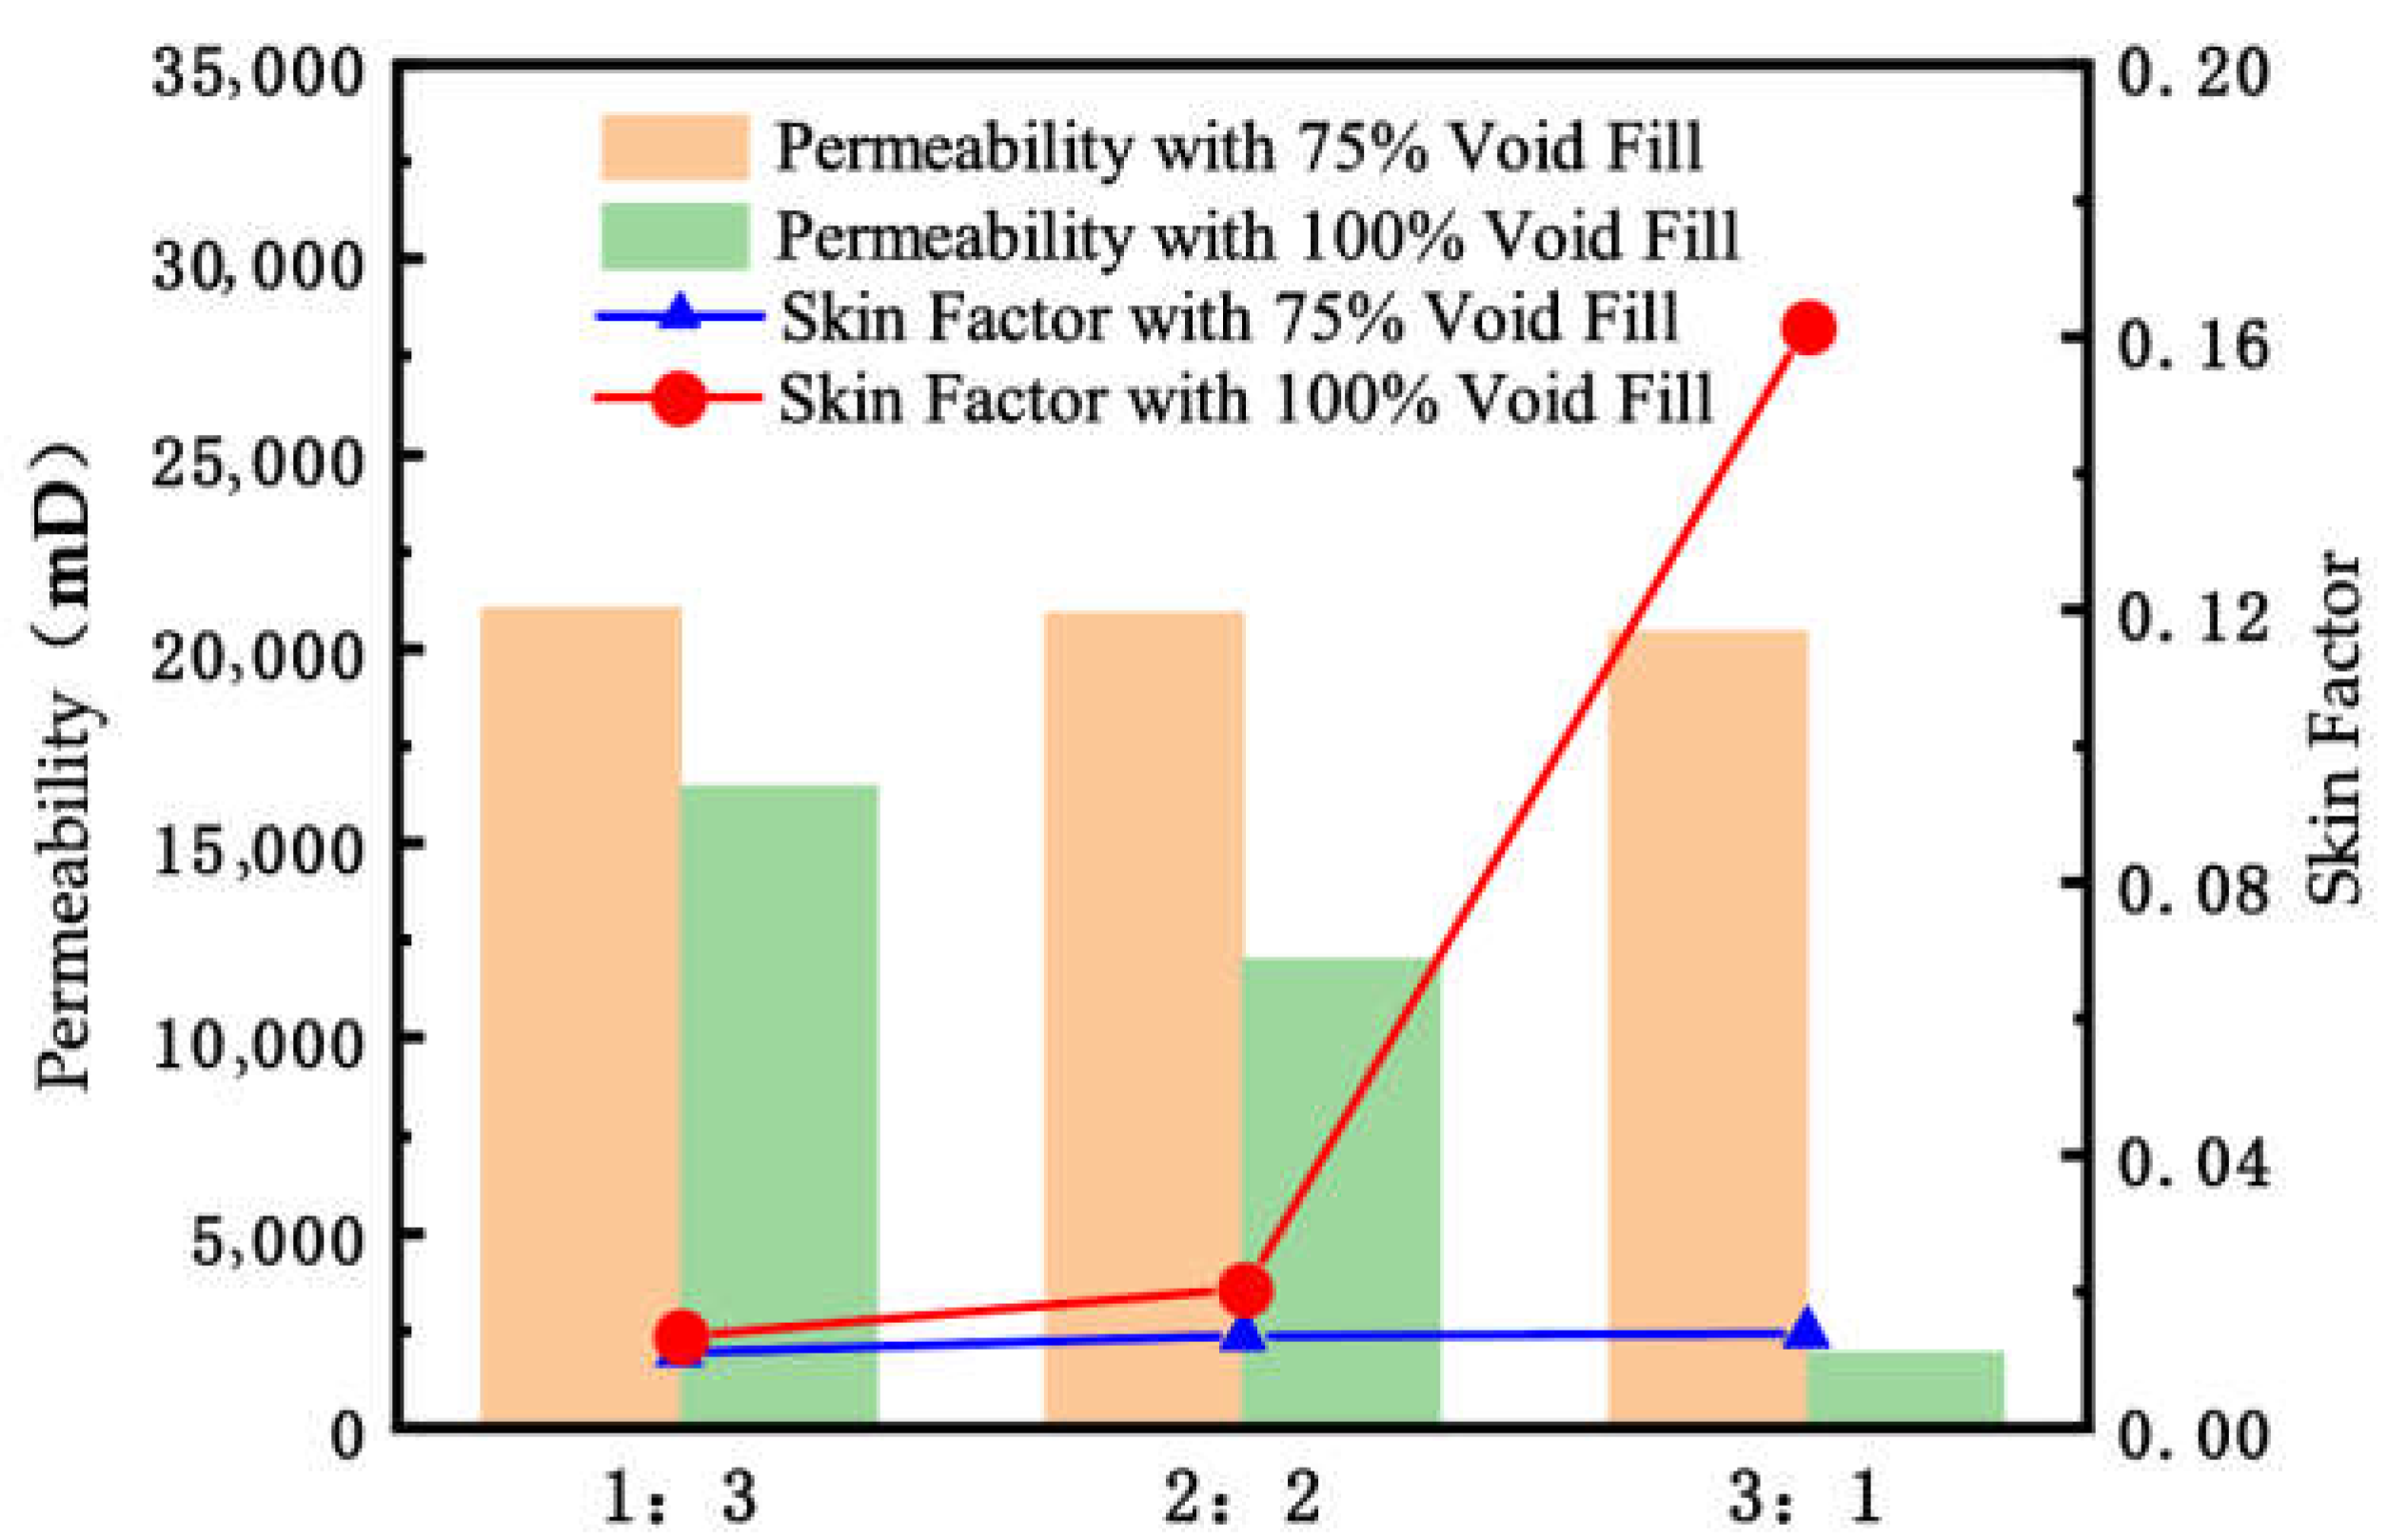
The annular fill rate affects permeability. The annular fill rates are set at approximately 75% and 100%. The mud content is 15.0%:
T h e   l e n g t h   o f   t h e   b l i n d   p i p e T h e   l e n g t h   o f   t h e   S c r e e n   p i p = 1 3 , 2 2 , 3 1
(3)
Mud content affects permeability. The mud content is set while considering the ratio of blind pipe-to-screen pipe lengths:
T h e   l e n g t h   o f   t h e   b l i n d   p i p e T h e   l e n g t h   o f   t h e   S c r e e n   p i p = 3 1 .
The mud contents are 5.0%, 10.0%, 12.5%, 15.0%, 20.0%, 40.0%, 50.0%, and 80.0%.

2.4. The Experimental Process

Although the experimental conditions vary, the experimental process and procedures are essentially the same. The main experimental steps are as follows:
  • Combine the blind pipe and screen pipe as a single unit, blocking the entrance end of the blind pipe, leaving the annular section open.
  • Allow the experimental test fluid to enter through the annular space. Initially, pre-fill the blind pipe section with gravel to the specified displacement and let the experimental fluid carry the gravel through the annular space.
  • As the gravel passes through the annular space of the blind pipe and gradually moves into the annular space of the screen pipe, wait for the pressure and flow rate to stabilize, and then stop the experiment.
  • Utilize the experimental flow rate and pressure differential, along with the formulas for permeability and annular skin factor, to determine the skin factors of the blind pipe and screen pipe.
  • Change the experimental conditions and repeat the above steps to complete all experiments.

3. Results

Analyzing the patterns of annular permeability and skin factors of the blind pipe and screen pipe combination completion tubing based on experimental conditions and the experimental process.

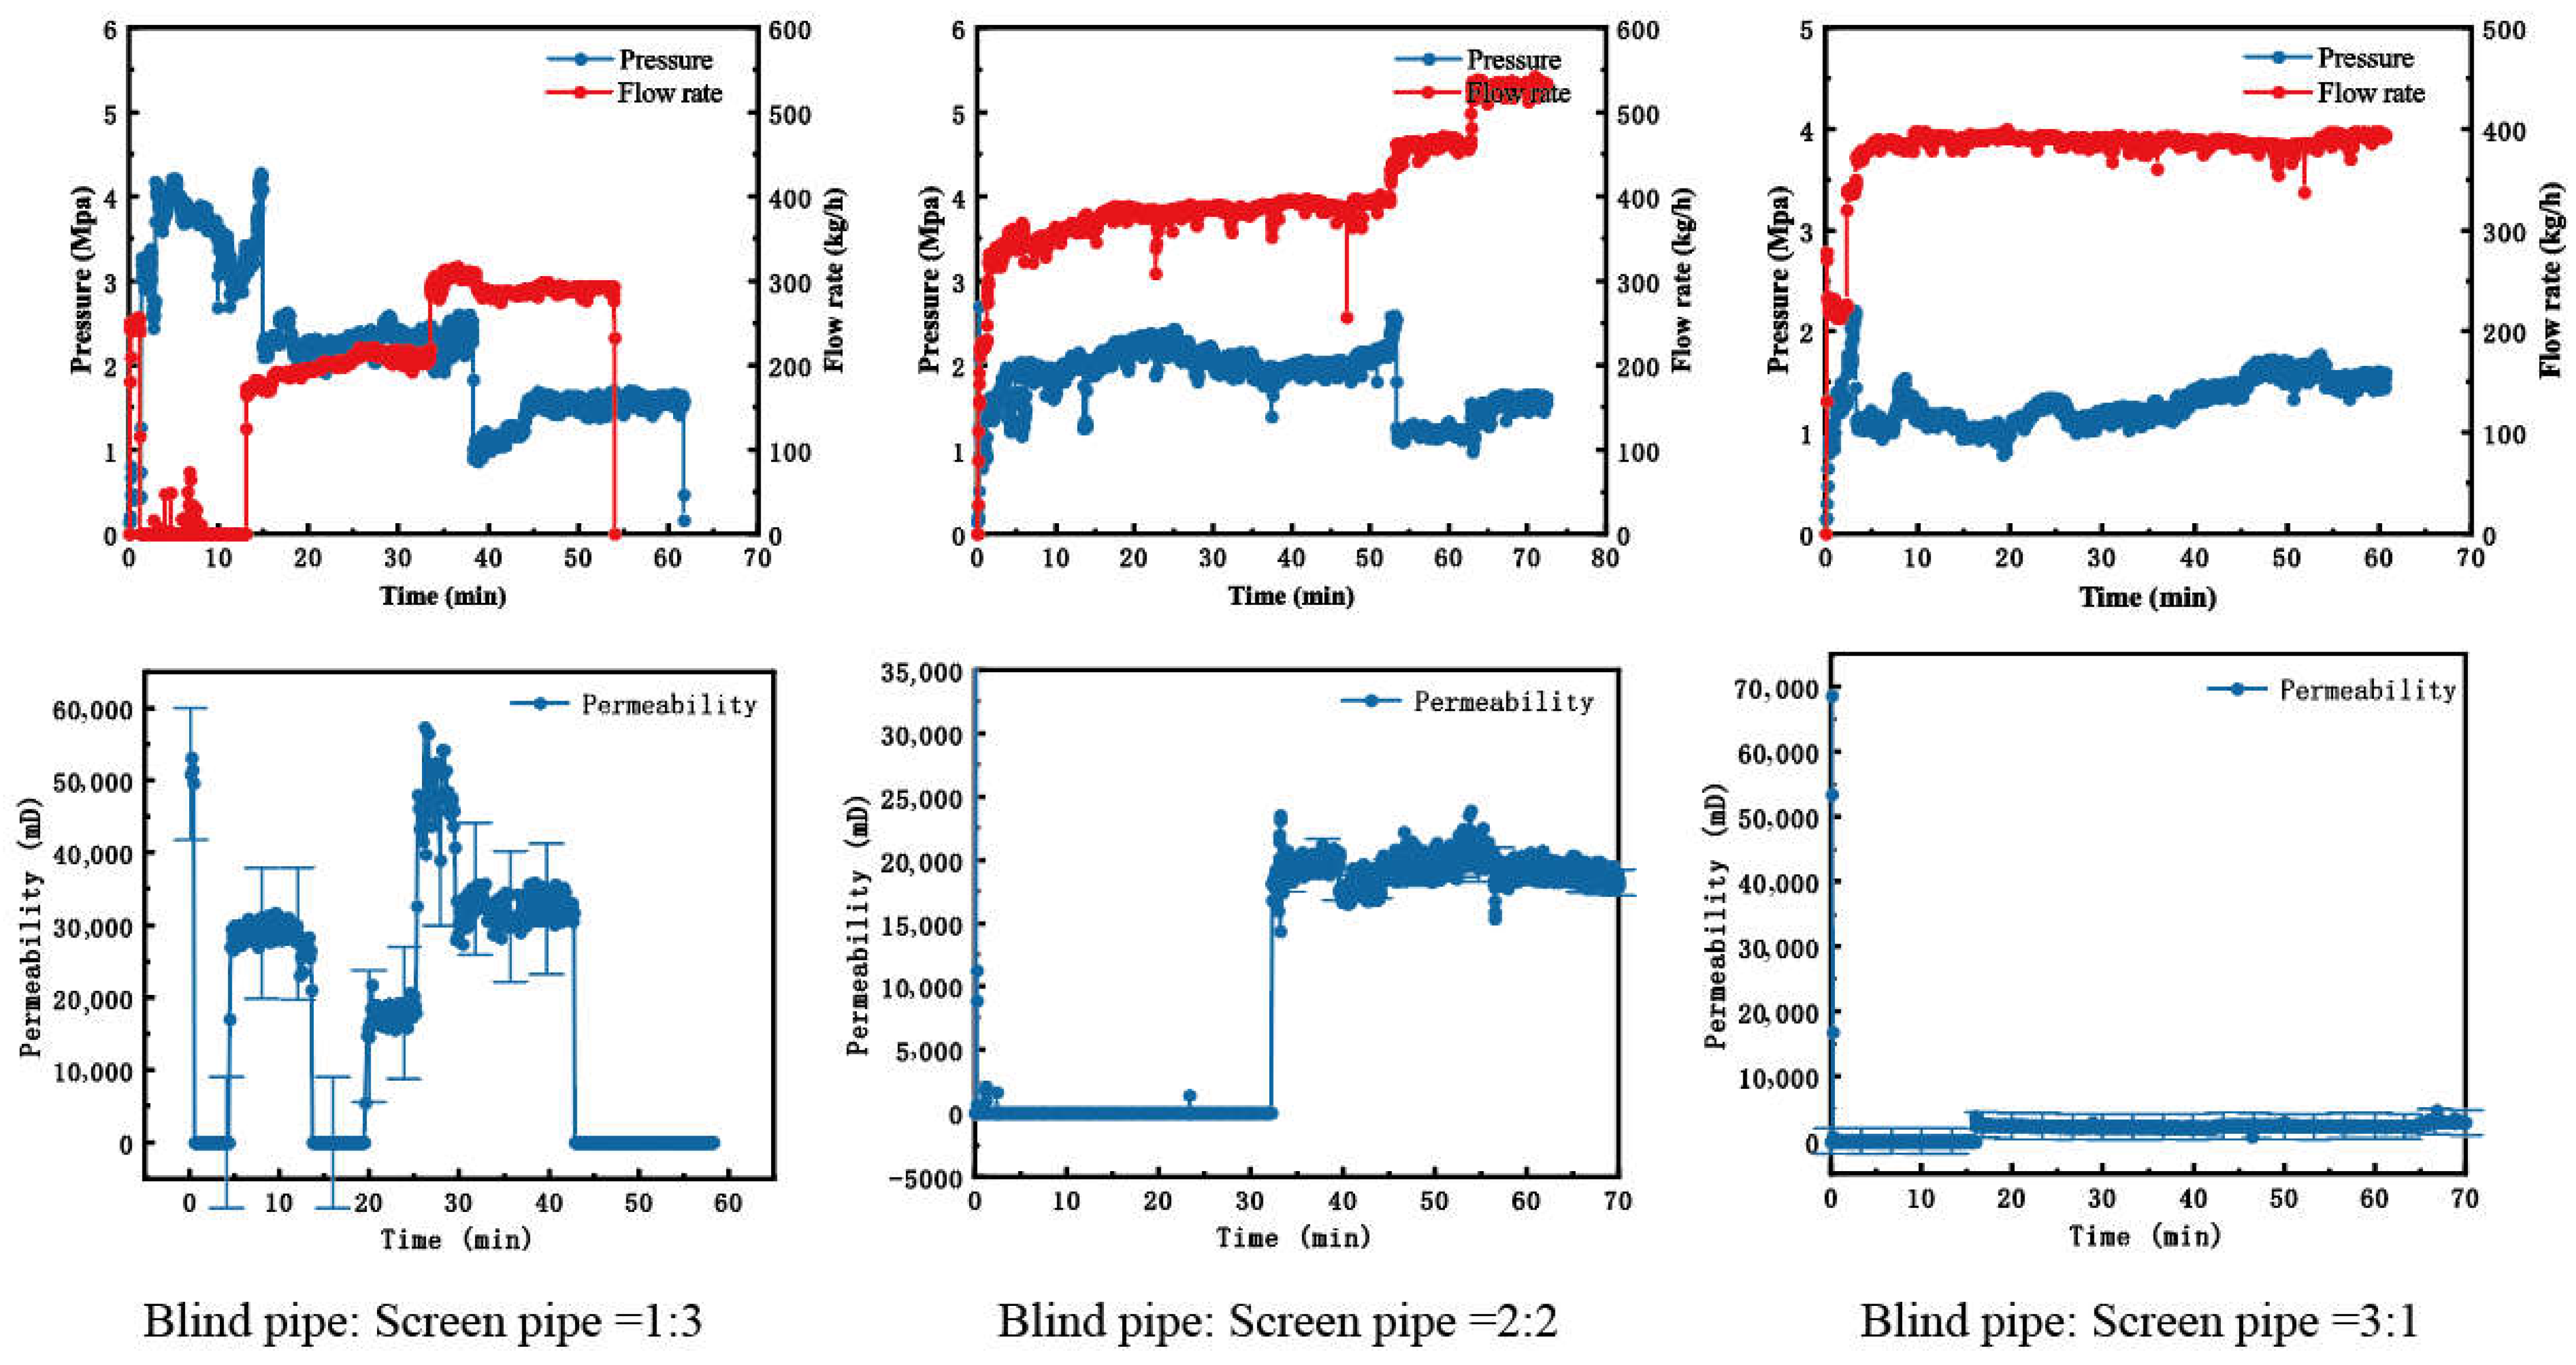
3.1. The Ratio of Blind Pipe and Screen Pipe Lengths Affects Permeability

Based on the different lengths of sand–mudstone (or mudstone) sections, varying lengths of blind pipes are selected. Different lengths of blind pipes may impact production capacity, so different ratios of blind pipes to screen pipes are set to study their permeability variations. This allows for the determination of the skin factors of the blind pipe and screen pipe, which can be used to assess their impact on production capacity. The mud content is 12.5%, and the annular filling ratio is approximately 75%. The pressure–flow rate and permeability curves were measured for the blind pipe–screen pipe ratios of 1:3, 2:2, and 3:1. Then, the standard deviation of permeability was calculated. Due to the large number of experimental results obtained, every 75th point was selected to plot the error graph of permeability, as shown in Figure 5. It can be observed that longer error bars indicate greater fluctuation in permeability results, while shorter error bars indicate more accurate permeability results. Even though the annular space is not completely filled with gravel, the filled gravel still effectively hinders the flow of the annular fluid. The flow rate and pressure measurements eventually stabilize, allowing the determination of the permeability curves based on changes in flow rate and pressure.
The average permeability was calculated, then the average value was substituted into Equations (2)–(4) to obtain the skin factor S p a c for the combinations of blind pipes and screen pipes. The average values for permeability and skin factors are shown in Figure 6. From the graph, it can be observed that as the ratio of blind pipes increases, the average permeability decreases, and the skin factors of the blind pipe and screen pipe combination increase. It is evident that an excessive ratio of blind pipes has an impact on production capacity. However, in cases where the annular space is not completely filled (75% fill rate), the skin factor for all three ratios of blind pipe to screen pipe lengths is less than 0.1. This relatively small skin factor, although affecting production capacity, does not significantly impact overall production capacity.

3.2. The Annular Fill Rate Affects Permeability

From the experiments on the impact on permeability of the ratio of blind pipe to screen pipe lengths, it is evident that the fill rate has a significant influence on the annular permeability of blind pipes and screen pipes. Therefore, the next step is to study the variation patterns of annular permeability for different fill rates. When the annular fill rates are 50%, 75%, and 100%, the annular permeability is tested with a mud content of 15.0%. When the flow rate and pressure have stabilized, record the changes in flow rate and pressure. Use Formula (1) to obtain the permeability curves, as shown in Figure 7, Figure 8 and Figure 9. Calculate the average permeability for the blind pipe and screen pipe combination tubing with annular fill rates of 75% and 100%. Then, use Formulas (2)–(4) to obtain the skin factors for the blind pipe and screen pipe combination tubing, as shown in Figure 7.
From the analysis of Figure 10 it can be observed that when the annular fill rate is 75%, the permeability and skin factors of the blind pipe and screen pipe combination tubing do not vary with changes in the ratio of blind pipes to screen pipes. Their permeability and skin factors remain relatively consistent. This is mainly because the annular space is not completely filled, and there are certain gaps or channels within the annular space. As a result, fluid can flow relatively smoothly through the annular space of the blind pipe and screen pipe, leading to higher permeability values and smaller skin factors. When the annular fill rate is 100%, with a larger ratio of blind pipes, higher mud content, and more prone blockage in the screen pipe, the annular permeability gradually decreases, and the skin factors increase as the ratio of blind pipes to screen pipes increases.

3.3. Mud Content Affects Permeability

As mud content increases, screen pipes are more prone to blockage. Testing was conducted using a blind pipe-to-screen pipe ratio of 3:1 for various mud content levels, including 5.0%, 10.0%, 12.5%, 15.0%, 20.0%, 40.0%, 50.0%, and 80.0%. The permeability of the blind pipe and screen pipe combination tubing under these conditions is shown in Figure 11. It was observed that the relationship between annular permeability and mud content follows a power law change pattern, and the fitting relationship is as follows:
k p a c = 685.62 x 0.639
In the equation: k p a c represents the annular permeability, mD; x represents the mud content, % .

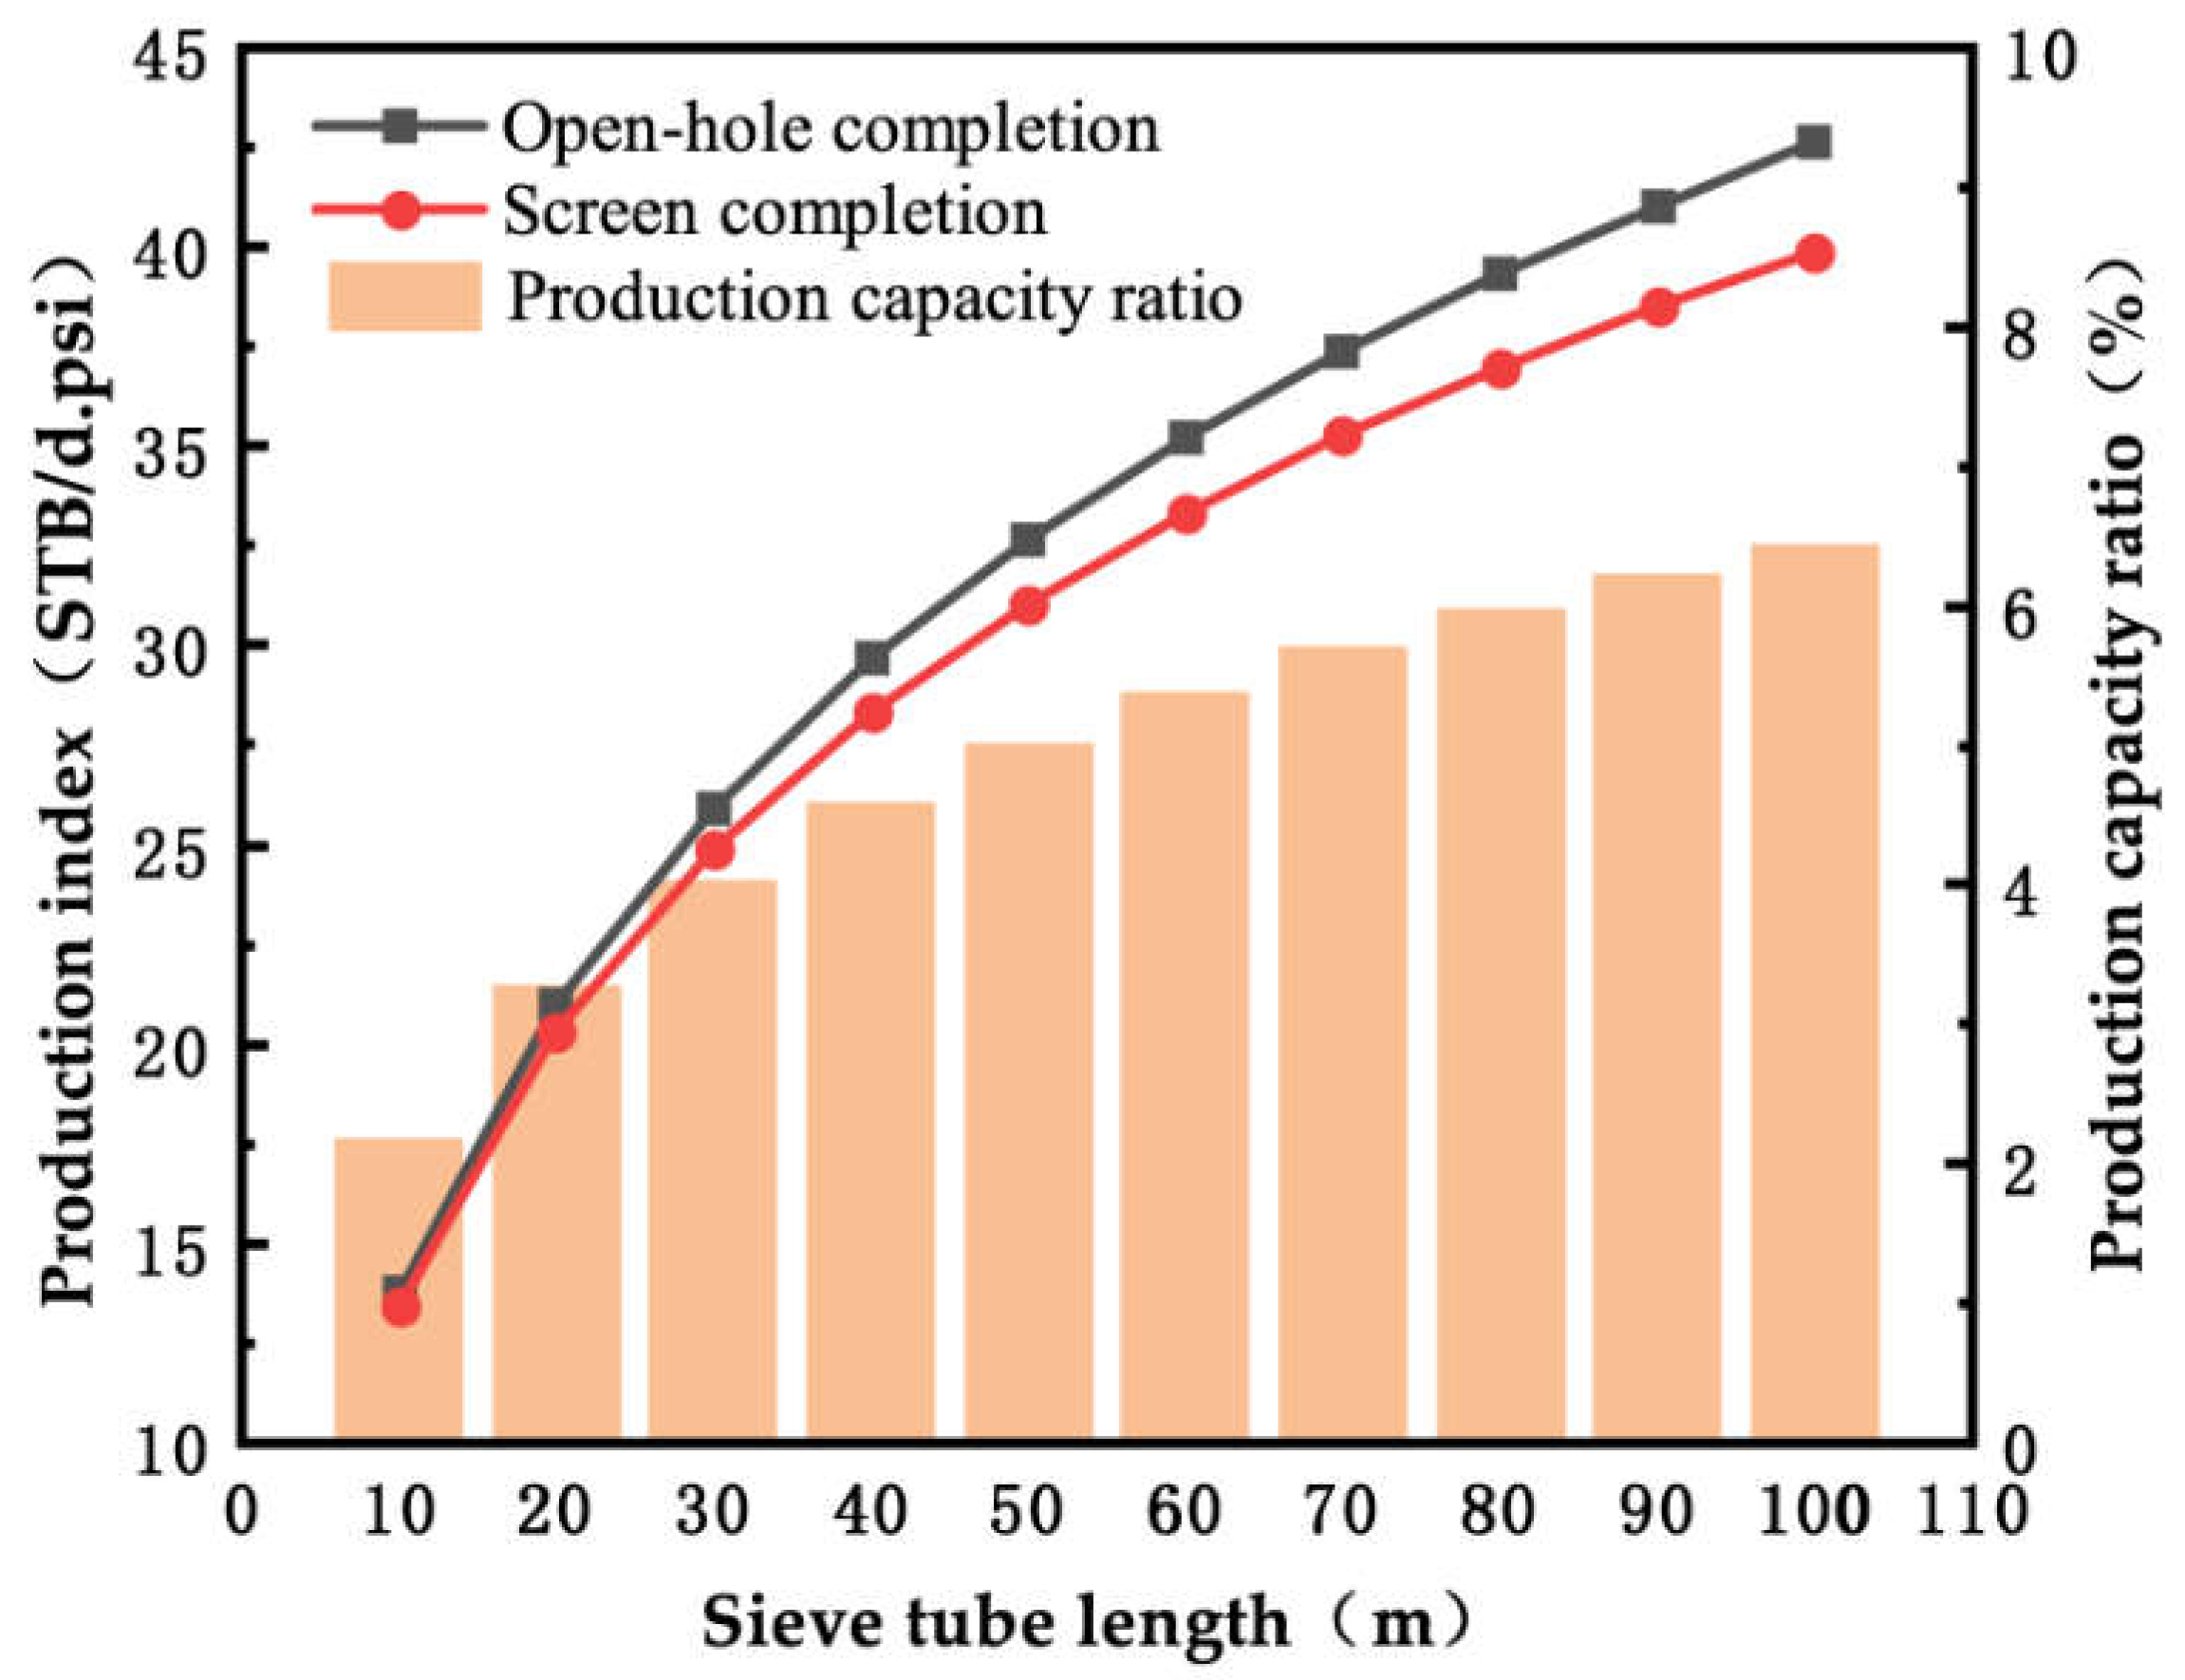
4. Engineering Applications

South China Sea XH is a horizontal well that encountered a section of sandy mudstone with high mud content during drilling at a depth of 4082 m to 4139 m in the horizontal segment. Blind pipes were used to seal off this section, but the blind pipes did not reach their specified position completely. Therefore, from the depth of 4119 m to 4139 m, 20 m of screen pipe replaced the intended blind pipe section, as shown in Figure 12. The movement of mud particles in the sandy mudstone section may have an impact on production capacity. Based on field data and experimental results, an assessment of the impact of the blind pipe and screen pipe combination tubing on production capacity is carried out.
Based on the geological parameters and log data of the XH well, the production capacity parameters are as shown in Table 2. The analysis of cuttings from the section (4119 m to 4139 m) indicates that the sand grain size distribution falls within the range of 250 μm to 300 μm. If the sandy mudstone section can be effectively sealed off with blind pipes, there would be no migration of mudstone particles. Only the screen pipe section would be in normal operation. Now, with the inclusion of the mudstone section in the screen pipe, the migration of mudstone particles can further block the annular space of the screen pipe. The objective of this study is to assess how much the inclusion of the mudstone section in the screen pipe affects the production capacity.
If there is no influence from the mudstone section without the blind pipe, the evaluation of screen pipe productivity will only consider the screen pipe productivity index in the 4139 m to 4216 m horizontal section. The calculation method can be referenced from the literature [11,12,15], and is calculated as follows [11,12,15]:
J 0 = 2 π K h K v h μ 0 B 0 Δ p ( ln 0.472 r e r w + S s )
If the mudstone particles in the blind pipe section affect the screen pipe productivity, the blind pipe and screen pipe are treated as a single unit, and the productivity index for the 4119 m to 4216 m horizontal section is considered with a combined skin factor for the blind pipe and screen pipe, denoted as S p a c instead of S s . The productivity index is calculated as follows [15]:
J p a c = 2 π K h K v h μ 0 B 0 Δ p ( ln 0.472 r e r w + S p a c )
In Equations (8) and (9), J 0 , J p a c respectively represent the productivity indices for the screen pipe and the combined blind pipe and screen pipe completion column STB/d · p s i ; K h , K v corresponding to the horizontal and vertical reservoir permeability, mD; h represents the reservoir thickness, m; μ 0 represents the oil viscosity, m P a · s .
B 0 represents the oil volume factor, dimensionless; r e , r w respectively represent the drainage radius and wellbore radius, m; S s , S p a c represent the skin factors for the screen pipe and the combined blind pipe and screen pipe completion column, dimensionless. The calculation of process parameters is based on references [11,12,13,14,15].
According to the wellbore diameter data from the logs, the wellbore of the XH well is not completely blocked (assuming 75% blockage). Assuming the screen pipe length inserted into the sandy shale section varies from 10 m to 100 m, a comparison of the productivity indices between pure screen pipe completion and blind pipe combined with screen pipe completion is shown in Figure 11. Using the productivity index of the screen pipe completion as the reference, the comparison of the productivity impact between open-hole completion and blind pipe combined with screen pipe completion in the sandy shale section is shown in Figure 11.
From Figure 13, it can be observed that when the annulus is not completely blocked, using a blind pipe combined with screen pipe completion method with 20 m of screen pipe inserted into the sandy shale section results in only a 0.73% reduction in the productivity index. However, if the proportion of screen pipe inserted into the shale section increases and reaches 100 m, the productivity index reduction increases to 1.47%.

5. Conclusions

  • The combination of blind and screen pipes in the well completion method may lead to the migration and blockage of highly muddy sediment particles in sandy shale or mudstone sections, affecting production. Given the lack of quantitative evaluation criteria for the impact of a blind and screen pipe combination on production, this paper designs instruments for measuring annular permeability and skin factor in this completion method. It also analyzes the variation in skin factor in different scenarios, providing a theoretical basis for the quantitative assessment of the impact of the blind and screen pipe combination on production.
  • The research findings suggest that an excessive proportion of blind pipes affects productivity but is not the main factor affecting production. The degree of annular blockage and the mud content are the primary factors affecting production.
  • Due to the complexity of experimental conditions and geological characteristics, the current research has only designed three ratios of screen pipes to blind pipes. To ensure the accuracy of the proportion, placement, and sealing of screen pipes and blind pipes, higher levels of technical knowledge and experience may be required. A high proportion of blind pipes may affect the permeability of the formation and lead to a decrease in the effective recovery of oil, resulting in reduced production. Therefore, future research needs to consider the impact of a wider range of proportions of screen pipes to blind pipes on production under different geological conditions in order to identify the optimal screen pipe-to-blind pipe ratio suitable for different formations.
  • The mechanism by which the combination of blind and screen pipes in well completion affects production is primarily due to the blocking of screen pipes by the movement of sediment particles. Mechanism analysis based solely on experimental research is insufficient, and further research is needed, potentially incorporating numerical simulations and other methods for in-depth investigation.

Author Contributions

Conceptualization, Y.Z., S.Q. and X.Z.; methodology, Y.Z. and X.Z.; validation, B.C.; formal analysis, X.Z.; investigation, X.Y.; resources, K.Z. and W.C.; data curation, Y.Z., S.Q. and X.Y.; writing—original draft preparation, X.Z. and Y.Z.; writing—review and editing, X.Z.; visualization, X.Z.; supervision, X.Z.; project administration, X.Z. and Y.Z.; funding acquisition, X.Z. and Y.Z. All authors have read and agreed to the published version of the manuscript.

Funding

The authors thank the National Key Laboratory Fund for Offshore Oil Development: Analysis of Drilling Limits and Safety Control Techniques for High Water-Cut, Extended-Reach Wells in Enping (No. CCL2023RCPS0168RQN).

Data Availability Statement

The original contributions presented in the study are included in the article, further inquiries can be directed to the corresponding author.

Conflicts of Interest

Authors Yongtao Zhang, Shili Qin, Bobo Cao, Xingtao Yan and Kun Zuo were employed by the company CNOOC (China) Limited Shenzhen Branch. The remaining authors declare that the research was conducted in the absence of any commercial or financial relationships that could be construed as a potential conflict of interest. The CNOOC (China) Limited Shenzhen Branch had no role in the design of the study; in the collection, analyses, or interpretation of data; in the writing of the manuscript, or in the decision to publish the results.

References

  1. Bao, C.Y.; Zhang, B.; Li, J.B.; Wang, P.; Wan, X.; Yan, M.K.; Li, Y.Q. Research and application of by-pass packing sand control tool used in horizontal well with mudstone section. China Offshore Oil Gas 2018, 30, 132–137. [Google Scholar]
  2. Liao, H.; Dong, L.; Niu, J. An experimental study on plugging and erosion failures of sand screen in grave packing conditions. J. China Univ. Pet. 2019, 43, 90–97. [Google Scholar]
  3. Procyk, A.; Gou, X.; Marti, S.K.; Burton, R.C.; Knefel, M.; Dreschers, D.; Wiegmann, A.; Cheng, L.; Glatt, E. Sand Control Screen Erosion: Prediction and Avoidance. In Proceedings of the SPE Annual Technical Conference and Exhibition, Houston, TX, USA, 28 September 2015. [Google Scholar] [CrossRef]
  4. Wenke, C.; Wei, L.; Hailong, L.; Hai, L. Effect of formation strength anisotropy on wellbore shear failure in bedding shale. J. Petrol. Sci. Eng. 2021, 81, 375–383. [Google Scholar] [CrossRef]
  5. Zhai, X.; Meng, W.; Kong, X.; Wang, E.; Huang, Y.; Lou, Y. Applying the DPM numerical simulation method to predict the erosion life of metal mesh screen in gas wells. Oil Drill. Prod. Technol. 2020, 42, 668–672. [Google Scholar]
  6. Dong, C.; Song, Y.; Zhou, Y.; Xu, H.; Wang, J.; Liu, Y.; Wang, L. Plugging law and microscopic sand retention mechanism of sand retaining of argillaceous fine silt sand in gas hydrate reservoirs. Acta Petrol. Sin. 2020, 41, 1248–1258. [Google Scholar]
  7. Mohammad, C.; AdelAl-Ajmi, V. The role of rock strength criteriain wellbore stability and trajectory optimization. Int. J. Rock Mech. Min. Sci. 2015, 80, 373–378. [Google Scholar]
  8. Zhu, C.M.; Deng, J.G.; Wang, L.H.; Wang, X.L.; Wei, L.G.; He, B.S.; Zeng, X.L. Experimental study of accumulated sand permeability outside sand control screen. Oil Drill. Prod. Technol. 2010, 32, 70–73. [Google Scholar]
  9. Dong, C.Y.; Wu, L.; Wang, A.P.; Zhang, Q. A new method for evaluating skin factor and productivity of horizontal Wells with different completion methods. Spec. Oil Gas Reserv. 2009, 16, 77–81+99–100. [Google Scholar]
  10. Bo, L.I.; Xiaodong, W.U.; Yongsheng, A.N.; Juntao, Z.H.A.N.G.; Jinfen, Z.H.A.N.G.; Guoqing, H.A.N. Modeling the skin factor of horizontal well completed with precision screen. Oil Drill. Prod. Technol. 2012, 34, 52–56. [Google Scholar]
  11. Geng, W.S.; Yang, E.L.; Zhao, Y.J. The Development and Application of Multi-Stage Fracturing Horizontal Well Testing Interpretation Software. Well Testing 2013, 22, 6–9+75. [Google Scholar]
  12. Unneland, T. An Improved Model for Predicting High-Rate Cased-Hole Gravel-Pack Well Performance. In Proceedings of the SPE European Formation Damage Conference, The Hague, The Netherlands, 31 May–1 June 1999. [Google Scholar]
  13. Zuo, M.L.; Guo, L.H.; He, J.B. Evaluation on Pollution of the Reservoir Caused by Drilling Fluid Invasion Along the Horizontal Well. Contemp. Chem. Ind. 2015, 44, 1851–1854. [Google Scholar]
  14. Gao, D.X.; Liu, L.; Nv, X.X. Parameter Optimization of Slotted Screen Based on Collapse Strength and Skin Factor. China Petrol. Mach. 2019, 47, 79–84. [Google Scholar]
  15. Lin, H.C.; Wei, C.D.; Zou, X.B. Sand Control Productivity Prediction Model for Secondary Completion of Horizontal Wells in Offshore Oilfield. China Petrol. Mach. 2022, 50, 111–117. [Google Scholar]
  16. Joshi, S.D. Augmentation of well productivity using slant and horizontal wells. J. Pet. Technol. 1988, 40, 729–739. [Google Scholar] [CrossRef]
  17. Chen, Y.Q.; Zhou, C.Y. Derivation, comparison and application of horizontal well production formulas considering the effects of anisotropy and eccentricity. Xinjiang Petrol. Geol. 2009, 30, 486–489. [Google Scholar]
  18. Welling, R.W.F. Improving Gravel Packing Techniques in Brunei Darussalam Field Trial Results. In Proceedings of the SPE Asia Pacific Oil and Gas Conference and Exhibition, Singapore, 8–10 February 1993; p. SPE-25363-MS. [Google Scholar]
Figure 1. Schematic Diagram of Combination Structure of Blind Pipe and Screen Pipe.
Processes 12 01835 g001
Figure 2. Actual Image of the Screen-Pipe Assembly with Blind Pipes of Different Length Proportions.
Processes 12 01835 g002
Figure 3. Chart of Permeability Test of Blind Pipe and Screen Combination Completion String. In the diagram: 1—liquid storage tank; 2—polymer diaphragm pump; 3—throttle valve; 4—flowmeter; 5—pressure gauge; 6, 9—pressure differential sensors; 7—blind pipe and screen pipe combination tubing; 8—clamping device; 10—valve; 11—waste liquid tank; 12—computer analyzer; 13—data collector.
Processes 12 01835 g003
Figure 4. The internal structural dimensions of the combined completion column with blind tube and screen tube.
Processes 12 01835 g004
Figure 5. Permeability corresponding to length ratio of blind screen.
Processes 12 01835 g005
Figure 6. Average Permeability and Skin Coefficient Corresponding to the Length Ratio of Blind Pipe–Screen Pipe.
Processes 12 01835 g006
Figure 7. Permeability of blind pipe and screen pipe at 50% annular fill for different length ratios.
Processes 12 01835 g007
Figure 8. Permeability of blind pipe and screen pipe at 75% annular fill for different length ratios.
Processes 12 01835 g008
Figure 9. Permeability of blind pipe and screen pipe at 100% annular fill for different length ratios.
Processes 12 01835 g009
Figure 10. Average permeability value and skin coefficient corresponding to different annular filling rate blind tube screen tube combinations.
Processes 12 01835 g010
Figure 11. Permeability of screen pipes under different clay content conditions.
Processes 12 01835 g011
Figure 12. Diagram of screen pipe insertion in the sand-mudstone interval.
Processes 12 01835 g012
Figure 13. Comparison of production index between blind pipe and screen pipe combination completion mode with different lengths and screen pipe completion mode.
Processes 12 01835 g013
Table 1. Sand control experimental conditions.
Experimental ConditionsExperimental Requirements
Blind Pipe–Screen Pipe CombinationDifferent ratios of blind pipe–screen pipe samples are produced based on the dimensions of actual engineering columns in the oil field, scaled down according to the principle of similarity. The original outer diameter of the blind pipe–screen pipe is 7 inches and, after proportional scaling, the outer diameter of the blind pipe–screen pipe becomes 30 mm, with an annular size of 10 mm.
Wellbore VisualizationThe fully visualized simulated wellbore is a transparent glass tube made of organic glass. It is scaled according to the actual naked-eye wellbore size on-site, where the on-site wellbore diameter is 8.5 inches. After scaling, the wellbore’s outer diameter becomes 60 mm, and it can withstand a pressure of 5 MPa.
Testing EnvironmentAt room temperature, within 5 MPa.
Experimental Erosive FluidThe experimental fluid medium can be either water or white oil (viscosity 30–250 mPa·s).
Experimental Sand Mixing RequirementsBy conducting laser particle size analysis on reservoir cores collected from the oil field, actual reservoir particle sizes are obtained. Then, quartz sand, conforming to current market standard mesh sizes, is mixed according to the test results. Parameters such as d50, d10, UC, and other particle size characteristics are used as evaluation criteria for preparing the formation sand.
Table 2. Production Evaluation Parameter Table for Blank Pipe and Screen Pipe Completion Column.
ParameterValueParameterValues
Horizontal reservoir permeability (mD)7.1Wellbore diameter (m)0.22
Vertical reservoir permeability (mD)2.6Oil leak radius (m)3700
Horizontal section length (m)926Reservoir thickness (m)25
Crude oil density (g/cm3)0.99Oil volume coefficient1.01
Column diameter (m)0.17Crude oil viscosity (mPa·s)360
Annular plugging rate (%)75Clay–sandstone segment mud content (%)15
Disclaimer/Publisher’s Note: The statements, opinions and data contained in all publications are solely those of the individual author(s) and contributor(s) and not of MDPI and/or the editor(s). MDPI and/or the editor(s) disclaim responsibility for any injury to people or property resulting from any ideas, methods, instructions or products referred to in the content.

