Article

Study on Evaluation of the Virtual Saturated Vapor Pressure Model and Prediction of Adsorbed Gas Content in Deep Coalbed Methane

1
China United Coalbed Methane Corporation Ltd., Beijing 100015, China
2
Institute of Energy Resources, China University of Geosciences, Beijing 100083, China
3
China United Coalbed Methane Corporation Ltd., Taiyuan 030000, China
*
Authors to whom correspondence should be addressed.
Processes 2024, 12(9), 1837; https://doi.org/10.3390/pr12091837
Submission received: 15 August 2024 / Revised: 24 August 2024 / Accepted: 26 August 2024 / Published: 29 August 2024
(This article belongs to the Section Separation Processes)

Abstract

:
Accurately predicting the adsorbed gas content in coal reservoirs is crucial for evaluating the gas content in deep coal seams. However, due to the significant variations in temperature and pressure conditions across different coal reservoirs, accurately assessing the adsorbed gas quantity presents challenges. Based on the adsorption potential theory, this paper proposes a prediction model of adsorbed gas that is applicable under various temperature and pressure conditions. The results indicate that the adsorbed gas content in deep coal reservoirs is influenced by a combination of temperature, pressure, and coal rank. The increase in pressure and coal rank enhances the inhibitory effect of temperature on methane adsorption. Meanwhile, there are significant differences in the results obtained from various virtual saturated vapor pressure models. Among them, the Amankwah model theoretically satisfies the uniqueness of the adsorption characteristic curve, with the optimal k values for different coal rank samples ranging between 2 and 9. In terms of predicting the adsorption gas, the performance of the models is ranked as follows: Amankwah model > Antonie model > Astakhov model > Dubinin model > Reid model. The Amankwah model exhibits the smallest average relative error and root mean square error. In addition, as burial depth increases, the influence of the pressure on methane adsorption decreases, while the significance of temperature increases, with the critical depth located around 1600 m. At depths shallower than the critical depth, adsorbed gas tends to preferentially accumulate and form reservoirs, which generally have lower commercial value. At depths deeper than the critical depth, free gas has the potential to form reservoirs. At this stage, gas reservoirs dominated by adsorbed gas start transitioning to those containing free gas. These findings are expected to deepen the understanding of deep coalbed methane and provide a scientific basis for exploration and development in the study area.

1. Introduction

Coalbed methane (CBM), an important unconventional clean energy source, is a key hot spot in research on natural gas exploration and development [1,2]. Early studies indicated that shallow coal reservoirs, such as those in the Soma Basin [3] and Parana Basin [4], have significant methane storage capacity. As research progressed, the study by Bicca et al. [5] revealed that an increase in coal seam depth contributes to enhanced gas storage capacity. Consequently, with the potential relationship between depth and gas content, deep coalbed methane began to attract attention in the energy sector. Pioneering explorations of deep coalbed methane were conducted by Johnson et al. [6] and Wyman et al. [7], who demonstrated the significant exploration potential of deep coalbed methane. China has achieved breakthroughs in CBM production in the Qinshui Basin [8,9], the Ordos Basin [10,11], and the Junggar Basin [12,13]. With continuous exploration and development, deep CBM has transformed from a forbidden zone for development into a development hot spot, with single-well daily gas production reaching as high as 10.1 × 10⁴ m3. This has provided a solid foundation for the “increase reserves and production” strategy in China [14] and ensured the commercial development of deep CBM. Recent research findings indicate significant differences between deep and shallow coal reservoirs in terms of geological conditions and gas-bearing parameters such as gas saturation and preservation conditions [15,16,17]. The Linxing block, a large, integrated gas field with high abundance in deep formations, boasts a single-well daily production capacity exceeding 60,000 m3 [18]. However, the exploration and development of deep CBM in this block faces numerous challenges, including lack of understanding of the gas content composition and unclear primary controlling factors of gas content, which constrain the efficient development of deep CBM resources in the area.
Unlike conventional natural gas reservoirs, coalbed methane reservoirs primarily contain methane in both adsorbed and free states [19,20]. At present, the development results of most deep CBM wells indicate that deep coal reservoirs may be rich in free gas, and the relationship between gas and water in the reservoir is complex [11,21]. Therefore, accurate prediction of gas content and gas composition, including adsorbed gas and free gas, is a key and challenging aspect of current deep CBM exploration and development. The composition of deep CBM significantly influences the production characteristics of CBM wells [22]. Under deep conditions, when the total gas content of the reservoir is known (which can be obtained through pressure-preserved coring) [23], accurately predicting the adsorbed gas content can clarify the occurrence state of deep CBM. Due to the high temperature and pressure characteristics of deep CBM, the adsorption characteristics of coal reservoirs differ significantly from those of shallow CBM. Therefore, studying the adsorption behavior of deep CBM and accurately predicting the adsorbed gas content is particularly important. Currently, the isothermal adsorption experiment remains the most commonly used method for predicting the adsorbed gas content in deep CBM. Ji et al. [24] conducted high-temperature high-pressure methane adsorption experiments on low rank coal and pointed out the differences in temperature and pressure effects before and after the critical depth. Jia et al. [25] suggested that under high pressure conditions the adsorption form of supercritical methane consists of the micropore filling adsorption and monolayer adsorption. The results of Zhao et al. [26] showed that adsorption capacity is mainly controlled by coal rank and macerals, and showed that the relationship between adsorption capacity and ash yield has a “V-shaped” trend. Bhapkar et al. [27] demonstrated that clay minerals have a moderate impact on micropores but exert a strong influence on mesopore volume and surface area, which in turn affects the amount of adsorbed gas. Research by Charoensuppanimit et al. [28] systematically described the adsorption characteristics of supercritical methane and its dependence on temperature. Although isothermal adsorption experiments typically provide high accuracy, they can only quantify the adsorption characteristics of coal under specific temperature and pressure conditions. This limitation makes it challenging to accurately characterize the adsorption capacity of coal under the complex and variable temperature and pressure conditions encountered in geological settings. Therefore, improving the accuracy of models for predicting adsorbed gas under reservoir temperature and pressure conditions has become a current research focus and challenge. Adsorption potential can be directly applied to characterize the adsorption properties of porous media under different temperature and pressure conditions [29,30]. However, there are currently few studies that have reported on predicting adsorbed gas under different temperature and pressure conditions through adsorption potential theory [31]. Theoretically, a prediction model of adsorbed gas can be established based on the relationship between adsorption potential and adsorption space. However, this approach has not yet gained sufficient recognition, which adds to the difficulty of accurately predicting the adsorbed gas content in deep CBM.
In recent years, adsorption potential theory has gradually been applied in the field of CBM and achieved several results [32,33]. Adsorption potential theory posits that the same sample exhibits a unique characteristic adsorption curve at different temperatures; therefore, it can effectively represent methane adsorption under various temperature and pressure conditions. However, under deep reservoir conditions where methane is in a supercritical state, the saturated vapor pressure in the calculation models often needs to be replaced with a virtual value [34]. It is noteworthy that the insufficient understanding of virtual saturated vapor pressure poses direct challenges to the establishment of adsorbed gas prediction models and the adsorption characteristics of methane. Currently, various models exist to determine the virtual saturated vapor pressure of methane under supercritical conditions; however, the accuracy and applicability of these models are rarely reported. Due to the insufficient precision in the study of virtual saturated vapor pressure, most researchers currently draw conclusions based on a single virtual saturated vapor pressure model [35,36]. Long et al. [37], Zhao et al. [36], and Gao et al. [38] derived conclusions based on calculating the adsorption potential using the Dubinin method, Amankwah method, and Reid method for virtual saturated vapor pressure, respectively. This not only results in a lack of a comparative foundation for research outcomes but also causes the findings to lack a solid scientific basis.
The aforementioned issues directly impact the evaluation of gas content in deep coalbed methane and related tasks, highlighting the lack of a systematic analysis of adsorption potential theory. Therefore, this paper focuses on deep coalbed methane in the middle Linxing block of the Ordos Basin, using isothermal adsorption experiments to systematically analyze and summarize the applicability and limitations of various virtual saturated vapor pressure models. Based on the optimal method, a prediction model of adsorbed gas in deep coal reservoirs is proposed and the critical depth of adsorbed gas content in the study area is explored. This paper aims to reveal the importance of virtual saturated vapor pressure and enhance the accuracy of adsorbed gas prediction models, thereby providing a scientific reference for the exploration and development of deep coalbed methane resources.

2. Sample and Methods

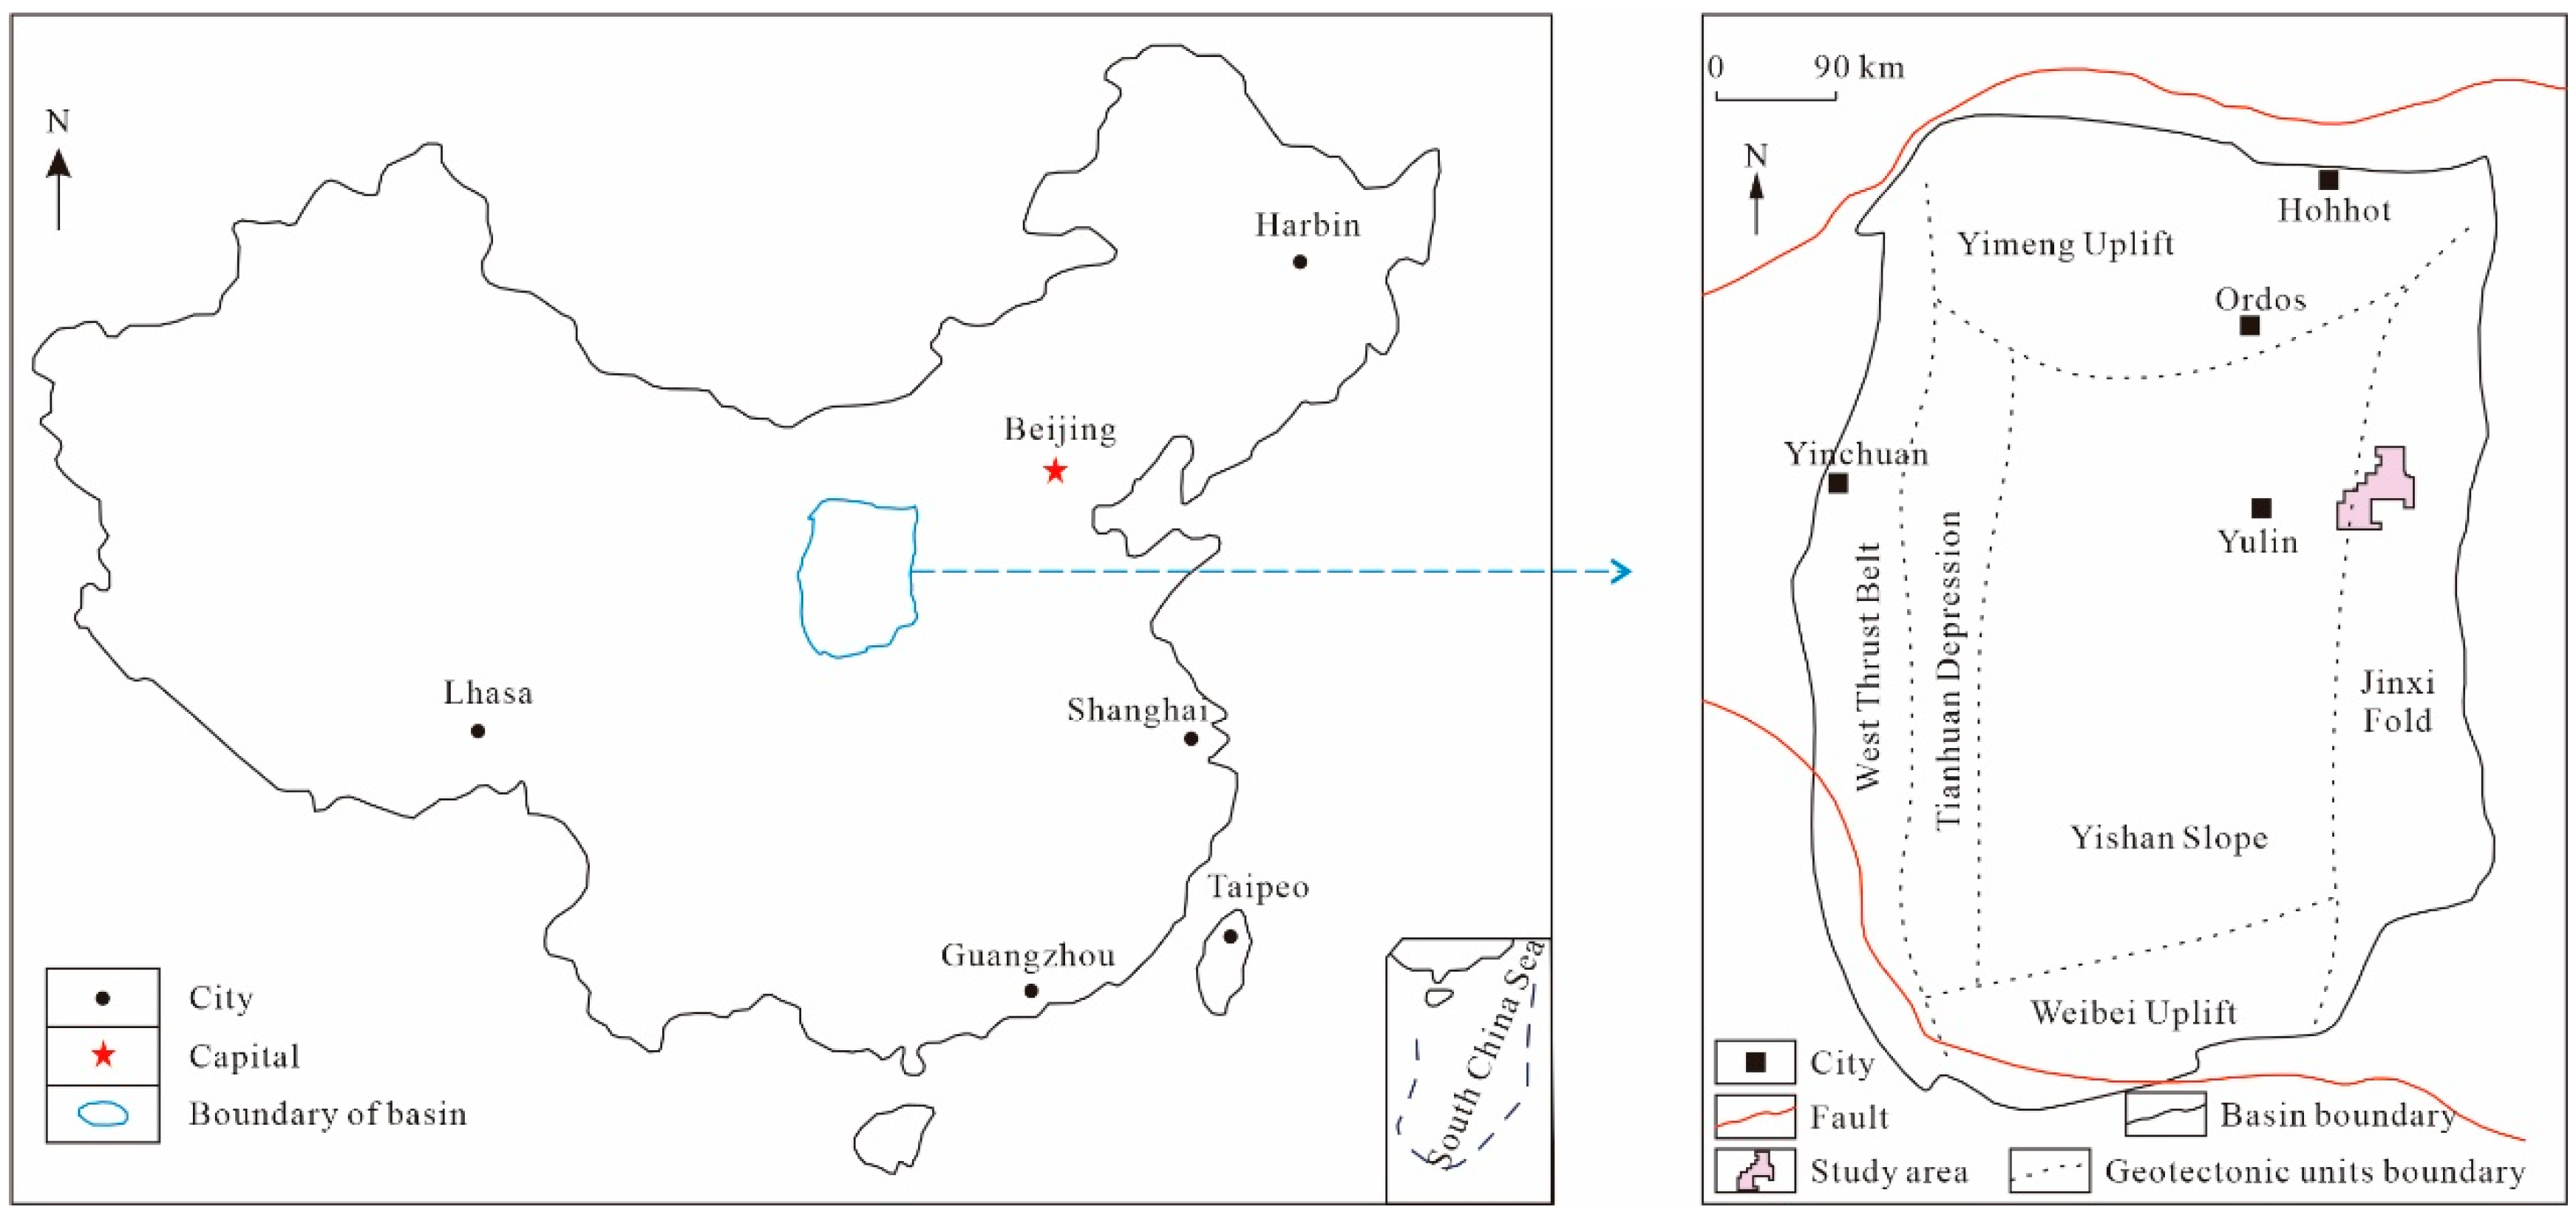
2.1. Geological Setting

The Ordos Basin, located in northern China, is a large inland basin bordered by the Qinling, Yinshan, Luliang, Liupan, and Helan Mountains. Since the Mesozoic era, the basin has undergone multiple tectonic movements, including the Indosinian, Yanshan, and Himalayan orogenies [39,40].
The middle Linxing block is located on the eastern edge of the Ordos Basin. Structurally, the middle Linxing block spans the Jinxi Flexural Belt and Yishan Slope, having undergone multiple tectonic movements including the Yanshan and Himalayan movements (Figure 1) [41]. The main coal-bearing strata within the block are the Shanxi Formation (No. 4 + 5 coal) and the Benxi Formation (No. 8 + 9 coal), which are stable and well-developed throughout the region. Specifically, the overall burial depth of the No. 4 + 5 coal seams within the block is relatively shallow, while the average burial depth of the No. 8 + 9 coal seams is around 1800 m [42]. In recent years, there have been breakthroughs in deep CBM in the Linxing block. However, the gas production characteristics of some well groups differ significantly, mainly manifesting in two forms: self-flowing gas production and dewatering depressurization [43]. Therefore, the accuracy of adsorbed gas content is crucial for determining gas saturation and free gas content, which in turn directly affects the gas production characteristics of different well groups.

2.2. Coal Sample Characterization

This study primarily involves sampling and testing the No. 8 + 9 coal seam. The results of the maceral composition, proximate analysis, and maximum vitrinite reflectance (Ro) are shown in Table 1. The findings indicate that the metamorphic degree of the samples ranges between 1.11% and 1.43%. The maceral composition is predominantly vitrinite (average 61.34%), followed by inertinite (average 22.38%). The proximate analysis does not show obvious patterns. During the experiments, the Chinese national standards GB/T8899-2008, GB/T212-2008, and GB/T6948-2008 were followed to ensure standardized experimental procedures [44,45,46].

2.3. Adsorption Experiment

The ISO-300 isothermal adsorption instrument was used for the tests in this study. Before starting the experiments, He was used for tightness detection and free volume tests. The samples tested in this experiment were dried samples (60~80 mesh) subjected to methane isothermal adsorption tests, with an equilibrium time of 12 h for each pressure point and a test temperature corresponding to the reservoir temperature. To accurately reflect the actual gas adsorption behavior of the samples, the excess adsorption amount is typically converted to the absolute adsorption amount (Equation (1)):
V e = V a ( 1   -   ρ gas ρ ad )
where Ve is the excess adsorption amount, cm3/g; Va is the absolute adsorption amount, cm3/g; ρgas is the gas density, g/cm3; and ρad is the adsorption phase density, g/cm3.
In this paper, the adsorption behavior of methane under different temperature and pressure conditions is characterized based on the Langmuir model (Equation (2)), as follows:
V a = V L P P + P L
where VL is the Langmuir volume, cm3/g; P is the gas pressure, MPa; and PL is the Langmuir pressure, MPa.

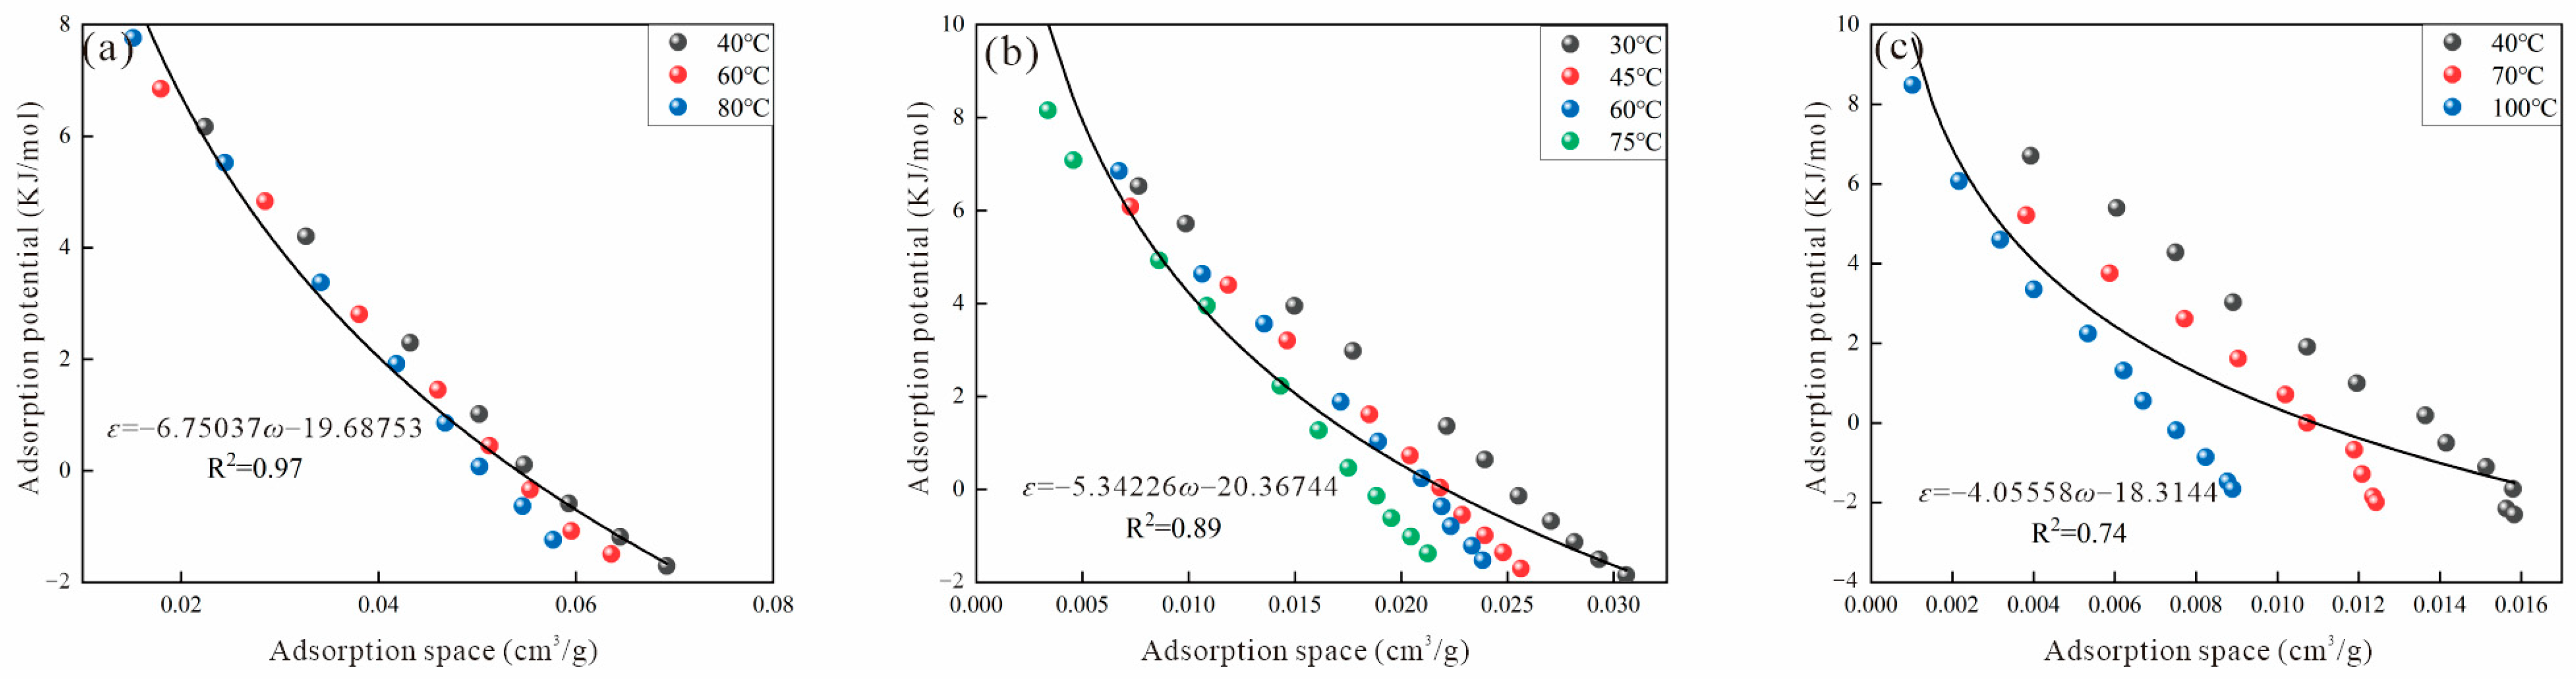
2.4. Adsorption Potential and Adsorption Space

Adsorption potential theory is primarily a thermodynamic method for analyzing physical adsorption behavior. The core of this theory involves establishing a characteristic adsorption curve through isothermal adsorption tests. When methane is adsorbed onto the coal surface, it is influenced by the adsorption potential well, occupying the adsorption space [47]. Polanyi et al. [48] first quantified the adsorption potential, defining it as the work done by gas when it transitions from the gas phase to the adsorbed phase (1 mol):
ε = P i P 0 V d P = P i P 0 R T P d P = R T I n P 0 P i        
where ε is the adsorption potential, J/mol; P0 is the saturated vapor pressure of gas, MPa; Pi is the equilibrium pressure of ideal gas under constant temperature, MPa; R is the molar gas constant, J/(K·mol); and T is the temperature, K.
Because the test temperature is higher than the critical temperature of methane (190.6 K), methane cannot normally liquefy, making P0 meaningless [49]. Instead, virtual saturated vapor pressure (Ps) is commonly used in research. The most commonly used methods for determining virtual saturated vapor pressure include the Dubinin method (Equation (4)), the Reid method (Equation (5)), the Antoine method (Equation (6)), the Astakhov method (Equation (7)), and the Amankwah method (Equation (8)):
P s = P c ( T T c ) 2
where Pc is the critical pressure of methane, MPa and Tc is the critical temperature of methane, MPa;
P s = P c e T b T c × l n P c 1 T b T c × 1 T c T
where Tb is the boiling point temperature of methane at 0.1 MPa, K
l n P s = B C / D + T
where B, C, and D are the vapor pressure parameters related to methane, dimensionless;
l n P s = a / T + b
where a and b are the vapor pressure parameters related to methane, dimensionless; and
P s = P c ( T T c ) k
where k is the coefficient related to adsorption behavior, dimensionless.
The adsorption space represents the volume occupied by the adsorbed gas on the adsorbent, and can be used as a parameter to characterize pore structure. As the adsorption space increases, the adsorption potential decreases. For isothermal adsorption experiments at different temperatures, higher adsorption pressure is required to adsorb the same volume of methane as the temperature increases. The adsorption of methane by coal is carried by van der Waals forces, primarily dispersion forces, which are temperature-independent; therefore, the adsorption capacity of coal for methane is often quantitatively characterized by the characteristic adsorption curve. The adsorption space can be calculated using Equation (9):
ω = m a d ρ ad = 16 V a 22,400 ρ ad
where ω is the adsorption space, cm3/g and mad is the absolute adsorption quantity, g/g.

3. Results and Discussion

3.1. Factors Influencing Adsorption Behavior

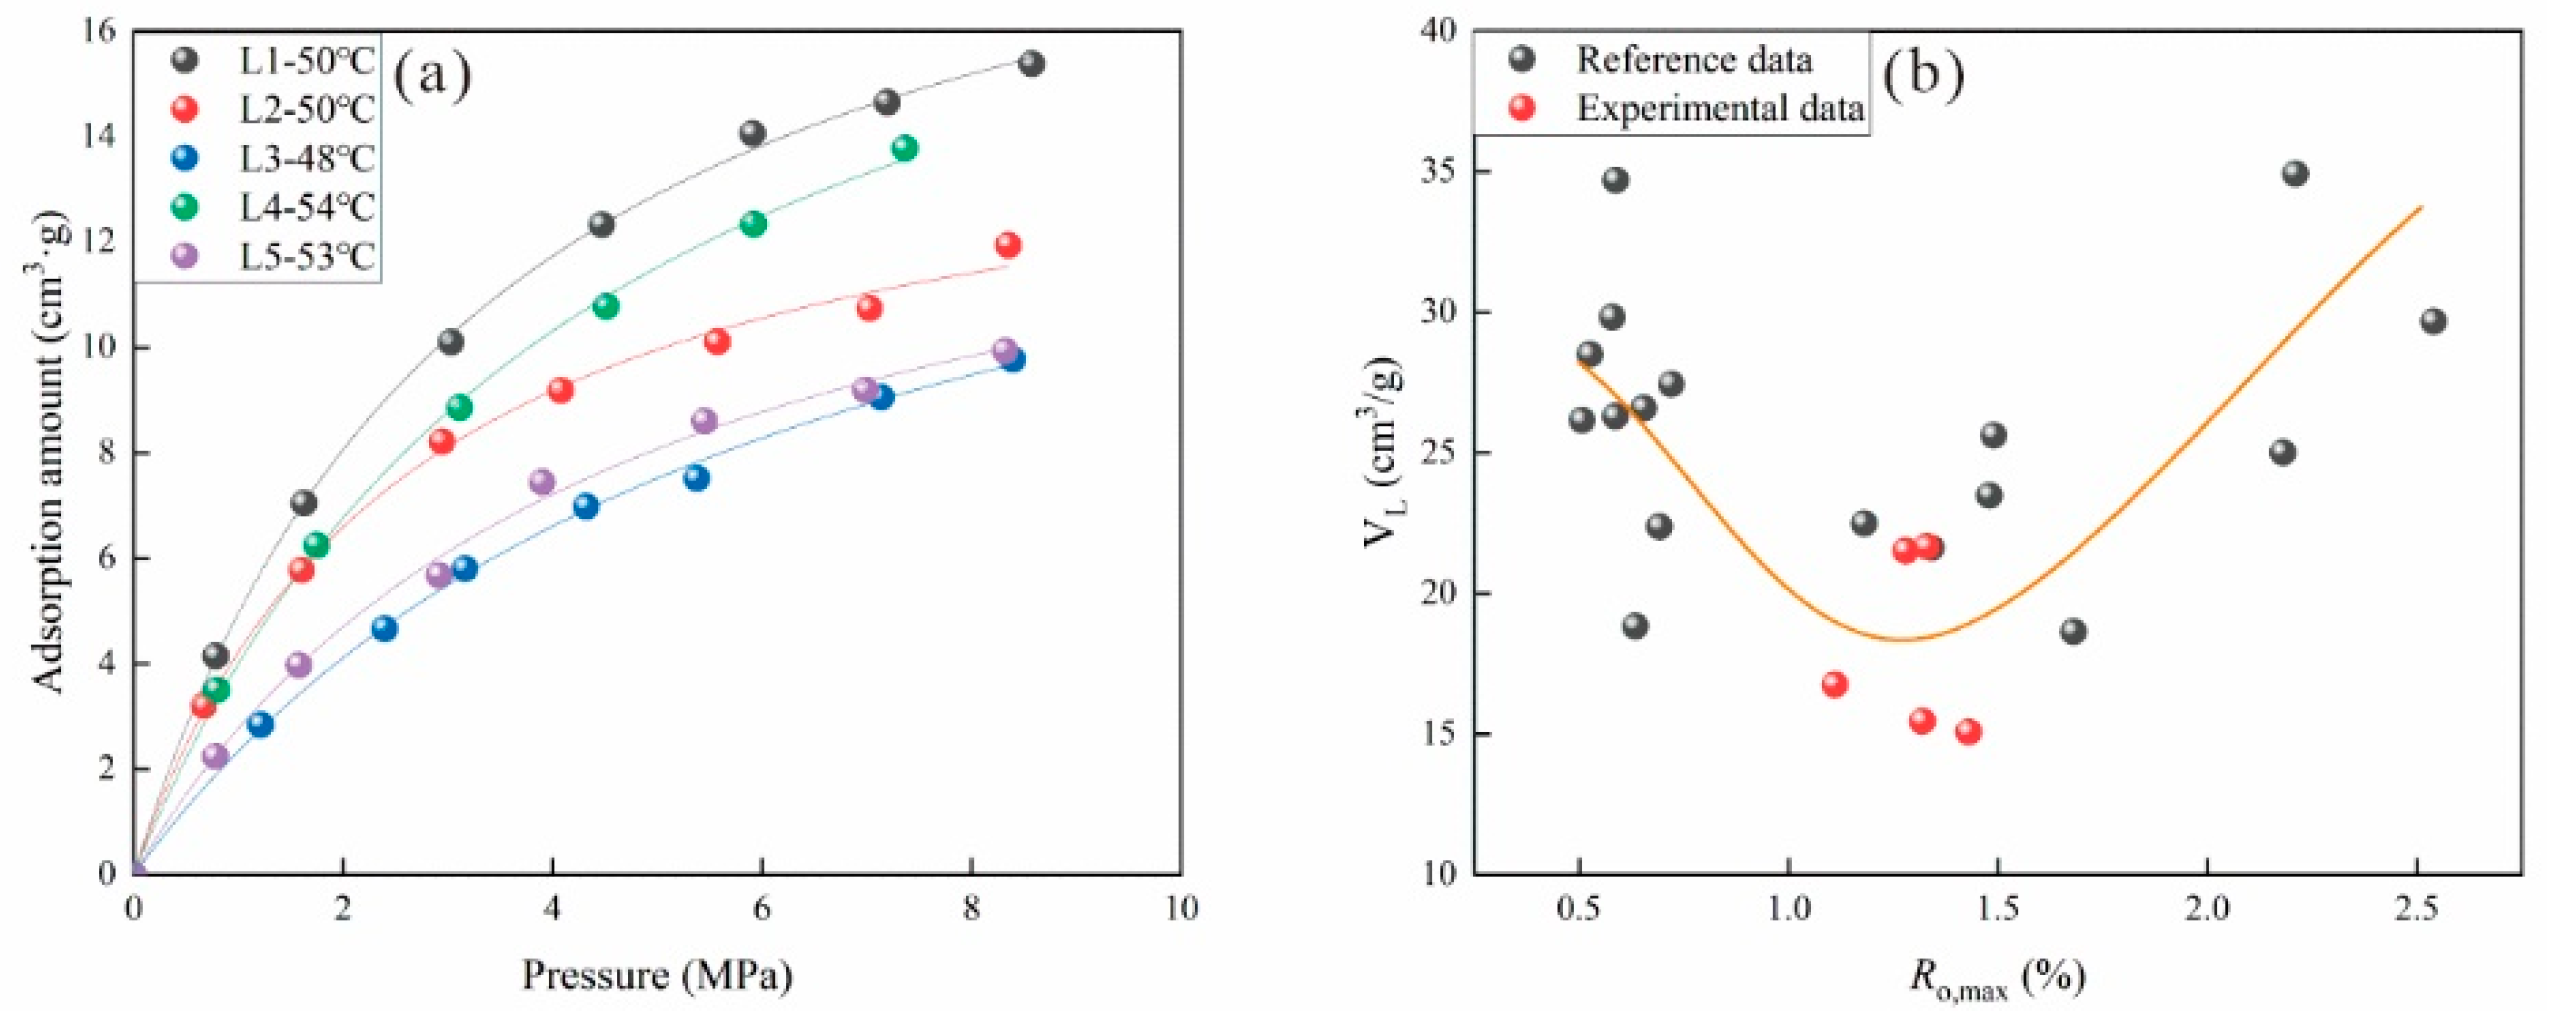
3.1.1. Effect of Coal Rank on Adsorption Behavior

The influence of coal rank on adsorption capacity is significant. The coal rank in this study area is relatively concentrated, with the Ro value generally ranging from 1.1% to 1.5%, while the research samples of Qiu et al. [50] show a wide range of coal ranks. Therefore, this study incorporates the research results of Qiu et al. [50] in order to further clarify the influence of coal rank on methane adsorption behavior (Figure 2b). With increasing coal rank, the adsorption capacity of coal for methane exhibits a “U-shaped” pattern. This is primarily because the polycondensation of aromatic rings and loss of aliphatic side chains during the medium-rank coal stage impacts the pore volume number and pore specific surface area of the coal, ultimately leading to a decrease in adsorption capacity [50,51].

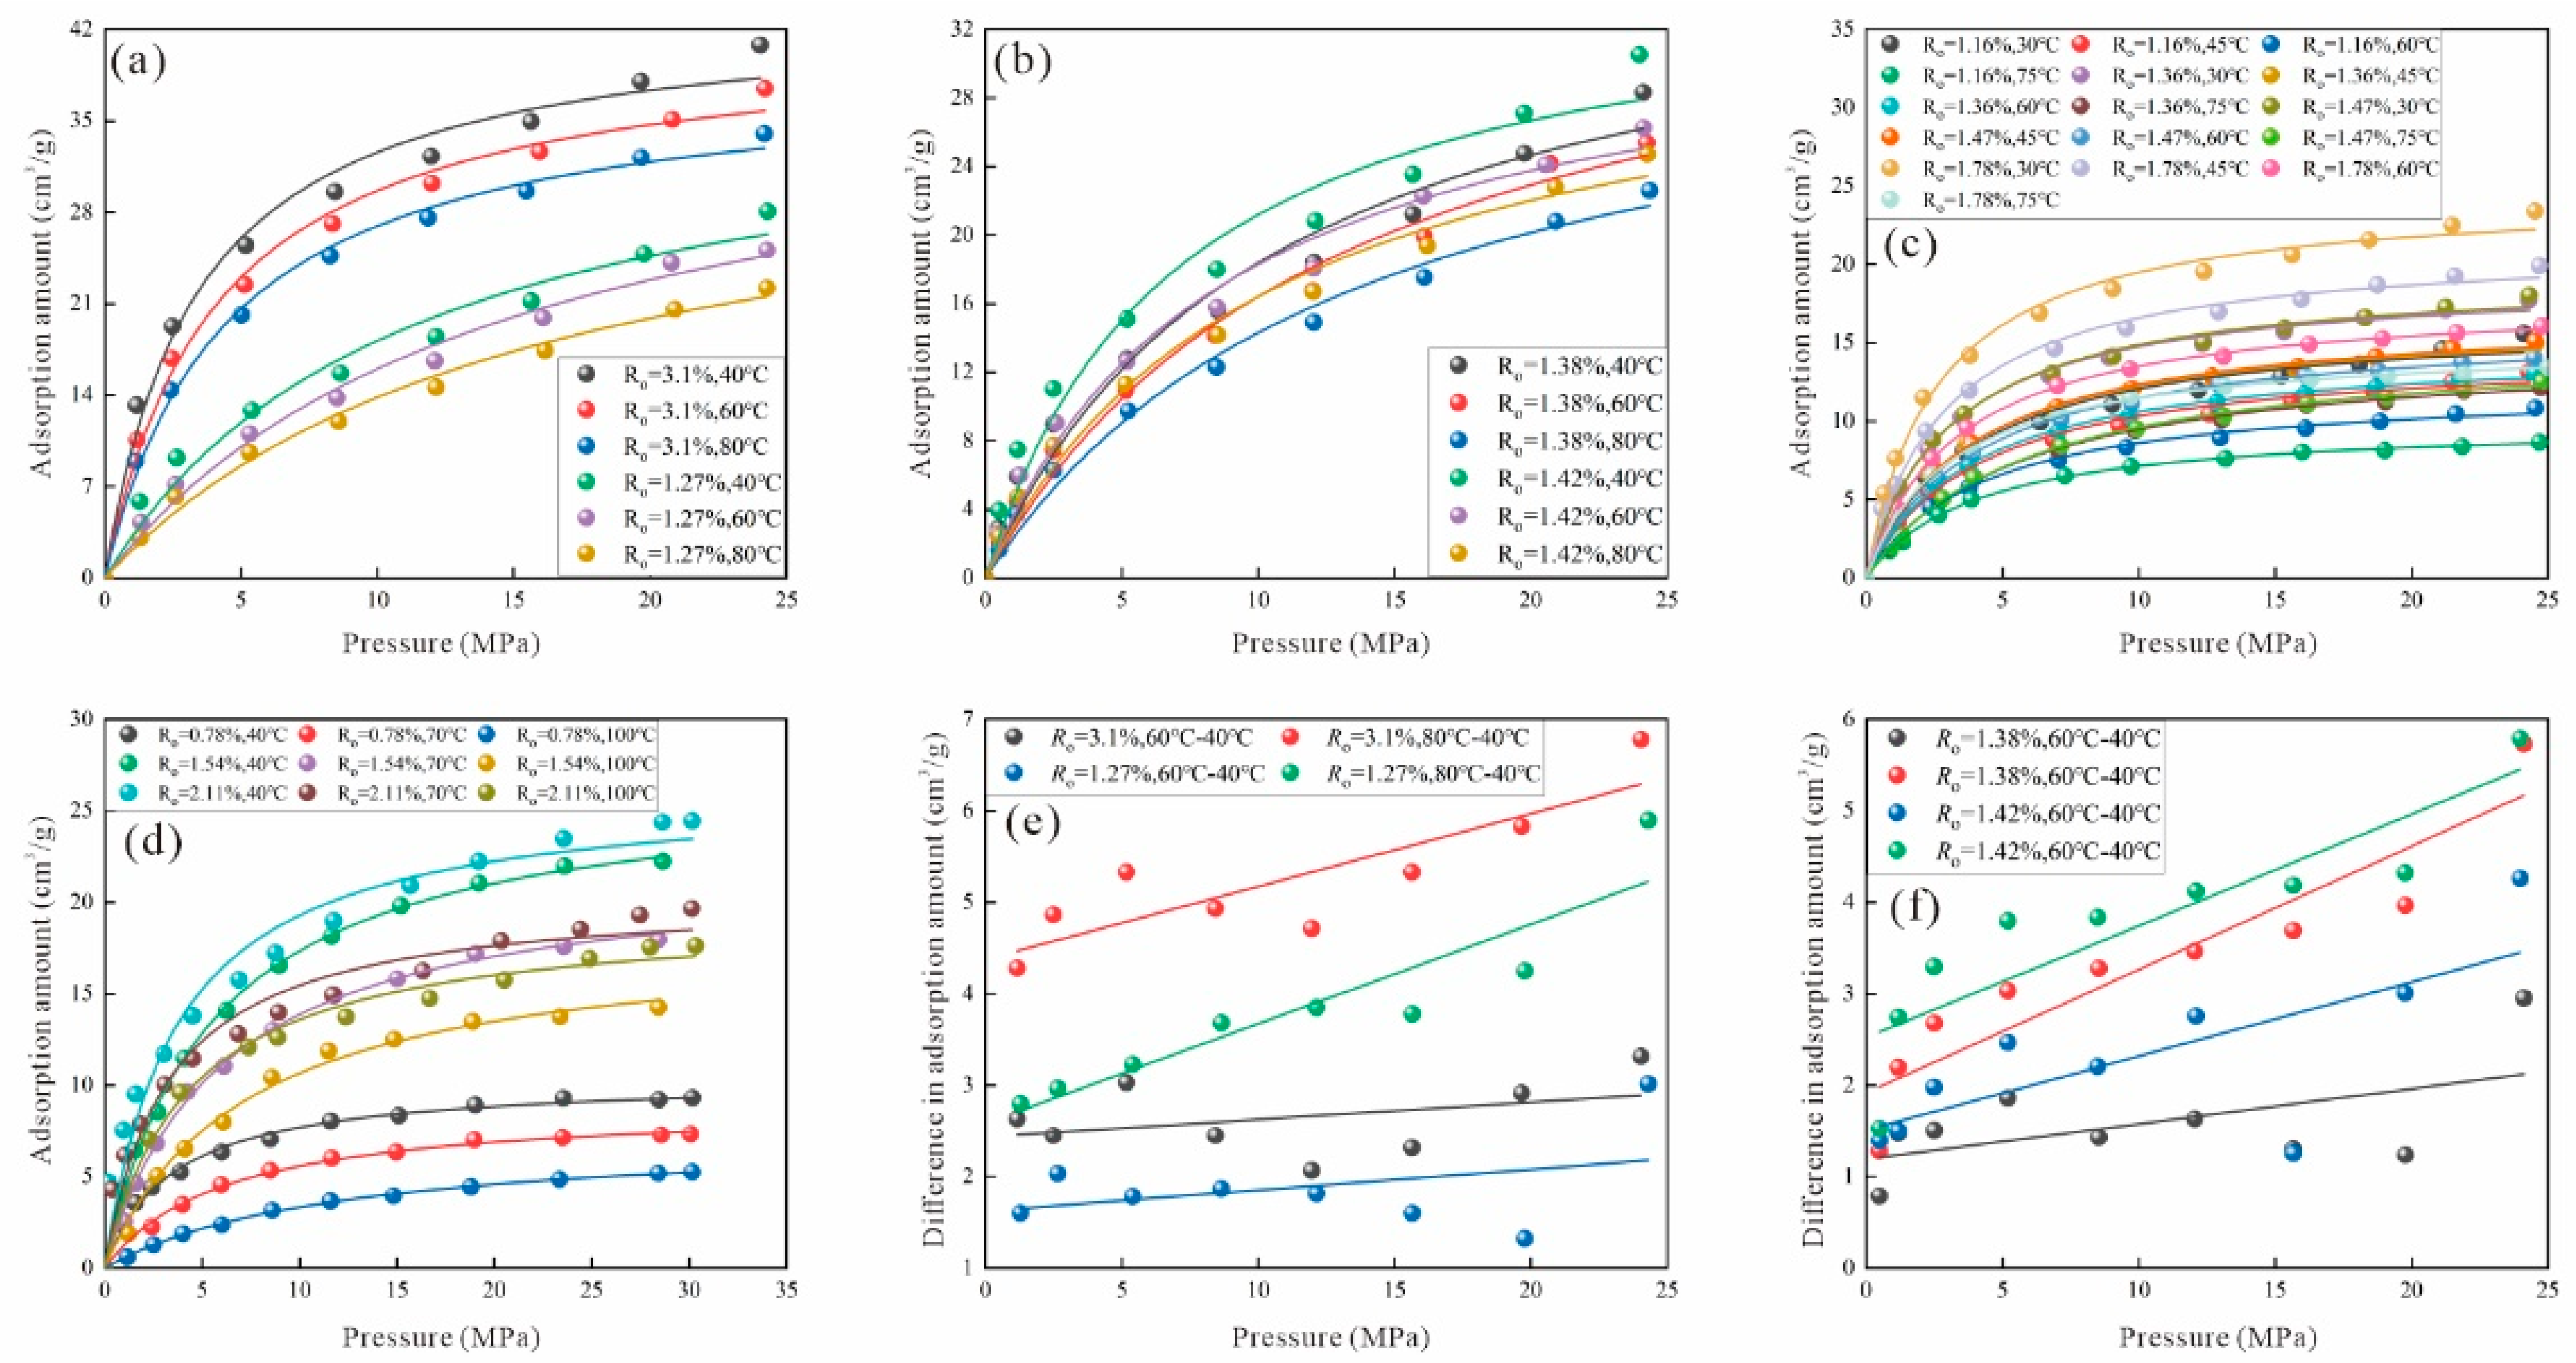
3.1.2. Effects of Pressure and Temperature on Adsorption Behavior

Increasing pressure promotes the adsorption of methane by coal, and this effect is evident in samples of different temperatures and coal ranks (Figure 2a). When the pressure is below 5 MPa, the increase in pressure significantly enhances methane adsorption, with the adsorption amount reaching over 50% of the total adsorption capacity across different samples. When the pressure exceeds 5 MPa, the increase in the adsorption amount becomes more gradual with increasing pressure.
To facilitate a more intuitive and convenient comparison of the impact of temperature on methane adsorption, this study incorporates the research findings of Gao et al. [52], Xie [53], Tao [54], and Wu [55], which are discussed in subsequent sections. It should be noted that Gao et al. [52] and Xie [53] used dried samples, while Tao [54] and Wu [55] used equilibrium water samples. The reason for using the research results of the above scholars is mainly because the samples studied by Gao et al. [52], Xie [53], and Tao [54] were all from the Linxing block, which has the same geological conditions. The samples studied by Wu [55] were from blocks such as Liulin and Hancheng, which are comparable. As shown in Figure 3a–d, increasing temperature inhibits methane adsorption by coal. This inhibition effect applies to samples of different coal ranks and different moisture contents. To further analyze the inhibition effect of temperature, this study quantifies the influence of temperature by comparing the adsorption amounts at different temperatures under the same pressure. The sensitivity of methane adsorption to temperature varies under different pressures. Higher pressures result in a more pronounced inhibitory effect of temperature on methane adsorption (Figure 3e,f), indicating a certain regularity. For samples of different coal ranks, an increase in coal rank enhances the inhibitory effect of temperature on methane adsorption.

3.2. Virtual Saturated Vapor Pressure

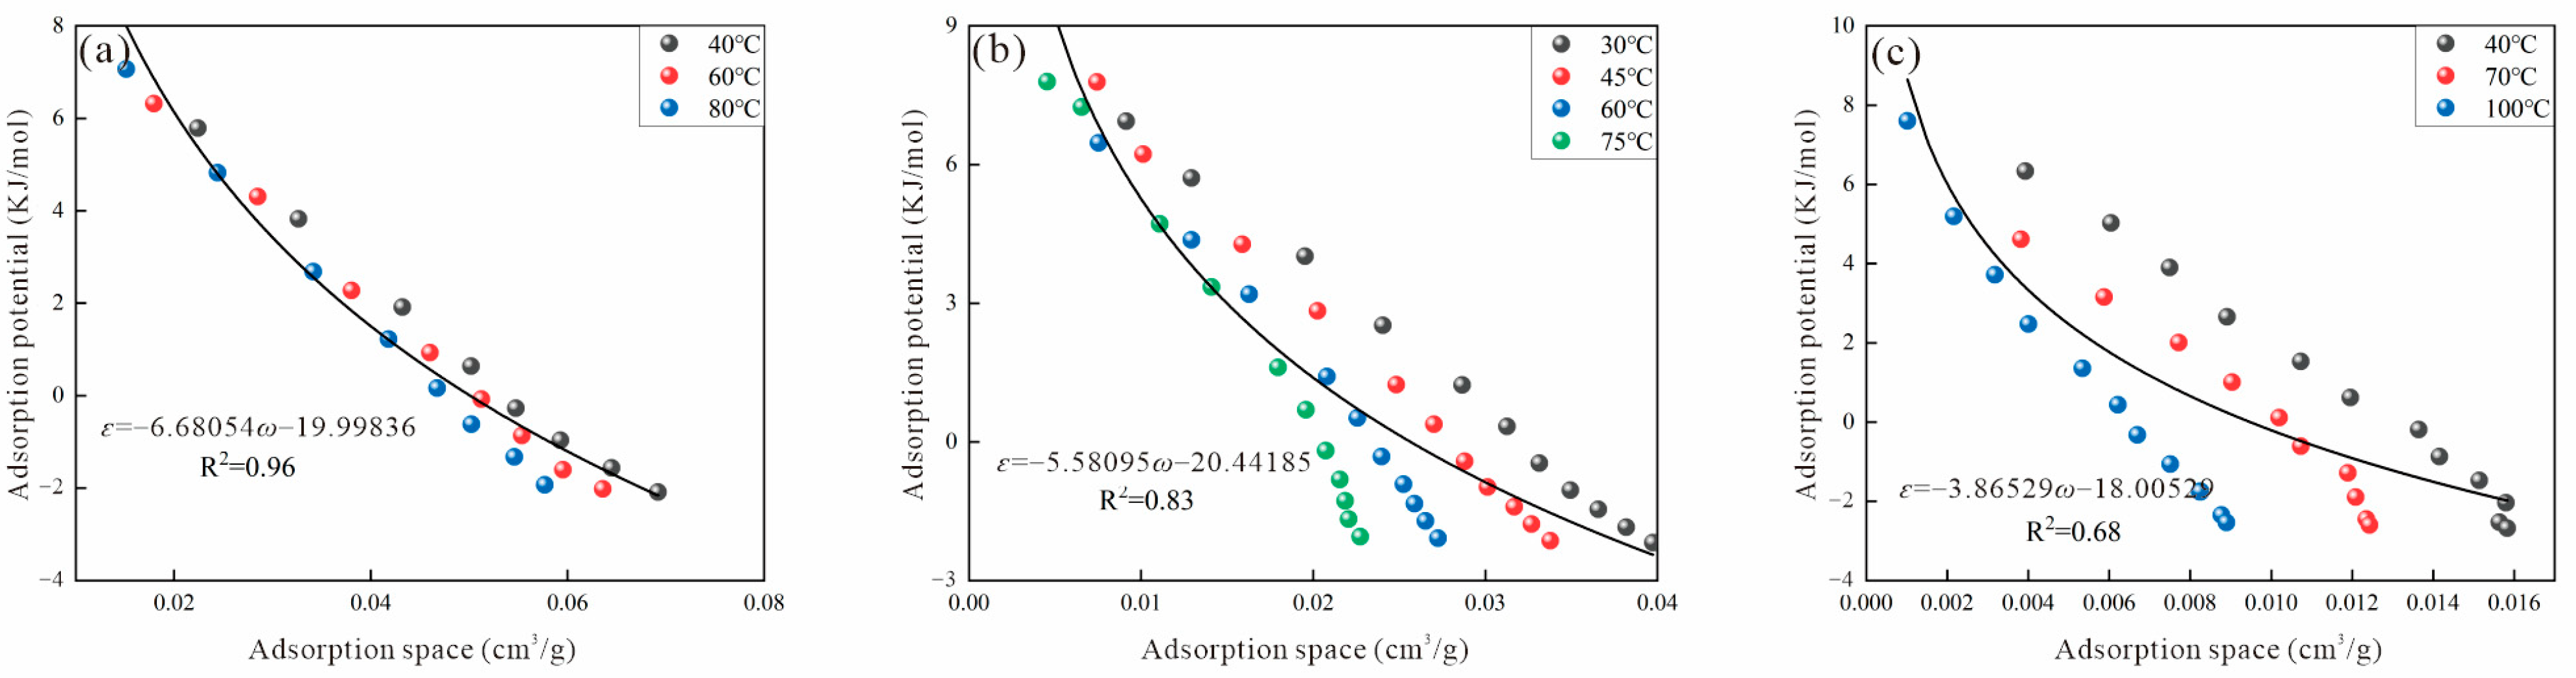
3.2.1. Dubinin Method
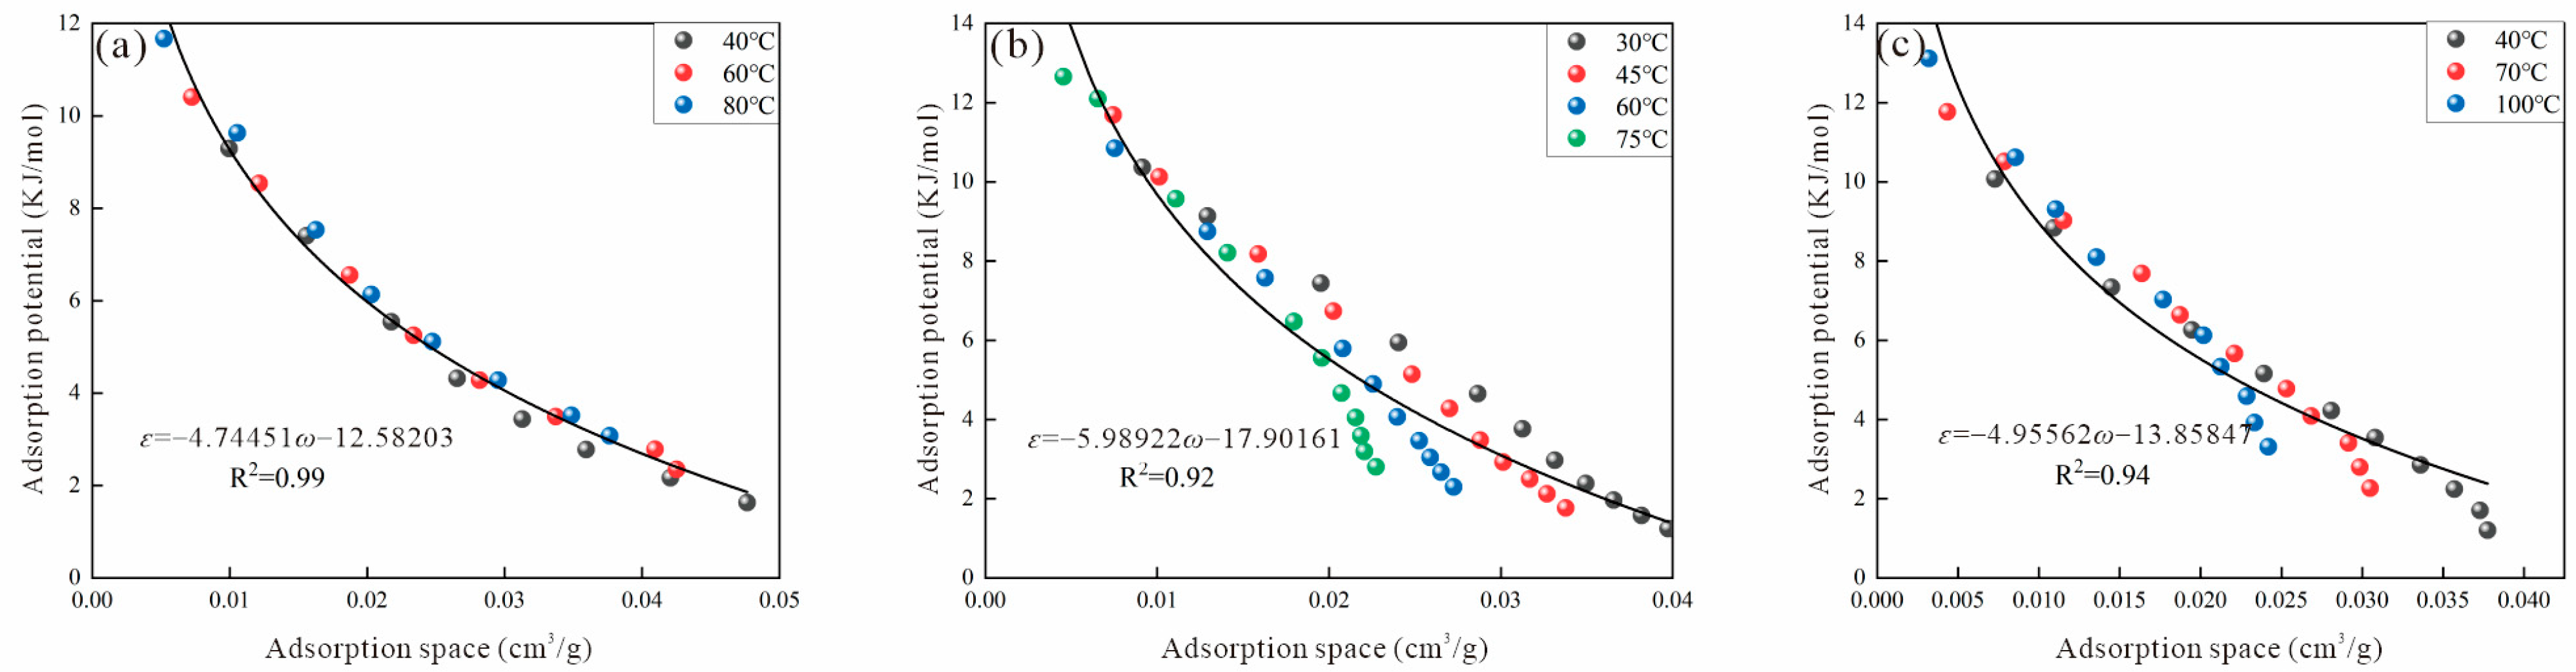
Due to the differences in sample sources among various researchers and the strong heterogeneity of coal reservoirs, the characteristic adsorption curves calculated using the same model for different samples exhibit both similarities and differences. This study selects the characteristic adsorption curves of representative samples (different types of characteristic adsorption curves) for discussion in order to clarify the accuracy and applicability of different calculation models.
The characteristic adsorption curves of representative samples selected based on the Dubinin method are shown in Figure 4. It can be observed that the virtual saturated vapor pressure calculated by the Dubinin method is relatively low and that the adsorption potential of different samples exhibits negative values. Regarding the calculation method, the Dubinin method classifies the characteristic adsorption curves into three categories: (1) the first category, shown in Figure 4a, displays a high degree of fitting for the characteristic adsorption curve, but it is controlled by temperature, resulting in non-overlapping characteristic adsorption curves at different temperatures; (2) the second category, shown in Figure 4b, exhibits a low degree of fitting for the characteristic adsorption curve, with noticeable non-overlapping characteristic adsorption curves at different temperatures, contradicting the adsorption potential theory; (3) the third category, shown in Figure 4c, shows a high degree of fitting for the characteristic adsorption curve, with relatively overlapping characteristic adsorption curves at different temperatures but with negative values present. Because the temperature of deep coal reservoirs generally exceeds 313.15 K, the calculated virtual saturated vapor pressure at this temperature is 12.47 MPa. As the temperature increases, the virtual saturated vapor pressure continues to rise, reaching 15.86 MPa at 333.15 K. Therefore, for deep coal reservoirs, the Dubinin method is suitable for calculating the virtual saturated vapor pressure of supercritical methane at lower pressures.

3.2.2. Reid Method

The relationship between adsorption potential and adsorption space for representative samples selected based on the Reid method is shown in Figure 5. It can be observed that the characteristic adsorption curves calculated using the Reid method are relatively dispersed at different temperatures and that the adsorption potential shows negative values. The Reid method classifies the characteristic adsorption curves into two categories: (1) the first category, shown in Figure 5a, exhibits a high degree of fitting for the characteristic adsorption curve, but there are certain deviations between the characteristic adsorption curves at different temperatures; (2) the second category, shown in Figure 5b,c, displays a low degree of fitting for the characteristic adsorption curve, with noticeable differentiation in adsorption potential at different temperatures, contradicting the adsorption potential theory. When the reservoir temperature is 313.15 K and 373.15 K, the virtual saturated vapor pressures are 10.79 MPa and 13.33 MPa, respectively. This is approximately 13% lower than the values obtained using the Dubinin method. Therefore, the applicability of Reid method is more limited. For deep coal reservoirs, the Reid method is not suitable for calculating the virtual saturated vapor pressure of supercritical methane.

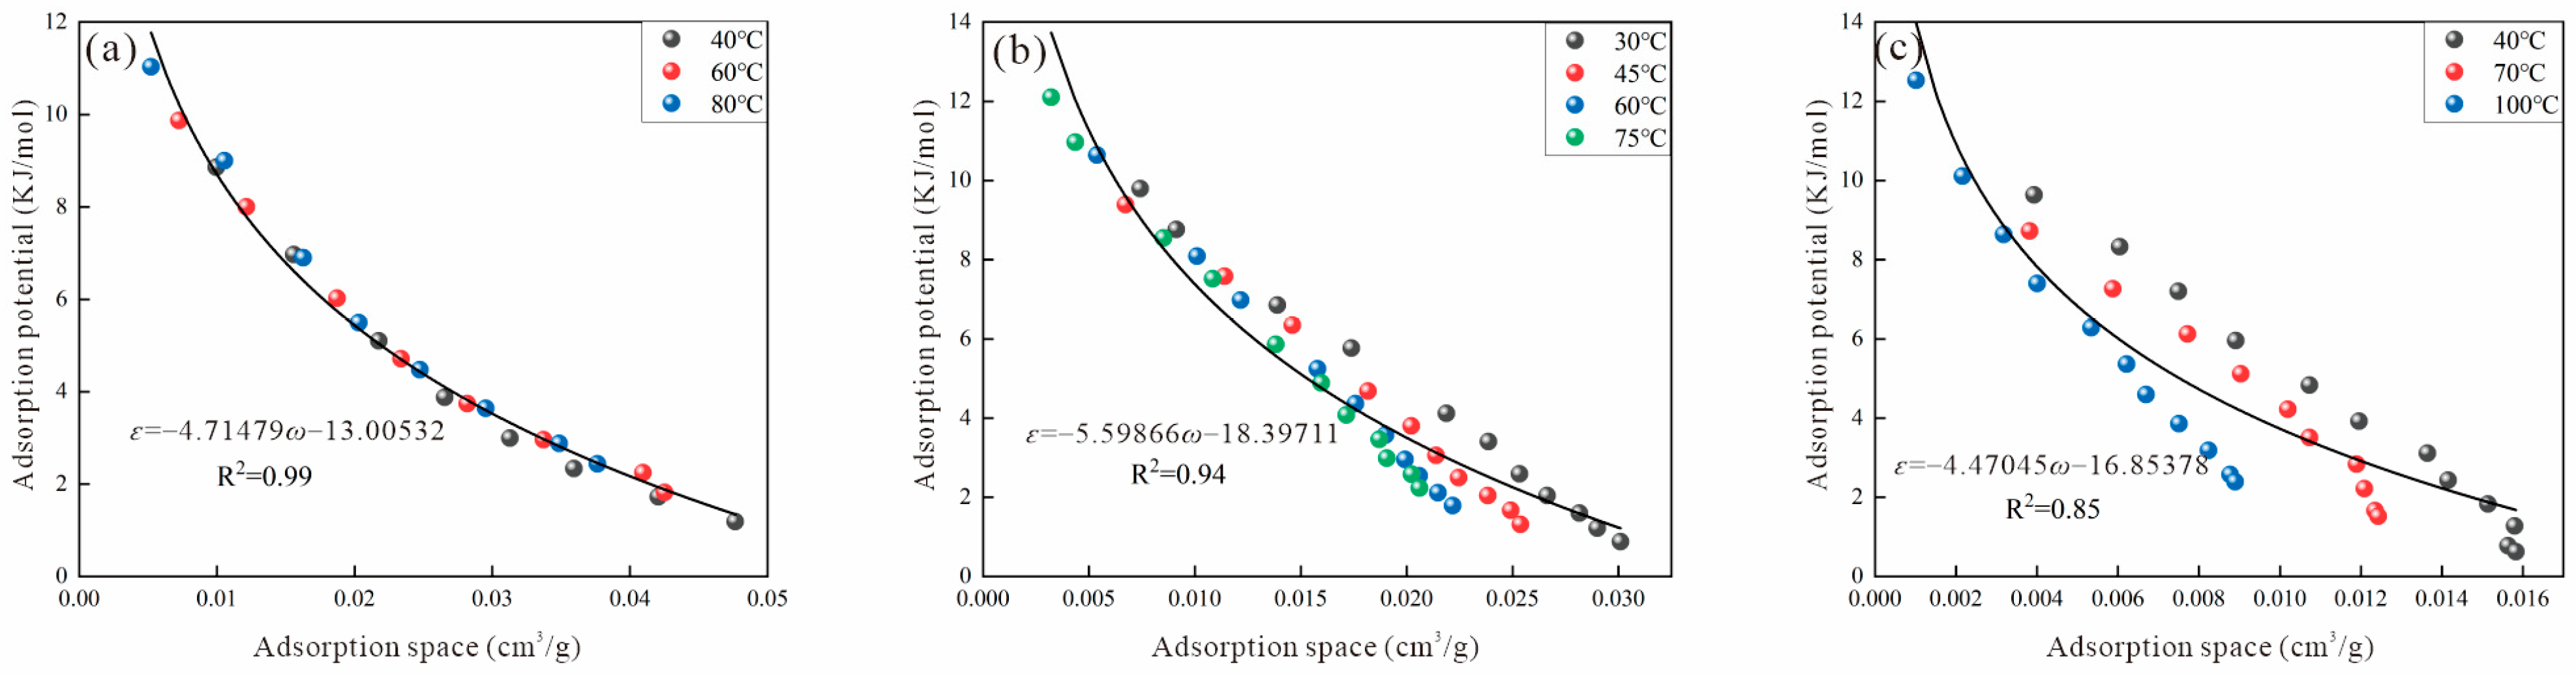
3.2.3. Antoine Method

Based on the Antoine method, the relationship between the adsorption space and adsorption potential for representative samples is shown in Figure 6. Compared to the Dubinin and Reid methods, the Antoine method eliminates the occurrence of negative adsorption potentials. However, the characteristic adsorption curves still show some differences. The Antoine method categorizes the characteristic adsorption curves into two types: (1) the first type, shown in Figure 6a, exhibits a high degree of fitting for the characteristic adsorption curve, with consistent curves across different temperatures; (2) the second type, shown in Figure 6b,c, demonstrates a relatively lower degree of fitting. While the characteristic adsorption curves overlap well at low pressures across different temperatures, discrepancies appear at higher pressures. The primary reason for these discrepancies is that the virtual saturated vapor pressure calculated using the Antoine method is solely based on the temperature, while the adsorption capacities of different coal ranks inherently differ. Thus, the calculated adsorption spaces at the same temperature and pressure differ. When the reservoir temperatures are 313.15 K and 373.15 K, the virtual saturated vapor pressures are 45.41 MPa and 82.76 MPa, respectively; ignoring other factors, this could result in overestimation or underestimation of the virtual saturated vapor pressure for different coal ranks at the same temperature. Therefore, the applicability of the Antoine method is also relatively limited. For deep coal reservoirs, the Antoine method can be used to fit low-pressure characteristic adsorption curves at different temperatures and pressures. Using the obtained fitting parameters as a foundation might yield more accurate calculations.

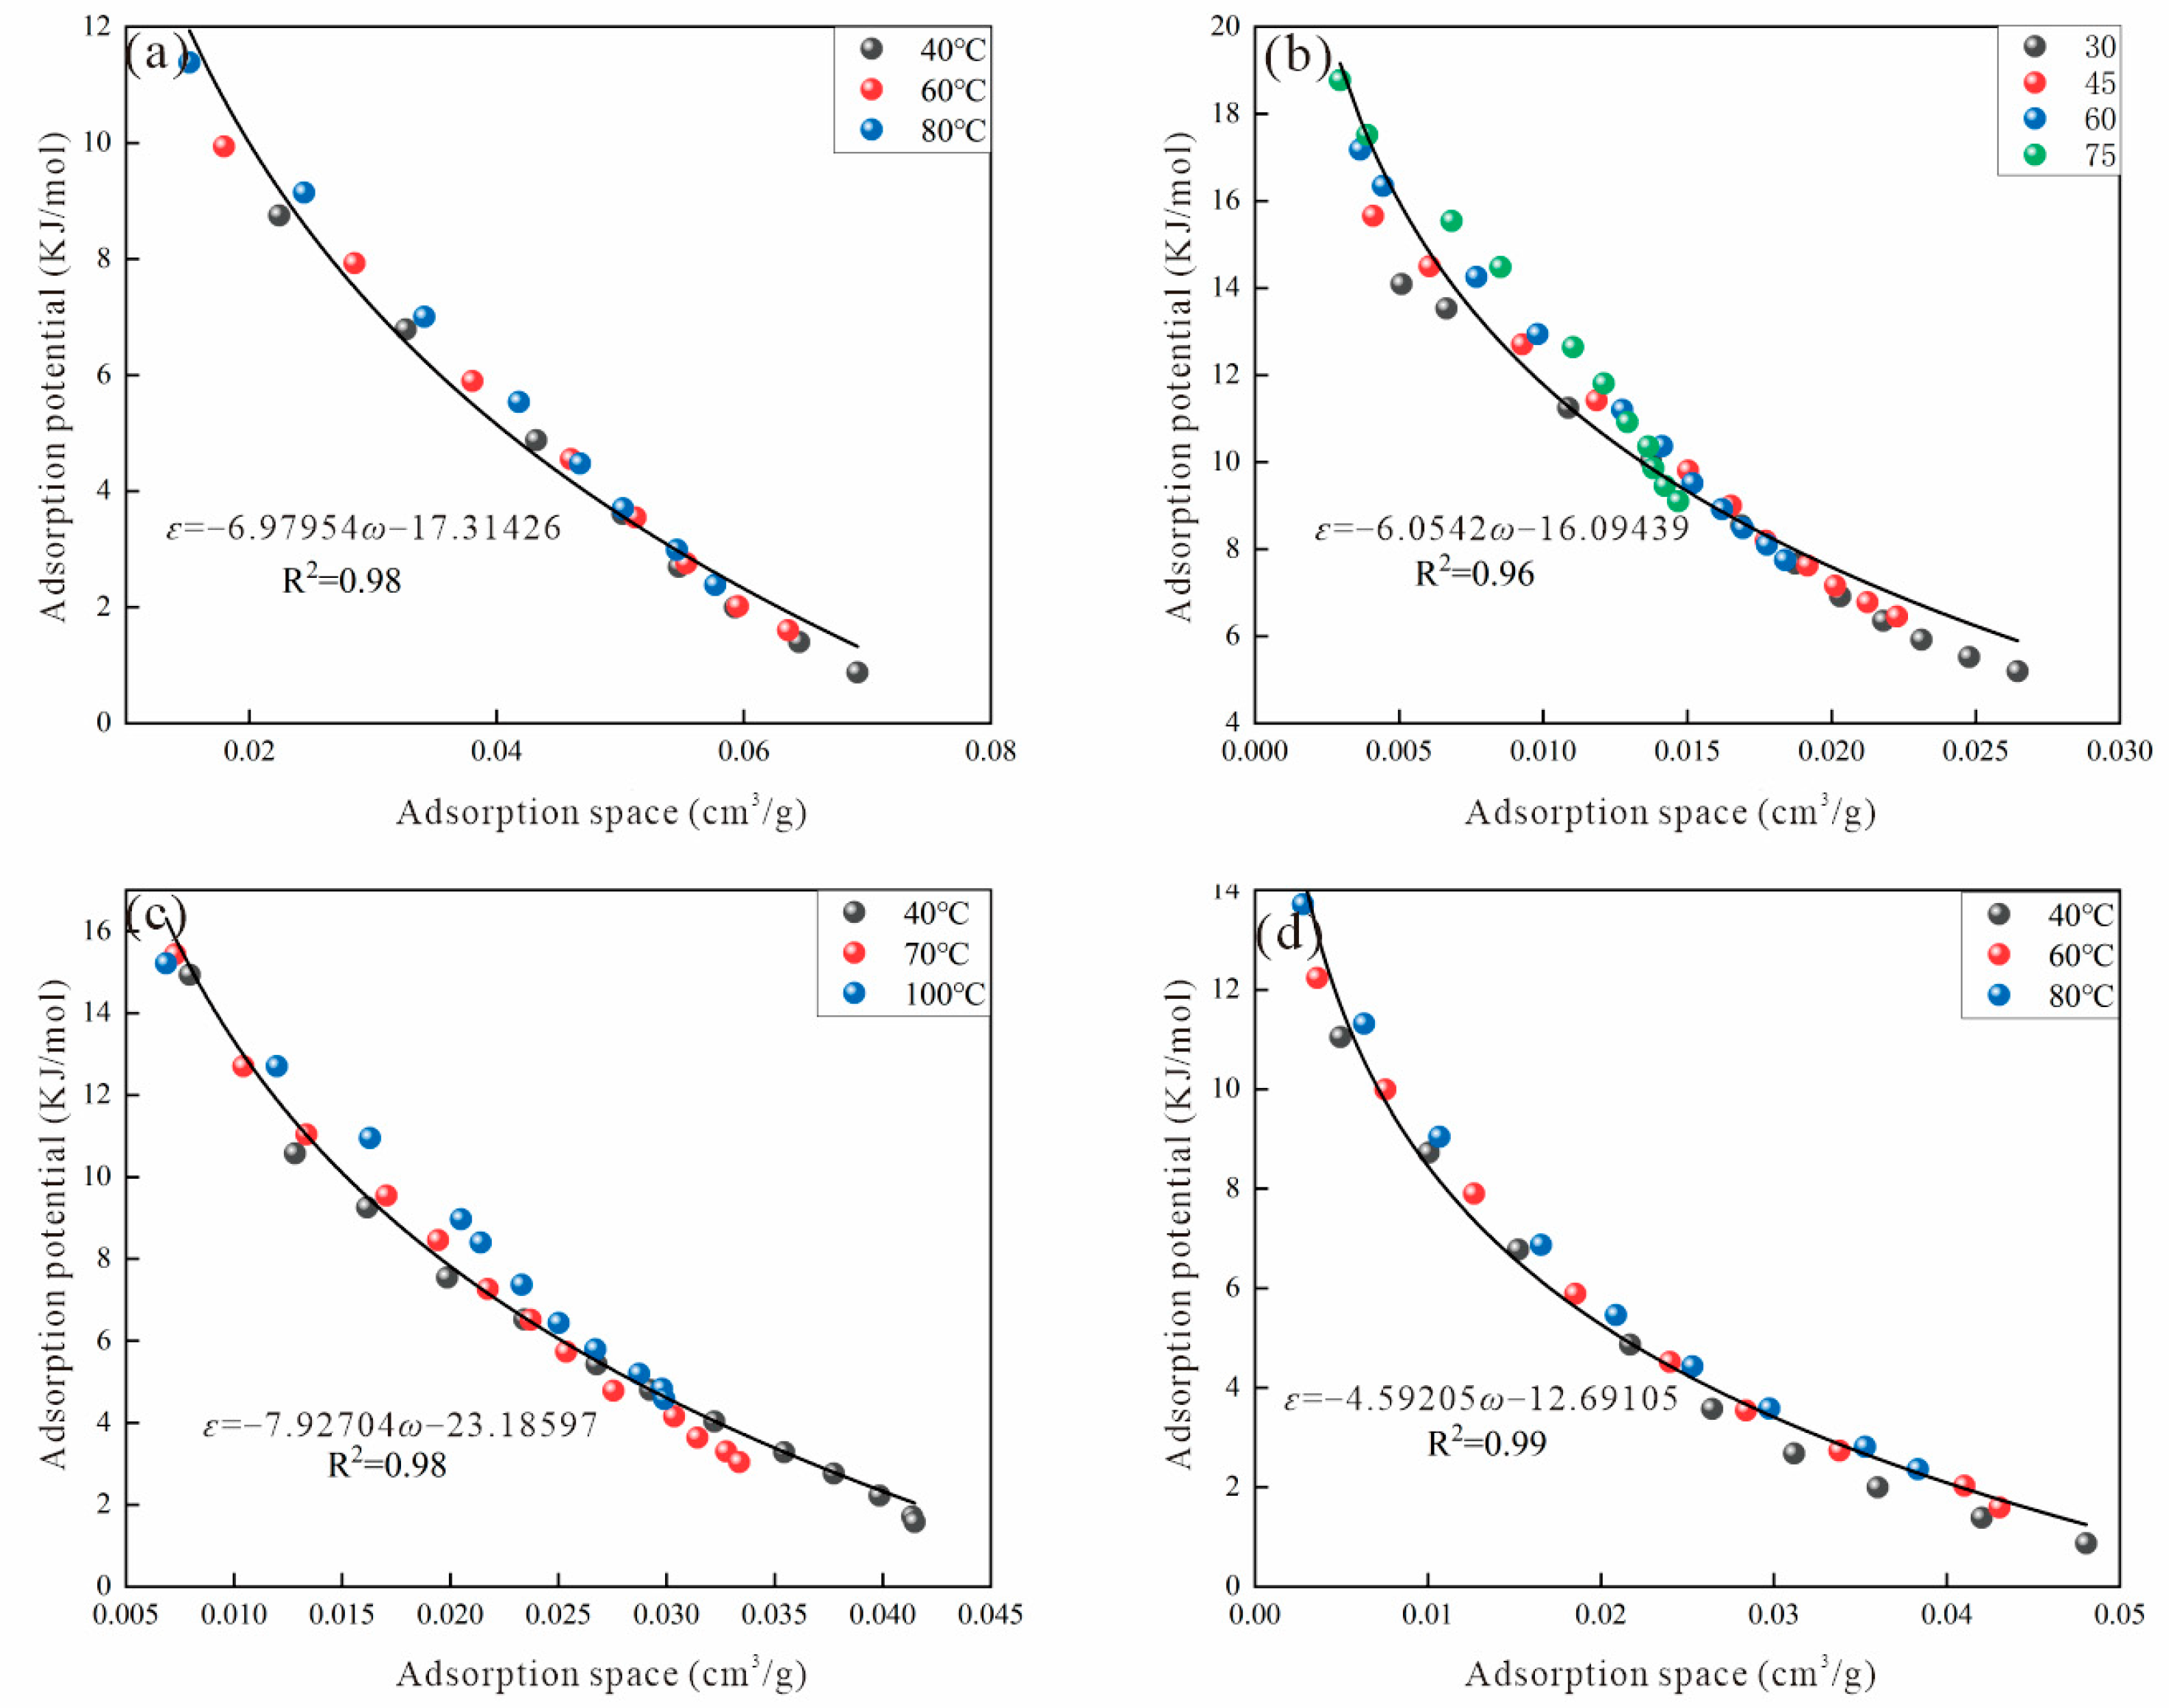
3.2.4. Astakhov Method

Based on the Astakhov method, the relationship between the adsorption space and adsorption potential for representative samples is shown in Figure 7. Similar to the Antoine method, the Astakhov method calculates adsorption potentials without negative values. However, differences in the characteristic adsorption curves persist. The Astakhov method categorizes the characteristic adsorption curves into three types: (1) the first type, shown in Figure 7a, exhibits a high degree of fitting for the characteristic adsorption curve, with relatively overlapping curves across different temperatures; (2) the second type, shown in Figure 7b, demonstrates a relatively lower degree of fitting, with the characteristic adsorption curves differing at high and low pressures; (3) the third type, shown in Figure 7c, has a low degree of fitting, with significant differences in the characteristic adsorption curves at different temperatures. The reason for these discrepancies is similar to that of the Antoine method. The calculation of virtual saturated vapor pressure in the Astakhov method is solely based on the temperature, neglecting factors such as coal rank and coal properties, leading to deviations in the virtual saturated vapor pressure at different temperatures. When the reservoir temperatures are 313.15 K and 373.15 K, the virtual saturated vapor pressures are 38.37 MPa and 65.21 MPa, respectively. Therefore, the applicability of the Astakhov method also has limitations. For deep coal reservoirs, the Astakhov method can refer to the approaches used by the Antoine method, such as fitting low-pressure characteristic adsorption curves at different temperatures and pressures and using the obtained fitting parameters as a basis for more accurate calculations.

3.2.5. Amankwah Method

When calculating the virtual saturated vapor pressure using the Amankwah method, it is first necessary to determine the coefficient k. However, there is no standardized method for determining this coefficient. This study uses an assumed substitution method to determine the optimal k value for different samples at different temperatures. First, a k value is assumed; then, the characteristic adsorption curves are fitted using the calculated values and the optimal k range is judged using the correlation coefficient method. Finally, mathematical methods are employed to determine the optimal k value. In this study, the range of k values is set from 2 to 10. The characteristic adsorption for different k values is shown in Figure 8b. It can be seen that when k values are smaller, the fitting relationship between adsorption potential and adsorption space is better for each sample, but the adsorption potential has negative values. When k values are larger, the degree of dispersion between the adsorption potential and adsorption space increases, which disrupts the properties of the characteristic adsorption curve. As the k value increases, the characteristic adsorption curve shifts upwards and the characteristic adsorption curves first converge and then diverge. The relationship between the correlation coefficient of each sample and the k value is shown in Figure 8c and Table 2.
Based on the optimal k values calculated using the Amankwah method, the relationship between the adsorption space and adsorption potential for representative samples is shown in Figure 9. It can be seen that the Amankwah method not only avoids negative values in the adsorption potential but also ensures the uniqueness of the characteristic adsorption curves at different temperatures. The characteristic adsorption curves of different samples show a high degree of fit, meeting precise accuracy requirements. This approach provides a systematic method for determining the optimal k value for various samples and temperatures, balancing the trade-offs between fitting accuracy and physical realism so as to avoid negative adsorption potentials. For deep coal reservoirs, finding the appropriate k value is crucial for accurately predicting the virtual saturated vapor pressure, and consequently the adsorption characteristics of methane under reservoir conditions.

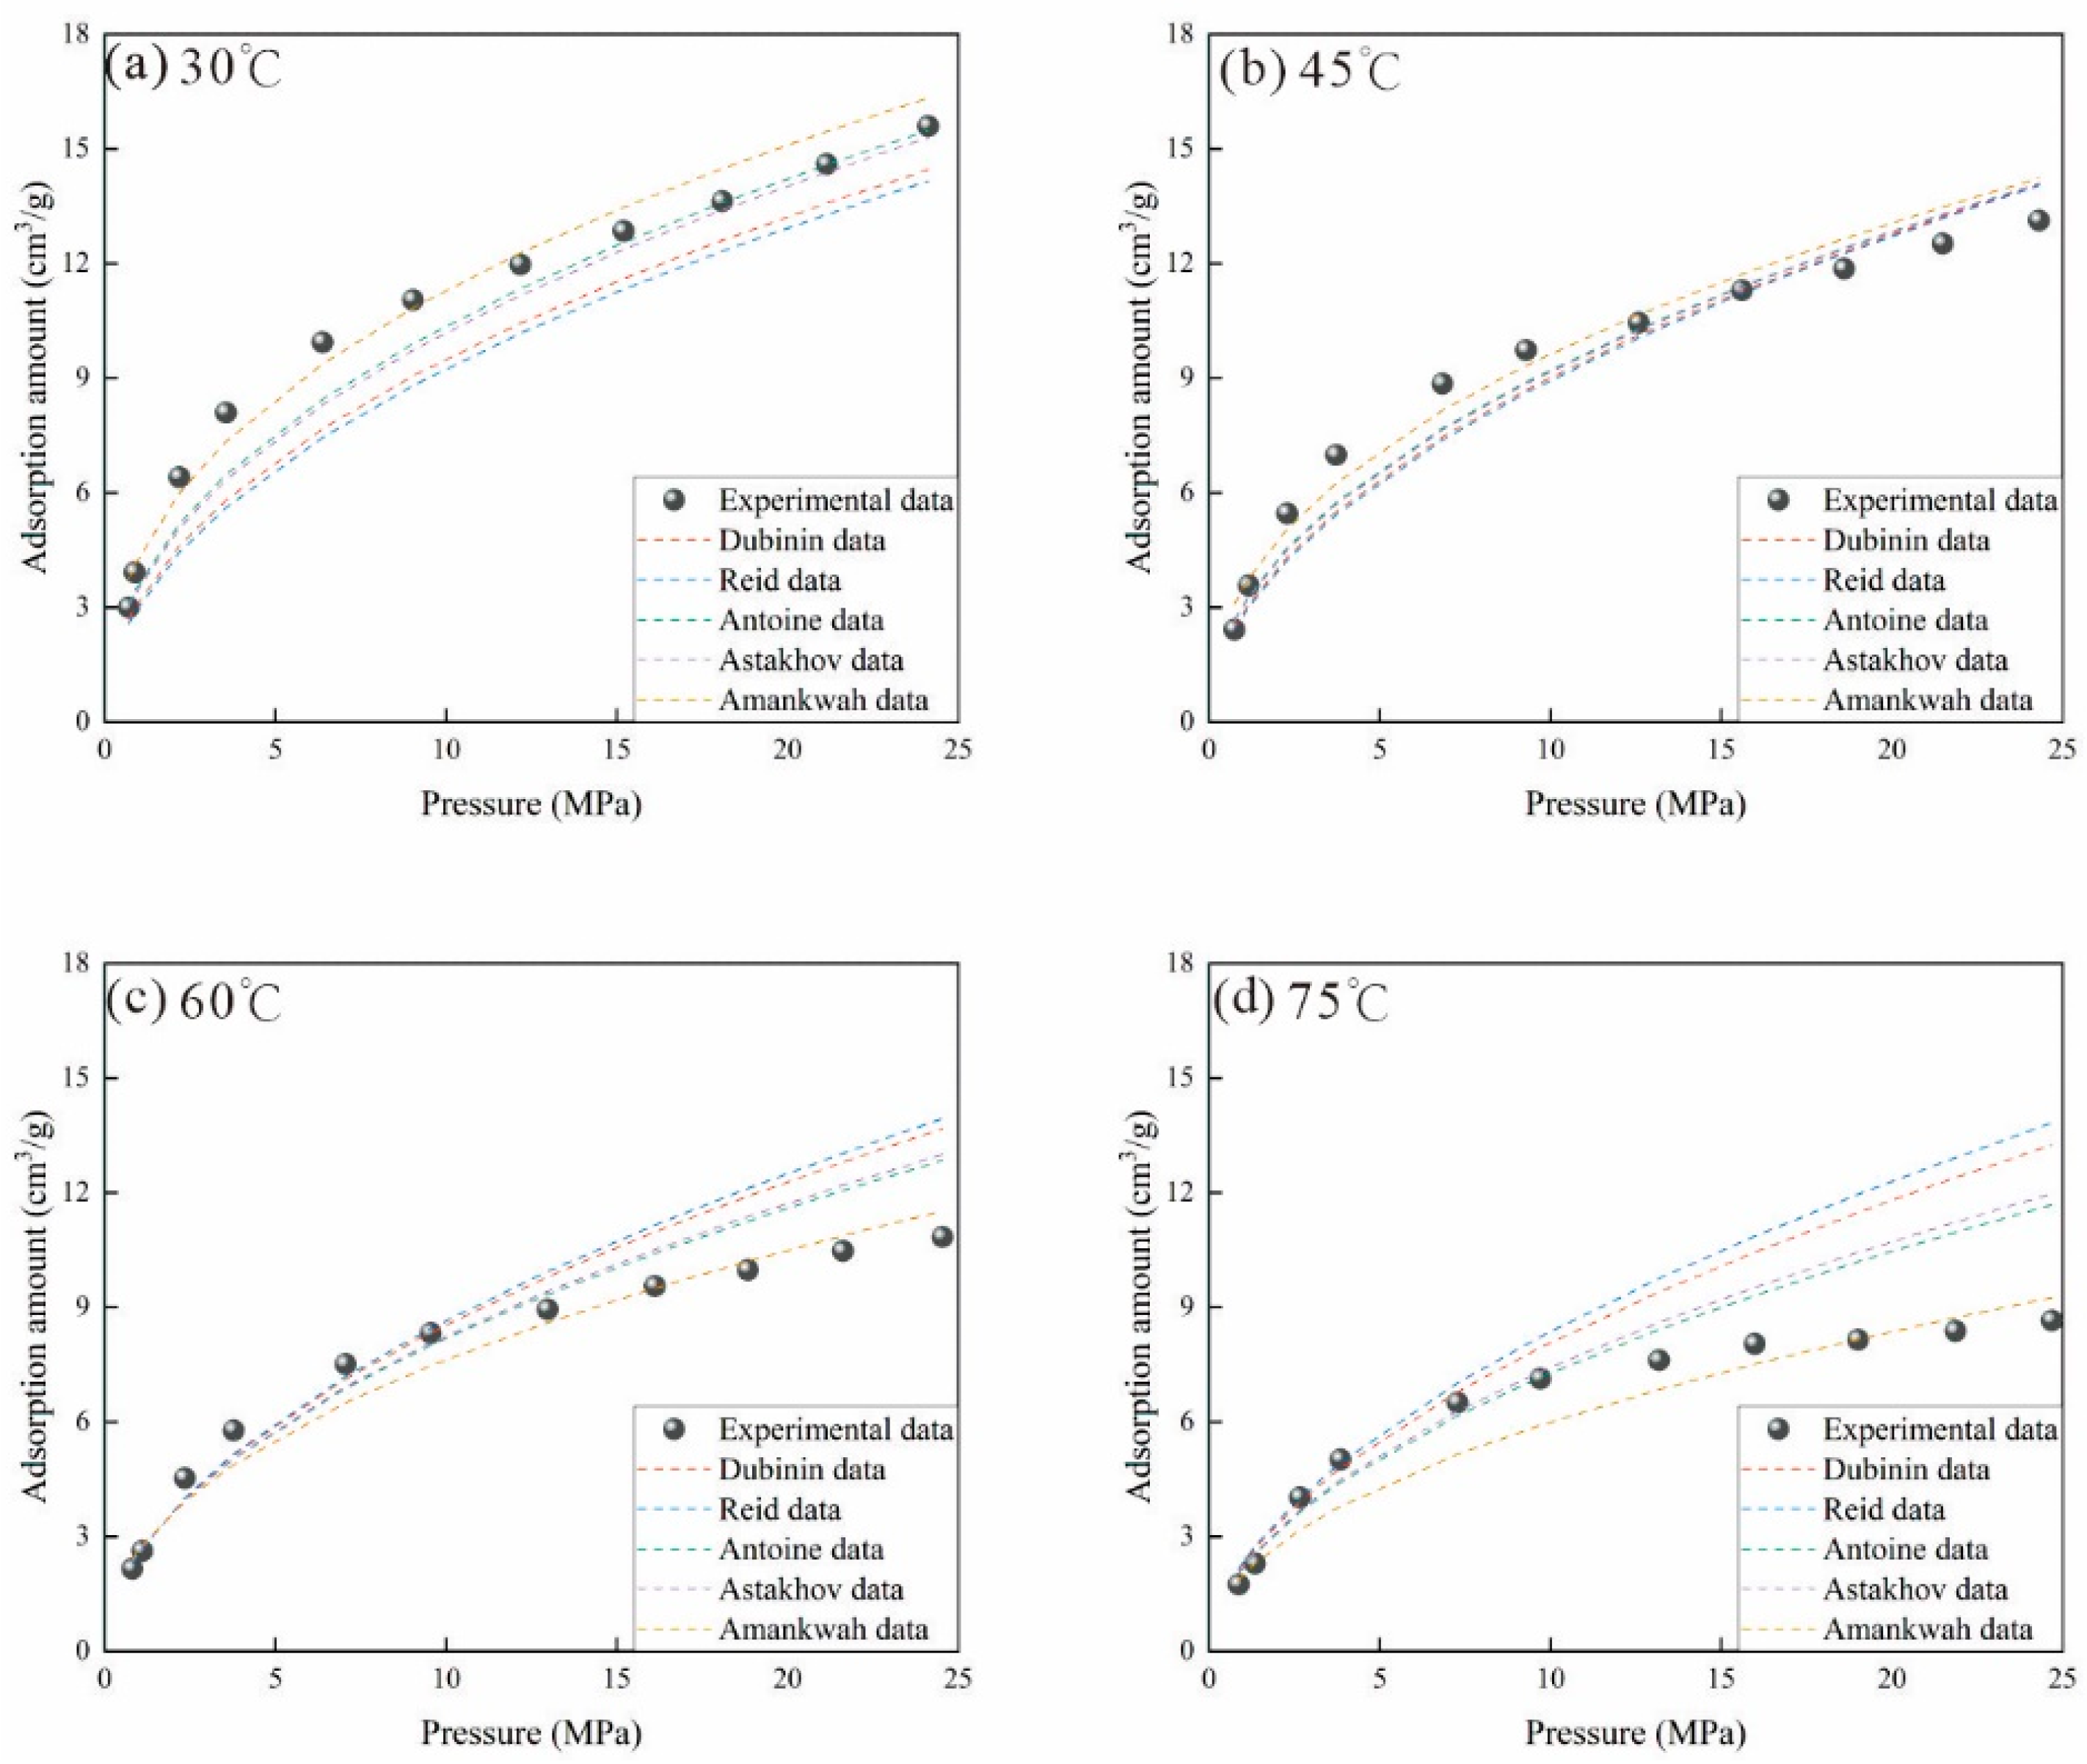
3.2.6. Error Analysis of Different Methods

The adsorption potential theory can be applied to calculate the methane adsorption amount at any temperature and pressure conditions. Using different virtual saturation vapor pressure calculation methods, the isothermal adsorption curves of different samples (Ro = 3.1% and Ro = 1.16%) under various temperatures and pressures are shown in Figure 10 and Figure 11. Overall, the results from different methods indicate that the methane adsorption amount increases with increasing pressure and decreases with rising temperature. However, there are significant differences in the adsorption amounts obtained based on different virtual saturation vapor pressure calculation methods.
Although R2 is a widely used indicator of model goodness-of-fit, it can be affected by outliers in certain cases, potentially masking the true impact of outliers on model performance. In contrast, the average relative error (ARE) provides information on the relative size of the prediction errors, which helps in understanding the prediction accuracy of the model across different data points, while the root mean squared error (MSE) provides information on the absolute size of the prediction error, which helps in evaluating the model’s overall fitting performance. Therefore, in this paper the ARE and MSE, calculated based on Equations (10) and (11), respectively, are used to evaluate the model’s applicability. As shown in Table 3, the results obtained using the Reid model generally exhibit the largest errors, while the results based on the Amankwah model show the highest accuracy. Moreover, while the differences between the samples are significant (the ARE values for the samples with Ro values of 3.1% and 1.16% obtained using the Reid method are 6.51% and 16.90%, respectively), these differences do not affect the goodness-of-fit ranking of the models (the Amankwah model is superior to the Reid model), which is hypothesized to be due to differences in pore structure between the samples. In summary, the goodness-of-fit performance of the models is ranked as follows: Amankwah model > Antonie model > Astakhov model > Dubinin model > Reid model:
ARE = 1 N 1 n a b s V s V y V s
MSE = 1 N 1 n ( V s V y ) 2
where N is the number of isothermal data points, Vs is the measured adsorption amount at equilibrium pressure, and Vy is the fitted adsorption amount at equilibrium pressure.

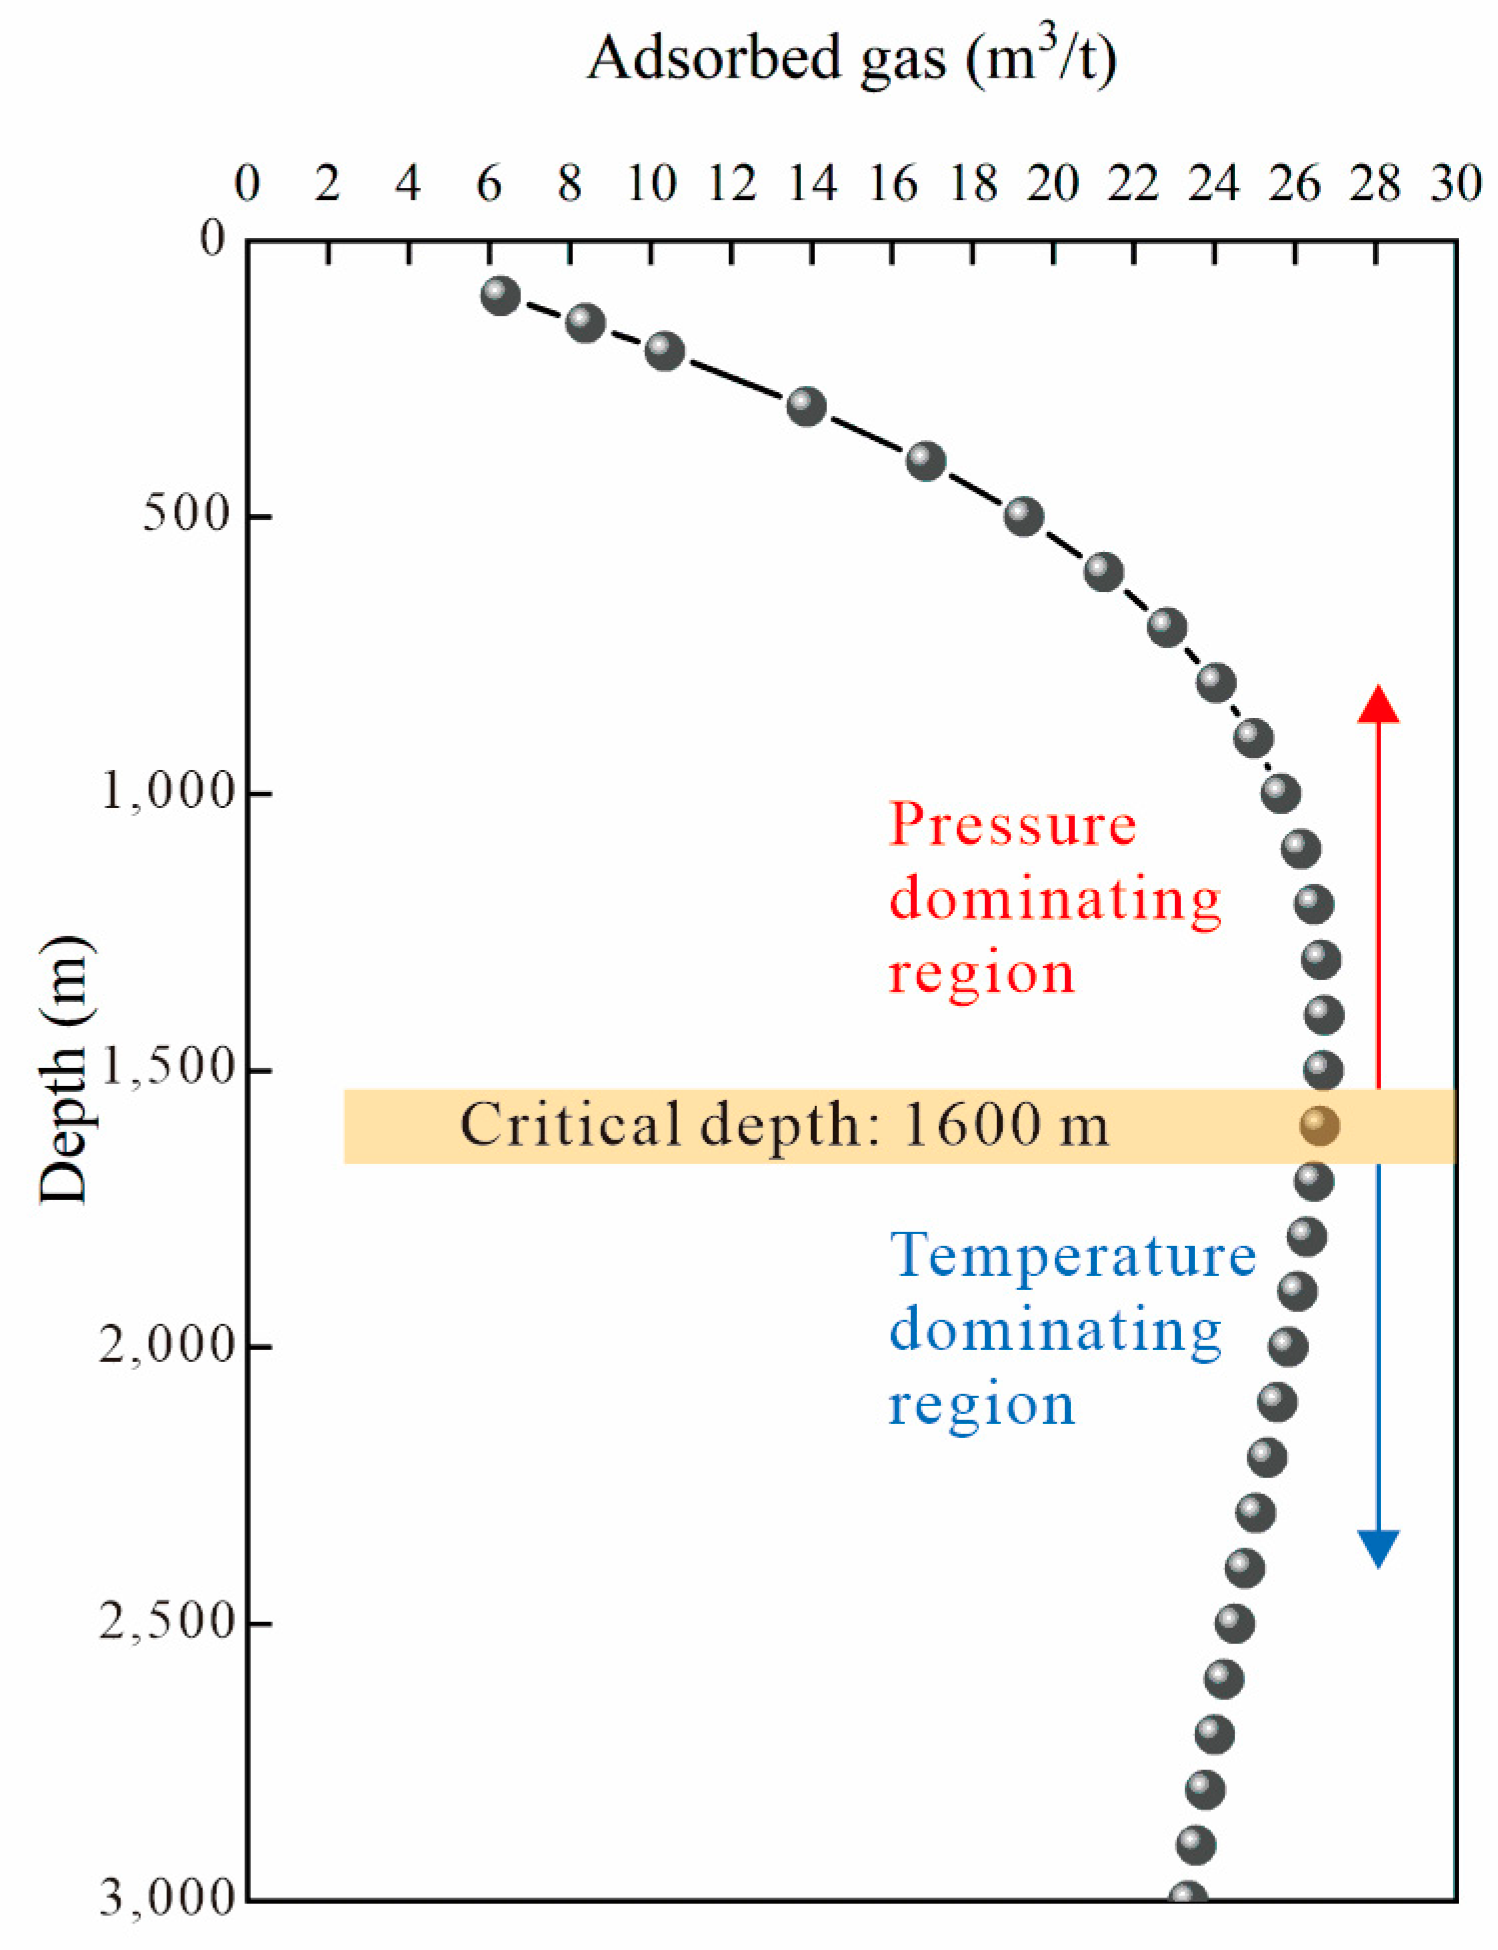
3.3. Adsorbed Gas Content Prediction and Application

CBM presents complex geological conditions characterized by high temperatures, high pressures, low porosity, and low permeability [11,56,57]. Consequently, it is not feasible to apply the adsorption models used for shallow CBM to predict the adsorption behavior of deep CBM. Therefore, in the previous analysis we determined the applicability and accuracy of the adsorption potential theory. The variations in adsorption potential and adsorption space under different temperatures and coal ranks were clarified, quantitatively establishing the saturation adsorption amount of coal reservoirs for methane under high temperature and pressure conditions from a theoretical perspective. In summary, this study explores the variation characteristics of the saturation adsorption amount of coal reservoirs in the Linxing block based on the characteristic adsorption curve, using dry coal samples as an example. As shown in Figure 12a, the variation patterns of the adsorption potential and adsorption space follow a logarithmic function relationship, expressed by the following equation:
ε = a ln ω + b
where a and b are dimensionless fitting parameters for the characteristic adsorption curve.
Due to the varying fitting parameters of the characteristic adsorption curves for different coal ranks, the growth rates of adsorption potential and adsorption space generally decrease with increasing coal rank. This phenomenon is primarily attributed to the continuous loss of oxygen-containing functional groups such as hydroxyl and carboxyl groups, as well as of aliphatic side chains, coupled with the enhanced condensation of aromatic rings as the coal rank increases. Consequently, the above results lead to the development of micropores in coal, in turn resulting in corresponding changes in the methane adsorption capacity of coal samples of different ranks, thereby causing systematic changes in adsorption behaviors [58,59]. To establish a methane adsorption model, this study has developed relationships between the adsorption characteristic parameters a and b and the coal rank. As shown in Figure 12b,c, it can be observed that the fitting coefficient of adsorption characteristic parameter a with coal rank is relatively high (R2 = 0.91), whereas the fitting coefficient of adsorption characteristic parameter b with coal rank is relatively low (R2 = 0.58). Additionally, adsorption characteristic parameters a and b both decrease with increasing coal rank. The relationships can be expressed by Equations (13) and (14), respectively.
a =   - 1.7331 ln R o   -   3.9088
b = - 3.1754 R o   -   8.2519
The research findings by Zhao et al. [60] indicate that the maceral and proximate compositions of coal still affect methane adsorption under high temperature and pressure conditions, although these effects are significantly reduced compared to the temperature and pressure conditions of shallow coal seams. Therefore, this study focuses on establishing a prediction model for the adsorbed gas content of deep coal reservoirs considering only the coal rank, pressure, and temperature. Based on the studies by Zhu [61], Tao [54], Gao et al. [52], Zhang et al. [62], and Xie [53], this study adopts temperature and coal rank gradients. By incorporating Equations (2) and (8) into Equation (12), the basic theoretical prediction model for adsorbed gas content can be derived. This model provides a foundation for predicting the adsorbed gas content of methane in deep coal reservoirs, accounting for the influences of coal rank, temperature, and pressure.
V a = ρ a d M e x p R T I n P c ( T T c ) k P i b a
By combining Equations (13)–(15), the temperature gradient, and the coal rank gradient, the adsorbed gas content under different burial depths can be derived. The equation is shown below.
V a = ρ a d M e x p R T I n P c ( 3.02 × H + 10.04 T c ) ( 0.006     H 2 + 0.305     H 0.059 ) P i + 0.222     H + 9.517 1.7331 ln ( 0.07     H ) 2.314    
Based on the aforementioned adsorbed gas content prediction model combined with the reservoir temperature, reservoir pressure, and other characteristics of the study area, the relationship between the adsorbed gas content and burial depth can be established (Figure 13). The results indicate that the adsorbed gas content initially increases with depth and then decreases, exhibiting a “critical depth” around 1600 m. At depths shallower than the critical depth, the positive effect of the pressure on the adsorbed gas content outweighs the negative effect of the temperature. However, at depths deeper than the critical depth, the negative effect of the temperature gradually becomes dominant, leading to a decrease in the adsorbed gas content. It is important to note that the adsorbed gas content prediction model established in this study is a theoretical model specific to the study area. It has certain limitations regarding reservoir pressure, reservoir temperature, and coal rank, and as such may differ from the actual conditions at individual well locations.
In summary, as the burial depth increases (below the critical depth), adsorbed gas tends to preferentially accumulate, leading to the formation of adsorbed gas sweet spots. At the same time, free gas generally does not possess favorable conditions for reservoir formation, and its commercial development value is relatively low. With further increases in burial depth (beyond the critical depth), free gas begins to have certain reservoir formation conditions due to the adverse effect of temperature on adsorbed gas and the favorable effect of pressure on free gas. At this stage, gas reservoirs dominated by adsorbed gas begin transitioning to those containing free gas. Therefore, the presence of free gas in deep coal reservoirs is more conducive to establishing sweet spots. In the study area, the burial depth of the No. 8 + 9 coal seams is mostly around 1800 m, which exceeds the critical depth of approximately 1600 m, favoring the formation of free gas reservoirs. The research findings of Kang et al. [63] also indicate that some well groups in the Linxing block exhibit characteristics of self-flowing gas production and pressure reduction by dewatering (with dewatering periods of less than 10 d and daily water production of less than 5 m3). These results indirectly validate the accuracy of the findings in this study.

4. Conclusions

In this work, coals with different ranks were used to theoretically calculate the change of adsorption potential using different virtual saturated vapor pressure models. The following key conclusions have been drawn:
(1)
The adsorption capacity of deep coalbed methane is influenced by a combination of temperature, pressure, and coal rank. As pressure increases, the inhibitory effect of temperature on methane adsorption becomes more pronounced, and this inhibitory effect is further enhanced with higher coal ranks.
(2)
Although various virtual saturation vapor pressure models can be used to calculate methane adsorption amount, only the adsorption characteristic curve obtained by the Amankwah model aligns with actual physical principles and exhibits the smallest ARE and MSE. Therefore, the Amankwah model provides a reliable method for predicting adsorbed gas content.
(3)
The adsorbed gas prediction model based on adsorption potential theory indicates that there is a critical depth for adsorbed gas in the middle Linxing Block, which is approximately 1600 m. Above this critical depth, the adsorption capacity is primarily influenced by pressure, making it conducive to the formation of adsorbed gas reservoirs. Below this critical depth, the adsorption capacity is mainly affected by temperature and free gas has certain conditions for formation, causing free gas-containing reservoirs to form more easily.
However, it is important to note that while the Amankwah model has been identified as the optimal model for virtual saturation vapor pressure, there are still some errors in ARE and MSE (>5%). This highlights a significant challenge in accurately determining the adsorption potential, as methane exists in a supercritical state under reservoir conditions, rendering the concept of saturation vapor pressure physically meaningless. Although the virtual saturation vapor pressure is commonly used, substantial progress in this area remains lacking, with all current models having certain limitations.
As such, future research should focus on developing new models or refining existing ones in order to better reveal the true adsorption potential of methane under varying temperature and pressure conditions. With the continued commercial success of deep coalbed methane development in China’s Ordos and Junggar Basins, advancing our understanding of methane adsorption behavior through improved modeling will be crucial for realizing further breakthroughs in production.

Author Contributions

Conceptualization: W.P. and T.J.; Methodology: S.Z., J.W. and S.L.; Software: T.J. and S.L.; Validation: S.Z.; Formal analysis: W.P. and T.J.; Investigation: W.P.; Resources: T.J., S.Z., J.W. and S.L.; Data curation: W.P. and Z.L.; Writing—original draft: W.P.; Writing—review and editing: W.P., T.J. and S.Z.; Visualization: S.Z. and W.C.; Supervision: T.J., J.W., W.C. and Z.L.; Project administration: S.Z.; Funding acquisition: S.Z. All authors have read and agreed to the published version of the manuscript.

Funding

This research and the APC were funded by the National Natural Science Foundation of China (Grant number: 42272197, 41872178, U1910205).

Data Availability Statement

The data presented in this paper are available upon request from the corresponding author.

Acknowledgments

Sincere thanks to all those who contributed to this paper.

Conflicts of Interest

Authors Wenchun Peng and Jian Wu were employed by the company China United Coalbed Methane Corporation Ltd. Author Weiwei Chao was employed by the company China United Coalbed Methane Corporation Ltd. The remaining authors declare that the research was conducted in the absence of any commercial or financial relationships that could be construed as a potential conflict of interest.

References

  1. Li, S.; Wang, C.; Wang, H.; Wang, Y.; Xu, F.; Guo, Z.; Liu, X. Reservoir forming characteristics and favorable area evaluation of deep coalbed methane in Daning-Jixian Block. Coal Geol. Explor. 2022, 50, 59–67. [Google Scholar]
  2. Zheng, C.; Jiang, B.; Xue, S.; Chen, Z.; Liu, H. Coalbed methane emissions and drainage methods in underground mining for mining safety and environmental benefits: A review. Process Saf. Environ. Prot. 2019, 127, 103–124. [Google Scholar] [CrossRef]
  3. Esen, O.; Fisne, A. A comprehensive study on methane adsorption capacities and pore characteristics of coal seams: Implications for efficient coalbed methane development in the Soma Basin, Turkiye. Rock Mech. Rock Eng. 2024, 57, 6355–6375. [Google Scholar] [CrossRef]
  4. Kalkreuth, W.; Levandowski, J.; Weniger, P.; Krooss, B.; Prissang, R.; da Rosa, A.L. Coal characterization and coalbed methane potential of the Chico-Loma Coalfield, Parana Basin, Brazil—Results from exploration borehole CBM001-CL-RS. Energy Explor. Exploit. 2024, 38, 1589–1630. [Google Scholar] [CrossRef]
  5. Bicca, M.M.; Kalkreuth, W.; Rosa, A.L.; Simao, G.; Levandowski, J.; Silva, T.F.; Anzolin, H.M. Effect of diabase intrusion on the CBM-bearing coalfields of southern Brazil: A review. J. S. Am. Earth Sci. 2022, 119, 104041. [Google Scholar] [CrossRef]
  6. Johnson, R.C.; Flores, R.M. Developmental geology of coalbed methane from shallow to deep in Rocky Mountain basins and in Cook inlet Matanuska basin, Alaska, USA and Canada. Int. J. Coal Geol. 1998, 35, 241–282. [Google Scholar] [CrossRef]
  7. Wyman, R.E.; Kuuskraa, V.A. Deep coal seams: Potential for long-term natural-gas supplies. J. Pet. Technol. 1995, 47, 774. [Google Scholar] [CrossRef]
  8. Jiang, L.; Song, Y.; Zhao, W.; Bo, D.; Liu, S.; Hao, J. Main controlling factor of coalbed methane enrichment area in southern Qinshui Basin, China. J. Pet. Explor. Prod. Technol. 2024, 14, 165–173. [Google Scholar] [CrossRef]
  9. Chen, F.; Wu, C.; Huo, Z.; Zhao, Q. Productivity characteristics and controlling factors of coalbed methane vertical well in a coal block of Qinshui Basin. Energy Explor. Exploit. 2024, 42, 856–877. [Google Scholar] [CrossRef]
  10. Xu, F.; Hou, W.; Xiong, X.; Xu, B.; Wu, P.; Wang, H.; Feng, K.; Yun, J.; Li, S.; Zhang, L.; et al. The status and development strategy of coalbed methane industry in China. Pet. Explor. Dev. 2023, 50, 765–783. [Google Scholar] [CrossRef]
  11. Li, S.; Qin, Y.; Tang, D.; Shen, J.; Wang, J.; Chen, S. A comprehensive review of deep coalbed methane and recent developments in China. Int. J. Coal Geol. 2023, 279, 104369. [Google Scholar] [CrossRef]
  12. Tang, D.; Yang, S.; Tang, S.; Tao, S.; Chen, S.; Zhang, A.; Pu, Y.; Zhang, T. Advance on exploration-development and geological research of coalbed methane in the Junggar Basin. J. China Coal Soc. 2021, 46, 2412–2425. [Google Scholar]
  13. Zhang, B.; Tao, S.; Sun, B.; Tang, S.; Chen, S.; Wen, Y.; Ye, J. Genesis and accumulation mechanism of external gas in deep coal seams of the Baijiahai Uplift, Junggar Basin, China. Int. J. Coal Geol. 2024, 286, 104506. [Google Scholar] [CrossRef]
  14. Xu, F.; Yan, X.; Li, S.; Xiong, X.; Wang, Y.; Zhang, L.; Liu, C.; Han, J.; Feng, Y.; Zhen, H.; et al. Theoretical and technological difficulties and countermeasures of deep CBM exploration and development in the eastern edge of Ordos Basin. Coal Geol. Explor. 2023, 51, 115–130. [Google Scholar]
  15. Li, X.; Wang, H.; Jiang, Z.; Chen, Z.; Wang, L.; Wu, Q. Progress and study on exploration and production for deep coalbed methane. J. China Coal Soc. 2016, 41, 24–31. [Google Scholar]
  16. Xu, H.; Tang, D.; Tao, S.; Li, S.; Tang, S.; Chen, S.; Zong, P.; Dong, Y. Differences in geological conditions of deep and shallow coalbed methane and their formation mechanisms. Coal Geol. Explor. 2024, 52, 33–39. [Google Scholar]
  17. Tonnsen, R.R.; Miskimins, J.L. Simulation of deep-coalbed-methane permeability and production assuming variable pore-volume compressibility. J. Can. Pet. Technol. 2011, 50, 23–31. [Google Scholar] [CrossRef]
  18. Yang, F.; Li, B.; Wang, K.; Wen, H.; Yang, R.; Huang, Z. Extreme massive hydraulic fracturing in deep coalbed methane horizontal wells: A case study of the Linxing Bloc, eastern Ordos Basin, NW China. Pet. Explor. Dev. 2024, 51, 389–398. [Google Scholar] [CrossRef]
  19. Mohamed, T.; Mehana, M. Coalbed methane characterization and modeling: Review and outlook. Energy Sources Part A Recovery Util. Environ. Eff. 2020, 1–23. [Google Scholar] [CrossRef]
  20. Asif, M.; Wang, L.; Naveen, P.; Longinos, S.N.; Hazlett, R.; Ojha, K.; Panigrahi, D.C. Influence of competitive adsorption, diffusion, and dispersion of CH4 and CO2 gases during the CO2-ECBM process. Fuel 2023, 358, 130065. [Google Scholar]
  21. Ouyang, Z.; Wang, H.; Sun, B.; Liu, Y.; Fu, X.; Dou, W.; Du, L.; Zhang, B.; Luo, B.; Yang, M.; et al. Quantitative Prediction of Deep Coalbed Methane Content in Daning-Jixian Block, Ordos Basin, China. Processes 2023, 11, 3093. [Google Scholar] [CrossRef]
  22. Zhang, B.; Deng, Z.; Fu, X.; Yin, K. A Study on Three-Phase Gas Content in Coal Reservoirs and Coalbed Methane-Water Differential Distribution in the Western Fukang Mining Area, Xinjiang, China. Acs Omega 2021, 6, 3999–4012. [Google Scholar] [CrossRef]
  23. Li, Y.; Gao, S.; Wu, P.; Xu, L.; Ma, L.; Hu, W.; Yang, J. Evaluation and correction of prediction model for free gas content in deep coalbed methane: A case study of deep coal seams in the eastern margin of Ordos Basin. Acta Pet. Sin. 2023, 44, 1892–1902. [Google Scholar]
  24. Ji, Y.; Ma, D.; Chen, Y.; Li, W.; Li, G.; Zheng, C.; Ma, Z.; Wang, L.; Wang, X. Study on gas content variation and main controlling of low-rank coal in Huanglong Jurassic coalfield. Energy Explor. Exploit. 2023, 41, 561–584. [Google Scholar] [CrossRef]
  25. Jia, T.; Zhang, S.; Tang, S.; Xin, D.; Zhang, Q.; Zhang, K.; Wang, B. Re-cognition of adsorption phase density and adsorption phase volume: Insights from methane adsorption behavior. Chem. Eng. J. 2024, 486, 150296. [Google Scholar] [CrossRef]
  26. Zhao, S.; Shao, L.; Hou, H.; Tang, Y.; Li, Z.; Yao, M.; Zhang, J. Methane adsorption characteristics and its influencing factors of the medium-to-high rank coals in the Anyang-Hebi coalfield, northern China. Energy Explor. Exploit. 2019, 37, 60–82. [Google Scholar] [CrossRef]
  27. Bhapkar, P.V.; Pradhan, S.P.; Chandra, D.; Hazra, B.; Vishal, V. Systematic pore characterization of sub-bituminous coal from Sohagpur Coalfield, central India using gas adsorption coupled with X-ray scattering and high-resolution imaging. Energy Fuels 2023, 37, 9297–9308. [Google Scholar] [CrossRef]
  28. Charpensuppanimit, P.; Mohammad, S.A.; Robinson, R.L.; Gasem, K.A.M. Modeling the temperature dependence of supercritical gas adsorption on activated carbons, coals and shales. Int. J. Coal Geol. 2015, 138, 113–126. [Google Scholar] [CrossRef]
  29. Zhou, D.; Feng, Z.; Zhao, Y. Study on the methane adsorption characteristics of coal with heterogeneous potential wells. Int. J. Oil Gas Coal Technol. 2020, 23, 312–324. [Google Scholar] [CrossRef]
  30. Meng, Z.; Liu, S.; Li, G. Adsorption capacity, adsorption potential and surface free energy of different structure high rank coals. J. Pet. Sci. Eng. 2016, 146, 856–865. [Google Scholar] [CrossRef]
  31. Yao, Y.; Wang, F.; Liu, D.; Sun, X.; Wang, H. Quantitative characterization of the evolution of in-situ adsorption/free gas in deep coal seams: Insights from NMR fluid detection and geological time simulations. Int. J. Coal Geol. 2024, 285, 104474. [Google Scholar] [CrossRef]
  32. Xie, J.; Liang, Y.; Zou, Q.; Wang, Z.; Li, X. Prediction Model for Isothermal Adsorption Curves Based on Adsorption Potential Theory and Adsorption Behaviors of Methane on Granular Coal. Energy Fuels 2019, 33, 1910–1921. [Google Scholar] [CrossRef]
  33. Dundar, E.; Zacharia, R.; Chahine, R.; Benard, P. Modified potential theory for modeling supercritical gas adsorption. Int. J. Hydrogen Energy 2012, 37, 9137–9147. [Google Scholar] [CrossRef]
  34. Xiong, J.; Liu, X.; Liang, L. Study on the Pseudo-saturation Vapor Pressure of the Methane on Shales. J. Southwest Pet. University. Sci. Technol. Ed. 2015, 37, 90–100. [Google Scholar]
  35. Gao, C.; Liu, D.; Vandeginste, V.; Cai, Y.; Sun, F. Thermodynamic energy change and occurrence mechanism of multiple fluids in coal reservoirs. Energy 2023, 283, 129089. [Google Scholar] [CrossRef]
  36. Zhao, P.; Wang, H.; Wang, L.; Xu, D.; Ma, H.; Guo, H. Prediction of methane adsorption capacity in different rank coal at low temperature by the Polanyi-based isotherm model. Energy Sci. Eng. 2022, 10, 1384–1397. [Google Scholar] [CrossRef]
  37. Long, Z.; Zhu, X.; Liao, J.; Ye, D.; Chen, R. Study of the methane adsorption characteristics in a deep coal reservoir using adsorption potential theory. Appl. Sci. 2024, 14, 3478. [Google Scholar] [CrossRef]
  38. Gao, J.; Li, X.; Shi, Y.; Jia, S.; Ye, X.; Long, Y. The adsorption model of the adsorption process of CH4 on coal and its thermodynamic characteristics. Colloids Surf. A Physicochem. Eng. Asp. 2022, 632, 127766. [Google Scholar] [CrossRef]
  39. Yuan, S.; Sun, Q.; Geng, S.; Wang, S.; Xue, S.; Ding, X. Distribution pattern and geological evolution of combustion metamorphic rocks in the northeast margin of Ordos Basin. Environ. Earth Sci. 2023, 82, 497. [Google Scholar] [CrossRef]
  40. Chen, B.; Wang, Y.; Franceschi, M.; Duan, X.; Li, K.; Yu, Y.; Wang, M.; Shi, Z. Petrography, Mineralogy, and Geochemistry of Combustion Metamorphic Rocks in the Northeastern Ordos Basin, China: Implications for the Origin of “White Sandstone”. Minerals 2020, 10, 1086. [Google Scholar] [CrossRef]
  41. Shu, Y.; Sang, S.; Lin, Y.; Zheng, H. Natural Gas Accumulation Characteristics in the Linxing Area, Ordos Basin, NW China: Revealed from the Integrated Study of Fluid Inclusions and Basin Modeling. Geofluids 2020, 2020, 8695497. [Google Scholar] [CrossRef]
  42. Li, Y.; Wu, P.; Gao, J.; Du, J.; Wu, J.; Ma, Z.; Chen, J. Multilayer coal-derived gas enrichment mechanism and whole gas bearing system model: A case study on the Linxing Block along the eastern margin of the Ordos Basin. Nat. Gas Ind. 2022, 42, 52–64. [Google Scholar]
  43. Liu, J.; Zhu, G.; Liu, Y.; Chao, W.; Du, J.; Yang, Q.; Mi, H.; Zhang, S. Breakthrough, future challenges and countermeasures of deep coalbed methane in the eastern margin of Ordos Basin: A case study of Linxing-Shenfu block. Acta Pet. Sin. 2023, 44, 1827–1839. [Google Scholar]
  44. GB/T 8899-2008; Method of Determining Maceral Group Composition and Mineral of Coal. China Coal Industry Association: Beijing, China, 2008.
  45. GB/T 212-2008; Proximate Analysis of Coal. China Coal Industry Association: Beijing, China, 2008.
  46. GB/T 6948-2008; Method of Determining Microscopically the Reflectance of Vitrinite in Coal. China Coal Industry Association: Beijing, China, 2008.
  47. Lu, G.; Wei, C.; Wang, J.; Zhang, J.; Quan, F.; Tamehe, L. Variation of Surface Free Energy in the Process of Methane Adsorption in the Nanopores of Tectonically Deformed Coals: A Case Study of Middle-Rank Tectonically Deformed Coals in the Huaibei Coalfield. Energy Fuels 2019, 33, 7155–7165. [Google Scholar] [CrossRef]
  48. Polanyi, M. The Potential Theory of Adsorption. Science 1963, 141, 1010–1013. [Google Scholar] [CrossRef] [PubMed]
  49. Amankwah, K.; Schwarz, J. A modified approach for estimating pseudo-vapor pressures in the application of the dubinin-astakhov equation. Carbon 1995, 33, 1313–1319. [Google Scholar] [CrossRef]
  50. Qiu, F.; Liu, D.; Cai, Y.; Liu, N.; Qiu, Y. Methane adsorption interpreting with adsorption potential and its controlling factors in various rank coals. Processes 2020, 8, 390. [Google Scholar] [CrossRef]
  51. Godyn, K.; Dutka, B. The impact of the degree of coalification on the sorption capacity of coals from the Zofiowka Monocline. Arch. Min. Sci. 2018, 63, 727–746. [Google Scholar]
  52. Gao, L.; Xie, Y.; Pan, X.; Pang, J.; Zhou, L. Gas analysis of deep coalbed methane and its geological model for development in Linxing Block. J. China Coal Soc. 2018, 43, 1634–1640. [Google Scholar]
  53. Xie, Y. Theory and Method for Compatibility Evaluation of Joint Deep Coalbed Methane an Tight Sandstone Gas Production: In a Case of Member C2b~P1t in Linxing Block; China University of Mining and Technology: Xuzhou, China, 2022. [Google Scholar]
  54. Tao, C. Deep Coalbed Methane Accumulation and Reservoiring in Linxing Area, Eastern Ordos Basin, China; China University of Mining and Technology: Beijing, China, 2019. [Google Scholar]
  55. Wu, S. Storage-Seepage Mechanism and Development Features of Deep Coalbed Methane Reservoir; China University of Geosciences: Beijing, China, 2018. [Google Scholar]
  56. Li, S.; Tang, D.; Pan, Z.; Xu, H.; Tao, S.; Liu, Y.; Ren, P. Geological conditions of deep coalbed methane in the eastern margin of the Ordos Basin, China: Implications for coalbed methane development. Int. Nat. Gas Sci. Eng. 2018, 53, 394–402. [Google Scholar] [CrossRef]
  57. Fu, Y.; Niu, Q.; Cui, B.; Huang, D.; Xie, X. Evaluation of deep high-rank coal seam gas content and favorable area division based on GIS: A case study of the South Yanchuan block in Ordos Basin. Energy Explor. Exploit. 2022, 40, 1151–1172. [Google Scholar] [CrossRef]
  58. Chen, J.; Li, X.; Qi, S.; Gao, W.; Sun, K. Study on the relationship between chemical structure evolution and gas generation of coal. Nat. Gas Geosci. 2017, 28, 863–872. [Google Scholar]
  59. Liu, L.; Jin, C.; Li, L.; Xu, C.; Sun, P.; Meng, Z.; An, L. Coalbed methane adsorption capacity related to maceral compositions. Energy Explor. Exploit. 2020, 38, 79–91. [Google Scholar] [CrossRef]
  60. Zhao, L.; Qin, Y.; Wu, C.; Shen, J. Adsorption Behavior of Deep Coalbed Methane Under High Temperatures and Pressures. Geol. J. China Univ. 2013, 19, 648–654. [Google Scholar]
  61. Zhu, W. Characterization of Coalbed Methane Accumulation and Reservoir under the Background of Magma Invasion in Linxing District; China University of Geosciences: Beijing, China, 2017. [Google Scholar]
  62. Zhang, B.; Xu, W.; Xu, Y.; Gu, J.; Yang, G.; Zhao, J. Key parameters identification for deep coalbed methane reservoir in Linxing block of eastern Ordos Basin. J. China Coal Soc. 2016, 41, 87–93. [Google Scholar]
  63. Kang, Y.; Huangfu, Y.; Zhang, B.; He, Z.; Jiang, S.; Ma, Y. Gas oversaturation in deep coals and its implications for coal bed methane development: A case study in Linxing Block, Ordos Basin, China. Front. Earth Sci. 2023, 10, 1031493. [Google Scholar] [CrossRef]
Figure 1. Map of the regional geology of the Linxing block.
Processes 12 01837 g001
Figure 2. Isothermal adsorption curves of samples. (a) methane adsorption at different pressures for samples; (b) the relationship between adsorption capacity and coal rank.
Processes 12 01837 g002
Figure 3. Isothermal adsorption curves of CH4 at different temperatures: (ad) the results of Gao et al. [52], Xie [53], Tao [54], and Wu [55], respectively; (df) results on the sensitivity of methane adsorption from Gao et al. [52] and Xie [53].
Processes 12 01837 g003
Figure 4. Characteristic adsorption curves of the Dubinin method: (a) Ro = 3.1%; (b) Ro = 1.47%; (c) Ro = 1.42%.
Processes 12 01837 g004
Figure 5. Characteristic adsorption curves of the Reid method: (a) Ro = 3.1%; (b) Ro = 1.78%; (c) Ro = 0.78%.
Processes 12 01837 g005
Figure 6. Characteristic adsorption curves of the Antoine method: (a) Ro = 1.27%; (b) Ro = 1.78%; (c) Ro = 1.54%.
Processes 12 01837 g006
Figure 7. Characteristic adsorption curves of the Astakhov method: (a) Ro = 1.27%; (b) Ro = 1.36%; (c) Ro = 0.78%.
Processes 12 01837 g007
Figure 8. Characteristic map for selection of the optimal k value: (a) Ro = 3.1%; (b) Ro = 1.27%; (c) fitting results of k values for different coal ranks.
Processes 12 01837 g008
Figure 9. Characteristic adsorption curves of the Amankwah method: (a) Ro = 3.1%; (b) Ro = 1.16%; (c) Ro = 2.11%; (d) Ro = 1.38%.
Processes 12 01837 g009
Figure 10. Adsorption isotherm results for the sample with Ro = 3.1% obtained from different virtual saturated vapor pressure models: (a) T = 40 °C; (b) T = 60 °C; (c) T = 80 °C.
Processes 12 01837 g010
Figure 11. Adsorption isotherm results for the sample with Ro = 1.16% obtained from different virtual saturated vapor pressure models: (a) T = 30 °C; (b) T = 45 °C; (c) T = 60 °C; (d) T = 75 °C.
Processes 12 01837 g011
Figure 12. Diagrams of the characteristic adsorption curves and characteristic parameters for different coal rank samples: (a) characteristic adsorption curves; (b) relationship between parameter a and coal rank; (c) relationship between parameter b and coal rank.
Processes 12 01837 g012
Figure 13. Adsorption capacity variation with depth.
Processes 12 01837 g013
Table 1. Fundamental information of the sample.
SampleRo (%)Maceral Composition (%)Proximate Analysis (%)
VLIMMadAdVdafFCad
L11.2853.6030.216.20.6224.533.9640.92
L21.4362.7020.716.60.5923.2725.0551.09
L31.1158.22.827.0120.50 20.52 29.97 49.01
L41.3383.69.27.20.5210.5426.4162.52
L51.3248.62.624.8240.7524.7827.0247.45
V: vitrinite; L: liptinite; I: inertinite; M: mineral; Mad: moisture content of air-dried basis; Ad: Ash yield of dry basis; Vdaf: volatile content of dry-ash-free basis; FCad: fixed carbon content of air-dried basis.
Table 2. Statistical table of k value correlations for samples of different coal ranks.
kR2
Ro = 3.1%Ro = 1.27%Ro = 0.78%Ro = 1.54%Ro = 2.11%Ro = 1.16%Ro = 1.36%Ro = 1.47%Ro = 1.78%Ro = 1.38%Ro = 1.42%
20.97810.93420.70110.89390.88960.84520.87780.89580.80340.92130.9322
30.98890.94340.79120.93680.92480.88350.91580.93210.84860.92590.9388
40.98910.94190.86250.9590.94630.91390.9440.95760.88620.92420.9391
50.97970.93060.91350.96240.95410.93610.96250.97250.91570.91660.9334
60.96210.91130.94540.95050.94950.93040.96510.96770.9130.90370.9223
70.93810.88560.96110.92730.93430.95720.97290.97450.9510.88650.9066
80.90930.85540.96420.89660.91070.95740.96680.96430.95770.86550.887
90.87730.82230.95810.86170.88120.95190.95510.94840.95840.84170.8644
100.84330.78750.94570.82490.84780.94180.9390.92850.95390.81580.8395
Optimal k value3.21492.91267.89685.02985.36017.86376.92136.41758.95372.88413.3443
Table 3. Detailed ARE and MSE information of different samples.
SamplesT/°CARE/%MSE/cm3/g
DubininReidAntoineAstakhovAmankwahDubininReidAntoineAstakhovAmankwah
Ro = 3.1%404.516.444.495.773.941.491.911.541.701.22
605.605.705.305.565.211.501.571.291.451.27
806.497.405.645.365.542.042.631.331.411.31
Ro = 1.16%3015.9318.408.119.277.031.531.750.870.990.62
459.489.958.618.777.720.880.920.760.780.67
6011.8312.629.9510.289.571.381.510.981.050.83
7523.4326.6315.6316.9413.382.302.631.451.601.02
Disclaimer/Publisher’s Note: The statements, opinions and data contained in all publications are solely those of the individual author(s) and contributor(s) and not of MDPI and/or the editor(s). MDPI and/or the editor(s) disclaim responsibility for any injury to people or property resulting from any ideas, methods, instructions or products referred to in the content.

