Article

Effects of Compositions and Fractal Pores on CO2 Adsorption in Lacustrine Shale

1
Key Laboratory of Coalbed Methane Resources and Reservoir Formation Process, Ministry of Education, China University of Mining and Technology, Xuzhou 221008, China
2
School of Resources and Geosciences, China University of Mining and Technology, Xuzhou 221116, China
3
Carbon Neutrality Institute, China University of Mining and Technology, Xuzhou 221008, China
4
School of Computer Science & Technology, China University of Mining and Technology, Xuzhou 221116, China
*
Authors to whom correspondence should be addressed.
Processes 2024, 12(9), 1842; https://doi.org/10.3390/pr12091842
Submission received: 1 August 2024 / Revised: 24 August 2024 / Accepted: 27 August 2024 / Published: 29 August 2024

Abstract

:
Lacustrine shale reservoirs hold promise for CO2 geological sequestration and enhanced shale gas/oil recovery, while the CO2 adsorption capacity and its controlling factors are still unclear in lacustrine shales. Using a volumetric-based adsorption apparatus, CO2 adsorption experiments were performed at 50 °C on the Ch7 lacustrine shale samples from the Yanchang Formation in Ordos Basin, China. Basic petro-physical experiments, low-temperature N2 adsorption, and field emission scanning electron microscopy were used to characterize shale properties and fractal pores in the lacustrine shales. Further, the effects of shale compositions and fractal pores on CO2 adsorption capacities were serially investigated. The results show that Ch7 lacustrine shales are characterized by being rich in their TOC (total organic carbon) content, high in their clay content, but low in their quartz content, which is distinguished from the mineral compositions in marine shales. The pore size distributions are multi-modal with a main peak and two secondary peaks. Meanwhile, two-regime pore fractal characteristics were identified in the Ch7 lacustrine shales, and the fractal dimensions of the pore surface and spatial structure were calculated based on the FHH (Frenkel–Halsey–Hill) model with D1 and D2 ranging from 2.586–2.690 and 2.756–2.855, respectively. CO2 adsorption isotherms present an initial phase of rapid adsorption followed by a slow saturation and were fitted using the Langmuir model with Langmuir volumes in the range of 2.16–6.89 cm3/g for Ch7 lacustrine shales. TOC is crucial for enhancing the CO2 adsorption capacity, whereas the effect of clays on CO2 adsorption is complex because of the reverse effects of clay-related pores and other pores filled by clays. Micropores (<2 nm) dominate the CO2 adsorption capacity because they offer a larger unit-specific surface area and possess a higher adsorption potential compared to meso- (2–50 nm) and macro- (>50 nm) pores. Moreover, the D1 is positively related to the CO2 adsorption capacity as a larger D1 coincides with more heterogeneous fractal pore surfaces and more available locations for CO2 adsorption. This work provides useful knowledge and important data for estimating the CO2 geological storage potential in lacustrine shale reservoirs.

1. Introduction

CCUS (Carbon Capture, Utilization, and Storage) involves the extraction of carbon dioxide (CO2) from the atmosphere or industrial operations, then either using it directly or injecting it into geological formations to permanently reduce CO2 emissions [1,2]. Injecting CO2 into coal or shale reservoirs is not only one of the important methods of CCUS, but also can enhance oil and shale gas recovery [3,4,5,6,7], commonly known as CO2-ESGR (CO2-enhanced shale gas recovery). CO2-ESGR has preliminarily confirmed the feasibility through the pilot engineering testing for lacustrine shale reservoirs at the Yan’an National Continental Shale Gas Demonstration Zone, China, and increasing production by more than 50% has been achieved [8]. Shale gas, primarily composed of methane (CH4), is found in various forms within reservoirs: as an adsorbed layer on the surfaces of organic or inorganic components (mainly clay minerals), as free gas within fractures and pores, and as a dissolved component in residual oil or a formation water [9,10,11]. Among these, adsorbed gas accounts for 20–80% of the gas in place [12,13]. In fact, CO2-ESGR can be simply understood as injecting CO2 into shale reservoirs to replace CH4 according to the competitive adsorption between CO2 and CH4. Particularly, the gas adsorption performance was controlled by the complex compositions and heterogeneous pore structure in shale reservoirs [14,15]. Thus, the CO2 adsorption capability of shale is an essential research topic for evaluating CO2 geological sequestration potential in shale reservoirs.
Shale is a kind of porous medium and the internal pore network enables gas to be adsorbed and stored in shale reservoirs [9,15,16,17]. The heterogeneous pore structure is closely related to the CO2 adsorption capacity of shale as it is the location of the solid–gas interaction between the shale matrix and gas molecules [18,19]. The pore classification system suggested by the International Union of Pure and Applied Chemistry (IUPAC) is commonly used for shale reservoirs and categorizes pores into three types: macropores (>50 nm), mesopores (2–50 nm), and micropores (<2 nm) [20,21]. Over recent decades, numerous advanced techniques have been employed for pore characterization in unconventional reservoirs, such as NMR (nuclear magnetic resonance) [22,23], SAXS/SANS (small-angle X-ray/neutrons scattering) [24,25], micro-/nano-CT (computed tomography) [26,27], etc. However, it is difficult for these technologies to be prevailing and they are limited by their expensive cost, doubtful accuracy, and cumbersome data processing. Generally, FE-SEM (Field emission scanning electron microscopy) is historically employed to visualize pore morphologies [28,29]. LT-N2GA (low-temperature N2 gas adsorption) and HP-MIP (high-pressure mercury intrusion porosimetry) are still simple and convenient methods to determine relatively accurate information about pore systems, for instance, the specific surface area (SSA), pore size distributions (PSDs), pore volume (PV), pore shapes (PS), etc., [30,31,32,33,34]. HP-MIP has been proven to be more suitable for characterizing macropores in the study of gas seepage [35,36], but it is not applicable for mesopores and micropores’ characterization due to sample matrix compression and potential pore collapse at high experimental pressures [34,37,38,39,40]. Nevertheless, LT-N2GA was primarily used for gas adsorption research to characterize mesopores and micropores [41,42,43]. As heterogeneous pores are hardly described by the traditional Euclidean geometry theory, the fractal theory has been introduced to quantitatively investigate the heterogeneity of a pore structure with a fractal dimension [15,36,43,44]. The fractal dimension is a measure that describes how a fractal scales differently from the space it is embedded in, with higher dimensions indicating more complexity and detail [45].
Isothermal adsorption measurements, such as volumetric-based and gravimetric-based methods, are commonly applied for measuring the gas adsorption isotherms on shale samples [5,10]. Furthermore, the gas adsorption capacities are quantified by calculating adsorption parameters through fitting an appropriate adsorption model [11]. Using CH4 as an adsorbate, the researchers have extensively analyzed CH4 adsorption characteristics in marine shales and geological controlling factors [15,46,47,48]. The CH4 adsorption in shale reservoirs is not only closely related to external conditions including temperature, pressure, moisture content, etc., [49,50,51,52], but also affected by the internal properties, such as shale compositions, especially for organic matter (OM) and clays [53,54], pore structure [48], fractal heterogeneity [15], etc. In contrast, the research on CO2 adsorption is still insufficient for shale reservoirs. Through CO2 adsorption experiments, Kang et al. (2011) suggested that the pore volume is crucial for determining the potential of CO2 geological storage in organic-rich shales [55]. Fakher and Imqam (2020) discussed the effects of varying the CO2 phase, injection pressure, and temperature on CO2 adsorption in shales based on high-temperature, high-pressure CO2 adsorption experiments [4]. Moreover, the composition properties and pore structure in lacustrine shales definitely distinguish them from marine shales from the perspectives of sedimentation and diagenesis. In summary, the adsorption carriers in lacustrine shales would be characterized by various components and a complex pore structure, which results in large differences in the CO2 adsorption capacity, and thereby the effects of shale compositions and fractal pores on CO2 adsorption in lacustrine shales need to be studied in details.
This study aims at the CO2 adsorption behavior in lacustrine shales from the Yanchang Formation in Ordos Basin, China, and its controlling factors from aspects of shale properties and the fractal pore structure. The mineral compositions and organic geochemistry were basically assessed using an X-ray diffraction (XRD) analyzer, a microphotometer, and a carbon/sulfur analyzer. To examine the pore micromorphology and structural details, FE-SEM observation and LT-N2GA were employed. Additionally, the pore heterogeneity was quantitatively analyzed based on fractal dimension calculations. Isothermal adsorption experiments with CO2 adsorbate were performed to measure CO2 adsorption capacities in lacustrine shale samples. Ultimately, we thoroughly discussed the effects of shale compositions and fractal pores on CO2 adsorption in the lacustrine shales. The results revealed in this work will be extended in the future to CO2 injection storage and CO2-ESGR projects in lacustrine shales.

2. Samples and Methodology

2.1. Geological Backgrounds and Samples

The research site is situated within the Ordos Basin, North China Plate (Figure 1a), which contains rich oil and gas resources through long-time evolution with simple construction, smooth tectonic characteristics, and stable sedimentation [56]. Tectonically, the internal structure units of the Ordos Basin are categorized into the Yishan Slope, the Tianhuan Sag, the Western Edge Thrust Belt, the Jinxi Folding Belt, the Weibei Uplift, and the Yimeng Uplift [57] (Figure 1b). In the study area, the sedimentary history reflects a transition from Paleozoic marine sedimentation to Mesozoic continental sedimentation. Lakes had developed in the southwestern depression of the basin by the late Triassic, leading to the widespread deposition of terrigenous sediments. This resulted in the formation of the lacustrine Yanchang Formation. The lacustrine Yanchang Formation is stratified into ten distinct layers, labeled from Ch10 at the bottom to Ch1 at the top [37,58], which correspond to the entire sequence of lake basin expansion, peak, contraction, and eventual disappearance (Figure 1c).
The black shale in the thick layer is primarily found in the Ch7 and Ch9 layers, while other layers predominantly consist of muddy siltstone, siltstone, sandstone, and silty mudstone (Figure 1c). The Ch7 layer was formed in a deep and expansive lake environment when the relative lake level reached its highest point [37,58]. Moreover, features such as granular pyrite, aquatic fossils (including mussels and algae), and horizontal bedding are typically present in the Ch7 shales, indicating a reducing environment with low energy. This environment is also conducive to OM accumulation and preservation. The Ch7 shales exhibit significant effective thickness, often reaching up to 20 m (Figure 1b), creating a high-value zone in the Zhidan–Fuxian area. Meanwhile, Ch7 lacustrine shales are widely exposed in the study area. Nine samples were gathered from newly exposed Ch7 lacustrine shale outcrops in the Yan’an, Yichuan, and Tongchuan regions (Figure 1b and Table 1). Considering the need to minimize the influence of weathering as much as possible, we used short-hole drilling to collect all the lacustrine shale samples in this study.

2.2. Analytical Experiments

2.2.1. Fundamental Experiments for Shale Properties

The TOC content of Ch7 lacustrine shales was measured with a CS-230 carbon/sulfur analyzer (LECO Corp., St. Joseph, MI, USA) at the Experimental Research Center of the East China Branch of SINOPEC. Initially, the shale samples were pulverized into a fine powder with a particle size of 0.18–0.25 mm (60–80 mesh). Before testing, inorganic carbon was removed by treating the powder with boiling hydrochloric acid. Subsequently, the treated powder samples were incinerated at high temperatures. The TOC content was then calculated from the CO2 produced, which was derived from the organic matter present in the samples.
The kerogen type and equivalent vitrinite reflectance (Ro %) were determined in the combination of the MPV-SP microphotometer (Leica Microsystems GmbH, Wetzlar, Germany) and DMRXP multifunctional microscope with transmitted light (400× magnification) and reflected light (500× magnification) using oil immersion, respectively, at the China University of Mining and Technology.
A quantitative analysis of mineral compositions of shale samples was carried out using an Ultima IV X-ray diffractometer (Rigaku Corp., Tokyo, Japan) at the Experimental Research Center of East China Branch, SINOPEC. the XRD test was conducted under conditions of 25 °C and 35% humidity. The X-ray spectra were acquired to correspond with the chemical and crystal structure of various mineral compositions. Following this, the mineralogical composition and relative content calculation were carried out according to the diffraction intensity and key parameters of the peaks observed in the XRD spectra.
A micromorphology observation was performed by a Quanta 200F field emission scanning electron microscopy (FEI, Eindhoven, The Netherlands) at the China University of Petroleum, Beijing. The specific sample preparation and other details can be found in our previous work [15].

2.2.2. Low-Temperature N2 Gas Adsorption

The pore structure was characterized based on LT-N2GA employing an Autosorb IQ pore size and specific surface analyzer (Quantachrome, Boynton Beach, FL, USA) at the Key Laboratory of Coal Preparation and Purification, China University of Mining and Technology. The initial step involved crushing and sieving the original shale into particles sized between 0.18 mm and 0.25 mm (60–80 mesh). To remove any moisture and impurity gases, shale powder samples weighing 5–8 g were sequentially dried for 12 h in an oven maintained at 110 °C. A long-time drying period at a lower temperature can ensure a better effect while preserving the physical and chemical integrity for our lacustrine shales. Following the drying process, all sample powders were placed in a high-vacuum system for complete degassing over a period of 5 h. Successively, we determined and recorded the nitrogen gas adsorption/desorption isotherms of all the shale samples. This was carried out using nitrogen gas with a purity of 99.99% at a temperature of 77.4 K, with relative pressures (P/P0) ranging from 0.009 to 0.998. In the present study, we here choose the multi-point Brunauer–Emmett–Teller (BET) model [59] and Barrett–Joyner–Halenda (BJH) model [60] to estimate the SSA and PV, respectively. Meanwhile, the quenched solid density functional theory (QSDFT) method was used to derive the PSDs according to the N2 adsorption branches. Researchers have highlighted that the QSDFT model excels in analyzing the texture of geometrically disordered carbons as it explicitly takes into account the effects of surface roughness and heterogeneity [16]. It should be noticed that the resolution of the equipment can reach 0.0001 cm3/g and 0.0005 m2/g for the minimum detectable PV and SSA, respectively, and the PSD can be detected from 0.35 nm to 200 nm, which covers all mesopores and most of the micropores and macropores.

2.2.3. CO2 Isothermal Adsorption Experiments at 50 °C

CO2 isothermal adsorption experiments were performed using a GAI-100 volumetric-based adsorption apparatus (CoreLab, USA) (Figure 2), and its principle is to indirectly calculate the adsorption capacities according to the relationship between the gas volume and pressure. The maximum working pressure of the apparatus can reach 69 MPa with an accuracy of 0.05 MPa for the pressure sensor, and the maximum working temperature can reach 177 °C, adopting an advanced digital thermostat bath system with an accuracy of 0.1 °C. The specific experimental procedures were summarized as follows.
(a)
Sample preparation: the original shale was crushed to a 60–80 mesh size (0.18–0.25 mm) by a ball mill, and 100–150 g pulverized powder samples were prepared for each experiment.
(b)
Sample drying and degassing: powder samples underwent a dry treatment at 110 °C for 72 h in an oven to remove impurity gas and moisture.
(c)
Experiment preparation: the powder samples were placed into the sample cell, then a vacuum pump was used to perform vacuum treatment. The target temperature (50 °C) was set through the thermostat bath system.
(d)
Free volume calibration: High-pressure helium was injected to detect the tightness of the device. Helium was used as the probe to calibrate the free volume by comparing the mass balance parameters before and after its injection, and the average value was calculated through multiple measurements to reduce the error.
(e)
Adsorption test: CO2 with a purity of 99.99% was injected into the reference cell to reach the designed pressure, and then the air valve between the reference cell and sample cell was opened for CO2 adsorption. Gradually, CO2 was adsorbed onto the shale samples until a dynamic equilibrium was reached. The adsorption equilibrium time was maintained for more than 12 h at each equilibrium pressure point. In the present study, eight pressure points were set, ranging from 0 to 7 MPa.
(f)
Data collection: The free volume, temperature, and pressure parameters before/after adsorption equilibrium were collected in a computer connected to the apparatus. Finally, the adsorption capacities at each equilibrium pressure were calculated according to the data acquisition system.

2.3. Fractal Theory

The fractal theory was proposed to characterize the complex geometry in nature [61]. Pores in shale or coal are extremely complex and their heterogeneity also can be quantitatively described by a fractal dimension. The adsorption data of probe gas on an adsorbent material can be used to describe the porous structure and surface irregularity of the given materials. Based on LT-N2GA data, several methods for calculating the fractal dimension have been proposed in previous studies [43,62,63], including the Frenkel–Halsey–Hill (FHH) model, thermodynamic method, and fractal BET model. The FHH model has been effectively used to determine the fractal dimensions of shale pore systems [15,64], which is expressed in Equation (1).
V V m = K [ R T ln ( P 0 P ) ] 3 D
where D is the fractal dimension, dimensionless; V is the gas adsorption volume at P/P0, cm3/g; Vm is monolayer coverage volume, cm3/g; P/P0 is relative pressure, dimensionless; R is the universal gas constant; T is the absolute temperature; and K is a characteristic constant.
Equation (1) can be written in a log–log term as follows [15,64]:
ln V = D 3 ln [ l n ( P 0 P ) ] + C o n s t
According to the fractal theory, lnV exhibits a linear correlation with ln[ln(P0/P)] when the pore system exhibits fractal heterogeneity. The fractal dimension, D, can be further determined based on the slope, S, of the lnV versus ln[ln(P0/P)] plots, as outlined in Equation (2). Typically, the value of D ranges from 2 to 3 [65]. A larger fractal dimension indicates greater fractal heterogeneity in the pore system. In particular, a D value of 2 corresponds to a smooth and perfect solid surface, while a D value of 3 means a highly intricate surface.

3. Results

3.1. Organic Geochemistry and Mineralogy of Lacustrine Shales

The organic geochemical evaluation for shales basically includes the TOC content, kerogen type, and thermal evolution degree of the OM. Organic geochemical characteristics not only directly reflect the source rock properties, but also indirectly affect the heterogeneous porosity and adsorption performance. The experimental results show that the TOC contents of shale samples were distributed in the range of 0.82–6.62% with an average of 3.07% (Table 1). Generally, the TOC of the Ch7 lacustrine shales was significantly high as the values of more than half samples were greater than 2%. The regional differentiation is presented in the TOC contents as its value is relatively high in the southeastern basin. Among the collected samples, the TOC contents of shale samples from the Yichuan and Tongchuan regions are higher than those from the Yan’an region. According to the test results (Table 1), the dark shales have an equivalent vitrinite reflectance ranging from 0.79% to 1.12%, with an average value of 0.91%. Compared with marine shales in North America and south China [15,48], the Ch7 lacustrine shales in the study area exhibit significantly lower maturity levels. The organic matter within these shales is in a mature stage, resulting in the coexistence of oil and gas within the reservoirs. The microscopic identification of the kerogen type was conducted on the seven samples from three sampling points. The results show that I and II types of kerogen are prevailing in the Ch7 lacustrine shales (Table 1). In general, the kerogen type is mainly type I for the shale samples located in the central basin, which is rich in macerals of microalgae and bacteriolytic amorphous. The kerogen type transited to the II1 and II2 type near the basin margin because of the impact of the terrigenous deposit inputs from the basin margin.
Based on the XRD spectrum, the mineralogical compositions and clay compositions were interpreted for the lacustrine shale samples, as well as the relative content which was calculated as shown in Table 1 and Figure 3. The primary mineral components of the Ch7 lacustrine shales are clay minerals, quartz, and feldspar, with an average content of 51.25% (ranging from 37.6% to 70.7%), 25.79% (ranging from 19.3% to 30.2%), and 20.15% (ranging from 8.2% to 29.5%), respectively. Additional minerals such as calcite, dolomite, and pyrite are present in minor amounts, each constituting less than 5% of the samples. The significant presence of pyrite within the muddy layers further indicates that the Ch7 shales were deposited in a reducing environment characteristic of a deep lake setting. Clays are primarily composed of the illite–smectite mixed layer (19.8–59.5%, with an average of 28.95%), illite (6.3–15.5%, with an average of 8.56%), kaolinite (2.0–9.9%, with an average of 5.7%), and chlorite (4.6–13.8%, with an average of 8.05%), which reflects a mid-late diagenetic stage for the Ch7 lacustrine shales. Compared to the marine shale from south China in our earlier study [15], the Ch7 lacustrine shales exhibit a higher content of clay minerals, but a lower content of siliceous brittle minerals. The Ch7 shales belong to proximal sediment in inland lacustrine facies, which is obviously affected by the inputs of terrigenous detritus resulting in a relatively low quartz content. The high total clay content, on the one hand, comes from the clay particles during the synsedimentary precipitation and, on the other hand, from the diagenetic transformation by feldspar and other unstable minerals.

3.2. Pore Characteristics of Lacustrine Shales

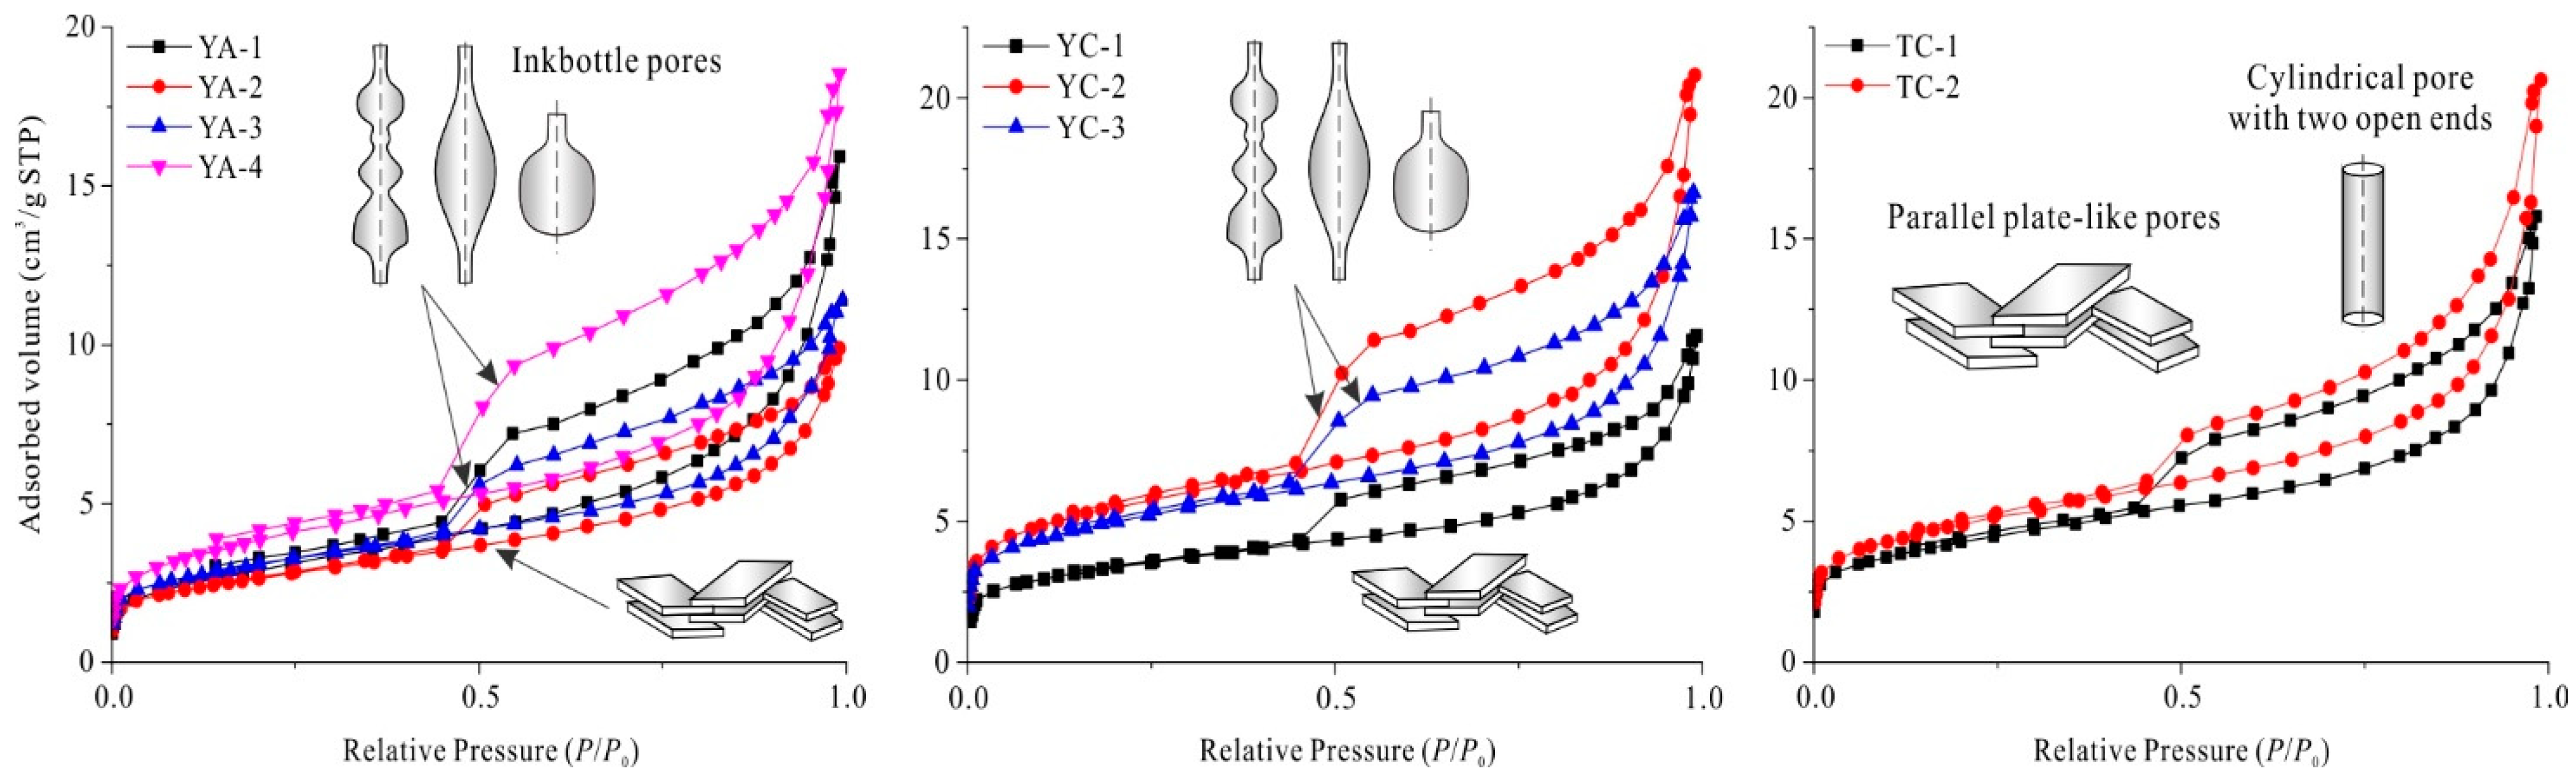
3.2.1. N2 Adsorption/Desorption Isotherms and Pore Shape

The N2 gas adsorption/desorption isotherms are shown in Figure 4. Although the maximum adsorbed volumes are slightly different among the Ch7 shale samples, all the N2 adsorption branches exhibit a reverse “S” shape. The N2 adsorption curves show a variety of characteristics with the increase in the test relative pressure owing to the difference in the dynamic behavior of gas in pores [20,21]. At P/P0 values below 0.01, the adsorption curves exhibit a sharp increase due to micropore filling, suggesting the presence of significant micropore systems in the lacustrine shales. Following this, the adsorption isotherms show a knee-bend shape when P/P0 is in the range of 0.01–0.05, aligning with the type I adsorption isotherm described by the IUPAC [21]. During this phase, it involves N2 molecules covering the pore walls in a monolayer adsorption process. As the relative pressure increases from 0.05 to 0.90, the adsorbed volume gradually rises, transitioning from monolayer to multilayer adsorption. Finally, when the relative pressure rises above 0.90, the adsorption isotherms increase notably and do not reach saturation, even as P/P0 nears 1.00. This behavior indicates the presence of capillary condensation within macropores.
Due to the existence of capillary condensation in the LT-N2GA process, various hysteresis loops occur in adsorption and desorption curves (Figure 4). According to the classification of the hysteresis loop revised by the IUPAC [21], the pore shape in Ch7 lacustrine shales was further analyzed. In general, the hysteresis loops possess a certain width and the desorption branches decrease sharply at the point of P/P0 = 0.5, resembling type H2(b). Additionally, they display type H3 characteristics, particularly under higher pressures. Thus, the pore structures in the Ch7 shale samples include inkbottle pores characterized by a narrow throat and a broad body, as well as cylindrical pores with open ends and parallel plate-shaped pores. However, it should be pointed out that adsorption curves and hysteresis loops for shale samples are the comprehensive superposition from multiple standard curves in the IUPAC classification, which reflects the mixed characteristics of multiple pore shapes in the shales. Therefore, it is difficult to entirely interpret the complex pore morphology in shales only through LT-N2GA curves.

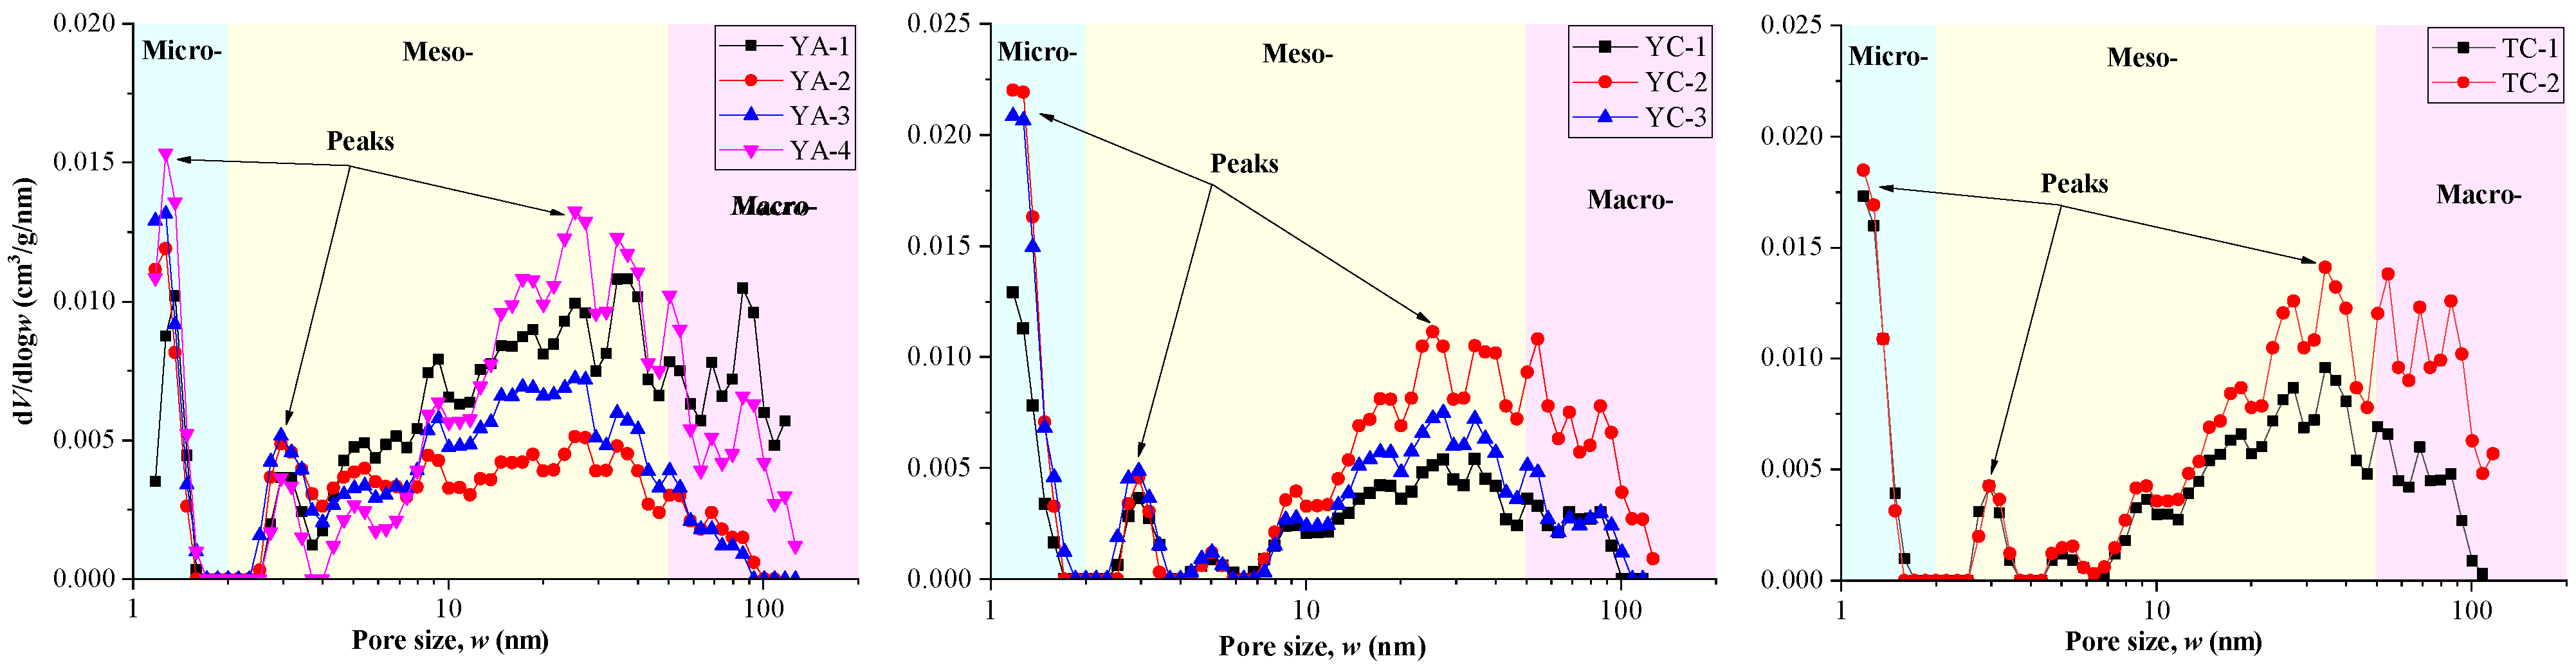
3.2.2. Pore Size Distribution and Pore Structure Parameters

Based on the QSDFT model, we calculated and plotted the dV/dlogw versus pore size (w) to obtain the PSD curves (Figure 5) of the Ch7 lacustrine shale samples. The multi-modal PSDs were presented in a main peak and two secondary peaks for all the samples from three regions. The main peak varies from 1.2 nm to 1.8 nm, which belongs to the range of micropores. One secondary peak occurs in 2.5–4.0 nm, falling in the range of the mesopores, and the other secondary peak distributes from 20 nm to 80 nm, covering a part of the mesopores and macropores. As the molecular dynamic diameter of CO2 is 0.33 nm, all the dominant pores within the range of PSD peaks could offer spaces for CO2 adsorption and storage in the Ch7 lacustrine shales.
Pore structure parameters were posted in Table 2. The total PV calculated by the BJH model is 0.0150–0.0303 cm3/g with an average value of 0.0231 cm3/g for the Ch7 lacustrine shale samples. The total SSA is 9.371–19.724 m2/g with a mean value of 14.091 m2/g based on the BET method. Additionally, the average pore size of the Ch7 shales is 5.93–10.14 nm derived by the QSDFT model, which belongs to the mesopore range. Compared with the typical marine shale reservoirs, the total PV and SSA of the Ch7 lacustrine shales are slightly smaller than that of the Longmaxi shales (total PV: 0.015–0.051 cm3/g, total SSA: 9–34 m2/g) from the southern Sichuan Basin in China reported by Yang et al. (2014) [63], but significantly higher than that of the Niutitang shales (total PV: 0.0043–0.0244 cm3/g, total SSA: 1.221–13.014 m2/g) forming the Upper Yangtze Area of China in our previous study [15]. Thus, the pores of Ch7 lacustrine shales can provide reliable spaces for methane or CO2 storage.

3.3. Fractal Heterogeneity of Pore Structure

Using the least-squares method, the correlations of lnV vs. ln[ln(P0/P)] for the Ch7 lacustrine shale samples are fitted and plotted in Figure 6 according to the data from the N2 desorption branches. Table 3 lists some key parameters calculated according to the FHH model (Equation (3)), including the fitting slopes of linear correlations, fractal dimensions, and the fitting coefficient of determination (R2). For all the samples, two obvious linear correlations are exhibited at the pressure regimes of P/P0 = 0–0.5 and P/P0 = 0.5–1.0, respectively, with all the R2 above 0.9 (Table 3) except for sample YA-3. Accordingly, the pore structure in the Ch7 shale possesses fractal heterogeneity at different PSD stages and the pore size is approximately 4 nm at the dividing point between the two linear relations. Two-regime fractal characteristics are similar to those of the fractal pores in coal and marine shales reported in the previous investigations [15,43,63], as well as D1 and D2 which were defined as the pore surface fractal dimension and spatial structure fractal dimension, respectively. As a result, the pore surface and spatial structure of the Ch7 lacustrine shales exhibit fractal properties. D1 varies from 2.586 to 2.690 (mean value: 2.644), while D2 ranges from 2.756 to 2.855 (mean value: 2.820). Comparatively, D2 is generally larger than D1, indicating that the heterogeneity of the pore spatial structure is stronger than that of the pore surfaces.

3.4. CO2 Adsorption Isotherms of Lacustrine Shales

As illustrated in Figure 7, the CO2 adsorption capacities at each equilibrium pressure were determined by the isothermal adsorption experiments at 50 °C for all the Ch7 lacustrine shale samples. Among the selected samples, the CO2 adsorption capacities in the shale from the Yan’an region are generally lower than that of the shale samples from the Yichuan and Tongchuan regions (Figure 7). Although there are differences in the adsorption capacity among the shale samples, the variation trend of the adsorption capacity is consistent with the increase in pressure for all the lacustrine samples. At low pressures, the adsorption capacity of CO2 rises sharply as the equilibrium pressure increases, while the increasing trend changes to slow and stable at high pressures, indicating that the CO2 adsorption tends to be saturated in the shale samples.
In the previous studies [30,48], the Langmuir model was commonly employed to fit the CH4 adsorption isotherms in coals and shales and determine the adsorption parameters. According to the following assumptions [66]: (a) the adsorbent surface is uniform; (b) adsorption occurs as a monolayer of molecules; (c) the dynamic adsorption equilibrium is established between the adsorbate and adsorbent; and (d) there are no interactions between gas molecules. The Langmuir model can be derived as follows:
V = P V L P + P L
where P is the testing pressure, MPa; V is the methane adsorption content at pressure P, cm3/g; PL is the Langmuir pressure, MPa; and VL is the Langmuir volume, which indicates the highest methane adsorption capacity, cm3/g.
The Langmuir model was extended to investigate the CO2 adsorption on lacustrine shales in this study. Figure 7 and Table 4 show that the CO2 adsorption isotherms for all the Ch7 lacustrine shale samples were accurately modeled using the Langmuir equation (Equation (3)), with all the fitting coefficients R2 greater than 0.99. We further obtained the CO2 adsorption parameters listed in Table 4. The Langmuir volume (VL) of the Ch7 shale samples varies from 2.16 cm3/g to 6.89 cm3/g with an average of 4.33 cm3/g, and the Langmuir pressure (PL) ranges from 1.21 MPa to 3.07 MPa with an average of 1.98 MPa. In general, the samples collected from the Yichuan and Tongchuan areas possess large VL but low PL values, which implies the strong adsorption affinity between CO2 molecules and shale compositions. Our previous work reported the CO2 adsorption capacity in marine shales in the range of 3.26–6.95 cm³/g, with an average value of 5.03 cm³/g [64]. Therefore, compared to marine shales, the lacustrine shales in this study have a comparable CO2 adsorption capacity and storage potential.

4. Discussion

4.1. Effect of Lacustrine Shale Compositions on CO2 Adsorption Capacity

In fact, CO2 adsorption in shales can be attributed to the interrelationship between various components of shales and CO2 gas. Hence, the adsorption capacity is closely related to the shale compositions, among which, OM and clays are considered to be the key factors affecting the adsorption capacity [53,54] because they are associated with internal pores and surfaces for gas adsorption and storage. In the massive amount of CH4 adsorption data on marine shales [15,48,63], the adsorption capacity was positively affected by the TOC content. A clear positive correlation between the CO2 Langmuir volume VL and TOC content is plotted in Figure 8a, with a high correlation coefficient of 0.781. Similar findings have also been observed in CO2 adsorption in marine shales [64]. Obviously, the TOC remains crucial in enhancing the CO2 adsorption capacities in Ch7 lacustrine shales. In Section 3.1, we stated that the kerogen of the Ch7 shale is mainly I-II type at the early-maturity stage. The kerogen macromolecules are rich in polar functional groups and various side chains, promoting the strong gas adhesion ability of the OM particles. In addition, Figure 8b shows that the total SSA is positively correlated with the TOC content. According to the FE-SEM observations (Figure 9a,b), the OM pores in the Ch7 lacustrine shales exhibit honeycomb- and grid-like structures, providing abundant surface areas for CO2 adsorption. Under the influence of the above factors, the greater TOC content leads to increased CO2 adsorption capacities in the Ch7 lacustrine shales.
The effect of clay minerals on methane adsorption is still unclear and has not yet formed a definite conclusion for shale reservoirs [15,67]. The total clay content versus the Langmuir volume was illustrated in Figure 10. There is no obvious relationship between the total clays and VL of the Ch7 lacustrine shale samples. It should be noted that the strong effect of OM on the CO2 adsorption capacity could mask the effect of clays. Further, the Langmuir volumes were normalized to the TOC content to eliminate the influence on the analysis from the OM. As presented in Figure 10, a varying trend can be identified, where the TOC-normalized VL appears to first decrease and then increase as the total clay content increases. Our previous work on marine shales shows that the effect of clays on CO2 adsorption is monotonically increasing [64]. However, compared to marine shales, the abundant clay mineral content and diverse clay types in lacustrine shales result in a multifaceted impact on CO2 adsorption. In the study area, the Ch7 lacustrine shales are characterized by a high content of clays, of which the illite–smectite mixed layer is the main type of clay (Figure 3). Generally, the illite–smectite mixed layers occur as filamentous, flocculent, and irregular flakes, which are either attached to the particle surfaces or filled into pores. The FE-SEM image also confirmed the existence of clay minerals filling pores in lacustrine shales (Figure 9c), and this phenomenon reduces pore spaces and limits the CO2 adsorption capacity. However, with the continuous increase in the clay content, the clay-related pores (Figure 9d) dominate adsorption locations and storage spaces to improve the CO2 adsorption capacity. In summary, the effects of clays on the pore structure and CO2 adsorption capacity are relatively complex in lacustrine shales, which need to be specially analyzed in the specific samples.

4.2. Effect of Pore Size Distributions on CO2 Adsorption Capacity

Pores in lacustrine shales directly affect the CO2 adsorption capacity as the place where shale compositions interact with CO2 gas. Figure 11 shows the correlations between the CO2 adsorption capacities and the total PVs and SSAs of the Ch7 lacustrine shales. The Langmuir volume does not exhibit a clear correlation with the total PV (Figure 11a), while the positive correlation between the Langmuir volume and total SSA is strong with R2 = 0.8411 (Figure 11b). As the SSA increases, more CO2 can be absorbed into the lacustrine shales. Thus, the adsorption capacities of the Ch7 samples are predominantly influenced by the SSA, which directly correlates with the number of available sites for CO2 adsorption.
As for the total PV, differently sized pores may possess a different influence on the the CO2 adsorption capacity. So, we plotted the scatter diagrams of the Langmuir volume versus the PV of micro-, meso-, and macropores, respectively. As shown in Figure 12, the data points for the Langmuir volume in relation to meso- and macropore volumes appear to be randomly distributed, showing no clear correlation. However, the Langmuir volume presents a positive linear correlation with the micropore volume. Consequently, the micropores are the governing factor for CO2 adsorption capacities in the Ch7 lacustrine shales.
On the one hand, pores of varying sizes contribute differently to the PV and SSA. As illustrated in Figure 13, we calculated the proportions of pores in different PSDs in relation to the overall PV and SSA. Among these, mesopores constitute the largest share of the total PV (55.47–75.69%, average: 64.48%), followed by micropores (7.41–34.02%, average: 20.80%), and the macropores account for 4.93–26.57% with an average of 14.72%. Nevertheless, micropores contributed the most to the total SSA, ranging from 46.48% to 84.22% with an average of 72.14%. This was followed by mesopores, which accounted for 15.35% to 51.21%, averaging 26.80%. Macropores made up only a minimal 1.05% on average. The total PV of the Ch7 lacustrine shales is mainly provided by mesopores, whereas the total SSA is dominantly contributed by micropores. The findings align with those reported by Wang et al. (2016) regarding organic-rich marine shales in the Upper Yangtze region of China [48]. Thus, given a certain PV, micropores would provide a greater surface area for CO2 adsorption. On the other hand, compared with meso- and macropores, micropores have relatively close pore walls, leading to a larger adsorption potential as the van der Waals force fields would overlap between these walls [18,19]. Therefore, we try to conclude that the main reason why micropores play a dominant role in CO2 adsorption is that micropores offer a larger unit specific surface area and greater adsorption potentials compared to macropores and mesopores.

4.3. Effect of Fractal Dimensions on CO2 Adsorption Capacity

Fractal pore heterogeneity is also an important factor in gas adsorption in coal or shale reservoirs [15,41,43]. The fractal dimensions of pores may be completely different even if they have the same PV or SSA. In Section 3.3, pores in the Ch7 lacustrine shales were characterized by two-regime fractal heterogeneity (Figure 6) with fractal dimensions D1 and D2, respectively. Figure 14 shows the correlations between the CO2 adsorption capacities and fractal dimensions. The VL positively correlates with D1 within the range defined by the dashed lines, as the Langmuir volumes generally increase with the increasing fractal dimension D1 of the Ch7 lacustrine shale samples. However, the relationship is unclear between the fractal dimension D2 and VL. Both D1 and D2 are obtained by fitting N2 desorption data using the FHH model, but the physical meanings conveyed by them are discrepant. Two-regime fractal characteristics suggest the different behaviors of N2 gas in the desorption process. N2 desorption first occurs in the internal spaces of pores to get rid of capillary condensation, and the fractal dimension D2 calculated from the data at high pressures (P/P0 = 0.5–1.0) reflects the structural irregularity of the pore space. Nevertheless, at low pressures (P/P0 = 0–0.5), N2 desorption primarily occurs on the pore surface against the van der Waals force, with the fractal dimension D1 characterizing the heterogeneous nature of the pore surface. In this study, the CO2 adsorption in the shale reservoirs mainly involves the interaction between the gas molecules and the pore surface under van der Waals forces. Thus, the pore surface fractal dimension (D1) is strongly linked to the CO2 adsorption capacity, while the spatial structure fractal dimension (D2) has a less noticeable impact on the CO2 adsorption capacity.
To explain the internal mechanism of the fractal dimension D1 on the CO2 adsorption capacities, the scatter diagrams of the fractal dimension D1 versus the total SSA and micropore volume were further plotted in Figure 15. The results indicate a positive correlation between the total SSA and D1 (R2 = 0.7052), which means that the heterogeneous pore surface provides more area for CO2 adsorption. Meanwhile, the micropore volumes positively correlate with fractal dimension D1 (Figure 15). Thus, the micropores possess relatively complex and heterogeneous surfaces, which is a fundamental reason for micropores dominating the total SSA. In conclusion, a larger fractal dimension D1 along with a rougher pore surface and more sites are available for gas adsorption, thereby facilitating the CO2 adsorption capacity in the Ch7 lacustrine shales.

5. Conclusions

In this work, CO2 adsorption in lacustrine shales has been systematically analyzed. Meanwhile, the effects of shale compositions and fractal pores on CO2 adsorption capacities have been discussed, leading to new insights that are distinct from marine shales, which further provide implications for CO2 geological storage in lacustrine shale reservoirs. Here are the key conclusions:
(1)
Distinguished from the mineralogy in typical marine shales, the Ch7 lacustrine shales have a lower quartz content but a higher clay content. The CO2 adsorption isotherms of the Ch7 lacustrine shales show a quick uptake at lower injection pressures, which then levels off gradually as the pressures increase, with the Langmuir volume ranging from 2.16–6.89 cm3/g at 50 °C.
(2)
The PSDs are multi-modal with a main peak and two secondary peaks in the Ch7 lacustrine shales. Two-regime fractal characteristics were identified in the pore structure of Ch7 lacustrine shales, and fractal dimensions were quantitatively calculated with the pore surface fractal dimension (D1) and spatial structure fractal dimension (D2) varying at 2.586–2.690 and 2.756–2.855, respectively.
(3)
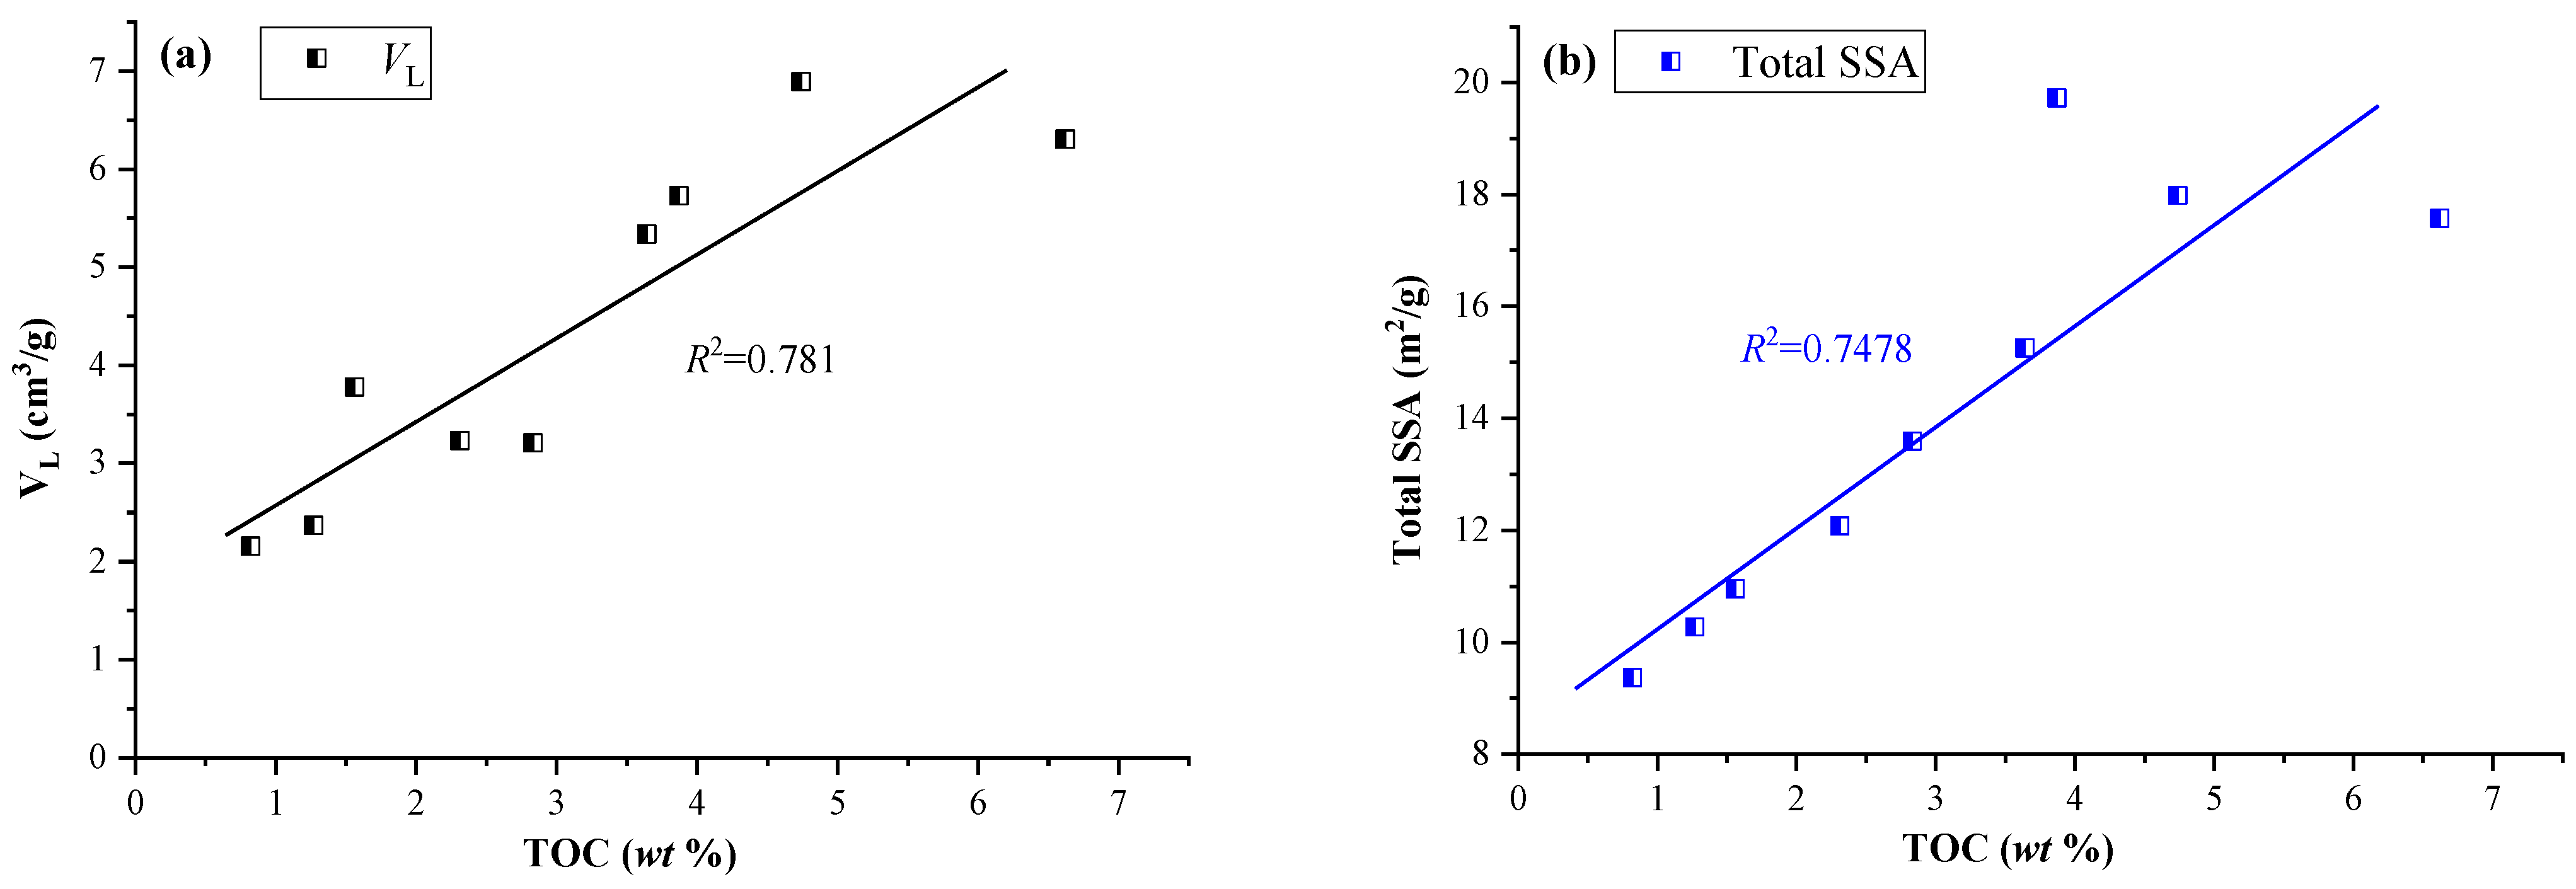
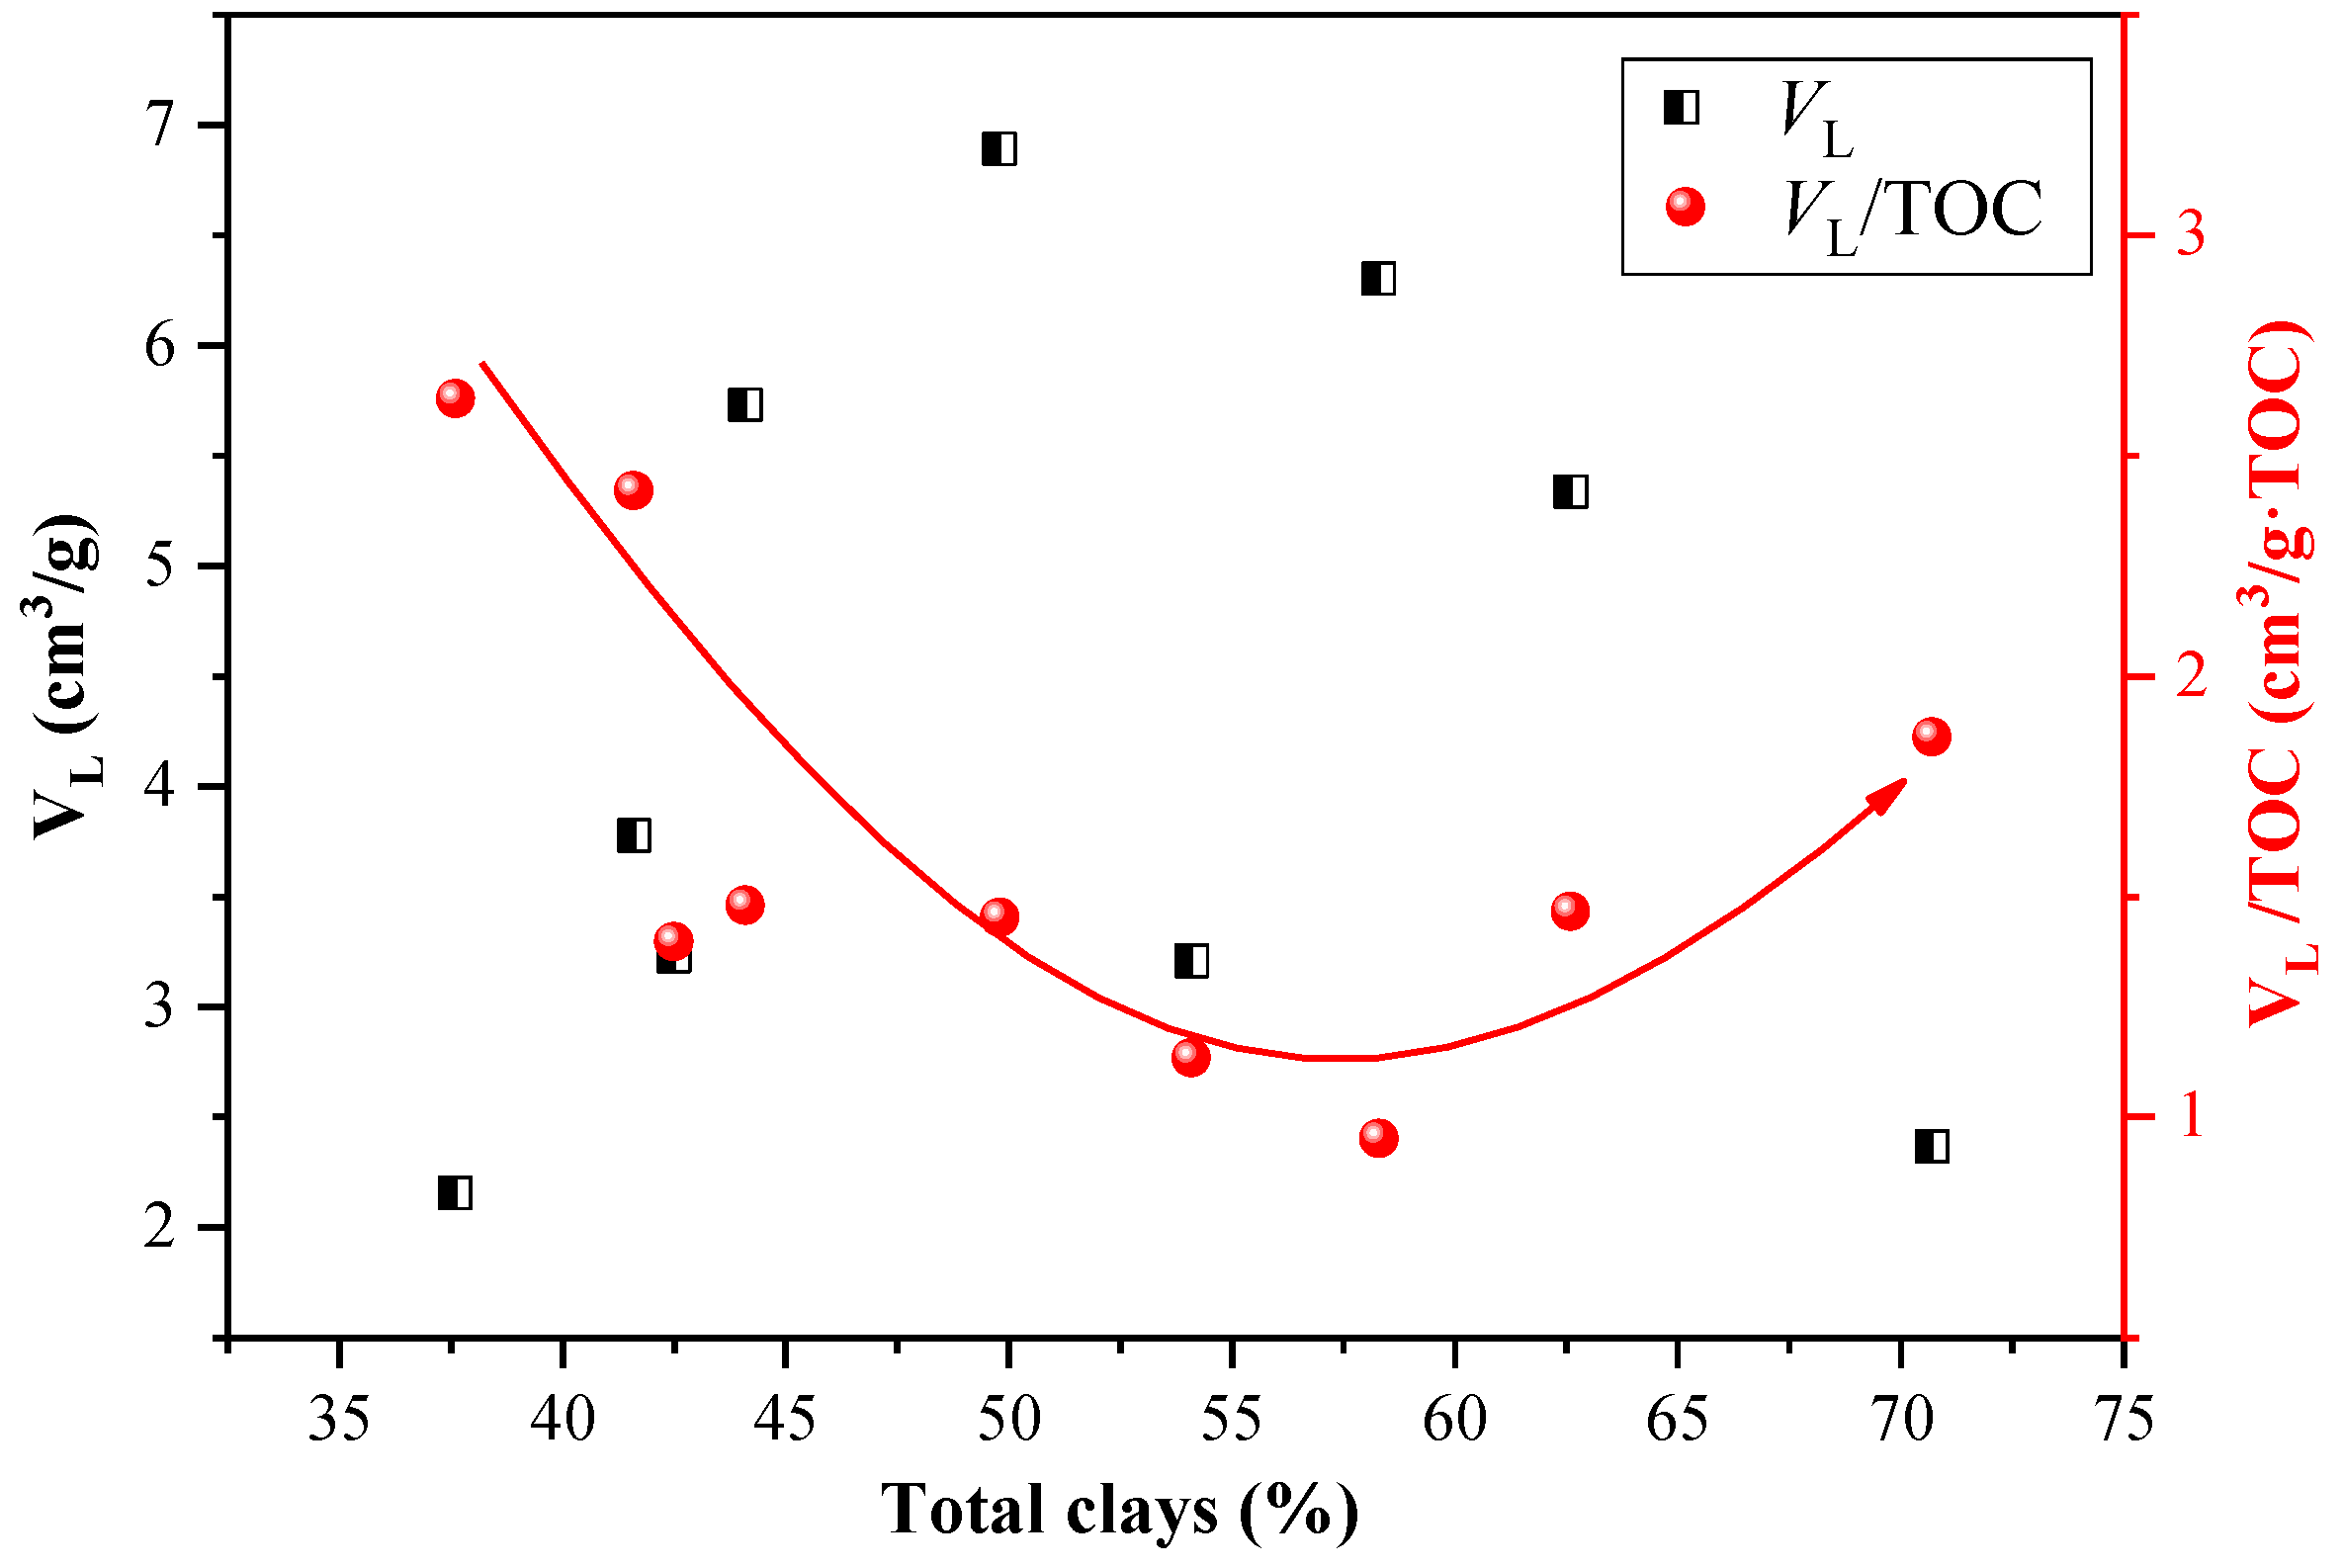
The TOC significantly enhances the capacity for CO2 adsorption in the Ch7 lacustrine shales due to the rich nanopores and specific surface area provided by organic matter. However, the effect of clay minerals on CO2 adsorption is multi-faceted in Ch7 lacustrine shales. As the total clay content increases, the CO2 adsorption capacity initially decreases because the illite–smectite mixed layers fill the pores spaces, limiting the CO2 adsorption capacity, and then increase as the clay-related pores gradually dominate the pore spaces and adsorption sites.
(4)
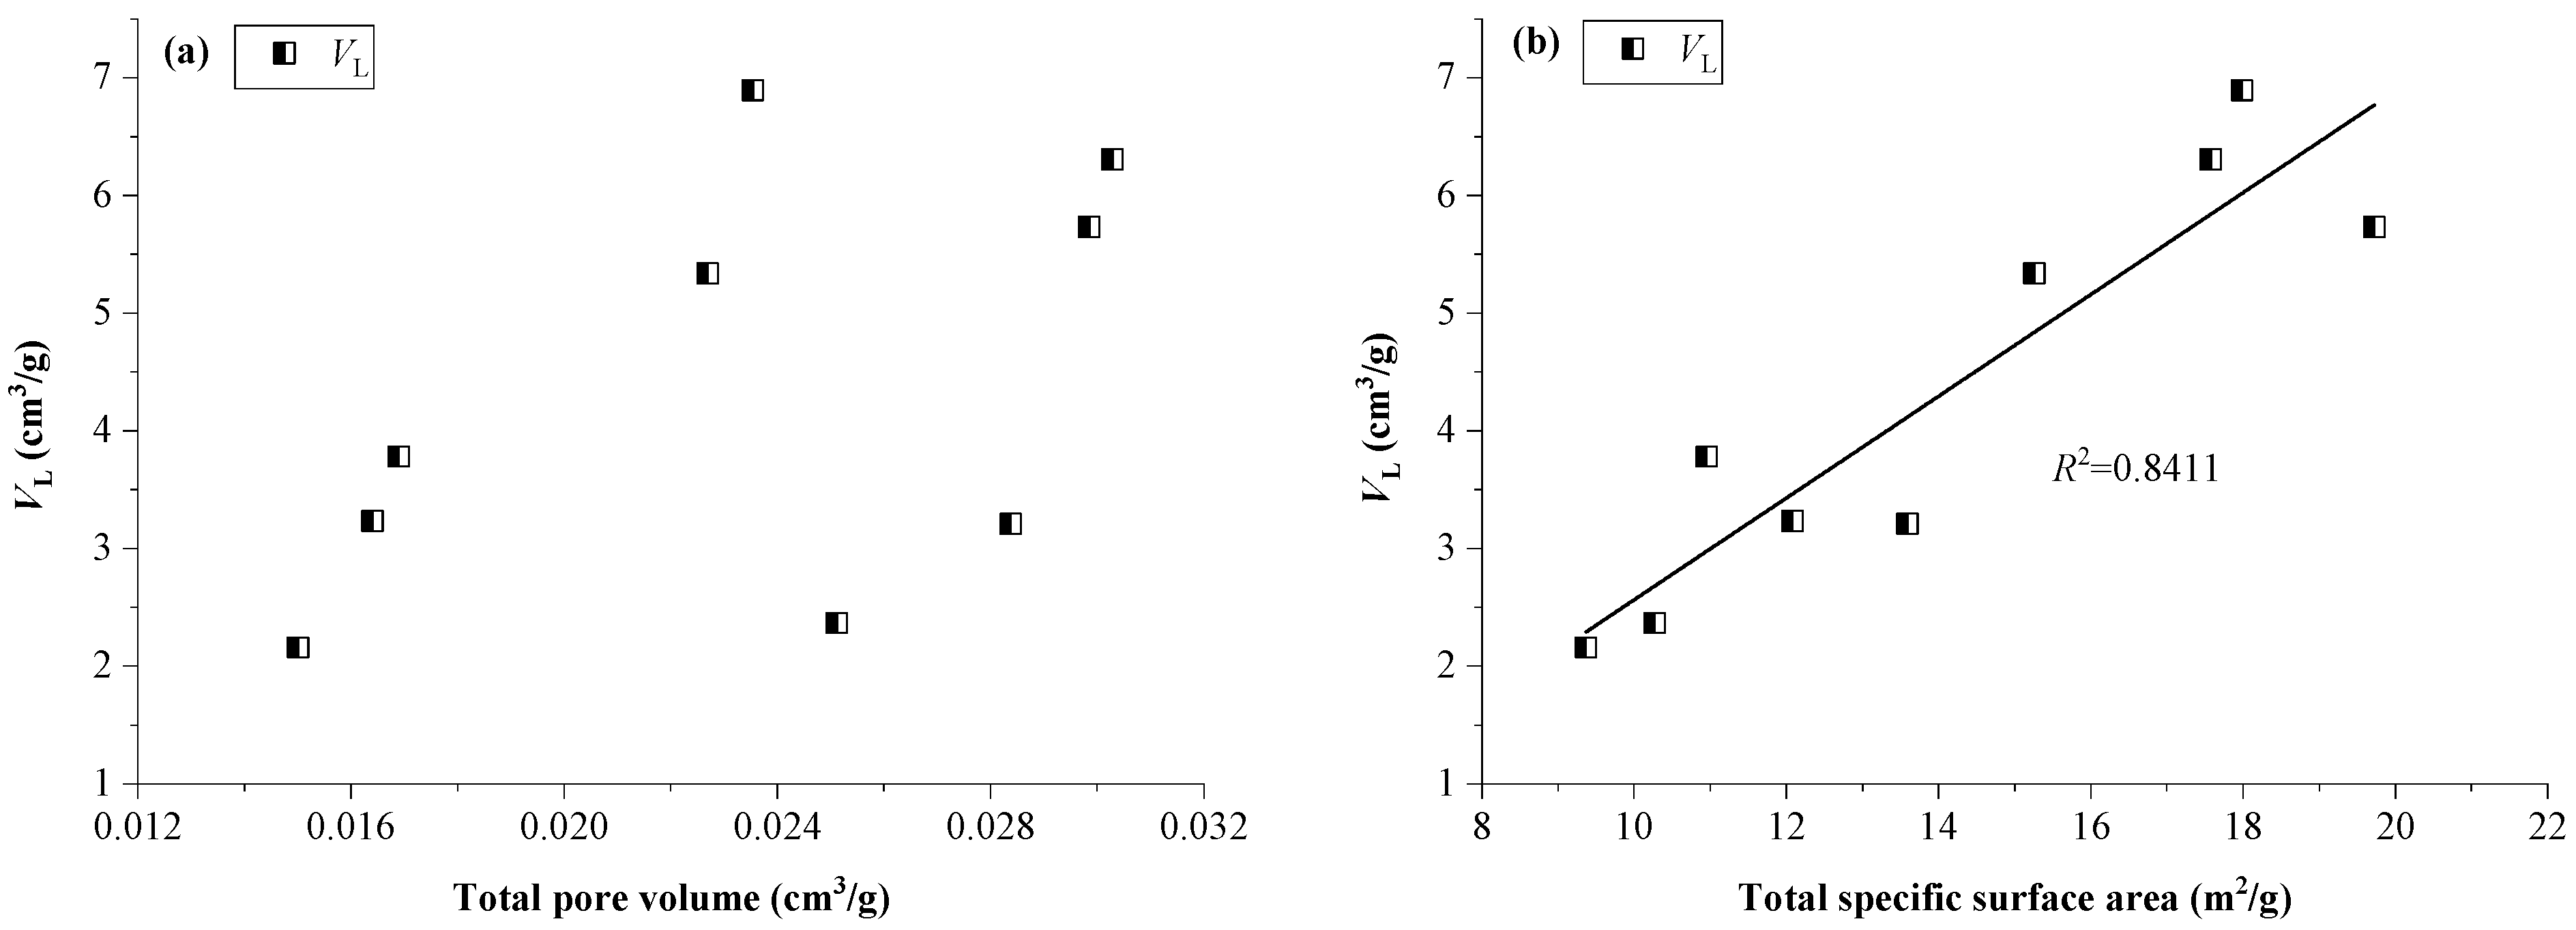
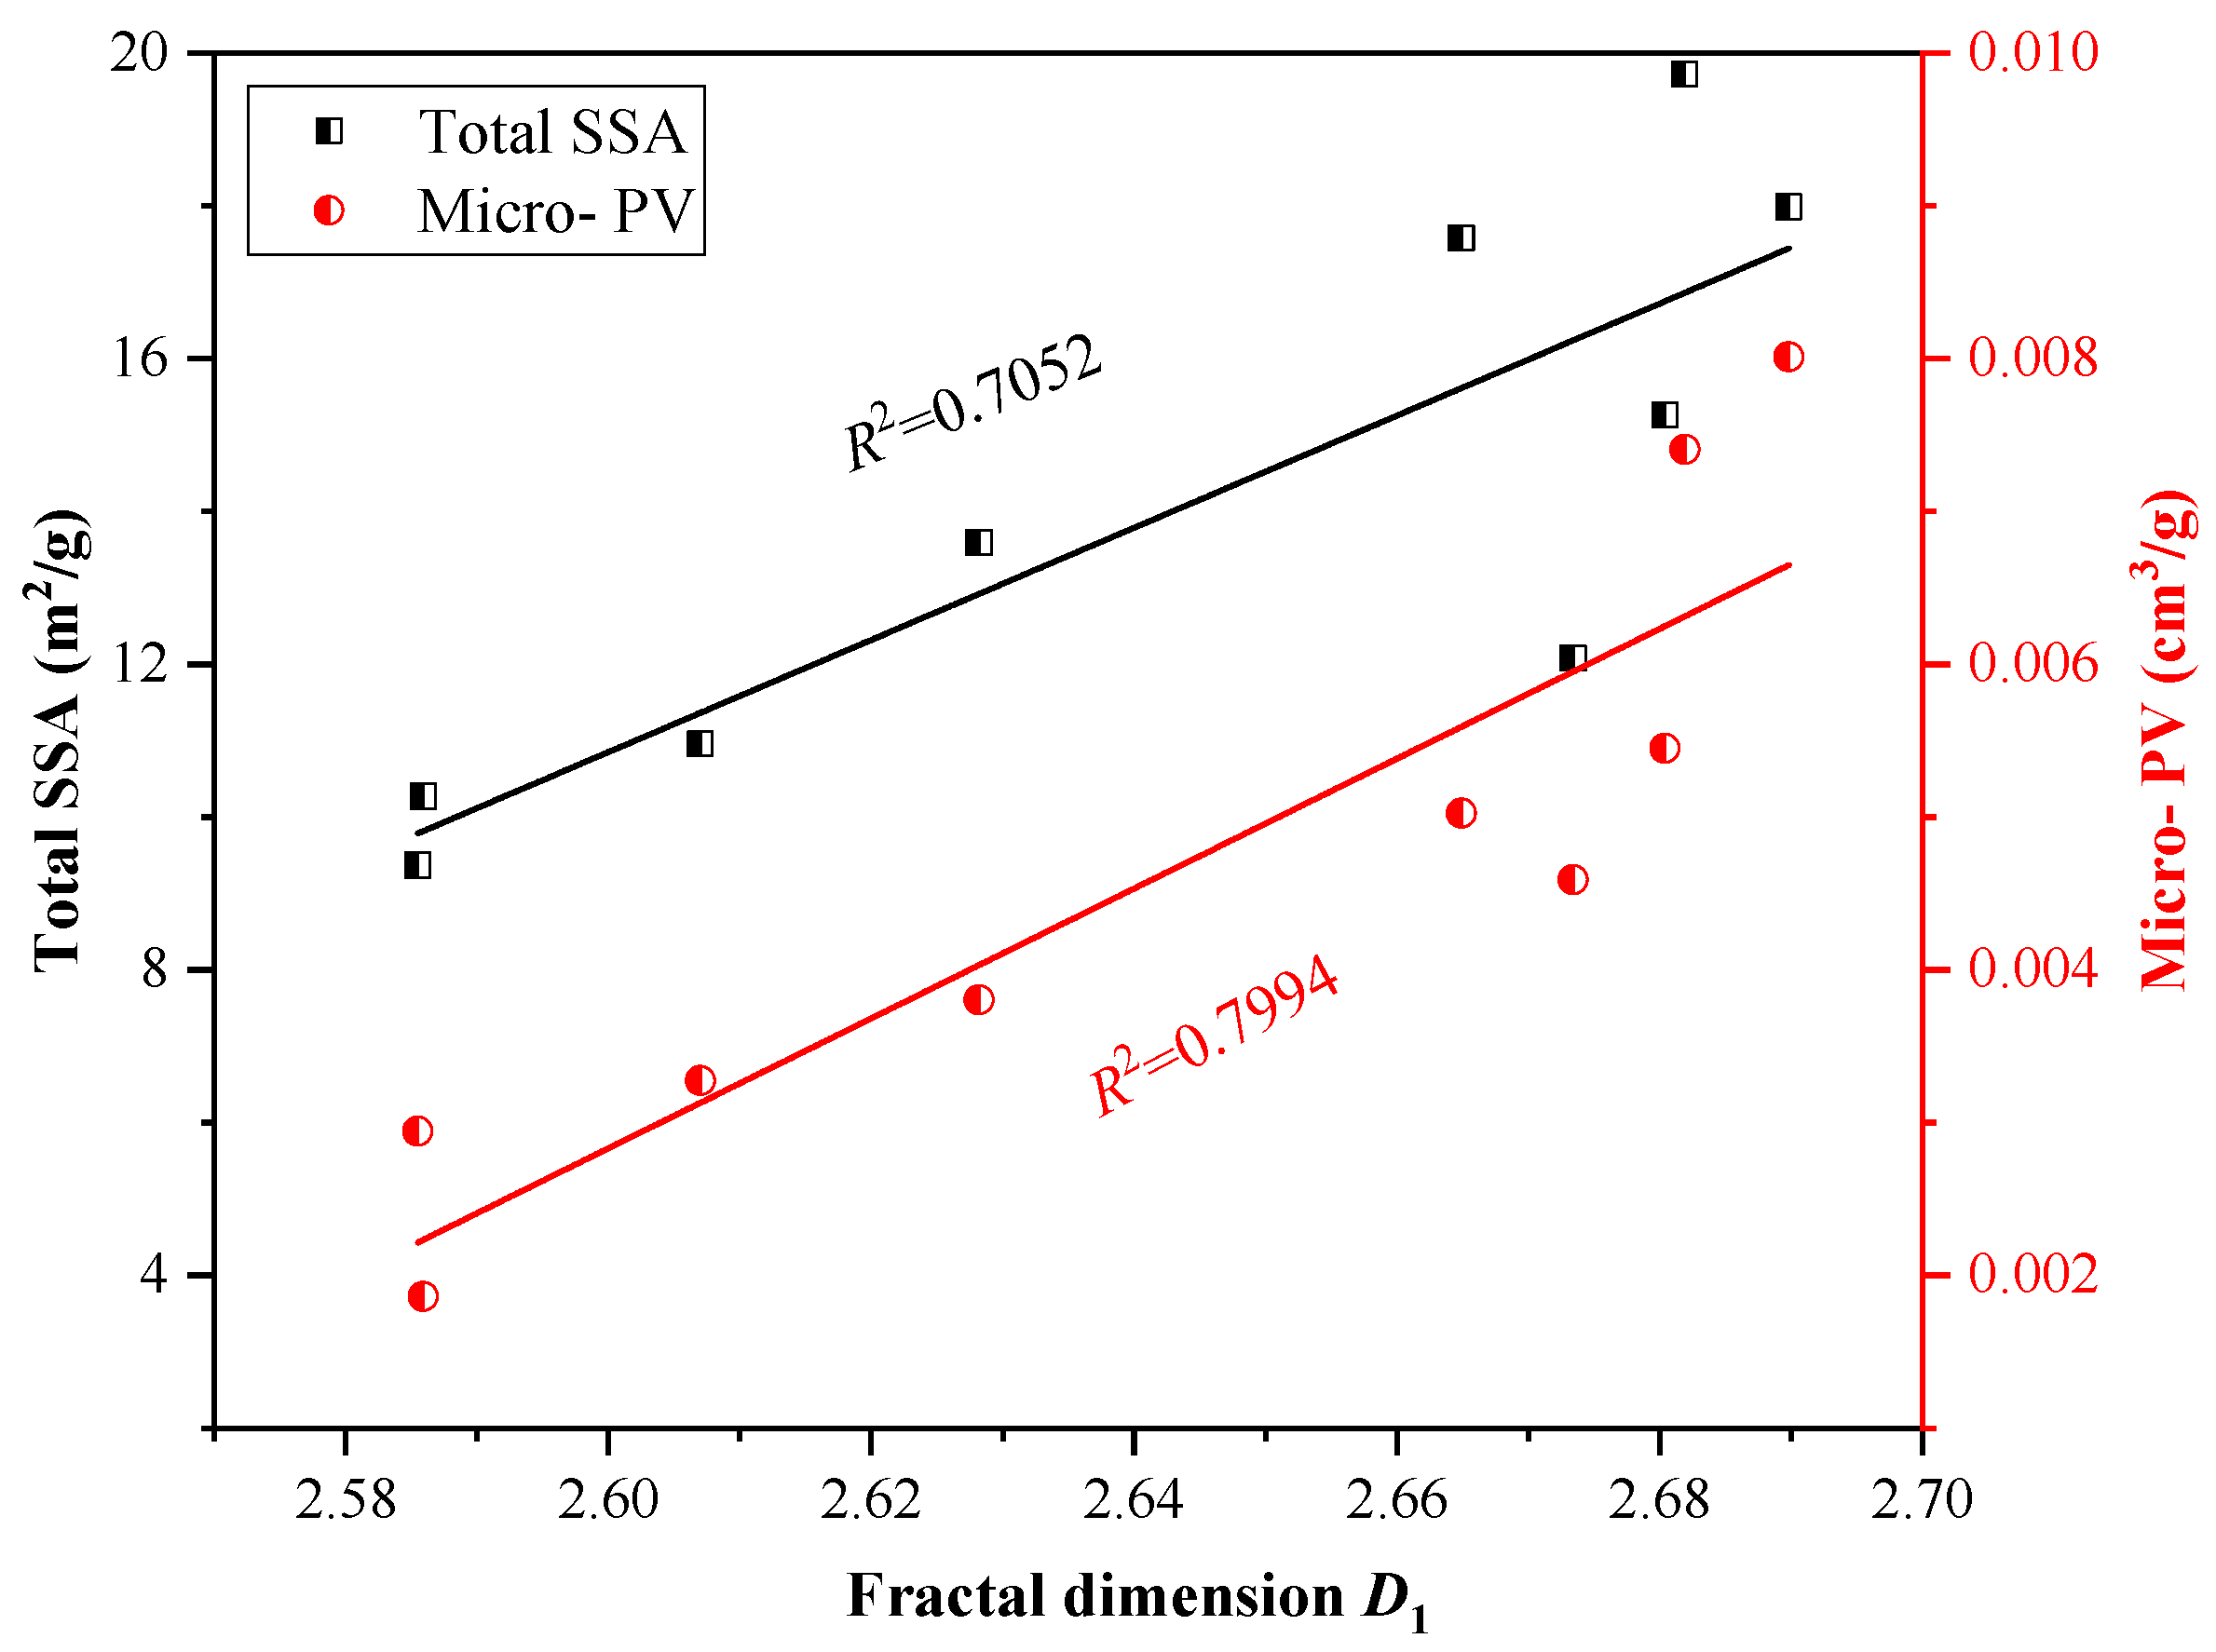
Among the pore size distributions in lacustrine shales, micropores dominate CO2 adsorption as they contribute to a larger specific surface area per unit and possess greater adsorption potentials compared to macropores and mesopores. Moreover, the pore surface fractal dimension (D1) is positively related to CO2 adsorption capacity because of a larger D1 along with a more heterogeneous pore surface and more available locations for CO2 adsorption, while the spatial structure fractal dimension (D2) has a less noticeable impact on the CO2 adsorption capacity.

Author Contributions

G.F.: Methodology, Writing—original draft, Funding acquisition. M.W. and Y.Z.: Conceptualization, Writing—review and editing. Y.S. and S.Z.: Investigation, Validation. X.D. and X.W.: Software, Formal analysis. All authors have read and agreed to the published version of the manuscript.

Funding

This research was funded by the National Natural Science Foundation of China (Grant Nos. 42202190 and 42402177), the Natural Science Foundation of the Jiangsu Province, China (Grant Nos. BK20221147 and BK20231084), and the Postdoctoral Fellowship Program of CPSF (GZC20233002).

Data Availability Statement

Data are contained within the article, further inquiries can be directed to the corresponding author.

Acknowledgments

We thank Han Zhang at Taiyuan University of Technology, China, for her assistance in the sample collection and FE-SEM observation.

Conflicts of Interest

The authors declare that they have no known competing financial interests or personal relationships that could have appeared to influence the work reported in this paper.

References

  1. Chronopoulos, T.; Fernandez-Diez, Y.; Maroto-Valer, M.M.; Ocone, R.; Reay, D.A. CO2 desorption via microwave heating for post-combustion carbon capture. Microporous Mesoporous Mat. 2014, 197, 288–290. [Google Scholar] [CrossRef]
  2. Fernández, J.; Sotenko, M.; Derevschikov, V.; Lysikov, A.; Rebrov, E.V. A radiofrequency heated reactor system for post-combustion carbon capture. Chem. Eng. Process. Process Intensif. 2016, 108, 17–26. [Google Scholar] [CrossRef]
  3. Du, X.; Gu, M.; Hou, Z.; Liu, Z.; Wu, T. Experimental study on the kinetics of adsorption of CO2 and CH4 in gas-bearing shale reservoirs. Energy Fuels 2019, 33, 12587–12600. [Google Scholar] [CrossRef]
  4. Fakher, S.; Imqam, A. High pressure-high temperature carbon dioxide adsorption to shale rocks using a volumetric method. Int. J. Greenh. Gas. Control 2020, 95, 102998. [Google Scholar] [CrossRef]
  5. Hu, K.; Herdegen, V.; Mischo, H. Carbon dioxide adsorption to 40 mpa on extracted shale from Sichuan basin, southwestern China. Fuel 2022, 318, 123666. [Google Scholar] [CrossRef]
  6. Jeong, S.R.; Park, J.H.; Lee, J.H.; Jeon, P.R.; Lee, C. Review of the adsorption equilibria of CO2, CH4, and their mixture on coals and shales at high pressures for enhanced CH4 recovery and CO2 sequestration. Fluid Phase Equilib. 2023, 564, 113591. [Google Scholar] [CrossRef]
  7. Khormali, A.; Ahmadi, S. Experimental and modeling analysis on the performance of 2-mercaptobenzimidazole corrosion inhibitor in hydrochloric acid solution during acidizing in the petroleum industry. J. Pet. Explor. Prod. Technol. 2023, 13, 2217–2235. [Google Scholar] [CrossRef]
  8. Wang, X.; Zhou, J.; Sun, X.; Tian, S.; Tang, J.; Shen, F.; Wu, J. The influences of composition and pore structure on the adsorption behavior of CH4 and CO2 on shale. Front. Earth Sci. 2021, 15, 283–300. [Google Scholar] [CrossRef]
  9. Ambrose, R.J.; Hartman, R.C.; Diaz-Campos, M.; Akkutlu, I.Y.; Sondergeld, C.H. Shale gas-in-place calculations part I: New pore-scale considerations. SPE J. 2012, 17, 219–229. [Google Scholar] [CrossRef]
  10. Feng, G.; Zhu, Y.; Chen, S.; Wang, Y.; Ju, W.; Hu, Y.; You, Z.; Wang, G.G.X. Supercritical methane adsorption on shale over wide pressure and temperature ranges: Implications for gas-in-place estimation. Energy Fuels 2020, 34, 3121–3134. [Google Scholar] [CrossRef]
  11. Tang, X.; Ripepi, N.; Luxbacher, K.; Pitcher, E. Adsorption models for methane in shales: Review, comparison, and application. Energy Fuels 2017, 31, 10787–10801. [Google Scholar] [CrossRef]
  12. Curtis, J. Fractured shale-gas systems. Am. Assoc. Pet. Geol. Bull. 2002, 86, 1921–1938. [Google Scholar] [CrossRef]
  13. Jarvie, D.M.; Hill, R.J.; Ruble, T.E.; Pollastro, R.M. Unconventional shale-gas systems: The Mississippian Barnett shale of north-central Texas as one model for thermogenic shale-gas assessment. Am. Assoc. Pet. Geol. Bull. 2007, 91, 475–499. [Google Scholar] [CrossRef]
  14. Guo, H.; Wang, Z.; Zhang, Y.; Sun, Y.; Liu, S.; Li, Z.; Liu, Y.; Yang, S.; Zhao, S. Influence of shale mineral composition and proppant filling patterns on stress sensitivity in shale reservoirs. Processes 2024, 12, 789. [Google Scholar] [CrossRef]
  15. Feng, G.; Zhu, Y.; Wang, G.G.X.; Chen, S.; Wang, Y.; Ju, W. Supercritical methane adsorption on overmature shale: Effect of pore structure and fractal characteristics. Energy Fuels 2019, 33, 8323–8337. [Google Scholar] [CrossRef]
  16. Chalmers, G.R.; Bustin, R.M.; Power, I.M. Characterization of gas shale pore systems by porosimetry, pycnometry, surface area, and field emission scanning electron microscopy/transmission electron microscopy image analyses: Examples from the barnett, woodford, haynesville, marcellus, and doig units. Am. Assoc. Pet. Geol. Bull. 2012, 96, 1099–1119. [Google Scholar] [CrossRef]
  17. Wang, J.J.; Lu, S.F.; Zhang, P.F.; Zhi, Q.; Huang, H.S. Pore distribution characteristics of different lithofacies shales: Evidence from scanning electron microscopy. Processes 2023, 11, 1120. [Google Scholar] [CrossRef]
  18. Liu, Y.; Zhu, Y.; Li, W.; Xiang, J.; Wang, Y.; Li, J.; Zeng, F. Molecular simulation of methane adsorption in shale based on grand canonical monte carlo method and pore size distribution. J. Nat. Gas Sci. Eng. 2016, 30, 119–126. [Google Scholar] [CrossRef]
  19. Mosher, K.; He, J.; Liu, Y.; Rupp, E.; Wilcox, J. Molecular simulation of methane adsorption in micro- and mesoporous carbons with applications to coal and gas shale systems. Int. J. Coal Geol. 2013, 109–110, 36–44. [Google Scholar] [CrossRef]
  20. Sing, K.S.W.; Everett, D.H.; Haul, R.A.W.; Moscou, L.; Pierotti, R.A.; Rouquerol, J.; Siemieniewska, T. Reporting physisorption data for gas/solid systems with special reference to the determination of surface area and porosity. Pure Appl. Chem. 1985, 57, 603–619. [Google Scholar] [CrossRef]
  21. Thommes, M.; Kaneko, K.; Neimark, A.V.; Olivier, J.P.; Rodriguez-Reinoso, F.; Rouquerol, J.; Sing, K.S.W. Physisorption of gases, with special reference to the evaluation of surface area and pore size distribution (iupac technical report). Pure Appl. Chem. 2015, 87, 1051–1069. [Google Scholar] [CrossRef]
  22. Chen, F.; Yang, D.; Liu, D.; Ding, X.; Lu, S. Correction and application of the nuclear magnetic resonance T2 spectra of shale reservoir samples in a centrifugal state: A case study of the Longmaxi Shale in Southeast Chongqing, China. Energy Fuels 2022, 36, 14913–14925. [Google Scholar] [CrossRef]
  23. Zheng, S.; Yao, Y.; Liu, D.; Cai, Y.; Liu, Y. Characterizations of full-scale pore size distribution, porosity and permeability of coals: A novel methodology by nuclear magnetic resonance and fractal analysis theory. Int. J. Coal Geol. 2018, 196, 148–158. [Google Scholar] [CrossRef]
  24. Mastalerz, M.; He, L.; Melnichenko, Y.B.; Rupp, J.A. Porosity of coal and shale: Insights from gas adsorption and sans/usans techniques. Energy Fuels 2012, 26, 5109–5120. [Google Scholar] [CrossRef]
  25. Radlinski, A.; Mastalerz, M.; Hinde, A.; Hainbuchner, M.; Rauch, H.; Baron, M.; Lin, J.; Fan, L.; Thiyagarajan, P. Application of saxs and sans in evaluation of porosity, pore size distribution and surface area of coal. Int. J. Coal Geol. 2004, 59, 245–271. [Google Scholar] [CrossRef]
  26. Garum, M.; Glover, P.W.J.; Lorinczi, P.; Drummond-Brydson, R.; Hassanpour, A. Micro- and nano-scale pore structure in gas shale using XµU-CT and FIB-SEM techniques. Energy Fuels 2020, 34, 12340–12353. [Google Scholar] [CrossRef]
  27. Huang, X.; Yang, D.; Kang, Z. Three-phase segmentation method for organic matter recognition in source rocks via CT images: A case study on oil shale pyrolyzed by steam. Energy Fuels 2021, 35, 10075–10085. [Google Scholar] [CrossRef]
  28. Loucks, R.G.; Reed, R.M.; Ruppel, S.C.; Hammes, U. Spectrum of pore types and networks in mudrocks and a descriptive classification for matrix-related mudrock pores. Am. Assoc. Pet. Geol. Bull. 2012, 96, 1071–1098. [Google Scholar] [CrossRef]
  29. Loucks, R.G.; Reed, R.M.; Ruppel, S.C.; Jarvie, D.M. Morphology, genesis, and distribution of nanometer-scale pores in siliceous mudstones of the Mississippian Barnett shale. J. Sediment. Res. 2009, 79, 848–861. [Google Scholar] [CrossRef]
  30. Feng, G.; Zhao, X.; Wang, M.; Song, Y.; Zheng, S.; He, Y.; You, Z. Fractal pore and its impact on gas adsorption capacity of outburst coal: Geological significance to coalbed gas occurrence and outburst. Adsorp. Sci. Technol. 2022, 2022, 4273900. [Google Scholar] [CrossRef]
  31. Huang, Z.; Liu, G.; Li, T.; Li, Y.; Yin, Y.; Wang, L. Characterization and control of mesopore structural heterogeneity for low thermal maturity shale: A case study of Yanchang formation shale, ordos basin. Energy Fuels 2017, 31, 11569–11586. [Google Scholar] [CrossRef]
  32. Li, Y.; Song, D.; Liu, S.; Ji, X.; Hao, H. Evaluation of pore properties in coal through compressibility correction based on mercury intrusion porosimetry: A practical approach. Fuel 2021, 291, 120130. [Google Scholar] [CrossRef]
  33. Yang, Q.; Xue, J.; Li, W.; Du, X.; Ma, Q.; Zhan, K.; Chen, Z. Comprehensive evaluation and interpretation of mercury intrusion porosimetry data of coals based on fractal theory, tait equation and matrix compressibility. Fuel 2021, 298, 120823. [Google Scholar] [CrossRef]
  34. Yu, Y.; Luo, X.; Wang, Z.; Cheng, M.; Lei, Y.; Zhang, L.; Yin, J. A new correction method for mercury injection capillary pressure (micp) to characterize the pore structure of shale. J. Nat. Gas Sci. Eng. 2019, 68, 102896. [Google Scholar] [CrossRef]
  35. Mu, G.; Hou, H.; Zhang, J.; Tang, Y.; Li, Y.-N.; Sun, B.; Li, Y.; Jones, T.; Yuan, Y.; Shao, L. Fractal characterization of pore structure and its influence on CH4 adsorption and seepage capacity of low-rank coals. Front. Earth Sci. 2022, 16, 916–933. [Google Scholar] [CrossRef]
  36. Yao, Y.; Liu, D.; Tang, D.; Tang, S.; Huang, W.; Liu, Z.; Che, Y. Fractal characterization of seepage-pores of coals from China: An investigation on permeability of coals. Comput. Geosci. 2009, 35, 1159–1166. [Google Scholar] [CrossRef]
  37. Feng, G.; Li, W.; Zhu, Y.; Wang, X.; Wang, Y.; Song, Y.; Zheng, S.; Shang, F. Matrix compressibility and multifractal nature of nanoporous shale. Energy Fuels 2024, 38, 4057–4075. [Google Scholar] [CrossRef]
  38. Feng, G.; Li, W.; Zhu, Y.; Wang, Y.; Song, Y.; Zheng, S.; Shang, F. Scale-dependent fractal properties and geological factors for the pore structure in shale: Insights from field emission scanning electron microscopy and fluid intrusion. Energy Fuels 2023, 37, 16519–16535. [Google Scholar] [CrossRef]
  39. Li, Y.H.; Lu, G.Q.; Rudolph, V. Compressibility and fractal dimension of fine coal particles in relation to pore structure characterisation using mercury porosimetry. Part. Part. Syst. Charact. 1999, 16, 25–31. [Google Scholar] [CrossRef]
  40. Zhang, M.; Fu, X.; Duan, C.; Li, Y. Influencing factor analysis of the coal matrix compressibility of middle-high rank coals. J. Nat. Gas Sci. Eng. 2020, 81, 103462. [Google Scholar] [CrossRef]
  41. Cai, Y.; Liu, D.; Pan, Z.; Yao, Y.; Li, J.; Qiu, Y. Pore structure and its impact on CH4 adsorption capacity and flow capability of bituminous and subbituminous coals from northeast China. Fuel 2013, 103, 258–268. [Google Scholar] [CrossRef]
  42. Qi, L.; Tang, X.; Wang, Z.; Peng, X. Pore characterization of different types of coal from coal and gas outburst disaster sites using low temperature nitrogen adsorption approach. Int. J. Min. Sci. Technol. 2017, 27, 371–377. [Google Scholar] [CrossRef]
  43. Yao, Y.; Liu, D.; Tang, D.; Tang, S.; Huang, W. Fractal characterization of adsorption-pores of coals from north China: An investigation on CH4 adsorption capacity of coals. Int. J. Coal Geol. 2008, 73, 27–42. [Google Scholar] [CrossRef]
  44. Haki, A.; El Hadi, M.A.; Bouhafid, A. Assessment of the pyrolysis, combustion and fractal dimension of fragmented oil shale particles. Powder Technol. 2017, 318, 569–588. [Google Scholar] [CrossRef]
  45. Peta, K.; Stemp, W.J.; Chen, R.; Love, G.; Brown, C.A. Multiscale characterizations of topographic measurements on lithic materials and microwear using a gelsight max: Investigating potential archaeological applications. J. Archaeol. Sci. Rep. 2024, 57, 104637. [Google Scholar] [CrossRef]
  46. Rexer, T.F.; Mathia, E.J.; Aplin, A.C.; Thomas, K.M. High-pressure methane adsorption and characterization of pores in posidonia shales and isolated kerogens. Energy Fuels 2014, 28, 2886–2901. [Google Scholar] [CrossRef]
  47. Ross, D.J.K.; Bustin, R.M. The importance of shale composition and pore structure upon gas storage potential of shale gas reservoirs. Mar. Pet. Geol. 2009, 26, 916–927. [Google Scholar] [CrossRef]
  48. Wang, Y.; Zhu, Y.; Liu, S.; Zhang, R. Pore characterization and its impact on methane adsorption capacity for organic-rich marine shales. Fuel 2016, 181, 227–237. [Google Scholar] [CrossRef]
  49. Crosdale, P.J.; Moore, T.A.; Mares, T.E. Influence of moisture content and temperature on methane adsorption isotherm analysis for coals from a low-rank, biogenically-sourced gas reservoir. Int. J. Coal Geol. 2008, 76, 166–174. [Google Scholar] [CrossRef]
  50. Dang, W.; Zhang, J.; Wei, X.; Tang, X.; Chen, Q.; Li, Z.; Zhang, M.; Liu, J. Geological controls on methane adsorption capacity of lower permian transitional black shales in the southern north China basin, central China: Experimental results and geological implications. J. Pet. Sci. Eng. 2017, 152, 456–470. [Google Scholar] [CrossRef]
  51. Gasparik, M.; Bertier, P.; Gensterblum, Y.; Ghanizadeh, A.; Krooss, B.M.; Littke, R. Geological controls on the methane storage capacity in organic-rich shales. Int. J. Coal Geol. 2014, 123, 34–51. [Google Scholar] [CrossRef]
  52. Zou, J.; Rezaee, R.; Xie, Q.; You, L. Characterization of the combined effect of high temperature and moisture on methane adsorption in shale gas reservoirs. J. Pet. Sci. Eng. 2019, 182, 106353. [Google Scholar] [CrossRef]
  53. Ji, L.; Zhang, T.; Milliken, K.L.; Qu, J.; Zhang, X. Experimental investigation of main controls to methane adsorption in clay-rich rocks. Appl. Geochem. 2012, 27, 2533–2545. [Google Scholar] [CrossRef]
  54. Zhang, T.; Ellis, G.S.; Ruppel, S.C.; Milliken, K.; Yang, R. Effect of organic-matter type and thermal maturity on methane adsorption in shale-gas systems. Org. Geochem. 2012, 47, 120–131. [Google Scholar] [CrossRef]
  55. Kang, S.M.; Fathi, E.; Ambrose, R.J.; Akkutlu, I.Y.; Sigal, R.F. Carbon dioxide storage capacity of organic-rich shales. SPE J. 2011, 16, 842–855. [Google Scholar] [CrossRef]
  56. Dai, J.; Li, J.; Luo, X.; Zhang, W.; Hu, G.; Ma, C.; Guo, J.; Ge, S. Stable carbon isotope compositions and source rock geochemistry of the giant gas accumulations in the ordos basin, China. Org. Geochem. 2005, 36, 1617–1635. [Google Scholar] [CrossRef]
  57. Duan, Y.; Wang, C.Y.; Zheng, C.Y.; Wu, B.X.; Zheng, G.D. Geochemical study of crude oils from the Xifeng oilfield of the ordos basin, China. J. Asian Earth Sci. 2008, 31, 341–356. [Google Scholar] [CrossRef]
  58. Liu, F.; Zhu, X.; Li, Y.; Xu, L.; Niu, X.; Zhu, S.; Liang, X.; Xue, M.; He, J. Sedimentary characteristics and facies model of gravity flow deposits of late triassic Yanchang formation in southwestern ordos basin, nw China. Pet. Explor. Dev. 2015, 42, 633–645. [Google Scholar] [CrossRef]
  59. Brunauer, S.; Emmett, P.H.; Teller, E. Adsorption of gases in multimolecular layers. J. Am. Chem. Soc. 1938, 60, 309–319. [Google Scholar] [CrossRef]
  60. Barrett, E.P.; Joyner, L.G.; Halenda, P.P. The determination of pore volume and area distributions in porous substances. I. Computations from nitrogen isotherms. J. Am. Chem. Soc. 1951, 73, 373–380. [Google Scholar] [CrossRef]
  61. Mandelbrot, B.B.; Passoja, D.; Paullay, A.J. Fractal character of fracture surfaces of metals. Nature 1984, 308, 721–722. [Google Scholar] [CrossRef]
  62. Avnir, D.; Jaroniec, M. An isotherm equation for adsorption on fractal surfaces of heterogeneous porous materials. Langmuir 1989, 5, 1431–1433. [Google Scholar] [CrossRef]
  63. Yang, F.; Ning, Z.; Liu, H. Fractal characteristics of shales from a shale gas reservoir in the Sichuan basin, China. Fuel 2014, 115, 378–384. [Google Scholar] [CrossRef]
  64. Zheng, S.; Sang, S.; Wang, M.; Liu, S.; Huang, K.; Feng, G.; Song, Y. Experimental investigations of CO2 adsorption behavior in shales: Implication for CO2 geological storage. Front. Earth Sci. 2023, 10, 1098035. [Google Scholar] [CrossRef]
  65. Pfeiferper, P.; Avnir, D. Chemistry nonintegral dimensions between two and three. J. Chem. Phys. 1983, 79, 3369–3558. [Google Scholar]
  66. Langmuir, I. The adsorption of gases on plane surfaces of glass, mica and platinum. J. Am. Chem. Soc. 1918, 40, 1361–1403. [Google Scholar] [CrossRef]
  67. Wang, H.; Zhou, S.; Zhang, J.; Feng, Z.; Jiao, P.; Zhang, L.; Zhang, Q. Clarifying the effect of clay minerals on methane adsorption capacity of marine shales in Sichuan Basin, China. Energies 2021, 14, 6836. [Google Scholar] [CrossRef]
Figure 1. Geographical location of the Ordos Basin (a), structural outline map and thickness distribution of target shale in the study area (b), and lithological profile of the target stratigraphy (c) [37].
Processes 12 01842 g001
Figure 2. Volumetric-based adsorption apparatus and its schematic diagram for CO2 isothermal adsorption experiments.
Processes 12 01842 g002
Figure 3. Types and relative percentage of mineralogical compositions (a) and clay compositions (b) for the Ch7 lacustrine shale samples.
Processes 12 01842 g003
Figure 4. Adsorption/desorption isotherms of the Ch7 lacustrine shale samples from the LT-N2GA experiments.
Processes 12 01842 g004
Figure 5. Pore size distributions of the Ch7 lacustrine shale samples, calculated using the QSDFT model based on the N2 adsorption branches.
Processes 12 01842 g005
Figure 6. Plots of ln[ln(P0/P)] against lnV of the Ch7 lacustrine shale samples based on LT-N2GA data.
Processes 12 01842 g006
Figure 7. CO2 adsorption isotherms of the Ch7 lacustrine shale samples.
Processes 12 01842 g007
Figure 8. Plots of the TOC against CO2 adsorption capacities (a) and specific surface area (b) of the Ch7 lacustrine shales.
Processes 12 01842 g008
Figure 9. Ultrafine micrograph of the Ch7 lacustrine shale sample imaged with FE-SEM. (a) Abundant OM pores in the sample TC-1; (b) honeycomb OM pores in the sample YC-2; (c) pores filled by clays in the sample YA-1; and (d) interparticle pores and microfractures in the sample TC-1.
Processes 12 01842 g009
Figure 10. The relationship between total clay content and VL, as well as VL/TOC (TOC-normalized) for the Ch7 lacustrine shales.
Processes 12 01842 g010
Figure 11. Plots of the CO2 adsorption capacities against total PV (a) and total SSA (b) for the Ch7 lacustrine shales.
Processes 12 01842 g011
Figure 12. Plots of the CO2 adsorption capacities against pore volume of micro-, meso-, and macropores of the Ch7 lacustrine shales.
Processes 12 01842 g012
Figure 13. The proportion of PVs (a) and SSAs (b) in micro-, meso-, and macropore size ranges.
Processes 12 01842 g013
Figure 14. Plots of the CO2 adsorption capacities versus the fractal dimensions.
Processes 12 01842 g014
Figure 15. Plots of the fractal dimension D1 against the total specific surface area and micropore volume.
Processes 12 01842 g015
Table 1. Fundamental properties and their parameters of the Ch7 lacustrine shale samples.
Sample IDSampling LocationTOC (wt%)Ro a
(%)
Kerogen Type bMineralogical Composition (wt%)Clay Composition (wt%)
QuartzFeldsparCarbonatePyriteTotal Clay cI/S dIlliteKaoliniteChlorite
YA-1Yan’an region1.271.01II119.38.20.81.070.749.56.49.94.9
YA-20.82n/a en/a25.829.52.54.637.622.19.02.04.6
YA-31.560.95II225.026.73.33.441.619.87.73.610.5
YA-42.831.12II128.717.20054.135.04.86.28.2
YC-1Yichuan region2.310.79I29.126.61.8042.516.27.84.713.8
YC-23.87n/an/a30.222.603.144.125.66.64.07.9
YC-34.740.75II131.917.11.2049.829.96.37.16.4
TC-1Tongchuan region3.640.83I19.816.70.9062.628.215.58.510.4
TC-26.62n/an/a22.316.81.51.158.334.312.95.35.8
Notes: a Ro: equivalent vitrinite reflectance. b Kerogen type was determined based on its chemical composition. c Total clay = I/S + Illite + Kaolinite + Chlorite. d I/S: Illite/Smectite mixed layer. e n/a: no available data.
Table 2. Key parameters of pore structure for the Ch7 lacustrine shale samples.
Sample IDAverage Pore Diameter (nm)BJH Pore Volume (cm3/g)BET Specific Surface Area (m2/g)
TotalMicroporesMesoporesMacroporesTotalMicroporesMesoporesMacropores
YA-110.140.02510.00190.01780.005410.2714.7745.2590.238
YA-26.780.01500.00290.01100.00119.3716.0143.3170.039
YA-36.650.01690.00330.01280.000810.9587.2023.7200.036
YA-48.850.02840.00380.02010.004513.5929.0694.3430.181
YC-16.100.01640.00460.00980.002012.0809.7682.2380.075
YC-26.740.02990.00740.01660.005919.72416.4383.0630.223
YC-35.930.02350.00800.01330.002317.98815.1492.7610.078
TC-16.590.02270.00550.01380.003415.26112.3182.8090.134
TC-27.510.03030.00500.01720.008117.57713.5453.6740.357
Table 3. Key parameters of fractal dimensions (D1 and D2) for the Ch7 lacustrine shale samples.
Sample IDP/P0 = 0–0.5P/P0 = 0.5–1.0
S1D1 = 3 + S1R12S2D2 = 3 + S2R22
YA-1−0.41412.5860.9971−0.20912.7910.9501
YA-2−0.41452.5860.9986−0.16242.8380.9363
YA-3−0.3932.6070.9948−0.14472.8550.8794
YA-4−0.37182.6280.9986−0.18062.8190.9346
YC-1−0.32662.6730.9990−0.15842.8420.9788
YC-2−0.31812.6820.9995−0.16332.8370.9713
YC-3−0.31022.6900.9964−0.15652.8440.9785
TC-1−0.31962.6800.9987−0.20442.7960.9853
TC-2−0.33512.6650.9971−0.24382.7560.9864
Table 4. Key adsorption parameters from the Langmuir model fitting for Ch7 lacustrine shale samples.
Sample IDVL (cm3/g)PL (MPa)R2
YA-12.371.630.9939
YA-22.163.070.9971
YA-33.781.500.9953
YA-43.211.580.9968
YC-13.232.740.9941
YC-25.731.730.9942
YC-36.891.210.9965
TC-15.342.580.9937
TC-26.301.740.9989
Disclaimer/Publisher’s Note: The statements, opinions and data contained in all publications are solely those of the individual author(s) and contributor(s) and not of MDPI and/or the editor(s). MDPI and/or the editor(s) disclaim responsibility for any injury to people or property resulting from any ideas, methods, instructions or products referred to in the content.

