Abstract
Amidst the growing challenges of water and energy scarcity, the following research presents an innovative solar desalination system that integrates predictive models with advanced thermal energy storage (TES) to optimize freshwater production. The system adjusts feed water flow dynamically, ensuring consistent and continuous top feed water temperature (TBT). Comprehensive mathematical modeling and simulations reveal significant enhancements in system performance, with an optimized TES tank volume of 500 m3 and a solar collector area of 4245 m2. The economic analysis indicates the system is cost-effective, with a production cost of approximately USD 5.86 million, competitive with conventional methods. Additionally, the system achieved an average daily feed water flow rate of 10 kg/s, ensuring stable operation even under fluctuating solar radiation. The system also achieved a global warming potential (GWP) of 2.24 kg CO2-eq per cubic meter, a favorable and environmentally sustainable measure. This study stresses the potential for scalable, sustainable desalination solutions to enhance water security in arid and remote regions.
1. Introduction
The growing global population, coupled with rapid industrialization and climate change, has intensified the pressure on freshwater resources, leading to an escalating crisis of water scarcity [1]. According to the United Nations, by 2025, nearly two-thirds of the world’s population could be living under water-stressed conditions, with 1.8 billion people facing absolute water scarcity [2]. In response to this critical issue, seawater desalination has emerged as a vital technology to supplement the dwindling freshwater supply. Rapid population growth and industrial development have exacerbated the imbalance between the supply and demand of freshwater [3]. However, traditional desalination methods, heavily reliant on non-renewable energy sources, are not sustainable in the long term due to their significant environmental impact [4].
Desalination technologies vary significantly in terms of operation, energy consumption, and environmental impact. A comparative analysis between solar-powered desalination and other conventional methods, as discussed in Reference [5], highlights the unique advantages and limitations of each approach.
Solar desalination systems have become a promising approach to addressing global issues of water scarcity and energy sustainability. With the growing demand for freshwater and the depletion of fossil fuel resources, there is an increasing need for innovative and efficient desalination technologies that utilize renewable energy. Significant progress has been made in optimizing solar desalination systems, especially through the incorporation of novel materials and technologies such as biowaste, nanofluids, and advanced membranes [6], which have played a crucial role in improving the efficiency and sustainability of these systems.
To enhance the efficiency and sustainability of solar desalination systems, researchers have been exploring various innovative technologies. Among these, the integration of biowaste, nanofluids, and advanced membranes has shown considerable promise in both improving thermal efficiency and reducing operational costs. Biowaste, for example, can be utilized as a cost-effective and environmentally friendly thermal energy storage medium, while nanofluids are known to significantly enhance heat transfer rates in solar collectors. Additionally, the application of artificial intelligence (AI) in solar desalination processes is proving to be a game-changer, enabling more precise control and optimization of system operations [7]. By leveraging AI, researchers can develop predictive models that adjust system parameters, thus improving overall efficiency and adaptability in varying environmental conditions.
To further enhance distilled water production, researchers have explored a range of innovative methods. For instance, Hitesh et al. [8]. used magnesia waste brick material as energy storage to improve solar still performance, while Kaviti and colleagues [9] employed aluminum fins as solar absorbers to boost desalination efficiency. Mevada et al. [10] achieved a 72.6% increase in daily efficiency using black granite and marble stones compared to traditional stills. Minghao [11] revealed that aged PLA microplastics, especially under UV, significantly boost ciprofloxacin (CIP) adsorption, potentially acting as long-term antibiotic carriers in aquatic environments. This emphasizes the importance of understanding material interactions in desalination systems for environmental sustainability and pollutant control. Kaviti et al. [6] further improved distillate output by 36.35% using camphor-soothed banana stems. Other studies include using derived carbon materials from plastic waste for green energy applications, hydrogels for brine water treatment, and porous absorbers with activated carbon tubes for better energy and environmental performance. Kumar and co-researchers [12] enhanced desalination by 104.54% with magnets and charcoal, while Kaviti’s team achieved 60% efficiency by fabricating hierarchical structures. Additional research focused on regulating salt concentration for freshwater generation and optimizing solar still performance through fin geometry and energy storage materials.
Moreover, the optimization of AI models, including the calibration of hyperparameters and activation functions, has further improved the prediction reliability of desalination processes. Sohani et al. [13] used digital systems to model variables like pressure drop and air temperature using multivariate regression and genetic programming. Asfahan et al. [14] applied AI to predict the thermal performance of various cooling systems, optimizing the algorithm with techniques like Adam and RMSprop to enhance learning and accuracy. Derbali et al. [15] explored defect detection in water membrane distillation systems using machine learning, with decision trees yielding the highest classification accuracy. Raghuvanshi et al. [16] used data mining to monitor solar water distillation performance, while Salem et al. [7] enhanced regression models, particularly the multilayer perceptron (MLP), using optimization techniques. H. Salem et al. [17] emphasize that explainable AI (XAI) is essential for improving the transparency and accuracy of AI models in water treatment. This study uses XAI to enhance understanding and decision-making in solar-powered desalination systems. Baetens et al. [18] presented two modeling approaches for forecasting temperatures in cooling towers, combining fluid dynamics with adaptive neuro-fuzzy systems, and highlighted the benefits and limitations of pre-cooling methods. In summary, these AI-driven advancements have greatly enhanced the efficiency, accuracy, and reliability of desalination processes.
Table 1 below presents a summary of important studies on predictive modeling in solar desalination, highlighting their respective advantages, limitations, and key findings. This table provides a broader understanding of the current state of research in this field and the gaps that still need to be addressed.

Table 1.
Important Studies on Predictive Modeling in Solar Desalination.
Despite these advancements, several crucial gaps remain unaddressed in the current literature. One of the most pressing issues is the lack of integration between predictive models and thermal energy storage (TES) systems in solar desalination. While predictive models, particularly those powered by AI, have shown promise in optimizing system operations by forecasting solar radiation and adjusting operational parameters, their combined application with TES remains underexplored. This integration is crucial for ensuring continuous desalination processes, especially during periods of low solar radiation or fluctuating environmental conditions.
Moreover, there is a notable gap in accurately calculating water based on energy availability needs for remote and residential areas. This is particularly important for developing effective and sustainable water supply plans tailored to specific energy expectations, which is essential for the successful implementation of solar-powered desalination in geographically diverse regions.
This research aims to bridge these gaps by introducing an innovative solar desalination system that seamlessly integrates predictive models with advanced TES. By leveraging precise solar radiation forecasts, the proposed system dynamically adjusts feed water flow rates, ensuring consistent top feed water temperatures (TBT) and continuous operation. This approach not only enhances the overall efficiency of the desalination process but also provides a more accurate framework for calculating water needs in remote and residential areas.
The novelty of this research lies in its holistic approach to optimizing solar desalination, offering a scalable and sustainable solution that can be adapted to various climatic and geographical conditions. Successfully integrating predictive modeling with TES represents a significant advancement in the field, addressing key limitations in current solar desalination systems and contributing to the broader adoption of renewable energy-driven water production technologies.
2. Materials and Methods
2.1. System Description
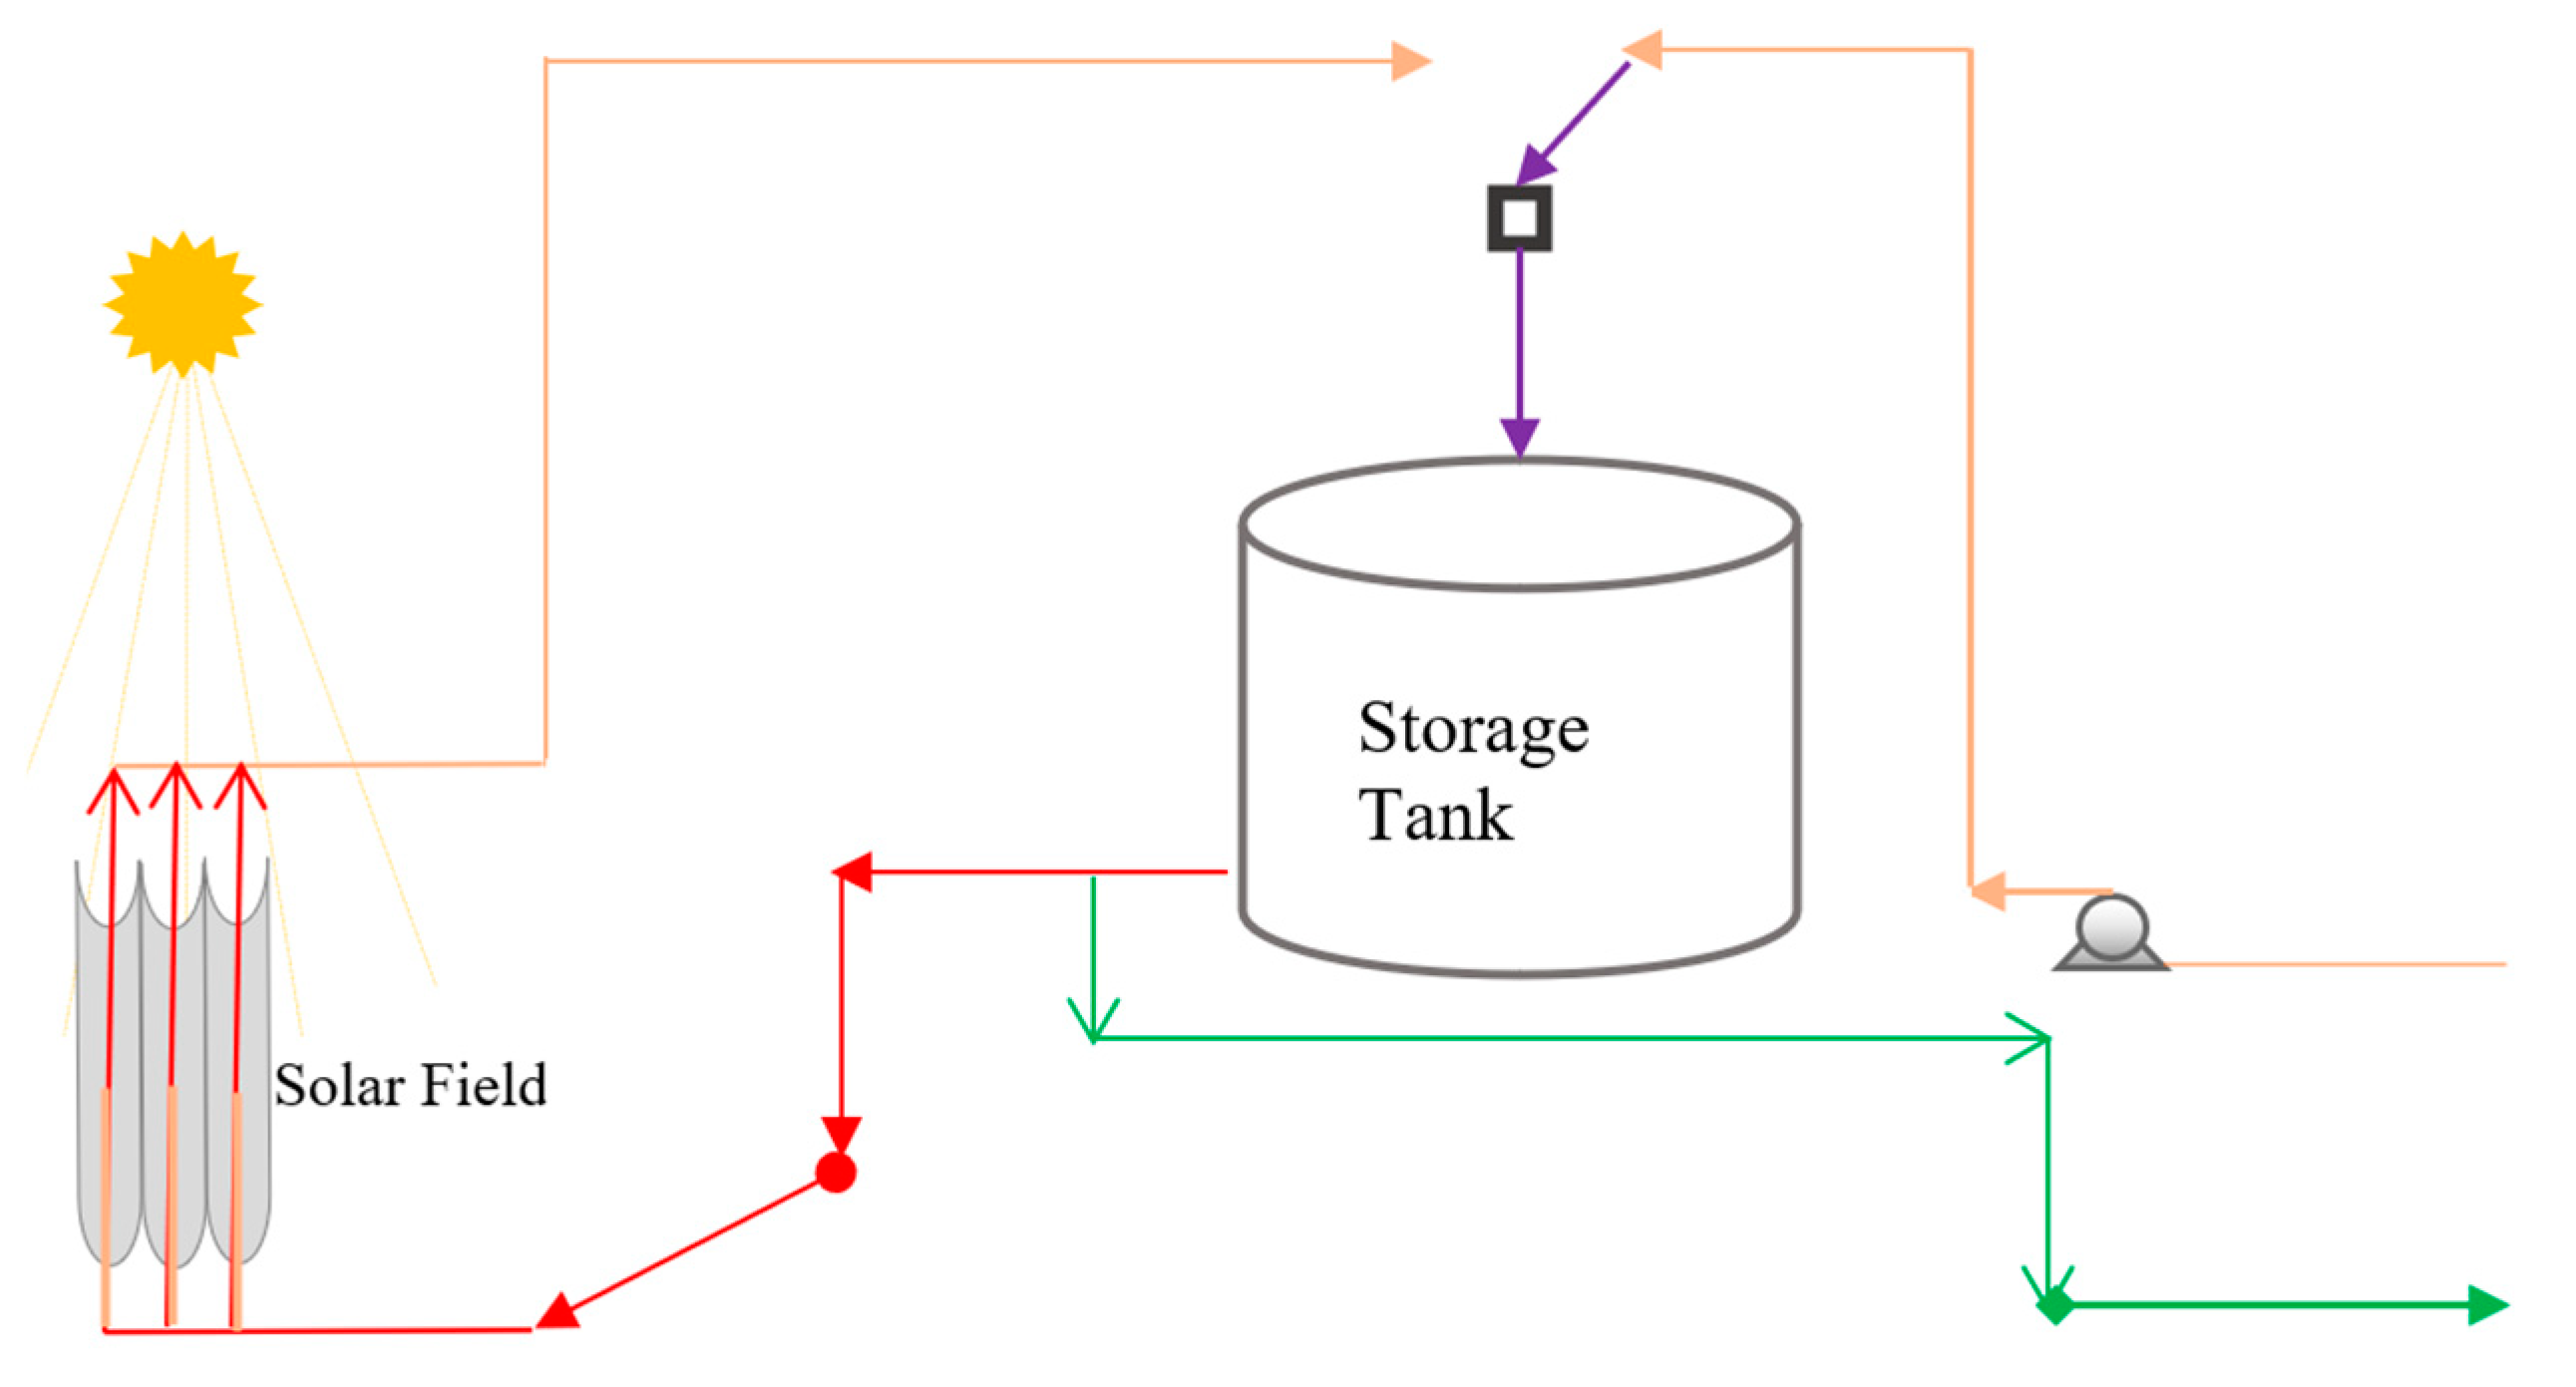
The proposed solar desalination system integrates thermal energy storage (TES) with a thermal desalination unit to enhance the efficiency and sustainability of freshwater production. This system is designed to operate continuously, leveraging solar energy during the day and stored thermal energy at night or during periods of low solar radiation. The system comprises three main components: the thermal desalination unit, the TES tanks, and the solar collector array. A detailed description of each component and their interactions is provided below (Figure 1).
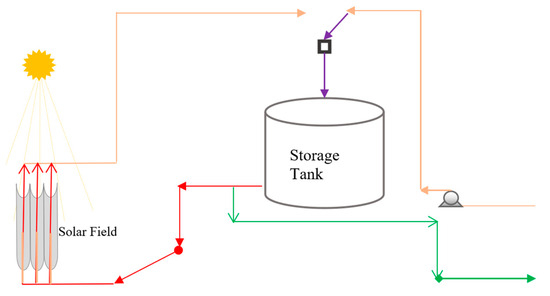
Figure 1.
System Description.
2.1.1. Thermal Desalination Unit
The thermal desalination unit is a system that utilizes the process of flashing, during which heated brine (seawater) rapidly evaporates under reduced pressure in multiple stages. The several stages operate at progressively lower pressures to maximize the evaporation of the feed brine. The hot brine enters the first stage, where it undergoes partial evaporation (flashing). The resulting vapors condense on the surfaces of preheating tubes, transferring heat to the incoming feed seawater, which then flows inside these tubes. The condensed vapors are collected as distillate, which is the product water, while the concentrated brine, known as blow-down, exits the last stage.
Key operational parameters for the thermal desalination unit include the brine temperature at each stage, the flow rates of both the feed brine and the seawater, and the vacuum levels maintained in each stage. The system design allows for adjusting the number of stages (N) based on performance requirements, with the current setup using five stages to optimize the balance between water production and energy consumption. Vacuum pumps are employed to maintain the necessary pressure differences between stages, ensuring efficient flashing and vapor condensation.
2.1.2. Thermal Energy Storage (TES) Tanks
The system includes two identical TES tanks, each with sufficient capacity to supply the thermal desalination unit with hot brine for 24 h. These tanks are constructed from high-density polyethylene (HDPE) for its thermal insulation properties and durability. The tanks operate in two distinct modes: charging and discharging.
- Charging Mode: During daylight hours, preheated brine from the thermal desalination unit is circulated through the solar collector array, further elevating its temperature to the target brine temperature (TBT). The heated brine is then stored in the TES tank, capturing the excess thermal energy generated by the solar collectors.
- Discharging Mode: At night or during periods of low solar radiation, the stored thermal energy in the TES tank is utilized to maintain the necessary TBT for continuous desalination operation. The hot brine from the TES tank is supplied to the thermal desalination unit, ensuring uninterrupted water production.
The TES tanks are heavily insulated to minimize heat loss, and their operation is controlled by a series of valves that switch the flow between charging and discharging modes. This switching is synchronized with the solar cycle so that the system operates efficiently throughout the day and night.
2.1.3. Solar Collector Array
The solar collector array is the primary source of thermal energy for the system. It consists of parabolic concentrator collectors designed to focus solar radiation onto receiver tubes containing the circulating brine. The collectors are optimized for high thermal efficiency, with tempered glass covers and copper tubing to minimize heat loss and maximize energy transfer to the brine.
The total area of the solar collector array is calculated to confirm that sufficient thermal energy is generated during the day to heat the brine to the required TBT. The collectors are configured to maintain a constant circulation mass flow rate, preventing the brine temperature from exceeding 120 °C. A temperature higher than 120 °C could lead to scale formation and reduced efficiency. The design also includes safety mechanisms to manage the temperature and flow rates, contributing to the system’s reliability and longevity.
2.1.4. Predictive Model and Control System
An advanced predictive model is necessary to forecast solar radiation and optimize the system’s operation. This model uses historical weather data and real-time solar radiation measurements to predict the available solar energy for the upcoming day. Based on these predictions, the control system adjusts the feed water flow rates and TES tank operations to maintain optimal TBT and maximize energy efficiency.
The control system continuously monitors the operational parameters, including solar radiation levels, feed water temperatures, and brine flow rates, to ensure the system adapts to fluctuations in solar energy availability. This adaptive control mechanism allows the system to operate efficiently under varying environmental conditions, allowing consistent freshwater production.
2.1.5. System Integration and Operation
The integration of the thermal desalination unit, TES tanks, and solar collector array is managed through a sophisticated control system that coordinates the flow of brine between components. The system is designed to operate continuously, with the TES tanks providing thermal energy during periods of low solar radiation. The ability to switch between charging and discharging modes ensures that the system can maintain consistent water production, regardless of the time of day or solar conditions.
The system’s adaptability to different geographical locations and climates is a key feature, allowing it to be deployed in various settings with minimal modifications. The predictive model and control system further enhance this adaptability by ensuring that the system can respond appropriately to changes in solar energy availability.
This detailed system description provides all the necessary information for replicating the proposed solar desalination system. The design is robust, adaptable, and capable of operating continuously, making it suitable for deployment in a wide range of environmental conditions.
2.2. Mathematical Model
In this section, a mathematical model is developed to simulate mass flows, heat transfers, and feed water temperatures for each system component. These components can be modeled individually. Because the tank system separates the charging and discharging operations, the TBT in the discharging tank is assumed to be constant for each day of operation. This serves to simplify the system simulation, allowing the flows to and from the desalination unit to have constant temperatures and mass rates for each day of the simulation. Adjustments to these flow rates are made to compensate for daily changes in solar radiation.
The mass of feed water processed each day is a function of the useful heat that the solar array is capable of transferring to the feed water. The weather data and a model for the efficiency of the collector are used in a heat balance formula to determine the mass of feed water for each day of the year.
The feed water in the tank is treated as well-mixed, and the model predicts the losses to the environment through the tanks. The tank switching occurs at the same time each day. The hourly temperature for the tank, each day of the year, is modeled. The final tank temperature at the end of each day is approximately the same as the predicted TBT.
2.2.1. Solar Array Model
The first necessary quantity to compute is useful heat per hour per day . The total solar array consists of separate collectors, each with aperture area . The useful heat transferred from the solar array to the feed water, from one collector receiving an incident solar energy , is given by the following.
The collector efficiency is determined according to [22].
where the parameters and are the heat loss coefficient and receiver area, respectively, which primarily depend on the collector geometry. The parameter is the optical efficiency for the collector, which is defined as the ratio of the energy absorbed by the receiver to the energy incident on the collector aperture. This represents an ideal efficiency for transferring heat to the feed water. The temperature is the feed water temperature entering the array, and is the ambient temperature.
2.2.2. Dynamic Modeling of Tank Temperatures
The dynamic tank model is developed by assuming the feed water is well-mixed, such that it is characterized by a single temperature. The following energy balance equation is used to update the tank temperatures at time based on the values at time .
The following table summarizes each term on the right of this equation, with a description.
| Feed water energy at the previous hour | |
| Incoming feed water energy from the solar array | |
| Pre-heated feed water energy | |
| Losses through the sides of the tank |
The update formula is then solved for the temperature at time
A similar update equation is developed for the discharging tank temperature. The discharging tank mass and temperature at each hour are given by and , respectively. The discharging tank update formula is given as follows.
The following table summarizes each term on the right of this equation, with a description.
| Feed water energy at the previous hour | |
| Feed water energy passed to the desalination | |
| Losses through the sides of the tank |
The update formula is then solved for the temperature at time
3. Results
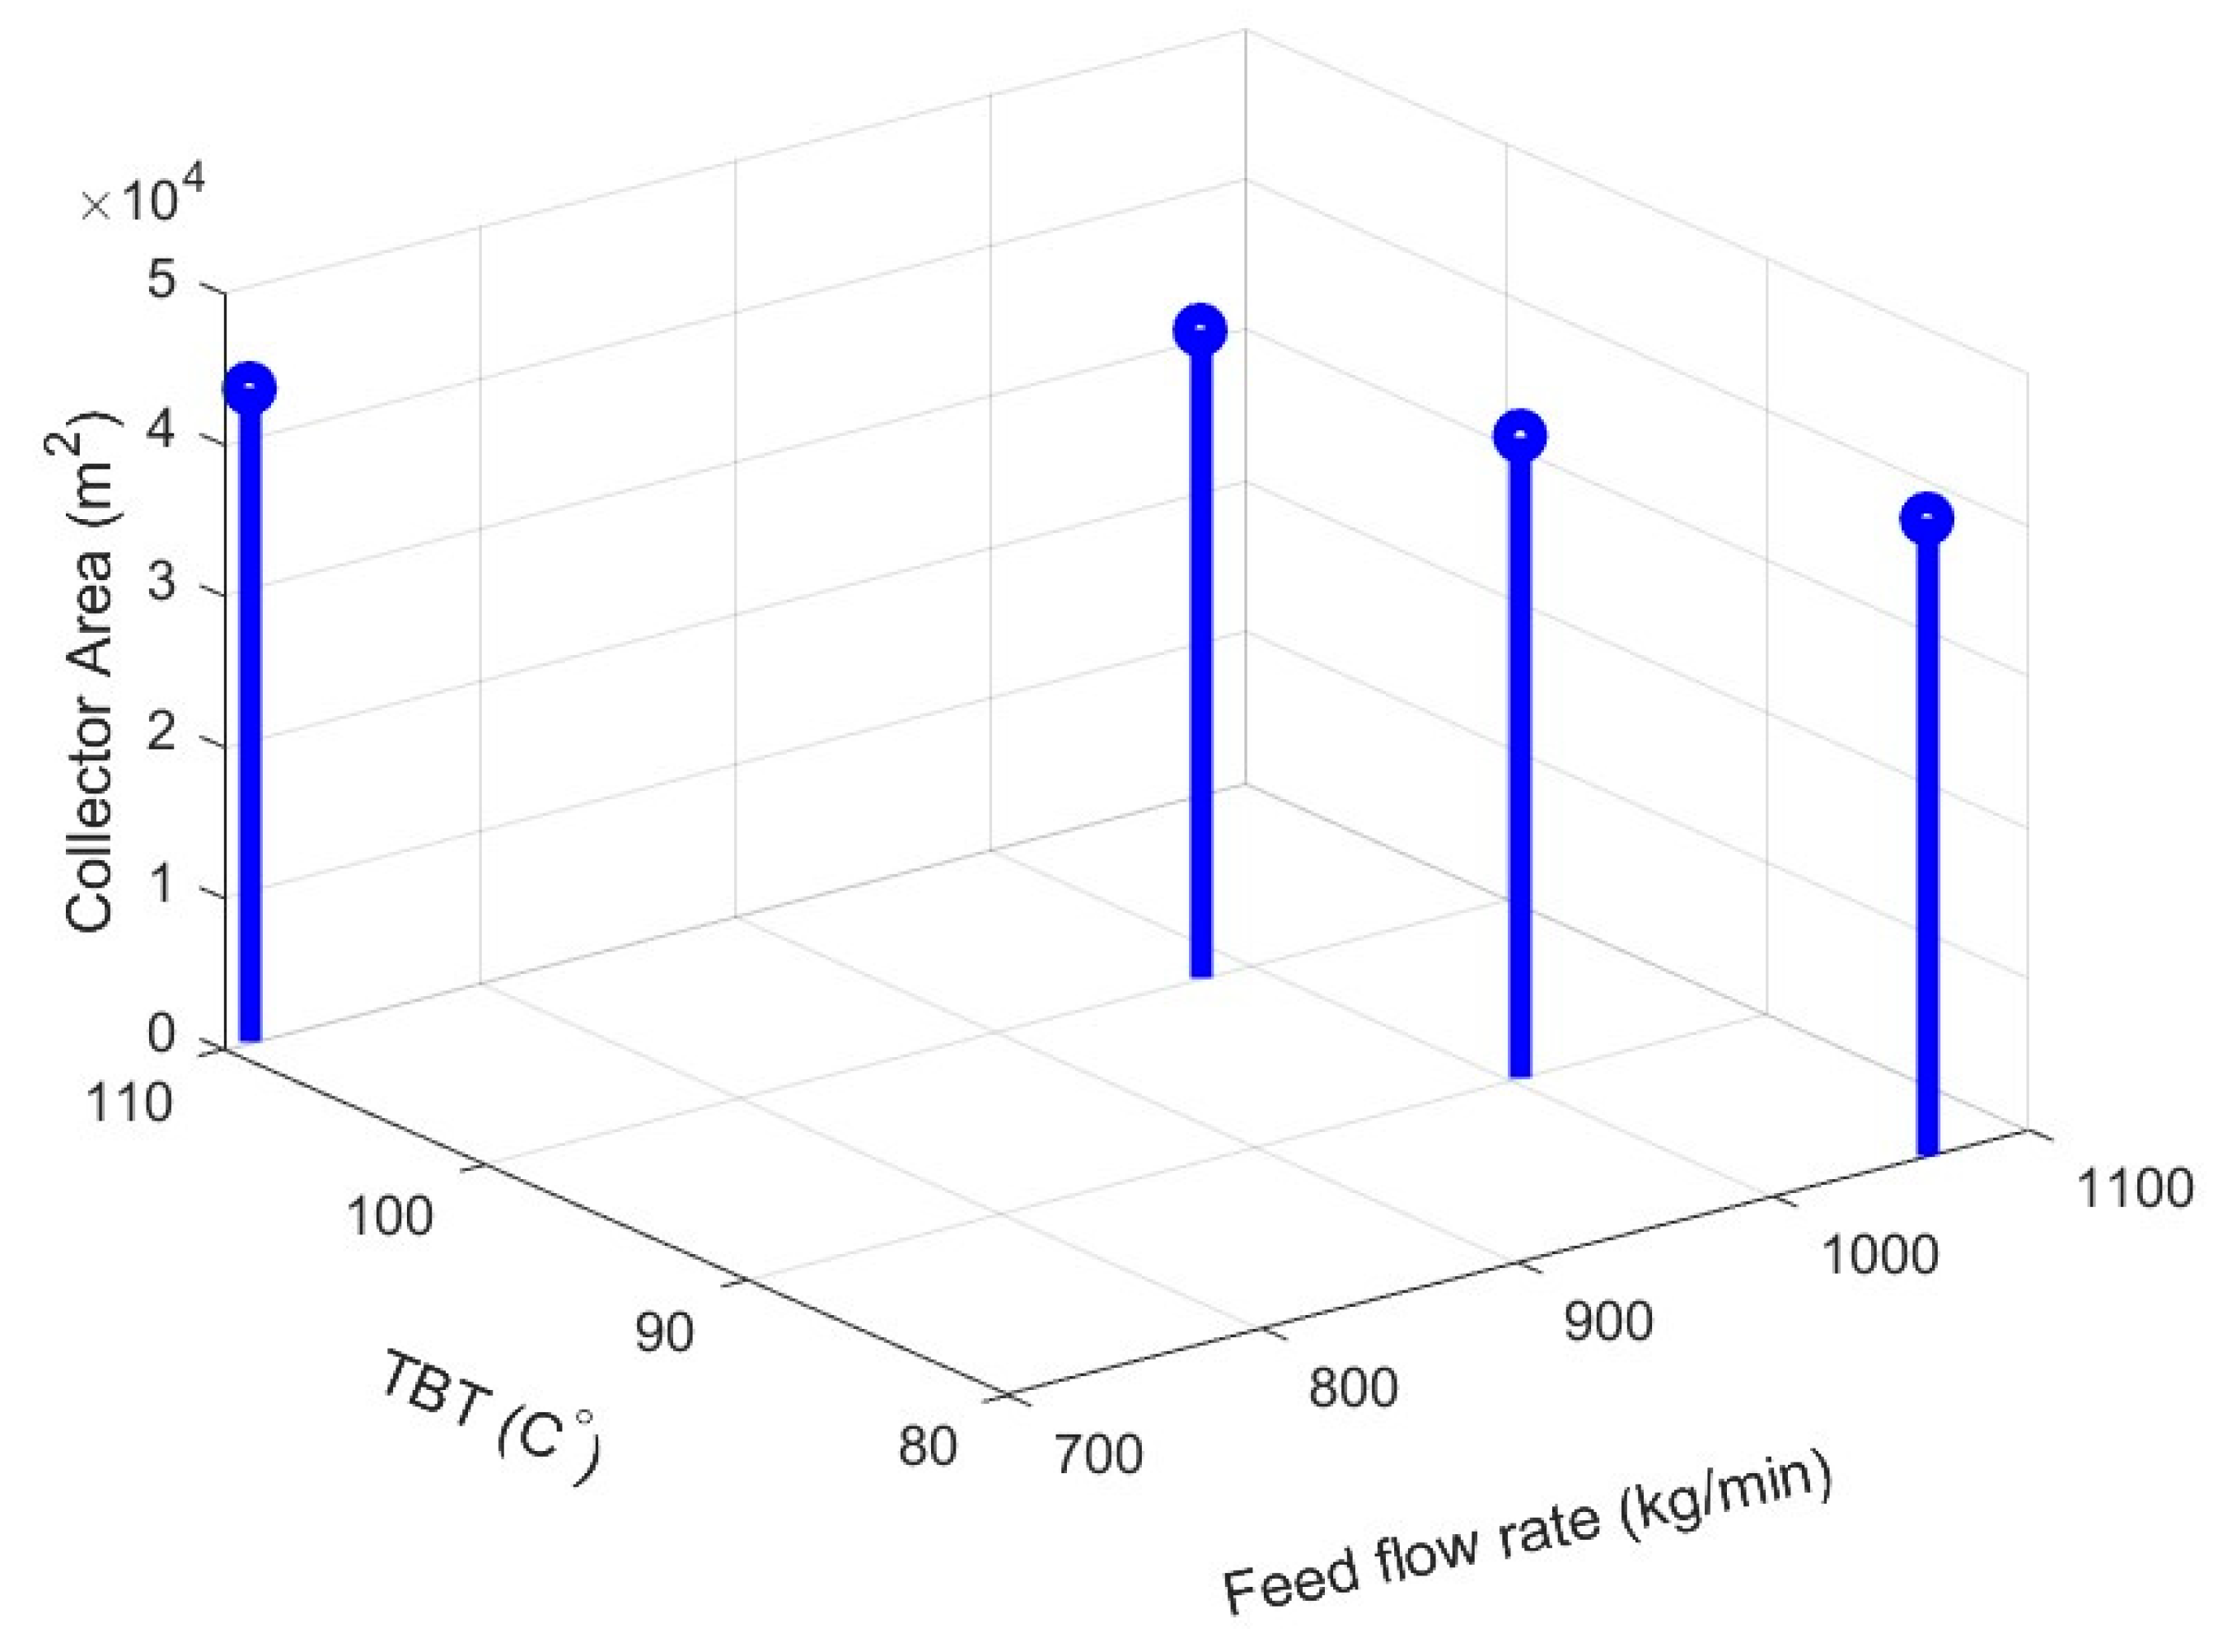
To evaluate the system’s efficiency, one must determine several key performance parameters, including the water temperature in the TES tank, overall efficiency, and feed water flow rates. These parameters were meticulously calculated using a MATLAB program (R2024a), which executed hourly simulations over 24-hour periods spanning several years. The simulations incorporated critical heating system parameters, such as collector area, mass flow rate, and TES tank volume.
In these calculations, values are set for the feed water flow rate, collector area, and TES tank volume at different operational and design conditions. To ensure the optimal values for the heating system components, namely tank volume, collector area, and mass flow rate, the results derived from the numerical calculations are comprehensively presented and analyzed.
The detailed analysis of these parameters reveals the system’s capability to optimize the desalination process. By adjusting the TES tank volume, collector area, and mass flow rate, the system demonstrates enhanced performance metrics. These insights are crucial for refining the design and operation of solar thermal desalination systems, ensuring they meet the demands for efficiency and sustainability in diverse environments.
3.1. Optimizing TES Tank Size for Enhanced System Efficiency
The TES tank size significantly influences the solar desalination system’s efficiency. As depicted in Figure 2, the analysis shows that smaller TES tanks (e.g., 10 m3) experience lower thermal losses—approximately 15% less than larger tanks (e.g., 30 m3). However, these smaller tanks also exhibit greater temperature fluctuations, with water temperatures ranging from 50 °C to 90 °C across different seasons. Conversely, larger tanks maintain more stable temperatures, typically between 70 °C and 85 °C, but are accompanied by a 25% increase in thermal losses and the need for a larger solar collector area. The findings indicate that an optimal TES tank size, around 20 m3, strikes a balance by maintaining sufficient water temperature with thermal losses kept under 20%, indicating efficient performance throughout the year.
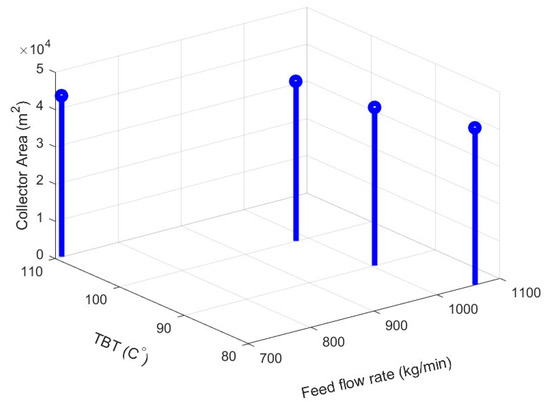
Figure 2.
Relationship Between Tank Size, Temperature, and Solar Collector Area.
3.2. Determining Optimal Collector Area for Consistent Performance
Figure 2 also illustrates the relationship between solar collector area and water temperature in the TES tank. The analysis reveals that increasing the collector area from 4190 m2 to 4300 m2 results in a 10% rise in the average TES tank temperature, from 75 °C to 82.5 °C. This temperature increase enhances the system’s thermal energy absorption, particularly during peak sunlight hours. However, the additional area also leads to a proportional rise in system costs. The optimal collector area is determined to be 4245 m2, which provides a sufficient temperature increase while keeping costs within a manageable range, ensuring consistent and efficient operation, especially during periods of lower solar radiation in winter months.
3.3. Impact of Mass Flow Rate on System Performance
The impact of mass flow rate on TES tank performance is shown in Figure 2, where three different flow rates are analyzed: 5 kg/s, 7.5 kg/s, and 10 kg/s. The results indicate that a higher mass flow rate of 10 kg/s maintains more stable water temperatures, with fluctuations contained within a 5 °C range. This stability is crucial during winter, where the temperature only drops to 70 °C, compared to lower flow rates, which see temperatures drop to 60 °C or lower. The peak mass flow rate of 10 kg/s is, therefore, identified as optimal, as it confirms that the TES tank maintains temperatures above the critical 70 °C threshold, leading to more reliable and efficient desalination throughout the year.
These findings provide clear numerical evidence of how TES tank size, collector area, and mass flow rate significantly affect the performance of the solar desalination system, offering valuable insights for optimizing these parameters in practical applications.
3.4. Feed Water Temperature Profiles under Varying Solar Radiation Conditions
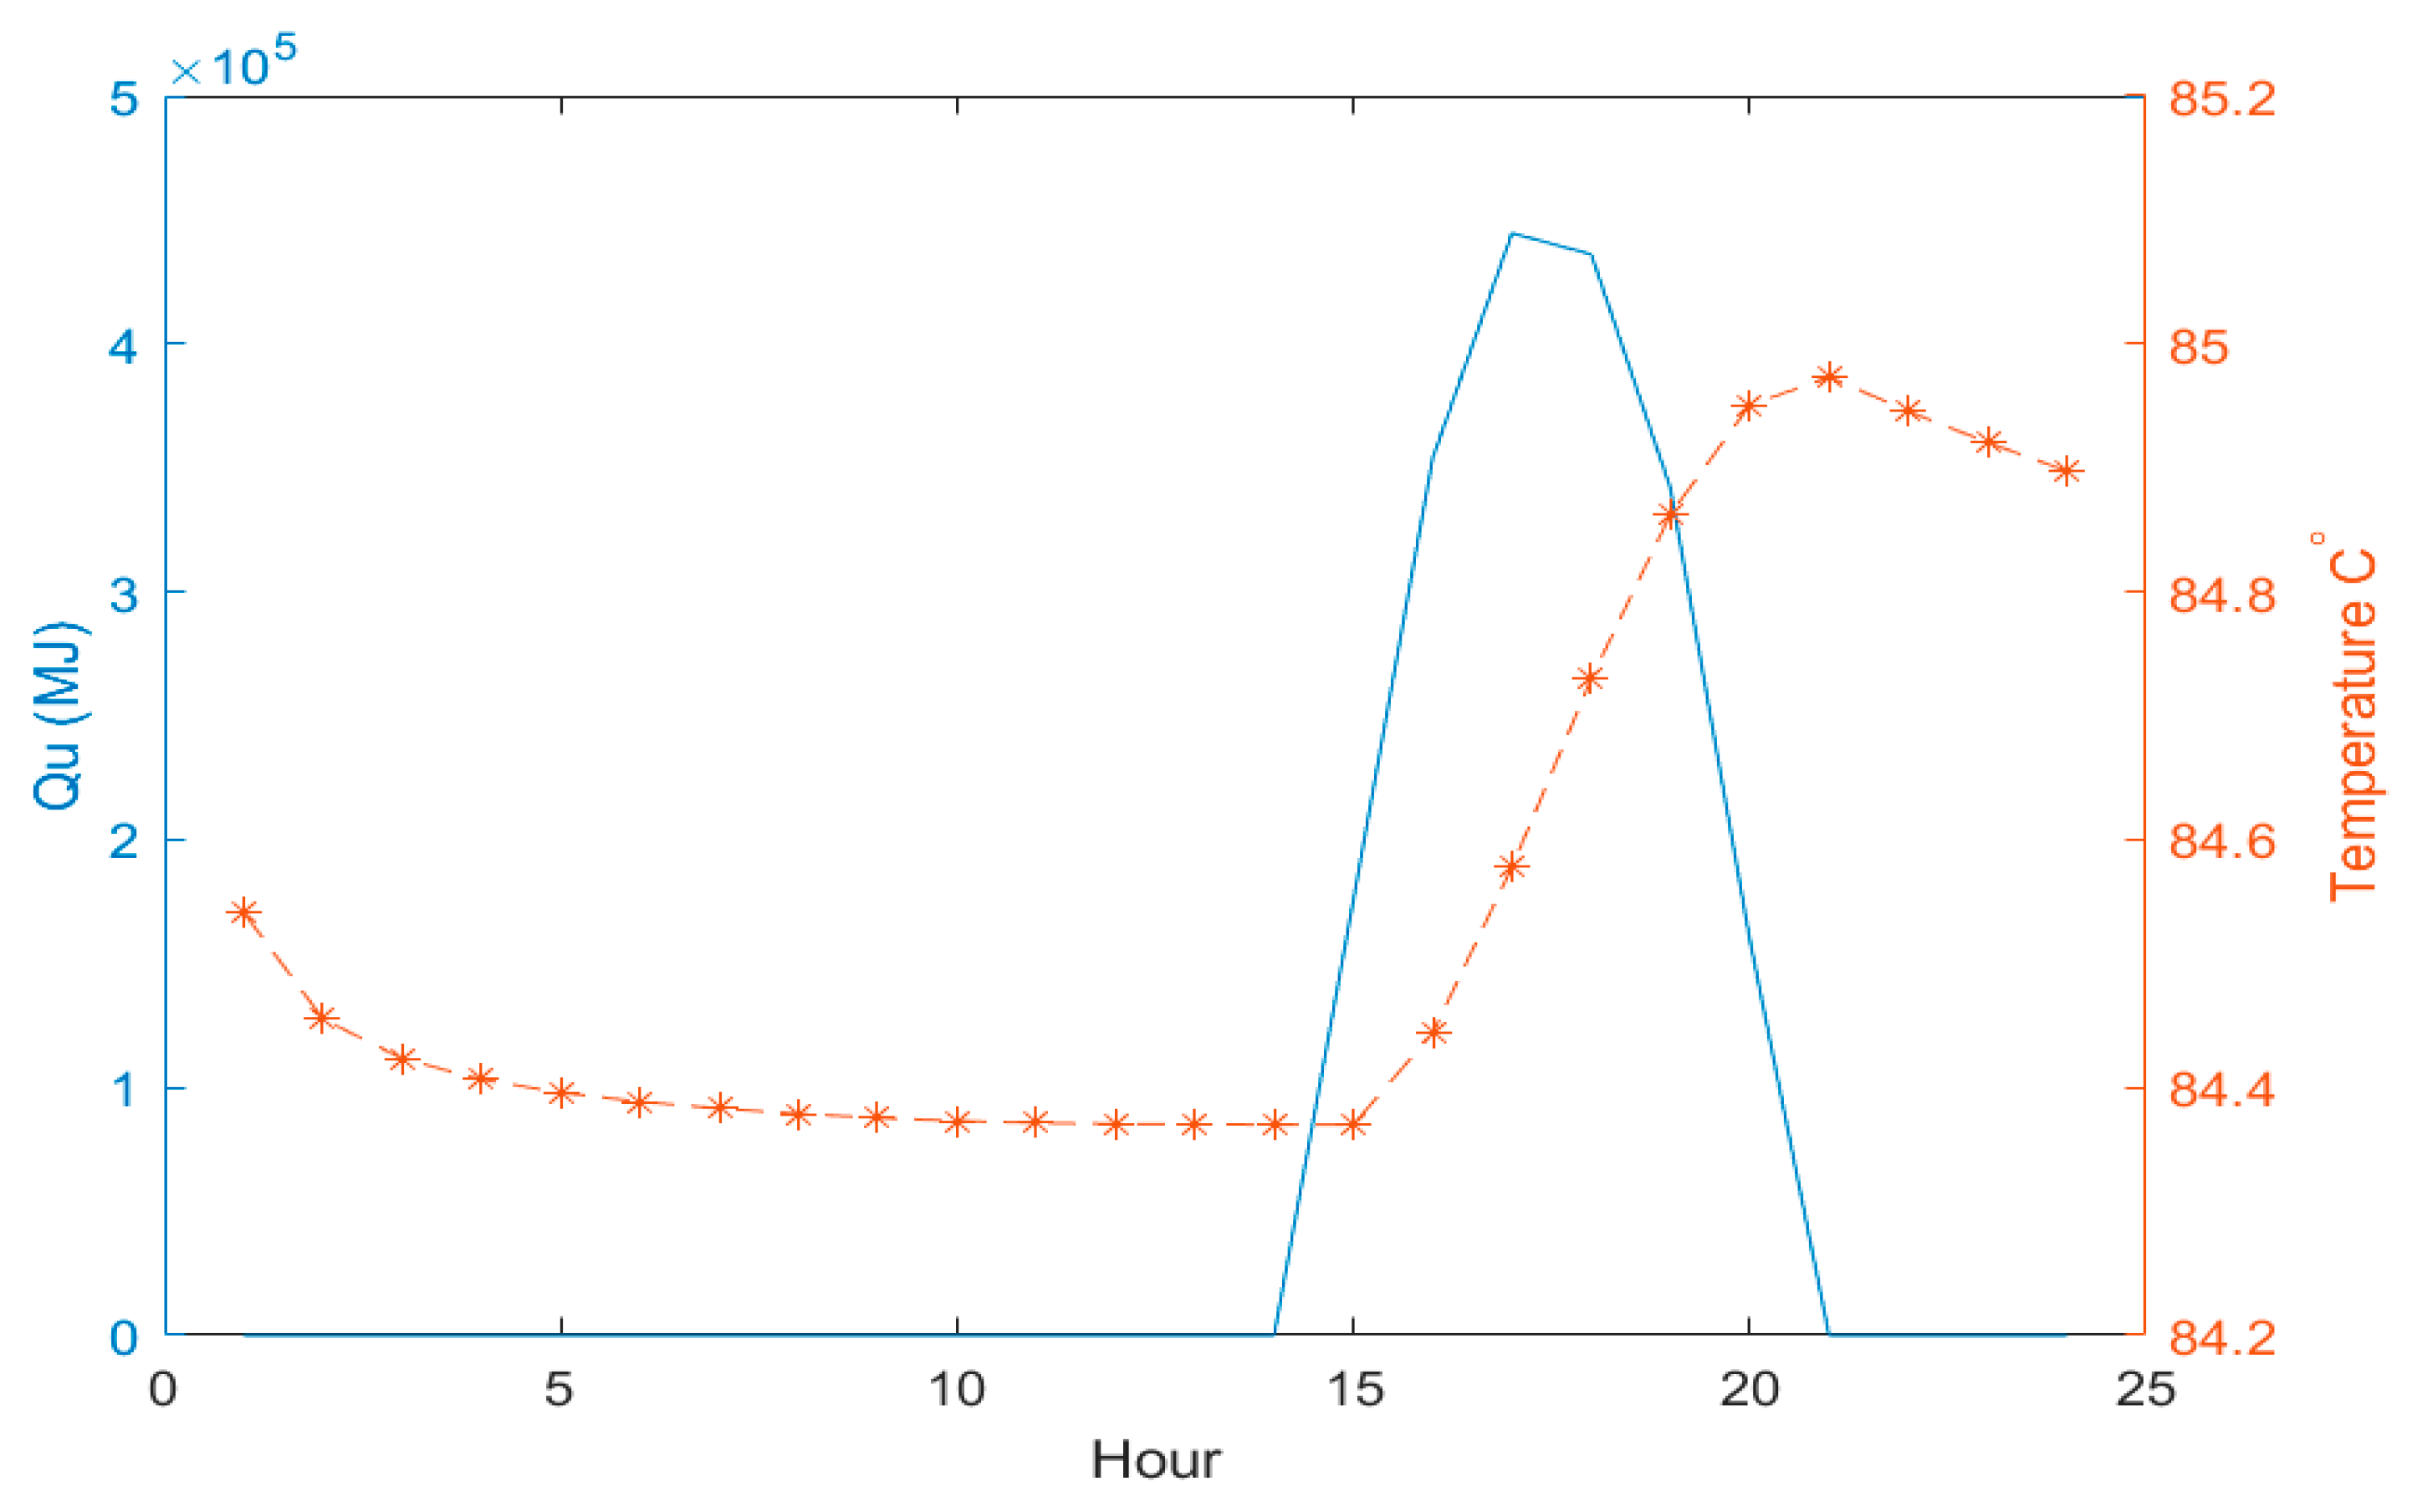
Figure 3 shows the charging tank temperature profile for a day with average solar irradiance. The tank receives a moderate flow of preheated feed water from the desalination unit, causing the tank temperature to initially drop from the top feed water temperature (TBT) to the preheated flow temperature of the desalination unit. During daylight hours, beneficial heat from the solar array raises the tank temperature back to TBT.
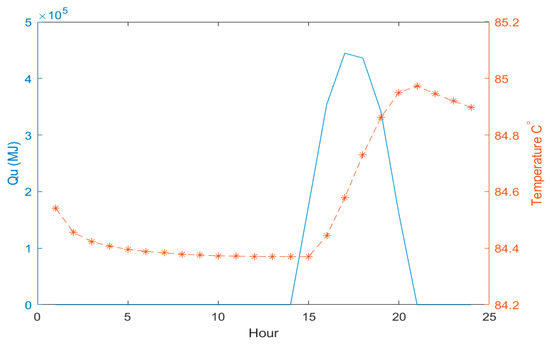
Figure 3.
Temperature Profile With Average Solar Irradiance.
These observations demonstrate that solar energy density significantly impacts the thermal performance of the system. On days with moderate solar radiation, the system can utilize available solar energy to moderately raise the temperature of the feed water. The results are calculations of the amount of feed water that can be raised to TBT, reflecting typical operating conditions throughout the year.
On days when solar intensity is at its minimum, the amount of feed water is the lowest. This illustrates the large variation in solar intensity between a clear summer day and a cloudy winter day.
3.5. Daily Energy Gains and Feed Water Flow
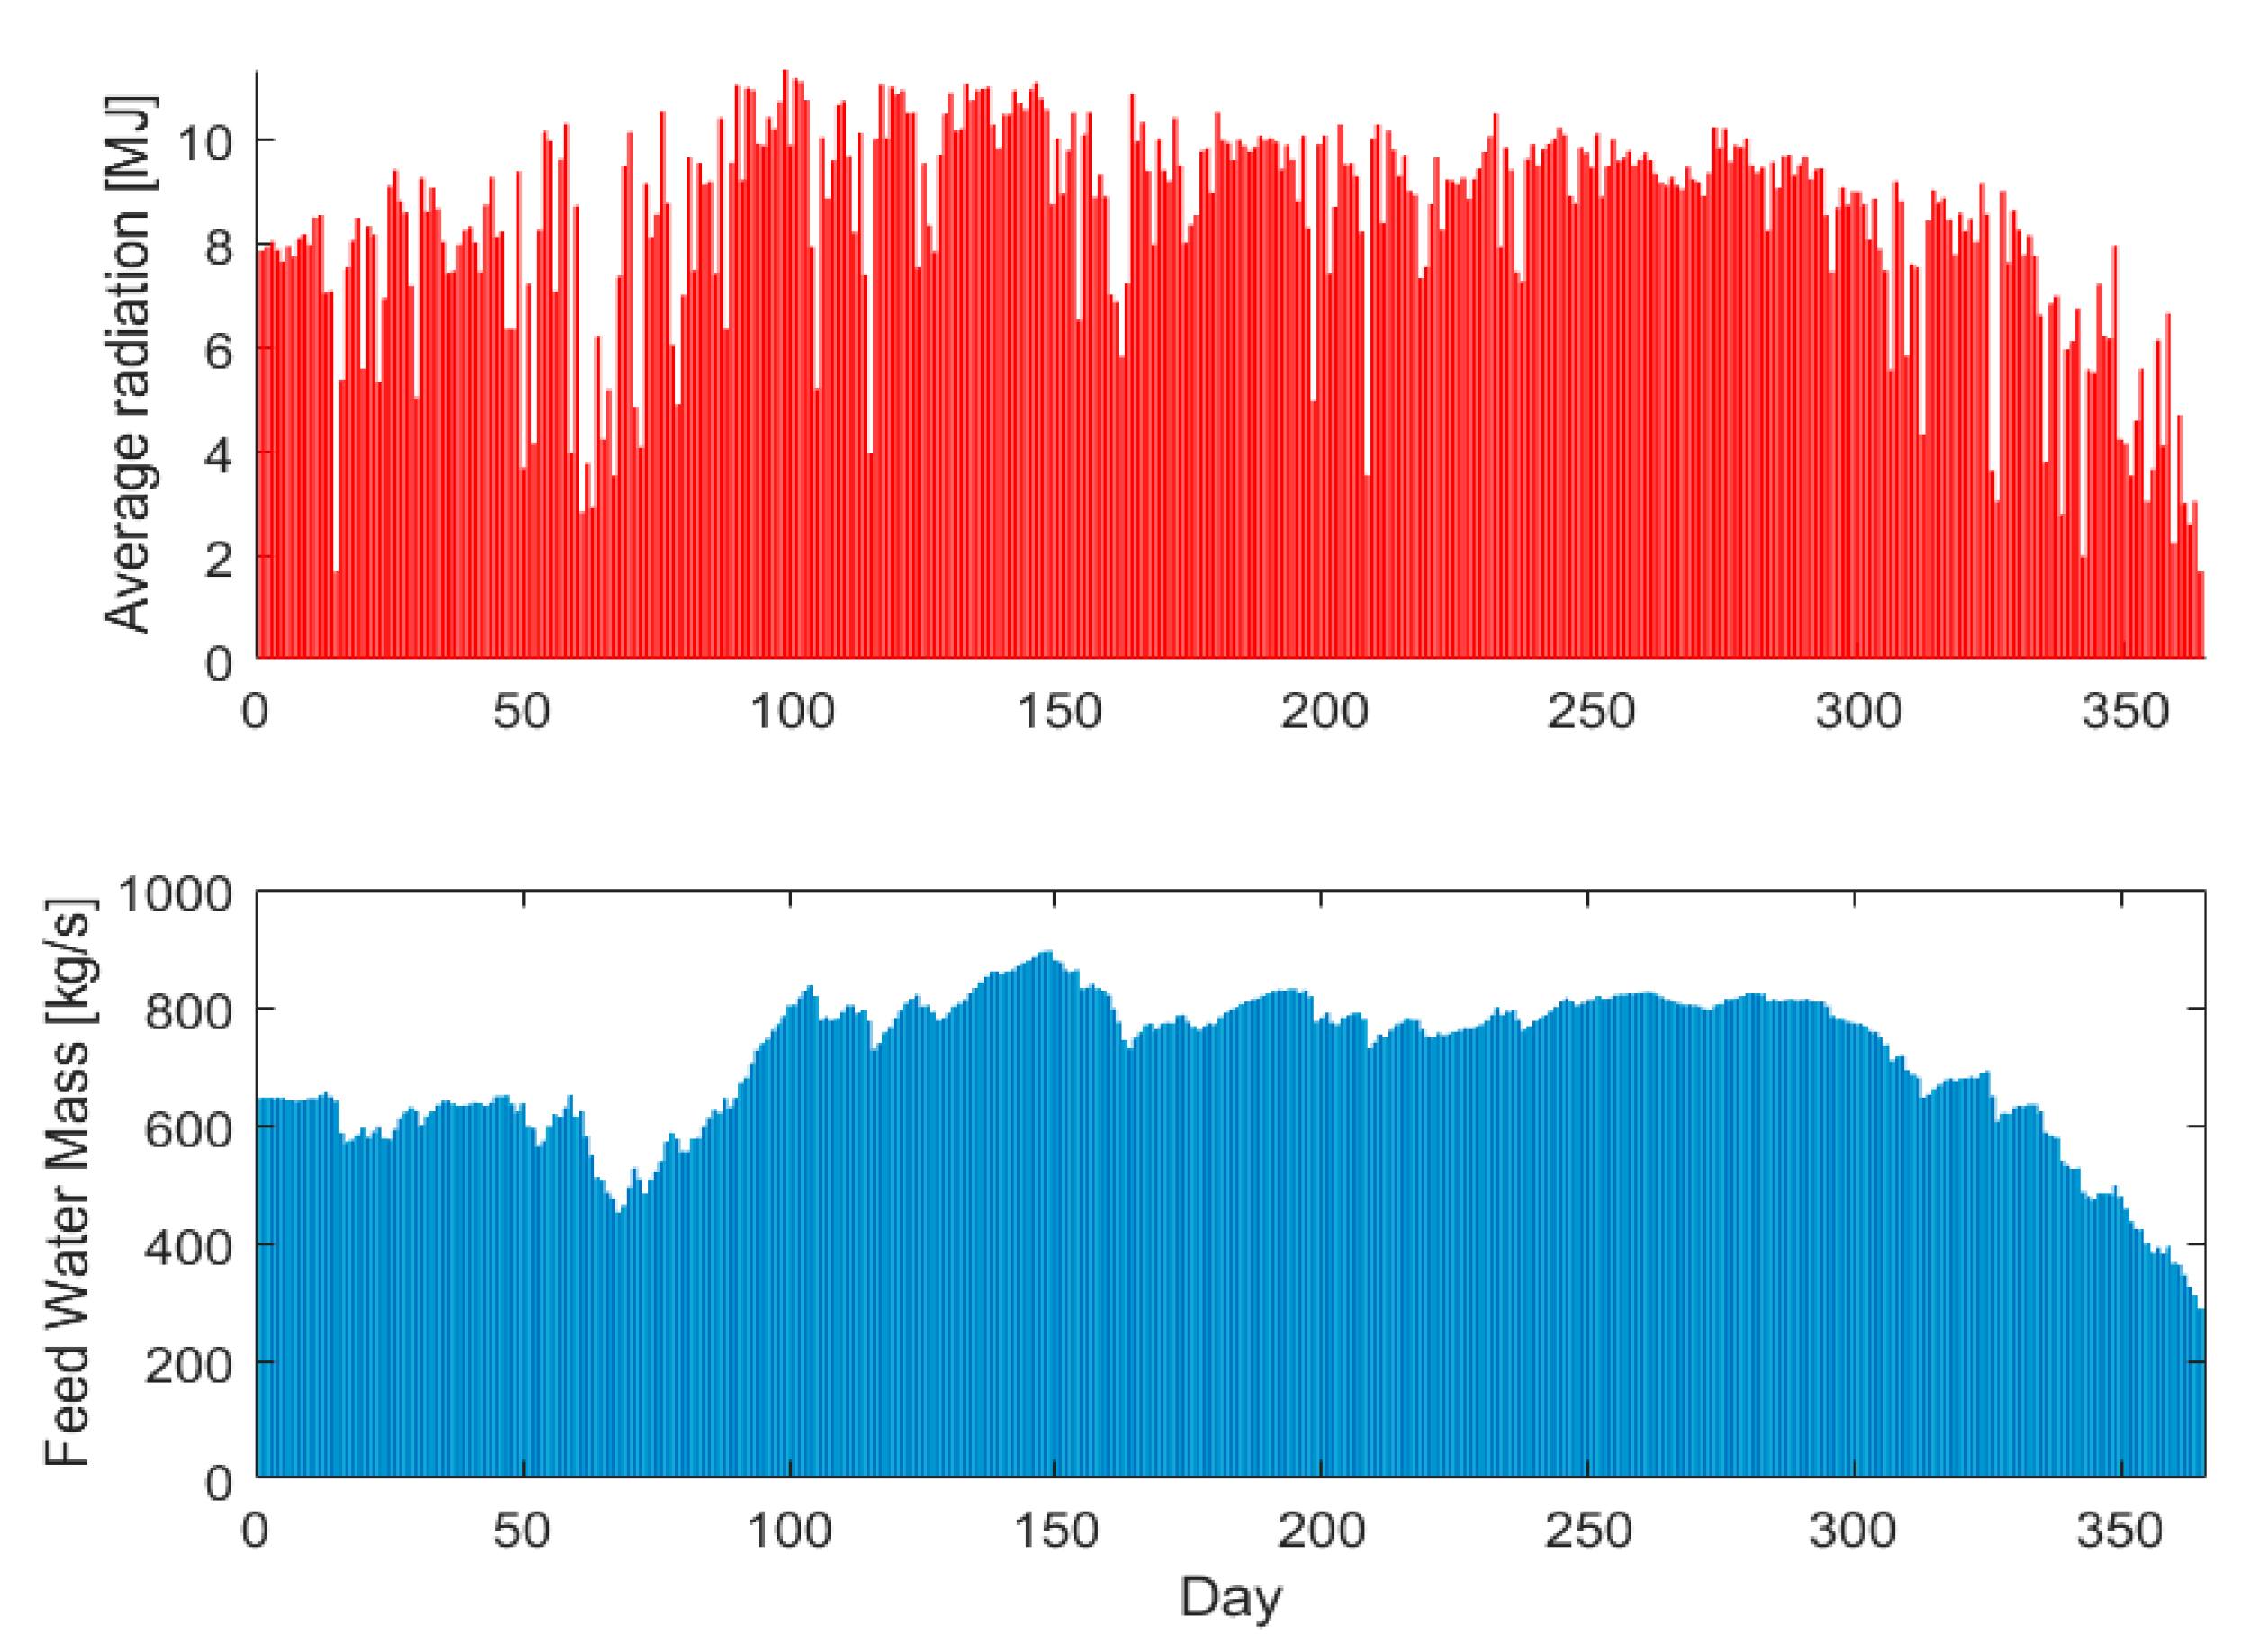
Figure 4 illustrates the daily energy captured by the desalination unit and solar collector, along with feed water masses and temperatures, over a period with significant variations in solar radiation. The figure also depicts the relationship between these variables.

Figure 4.
Daily Radiation and Feed Water Masses.
For instance, on days with the highest solar radiation, the system receives the maximum amount of feed water, resulting in a substantial temperature rise through the solar collector. Conversely, on days with lower solar radiation, there is a noticeable drop in temperature, representing the solar collector’s ability to achieve the same temperature rise despite reduced solar input.
3.6. Variations in the Hot Water Capacity
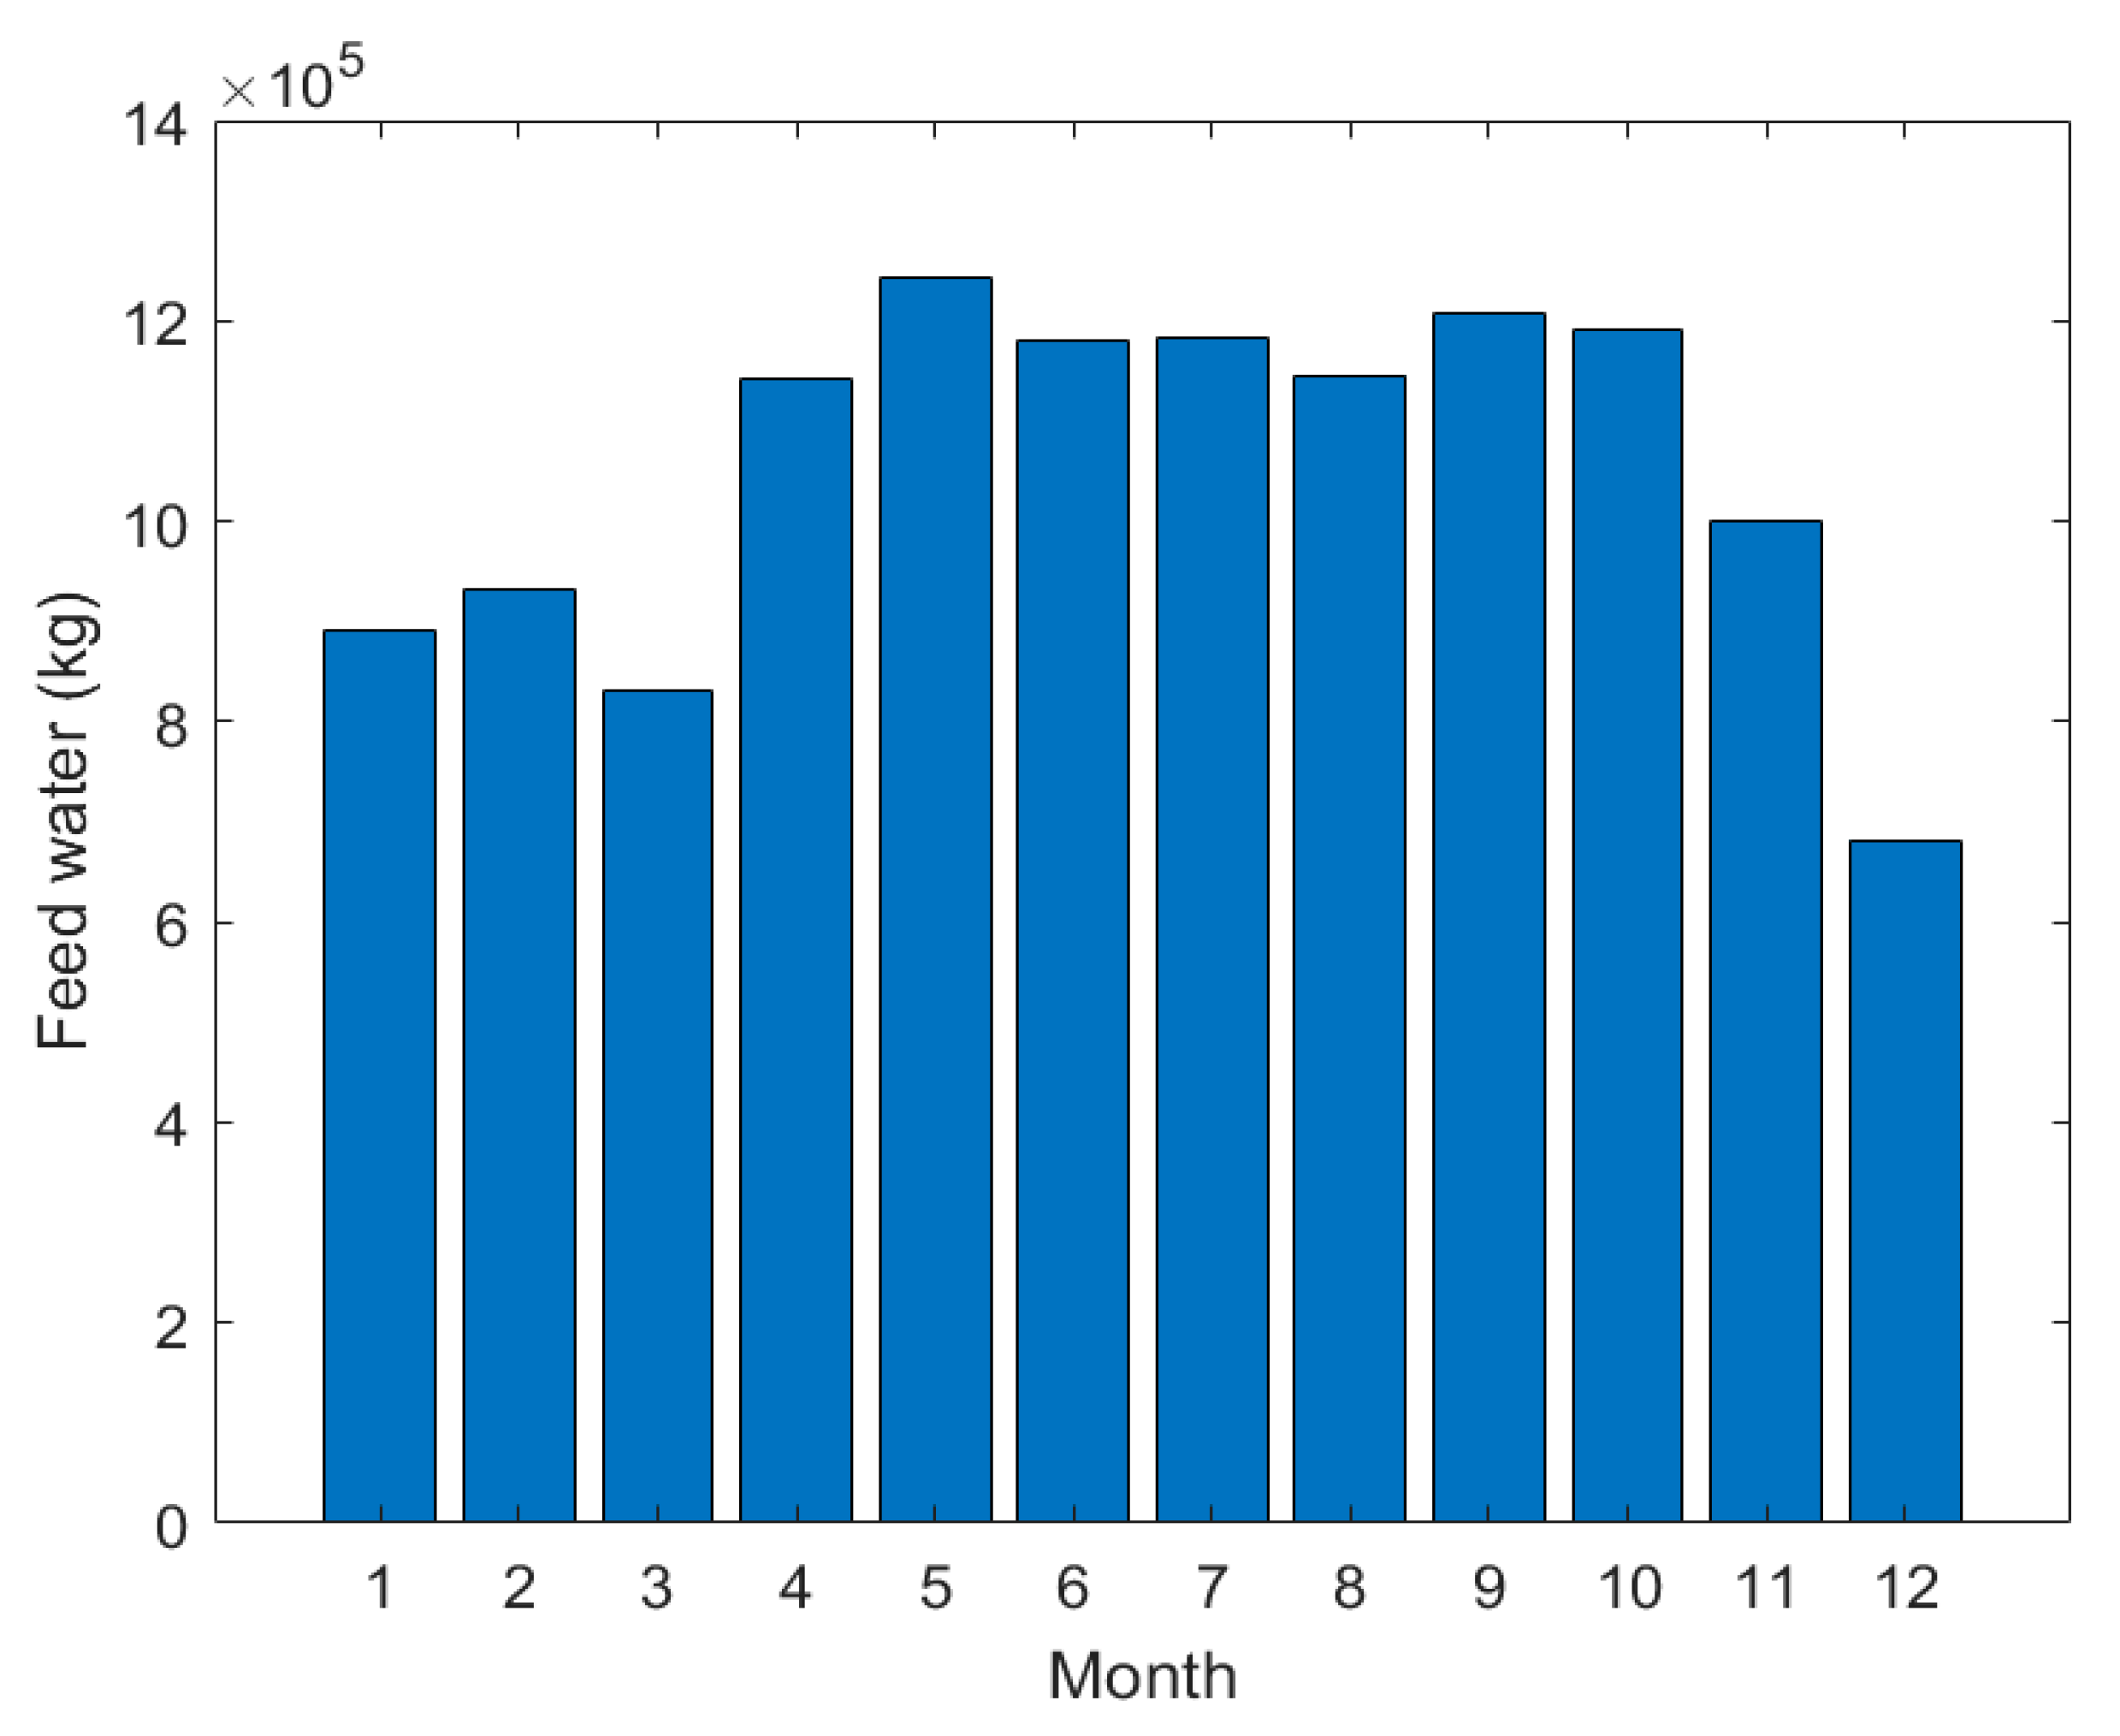
The monthly flow rate of hot water varies significantly, with the lowest rates during winter and the highest in summer. As shown in Figure 5, in June, the flow rate peaks, driven by higher solar radiation that boosts the system’s heating capacity. These fluctuations align with changes in monthly average temperatures and solar fraction values. Increased solar radiation in summer elevates water temperatures and feed water flow, enhancing the desalination system’s efficiency.
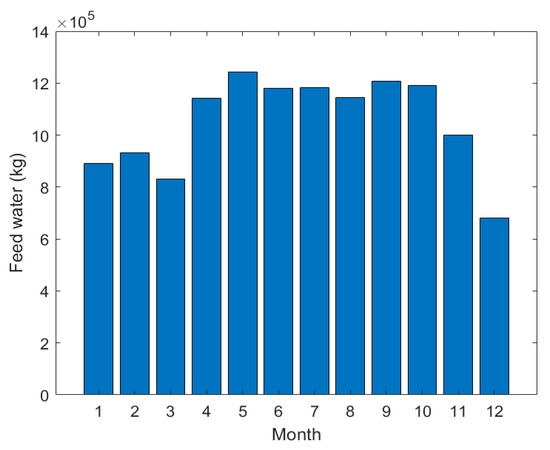
Figure 5.
Variations in the Hot Water Capacity.
3.7. Maximum and Minimum Feed Water Mass under Varying Solar Intensity
During periods of peak solar intensity, the system achieves a maximum useful heat transfer, as illustrated in Figure 6. These contrasting scenarios highlight the system’s adaptability to varying solar conditions, demonstrating its ability to efficiently harness solar energy across a wide spectrum of irradiance, from the high intensity of a clear summer day to the diminished levels on a cloudy winter day. This adaptability is a crucial key for maintaining consistent desalination performance and optimizing freshwater production throughout the year.
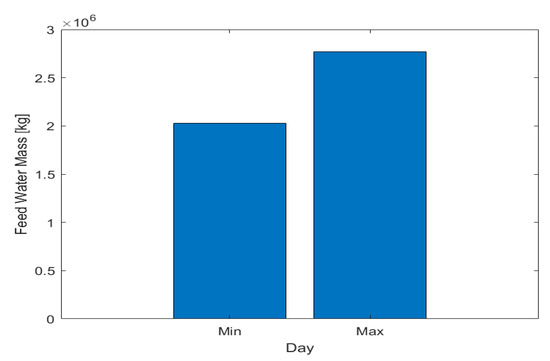
Figure 6.
Feed Water Mass for the Highest and Lowest Solar Radiation Days.
3.8. Cost Analysis of the Thermal Energy Storage
The cost analysis of the proposed thermal energy storage aims to provide a comprehensive estimation of both capital and operating costs related to the thermal tank and solar collector. These components are fundamental to the overall investment, with the cost of the solar array determined by its required area, while the cost formula accounts for bulk purchasing benefits. The thermal storage tank costs are calculated based on their volume, which is crucial for daily feed water storage. Additionally, indirect capital costs, including freight, insurance, construction overhead, and pipeline expenses, collectively contribute an additional percentage to the direct capital costs.
A significant finding from this analysis is the unit product cost (UPC), which is estimated to be approximately , assuming a standard production level and excluding subsidies. This UPC emphasizes the economic feasibility of the solar desalination plant in comparison to conventional desalination methods, particularly when considering the potential for government incentives for renewable energy projects. The thorough economic evaluation underscores the cost-effectiveness of incorporating solar energy into desalination processes, thereby promoting sustainable and affordable water production.
3.9. Annual Variation in Thermal Tank Efficiency
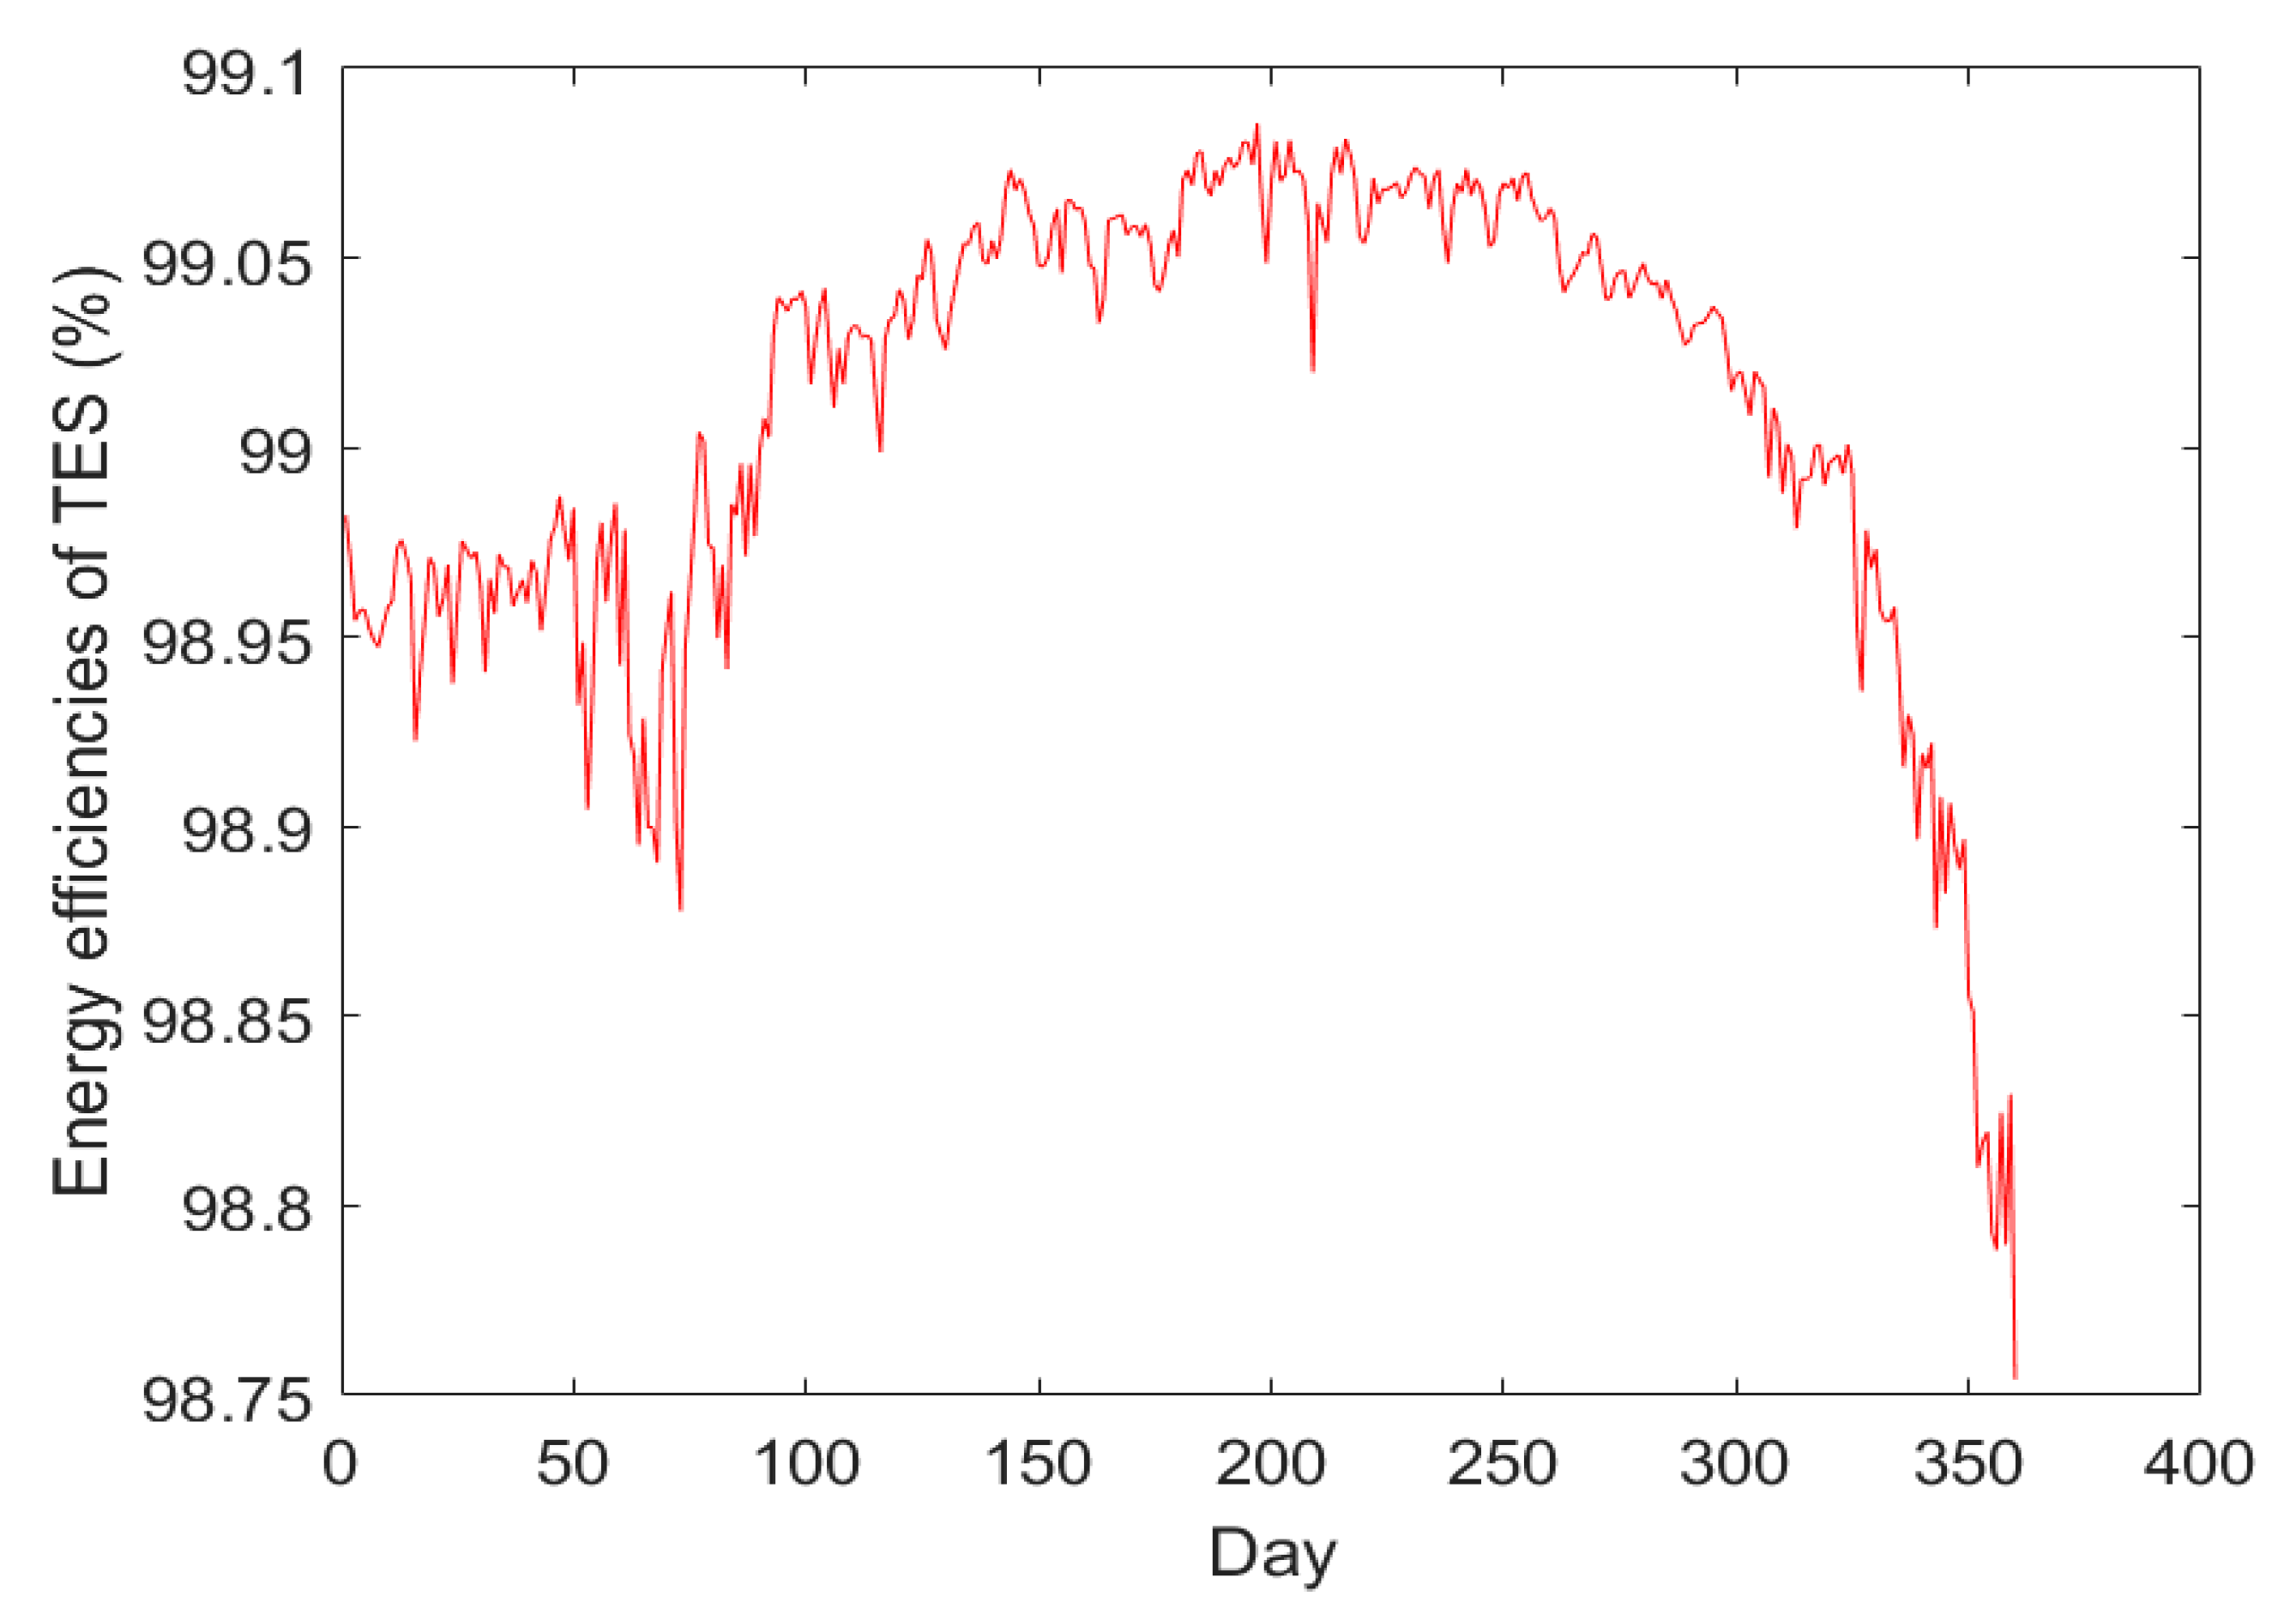
The thermal tank’s energy efficiency varies throughout the year, influenced by changes in solar radiation and corresponding adjustments in feed water volume. To evaluate this efficiency, heat loss is monitored and inferred from the average temperature changes in the water. The energy efficiency (η) is quantified by the ratio of recoverable energy to total input energy [23], expressed as:
Figure 7 presents the annual energy efficiency profile, showcasing consistently high values. During peak summer months, the system achieves optimal performance with energy efficiencies of up to 99.1% for the summer flow rate and 98.8% for the winter flow rate. These high-efficiency rates are attributed to minimal heat leakage, which is the system’s primary energy loss mechanism. The higher flow rates during summer further enhance efficiency by reducing heat loss to the environment.

Figure 7.
Energy Efficiencies of the Storage for the Two Flow Rates.
In contrast, winter months see a slight reduction in efficiency due to decreased solar radiation and lower feed water flow. Additionally, the cooler ambient temperatures in winter increase heat loss, contributing to this efficiency drop. Despite these seasonal variations, the system maintains notably high efficiency throughout the year.
These findings highlight the system’s capacity to adapt to fluctuating solar conditions, maintaining high efficiency and optimizing freshwater production. This robust performance stresses the viability of integrating thermal energy storage in solar desalination systems, leading to sustainable and efficient operation year-round. The comprehensive analysis affirms that while energy efficiency is a critical metric, it is part of a broader assessment of the system’s thermodynamic performance and sustainability.
3.10. Summary of Environmental Impact for the Solar Desalination Plant
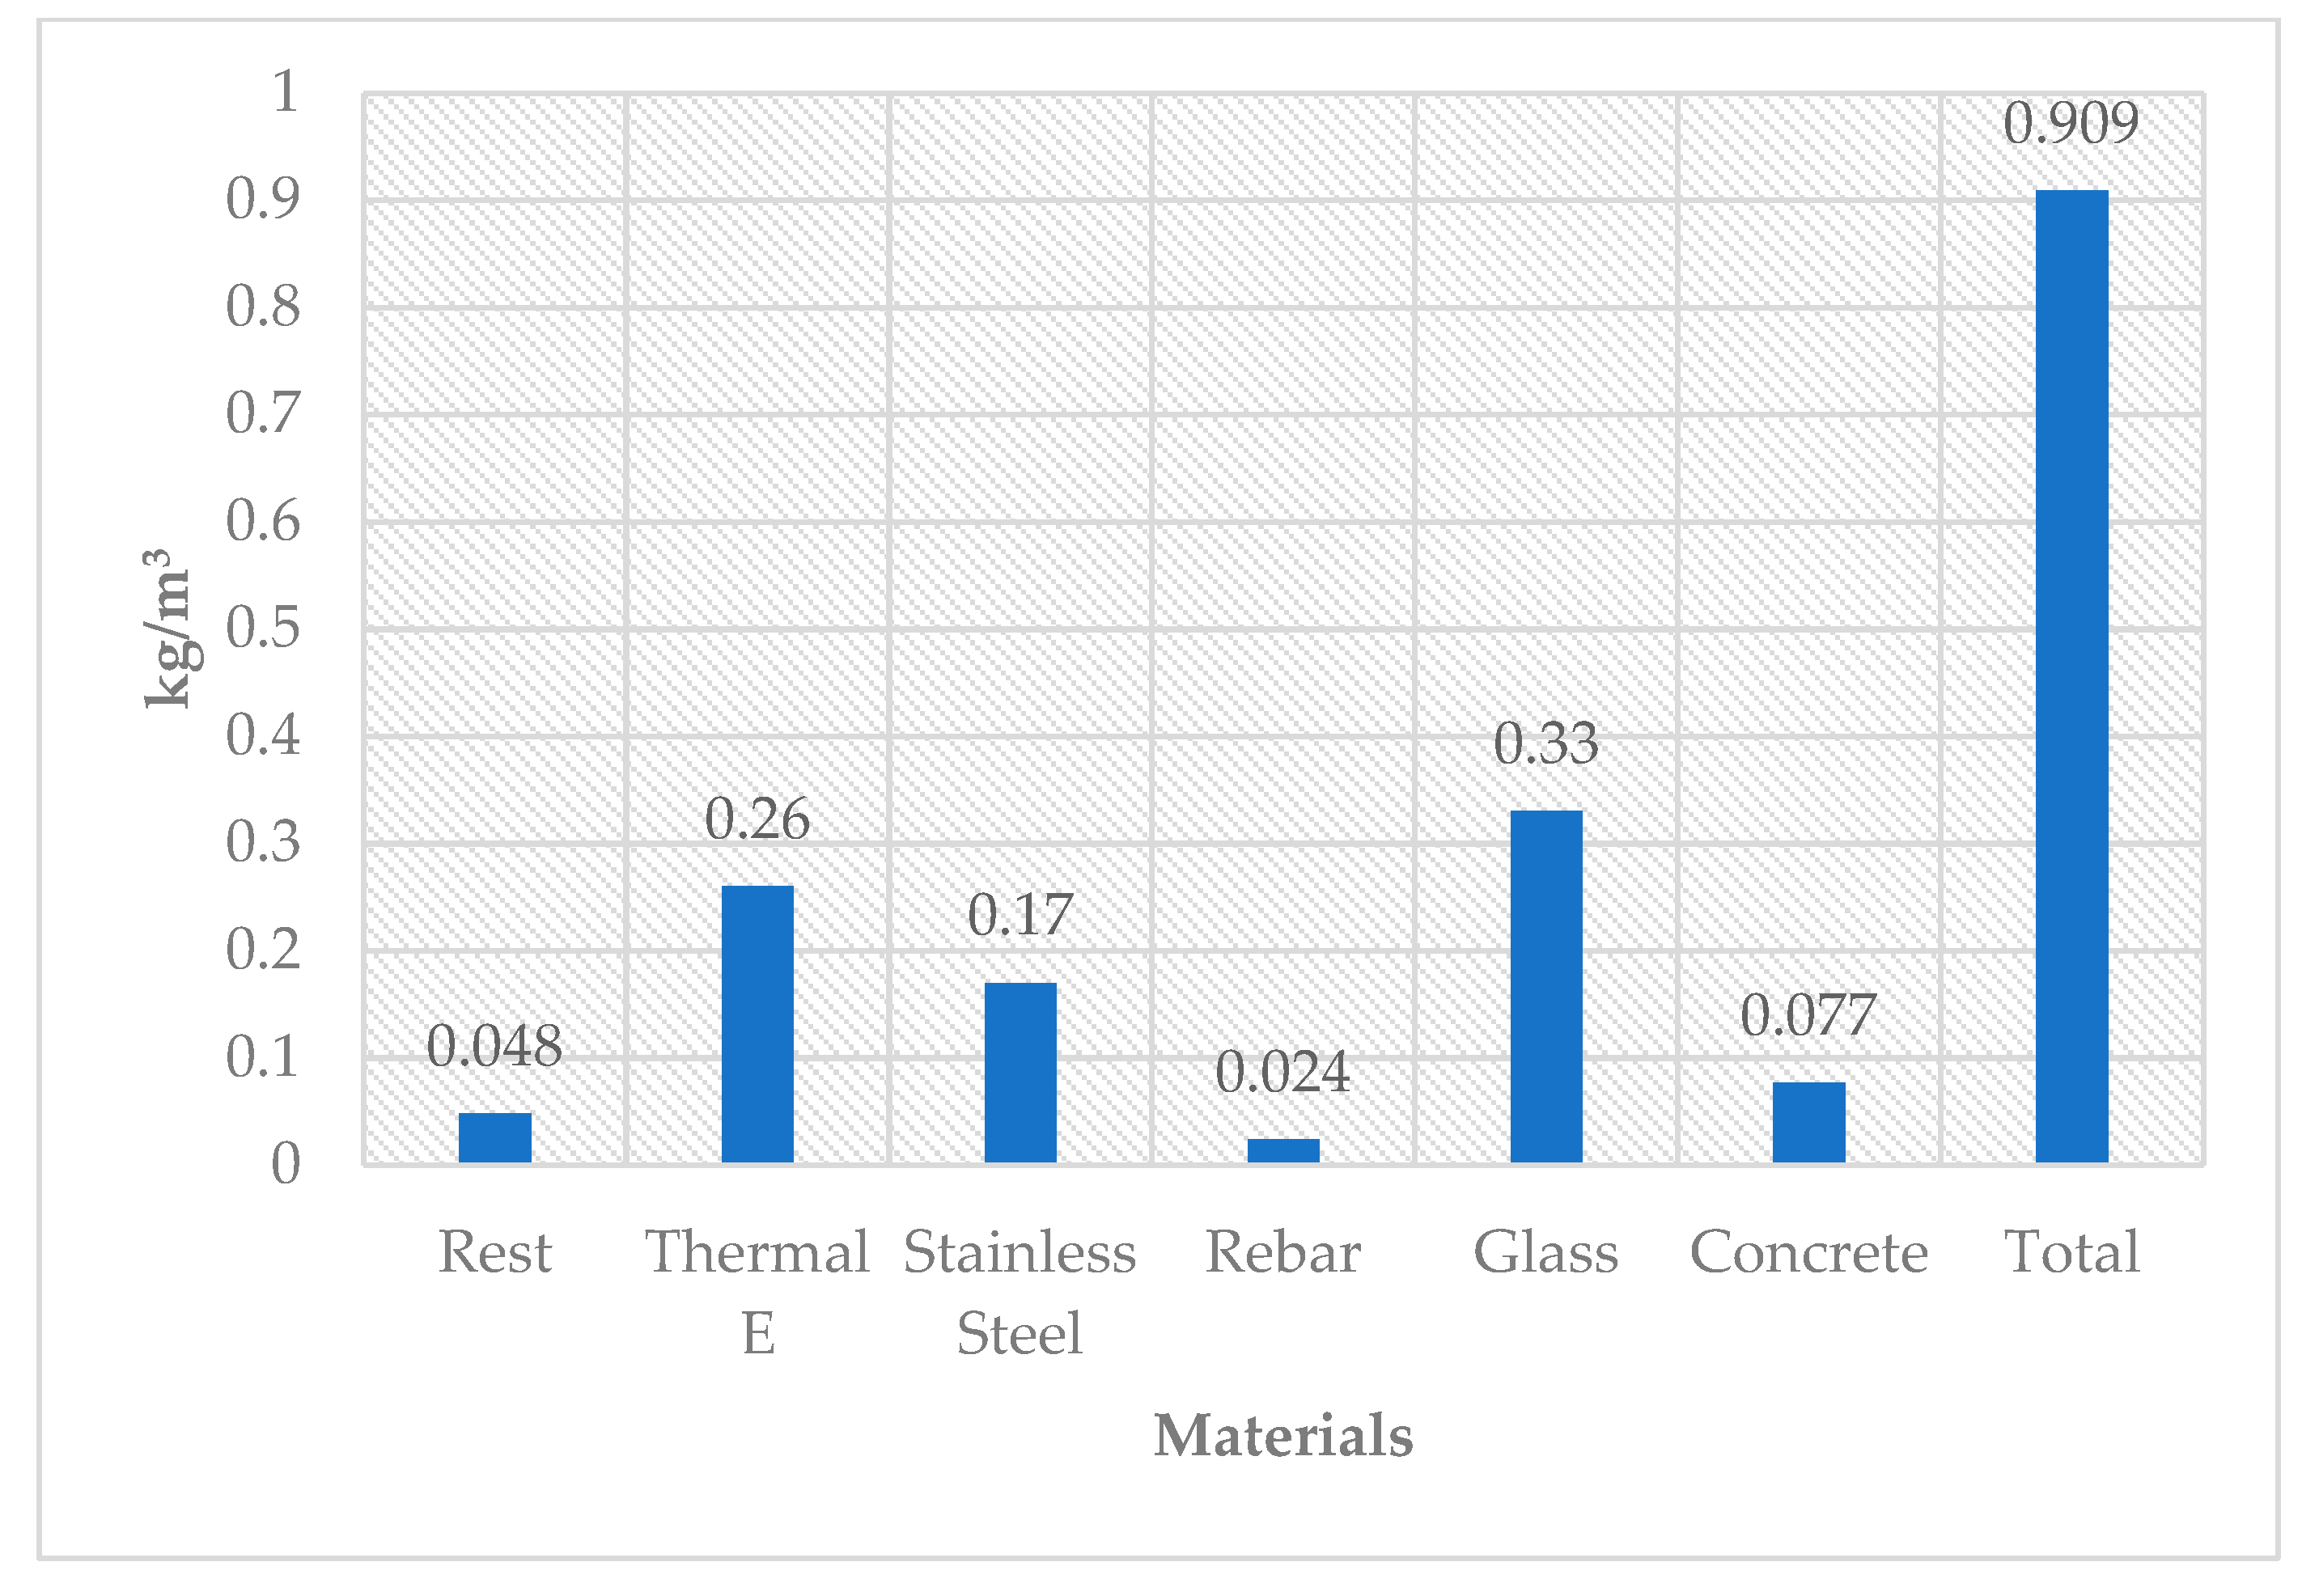
The life cycle assessment (LCA) of the solar desalination plant, with a focus on the thermal tank and solar collector, reveals substantial environmental advantages. Adhering to the rigorous ISO 14040 standards, the LCA encompasses every phase of the plant’s life cycle, from manufacturing to disposal, and was meticulously conducted using GaBi 6 software. The primary construction materials include steel, glass, and PVC, each requiring considerable energy for production and transportation. Key environmental impact categories, such as global warming potential (GWP) and acidification potential (AP), are quantified in CO2-equivalents and SO2-equivalents, respectively.
The findings indicate that the solar-powered desalination plant significantly reduces environmental impact compared to traditional fossil-fuel-powered systems. Specifically, the thermal tanks and solar collectors contribute to a marked decrease in GWP, primarily due to the reliance on renewable energy sources. For instance, Table 2 shows that the GWP of the solar plant is significantly lower, primarily due to the use of renewable energy sources. The operational phase of the plant, where electricity for water pumping is the main GWP contributor, contrasts with the manufacturing phase, which incurs the highest emissions due to material processing. However, due to efficient recycling practices, the dismantling and disposal phases exhibit minimal environmental impact.
Table 2.
The Economic Model Equations [24,25,26,27].
Furthermore, the system’s high efficiency translates into lower emissions. As illustrated in Table 3, substituting conventional energy sources with solar energy leads to a notable reduction in both GWP and AP. This significant decrease underscores the critical role of renewable energy integration in desalination processes, promoting sustainable and eco-friendly water production (Table 4).
Table 3.
Total Environmental Impact.
Table 4.
CO2 Emissions.
In essence, the LCA underscores the environmental benefits of the solar desalination plant, as well as its potential to mitigate climate change impacts and advance sustainable water resource management. By leveraging renewable energy, this innovative system not only enhances freshwater production but also contributes to broader environmental conservation efforts (Figure 8 and Figure 9).
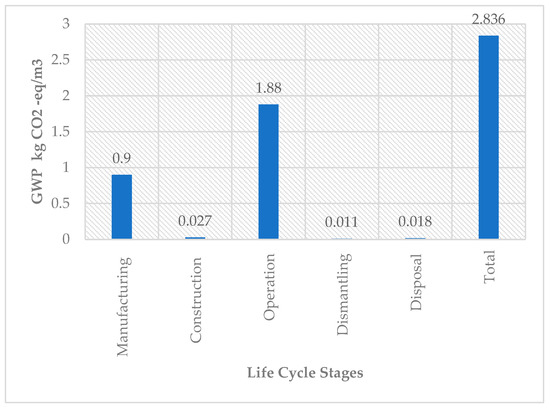
Figure 8.
Bar Graph Showing GWP for Solar Array and Thermal Tanks for Five Stages LCA.

Figure 9.
Bar Graph Showing Percentages for All the Impact Categories for the Materials.
3.11. Verification of the Mathematical Model with Previous Works
The predictive models were validated using historical solar radiation data from the King Abdullah City for Atomic and Renewable Energy (K.A.CARE). This crucial validation process ensures the accuracy and reliability of the mathematical model developed in this study. To establish the model’s credibility, its predictions were compared with results from previous studies on various thermal energy storage (TES) technologies and solar desalination systems [28,29,30,31]. This comparison confirmed the model’s alignment with established methodologies and findings in the field, reinforcing its robustness and reliability.
4. Conclusions
This study advances solar desalination technology by integrating thermal energy storage (TES) with predictive modeling, significantly enhancing system efficiency and sustainability. Optimizing key parameters such as TES tank size, collector area, and mass flow rate led to notable improvements in freshwater production. For instance, increasing the collector area to 4245 m2 resulted in a 10% rise in TES tank temperatures, maintaining an average of 82.5 °C, which boosts thermal energy absorption. A higher mass flow rate of 10 kg/s stabilized water temperatures, reducing fluctuations and leading to efficiency throughout the year.
The study also identifies research gaps, such as the need to explore system adaptability across diverse climates and the integration of alternative renewable energy sources like wind or geothermal energy. Additionally, accurately calculating water needs for remote and residential areas based on energy availability is essential for developing effective water supply plans.
Economic analysis indicates the system is cost-effective, with a production cost of approximately USD 5.86 million, competitive with conventional methods. The environmental benefits are significant, with reductions in global warming potential (GWP) to 2.24 kg CO2-eq per cubic meter and acidification potential (AP) to 0.008 kg SOx-eq per cubic meter.
In conclusion, this research acts as a strong foundation for the broader adoption of renewable energy-driven desalination systems, contributing to sustainable water resource management and environmental conservation.
Funding
This research was funded by Taif University, Saudi Arabia, Project No. (TU-DSPP-2024-212).
Data Availability Statement
The data presented in this study are available on request from the corresponding author.
Acknowledgments
The author extends his appreciation to Taif University, Saudi Arabia, for supporting this work through project number (TU-DSPP-2024-212).
Conflicts of Interest
The authors declare no conflict of interest.
List of Abbreviations
| Abbreviation | Full Form |
| TES | Thermal Energy Storage |
| LCA | Life Cycle Assessment |
| PCM | Phase Change Materials |
| HDPE | High-Density Polyethylene |
| GWP | Global Warming Potential |
| Ap | Acidification Potential |
Nomenclature
| Variable | Units | Description |
| Aperture Area | ||
| Receiver Area | ||
| Specific Heat Capacity | ||
| Heat Removal Factor | ||
| Available Solar Power | ||
| Mass of Charging Tank | ||
| Mass of Discharging Tank | ||
| Number of Collectors | ||
| Useful Heat Gain | ||
| Ambient Temperature | ||
| Feed Water Temperature Entering the Array | ||
| Feed Water Temperature | ||
| Top Brine Temperature | ||
| Charging Tank Temperature | ||
| Discharging Tank Temperature | ||
| Optical Efficiency | ||
| Direct Capital Cost | ||
| UPC | Unit Product Cost | |
| Indirect Capital Cost | ||
| Operating Maintenance Cost | ||
| Loss Coefficient for Charging Tank | ||
| Loss Coefficient for Discharging Tank | ||
| Heat Loss Coefficient | ||
| Day | ||
| Time | ||
| Cost per Square Meter of Collector Area | ||
| Collector Efficiency | ||
| GWP | kg CO2-eq | Global Warming Potential |
| AP | kg H+ moles-eq | Acidification |
References
- Martinez-Cruz, T.E.; Adelman, L.; Castañeda-Quintana, L.; Mejía-Montalvo, D. Water is more than a resource: Indigenous Peoples and the right to water. Soc. Sci. Humanit. Open 2024, 10, 100978. [Google Scholar] [CrossRef]
- United Nations. Secretary-General, at Event on Human Rights, Highlights Power of Science, Technology to Advance Societies, Accelerate Development, Urges End to Their Misuse; United Nations: New York, NY, USA, 2016. [Google Scholar]
- Joshua Dibal, I.; Salihu, A.; Mshelia, A.; Ubachukwu, N. Analysis of Community-Based Pattern of Water Demand and Supply. J. Environ. Sci. Sustain. Dev. 2023, 6, 228–248. [Google Scholar]
- Hindiyeh, M.; Albatayneh, A.; Altarawneh, R.; Jaradat, M.; Al-Omary, M.; Abdelal, Q.; Tayara, T.; Khalil, O.; Juaidi, A.; Abdallah, R.; et al. Sea Level Rise Mitigation by Global Sea Water Desalination Using Renewable-Energy-Powered Plants. Sustainability 2021, 13, 9552. [Google Scholar] [CrossRef]
- Thi, H.T.D.; Pasztor, T.; Fozer, D.; Manenti, F.; Toth, A.J. Comparison of Desalination Technologies Using Renewable Energy Sources with Life Cycle, PESTLE, and Multi-Criteria Decision Analyses. Water 2021, 13, 3023. [Google Scholar] [CrossRef]
- Kaviti, A.K.; Akkala, S.R.; Sikarwar, V.S.; Sai Snehith, P.; Mahesh, M. Camphor-Soothed Banana Stem Biowaste in the Productivity and Sustainability of Solar-Powered Desalination. Appl. Sci. 2023, 13, 1652. [Google Scholar] [CrossRef]
- Salem, H.; Kabeel, A.; El-Said, E.M.; Elzeki, O.M. Predictive modelling for solar power-driven hybrid desalination system using artificial neural network regression with Adam optimization. Desalination 2022, 522, 115411. [Google Scholar] [CrossRef]
- Kaviti, A.K.; Akkala, S.R.; Ali, M.A.; Anusha, P.; Sikarwar, V.S. Performance Improvement of Solar Desalination System Based on CeO2-MWCNT Hybrid Nanofluid. Sustainability 2023, 15, 4268. [Google Scholar] [CrossRef]
- Kaviti, A.K.; Mary, B.; Ram, A.S.; Kumari, A.A. Influence of aluminium parabolic fins as energy absorption material in the solar distillation system. Mater. Today Proc. 2021, 44, 2521–2525. [Google Scholar] [CrossRef]
- Mevada, D.; Panchal, H.; Ahmadein, M.; Zayed, M.E.; Alsaleh, N.A.; Djuansjah, J.; Moustafa, E.B.; Elsheikh, A.H.; Sadasivuni, K.K. Investigation and performance analysis of solar still with energy storage materials: An energy-exergy efficiency analysis. Case Stud. Therm. Eng. 2022, 29, 101687. [Google Scholar] [CrossRef]
- Zheng, M.; Wu, P.; Li, L.; Yu, F.; Ma, J. Adsorption/desorption behavior of ciprofloxacin on aged biodegradable plastic PLA under different exposure conditions. J. Environ. Chem. Eng. 2023, 11, 109256. [Google Scholar] [CrossRef]
- Kaviti, A.K.; Akkala, S.R.; Sikarwar, V.S. Productivity enhancement of stepped solar still by loading with magnets and suspended micro charcoal powder. Energy Sources Part A Recover. Util. Environ. Eff. 2021, 1–19. [Google Scholar] [CrossRef]
- Sohani, A.; Zabihigivi, M.; Moradi, M.H.; Sayyaadi, H.; Balyani, H.H. A comprehensive performance investigation of cellulose evaporative cooling pad systems using predictive approaches. Appl. Therm. Eng. 2017, 110, 1589–1608. [Google Scholar] [CrossRef]
- Asfahan, H.M.; Sajjad, U.; Sultan, M.; Hussain, I.; Hamid, K.; Ali, M.; Wang, C.-C.; Shamshiri, R.R.; Khan, M.U. Artificial Intelligence for the Prediction of the Thermal Performance of Evaporative Cooling Systems. Energies 2021, 14, 3946. [Google Scholar] [CrossRef]
- Derbali, M.; Fattouh, A.; Jerbi, H.; Abdelkrim, M.N. Improved fault detection in water desalination systems using machine learning techniques. J. Theor. Appl. Inf. Technol. 2016, 92, 380. [Google Scholar]
- Raghuvanshi, R.; Ilyas, M.D.; Sharma, S. Predicting Pyramid Geometric Solar Water Still Plant Efficiency Using RBF Based Multi-layer Perceptron. In European, Asian, Middle Eastern, North African Conference on Management & Information Systems; Springer: Berlin/Heidelberg, Germany, 2021; pp. 144–153. [Google Scholar]
- Salem, H.; El-Hasnony, I.M.; Kabeel, A.; El-Said, E.M.; Elzeki, O.M. Deep Learning model and Classification Explainability of Renewable energy-driven Membrane Desalination System using Evaporative Cooler. Alex. Eng. J. 2022, 61, 10007–10024. [Google Scholar] [CrossRef]
- Baetens, J.; Van Eetvelde, G.; Lemmens, G.; Kayedpour, N.; De Kooning, J.D.M.; Vandevelde, L. Thermal Performance Evaluation of an Induced Draft Evaporative Cooling System through Adaptive Neuro-Fuzzy Interference System (ANFIS) Model and Mathematical Model. Energies 2019, 12, 2544. [Google Scholar] [CrossRef]
- Gude, V.G. Energy storage for desalination processes powered by renewable energy and waste heat sources. Appl. Energy 2015, 137, 877–898. [Google Scholar] [CrossRef]
- Antipova, E.; Boer, D.; Cabeza, L.F.; Guillén-Gosálbez, G.; Jiménez, L. Multi-objective design of reverse osmosis plants integrated with solar Rankine cycles and thermal energy storage. Appl. Energy 2013, 102, 1137–1147. [Google Scholar] [CrossRef]
- Szacsvay, T.; Hofer-Noser, P.; Posnansky, M. Technical and economic aspects of small-scale solar-pond-powered seawater desalination systems. Desalination 1999, 122, 185–193. [Google Scholar] [CrossRef]
- Kabeel, A.; El-Said, E.M. Water production for irrigation and drinking needs in remote arid communities using closed-system greenhouse: A review. Eng. Sci. Technol. Int. J. 2015, 18, 294–301. [Google Scholar] [CrossRef]
- Din, I.; Rosen, M.A. Thermal Energy Storage: Systems and Applications; John Wiley & Sons: Hoboken, NJ, USA, 2011. [Google Scholar]
- El-Dessouky, H.T.; Ettouney, H.M. Fundamentals of Salt Water Desalination; Elsevier: Amsterdam, The Netherlands, 2002. [Google Scholar]
- Sharaf, M.A.; Nafey, A.S.; García-Rodríguez, L. Exergy and Thermo-Economic Analyses of A Combined Solar Organic Cycle with Multi Effect Distillation (MED) Desalination Process. Desalination 2011, 272, 135–147. [Google Scholar] [CrossRef]
- Janghorban Esfahani, I.; Ataei, A.; Shetty, K.V.; Oh, T.; Park, J.H.; Yoo, C. Modeling and genetic algorithm-based multi-objective optimization of the MED-TVC desalination system. Desalination 2012, 292, 87–104. [Google Scholar] [CrossRef]
- Rahimi, B.; Christ, A.; Regenauer-Lieb, K.; Chua, H.T. A novel process for low grade heat driven desalination. Desalination 2014, 351, 202–212. [Google Scholar] [CrossRef]
- Gude, V.G.; Nirmalakhandan, N.; Deng, S. Renewable and sustainable approaches for desalination. Renew. Sustain. Energy Rev. 2010, 14, 2641–2654. [Google Scholar] [CrossRef]
- Kalogirou, S.A. Seawater desalination using renewable energy sources. Prog. Energy Combust. Sci. 2005, 31, 242–281. [Google Scholar] [CrossRef]
- Leblanc, J. Solar Thermal Desalination—A Modelling and Experimental Study; RMIT University: Melbourne, Australia, 2009. [Google Scholar]
- Alsehli, M.; Choi, J.-K.; Aljuhan, M. A novel design for a solar powered multistage flash desalination. Sol. Energy 2017, 153, 348–359. [Google Scholar] [CrossRef]


Disclaimer/Publisher’s Note: The statements, opinions and data contained in all publications are solely those of the individual author(s) and contributor(s) and not of MDPI and/or the editor(s). MDPI and/or the editor(s) disclaim responsibility for any injury to people or property resulting from any ideas, methods, instructions or products referred to in the content. |
© 2024 by the author. Licensee MDPI, Basel, Switzerland. This article is an open access article distributed under the terms and conditions of the Creative Commons Attribution (CC BY) license (https://creativecommons.org/licenses/by/4.0/).