Article

Photo(solar)-Activated Hypochlorite Treatment: Radicals Analysis Using a Validated Model and Assessment of Efficiency in Organic Pollutants Degradation

1
Laboratory of Environmental Process Engineering, Faculty of Process Engineering, University Constantine 3 Salah Boubnider, P.O. Box 72, Constantine 25000, Algeria
2
Chemical Engineering Department, College of Engineering, King Saud University, P.O. Box 800, Riyadh 11421, Saudi Arabia
*
Author to whom correspondence should be addressed.
Processes 2024, 12(9), 1853; https://doi.org/10.3390/pr12091853
Submission received: 22 July 2024 / Revised: 24 August 2024 / Accepted: 25 August 2024 / Published: 30 August 2024
(This article belongs to the Special Issue Treatment and Remediation of Organic and Inorganic Pollutants)

Abstract

:
Reactive oxygen species (ROS) and reactive chlorine species (RCS) and their involvement in the degradation process are explored in this work by thorough kinetic modeling of the solar-activated hypochlorite degradation of Rhodamine B (RhB) dye. The kinetic modeling enabled the determination of rate constants for both radical and non-radical pathways of hypochlorite and the oxidation of RhB by free radicals. Using COPASI® software, fed with a kinetics mechanism of 144 chemical reactions, the free radical kinetic model accurately fitted experimental data under various conditions, including temperatures ranging from 25 to 55 °C and initial hypochlorite concentrations from 300 to 1000 µM, at a controlled pH of 11. Results indicate that increasing hypochlorite dosages and temperatures enhance free radical concentrations and RhB degradation rates. OH and ClO radicals were quantified as primary contributors to RhB degradation, while ozone played a minor role. The model provides profiles for ROS and RCS, details on radicals distribution in RhB degradation, and predictions of rate constants for the photolysis of ClO: kR1 = 2.67 × 10⁻⁴ s−1 for the radical pathway (ClO  h ν O•− + Cl), and kR2 = 1.88 × 10⁻⁵ s−1 and kR3 = 0 s−1 for the non-radical pathway (i.e., ClO  h ν O(3P) + Cl and ClO  h ν O(1D) + Cl, respectively). The rate constants for RhB reactions with O•−, Cl, Cl2•− and ClO were predicted to be 4.8 × 10⁹ M−1 s−1, 1.45 × 10⁹ M−1 s−1, 2.5 × 10⁷ M−1 s−1 and 8.7 × 10⁴ M−1 s−1, respectively. Lower rate constants were predicted for RhB reactions with HOCl•−, HO2, O2•−, and O(3P), with values of 4.1 × 10⁴ M−1 s−1, 7.3 × 10⁵ M−1 s−1, 3.6 × 10⁴ M−1 s−1, and 0.40 M−1 s−1, respectively.

1. Introduction

Water utilities are increasingly challenged by the presence of organic pollutants in drinking water sources, including textile dyes, aromatics, pharmaceuticals, and pesticides. These substances find their way into the environment through various pathways such as industrial effluents, municipal sewage, and agricultural runoff [1,2,3,4]. Conventional water treatment systems often struggle to effectively remove these contaminants [5]. While oxidants differ in their selectivity, the generation of highly reactive radicals, such as hydroxyl radicals (OH), sulfate radicals (SO4•−), chlorine radicals (Cl), chlorite radicals (ClO), and di-chloride radicals (Cl2•−), enables the oxidation of a wide range of organic compounds, thanks to their high measured rate constants (~106–109 M−1 s−1) toward organic pollutants [6]. Advanced oxidation processes (AOPs) utilize these radicals to break down numerous organic pollutants [7,8,9,10]. UV-based techniques are regarded as robust AOPs for water purification [11,12,13]. Chlorine is particularly advantageous for sunlight-driven processes because it can absorb longer wavelengths, unlike H2O2 and persulfate-based AOPs, which are limited to UV-C light due to their lower molar absorptivity [14,15,16]. Chlorine photolysis stands out for its use of a cost-effective and widely available disinfectant, making it the more economical choice [17]. Additionally, chlorine photolysis eliminates the need for residual chlorine quenching, a necessary procedure in UV/persulfate and UV/H2O2 systems [5].
UV/chlorine systems commonly employ low-pressure mercury vapor (LP-UV) lamps as their primary UV light source. However, for the enhancement of the energy efficacy of the UV/chlorine process, various UV lamps have been used, including medium-pressure mercury vapor (MP-UV) lamps, excimer lamps, and UV light-emitting diodes (UV-LED). Furthermore, a limited number of studies have investigated the feasibility of utilizing solar radiation as a UV light source for UV/chlorine AOP [18,19,20]. The photocatalytic activation of chlorine is affected by several parameters (solution pH, irradiation wavelength, chlorine dose, water matrices, solution temperature, etc.). For example, in the experimental work of Yin et al. [21], UV-LEDs emitting at four wavelengths within the UV-C and near-UV-C spectrum (i.e., 257.7, 268, 282.3, and 301.2 nm) have been used to examine the influence of wavelength on chlorine photolysis and the subsequent generation of reactive radicals. The fluence-based photodecay rates of hypochlorous acid (HOCl) and hypochlorite (OCl) exhibited a monotonic correlation with their respective molar absorption coefficients and quantum yields. Notably, chlorine photodecay rates were significantly more influenced by molar absorption coefficients (0.949) than by quantum yields (0.055). The modeling outcomes indicated that the maximum fluence-based rate constant (1.46 × 10⁻⁴ m² J−1) was achieved at 289.7 nm and a pH of 9.95. The influence of wavelength on photodecay rates was more pronounced under alkaline conditions compared to acidic conditions. Additionally, the sensitivity to pH was greatest at the longest wavelength studied. The generation of OH and reactive chlorine species (RCS) exhibited inverse wavelength dependencies at pH 6. However, at pH 7, the formation of OH and RCS increased with increasing wavelength. Furthermore, a higher concentration of OH was observed at pH 6 compared to pH 7, while the formation of RCS demonstrated the opposite pH dependence [21]. On the other side, the UV/chlorine process could be enhanced in the presence of catalysts. In the recent work of Cheng et al. [22], using the UV365/TiO2/chlorine process for the removal of carbamazepine, the obtained apparent first-order rate constant was found to be 34.2 and 3.9 times higher compared to those without TiO2 and chlorine, respectively. In this process, chlorine plays a dual role. Firstly, it acts as a catalyst, increasing the production of hydroxyl radicals (OH) without undergoing consumption. Secondly, chlorine serves as a radical precursor, contributing to the formation of OH and reactive chlorine species [22]. The k’CBZ increased with rising TiO2 dose within the range of 1.0 to 20.0 mg/L and with increasing light intensities from 0.1 to 0.33 mW/cm² and with decreasing chlorine dose from 5.0 to 1.0 mgCl2/L. While an increase in pH led to a higher overall concentration of reactive species, the transformation of OH and Cl into the less reactive ClO species resulted in a decrease in k’CBZ from pH 6.0 to 9.0. In [23], the visible light/g-C3N4/chlorine process significantly enhanced the pseudo-first-order degradation rate constant of carbamazepine. Compared to processes without g-C3N4 or chlorine, this combined approach achieved degradation rates that were 16 and 7 times higher, respectively. Moreover, the system demonstrated sustained performance over repeated use cycles. A notable advantage of the vis-light/g-C3N4/chlorine process is its exceptional performance in the presence of natural organic matter (NOM). Unlike UV/TiO2 or UV/chlorine AOPs, this system is less affected by NOM due to its reduced light absorption at visible wavelengths and its lower scavenging of surface-bound reactive species [23].
The photolysis of chlorine involves intricate chemistry influenced by the wavelength and the form of chlorine present, which depends on the solution’s pH [24]. Hypochlorous acid (HClO), with a pKa of 7.5, is predominant in the pH range of 4.0–6.0, whereas hypochlorite (ClO) dominates at pH levels above 10, such as in commercial sodium hypochlorite solutions with a pH around 12 [25]. HClO primarily absorbs at 236 nm (ε~102 M−1 cm−1), while the absorption band of hypochlorite extends up to 400 nm, peaking at 294 nm (ε~375 M−1 cm−1), making it suitable for solar-light activation. Photolysis of HClO produces OH and Cl radicals (HOCl +hν → OH + Cl) [26]. The quantum yield (Φ) for this reaction decreases with increasing wavelength: 0.278 at 253.4 nm, 0.127 at 313 nm, and 0.08 at 365 nm [26]. In contrast, the photolysis of hypochlorite (OCl) is more complex, generating O•− (ClO + hν → O•− + Cl), and two excited oxygen states, O(1D) and O(3P) (OCl +hν → O(1D) + Cl and OCl + hν → O(3P) + Cl) [26]. For the O(3P) pathway, the quantum yield of ClO photolysis increases with wavelength: 0.074 at 253.7 nm, 0.075 at 313 nm, and 0.28 at 365 nm [26]. Therefore, there is significant potential to utilize solar light, which includes UV light between 300 and 400 nm, to activate hypochlorite, particularly as it has an absorption band with a peak at 303 nm. However, the O(1D) pathway is not favored with solar light, as the quantum yield of ClO at 365 nm is zero [26]. ClO from the reaction of Cl or OH with chlorine (Reactions 30, and 44 in Table 1) and Cl2•− from the reaction of Cl with Cl (Reaction 47 in Table 1) are examples of further chlorine radicals that can be produced during chlorine photo-dissociation. Cl is more selective than the non-selective OH and interacts preferentially with substrates that are rich in electrons [27]. Cl2•− preferentially interacts with a variety of organic compounds, although being typically less reactive than OH and Cl [28,29]. These radicals are essential for the degradation of several water contaminants and have high redox potentials (2.43 V for Cl, 2.13 V for Cl2•−, and 1.5–1.8 V for ClO) [30]. With regard to organic molecules, the rates of reaction of these radicals are around~102–106 M−1 s−1 for Cl2•−, ~107–109 M−1s−1 for ClO, and 108–1011 M−1s−1 for Cl and OH [15,24,31,32].
The UV/chlorine process demonstrated high degradation rates under various conditions. For example, in their analysis of NOM degradation through the UV/chlorine process, Wang et al. [32] found that this method is particularly efficient at removing chromophores (~ 80%) and fluorophores (76.4–80.8%), while the reduction of dissolved organic carbon (DOC) is less pronounced at 15.1–18.6%. The contribution of hydroxyl radicals was found to be 1.4 times more than that of chlorine radicals (Cl). Similarly, in [31] a systematic investigation was conducted to assess the degradation of three lipid regulators—gemfibrozil, bezafibrate, and clofibric acid—via UV/chlorine treatment. The chlorine oxide radical (ClO) was identified as a primary contributor to the degradation of gemfibrozil and bezafibrate, with corresponding second-order rate constants of 4.2 (±0.3) × 108 M−1 s−1 and 3.6 (±0.1) × 107 M−1 s−1, respectively. In contrast, the degradation of clofibric acid was predominantly attributed to UV photolysis and hydroxyl radicals. A linear correlation was observed between the first-order rate constants (k’) for the degradation of gemfibrozil and bezafibrate and increasing chlorine dosage [31]. Conversely, an inverse relationship was found between the k’ values for the degradation of gemfibrozil, bezafibrate, and clofibric acid and pH within the range of 5.0 to 8.4. Despite this, the contribution of reactive chlorine species (RCS) exhibited an upward trend across the investigated pH range. In [43], hydroxyl radicals (OH) and chlorine radicals (Cl) were found to be significant contributors to the degradation of benzoic acid, whereas the involvement of other reactive species, including the dichloride radical (Cl₂) and the superoxide radical (O), was deemed insignificant. The overall rate of benzoic acid (BA) degradation diminished as the pH ascended from 6 to 9 [43]. Notably, the relative contributions of HO and Cl to the degradation process shifted from 34.7% and 65.3%, respectively, at pH 6 to 37.9% and 62%, respectively, at pH 9 under the experimental conditions considered. Deng et al. [44] examined the degradation of Ciprofloxacin (CIP) using the UV/chlorine process. Over 30 min, UV photolysis and dark chlorination achieved only 41.2% and 30.5% CIP degradation, respectively. In contrast, the synergistic UV/chlorine process resulted in a significantly enhanced CIP removal of 98.5% within 9 min. Under neutral aqueous conditions, Ciprofloxacin exhibited the highest pseudo-first-order reaction rate constants for degradation. Among the reactive species involved, eaq was the primary contributor, followed by Cl, HO, and UV photolysis.
Comprehending the generation of reactive species is essential for the efficient application of chlorine photolysis in water treatment. The distribution of reactive oxidants in a UV/chlorine system is mostly determined by the pollutant’s reactivity with the produced species as well as processing variables including chlorine dose, solution pH, and irradiation wavelength. To assess the contributions of OH, RCS, and other oxidants to pollutant degradation, an innovative approach has been developed. This method combines specific radical quenchers with a free radical kinetics model, enabling the determination of the profiles of different species after model validation through experimental quenching tests. Utilizing this technique, Djaballah et al. [45] analyzed the distribution of key free radicals involved in the degradation of reactive green 12 at 254 nm, with varying solution pH and chlorine dosages. Their findings indicated that OH was the predominant oxidant, as determined using the quenchers technique. Bulman et al. [5] employed the same combination approach to study the generation of reactive oxidants during chlorine photolysis across different irradiation wavelengths (254, 311, and 365 nm) and pH levels (6.0–10.0). Nitrobenzene, cinnamic acid, and benzoate were selected as probe chemicals for hydroxyl radicals, RCS, and ozone. According to the study, steady-state concentrations of OH and Cl were higher in acidic conditions under 254 or 311 nm radiation, while ozone levels peaked at 254 nm radiation in alkaline conditions. Because of the greater molar absorptivity of hypochlorite under high-wavelength irradiation, the chlorine decay rate constants increased with pH. The scientists came to the conclusion that kinetic modeling is an effective method for investigating the processes of radicals photochemistry in the UV/chlorine process. However, both of the aforementioned studies utilized UV light sources, and no similar approach has been applied to quantify free radical generation and utilization in solar-activated chlorine, particularly focusing on hypochlorite. The investigation of this approach—utilizing solar light under highly basic conditions—is of paramount importance compared to other light sources. This is due to its potential to reduce future operating costs of this technique (UV/chlorine) by (i) harnessing sunlight (simulated here by a solar light simulator), a renewable energy source, and (ii) its adaptability to the basic pH levels commonly found in industrial effluents.
Therefore, this study aims to investigate the solar-activated hypochlorite degradation of Rhodamine B (RhB) through detailed kinetic modeling, providing insights into the roles of reactive oxygen species (ROS) and reactive chlorine species (RCS) in the degradation process. The kinetic modeling facilitated the determination of key rate constants for both radical and non-radical pathways of hypochlorite and the oxidation of RhB by free radicals. Using COPASI® software, which was fed with a kinetic mechanism involving 144 chemical reactions, the free radical kinetic model was tested under various conditions, including temperatures ranging from 25 to 55 °C and initial hypochlorite concentrations from 300 to 1000 µM, at a controlled pH of 11. RhB was chosen as the pollutant model for several reasons: (i) it is a common dye pollutant whose degradation has been widely studied in the literature [46,47,48], (ii) the reaction rate constants of RhB with OH and O3 are available, reducing the number of unknown parameters in the reaction kinetics model, and (iii) its reaction with chlorine is negligible in basic medium where ClO predominates, allowing for a purely free radical reaction mechanism.

2. Experimental and Modeling Package

2.1. Reagents and Setup Specifications

Rhodamine B (RhB; C28H31N2O3Cl; MW: 479.01 g/mol) was sourced from Sigma-Aldrich. NaOCl solution with approximately 16% accessible chlorine was supplied by Henkel-Algeria. Tert-butanol, benzoic acid, NaOH, and H2SO4 were purchased from Sigma-Aldrich and were of the highest purity grade available. All reagent solutions were prepared in distilled water.
Reference [49] contains comprehensive details on the experimental setup, including specifications and descriptions. A 250 mL Pyrex glass reactor with a water jacket was part of the arrangement, and it was housed within a Suntest CPS+ simulator from Atlas. This simulator ran at 500 W of radiation intensity using a Xe arc lamp whose emission range was limited to 280–800 nm. About 0.5% of the photons released by the lamp were in the wavelength range of less than 300 nm, and about 7% were in the range of 300 to 400 nm. The emission spectrum from 400 to 800 nm was similar to that of sunlight. The solution’s surface and the light source were maintained at a constant distance. A thermocouple submerged in the reaction mixture was used to measure the temperature during the experiments, which were carried out between 25 and 55 °C. Water from a controlling bath (RC6 Lauda) was circulated through the reactor jacket to regulate the temperature. Using a Jenway 3505 pH meter, the pH of the solution was monitored during the process. A magnetic stirrer set at 300 rpm was used to constantly mix the 200 mL of irradiation RhB solution. Samples were taken periodically to measure the dye absorbance at λmax = 551 nm using a UV-Visible spectrophotometer (Jasco V-730). Each experiment was conducted in triplicate, and the mean values, along with error bars, were reported in the figures.

2.2. Kinetic Model, Simulator, and Computational Approach

Table 1 summarizes the 144 chemical reactions used to study the degradation kinetics of RhB. This scheme includes the initial constituents (HOCl/ClO, RhB, H2O, O2, H+ and OH), various reactive radicals (Cl, ClO, OH, ClOH•−, Cl2•−, HO2, O2•−, O3•−), several non-radical intermediates/products (O3, ClO2, ClO3, H2O2, HO2, and Cl2O2), and the reactions of free radicals and oxidants with RhB and scavengers such as tert-butyl alcohol (TBA) or benzoic acid (BA). The chemical reactions and their rate constants were sourced from various specialized references (as noted in Table 1), except for the rate constants for Reactions R1-R3, R125 and R127-R133, which were determined in this study.
The kinetic modeling of RhB degradation, based on the reactions outlined in Table 1, was carried out using the open-source COPASI® kinetic simulation software. This robust tool enables the determination of concentration-time profiles for all species involved in the reaction scheme. It simultaneously optimizes multiple unknown reaction rate constants to achieve the best fit for the degradation curve of the micropollutant [45,50]. In this study, the Nelder-Mead Simplex deterministic method, provided by the software, was selected for optimizing the unknown reaction rate constants (R1–R3, R125 and R127–R133).
The software’s input parameters comprise the starting concentrations of the following species: ClO, RhB, O2, H2O, OH, H+, and scavengers (TBA or BA), as well as the reaction scheme from Table 1 and their corresponding rate constants. Following that, the simulator generates concentration profiles for every species over the course of the oxidation period. The experimental degradation profile of RhB over time was fed into the software in order to derive the unknown rate constants, which included those for ClO photolysis (Reactions R1–R3) and the reactions of RhB with other reactive species (Reactions R125 and R127–R133). This profile was adjusted by optimizing the unknown rate constants as parameters.

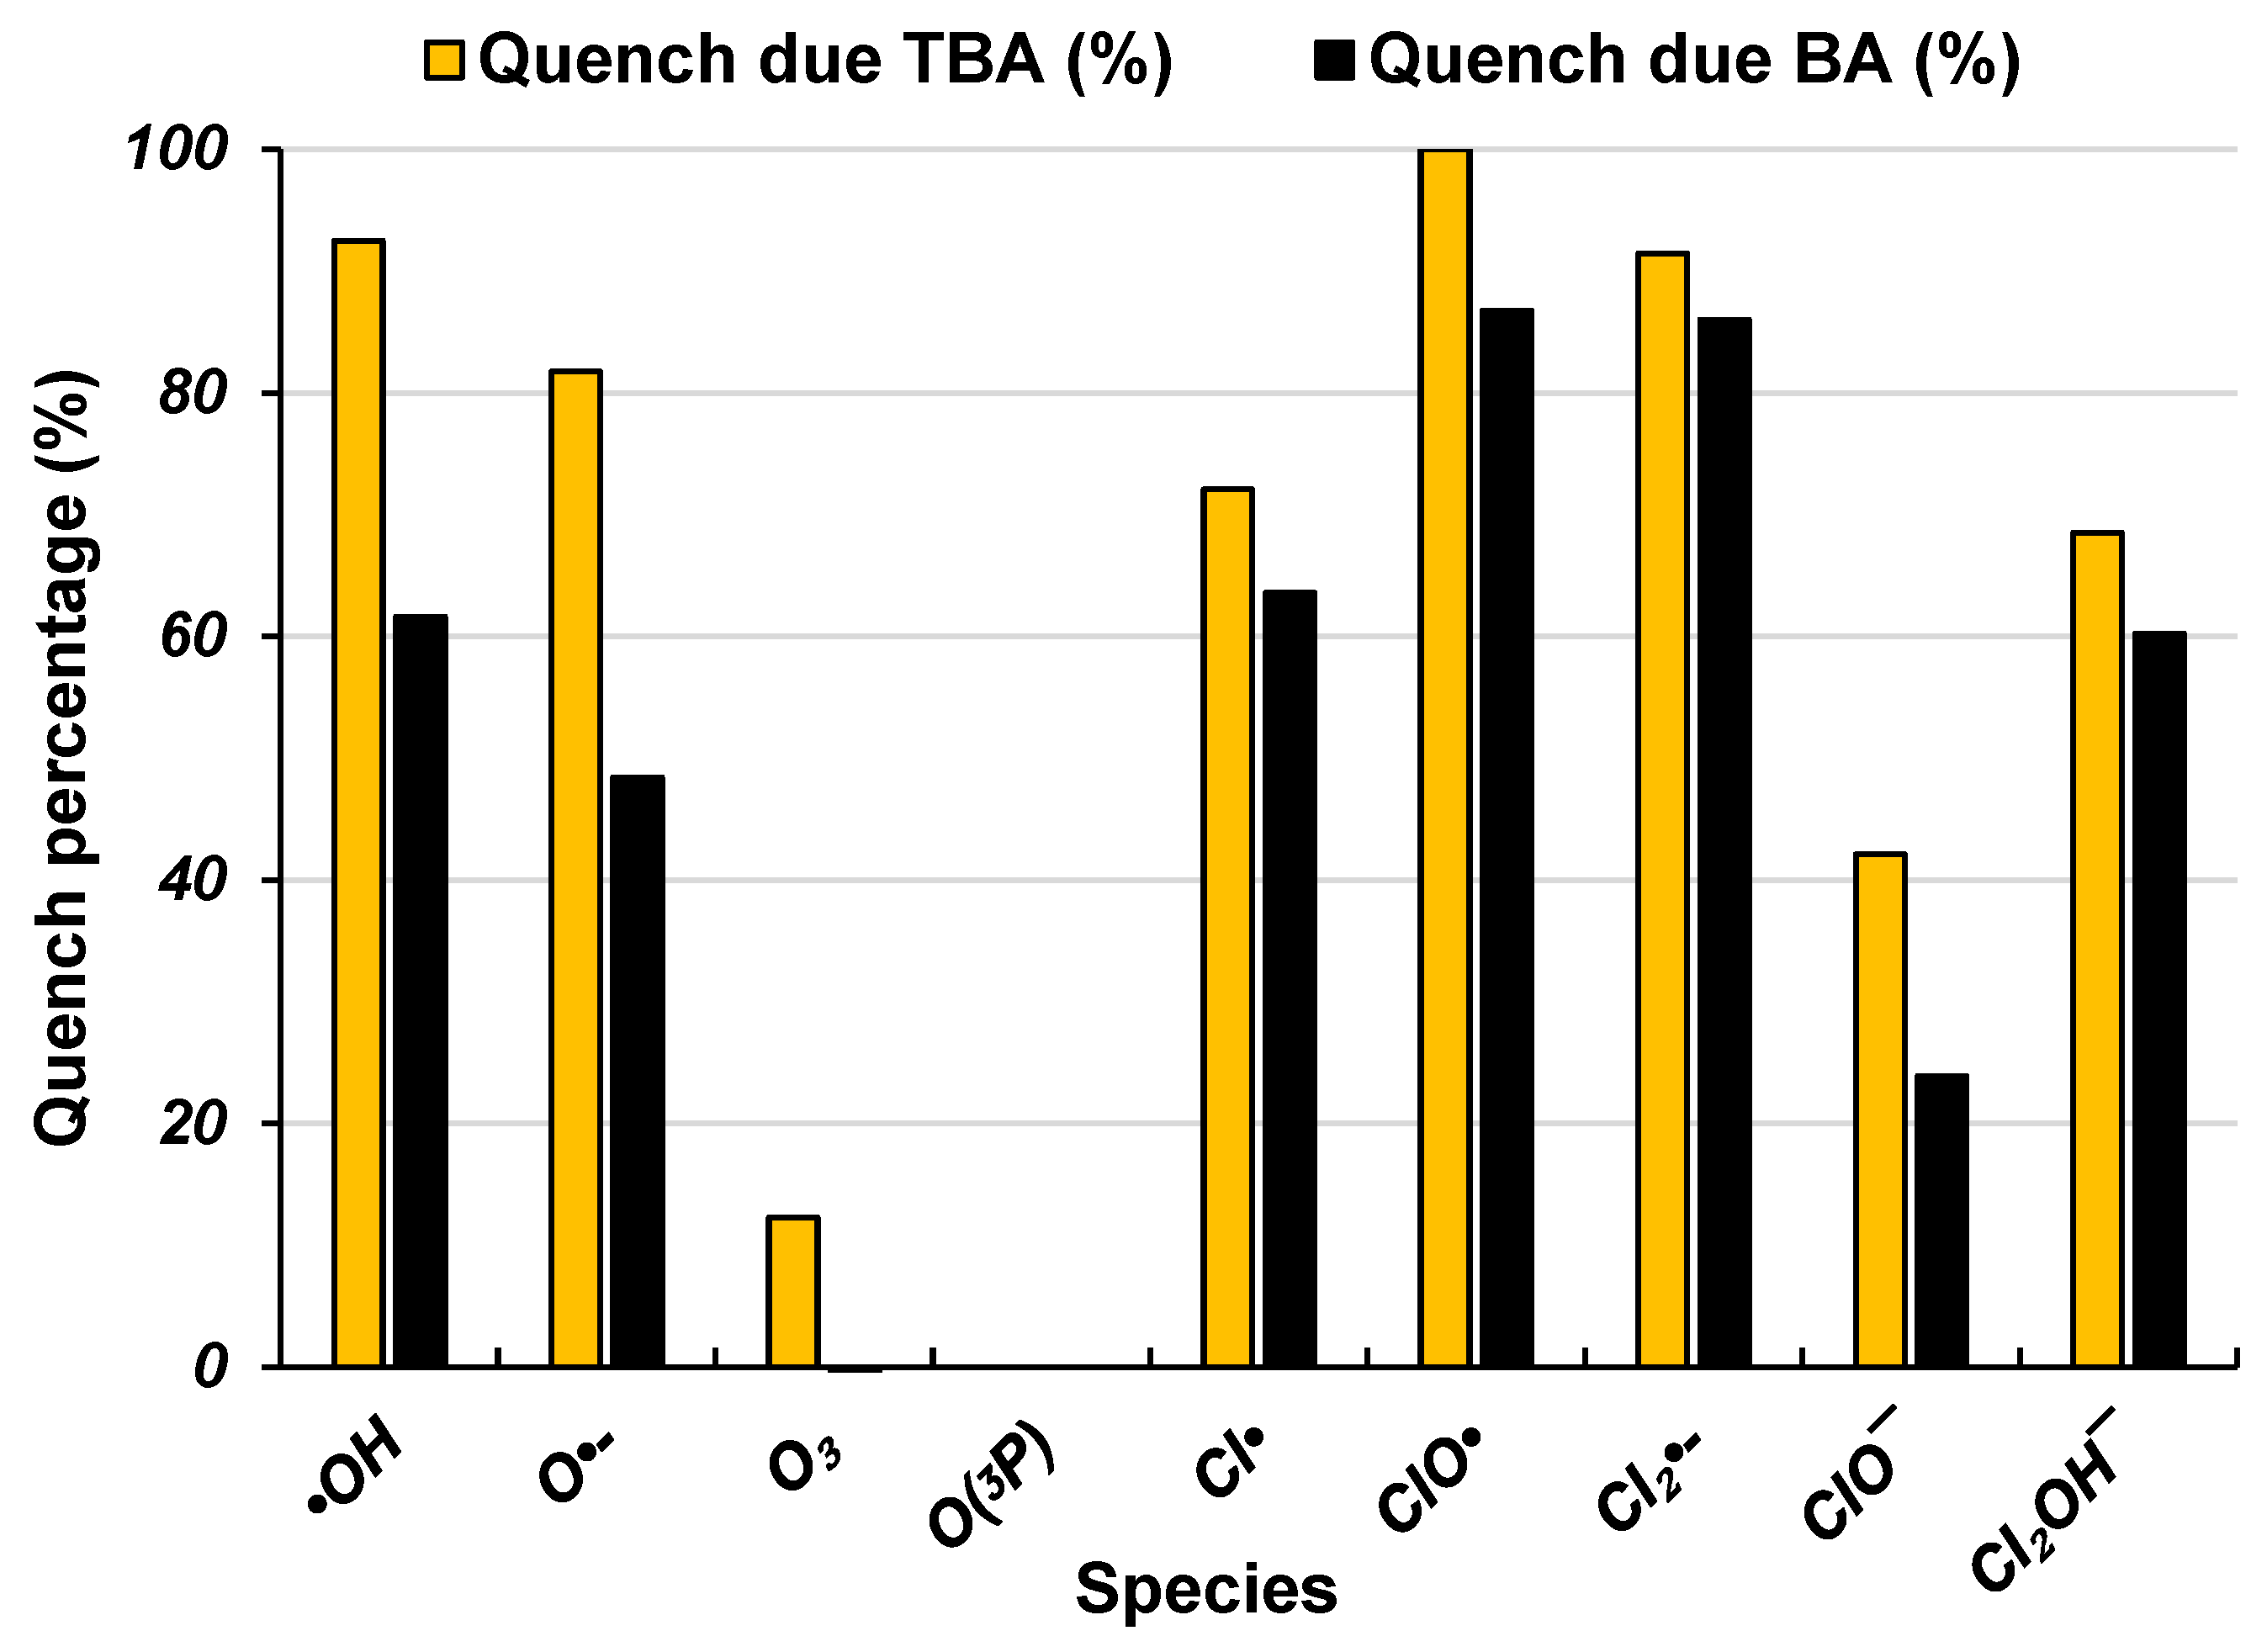
2.3. Reactive Species Contribution

The contribution of each reactive species (RS: OH, O•−, O(3P), Cl, ClO, Cl2•−, O3, etc.) to the overall degradation rate of the micropollutant was quantified by calculating their selectivity. This is given by:
S R C / R h B = r R C - p r o d r R h B
Here, (−rRhB) is the rate at which RhB disappears, and (rRC-prod) is the rate at which the organic product forms due to the direct reaction of each specific reactive species (RC) with RhB. Both rates were quantified (from the optimized profiles) during the initial progress of the reaction. The selectivity approach enables an assessment of the impact of each reactive species on the degradation process, providing a clear understanding of their relative contributions during the early stages of the reaction.

3. Results and Discussion

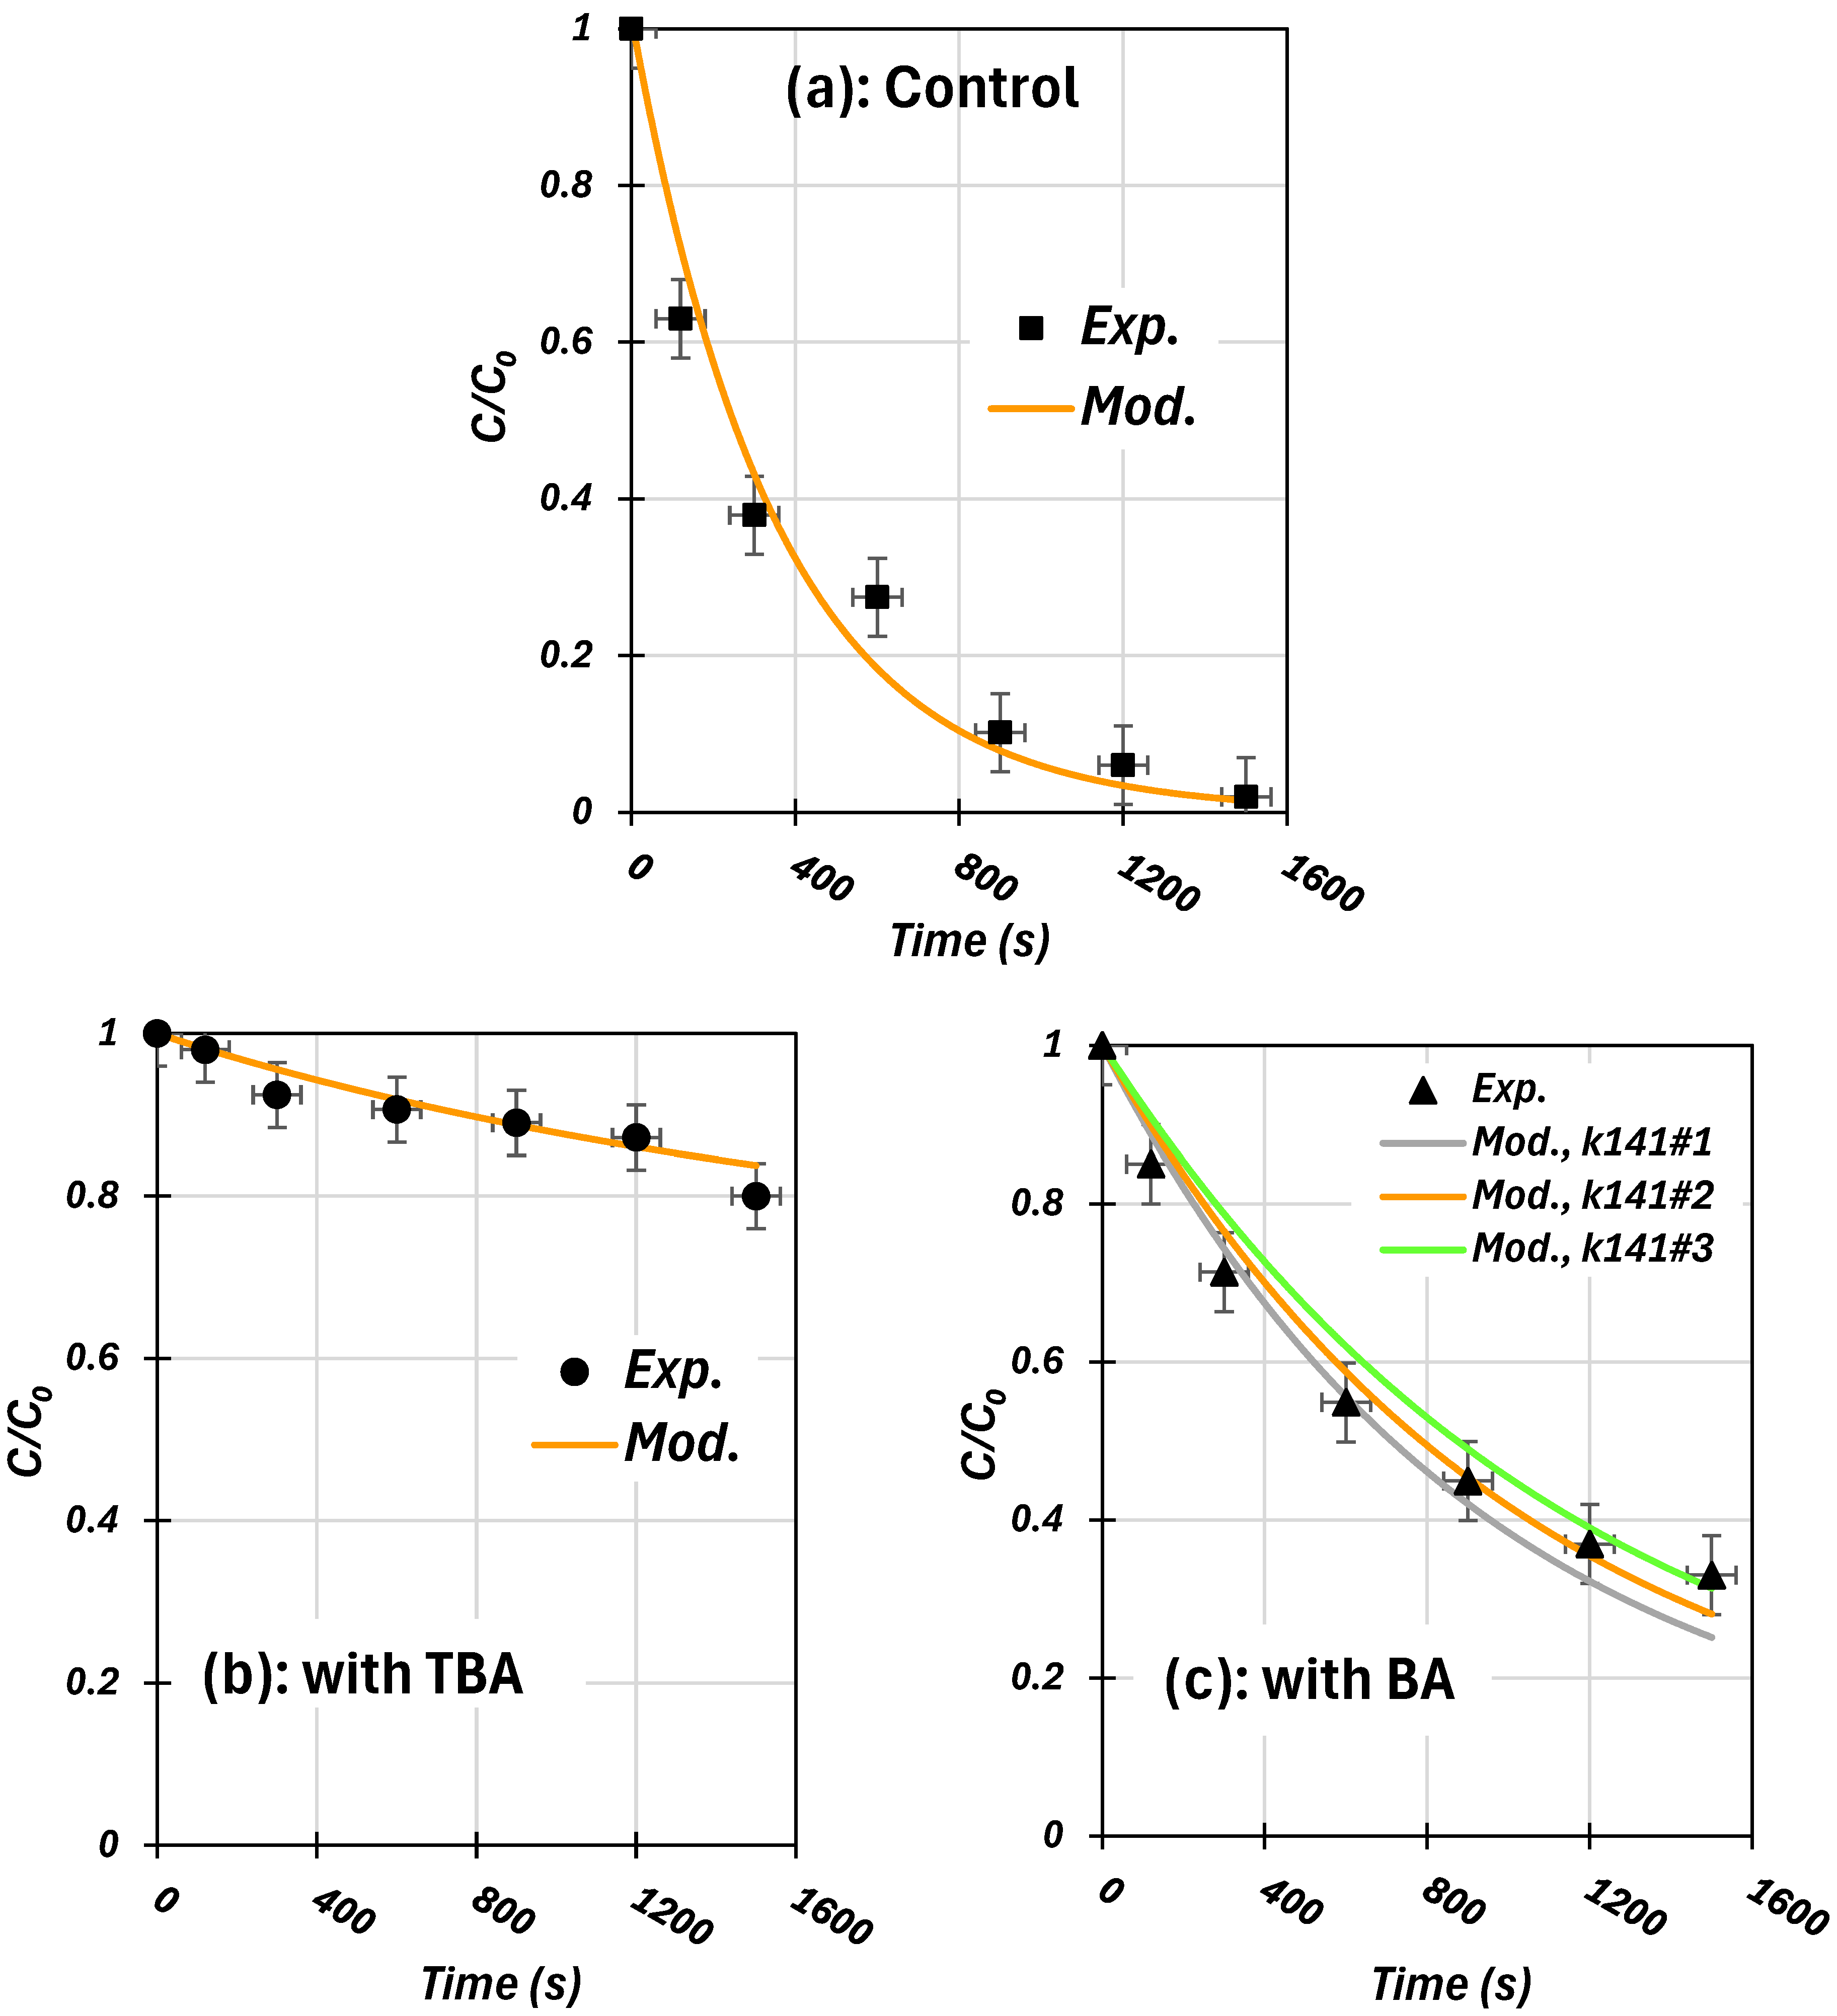
3.1. Validated RhB Degradation Kinetics Using Scavenger Tests

Figure 1a–c compare the experimental and simulated (using the model from Table 1) photodegradation profiles of RhB (C0 = 10 µM) at pH 11 in the presence of ClO (1000 µM) and either tert-butyl alcohol (TBA: 100 mM) or benzoic acid (BA: 10 mM), which act as specific radical scavengers. As shown in Figure 1a, the degradation of RhB rapidly diminished (exponentially) over time in the UV/ClO system. In contrast, no change in dye concentration was observed when subjected to either chlorination (1000 µM) or solar lighting separately. This demonstrates that the combined action of chlorine and solar illumination in the Sun Test model results in a fully synergistic treatment. The free radical-oxidation mechanism is the primary pathway responsible for the observed synergism in RhB degradation during the UV/ClO photo-assisted treatment at pH 11. This conclusion was supported by the addition of TBA and BA, which significantly slowed down RhB decomposition, as illustrated in Figure 1b,c.
Moreover, it is evident from Figure 1a–c that the kinetic model accurately matches the experimental degradation profiles, both in the absence and presence of TBA or BA. Notably, the reaction rate constant for BA with the ClO at a basic medium (k141 in Table 1) is reported to be less than 3 × 10⁶ M−1s−1 [42,51] (this reaction rate constant is much lower (7.26 × 10³ [52] and 3.13 × 10³ M−1 s−1 [53]) at an acidic pH). Therefore, the fitting process in Figure 1c was conducted using three different values for k141: 1 × 10⁵, 2 × 10⁵, and 1 × 10⁶ M−1s−1. Although all three values provided a good fit between the experimental and predicted profiles, the best among them was observed with k141 set at 2 × 10⁵ M−1s−1 (Figure 1c).
The observed RhB degradation rate constant from the experimental profiles in the control run is kobs = 3 × 10⁻³ s−1 (R² = 0.9785). However, it decreased to kBA = 8 × 10⁻⁴ s−1 (R² = 0.9816) in the presence of BA and kTBA =1 × 10⁻⁴ s−1 (R² = 0.9305) in the presence of TBA. The predicted values from the modeling profiles closely matched the experimental ones, with 3 × 10⁻³ s−1 for the control run (R² = 1), 9 × 10⁻⁴ s−1 (R² = 0.9997) with BA, and 1 × 10⁻⁴ s−1 (R² = 0.9933) with TBA. The predicted profiles in Figure 1a–c were obtained using optimized specific rate constants for several reactions listed in Table 1, a topic that will be discussed in the subsequent section. However, before delving into that, it is important to estimate the overall contribution of some reactive species in the dye degradation based on the experimental tendency of BA and TBA.
BA (i.e., benzoate form at basic pH) commonly quenches OH/O•− and Cl in a UV/chlorine photoinduced system, with rate constants kBA-•OH = 5.27 × 10⁹ M−1s−1, kBA-O•– = 4 × 10⁷ M−1s−1, and kBA-Cl• = 1.8 × 10¹⁰ M−1s−1 [5]. However, its reactions with ClO and Cl2•− are relatively insignificant, with rate constants kBA-ClO• < 3 × 10⁶ M−1 s−1 [42] and kBA-Cl2•– = 2 × 10⁶ M−1 s−1, respectively [5]. Thus, the contribution of (OH/O•− + Cl) can be estimated based on the retarding impact of BA by using the ratio (kobs-kBA)/kobs, which is calculated as (0.003–0.0008)/0.003 = 0.73. Therefore, the contribution of (OH/O•− + Cl) is approximately 73%.
Similarly, TBA quenches OH/O•−, Cl, and ClO, with rate constants kTBA-•OH = 3.80 × 10⁸ M−1s−1, kTBA-O•- = 5 × 10⁸ M−1s−1, kTBA-Cl• = 3 × 10⁸ M−1s−1, and kTBA- ClO• = 1.30 × 10⁷ M−1s−1 [39,54]. However, TBA reacts insignificantly with Cl2•− and ozone, with rate constants k kTBA- Cl2•− = 700 M−1s−1 [39,54] and kTBA- O3 = 0.03 M−1 s−1 [41]. The contribution of (OH/O•− + Cl + ClO) can be estimated using the ratio (kobs-kTBA)/kobs, which is calculated as (0.003–0.0001)/0.003 = 0.966 (96.6%). Thus, the contribution of ClO can be estimated as 96.6%–73% = 23.6%. The specific contributions of other radicals and oxidants are difficult to estimate experimentally due to the lack of specific quenchers, but these contributions will be predicted based on the best fitting provided by the model.

3.2. Determination of Unknown Rate Constants

The created free-radicals model correctly predicted RhB degradation profile under a variety of circumstances, as was covered in the previous section (Figure 1). The software’s Nelder-Mead optimization technique was used to identify the unknown rate constants by finding the best match to the experimental data (Figure 1a). At pH 11 and around 25 °C, the starting hypochlorite concentration of 1000 µM yields the following rate constants for the photolysis of ClO through various pathways: kR1 = 2.67 × 10⁻⁴ s−1 for R1: ClO  h ν O•− + Cl, kR2 = 1.88 × 10⁻⁵ s−1 for R2: ClO  h ν O(3P) + Cl and kR3 = 0 s−1 for R3: ClO  h ν O(1D) + Cl. These results indicate that the radical pathway (R1) of ClO photolysis under solar light irradiation is more favorable than the non-radical pathways (R2 and R3), though this is specific to the current simulation conditions (1000 µM chlorine, pH 11 and 25 °C). This is because the activation pathway of chlorine can be influenced by various operating conditions, such as medium temperature, pH level, chlorine dose, and the presence of a catalyst. As a result, the following sections investigate these activation possibilities under different chlorine concentrations and solution temperatures to evaluate their significance within the overall mechanism, specifically the abatement of hypochlorite and the contributions of ROS (Reactive Oxygen Species) and RCS. It should be indicated that these rate constants (kR1, kR2, and kR3) align well with the quantum yields determined by Buxton and Subhani [55] at 313 nm: Φ (R1) = 0.127, Φ (R2) = 0.075 and Φ (R3) = 0.02. At 356 nm, the quantum yield for R3 is effectively zero [55]. It is important to note that the photolysis of H2O2, HO2, and O3 are not included in the reaction scheme because they are produced in lower concentrations and their molar absorptivity is negligible between 300 and 400 nm [5]. Additionally, at pH 11, ClO is the sole chlorine species in the solution, so photolytic reactions of hypochlorous acid are not significant. At 254 nm irradiation light (pH 9), Djaballah et al. [45] reported a rate constant of ~9 × 10⁻³ s−1 for R2. The discrepancy between our value and Djaballah et al.’s was attributed to the higher energy (E = hC/λ) of the 254 nm irradiation light compared to our solar system, which includes only about 0.5% UV light < 300 nm and 7% between 300 and 400 nm (with lower intensity). Additionally, the Φ254 (R2) = 0.278 [15] is much higher than the Φ365 (R2) = 0.08 [15]. The single rate constants for the photolysis of S2O82− and H2O2 at 254 nm irradiation was found to be 1.5 × 10⁻⁵ s−1 [56] and 1.16 × 10⁻⁵ s−1 [57]. As a result, our fitted values (both R1 and R2) for hypochlorite photolysis are higher than those for H2O2 and S2O82−. This makes sense, because the molar absorption coefficient of ClO is higher than that of H2O2 and S2O82− (at 254 nm, εClO = 66.0 M−1 cm−1 [58] compared to 19.0 M−1 cm−1 for H2O2 and 47.50 M−1 cm−1 for S2O82− [43]).
The rate constants for the reactions of RhB with OH and O3 have been experimentally determined to be kR124 = 2.5 × 10¹⁰ M−1 s−1 [33] and kR126 = 2450 M−1 s−1 [38], respectively. In contrast, the rate constants for the reactions of RhB with O•−, Cl, Cl2•− and ClO were predicted to be kR125 = 4.8 × 10⁹ M−1 s−1, kR127 = 1.45 × 10⁹ M−1 s−1, k129 = 2.5 × 10⁷ M−1 s−1 and k128 = 8.7 × 10⁴ M−1 s−1 (Table 1). Additionally, lower rate constants were predicted for the reactions of RhB with HOCl•−, HO2, O2•−, and O(3P), with kR130 = 4.1 × 10⁴ M−1 s−1, kR131 = 7.3 × 10⁵ M−1 s−1, kR132 = 3.6 × 10⁴ M−1 s−1, and kR133 = 0.40 M−1 s−1, respectively (Table 1). These predicted values align with those reported for various organic pollutants, including dyes. The reactivity of O(3P) with chlorazol black was found to be negligible [45], while the reactions of HOCl•−, HO2, and O2•− with dyes are often negligible as well [30,45,59]. Measurements show that Cl is highly reactive towards organic aromatic solutes, such as toluene (k =1.80 × 10¹⁰ M−1 s−1), chlorobenzene (k = 1.80 × 10¹⁰ M−1 s−1) and benzoic acid (k = 1.80 × 10¹⁰ M−1 s−1). Furthermore, Cl2•− reacts with acid orange 7 azo at k = 3.65 × 10⁷ M−1 s−1 [56]; however, other values such as k = 2.50 × 10⁸, 2.80 × 10⁸ and 3.0 × 10⁶ M−1 s−1 were reported for phenol, p-hydroxybenzoic acid, and p-chlorobenzoic acid, respectively [15].
It is important to note that in the subsequent sections when the effects of solution temperature and initial concentrations of chlorine and RhB are examined, only the rate constants kR1 and kR2 (corresponding to the radical and non-radical photolysis pathways of ClO) will be optimized based on the experimental profiles. The rate constants for RhB’s reactions with radicals (Reactions R125 and R127–R133 in Table 1) will remain unchanged.

3.3. Concentration Profiles of ClO, Reactive Species and Degradation Products

3.3.1. Control Conditions (without Scavengers)

Figure 2 presents the simulated concentration profiles of the various reactants, reactive species, and reaction products in the RhB-hypochlorite photoactivated (solar) system, using the same fitting conditions as in Figure 1a. As depicted in Figure 2a–d, the depletion of ClO and RhB leads to the substantial formation of Cl2OH (Figure 2a), a transient increase in reactive oxygen and chlorine species (ROS/RCS) (Figure 2b,c), and a high level of RhB degradation by-products (Figure 2d). The concentration of Cl2OH increases over time, becoming the predominant hypochlorite photolysis by-product, while HOCl is initially produced at a lower yield, reaching a steady concentration of 1.89 × 10⁻⁵ M before being quickly consumed. After 100 s, Cl2OH ions attain a concentration of 5.97 × 10⁻⁵ M, compared to 1.58 × 10⁻⁵ M for HOCl (Figure 2a). In contrast, other species such as ClO2, ClO3, H2O2, HCl, Cl, and Cl2O2 are produced in negligible concentrations (Figure 2a).
Figure 2c,d illustrate the presence of reactive oxygen species (ROS) and reactive chlorine species (RCS) in the system. The ROS include O3, OH, O●−, and O(3P), while the RCS are ClO, Cl, and Cl2●−. Other ROS and RCS, such as O2●−, HO2, Cl2, ClO2, and HOCl●−, were generated in negligible amounts. As shown in Figure 2c,d, the steady-state concentrations of OH, O●−, and Cl reached 7.54 × 10⁻¹⁴, 1.22 × 10⁻¹⁴, and 1.38 × 10⁻¹⁴ M, respectively, with ratios [OH]ss/[O●−]ss = 6.18 and [OH]ss/[Cl]ss = 5.45. Cl2●− and O(3P) achieved lower steady-state concentrations of 3.69 × 10⁻¹⁶ and 1.73 × 10⁻¹⁵ M, respectively. In contrast, ClO and O3 were produced in significantly higher concentrations, with [ClO]ss = 9.95 × 10⁻⁹ M and [O3]ss = 4.96 × 10⁻⁹ M, resulting in [ClO]ss/[Cl]ss and [O3]ss/[OH]ss ratios of 7.19 × 10⁵ and 6.59 × 10⁴, respectively. The high concentration of ClO can be attributed to the rapid reaction of initially formed radicals (OH and Cl) with hypochlorite, which is in excess at the early stages of the reaction, as described by Reactions R30 and R44 in Table 1. The significant formation of O3 is due to the high yield of O(3P) from reaction R2 (ClO → O(3P) + Cl, kR2 = 1.88 × 10⁻⁵ s−1) and the subsequent fast reaction of O(3P) with dissolved O2 to produce O3 (R5, kR5 = 4 × 10⁹ M−1 s−1). Notably, O3 concentration continues to rise over time, reaching 1.31 × 10⁻⁸ M at t = 800 s, owing to the ongoing release of O(3P) via reaction R2, as hypochlorite levels remain high even at t = 800 s (Figure 2a). It is essential to mention that the high levels of O3 and ClO do not necessarily indicate their dominant role in RhB degradation, as the degradation rate is determined by the concentrations of reactive species (RS) and RhB, as well as their reaction rate constants, ri = kRS-RhB[RS][RhB], which will be discussed later.
From Figure 2b, it can be observed that the concentration profiles of OH-prod and ClO-prod increased over time as primary RhB by-products, with a slight presence of O●−-prod also noted. No other RC-RhB by-products were formed. The initial stage of these profiles is of particular interest, as by-products become competitors for radical consumption after prolonged irradiation (the reaction model based on Table 1 did not account for this scenario). At the early stages of the reaction (before attaining t1/2 [50]-), the reactions between the target dye (RhB) and radicals predominate (by-product levels remain low), thus enabling the assessment of each radical’s contribution to RhB degradation using Equation (1). This equation yielded contributions of 67%, 2.1%, and 29.6% for OH, O●−, and ClO, respectively, in the overall degradation rate of RhB in the chlorine-photoassisted process. The contributions of all other reactive species (including O3, Cl, Cl2●−, HO2, O2●−, O(3P), and ClOH●−) under the given simulation conditions are negligible, although their contributions may change with operational conditions, such as the initial dosage of hypochlorite, as will be discussed in the subsequent sections.
In Section 3.1, the final two paragraphs discuss probing tests with TBA and BA, which indicate an estimated contribution of 23.6% for ClO and 73% for the combined effects of (OH/O●− + Cl). Although these values align with the predictions made in this section (67% for OH, 2.1% for O●−, and 29.6% for ClO), the numerical simulations provide a more precise determination of the specific contributions of each radical species, highlighting no contribution from Cl and a dominant role for OH over O●−. Despite the photolysis being conducted at pH 11, where the pKa of OH is 11.8, the hydroxyl radical speciation still favors the OH form, with an 86.3% dominance over the 13.6% presence of O●−.
Regardless, as previously mentioned, the RhB degradation rate is determined by the concentrations of reactive species (RS) and RhB, as well as their reaction rate constants, ri = kRS-RhB[RS][RhB]. Therefore, even though O3 and ClO have higher concentrations in the solution, their contributions are lower than that of OH, primarily due to the significantly higher rate constant between RhB and OH (2.5 × 10¹⁰ M−1 s−1) compared to those of RhB with O3 (2450 M−1 s−1) and ClO (8.70 × 10⁴ M−1 s−1). A similar interpretation applies to the null contributions of Cl, Cl2●−, HOCl●−, HO2, O2●−, and O(3P), considering both the lower concentrations of these radicals (Figure 2b,c) and their much lower rate constants with RhB (R127, R129-R132 of Table 1) compared to those related to OH.

3.3.2. UVsolar/ClO/TBA and UVsolar/ClO/BA Systems

Figure 3 and Figure 4 illustrate the simulated concentration profiles of various reactants, reactive species, and reaction products in the RhB-hypochlorite photoactivated system when TBA and BA are present, respectively (under the same conditions as in Figure 1b,c). The addition of TBA and BA resulted in a significant decrease in the steady-state concentration of OH to 5.65 × 10⁻¹⁵ M and 2.89 × 10⁻¹⁴ M, representing reductions of 92.5% and 61.6%, respectively. The corresponding quenching effects on the key species in the reaction system are depicted in Figure 5. The quenching data provided in Figure 5 reveal substantial insights into the effects of TBA and BA on various reactive species within the RhB-hypochlorite photolysis system. The significant quenching percentages illustrate the direct or indirect interactions of these scavengers on different species. For the hydroxyl radical (OH), TBA exhibited a quenching effect of 92.50%, highlighting its high reactivity with hydroxyl radicals and effectiveness as a scavenger. In comparison, BA also significantly quenched OH, but to a lesser extent at 61.59%, indicating that while effective (kR143 = 5.27 × 10⁹ M−1s−1), it is not as potent as TBA (kR137 = 3.80 × 10⁸ M−1s−1). This is due to the fact that we used a higher initial concentration of TBA (100 mM) compared to BA (1 mM) for solubility reasons.
The superoxide radical anion (O•−) showed a similar trend, with TBA quenching 81.75% of O•−, thus demonstrating TBA’s substantial impact. BA, on the other hand, reduced O•− concentration by 48.41%, which is still significant but comparatively lower than the effect of TBA. For ozone (O₃), TBA caused a 12.28% reduction, suggesting that TBA slightly affects ozone formation (kR141 = 0.003 M−1s−1). Conversely, BA exhibited null quenching due to the negligible reaction between O3 and BA. Interestingly, both TBA and BA had no effect on ground-state atomic oxygen (O(3P)), with 0% quenching for both. This implies that neither TBA nor BA interacts significantly with O(3P) and that this species did not play a major role in the reactive system under study.
Chlorine radical (Cl) quenching was substantial with both TBA and BA. TBA reduced Cl concentration by 72.09%, while BA achieved a slightly lower quenching effect of 63.57%, indicating strong but differential interactions with Cl. For the chlorine oxide radical (ClO), TBA was extremely effective, achieving 100% quenching, thus completely scavenging this species due to the effective quenching of Cl and OH, which are precursors of ClO (R33 and R44 of Table 1). BA also had a strong effect, with an 86.76% quenching rate, though it was slightly less effective than TBA. The quenching of the chlorine dioxide radical anion (Cl₂•−) was also high, with TBA achieving 91.46% and BA 85.99%, indicating that both agents effectively reduce the concentration of this radical. This is attributed to the efficient scavenging effect of both TBA and BA on the precursor of Cl₂•−, which is Cl (R134 and R140 in Table 1).
The hypochlorite ion (ClO¯) experienced a moderate quenching effect from TBA at 42.11%, while BA’s effect was lower at 23.89%, suggesting a less pronounced but still significant interaction. This is related to the direct impact of TBA and BA on quenching reacting radicals with ClO¯, as exemplified in reactions R134 and R140 in Table 1. Finally, for the dichlorine monoxide anion (Cl₂OH¯), TBA caused a 68.53% reduction, while BA resulted in a 60.21% reduction, highlighting their substantial but differential impacts on this species.

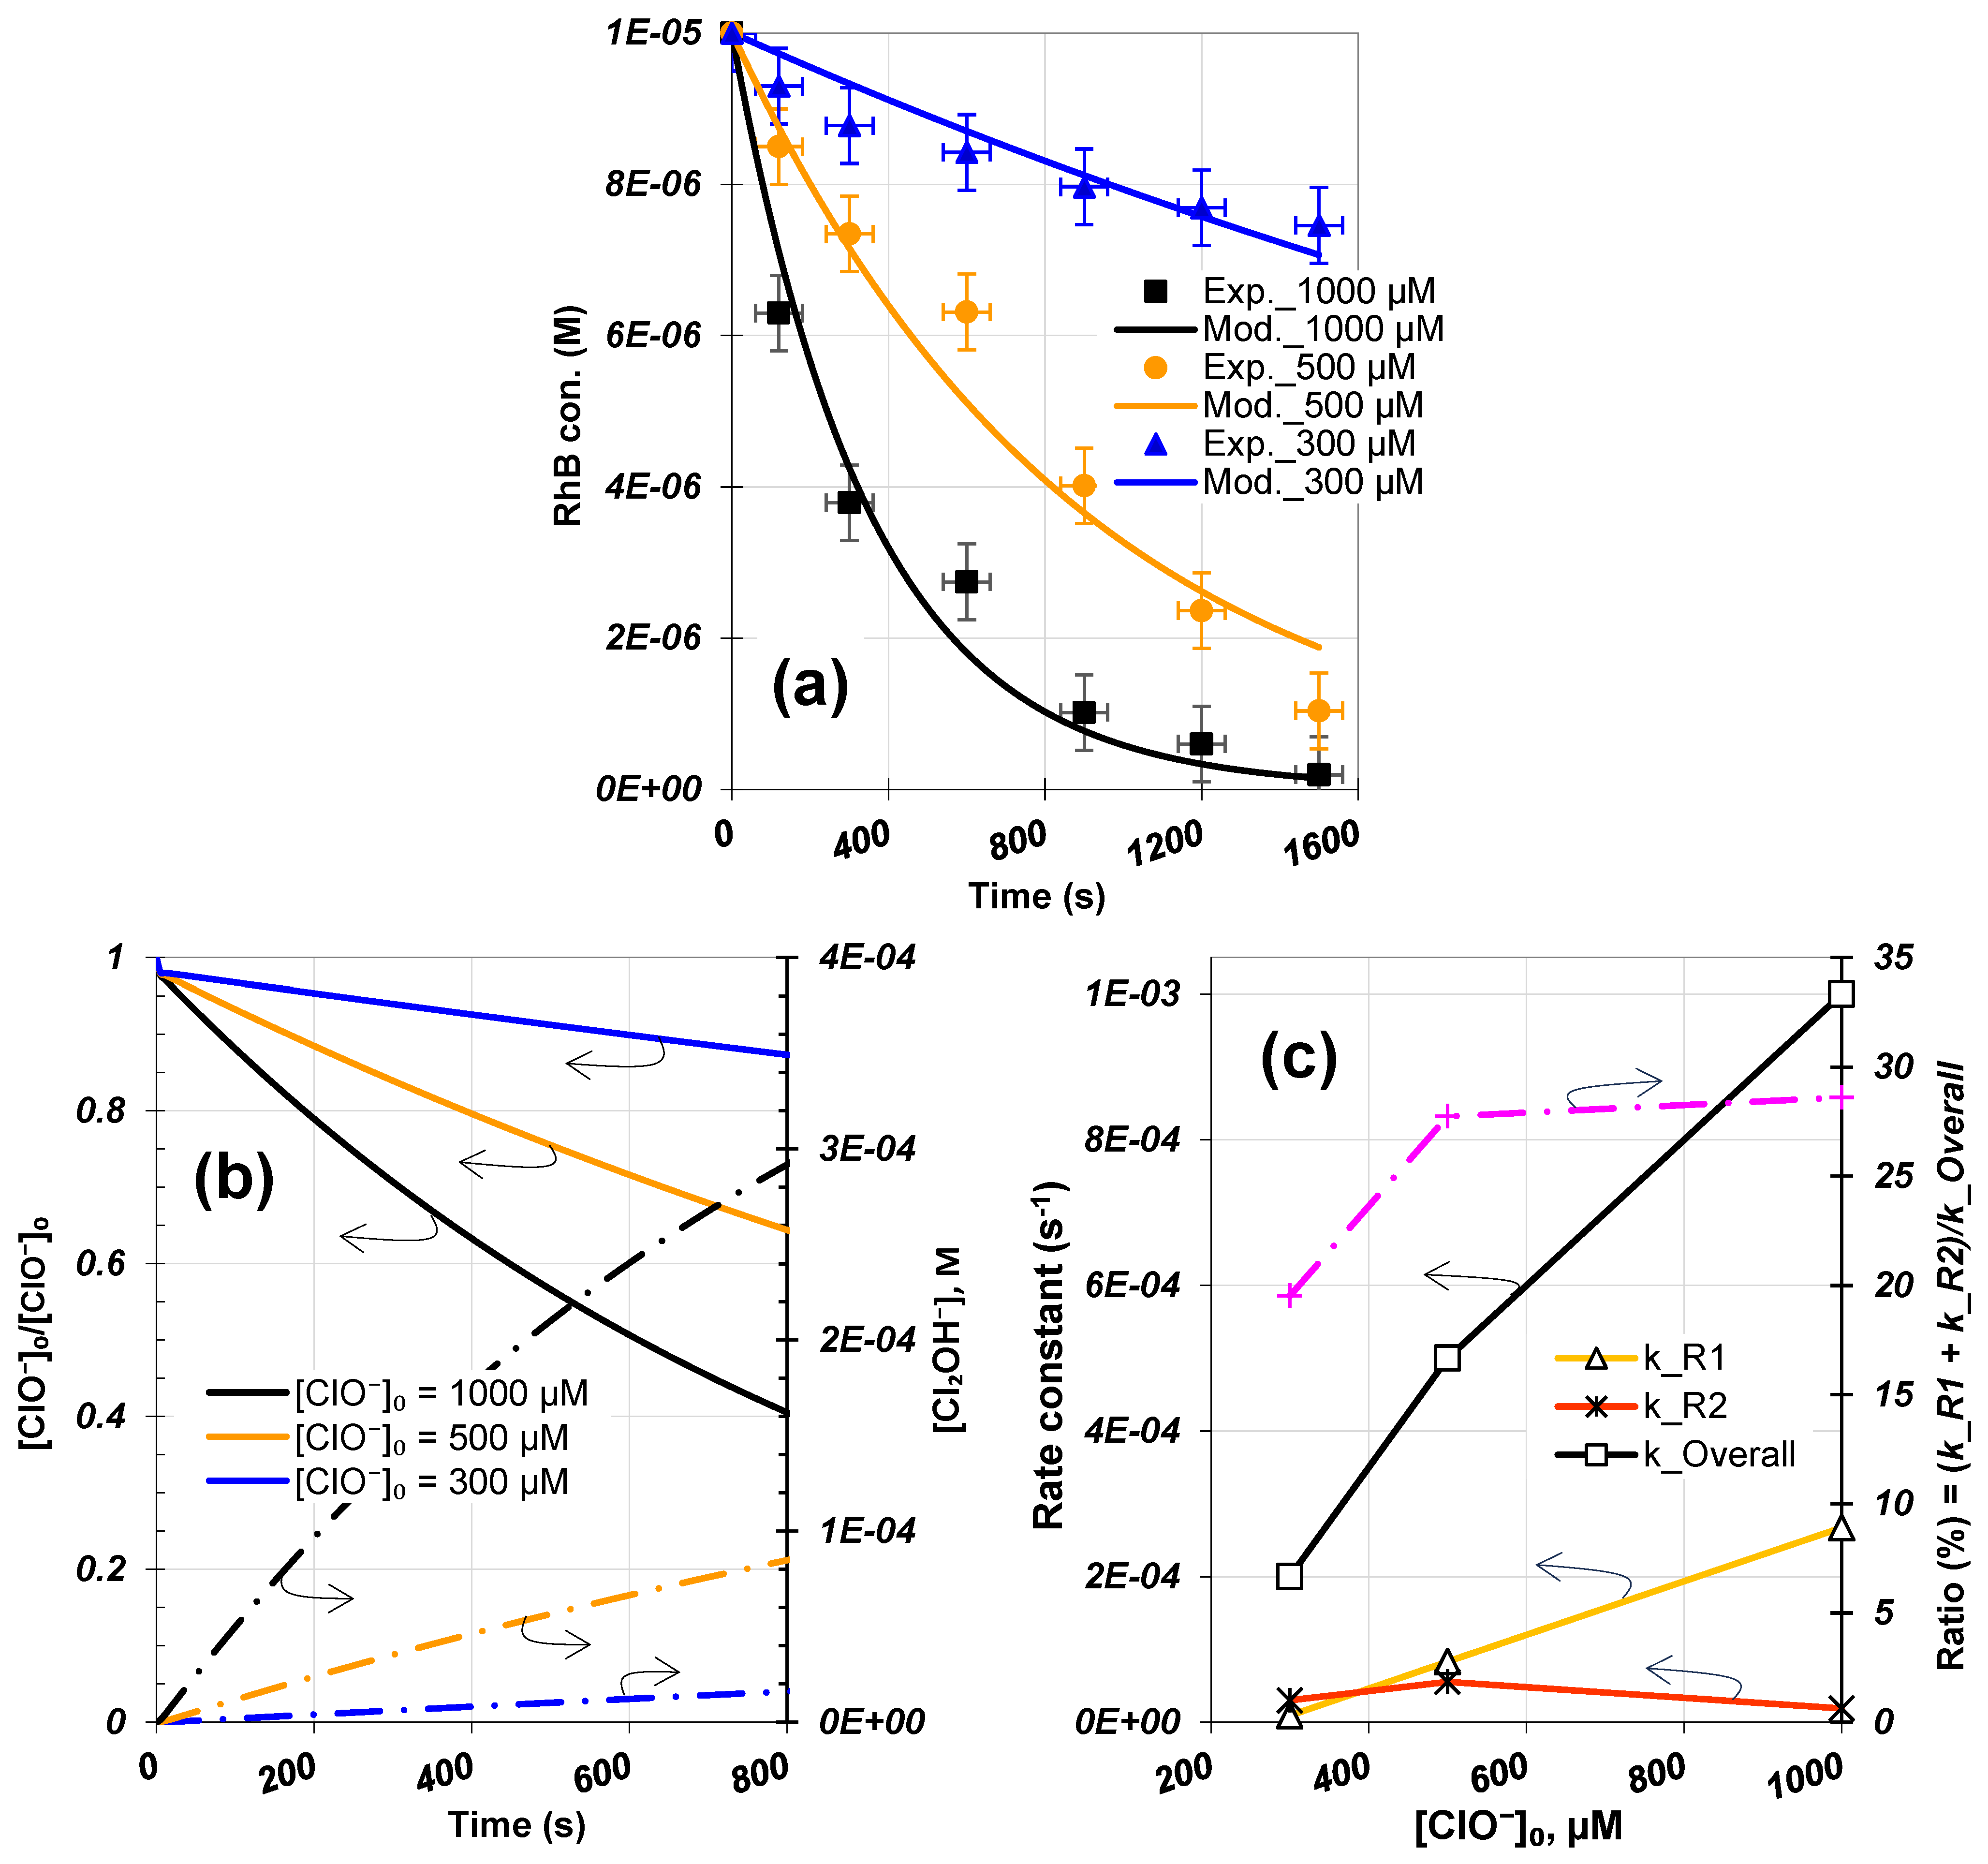
3.4. Analysis of Initial Hypochlorite Dosage

3.4.1. RhB and Hypochlorite Decay

In Figure 6a, the simulated RhB concentration profiles are compared with the experimental profiles at three initial hypochlorite concentrations (300, 500, and 1000 µM) under the conditions of pH 11 and a temperature of 25 °C. The comparison reveals that both the experimental and simulated results agree in showing that the degradation rate of RhB increases with higher initial chlorine concentrations. There is a strong concordance between the experimental data and the modeling profiles. This trend of increased degradation with higher chlorine concentrations has also been observed in various experimental studies for different contaminants [60,61,62]. The RhB degradation rate constants (pseudo-first-order) increased to 2 × 10⁻⁴, 10−3 and 3 × 10⁻³ s−1 for 300, 500 and 1000 µM [ClO]0, respectively. Correspondingly, the initial rates of degradation of RhB were increased to 4.07 × 10⁻⁹, 8.85 × 10⁻⁹, and 2.07 × 10⁻⁸ M s−1.
In Figure 6b, the kinetics of hypochlorite depletion and Cl2OH formation (the main product) are illustrated under the optimal fitting conditions from Figure 6a. Both rates increase with higher hypochlorite dosages, elucidating the behavior of RhB degradation observed in Figure 6a. A greater hypochlorite depletion leads to a higher yield of radical generation and an increased rate of Cl2OH release, as demonstrated. According to Figure 6b, hypochlorite depletes at increasing initial rates of 8.84 × 10⁻⁸, 3.22 × 10⁻⁷, and 1.15 × 10⁻⁶ M s−1, while Cl2OH forms at rates of 1.92 × 10⁻⁸, 1.19 × 10⁻⁷, and 4.97 × 10⁻⁶ M s−1 as the initial hypochlorite dosage rises from 300 µM to 500 µM and 1000 µM, respectively. Consequently, the yield of Cl2OH formation from hypochlorite depletion increases to 21.7%, 37%, and 43.2% for [ClO]0 values of 300, 500, and 1000 µM, respectively.
In Figure 6c, the overall hypochlorite depletion rate constant (derived from the profiles in Figure 6b) and the specific ClO photolysis rate constants (kR1 and kR2, predicted based on the best fit in Figure 6a) are plotted against initial hypochlorite concentration [ClO]0. The kR1 increases linearly, from 9.05 × 10⁻⁶ s−1 at 300 µM hypochlorite to 2.67 × 10⁻⁴ s−1 at 1000 µM hypochlorite. In contrast, kR2 shows less variation, being 3 × 10⁻⁵ s−1 at 300 µM, 5.54 × 10⁻⁵ s−1 at 500 µM, and 1.88 × 10⁻⁵ s−1 at 1000 µM. Additionally, Figure 6c demonstrates that the overall first-order rate constant (koverall) for chlorine depletion is greater than the sum of the specific rate constants, kR1 + kR2. The ratio (kR1 + kR2)/koverall is 0.195, 0.277, and 0.286, respectively, at the concentrations indicated, indicating that the combined contribution of Reactions R1 and R2 in hypochlorite depletion does not exceed 30%. This finding suggests that hypochlorite consumption also occurs via other pathways besides Reactions R1 and R2. Indeed, radicals such as O, Cl, O3, and OH, generated from Reactions R1, R2, and R115, can break down hypochlorite at higher rate constants according to Reactions R30, R44, R71, and R114 of Table 1.

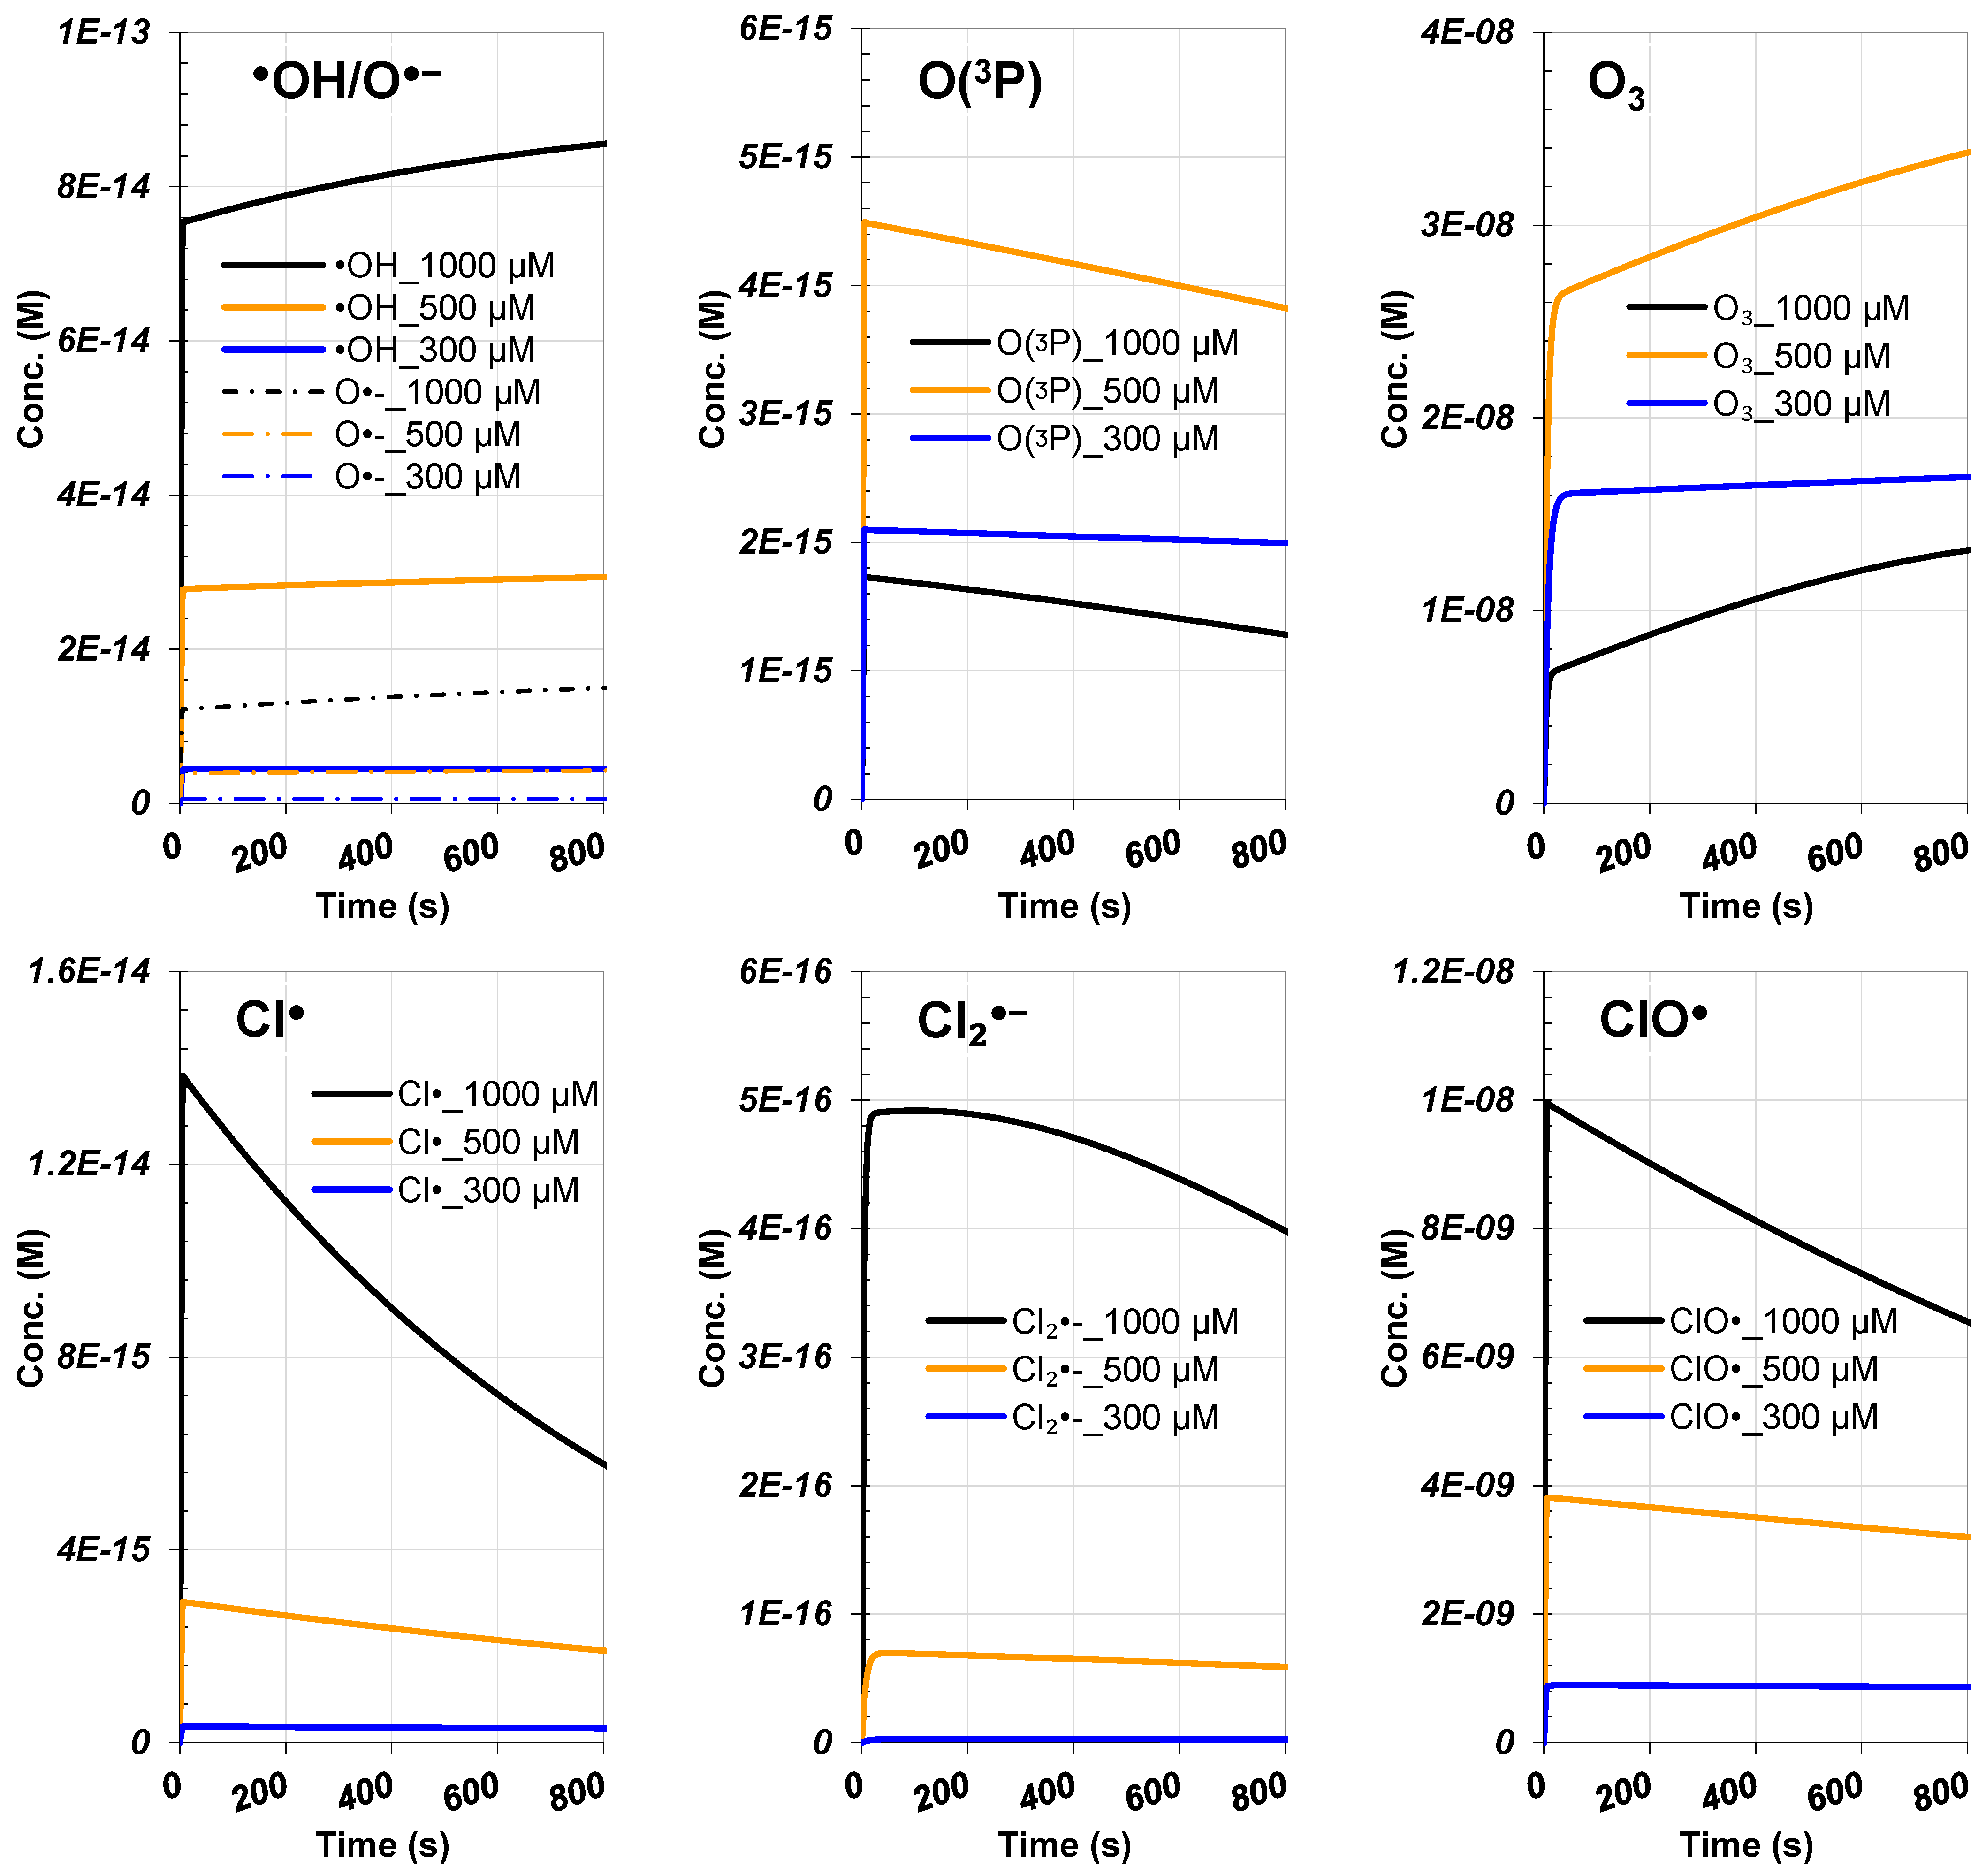
3.4.2. ROS and RCS Evolutions

Figure 7 illustrates the simulated profiles of the main ROS and RCS under the conditions set in Figure 6a. As the hypochlorite concentration increases, the concentration of RCS (Cl, ClO, and Cl2•−) and ROS (OH/O•−) also increases. The steady-state concentration of OH rises from 4.3 × 10⁻⁵ M at 300 µM to 2.76 × 10⁻¹⁴ M at 500 µM, and further to 7.54 × 10⁻¹⁴ M at 1000 µM. Similarly, O•− shows an increase, albeit at a lower yield, with concentrations of 5.68 × 10⁻⁶ M at 300 µM, 3.9 × 10⁻¹⁵ M at 500 µM, and 1.22 × 10⁻¹⁴ M at 1000 µM. Conversely, the concentration of O3 peaks at 500 µM with [O3]ss = 1.56 × 10⁻⁸ M, a trend corresponding to the optimal behavior of its precursor O(3P) and the decline in the photolytic rate constant of reaction R2 (kR2) beyond 500 µM, as shown in Figure 6c. For the same range of hypochlorite concentrations, Cl radicals reach steady-state values of 3.23 × 10⁻¹⁶ M, 2.9 × 10⁻¹⁵ M, and 1.38 × 10⁻¹⁴ M. ClO radicals, however, achieve higher steady-state concentrations compared to OH and Cl, with values of 8.67 × 10⁻¹⁰ M, 3.8 × 10⁻⁹ M, and 9.95 × 10⁻⁹ M for 300, 500, and 1000 µM of [ClO]0, respectively. Similarly, Cl2•− radicals follow the same trend, although they are the least formed RCS.
Overall, except for O3, the yield of reactive species increased with rising hypochlorite concentration. This explains the intensified effect of higher hypochlorite concentrations on the degradation rate of RhB, as observed in Figure 6a. These findings suggest that optimizing hypochlorite dosage is essential to maximize the degradation efficiency of RhB, considering both the generation of reactive species and their interaction dynamics.

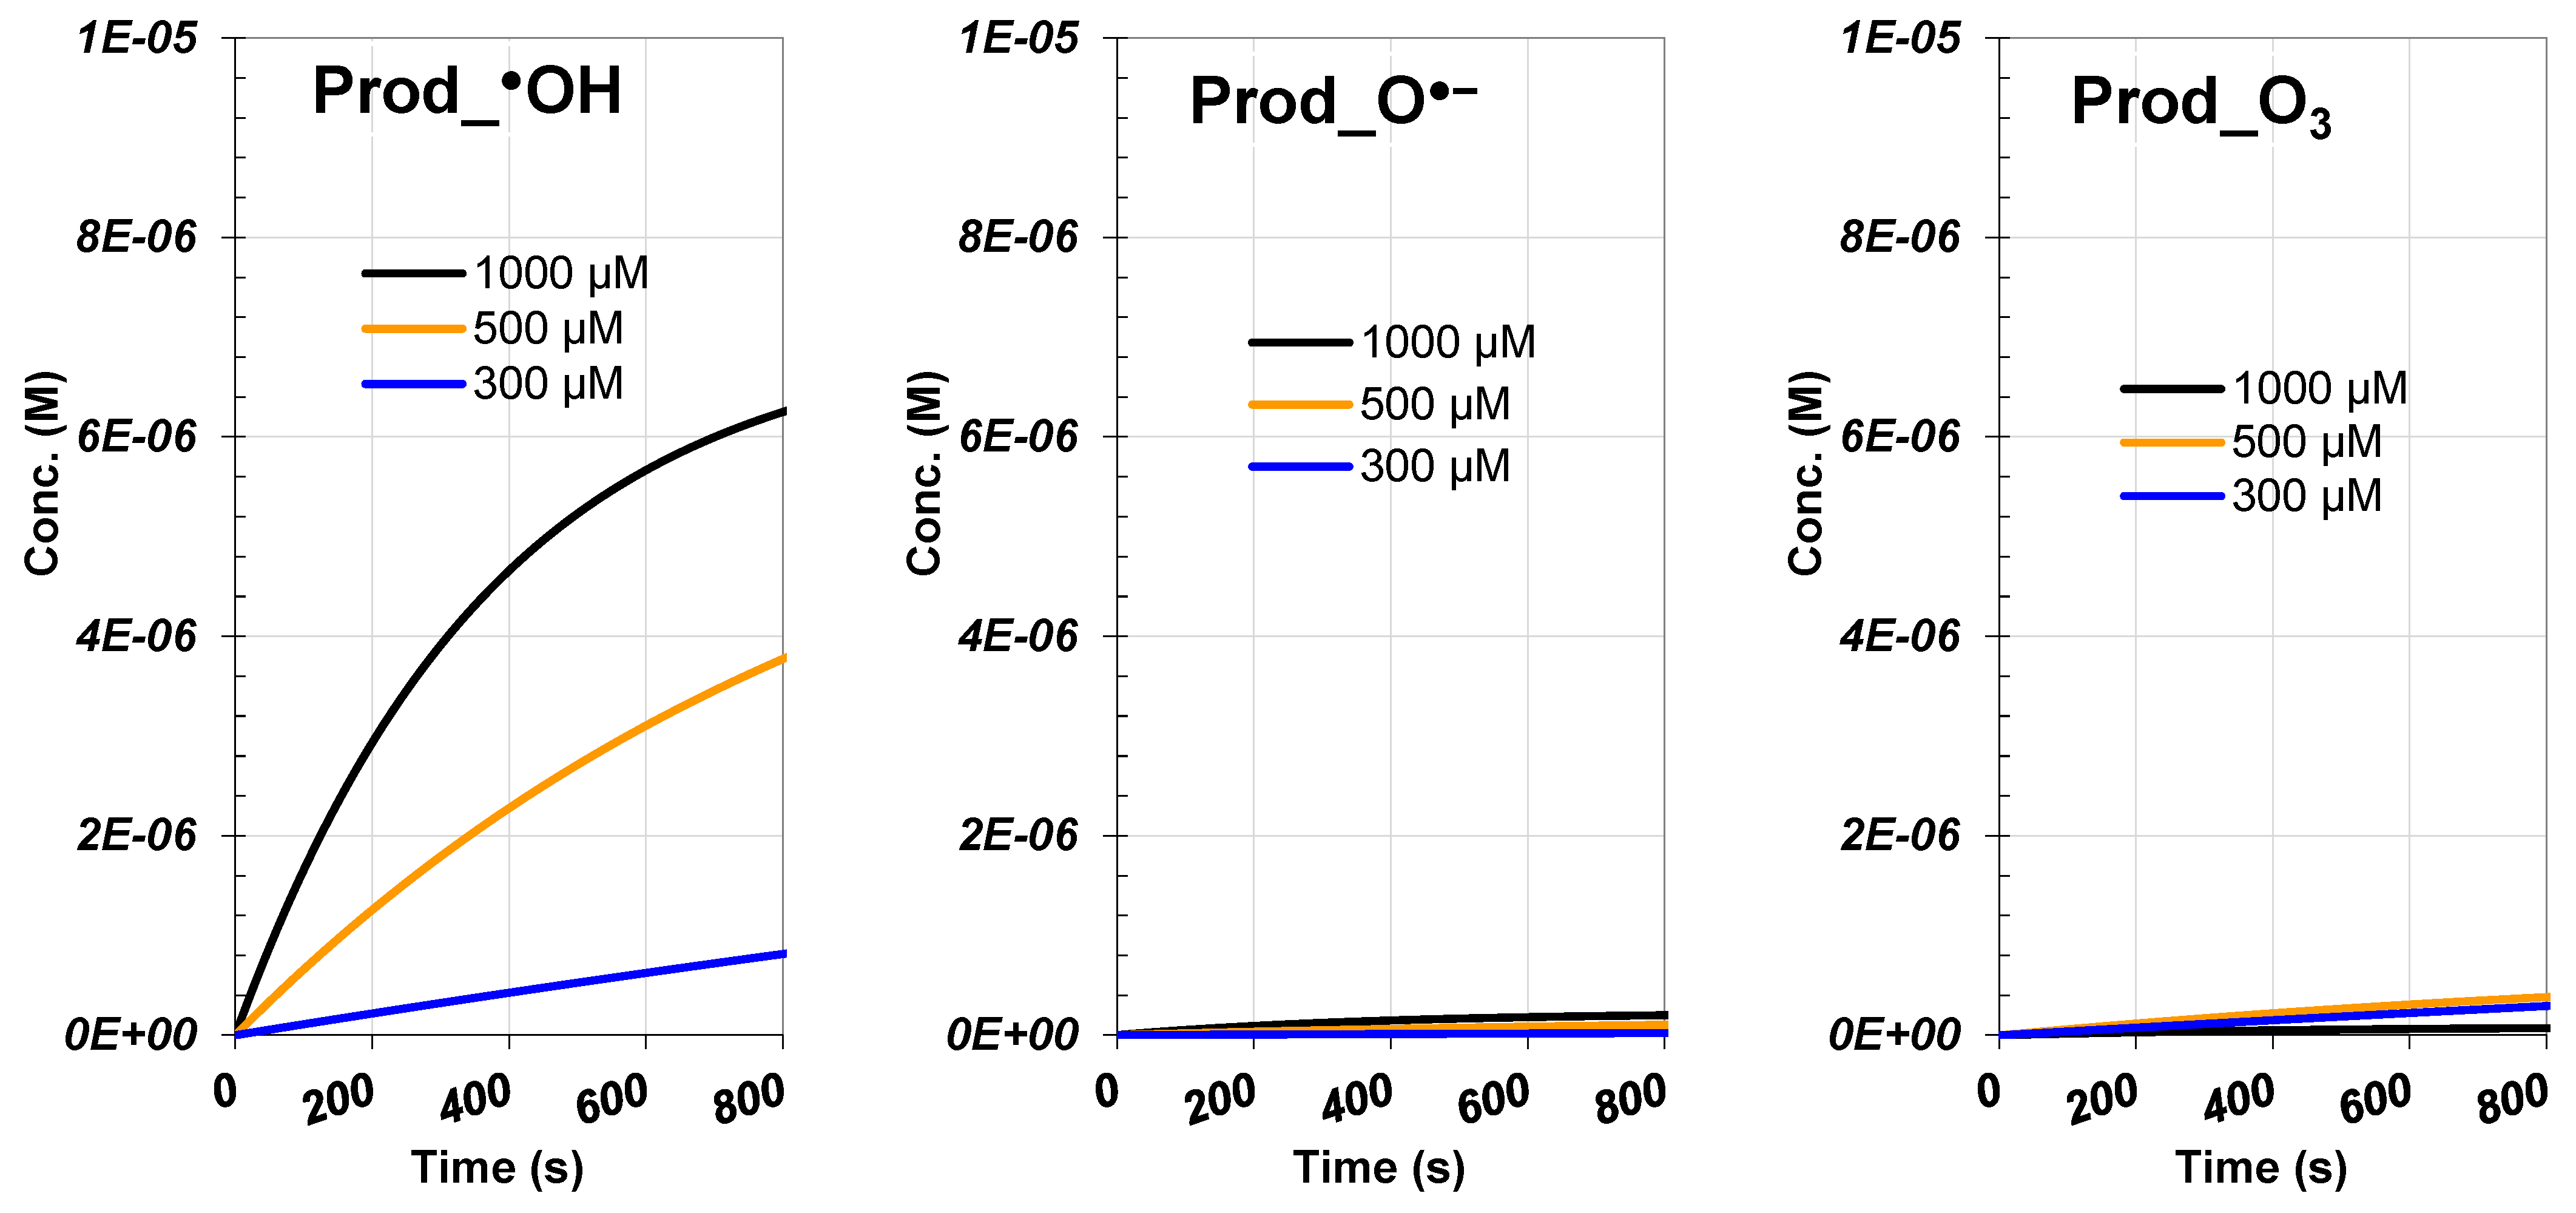
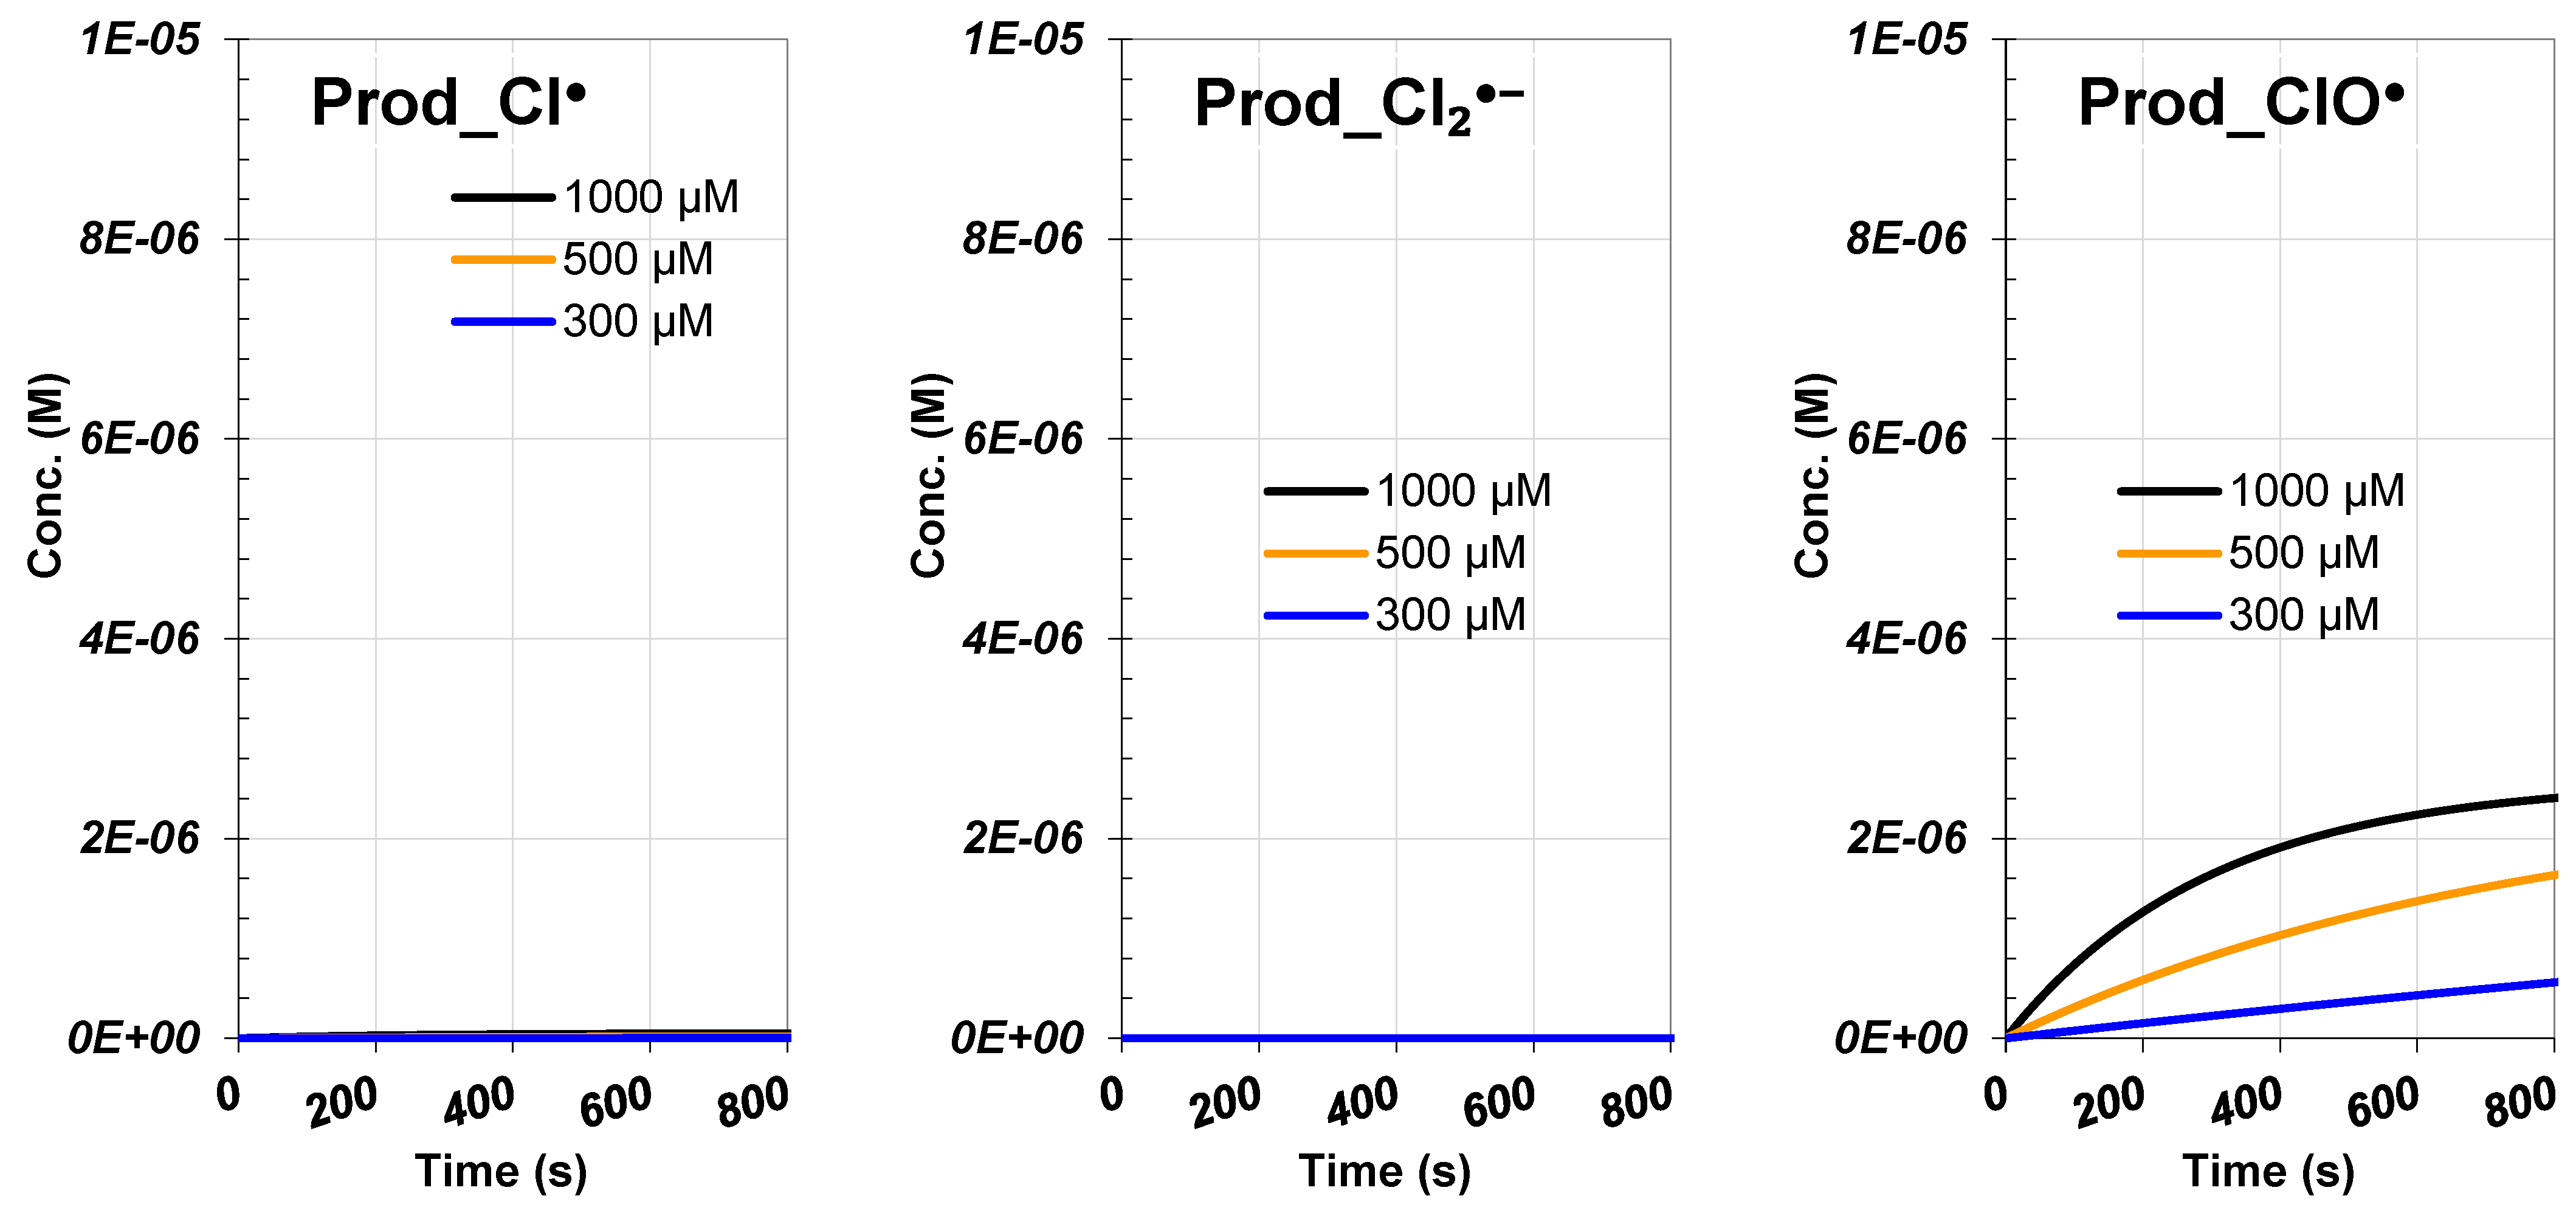
3.4.3. Products and Reactive Species Contribution

Figure 8 presents the simulated profiles of the main considered degradation products of RhB, namely Prod_OH, Prod_O•−, Prod_O3, Prod-Cl, Prod-ClO, and Prod-Cl2•−, under the conditions described in Figure 6a. Prod_OH and Prod-ClO are the primary products, with their concentrations increasing over time and with higher hypochlorite dosages. Prod_O•− and Prod_O3 are formed to a lesser extent, while Prod-Cl and Prod-Cl2•− are not detected. These findings indicate that OH and ClO radicals predominantly attack RhB. The contribution of each radical to the overall RhB degradation rate is calculated using the selectivity equation (Equation (1)). The terms of Equation (1) are calculated, and the results for three initial hypochlorite concentrations (300, 500, and 1000 µM) are shown in Table 2. According to the results, OH is the dominant contributor to RhB degradation, accounting for 67% at 1000 µM, 62.78% at 500 µM, and 48.43% at 300 µM. ClO is the second most significant contributor, with around 29.5% at both 1000 and 500 µM and 33.93% at 300 µM. The contribution of OH decreases with lower hypochlorite dosages, while ClO shows the opposite trend. The third contributing species, although less significant than the previous two, is O3, contributing 16.21% at 300 µM and 5.61% at 500 µM, but its contribution is negligible (0.6%) at 1000 µM. Therefore, the ozonation pathway increases with decreasing hypochlorite dosage, whereas the free radical attack (involving OH and ClO) becomes more significant at higher ClO concentrations. It is important to note that the evolution of product concentrations depends on two kinetic parameters: the rate constants and the reactive species concentration, as previously discussed. The interaction (multiplication) between these parameters determines the overall contribution of each reactive species in the dye degradation process.

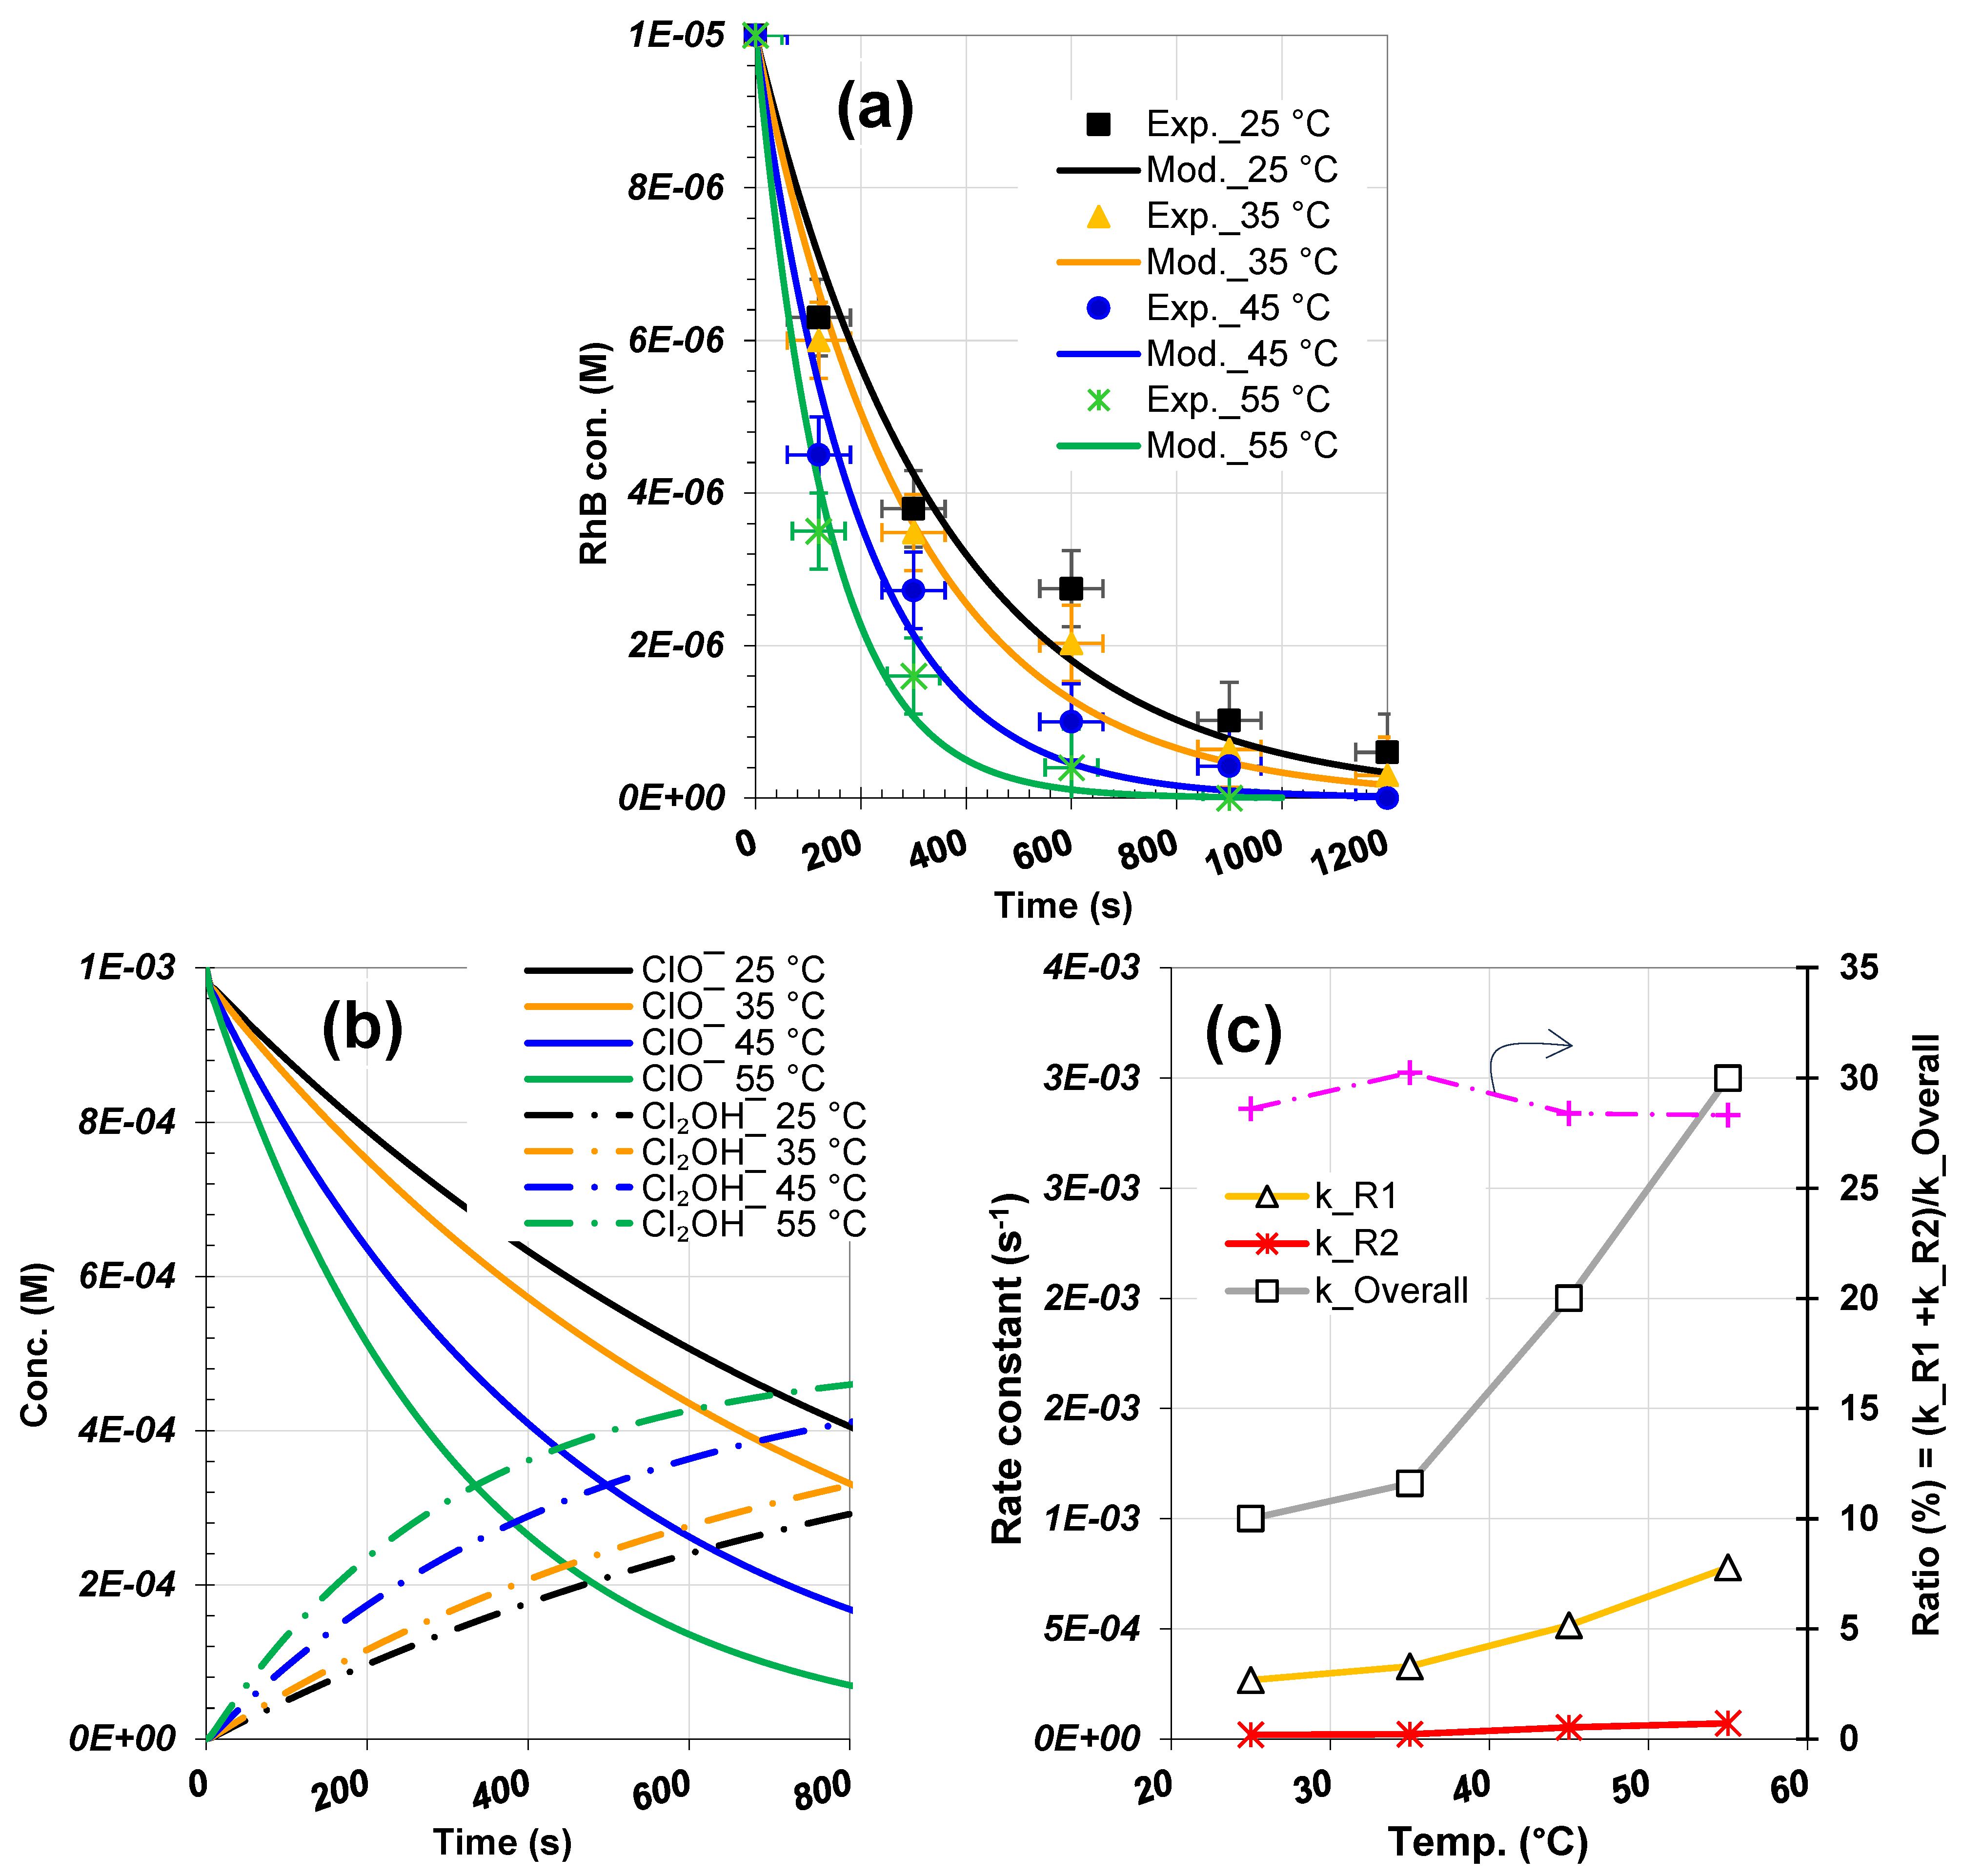
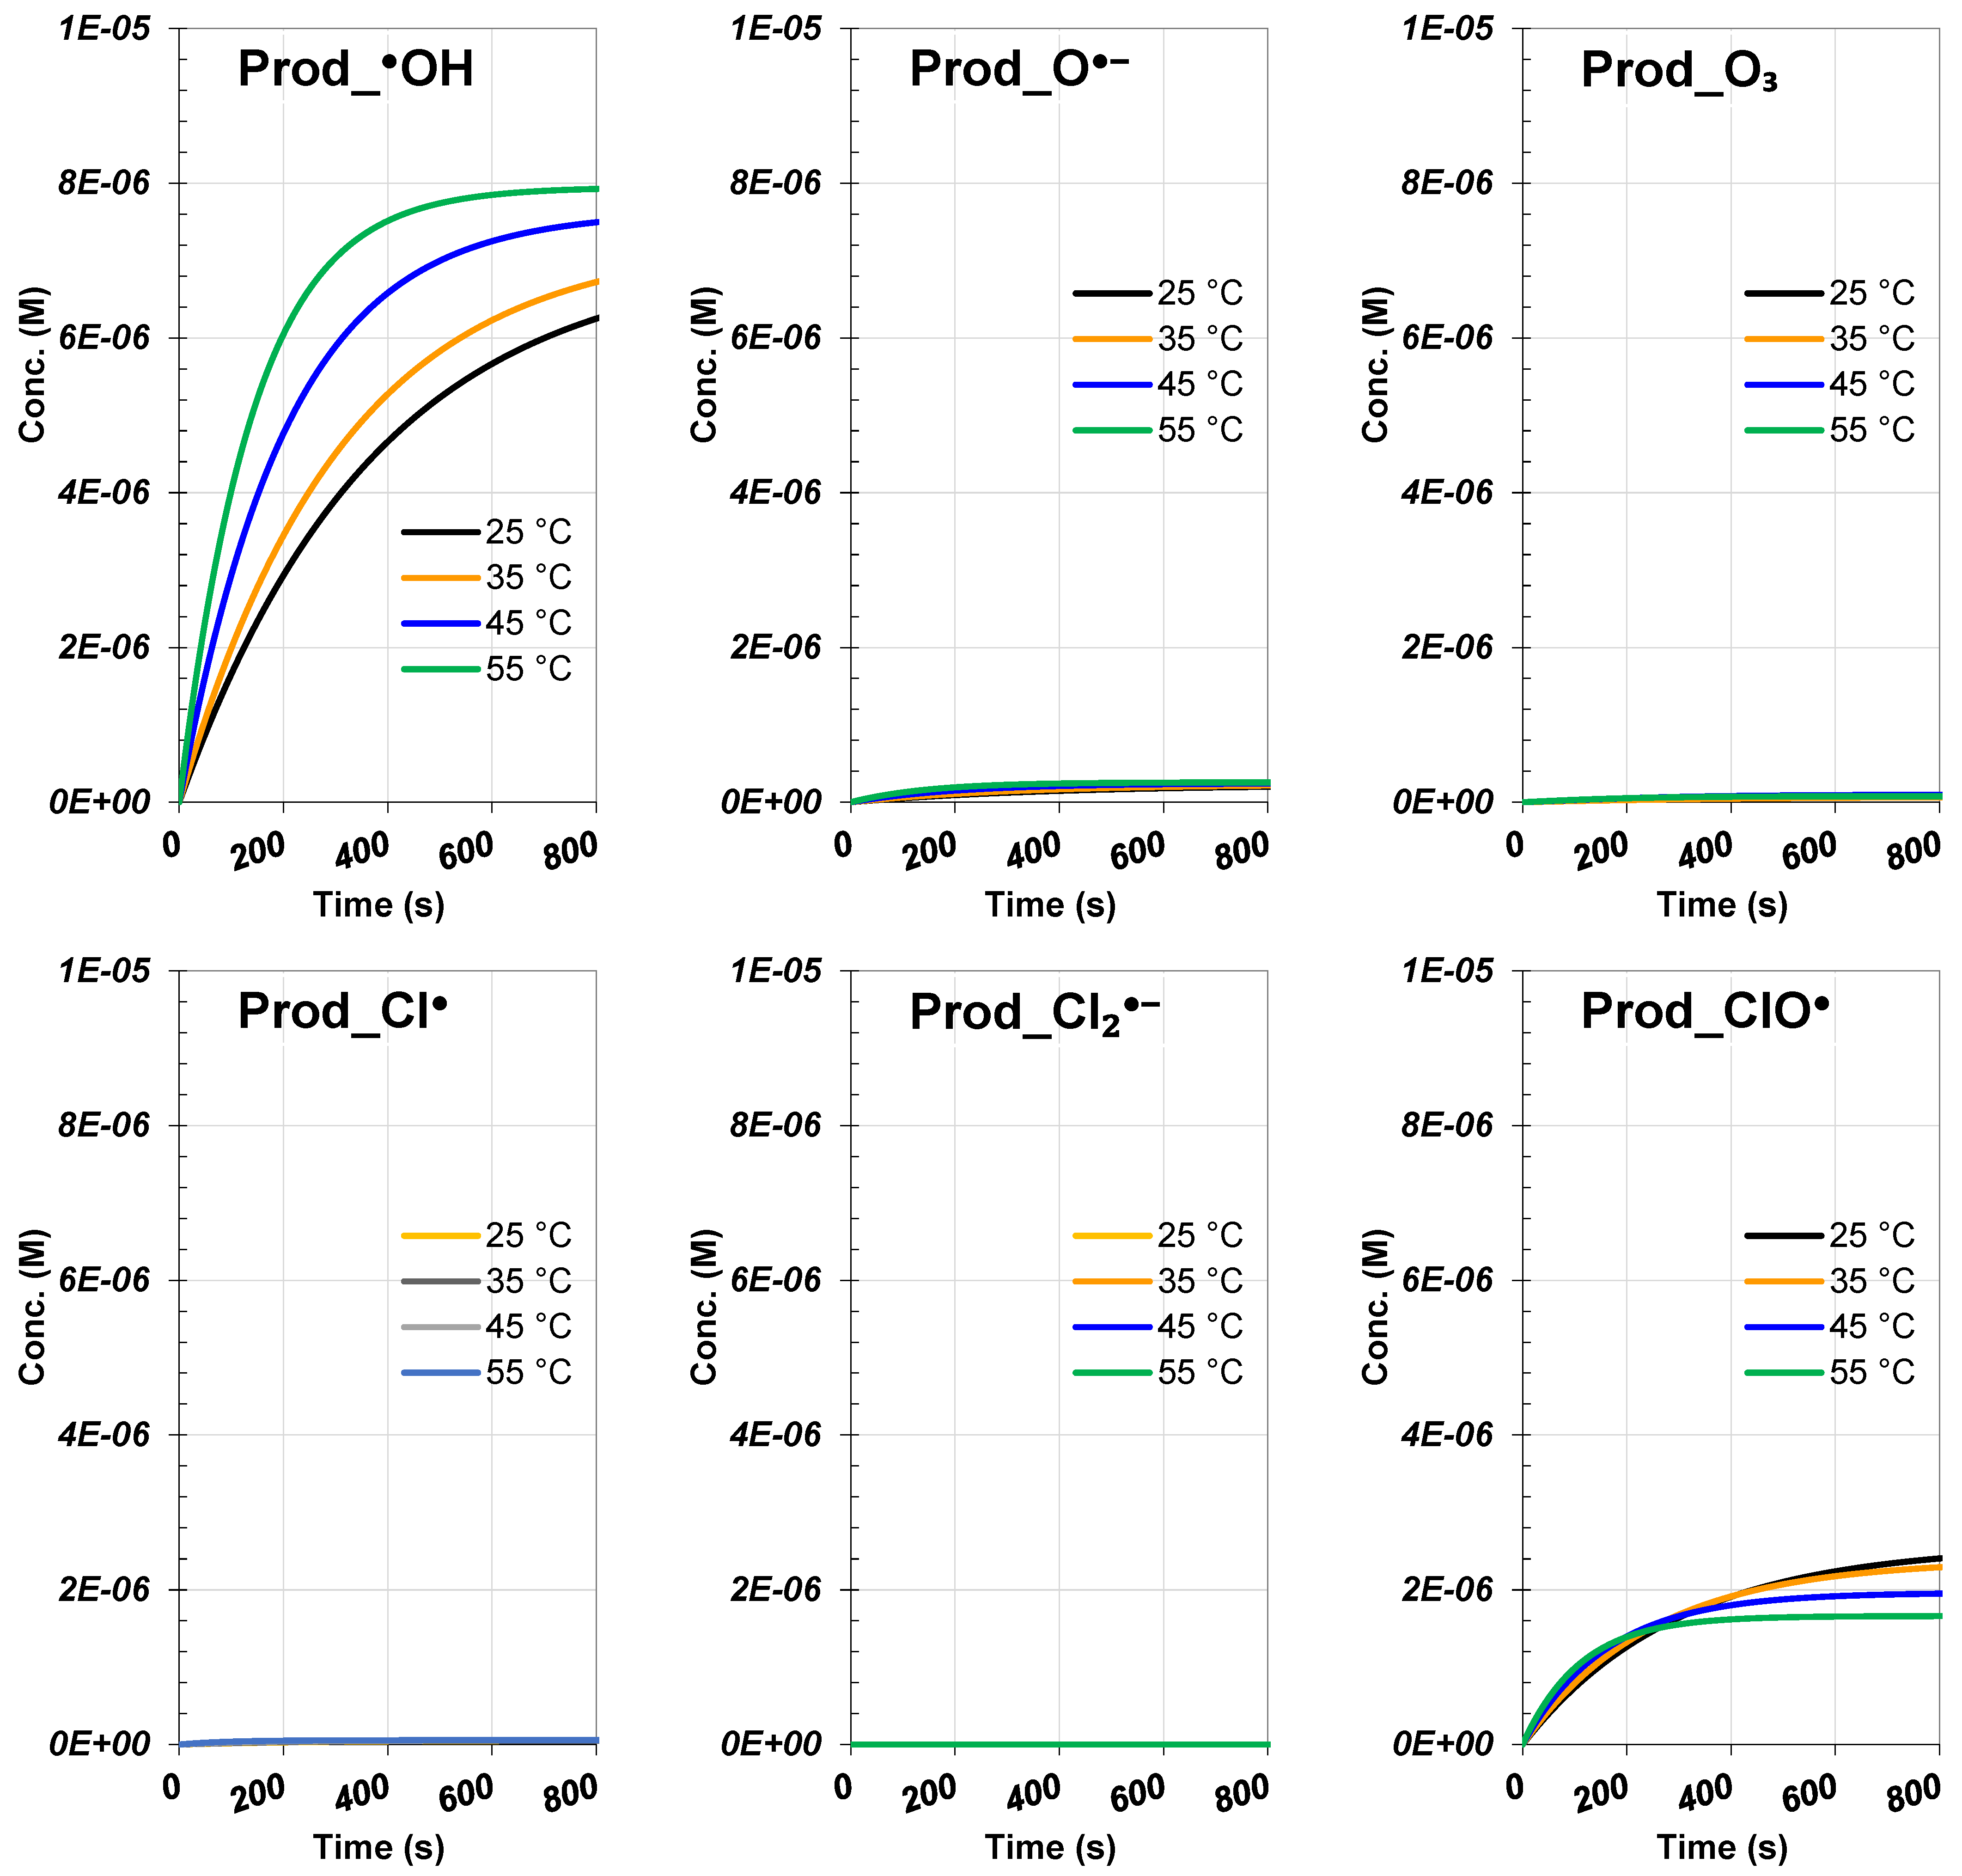
3.5. Analysis of Solution Temperature Impact

In Figure 9a, the simulated RhB concentration profiles are compared with experimental profiles at four different temperatures (25, 35, 45, and 55 °C) under conditions of pH 11 and using 1000 µM of hypochlorite. The comparison shows that both experimental and simulated results agree, indicating that the RhB degradation rate increases with temperature. There is a strong concordance between the experimental data and the modeling profiles. The pseudo-first-order RhB degradation rate constants increased to 2 × 10⁻³ and 3 × 10⁻³ s−1 for 45 and 55 °C, compared to 1 × 10⁻³ s−1 at 25 °C. Correspondingly, the initial degradation rates increased to 4.58 × 10⁻⁶ and 5.87 × 10⁻⁶ M s−1 at 45 and 55 °C, compared to 22.89 × 10⁻⁶ M s−1 at 25 °C.
In Figure 9b, the effect of liquid temperature on the kinetics of hypochlorite depletion and Cl2OH formation (the main product) is illustrated under the best-fitting conditions from Figure 6a. Both rates increase with higher temperature, elucidating the behavior of RhB degradation observed in Figure 9a. Greater hypochlorite depletion in heated solutions leads to a higher yield of radical generation and an increased rate of Cl2OH release, as demonstrated. According to Figure 9b, hypochlorite depletes at increasing initial rates of 1.36 × 10⁻⁶, 2.0 × 10⁻⁶, and 2.77 × 10⁻⁶, while Cl2OH forms at rates of 6.02 × 10⁻⁷, 9.29 × 10⁻⁷, and 1.31 × 10⁻⁶ M s−1 as the temperature increases to 35, 45, and 55 °C, respectively. Consequently, the yield of Cl2OH formation from hypochlorite depletion increases from 43.2% at 25 °C to 44.3%, 46.0%, and 47.1% at 35, 45, and 55 °C, respectively.
In Figure 9c, the impact of liquid temperature on the overall hypochlorite depletion rate constant (derived from the profiles in Figure 9b) and the specific ClO photolysis rate constants (kR1 and kR2, estimated based on the best fit in Figure 9a) is shown. Both kR1 and kR2 increase with liquid temperature, with kR1 exhibiting a more substantial rise compared to kR2 (more than 10-fold). Additionally, the overall first-order rate constant (koverall) for hypochlorite depletion is greater than the sum of the specific rate constants, kR1 + kR2. The ratio (kR1 + kR2)/koverall remains around 0.28–0.30 (Figure 9c) across the investigated temperature range, indicating that the combined contribution of Reactions R1 and R2 to hypochlorite depletion does not exceed 30%, similar to the findings for varying initial hypochlorite dosages. Consequently, hypochlorite dissociation also occurs through other pathways besides Reactions R1 and R2, as previously discussed. Indeed, radicals such as O, Cl, O3, and OH, generated from Reactions R1, R5, and R115, can degrade hypochlorite at higher rate constants according to Reactions R302, R44, R71, and R14 in Table 1. The efficiency of these reactions becomes significantly more pronounced at elevated temperatures, particularly at 55 °C. This is evident as the koverall for hypochlorite depletion peaks against the sum of kR1 and kR2 at this temperature (Figure 9c).
Figure 10 depicts the simulated profiles of the main ROS and RCS under the conditions outlined in Figure 9a. An increase in liquid temperature had a favorable effect on both ROS and RCS, with their concentrations rising with temperature. For instance, the steady-state concentration of OH increased from 7.54 × 10⁻¹⁴ M at 25 °C to 9.28 × 10⁻¹⁴ M at 35 °C, 1.47 × 10⁻¹³ M at 45 °C, and 2.22 × 10⁻¹³ M at 55 °C. Similarly, ClO rose from 99.95 × 10⁻⁹ M at 25 °C to 1.1 × 10⁻⁸ M at 35 °C, 1.38 × 10⁻⁸ M at 45 °C, and 1.7 × 10⁻⁸ M at 55 °C. Cl increased from 1.38 × 10⁻¹⁴ M at 25 °C to 1.7 × 10⁻¹⁴ M at 35 °C, 2.7 × 10⁻¹⁴ M at 45 °C, and 4.06 × 10⁻¹⁴ M at 55 °C. Overall, the yield of reactive species increased with rising liquid temperature. This accounts for the intensified effect of solution heating on the degradation rate of RhB observed in Figure 9a. These findings indicate that controlling liquid temperature is crucial for maximizing the degradation efficiency of RhB, as it influences the generation of reactive species.
Figure 11 displays the simulated profiles of the primary RhB degradation products, specifically Prod_OH, Prod_O•−, Prod_O3, Prod-Cl, Prod-ClO, and Prod-Cl2•−, under the conditions outlined in Figure 9a. Prod_OH and Prod-ClO emerge as the main products, with their concentrations increasing over time and with temperature. All other products are formed at negligible concentrations. The contribution of each radical to the overall RhB degradation rate is determined using the selectivity equation (Equation (1)). The terms of Equation (1) are calculated, and the results for various liquid temperatures are presented in Table 3. According to these results, OH is the dominant contributor to RhB degradation, accounting for 67% at 25 °C, 69% at 35 °C, 73.7% at 45 °C, and 77.5% at 55 °C. ClO is the second most significant contributor, with its contribution decreasing as the temperature rises: 29.63% at 25 °C, 27.4% at 35 °C, 22.5% at 45 °C, and 17.5% at 55 °C.

4. Conclusions

Important new information about the functions of various reactive species (RCS and ROS) in the degradation process has been revealed by modeling the oxidation kinetics of RhB in the UVSolar/hypochlorite treatment. Using this method made it possible to determine important rate constants for the oxidation of RhB by free radicals and both radical and non-radical hypochlorite routes. Free radical concentrations and degradation kinetics are influenced by several operational parameters, including temperature and ClO initial dose, which may be quantitatively understood by kinetic modeling. It was discovered that RhB could be effectively degraded by solar-activated hypochlorite. The kinetics of this degradation were precisely modeled using a free radical kinetic model with COPASI® software, under a range of conditions that included temperatures between 25 and 55 °C and initial hypochlorite concentrations between 300 and 1000 µM. To ensure ClO was the only form of chlorine present in the solution, all experiments were conducted at pH 11.
The validated kinetic model enabled the establishment of ROS and RCS profiles, highlighting their dependence on temperature and hypochlorite concentration. The simulated product profiles further identified the contributions of different reactive species to RhB degradation, with OH emerging as the primary ROS and ClO as the main RCS. OH displayed a dominant contribution over ClO, while ozone’s contribution was negligible but could reach up to 6% at lower hypochlorite dosages. Higher radical concentrations were achieved by increasing the solution temperature and initial hypochlorite dosage, resulting in more efficient hypochlorite decomposition and RhB degradation.
The photolysis rate constants for ClO via various pathways were predicted as follows: kR1 = 2.67 × 10⁻⁴ s−1 for R1: ClO  h ν O•− + Cl, kR2 = 1.88 × 10⁻⁵ s−1 for R2: ClO  h ν O(3P) + Cl and kR3 = 0 s−1 for R3: ClO  h ν O(1D) + Cl. The rate constants for RhB reactions with O•−, Cl, Cl2•− and ClO were predicted to be kR125 = 4.8 × 10⁹ M−1 s−1, kR127 = 1.45 × 10⁹ M−1 s−1, k129= 2.5 × 10⁷ M−1 s−1 and k128 = 8.7 × 10⁴ M−1 s−1, respectively. Lower rate constants were predicted for RhB reactions with HOCl•−, HO2, O2•−, and O(3P), with kR130 = 4.1 × 10⁴ M−1 s−1, kR131 = 7.3 × 10⁵ M−1 s−1, kR132 = 3.6 × 10⁴ M−1 s−1, and kR133 = 0.40 M−1 s−1.
In summary, even though the model was only tested using the RhB decay profile, it shows impressive accuracy in a variety of demanding scenarios. First of all, every anticipated rate constant, including those for RhB interactions with free radicals and ClO photolysis, agrees with data from previously published studies on related pollutants. Second, the RhB degradation is well matched by these expected rate constants, under various hypochlorite dosages and temperatures. Finally, it correctly depicts the suppression of RhB degradation in the presence of TBA and BA scavengers. This extensive validation confirms the resilience of the model.

Author Contributions

H.A., software and validation; S.M., conceptualization, methodology, data analysis, writing—review and editing, and project supervision; A.D., writing—review and editing; H.B.: experimentation and data collection; O.H., writing—review and analysis. All authors have read and agreed to the published version of the manuscript.

Funding

This research received no external funding.

Data Availability Statement

The original contributions presented in the study are included in the article, further inquiries can be directed to the corresponding authors.

Conflicts of Interest

The authors declare no conflict of interest.

References

  1. Masoner, J.R.; Kolpin, D.W.; Furlong, E.T.; Cozzarelli, I.M.; Gray, J.L. Landfill leachate as a mirror of today’s disposable society: Pharmaceuticals and other contaminants of emerging concern in final leachate from landfills in the conterminous United States. Environ. Toxicol. Chem. 2016, 35, 906–918. [Google Scholar] [CrossRef]
  2. Richardson, S.D.; Ternes, T.A. Water Analysis: Emerging Contaminants and Current Issues. Anal. Chem. 2018, 90, 398–428. [Google Scholar] [CrossRef] [PubMed]
  3. Fairbairn, D.J.; Arnold, W.A.; Barber, B.L.; Kaufenberg, E.F.; Koskinen, W.C.; Novak, P.J.; Rice, P.J.; Swackhamer, D.L. Contaminants of Emerging Concern: Mass Balance and Comparison of Wastewater Effluent and Upstream Sources in a Mixed-Use Watershed. Environ. Sci. Technol. 2016, 50, 36–45. [Google Scholar] [CrossRef]
  4. Merouani, S.; Hamdaoui, O. Sonochemical Treatment of Textile Wastewater. In Water Pollution and Remediation: Photocatalysis; Inamuddin, M.P., Asiri, A., Eds.; Springer-Nature: Cham, Switzerland, 2021; pp. 147–187. ISBN 978-3-030-54723-3. [Google Scholar]
  5. Bulman, D.M.; Mezyk, S.P.; Remucal, C.K. The Impact of pH and Irradiation Wavelength on the Production of Reactive Oxidants during Chlorine Photolysis. Environ. Sci. Technol. 2019, 53, 4450–4459. [Google Scholar] [CrossRef] [PubMed]
  6. Neta, P.; Huie, R.E.; Ross, A.B. Rate constants for reactions of inorganic radicals in aqueous solution. J. Phys. Chem. Ref. Data 1988, 17, 1027–1284. [Google Scholar] [CrossRef]
  7. Stefan, M.I. Advanced Oxidation Processes for Water Treatment—Fundamentals and Applications; IWA Publishing: London, UK, 2017; Volume 16, ISBN 9781780407180. [Google Scholar]
  8. Dehane, A.; Merouani, S. Dyes Sonolysis: An Industrial View of Process Intensification Using Carbon Tetrachloride. In Advanced Oxidation Processes in Dye-Containing Wastewater. Sustainable Textiles: Production, Processing, Manufacturing & Chemistry; Muthu, S.S., Khadir, A., Eds.; Springer Nature: Singapore, 2022; pp. 115–145. ISBN 978-981-19-0882-8. [Google Scholar]
  9. Merouani, S.; Dehane, A.; Hamdaoui, O.; Yasui, K.; Ashokkumar, M. Review on the impacts of external pressure on sonochemistry. Ultrason. Sonochem. 2024, 106, 106893. [Google Scholar] [CrossRef] [PubMed]
  10. Dehane, A.; Merouani, S. Chapter 13—Ultrasonic destruction of CCl4: A microscopic-scale analysis. In Development in Wastewater Treatment Research and Processes; Shah, M.P., Rodriguez-Couto, S., Eds.; Elsevier: Amsterdam, The Netherlands, 2024; pp. 219–236. ISBN 978-0-323-95656-7. [Google Scholar]
  11. Bendjama, H.; Merouani, S.; Hamdaoui, O.; Bouhelassa, M. Efficient degradation method of emerging organic pollutants in marine environment using UV/periodate process: Case of chlorazol black. Mar. Pollut. Bull. 2018, 126, 557–564. [Google Scholar] [CrossRef] [PubMed]
  12. Sadik, W.A. Effect of inorganic oxidants in photodecolourization of an azo dye. J. Photochem. Photobiol. A Chem. 2007, 191, 132–137. [Google Scholar] [CrossRef]
  13. Antonopoulou, M.; Evgenidou, E.; Lambropoulou, D.; Konstantinou, I. A review on advanced oxidation processes for the removal of taste and odor compounds from aqueous media. Water Res. 2014, 53, 215–234. [Google Scholar] [CrossRef]
  14. Sun, P.; Lee, W.N.; Zhang, R.; Huang, C.H. Degradation of DEET and caffeine under UV/Chlorine and simulated sunlight/Chlorine conditions. Environ. Sci. Technol. 2016, 50, 13265–13273. [Google Scholar] [CrossRef]
  15. Laat, J.D.; Stefan, M. UV/chlorine process. In Advanced Oxidation Processes for Water Treatment; Stefan, M.I., Ed.; IWA Publishing: London, UK, 2017; pp. 383–428. [Google Scholar]
  16. Belghit, A.; Merouani, S.; Hamdaoui, O.; Bouhelassa, M.; Al-Zahrani, S. The multiple role of inorganic and organic additives in the degradation of reactive green 12 by UV/chlorine advanced oxidation process. Environ. Technol. 2022, 43, 835–847. [Google Scholar] [CrossRef]
  17. Yin, R.; Zhong, Z.; Ling, L.; Shang, C. The fate of dichloroacetonitrile in UV/Cl2 and UV/H2O2 processes: Implications on potable water reuse. Environ. Sci. Water Res. Technol. 2018, 4, 1295–1302. [Google Scholar] [CrossRef]
  18. Khajouei, G.; Finklea, H.O.; Lin, L. UV/chlorine advanced oxidation processes for degradation of contaminants in water and wastewater: A comprehensive review. J. Environ. Chem. Eng. 2022, 10, 107508. [Google Scholar] [CrossRef]
  19. Yeom, Y.; Han, J.; Zhang, X.; Shang, C.; Zhang, T.; Li, X.; Duan, X.; Dionysiou, D.D. A review on the degradation efficiency, DBP formation, and toxicity variation in the UV/chlorine treatment of micropollutants. Chem. Eng. J. 2021, 424, 130053. [Google Scholar] [CrossRef]
  20. Kishimoto, N. State of the art of UV/chlorine advanced oxidation processes: Their mechanism, byproducts formation, process variation, and applications. J. Water Environ. Technol. 2019, 17, 302–335. [Google Scholar] [CrossRef]
  21. Yin, R.; Ling, L.; Shang, C. Wavelength-dependent chlorine photolysis and subsequent radical production using UV-LEDs as light sources. Water Res. 2018, 142, 452–458. [Google Scholar] [CrossRef]
  22. Cheng, Z.; Ling, L.; Shang, C. Near-Ultraviolet Light-Driven Photocatalytic Chlorine Activation Process with Novel Chlorine Activation Mechanisms. ACS ES&T Water 2021, 1, 2067–2075. [Google Scholar] [CrossRef]
  23. Cheng, Z.; Ling, L.; Wu, Z.; Fang, J.; Westerho, P.; Shang, C. Novel Visible Light-Driven Photocatalytic Chlorine Activation Process for Carbamazepine Degradation in Drinking Water. Environ. Sci. Technol. 2020, 54, 11584–11593. [Google Scholar] [CrossRef] [PubMed]
  24. Remucal, C.K.; Manley, D. Emerging investigators series: The efficacy of chlorine photolysis as an advanced oxidation process for drinking water treatment. Environ. Sci. Water Res. Technol. 2016, 2, 565–579. [Google Scholar] [CrossRef]
  25. Chuang, Y.H.; Chen, S.; Chinn, C.J.; Mitch, W.A. Comparing the UV/Monochloramine and UV/Free Chlorine Advanced Oxidation Processes (AOPs) to the UV/Hydrogen Peroxide AOP under Scenarios Relevant to Potable Reuse. Environ. Sci. Technol. 2017, 51, 13859–13868. [Google Scholar] [CrossRef] [PubMed]
  26. Watts, M.J.; Linden, K.G. Chlorine photolysis and subsequent OH radical production during UV treatment of chlorinated water. Water Res. 2007, 41, 2871–2878. [Google Scholar] [CrossRef] [PubMed]
  27. Dong, H.; Qiang, Z.; Hu, J.; Qu, J. Degradation of chloramphenicol by UV/chlorine treatment: Kinetics, mechanism and enhanced formation of halonitromethanes. Water Res. 2017, 121, 178–185. [Google Scholar] [CrossRef] [PubMed]
  28. Guo, K.; Wu, Z.; Shang, C.; Yao, B.; Hou, S.; Yang, X.; Song, W.; Fang, J. Radical Chemistry and Structural Relationships of PPCP Degradation by UV/Chlorine Treatment in Simulated Drinking Water. Environ. Sci. Technol. 2017, 51, 10431–10439. [Google Scholar] [CrossRef] [PubMed]
  29. Wu, Z.; Guo, K.; Fang, J.; Yang, X.X.; Xiao, H.; Hou, S.; Kong, X.; Shang, C.; Yang, X.X.; Meng, F.; et al. Factors affecting the roles of reactive species in the degradation of micropollutants by the UV/chlorine process. Water Res. 2017, 126, 351–360. [Google Scholar] [CrossRef]
  30. Belghit, A.A.; Merouani, S.; Hamdaoui, O.; Bouhelassa, M.; Alghyamah, A.; Bouhelassa, M. Influence of processing conditions on the synergism between UV irradiation and chlorine toward the degradation of refractory organic pollutants in UV/chlorine advanced oxidation system. Sci. Total Environ. 2020, 736, 139623_1–139623_10. [Google Scholar] [CrossRef]
  31. Kong, X.; Wu, Z.; Ren, Z.; Guo, K.; Hou, S.; Hua, Z.; Li, X.; Fang, J. Degradation of lipid regulators by the UV/chlorine process: Radical mechanisms, chlorine oxide radical (ClO•)-mediated transformation pathways and toxicity changes. Water Res. 2018, 137, 242–250. [Google Scholar] [CrossRef]
  32. Wang, W.; Zhang, X.; Wu, Q.; Du, Y.; Hu, H. Degradation of natural organic matter by UV/chlorine oxidation: Molecular decomposition, formation of oxidation byproducts and cytotoxicity. Water Res. 2017, 124, 251–258. [Google Scholar] [CrossRef]
  33. Buxton, G.V.; Greenstock, C.L.; Helman, W.P.; Ross, A.B. Critical review of rate constants for reactions of hydrated Electrons, hydrogen atoms and hydroxyl radicals (•OH/O-) in aqueous solution. J. Phys. Chem. Ref. Data 1988, 17, 515–886. [Google Scholar] [CrossRef]
  34. Matthew, B.M.; Anastasio, C. A chemical probe technique for the determination of reactive halogen species in aqueous solution: Part 2—Chloride solutions and mixed bromide/chloride solutions. Atmos. Chem. Phys. 2006, 6, 2439–2451. [Google Scholar] [CrossRef]
  35. Klaning, U.K.; Wolff, T. Laser flash photolysis of HCIO, CIO, HBrO, and BrO in aqueous solution. Reactions of Cl and Br atoms. Berichte der Bunsengesellschaft/Physical Chem. Chem. Phys. 1985, 89, 243–245. [Google Scholar] [CrossRef]
  36. Zhou, S.; Zhang, W.; Sun, J.; Zhu, S.; Li, K.; Meng, X.; Luo, J.; Shi, Z.; Zhou, D.; Crittenden, J.C. Oxidation Mechanisms of the UV/Free Chlorine Process: Kinetic Modeling and Quantitative Structure Activity Relationships. Environ. Sci. Technol. 2019, 53, 4335–4345. [Google Scholar] [CrossRef] [PubMed]
  37. Jayson, G.G.; Parsons, B.J.; Swallow, A.J. Some simple, highly reactive, inorganic chlorine derivatives in aqueous solution. Their formation using pulses of radiation and their role in the mechanism of the Fricke dosimeter. J. Chem. Soc. Faraday Trans. 1 Phys. Chem. Condens. Phases 1973, 69, 1597–1607. [Google Scholar] [CrossRef]
  38. Celardin, F.; Marcantonatos, M. Kinetics of the Rhodamine B-Ozone Chemiluminescent Reaction in Acetic Acid. Zeitschrift Phys. Chemie Neue Folge 1975, 96, 109–124. [Google Scholar] [CrossRef]
  39. Meghlaoui, F.Z.; Merouani, S.; Hamdaoui, O.; Bouhelassa, M.; Ashokkumar, M.; Zohra, F.; Merouani, S.; Hamdaoui, O.; Bouhelassa, M.; Meghlaoui, F.Z.; et al. Rapid catalytic degradation of refractory textile dyes in Fe (II)/chlorine system at near neutral pH: Radical mechanism involving chlorine radical anion (Cl 2 %−)-mediated transformation pathways and impact of environmental matrices. Sep. Purif. Technol. 2019, 227, 115685. [Google Scholar] [CrossRef]
  40. Liang, C.; Su, H.W. Identification of sulfate and hydroxyl radicals in thermally activated persulfate. Ind. Eng. Chem. Res. 2009, 48, 5558–5562. [Google Scholar] [CrossRef]
  41. Wu, J.J.; Muruganandham, M.; Chen, S.H. Degradation of DMSO by ozone-based advanced oxidation processes. J. Hazard. Mater. 2007, 149, 218–225. [Google Scholar] [CrossRef]
  42. Alfassi, Z.B.; Huie, R.E.; Mosseri, S.; Neta, P. Kinetics of one-electron oxidation by the ClO radical. Int. J. Radiat. Appl. Instrument. Part C Radiat. Phys. Chem. 1988, 32, 85–88. [Google Scholar] [CrossRef]
  43. Fang, J.; Fu, Y.; Shang, C. The roles of reactive species in micropollutant degradation in the UV/free chlorine system. Environ. Sci. Technol. 2014, 48, 1859–1868. [Google Scholar] [CrossRef]
  44. Deng, J.; Wu, G.; Yuan, S.; Zhan, X.; Wang, W.; Hu, Z.H. Ciprofloxacin degradation in UV/chlorine advanced oxidation process: Influencing factors, mechanisms and degradation pathways. J. Photochem. Photobiol. A Chem. 2019, 371, 151–158. [Google Scholar] [CrossRef]
  45. Larbi Djaballah, M.; Belghit, A.; Dehane, A.; Merouani, S.; Hamdaoui, O.; Ashokkumar, M. Radicals (●OH, Cl●, ClO● and Cl2●–) concentration profiles in the intensified degradation of reactive green 12 by UV/chlorine process: Chemical kinetic analysis using a validated model. J. Photochem. Photobiol. A Chem. 2023, 439, 114557. [Google Scholar] [CrossRef]
  46. Merouani, S.; Hamdaoui, O.; Saoudi, F.; Chiha, M. Sonochemical degradation of Rhodamine B in aqueous phase: Effects of additives. Chem. Eng. J. 2010, 158, 550–557. [Google Scholar] [CrossRef]
  47. Merouani, S.; Hamdaoui, O.; Saoudi, F.; Chiha, M.; Pétrier, C. Influence of bicarbonate and carbonate ions on sonochemical degradation of Rhodamine B in aqueous phase. J. Hazard. Mater. 2010, 175, 593–599. [Google Scholar] [CrossRef]
  48. Chiha, M.; Merouani, S.; Hamdaoui, O.; Baup, S.; Gondrexon, N.; Pétrier, C. Ultrasonics Sonochemistry Modeling of ultrasonic degradation of non-volatile organic compounds by Langmuir-type kinetics. Ultrason. Sonochem. 2010, 17, 773–782. [Google Scholar] [CrossRef]
  49. Bekkouche, S.; Merouani, S.; Hamdaoui, O.; Bouhelassa, M. Efficient photocatalytic degradation of Safranin O by integrating solar-UV/TiO2/Persulfate treatment: Implication of sulfate radical in the oxidation process and effect of various water matrix components. J. Photochem. Photobiol. A Chem. 2017, 345, 80–91. [Google Scholar] [CrossRef]
  50. Djaballah, M.L.; Merouani, S.; Bendjama, H.; Hamdaoui, O. Development of a free radical-based kinetics model for the oxidative degradation of chlorazol black in aqueous solution using periodate photoactivated process. J. Photochem. Photobiol. A Chem. 2020, 408, 113102. [Google Scholar] [CrossRef]
  51. Wojnárovits, L.; Takács, E. Rate constants for the reactions of chloride monoxide radical (ClO •) and organic molecules of environmental interest. Water Sci. Technol. 2023, 87, 1925–1944. [Google Scholar] [CrossRef]
  52. Li, M.; Mei, Q.; Wei, B.; An, Z.; Sun, J.; Xie, J.; He, M. Mechanism and kinetics of ClO-mediated degradation of aromatic compounds in aqueous solution: DFT and QSAR studies. Chem. Eng. J. 2021, 412, 128728. [Google Scholar] [CrossRef]
  53. An, Z.; Li, M.; Huo, Y.; Jiang, J.; Zhou, Y.; Jin, Z.; Xie, J.; Zhan, J.; He, M. The pH-dependent contributions of radical species during the removal of aromatic acids and bases in light/chlorine systems. Chem. Eng. J. 2022, 433, 133493. [Google Scholar] [CrossRef]
  54. Meghlaoui, F.Z.; Merouani, S.; Hamdaoui, O.; Alghyamah, A.; Bouhelassa, M.; Ashokkumar, M. Fe(III)-catalyzed degradation of persistent textile dyes by chlorine at slightly acidic conditions: The crucial role of Cl2●− radical in the degradation process and impacts of mineral and organic competitors. Asia-Pacific J. Chem. Eng. 2020, 16, e2553. [Google Scholar] [CrossRef]
  55. Buxton, G.V.; Subhani, M.S. Radiation chemistry and photochemistry of oxychlorine ions. Part 2.—Photodecomposition of aqueous solutions of hypochlorite ions. J. Chem. Soc. Faraday Trans. 1972, 68, 958–969. [Google Scholar] [CrossRef]
  56. Yuan, R.; Ramjaun, S.N.; Wang, Z.; Liu, J. Concentration profiles of chlorine radicals and their significances in •OH-induced dye degradation: Kinetic modeling and reaction pathways. Chem. Eng. J. 2012, 209, 38–45. [Google Scholar] [CrossRef]
  57. Yuan, R.; Wang, Z.; Hu, Y.; Wang, B.; Gao, S. Probing the radical chemistry in UV/persulfate-based saline wastewater treatment: Kinetics modeling and byproducts identification. Chemosphere 2014, 109, 106–112. [Google Scholar] [CrossRef]
  58. Chia, L.H.; Tang, X.; Weavers, L.K. Kinetics and mechanism of photoactivated periodate reaction with 4-chlorophenol in acidic solution. Environ. Sci. Technol. 2004, 38, 6875–6880. [Google Scholar] [CrossRef] [PubMed]
  59. Chadi, N.E.; Merouani, S.; Hamdaoui, O.; Bouhelassa, M.; Ashokkumar, M. H2O2/periodate (IO4): A novel advanced oxidation technology for the degradation of refractory organic pollutants. Environ. Sci. Water Res. Technol. 2019, 5, 1113–1123. [Google Scholar] [CrossRef]
  60. Watts, M.J.; Rosenfeldt, E.J.; Linden, K.G. Comparative OH radical oxidation using UV-Cl2 and UV-H2O2 processes. J. Water Supply Res. Technol.-AQUA 2007, 56, 469–477. [Google Scholar] [CrossRef]
  61. Guo, Z.; Lin, Y.; Xu, B.; Huang, H.; Zhang, T.; Tian, F.; Gao, N. Degradation of chlortoluron during UV irradiation and UV/chlorine processes and formation of disinfection by-products in sequential chlorination. Chem. Eng. J. 2015, 283, 412–419. [Google Scholar] [CrossRef]
  62. Wang, W.L.; Wu, Q.Y.; Huang, N.; Wang, T.; Hu, H.Y. Synergistic effect between UV and chlorine (UV/chlorine) on the degradation of carbamazepine: Influence factors and radical species. Water Res. 2016, 98, 190–198. [Google Scholar] [CrossRef]
Figure 1. Experimental and predicted evolution of RhB concentration vs. time during solar hypochlorite photolysis in the absence (a) and presence of scavengers, (b): TBA, (c): BA (conditions: pH 11, C0 = 10 µM, [ClO]0 = 1000 µM, temp. 25±1 °C, [TBA]0 = 100 mM, [BA]0 = 10 mM). For (c): k141#1 = 1 × 10⁵ M−1s−1, k141#2 = 2 × 10⁵ M−1s−1 and k141#1 = 1 × 10⁶ M−1s−1.
Processes 12 01853 g001
Figure 2. Concentration evolution of the different species during the solar hypochlorite photolysis of Rhodamine B, under the same conditions as Figure 1a. (a) Hypochlorite and its molecular chlorine species, (b) Rhodamine B (i.e., P) and its degradation by-products, (c) reactive oxygen species (ROS), and (d) reactive chlorine species (RCS).
Processes 12 01853 g002aProcesses 12 01853 g002b
Figure 3. Concentration evolution of the different species during the solar hypochlorite photolysis of Rhodamine B in the presence of TBA, under the same conditions as Figure 1b. (a) Hypochlorite and its molecular chlorine species, (b) Rhodamine B (i.e., P) and its degradation by-products, (c) reactive oxygen species (ROS), and (d) reactive chlorine species (RCS).
Processes 12 01853 g003
Figure 4. Concentration evolution of the different species during the solar hypochlorite photolysis of Rhodamine B in the presence of BA, under the same conditions as Figure 1c. (a) Hypochlorite and its molecular chlorine species, (b) Rhodamine B (i.e., P) and its degradation by-products, (c) reactive oxygen species (ROS), and (d) reactive chlorine species (RCS).
Processes 12 01853 g004
Figure 5. Quenching of key species in the reaction system due to the involvement of TBA and BA. For radicals, the quench is reflected in the steady-state concentration. For ClO, the quench is seen in the disappearance rate. For Cl2OH, the quench is in the formation rate. All quenching effects were calculated against the control run condition (without TBA and BA).
Processes 12 01853 g005
Figure 6. Impact of initial hypochlorite concentration (300, 500, and 1000 µM) on experimental and numerical RhB degradation profiles (a), ClO depletion, and subsequent Cl2OH formation rate (b). (c) Rate constant analysis for specific photolysis reactions and overall hypochlorite abatement, all vs. initial hypochlorite concentration.
Processes 12 01853 g006
Figure 7. Impact of initial hypochlorite concentration (300, 500, and 1000 µM) on reactive species (ROS and RCS) profiles, under the best fitting conditions of Figure 6a.
Processes 12 01853 g007
Figure 8. Impact of initial hypochlorite concentration (300, 500, and 1000 µM) on the main products resulting from the reaction of reactive species (ROS/RCS) with RhB, under the best fitting conditions of Figure 6a. The maximum y-axis value is fixed for all sub-figures at 1 × 10⁵ M, which is the initial concentration of RhB (i.e., 10 µM).
Processes 12 01853 g008aProcesses 12 01853 g008b
Figure 9. Impact of liquid temperature (25–55 °C) on experimental and numerical RhB degradation profiles (a), ClO depletion, and subsequent Cl2OH formation rate (b). (c) Rate constant analysis for specific photolysis reactions and overall hypochlorite abatement, all vs. liquid temperature.
Processes 12 01853 g009
Figure 10. Impact of liquid temperature (25–55 °C) on reactive species (ROS and RCS) profiles, under the best fitting conditions of Figure 9a.
Processes 12 01853 g010
Figure 11. Impact of liquid temperature (25–55 °C) on the main products resulting from the reaction of reactive species (ROS/RCS) with RhB, under the best fitting conditions of Figure 9a. The maximum y-axis value is fixed for all sub-figures at 1 × 10⁵ M, which is the initial concentration of RhB (i.e., 10 µM).
Processes 12 01853 g011
Table 1. Model equations for RhB degradation in basic solar-photoactivated hypochlorite solution (pH 11). Abbreviations: TBA: tert-butyl alcohol, BA: benzoic acid, Prod_1 to Prod_11: unspecified species.
Name ReactionRate ConstantRef.
R1ClO photolysis RxnsClO h ν O●− + Cl(0.028–2.67) × 10−4 s−1This study
R2 ClO h ν O(3P) + Cl(1.88–2.46) × 10−5 s−1This study
R3 ClO  h ν O(1D) + Cl0 s−1This study
R4O(1D)/O(3P) RxnsO(1D) + H2O → 2OH1.2 × 1011 M−1s−1[5]
R5 O(3P) + O2 → O34.0 × 109 M−1s−1[5]
R6 O(3P) + ClO → ClO29.4 × 109 M−1s−1[5]
R7 O(3P) + H2O2 → OH + HO21.6 × 109 M−1s−1[5]
R8 O(3P) + HO2 → OH + O2●−5.3 × 10⁹ M−1s−1[5]
R9 O(3P) + OH → HO24.2 × 108 M−1s−1[5]
R10 O3 → O2 + O(3P)4.5 × 10⁻⁶ s−1[5]
R11Speciations RxnsHOCl → H+ + ClO1.41 × 103 s−1[5]
R12 H+ + ClO → HOCl5.0 × 1010 M−1s−1[33]
R13 HOCl + Cl → Cl2 + H2O0.182 M−1s−1[5]
R14 Cl2 + H2O → HOCl + Cl + H+0.27 M−1s[14]
R15 HOCl + Cl → Cl2OH1.5 × 104 M−1s−1[5]
R16 Cl2 + OH → HOCl + Cl1.0 × 109 M−1s−1[5]
R17 HCl → H+ + Cl8.6 × 1016 s−1[14]
R18 H+ + Cl → HCl5.0 × 1010 M−1s−1[14]
R19 H2O2 → H+ + HO20.13 s−1[33]
R20 H+ + HO2 → H2O25.0 × 1010 M−1s−1[33]
R21 H2O → H+ + OH0.001 s−1[14]
R22 H+ + OH → H2O1.0 × 1011 M−1s−1[14]
R23OH RxnsOH + HOCl → ClO + H2O2.0 × 109 M−1s−1[34]
R24 2OH → H2O25.5 × 109 M−1s−1[34]
R25 OH + ClO → ClO2 + H+1.0 × 10⁹ M−1s−1[5]
R26 OH + H2O2 → HO2 + H2O2.7 × 107 M−1s−1[33]
R27 OH + O2●− → O2 + OH7.0 × 109 M−1s−1[14]
R28 OH + Cl → Cl + OH1.1 × 109 M−1s−1[5]
R29 OH + Cl2●− → HOCl + Cl1.0 × 109 M−1s−1[5,14]
R30 OH + ClO → ClO + OH8.8 × 109 M−1s−1[14]
R31 OH + HO2 → O2 + H2O6.6 × 109 M−1s−1[5,14]
R32 OH + Cl → HOCl●−4.3 × 10⁹ M−1s−1[14]
R33 OH + ClO2 → OH + ClO24.5 × 109 M−1s−1[5]
R34 OH + ClO3 → ClO3 + OH1.0 × 106 M−1s−1[5]
R35 OH + HO2 → HO2 + OH7.5 × 109 M−1s−1[33]
R36 OH + HO2 → H2O + O2●−7.05 × 10⁹ M−1s−1[33]
R37 OH + OH → O●− + H2O1.25 × 1010 M−1s−1[5]
R38 OH + O●− → HO22.0 × 1010 M−1s−1[5]
R39 OH + ClO2 → ClO3 + H+4.0 × 10⁹ M−1s−1[5]
R40 OH + O3●− → HO2 + O2●−8.5 × 10⁹ M−1s−1[5]
R41 OH + O3 → O2 + HO21.05 × 108 M−1s−1[5]
R42Cl Rxns2Cl → Cl2.8.8.8 × 107 M−1s−1[5,14]
R43 Cl + HOCl → Cl + ClO + H+3.0 × 10⁹ M−1s−1[35]
R44 Cl + ClO → Cl + ClO8.3 × 109 M−1s−1[35]
R45 Cl + Cl2 → Cl35.3 × 108 M−1s−1[5]
R46 Cl + H2O → HOCl●− + H+2.05 × 10⁵ M−1s−1[5]
R47 Cl + Cl → Cl2●−8.5 × 10⁹ M−1s−1[14]
R48 Cl + OH → HOCl●−1.8 × 10¹⁰ M−1s−1[14]
R49 Cl + H2O2 → HO2 + Cl + H+2.0 × 10⁹ M−1s−1[14]
R50 Cl + ClO3 → Prod_11.0 × 106 M−1s−1[5]
R51 Cl + ClO2 → Prod_21.0 × 109 M−1s−1[5]
R52 Cl + Cl2●− → Cl2 + Cl2.1 × 109 M−1s−1[5]
R53 Cl + ClO2 → ClO2 + Cl7.0 × 109 M−1s−1[5]
R54Cl2●− Rxns2Cl2●− → Cl2 + 2Cl8.0 × 108 M−1s−1[5]
R55 Cl2●− + H2O → HOCl●− + Cl + H+1.3 × 10³ M−1s−1[5]
R56 Cl2●− + OH → HOCl●− + Cl4.5 × 107 M−1s−1[5]
R57 Cl2●− + ClO → ClO + 2Cl2.9 × 108 M−1s−1[5]
R58 Cl2●− + O2●− → O2 + 2Cl2.0 × 109 M−1s−1[5,14]
R59 Cl2●− + HO2 → O2 + 2Cl + H+3.0 × 10⁹ M−1s−1[14]
R60 Cl2●− + H2O2 → HO2 + 2Cl + H+1.4 × 10⁵ M−1s−1[5]
R61 Cl2●− → Cl + Cl6.0 × 104 s−1[5]
R62 Cl2●− + ClO2 → Prod_31.0 × 109 M−1s−1[5]
R63ClO Rxns2ClO → Cl2O22.5 × 109 M−1s−1[36]
R64 Cl2O2 + H2O → HOCl + ClO2 + H+4.5 × 10⁷ M−1s−1[36]
R65 Cl2O2 + OH → ClO + ClO2 + H+2.5 × 10⁹ M−1s−1[36]
R66 ClO + ClO2 → ClO2 + ClO9.4 × 108 M−1s−1[5]
R67Ozone RxnsO3 + OH → O2 + HO248 M−1s−1[6]
R68 O3 + HO2 → O3●− + HO25.5 × 106 M−1s−1[5]
R69 O3 + HO2 → H+ + O2 + O3●−1.6 × 10⁹ M−1s−1[5]
R70 O3 + ClO → 2O2 + Cl110 M−1s−1[5]
R71 O3 + ClO → O2 + ClO230 M−1s−1[5]
R72 O3 + Cl → O2 + ClO0.0016 M−1s−1[5]
R73 O3 + H2O2 → O2 + OH + HO20.0272 M−1s−1[5]
R74 O3 + HO2 → O2 + OH + O2●−5.5 × 10⁶ M−1s−1[5]
R75 O3 + Cl2●− → Prod_49.0 × 107 M−1s−1[5]
R76 O3 + O2●− → O2 + O3●−1.55 × 10⁹ M−1s−1[5]
R77 O3 + ClO2 → O2 + ClO31230 M−1s−1[5]
R78 O3 + ClO3 → Prod_50.0001 M−1s−1[5]
R79 O3 + H+ → Prod_60.0004 M−1s−1[5]
R80 O3 + ClO2 → O3●− + ClO22.01 × 106 M−1s−1[5]
R81ROS RxnsH2O2 + Cl2 → 2HCl + O21.3 × 104 M−1s−1[5]
R82 H2O2 + HOCl → HCl + H2O + O21.1 × 104 M−1s−1[5]
R83 H2O2 + ClO → Cl + H2O + O21.7 × 105 M−1s−1[5]
R84 H2O2 + HO2 → O2 + OH + H2O3 M−1s−1[5]
R85 H2O2 + O2●− → O2 + OH + OH0.13 M−1s−1[5]
R86 H2O2 + O●− → O2●− + H2O4.0 × 108 M−1s−1[5]
R87 HO2 + O●− → HO2 + 2OH-5.0 × 10⁸ M−1s−1[5]
R88 HO2 + O●− → OH + O2●−4.0 × 10⁸ M−1s−1[5]
R89 HO2 + ClO2 → HO2 + ClO2-9.57 × 10⁴ M−1s−1[5]
R90 HO2 + HOCl → Cl + OH + O2 + H+7.5 × 10⁶ M−1s−1[5]
R91 HO2 + Cl2 → Cl2●− + H+ + O21.0 × 109 M−1s−1[5]
R92 HO2 → H+ + O2●−1.6 × 10⁵ M−1s−1[5]
R93 HO2 + O2●− → H2O2 + O2 + OH-7.9 × 10⁷ M−1s−1[5]
R94 HO2 + O2●− → HO2 + O29.7 × 107 M−1s−1[5]
R95 2 HO2 → H2O2 + O28.3 × 105 M−1s−1[5]
R96 HO2 + ClO2 → Prod_71.0 × 106 M−1s−1[5]
R97 O2●− + HOCl → Cl + OH + O27.5 × 106 M−1s−1[5]
R98 O2●− + HOCl → Cl + OH + O27.5 × 106 M−1s−1[5]
R99 O2●− + ClO → Cl + 2 OH + O22.0 × 108 M−1s−1[5]
R100 O2●− + Cl2 → Cl2●− + O21.0 × 109 M−1s−1[5]
R101 O2●− + O●− → 2OH + O26.0 × 108 M−1s−1[5]
R102 O2●− + Cl → Prod_8140 M−1s−1[5]
R103 O2●− + ClO2 → O2 + ClO2-3.15 × 10⁹ M−1s−1[5]
R104 O2●− + ClO2 → Prod_940 M−1s−1[5]
R105 O2●− + H+ → HO25.0 × 1010 M−1s−1[33]
R106 O2●− + ClO3 → Prod_103.2 × 103 M−1s−1[5]
R107 O3●− → O2 + O●−3.2 × 10³ s−1[5,6]
R108 O3●− + ClO → ClO + O31.0 × 109 M−1s−1[5]
R109 O3●− + H+ → O2 + OH9.0 × 1010 M−1s−1[5]
R110 O3●− + O●− → 2O2●−7.0 × 10⁸ M−1s−1[5]
R111 O3●− + ClO2 → O2 + ClO31.8 × 105 M−1s−1[5]
R112 2O3●− → Prod_119.0 × 108 M−1s−1[5]
R113 O3●− + ClO2 → ClO2 + O33.15 × 109 M−1s−1[5]
R114 O●− + ClO + H2O → ClO + 2OH2.3 × 108 M−1s−1[5]
R115 O●− + H2O → OH + OH1.8 × 106 M−1s−1[14]
R116 O●− + O2 → O3●−3.5 × 10⁹ M−1s−1[5]
R117 O●− + ClO2 → OH + ClO21.95 × 108 M−1s−1[5]
R118 2O●− → O22 −4.65 × 10⁹ M−1s−1[5]
R119 O●− + ClO2 → ClO32.7 × 109 M−1s−1[5]
R120Other RCS RxnsHOCl●− → Cl + OH6.1 × 109 M−1s−1[37]
R121 HOCl●− + H+ → Cl + H2O2.1 × 1010 M−1s−1[5]
R122 HOCl●− + Cl → Cl2●− + OH1.0 × 104 M−1s−1[5]
R123 ClO2 → Cl + O26.7 × 109 M−1s−1[5]
R124Pollutants RxnsP + OH → Prod_OH2.5 × 1010 M−1s−1[33]
R125 P + O●− → Prod_O●−4.8 × 10⁹ M−1s−1This study
R126 P + O3 → Prod_O32450 M−1s−1[38]
R127 P + Cl → Prod_Cl1.45 × 109 M−1s−1This study
R128 P + ClO → Prod_ClO8.70 × 104 M−1s−1This study
R129 P + Cl2●− → Prod_Cl2●−2.50 × 10⁷ M−1s−1This study
R130 P + HOCl●− → Prod_HOCl●−4.10 × 10⁴ M−1s−1This study
R131 P + HO2 → Prod_HO27.30 × 105 M−1s−1This study
R132 P + O2●− → Prod_O2●−3.60 × 10⁴ M−1s−1This study
R133 P + O(3P) → Prod_O(3P)0.40 M−1s−1This study
R134TBA RxnsTBA + Cl → Prod_Cl-TBA3 × 108 M−1s−1[39]
R135 TBA + ClO → Prod_ClO-TBA1.30 × 107 M−1s−1[39]
R136 TBA + Cl2●− → Prod_Cl2●−-TBA700 M−1s−1[39]
R137 TBA + OH → Prod_OH-TBA3.80 × 108 M−1s−1[40]
R138 TBA + O3 → Prod_O3-TBA0.003 M−1s−1[41]
R139 TBA + O●− → Prod_O●−-TBA5 × 108 M−1s−1
R140BA RxnsBA + Cl → Prod_Cl-BA1.8 × 1010 M−1s−1[39]
R141 BA + ClO → Prod_ClO-BA<3 × 10⁶ M−1s−1[42]
R142 BA + Cl2●− → Prod_Cl2●−-BA2 × 106 M−1s−1[5]
R143 BA + OH → Prod_OH-BA5.27 × 109 M−1s−1[5]
R144 BA + O●− → Prod_O●−-BA4 × 107 M−1s−1[5]
Table 2. Computed RhB degradation rates, product formation rates, and the subsequent contribution of each reactive species to the overall degradation rate of RhB for various initial hypochlorite concentrations. The contribution is calculated using the selectivity equation (Equation (1)).
SpeciesRate (M/s)Contribution (%)
[ClO]₀ = 1000 µM
RhB2.89 × 10−6
Prod_Cl1.93 × 10−80.67
Prod_OH1.94 × 10−667.01
Prod_O•−6.05 × 10−82.09
Prod_ClO8.58 × 10−729.63
Prod_O₃1.75 × 10−80.60
[ClO]₀ = 500 µM
RhB1.25 × 10−6
Prod_Cl4.61 × 10−90.37
Prod_OH7.84 × 10−762.78
Prod_O•−2.12 × 10−81.70
Prod_ClO3.69 × 10−729.54
Prod_O₃7.00 × 10−85.61
[ClO]₀ = 300 µM
RhB2.70 × 10−7
Prod_Cl5.60 × 10−100.21
Prod_OH1.31 × 10−748.43
Prod_O•−3.32 × 10−91.23
Prod_ClO9.16 × 10−833.93
Prod_O₃4.38 × 10−816.21
Table 3. Computed RhB degradation rates, product formation rates, and the subsequent contribution of each reactive species to the overall degradation rate of RhB for various liquid temperatures. The contribution is calculated using the selectivity equation (Equation (1)).
SpeciesRate (M/s)Contribution (%)
Temp. 25 °C
RhB2.89 × 10−6
Prod_Cl1.93 × 10−80.67
Prod_OH1.94 × 10−667.01
Prod_O•−6.05 × 10−82.09
Prod_ClO8.58 × 10−729.63
Prod_O₃1.75 × 10−80.60
Temp. 35 °C
RhB3.35 × 10−6
Prod_Cl2.27 × 10−80.68
Prod_OH2.32 × 10−669.25
Prod_O•−7.25 × 10−82.16
Prod_ClO9.18 × 10−727.39
Prod_O₃1.72 × 10−80.51
Temp. 45 °C
RhB4.58 × 10−6
Prod_Cl3.18 × 10−80.69
Prod_OH3.38 × 10−673.77
Prod_O•−1.06 × 10−72.31
Prod_ClO1.03 × 10−622.50
Prod_O₃3.33 × 10−80.73
Temp. 55 °C
RhB5.87 × 10−6
Prod_Cl4.07 × 10−80.69
Prod_OH4.55 × 10−677.54
Prod_O•−1.43 × 10−72.44
Prod_ClO1.03 × 10−617.53
Prod_O₃3.50 × 10−80.60
Disclaimer/Publisher’s Note: The statements, opinions and data contained in all publications are solely those of the individual author(s) and contributor(s) and not of MDPI and/or the editor(s). MDPI and/or the editor(s) disclaim responsibility for any injury to people or property resulting from any ideas, methods, instructions or products referred to in the content.

