Article

Computational Fluid Dynamics Modelling of a Laboratory Spray Dry Scrubber for SO2 Removal in Flue Gas Desulphurisation—Effect of Drying Models

by
Letsabisa Lerotholi
1,2,*,
Raymond C. Everson
1,
Burgert B. Hattingh
1,
Lawrence Koech
2,
Ignus Le Roux
3,
Hein W. J. P. Neomagus
1 and
Hilary L. Rutto
2
1
Eskom Power Engineering Programme (EPEP), Specialisation Centre for Emissions Control, Centre of Excellence in Carbon Based Fuels, Faculty of Engineering, North-West University, Private Bag X6001, Potchefstroom 2520, South Africa
2
Clean Technology and Applied Material Research Group, Department of Chemical and Metallurgical Engineering, Vaal University of Technology, Vanderbijlpark Campus, Private Bag X021, Vanderbijlpark 1900, South Africa
3
Aerotherm, Block B, Deus Exorno, Bondev Park, Eldoraigne, Centurion 0171, South Africa
*
Author to whom correspondence should be addressed.
Processes 2024, 12(9), 1862; https://doi.org/10.3390/pr12091862
Submission received: 10 August 2024 / Revised: 27 August 2024 / Accepted: 29 August 2024 / Published: 31 August 2024
(This article belongs to the Section Separation Processes)

Abstract

:
Spray dry scrubbing is widely used for SO2 abatement, but high removal efficiencies are required for economical operation. Whereas SO2 removal dependence on the drying rate has been investigated, available modelling work has not addressed the impact of selected drying models on the removal efficiency; instead, a single drying model is often assumed. In the present work, computational fluid dynamics is used to numerically model the SO2 removal in a laboratory-scale spray dry scrubber. The Euler–Lagrangian framework is used to simulate the multiphase interaction and two drying models are used: the widely used classical D2-law model and the mechanistic model. In addressing shortcomings from previous works, this study also provides a comprehensive model development and robust model validation with quantifiable metrics for goodness-of-fit, including R2. Also presented are key parameters associated with SO2-removal efficiency, including the exit product moisture content and droplet dynamics. The mechanistic model gave a better representation of the SO2-removal efficiency. The latter was found to be dependent on the inlet temperature, the calcium-to-sulphur and liquid-to-gas (L/G) ratios, with a high L/G ratio having the most significant impact on the removal efficiency, although resulting in a higher product outlet moisture content.

Graphical Abstract

1. Introduction

Pollutants such as sulphur dioxide (SO2), oxides of nitrogen, and particulate matter are produced during the combustion of fossil fuels for power generation and in industries such as iron and steel making during the sintering process [1,2]. These pollutants have negative environmental effects—inhalation thereof can have adverse effects on heart and lung health, which may even be fatal. Worldwide, governments are imposing stricter legislation to combat the release of these pollutants into the atmosphere [3]. Much work is, therefore, required to ensure that current abatement technologies meet these increasingly more stringent emission standards. The process of SO2 removal from flue gas is often referred to as flue gas desulphurisation (FGD). Several desulphurisation technologies are employed in the power industry; the most common are scrubber techniques comprising wet FGD, semi-dry FGD, and dry FGD technologies [4,5]. In these technologies, hot flue gas is contacted with an alkali-based sorbent for the removal of SO2 from the gas phase [6,7].
For the wet and semi-dry processes, the sorbent is a slurry, while the dry process utilises dry sorbent [5,8]. The wet FGD process produces a wet concentrated slurry product that is dewatered and sold as gypsum, while the semi-dry and dry processes produce a dry product that is normally landfilled [9,10]. The main advantage of the wet FGD method is the high desulphurisation efficiencies (>90%) achievable with this technology; however, the handling of acidic slurries downstream generates waste water that requires comprehensive treatment [11]. The semi-dry FGD usually has lower efficiencies but uses about 60% less water than an equivalent wet FGD plant and no waste water is produced because the product exits the scrubber as a dry product [10,12]. It is the preferred method in regions where water scarcity is an issue. The semi-dry FGD method is commonly implemented in a spray dry scrubber (SDS), where the sorbent slurry is atomised into a spray of droplets for high heat and mass transfer rates. A circulating fluidised bed (CFB) may also be used; however, spray dry scrubbing (SDSCR) still constitutes a large percentage of the available semi-dry processes [9,12]. The focus of this study is on semi-dry FGD in an SDS—also referred to as SDSCR.
Spray dry scrubbing is a multiphase, multiphysics, and multiscale process that requires convoluted models. In recent years, because of the availability of increased computing capabilities, computational fluid dynamics (CFD) has been used to comprehensively model the convoluted details [3,4]. There is agreement that the desulphurisation efficiency in the semi-dry FGD process is a result of the competing processes of droplet drying and SO2 absorption [13,14]. Therefore, the three key phenomena that must be described in modelling this process are the hydrodynamics, the evaporation or drying of the atomised droplets, and the resultant SO2 absorption [4]. Current advances in FGD are focused on high-performance scrubbers able to achieve >98% removal efficiencies [9]. As, for the general SDSCR processes, achievable desulphurisation efficiencies hardly exceed 70% for a calcium-to-sulphur (Ca/S) ratio of 1–2, additional work is required to further enhance the technology’s desirability [13,15]. Comprehensive modelling is, therefore, necessary to capture the detailed phenomena of the multiphase heat, mass, and momentum transfer occurring within the SDS, towards then improving process optimisation aimed at increasing SO2-removal efficiency.
Research has shown that most of the CFD modelling of the FGD process has been conducted for the wet FGD process. Significant work has been conducted by Marocco and Inzoli [16] and, more recently, by Qu et al. [17]. The trend is changing, however, with complementary research on the semi-dry FGD, particularly in CFBs [18,19] and spouted beds [20,21], coming to the fore. The continued research on SDS [22,23,24], nonetheless, testifies to the importance of this technology in the abatement of SO2 emissions from coal- and fossil-based power plants, which continue to be the dominant source of energy in both developed and developing economies. Katolicky and Jicha [15] used CFD to model SO2 removal in a laboratory SDS that had been fitted with a two-fluid nozzle. They later extended their work to investigate SO2 removal in an industrial-scale SDS that had been fitted with a rotary atomiser [25]. This work assumed the initial particle size distribution (PSD) of the atomised droplets while other droplet parameters were taken from previous studies. Further recent studies on modelling an industrial SDS include those of Liu et al. [24] and Mei et al. [26]. Liu et al. [24] investigated the SO2-removal characteristics in an industrial FGD reactor. In their work, they investigated mono-sized droplets of the slurry. This approach holds the advantage of simplifying the analysis work, although it does not fully represent the real process where particles of various sizes are always produced by the injection nozzle. They based their model verification work on earlier studies carried out by Hill and Zank [14]. Mei et al. [26] used a rotary atomiser in their process. Similarly, a model simplification of the atomisation process was achieved through the use of single-sized particles. It is thus evident that further work should be carried out in an effort to achieve adequate representation and analysis of the SDSCR process.
There are generally two approaches that are used for modelling the drying kinetics in SDSCR. One approach treats the slurry droplets as pure water and thus focuses on evaporation being the medium for water removal, assuming no effect from either the dissolved or suspended solids [27,28]. The evaporation models in this category include the perfect shrinkage model, the classical D2-law model, and further amendments of the classical D2-law model. The second category takes into account the different drying regimes, incorporating the effect of solids hindrance on the water-removal process [29]. These are also referred to as the hindered-drying models. They include the lumped-parameter models, the internal diffusion-based models, and mechanistic models. A detailed review of the different drying models applicable in spray drying and SDSCR was recently reported by the authors [4], giving further details on the derivation and applicability of the two modelling approaches presented above [4].
A major challenge associated with the second modelling approach is the complexity linked with its implementation and the computational cost. This has led to the first-mentioned modelling approach finding prominence in published CFD works, such as work by Liu et al. [24], Mei et al. [26], and Katolicky and Jicha [25]. Amongst the simplified evaporation models, the classical D2-law model has found greater usage in published works partly due to increased accuracy emanating from its further variation to incorporate the Stefan flux in the removal rate [30,31]. Of the hindered drying models, the diffusion-based models are the most complex—the lumped-parameter models require additional experimentation—leaving the simpler mechanistic models as the most viable option when considering the computational cost. In 2000, Hill and Zank [14] proposed a simple mechanistic model; however, it has not found wide usage in the SDSCR environment. Selecting the appropriate drying model capable of accurately describing the multiphase flow process in SDSs is crucial for a full understanding of the process. Nevertheless, in previously published studies on SDSs, some authors have selected a single model with the assumption that the chosen model remains valid for the particular case being investigated. Given that water evaporation is important in determining the desulphurisation efficiency, the present work does not assume a single model but rather investigates both the classical D2-law model and mechanistic model in an effort to more fully understand the impact of drying on SO2-removal efficiency.
Notwithstanding the foregoing discussion on the ongoing application of CFD to SDSCR processes, there remains a paucity of investigations into achieving a more comprehensive understanding of the complex processes in SDSCR—a problem wherein CFD modelling is better suited to provide answers, given the ever-increasing computation power and modelling capability that had presented a challenge to earlier researchers. A further concern associated with the modelling work carried out to date is the limited validation of the modelling results with real or experimentally measured process data. Our study now seeks to close these gaps—it now presents both modelling work and associated validation experiments. Furthermore, it develops a comprehensive model that considers the three key phenomena characterising the SDSCR process: process hydrodynamics, droplet drying and SO2 absorption. Sensitivities are investigated in terms of the Ca/S ratio as well as the effect of varying the inlet liquid-to-gas (L/G) ratio on SO2-removal efficiency. The sorbent utilisation and final product moisture content are also analysed, alongside the realised SO2-removal efficiency.

2. Materials and Methods

The Buchi B-290 laboratory spray dryer (with a spray chamber height and diameter of 0.48 m and 0.154 m, respectively) was used to study the desulphurisation of flue gas using limeslurry (with the lime having an assay of 99 wt % calcium hydroxide and supplied by Kayla Africa Suppliers and Distributors, Johannesburg, South Africa). Artificial flue gas was generated by dosing SO2 (99 vol % assay grade and supplied by Afrox, Vanderbijlpark, South Africa) in air (with known humidity and temperature), as per the set-up shown in Figure 1. The flue gas, supplied by an air blower having a rated capacity of 35 m3/h, was introduced into a heated section of the column (fitted with a 2.3 kW electrical coil). Heating control was achieved using a PT100 fuzzy logic controller having a control accuracy of ±2 °C. The gas was then co-currently contacted with a spray of lime slurry droplets in the spray chamber or column. A two-fluid nozzle (0.7-mm nozzle tip and 1.5-mm cap size) was used to effect the atomisation. Droplet drying and SO2 absorption occur simultaneously in the column and the droplets that exit as dry particles are separated from the gas stream using a cyclone located downstream of the column.
The column was modified to incorporate five sampling points at equal distances of 0.095 m axially along the column at the locations shown as Levels 1–5 in Figure 1. These were used for measurements of the desired parameters, including the temperature and SO2 content of the gas phase inside the column. All values for temperature and inlet gas humidity were measured using a thermocouple and humidity probe (HygroPalm 23: HC2–IC102 probe supplied by Action Instruments South Africa (AISA) (Pty) Ltd., Johannesburg, South Africa), together with the in-built Buchi B-290 spray dryer thermocouples, the locations of which are shown in the figure. Within the column, the measurements were carried out using an amended micro-separator device as designed by Kievet [33]. An SO2 analyser (Testo 340 analyser supplied by Testo South Africa (Pty) Ltd., Johannesburg, South Africa) was used to intermittently measure the concentration of the SO2. All runs were performed in triplicate after obtaining steady temperature and SO2 concentration values. The mean values of the measured variables are then reported.
Further experiments were conducted. Selected parameters were varied to determine their effects on SO2-removal efficiency. These parameters included the inlet flue-gas temperature and the Ca/S ratio at an L/G ratio of 0.024. The ranges of the investigated parameters were selected based on operational parameters in industrial plants as well as previous experimental investigations on SDSCR [13,14]. Here, for the parameter ranges, the rated capacities of the laboratory equipment used were also taken into account. The associated SO2-removal efficiency and temperature measurements were conducted at the axial locations shown in Figure 1. Table 1 details the experimental conditions for the seven different case studies undertaken.

3. Numerical Model

The SDSCR mechanism may be explained by three key phenomena occurring during the SO2-removal process; these entail the modelling of hydrodynamics, droplet-drying modelling and SO2-absorption modelling. This section addresses the numeric modelling and supporting theory for the development of the comprehensive models used in this study considering these three key phenomena.

3.1. Hydrodynamic Modelling

The interaction between gas and droplets was modelled using the Euler–Lagrangian framework where the gas was modelled as the continuous phase (Eulerian approach) with the spray being the dispersed phase (Lagrangian approach). The governing equations in the continuous phase, the equations describing mass, heat, and momentum conservation, are given as Equations (1)–(4), while Equations (10)–(13) give the dispersed-phase formulations.

3.1.1. Continuous Phase

The governing equations of mass, heat, and momentum conservation for the continuous phase are given as follows:
Mass conservation
ρ t + · ρ u ¯ = S m
Species conservation
( ρ w A ) t + · ρ w A u ¯ = · ρ w A D A B + S m A
Energy conservation
ρ E t + · ρ u ¯ E = P · u ¯ + · k c T + ρ u ¯ g ¯ + S E
Momentum conservation
ρ u ¯ t + · ρ u ¯ × u ¯ = P + · τ τ R + ρ g ¯ + S m o m
where S is any additional source or sink term in the equations provided.
The shear stress transport (SST) k–ω model has been used successfully in spray drying operations and was used in order to capture the flow turbulence in this work [34,35]. When compared to other turbulence models, the SST k–ω model was selected for this work due to its success in previous studies in spray drying, including in the work of Langrish et al. [35], who studied a similar co-current spray drying operation as opposed to a counter-current contacting system. The SST k–ω model is also advantageous in that it blends the k–ε and k–ω models to best capture the free turbulence with the k–ε model and near-wall turbulence with the k–ω model [34,35]. The turbulence as described by the SST k–ω model is given in Equations (5)–(9), where the kinetic energy (k) is defined as
( ρ k ) t + · ρ k u ¯ = · μ + μ t σ k k + P k ρ β * ω k
The specific dissipation rate (ω) is given as
( ρ ω ) t + · ρ ω u ¯ = · μ + μ t σ ω ω + α P ω ρ β ω 2 + 2 ρ 1 F B 1 σ ω , 2 ω k ω
Here, the eddy viscosity (µt) is given as
μ t = ρ k ω m i n α * , a 1 ω ς F E
and the production of the turbulent kinetic energy (Pk) and the dissipation rate (Pω) described as
P k = m i n μ t ς 2 , 10 ρ β * k ω
P ω = P k m i n k ω α * , a 1 ω ς F E
FE and FB are blending wall functions, β* and β are turbulence-model constants, and α* and a1 are flow-transition constants. σk and σω are the turbulent Prandtl numbers for the turbulent kinetic energy and dissipation rate, respectively, and ς is the invariant strain rate.

3.1.2. Dispersed Phase

The corresponding governing equations for the dispersed phases are given as follows for the kth droplet/particle:
Trajectory
d x ¯ d t = v ¯
Mass
d m d d t = S k , m
Momentum
m d d v ¯ d t = S k , m o m + m d g ¯
Energy
m d C p d d T d d t = S k , E
In this study, the dispersed-phase source terms above were deduced from the equations given below.
The momentum balance source was computed using Equations (14)–(16), where the drag force and gravitational contribution are shown, and any additional forces such as the pressure gradient force, lift force, and added mass force are included as F
d v ¯ d t = C D 18 μ ρ p d R e p 24 u ¯ v ¯ + g ρ p ρ ρ p + F
The Schiller–Neumann correlation was used to describe the drag force
C D = 24 ( 1 + 0.15 R e p 0.687 ) R e p f o r   R e p 1000
R e p ρ u ¯ v ¯ d d μ
The energy source contribution was computed through the use of Equations (17) and (18), as follows:
m d C p d d T d d t = h A d T T d + h v a p m ˙ d
where the Ranz and Marshall’s Nusselt number (Nu) correlation was used to compute the transfer coefficient, h.
N u = 2 + 0.6 R e p 0.5 P r 0.33
The species mass transfer involving the water-removal rate as well as that involving SO2 absorption are given in detail in Section 3.2 and Section 3.3. All the source terms were evaluated by volume averaging of the individual dispersed-phase parcel source term contributions within a cell volume.

3.2. Droplet Drying Modelling

The use of the classical D2-law model and the mechanistic model was investigated. The former simplifies the drying phenomenon by disregarding the influence of solids on the water-removal rate. The latter takes into account the hindrance of solids on the water-removal rate [4].
The classical D2-law model is given by Equations (19)–(21) as follows:
d m d d t = ρ k H 2 O ,   g A d ln 1 + B M
here BM is the Spalding transfer number equating to
B M = w H 2 O ,   w H 2 O ,   s 1 w H 2 O ,  
and k H 2 O ,   g is the gas-phase mass transfer coefficient. It can be determined from the Ranz and Marshall Sherwood number (Sh) correlation as follows:
S h = 2 + 0.6 R e p 0.5 S c 0.33
The mechanistic model is formulated from Equations (21)–(24) as follows:
d m H 2 O d t = ρ ¯ K H 2 O , g A d l n 1 y H 2 O , 1 y H 2 O , s
where
1 K H 2 O , g = 1 k H 2 O , g + 1 D H 2 O , g S d i , d a g A a g
Here, the mass transfer coefficient K H 2 O , g includes an additional resistance to the mass transfer rate—it is implemented only when the falling rate ensues. The A a g is the fixed droplet area post the critical moisture content (it is also referred to as the agglomerate area) and S d i , d a g is defined as follows:
S d i , d a g = 2 π 1 d i 1 d a g
Here, d i is the diameter of the liquid interface which recedes inside the wet particle and d a g the diameter of the agglomerate. This process is addressed further in the next section (Section 3.3) when explaining the simultaneous process of water and SO2 migration.

3.3. SO2 Absorption Modelling

It is widely accepted that the two-film theory describes the gas–liquid reactions that take place during the absorption of SO2 into the liquid slurry phase in SDSCR. Figure 2 shows an extension of the two-film theory to include a third phase, in this case, the solid sorbent phase, describing the semi-dry FGD process, where the two-film theory is followed by an unreacted shrinking core model (as presented by Hill and Zank in 2000 [14]).
According to the two-film theory, the rate of SO2 absorption from the flue gas is proportional to the driving force multiplied by the mass transfer coefficient ( k S O 2 , g ) and the interfacial mass transfer area (a):
n ˙ S O 2 ,   g = k S O 2 , g a p S O 2 , p S O 2 , i
On the other hand, the rate of transfer of SO2 across the liquid film is directly proportional to the difference between the SO2 concentration in the gas–liquid interface and the bulk liquid:
n ˙ S O 2 ,   l = k S O 2 , L a c S O 2 , i c S O 2 , l
where k S O 2 , L is the liquid-side mass transfer coefficient.
One of the assumptions of the two-film theory is that the quantities of the respective species contained in the films are insignificant compared to those passing through. This is due to the films being very thin. As a result, the species that diffuses through the gas film can be assumed to also diffuse through the liquid film. The mass transfer resistances are thus considered to be in series, and the overall transfer rate can be given by
n ˙ S O 2 = K S O 2 , g a p S O 2 , p S O 2 , l * = K S O 2 , L a c S O 2 , * c S O 2 , l
where K S O 2 , g and K S O 2 , L are the overall mass transfer coefficients. p S O 2 , l * and c S O 2 , * are the equivalent partial pressure and concentration of the bulk gas and bulk liquid, respectively.
The two-film theory as presented above assumes that the dissolution of the hydrated lime sorbent within the droplet is infinite, with the implication that there is always a sufficient supply of calcium ions for an instantaneous reaction with the dissolved sulphurous species. Consequently, a spherical reaction front around the droplet ensues, where there is also precipitation of the hemihydrate with an unreacted core, the size of which decreases as the hemihydrate layer increases during the reaction process. This takes place concurrently with droplet shrinkage as a result of evaporation. The shrinkage is taken to be homogeneous in nature and it continues until the critical moisture content is realised, at which point the droplet size remains fixed (fixed particle agglomerate diameter) and the interface then recedes into the wet particle (Figure 3).
In terms of the desulphurisation process, the liquid-phase reaction of the dissolved SO2 with dissolved Ca(OH)2 is generally presented as follows (Equation (28)):
S O 2 a q + C a O H 2 a q C a S O 3 · ½ H 2 O ( a q ) + 1 2 H 2 O ( a q )
Calcium sulphite hemihydrate is the main product, although, in practice, there are other side reactions that result in the formation of CaSO4 and CaSO4·2H2O. The foregoing reaction as well as the two-film theory presented above show that the reaction progresses in the liquid phase, thus highlighting the importance of the drying rate or the water removal process in determining the efficiency of the SO2 removal process.
In practice, the above general reaction involves a series of steps as outlined below (Equations (29)–(36)). The reaction sequence commences with the gas-phase diffusion of SO2 from the bulk gas phase to the droplet surface. This is followed by the absorption of gaseous SO2 into the aqueous phase
S O 2 ( g ) S O 2 ( a q )
The next step is the formation of the sulphurous acid and its ionisation via the following:
S O 2 a q + H 2 O ( l ) H 2 S O 3 ( a q )
H 2 S O 3 ( a q ) + H 2 O l H 3 O + ( a q ) + H S O 3 ( a q )
H S O 3 ( a q ) + H 2 O l H 3 O + ( a q ) + S O 3 2 ( a q )
The dissociation of calcium hydroxide then follows
C a O H 2 a q C a 2 + ( a q ) + 2 O H ( a q )
The next step is the liquid-phase diffusion of the sulphurous ions to the reaction front, followed by the liquid-phase diffusion of the calcium ions to the reaction front and then the resultant reaction at the reaction front.
H 2 S O 3 a q + 2 O H a q S O 3 2 a q + 2 H 2 O l
H S O 3 a q + O H ( a q ) S O 3 2 a q + H 2 O l
2 C a 2 + a q + 2 S O 3 2 a q + H 2 O ( l ) 2 C a S O 3 · ½ H 2 O ( a q )

3.4. Effect of pH on the Reaction Chemistry

Sulphur dioxide absorption involves the movement of SO2, by diffusion, from the bulk gas phase into the slurry in which chemical reactions (discussed in the previous section) take place. Several authors have shown that different absorption regimes can be defined based on the rate of reaction of SO2 in the liquid phase [37,38]. Table 2 shows the regimes as adapted from Mchabe et al. [37]. Three regimes are presented, giving different characteristics of SO2 absorption. These are dependent on the pH of the solution in which the SO2 reactions take place. Regime I, which is characterised by neutral pH to highly alkaline conditions, is associated with instantaneous dissociation of SO2 in the liquid phase accompanied by immediate reaction with the alkaline sorbent, thus the mass transfer of SO2 is controlled by the gas-phase resistance. In Regime II, which refers to the medium acidic pH range, both the gas-phase and liquid-phase mass transfer resistances are applicable, with the absorbed SO2 undergoing a fast reaction but it is still able to accumulate in the liquid phase. Regime III is characterised by high acidic conditions where there is limited availability of the alkaline sorbent in solution, resulting in limited or no aqueous SO2 dissociation due to the high concentration of H+ ions. In this case, the gas-phase resistance to mass transfer is insignificant. The liquid-phase mass transfer resistance is the controlling mechanism.
In this work, hydrated lime was used as the sorbent of choice; it gave highly alkaline solutions of calcium hydroxide when mixed with water to form the sorbent slurry. The minimum pH of the alkaline slurry was 12 (as measured in the laboratory), thus corresponding to Regime I (described earlier). The SO2 absorption was, therefore, characterised by the instantaneous reaction in the liquid phase with the resistance to mass transfer being in the gas phase. Consequentially, in the subsequent analysis, only the gas-phase resistance was used in determining the SO2 mass transfer rate during the absorption process. In this case, the molar transfer rate of SO2 may be given by Equations (37) and (38)
n ˙ S O 2 = ρ ¯ k S O 2 ,   g A d y S O 2 , y S O 2 , i
where k g ,   S O 2 can be determined from the Sherwood number for the classical D2-law model
S h = k S O 2 ,   g d d D S O 2 , g = 2 + 0.6 R e p 0.5 S c 0.33
For the mechanistic model, the transfer coefficient is amended to consider the hindrance of the solids on the transfer process, giving Equations (39) and (40)
n ˙ S O 2 = ρ ¯ K S O 2 , g A d y S O 2 , y S O 2 , i
where
1 K S O 2 , g = 1 k S O 2 ,   g + 1 D S O 2 ,   g S d i , d a g A a g

4. Numerical Solution Approach

The numerical solution was implemented in STARCCM+® (v.16.02.008) where 2,468,780 volumetrically controlled 3D polyhedral mesh cells with eight prism layers were generated. A multicomponent ideal and compressible gas was used to model the artificial flue gas, wherein SO2 was introduced as a passive scalar in the continuous phase and another passive scalar introduced in the dispersed phase. The model made use of the interaction of these passive scalars to allow for the passive scalar transfer from the Eulerian to the Lagrangian phase. Thereafter, the desulphurisation or SO2-removal efficiency ( η ) of the process was computed as per Equation (41).
η = n ˙ S O 2 , i n l e t n ˙ S O 2 , i n ˙ S O 2 , i n l e t
For the investigation of select cases (Table 1: Cases 3, 6 and 7), where the impact of the Ca/S ratio on the desulphurisation efficiency was investigated, the calcium hydroxide utilisation ( ζ ) was computed from Equation (42) as follows:
ζ = n ˙ C a ( O H ) 2 , i n l e t n ˙ C a ( O H ) 2 , i n ˙ C a ( O H ) 2 , i n l e t = η λ
A thermal conductivity of 0.74 W/mK for the scrubber’s borosilicate glass (as reported by Hanus and Langrish [39]) and a heat transfer coefficient of 5 W/m2K for natural convection [40] were used to account for the heat loss to the environment. The droplet PSD was modelled by measuring the exit PSD and using the back-calculation method as described by Woo et al. [41], through the Rosin–Rammler description, to determine the mean droplet size and spread parameter. The cone shape and angle were determined from the work of Poozesh et al. [42]. A species mass source on a select volume of cells around the nozzle area was implemented to model the atomisation gas. Together with the described drag force acting on the droplets, the virtual mass and shear lift forces were also included. The Rohsenow correlation was also implemented to account for the stuck droplet heat and mass transfer. Submodels of the classical D2-law and the mechanistic model were implemented using user code. The appended cyclone was also included as a submodel in order to account for the associated pressure drop across the equipment. The model simulated the case investigations given in Table 1; it was also used to predict additional cases to investigate further sensitivities, such as the effect of the L/G ratio on the SO2 removal rate or desulphurisation efficiency. Further details of the model boundary conditions used in the study are given in Table 3.
An unsteady state solution of the single-phase flow of the gas was solved first until convergence and then the slurry droplets were introduced into the domain. Convergence was assessed by monitoring the residual values, the element count within the domain, the exit temperature, and the exit SO2 mass fraction. Mesh independence studies as well as parcel independence studies were conducted to ascertain that the model solution was independent of these input variables. Three mesh sizes were investigated as part of the conventional grid independence test for this work. These are a course-sized grid of 537,429 cells corresponding to a 0.02 mm cell base size, a medium-sized grid of 2,468,780 cells corresponding to a 0.01 mm cell base size, and a fine grid of 3,178,420 cells corresponding to a 0.005 mm cell base size. The CFD results for selected key process parameters (the SO2-removal efficiency and the temperature sampled axially along the column length) were used to determine the optimum grid. The results are shown in Figure 4.
From the results in Figure 4, there is no significant change in both the predicted SO2-removal efficiency and temperature moving from the medium grid to the finer grid and, therefore, the medium-grid resolution was selected as the base for this study, noting the computational complexity that comes with running at the finer mesh size. Furthermore, the model accuracy and optimal grid resolution were judged through comparing the root mean square error (RMSE—defined in Equation (43)) obtained by comparing the measured values to the model-predicted results for the two key parameters. The values obtained for the RMSE for the SO2-removal efficiency and temperature were 5.7 and 4.1, respectively, for the medium grid, and 4.9 and 3.2, respectively, for the fine grid, thus showing good fit with measured data.
The pressure-velocity coupling was solved using the segregated flow solver. The AMG linear solver with Gauss–Seidel relaxation scheme was used for the segregated flow, species and energy solver with a first-order upwind convection scheme.

5. Results and Discussion

The results of our investigations into the desulphurisation are now presented. First, model-generated profiles of variables are presented, giving insight into the nature and characteristics of the convoluted process dynamics inside the SDS. Second, a comparison between the two drying models (the classical D-2 law and the mechanistic) for their predictive capability of the SO2-removal efficiency, using the root mean square error (RMSE) to judge the goodness-of-fit (Equation (43)), is presented. The percentage error (Equation (44)) is also used to compare some model results to the experimental data as well as the coefficient of determination, R2 (Equation (45)). The section then concludes with a presentation of the effects of some of the key variables in the SDSCR process, including the Ca/S ratio and L/G ratio, on desulphurisation efficiency, product moisture content, and sorbent utilisation.
R S M E = 1 n i = 1 n y i y ^ i 2
A b s o l u t e   e r r o r = y i y ^ i
R 2 = 1 i = 1 n y i y ^ i 2 i = 1 n y ^ i y i ¯ 2
where n is the number of observations, y ^ i is the observed values, and y i is the model-predicted values, and y i ¯ is the average of the observed values.

5.1. SO2 Removal and Associated Variables

Figure 5 gives the results from the CFD model developed for the SO2 removal process. Also shown are measurement locations for the evaluation of the removal efficiency (η) and temperature measured (T) at the sampling locations shown in Figure 1. The profiles shown are only for the Case 2 setting, where the following applied: inlet temperature of the flue gas was 130 °C, a Ca/S ratio of 1, and an L/G ratio of 0.024. Furthermore, the mechanistic model was used to describe the drying kinetics and also capture the general trends seen for the other cases. Figure 5 shows that SO2 efficiency increases down the column, as is evident from the radial and axial profiles shown in Figure 5a–c. Such behaviour is expected as the injected droplets interact with the SO2-containing gas, where the SO2 is progressively absorbed while the droplets traverse the column. A closer look at the radial profile of SO2 efficiency in Figure 5a, for each sectional plane, reveals a central region having low efficiency, with the efficiency increasing towards the walls of the column. This region of low efficiency is associated with a high-velocity central jet stream (see Figure 5f), which decreases down the length of the column. This decrease is a result of better mixing and recirculation that is present in the lower section of the column. The decrease in the SO2 content of the gas is accompanied by an increase in the gas humidity and a decrease in the gas temperature, as a result of the simultaneous droplet drying process. The gas profiles also indicate that there is a bias in the overall velocity profile, with recirculation towards one side of the column in the direction opposite to the location of the sampling points. This region of high recirculation is characterised by relatively high humidity and low temperatures (see Figure 5d,e), conditions which are favourable for high SO2-removal efficiency.
Table 4 compares the actual measured values of the SO2-removal efficiency and flue-gas temperature to the model-predicted values down the column and at the sampling points as shown in Figure 5. The information in the table is in line with the profiles shown in the figure—there is an increase in SO2-removal efficiency down the column, accompanied by a general decrease in the gas temperature. The RMSE is also used to indicate the goodness-of-fit values for the model SO2-removal efficiency and gas temperature: values were 5.7 and 4.1, respectively. A point to note from the data in the table is that there are higher absolute errors towards the top of the column compared to the bottom of the column. This is due to the initial mixing of fresh, cooler, unreacted slurry (together with atomisation air) with the hotter inlet flue gas, as well as recirculating streams. This commences at the top section of the column, continuing in the axial direction, and thus leading to a large variation in the measured properties, which decreases with further mixing.
Figure 6 shows the corresponding droplet profiles inside the column. The concentration of absorbed SO2 is shown in the figure. It should be noted here that, in reality, some of the absorbed SO2 would dissociate further and react as shown in Equations (29)–(36). Therefore, the reported SO2 concentration is the overall absorbed SO2 for the associated droplet or particle residence time. The profiles indicate an increase in the droplet absorbed SO2 from the point of atomisation towards the bottom of the column. The profiles also show that high SO2 capture is associated with high particle moisture content and low particle residence time. This is because reactions between the SO2 and sorbent take place in the presence of water. The droplet profiles also show high particle residence times at the top of the column, indicating the presence of recirculation in the column. This region is characterised by very low mass fractions of particle water and, in turn, low SO2 content of particles. The expectation is that particles that have resided for longer periods inside the column would have higher SO2 content. However, this is not the case, as is evident from the particle profiles. This is likely a result of the recirculation of particles of smaller diameter, which dry quickly and are entrained in the recirculating flow. Subsequently, prior to drying, these particles do not absorb SO2 significantly.

5.2. Validation of the Drying Model

Validation of the two investigated drying models, the mechanistic model and the classical D2-law model, is now addressed. Figure 7 shows the variation profiles of SO2-removal efficiency within the column for the two model cases at an inlet temperature of 130 °C, a Ca/S ratio of 1, and an L/G ratio of 0.024.
It is evident from Figure 7 that higher SO2-removal efficiency is predicted for the classical D2-law model than for the mechanistic model, as shown from the plane profiles of the column. This rather unexpected behaviour, given the rigour in the development of the mechanistic model—hence it is expected to give higher efficiencies—is explained in more detail below, where a comparison of both the model predictions with experimental data is presented. Both the classical D2-law and mechanistic models show a marked increase in the SO2-removal efficiency at the top half of the column where the droplets first interact with SO2-laden flue gas, in a region characterised by a high concentration gradient for mass transfer between the continuous phase and the dispersed phase. This behaviour is limited in the lower sections of the column where the droplets already contain appreciable amounts of absorbed SO2. Overall, both models show a general increase in SO2-removal efficiency down the column. This is in line with the experimental data, which shows a similar behaviour, as well as previous work reported by Hill and Zank [14] and Katolicky and Jicha [15]. Figure 8 shows a comparison of the model-predicted SO2-removal efficiency for the classical D2-law and mechanistic models with the values measured as part of this work.
Figure 8 shows that the classical D2-law model over-predicts SO2 efficiency compared to the measured data. This is attributed to the inability of the model to account for the solid’s hindrance on the SO2 mass transfer during the drying process—as the droplet dries beyond the critical moisture content, the liquid interface recedes inside the droplet, providing increased resistance to the mass transfer of not only the water from the liquid surface but also to the SO2 transfer into the liquid surface. The classical D2-law model does not take this phenomenon into consideration because the assumption has always been that there is insignificant absorption during this latter part of the drying progression [13,43] and thus its impact on the absorption rate has not been much explored. On the other hand, the mechanistic model slightly under-predicts the removal efficiency. This can be explained by the fact that the model, in its formulation, does not consider the local droplet moisture gradients during the evaporation process, as explained earlier (Introduction section) and in an earlier review of the drying models by the authors [4]. The model nonetheless still captures the receding water front inside the droplet, but the drying rate over-prediction, when compared to the actual rate, leads to an under-prediction in observed SO2-removal efficiency. The resultant reduction in SO2-removal efficiency is due to SO2 absorption reaction dependence on the water availability in the droplet as explained previously. The RMSE was calculated to evaluate the goodness-of-fit. The values obtained for the classical D2-law model and the mechanistic model were 9.7 and 5.7, respectively. Thus, the mechanistic model best predicted the SO2 removal rate. Consequentially, in later work on looking into sensitivity analyses, only the mechanistic model results will be discussed.

5.3. Sensitivity Analysis

The SO2-removal efficiency was investigated further in terms of the effect of inlet flue-gas temperature at various Ca/S and L/G ratios. The sorbent utilisation was also calculated for the different Ca/S ratios. A comparison of model-predicted values with experimental values was also undertaken. Results revealed that the RMSE of the desulphurisation efficiency ranged between 2.6 and 6.0, and the R2 ranged between 0.77 and 0.95 as shown in Table 5 (the details of the various cases are given in Table 1). This means that for our investigations, the modelling of the SDSCR process as conducted was accurate to within an average of 4.8 percentage points when compared to the actual process occurring within the SDS. Overall, the high values of the coefficient of determination indicate a good fit between the model and measured data, with variability in the inlet temperature and the Ca/S ratio being adequately reflected in the prediction of desulphurisation efficiency. The lowest value of 0.77 agrees with the corresponding highest RMSE as noted for Case 3.

5.3.1. Effect of Inlet Temperature on SO2-Removal Efficiency

In terms of the effect of temperature on SO2-removal efficiency, Figure 9 shows that an increase in temperature from 108 °C to 142 °C at a constant Ca/S of 1.5 is accompanied by a decrease in removal efficiency. This is evident in both the experimental and model-predicted values. It can be explained to be a result of the increased water evaporation from the droplet, which increases at higher temperatures. The presence of water in the droplets as explained previously helps to improve SO2 absorption. Similar behaviour was observed for the other Ca/S ratios investigated in this work. The observation explains why relatively low temperatures are used in practice for the SDSCR process which necessitates the cooling of the generally hotter flue gas prior to the desulphurisation process.

5.3.2. Effect of the Ca/S on SO2-Removal Efficiency and Sorbent Utilisation

Figure 10 shows the effect of increasing the Ca/S ratio from 1 to 2 at a fixed inlet temperature of 142 °C. Both the measured and model-predicted values show that an increase in the Ca/S ratio results in an increase in SO2-removal efficiency. A marked increase from a ratio of 1.5 to 2 was seen, compared to that from 1 to 1.5. In practise, the Ca/S ratio may be increased by either increasing the calcium content in the slurry for a fixed SO2 content in the gas phase or reducing the SO2 amount in the gas phase in contact with the slurry having a fixed calcium content. In the former case, the improvement in efficiency with increased sorbent injection emanates from reduced water evaporation due to increased solids hindrance from the added calcium in the slurry—taking into account that SO2 absorption occurs in the presence of water. On the other hand, for the latter case, SO2-removal efficiency increases because of the corresponding increase in the available mass transfer area per unit amount of SO2 present in the system. These explanations hold for the case where physical absorption is the rate-limiting step as applicable for this study. Similar behaviour was observed for the other temperatures studied in this work.
Sorbent utilisation is defined in Equation (38) and gives an indication of how effectively a sorbent is utilised in the SO2 removal process. A high utilisation value is particularly important for the SDSCR process due to not only the high cost of the sorbent used but also to the high cost of the disposal of the solid product. Figure 11 shows the calculated sorbent utilisation for the different Ca/S ratios investigated in this work at a constant inlet temperature of 142 °C and an L/G ratio of 0.024. From the plot, the sorbent utilisation is seen to increase down the column, resulting in an increase in SO2-removal efficiency down the column, as shown in Figure 9 for all the Ca/S ratios investigated. What is also evident from the plot is a decrease in the sorbent utilisation with an increase in the Ca/S ratio. The increase in the Ca/S ratio increases SO2-removal efficiency at the cost of higher sorbent utilisation. This is further explained below.
Table 6 reports the exit SO2-removal efficiency and calculated sorbent utilisation for the three cases investigated: Cases 3, 6, and 7. Results show that despite the increase in SO2-removal efficiency with an increase in the Ca/S ratio, the utilisation decreases. This is because increasing the Ca/S ratio beyond the stochiometric requirement for a fixed inlet SO2 concentration, as was the case for the results in Table 6, will invariably lead to a reduction in the sorbent utilisation, although accompanied by an increase in removal efficiency. A 10% increase in the removal efficiency is accompanied by a >30% reduction in the sorbent utilisation. This indicates that improved efficiency may thus be forfeited for improved utilisation, where conditions allow for such a trade-off. Increasing the amount of sorbent for improved efficiency may thus be utilised when sorbent recycling is employed to improve the low utilisation.

5.3.3. Effect of the L/G Ratio on the SO2-Removal Efficiency

The effect of increasing the L/G ratio in the scrubber is presented in Figure 12 and Figure 13. Figure 12 reports SO2-removal efficiency along the axial sampling locations used in the study for four different L/G ratios. An increase in the L/G ratio was seen to result in a marked increase in SO2-removal efficiency. The highest efficiencies were observed for an L/G ratio of 0.049. For one of the L/G ratios (Case 2: L/G 0.024), validation of the measured data compared to model data was conducted. A good fit, as shown previously, was obtained with a resultant RMSE of 5.7 (shown in Table 5), giving confidence in the other model predictions at different L/G values.
Figure 13 shows the axial plane profiles for L/G ratios of 0.014 and 0.049. Higher SO2-removal efficiencies are also shown for the higher L/G ratio. It is notable that at the high L/G ratio, high efficiencies of >50% are observed midway in the column, in contrast to the low L/G ratio case where lower efficiencies are evident, even at the bottom of the column. Increasing the L/G ratio increases the amount of slurry droplets contacting the SO2-laden flue gas, and hence the available overall surface area for mass transfer, leading to an increase in the mass transfer taking place within the scrubber. Taking note that the rate-limiting step for the reaction is SO2 absorption into the liquid phase, increasing the available liquid slurry increases the amount of SO2 ending up in the liquid phase from where it instantaneously reacts to form the hemihydrate salt.
Figure 14 shows the profile of the moisture content within the column for the lower L/G ratio (0.014) and the higher L/G ratio (0.049). Both profiles show particles with low moisture content at the top of the column. This is because of the recirculation towards this section of the column; thus, the particles in this area generally have low moisture and longer residence times. In the lower section of the column, particles with a higher moisture content are seen, and for the higher L/G ratio, a larger proportion of higher moisture particles are evident—the same particles that also report to the outlet leg.
The predicted SO2-removal efficiency at the column outlet as well as the corresponding predicted moisture content of the final product were also determined for various L/G ratios. See Figure 15. With an increase in the L/G ratio, there is an increase in SO2-removal efficiency at the column outlet. Concurrently, there is an increase in the outlet product moisture content. This is attributed to the fact that increasing the L/G ratio increases the energy demand for the evaporation process. Given that the inlet temperature remains constant, the overall effect will be a reduction in the amount of water evaporated from the droplets, resulting in an increase in the outlet product moisture content. The slower the drying process, the better the SO2-removal efficiency—hence the observed simultaneous increase in SO2-removal efficiency with delayed drying. However, a wet SDS outlet product results in challenges in terms of pneumatic conveying and downstream handling, and an increasing risk of fouling inside the scrubber. Thus, in reality, a compromise has to be reached between ensuring higher efficiencies with the associated disadvantages of handling a wet outlet product and relatively lower efficiencies associated with a dry outlet product and easier handling.
Further increasing the L/G ratio ultimately changes the process to wet FGD where even higher SO2 removal efficiencies of >90% have been reported. Wet FGD handles a slurry product and thus presents the extreme end in terms of solids handling and associated treatment and disposal costs. A techno-economic evaluation will, therefore, be needed in practice to determine the appropriate SO2 removal technology. However, in dry environments where water availability is a challenge, wet FGD may not be an option and the degree of water addition (max L/G ratio that can be utilised) will also be determined from techno-economic considerations.

6. Conclusions

In this study, a comprehensive model for the desulphurisation process in a spray dry scrubber was developed. SO2 absorption was investigated, taking into account the sorbent slurry pH, which determined the relevant mass transfer mechanism for the absorption process. Under conditions of high pH (>12), the rate-controlling mechanism is governed by the transfer of SO2 from the bulk gas to the droplet interface, where all the absorbed SO2 reacts instantaneously with the calcium to form the calcium sulphite product. The resultant absorption equations were incorporated in the overall CFD model as submodels using passive scalars in STARCCM+. The developed comprehensive model was validated by comparing the model-predicted data with experimentally measured values and the RMSE was used as a measure of the goodness-of-fit.
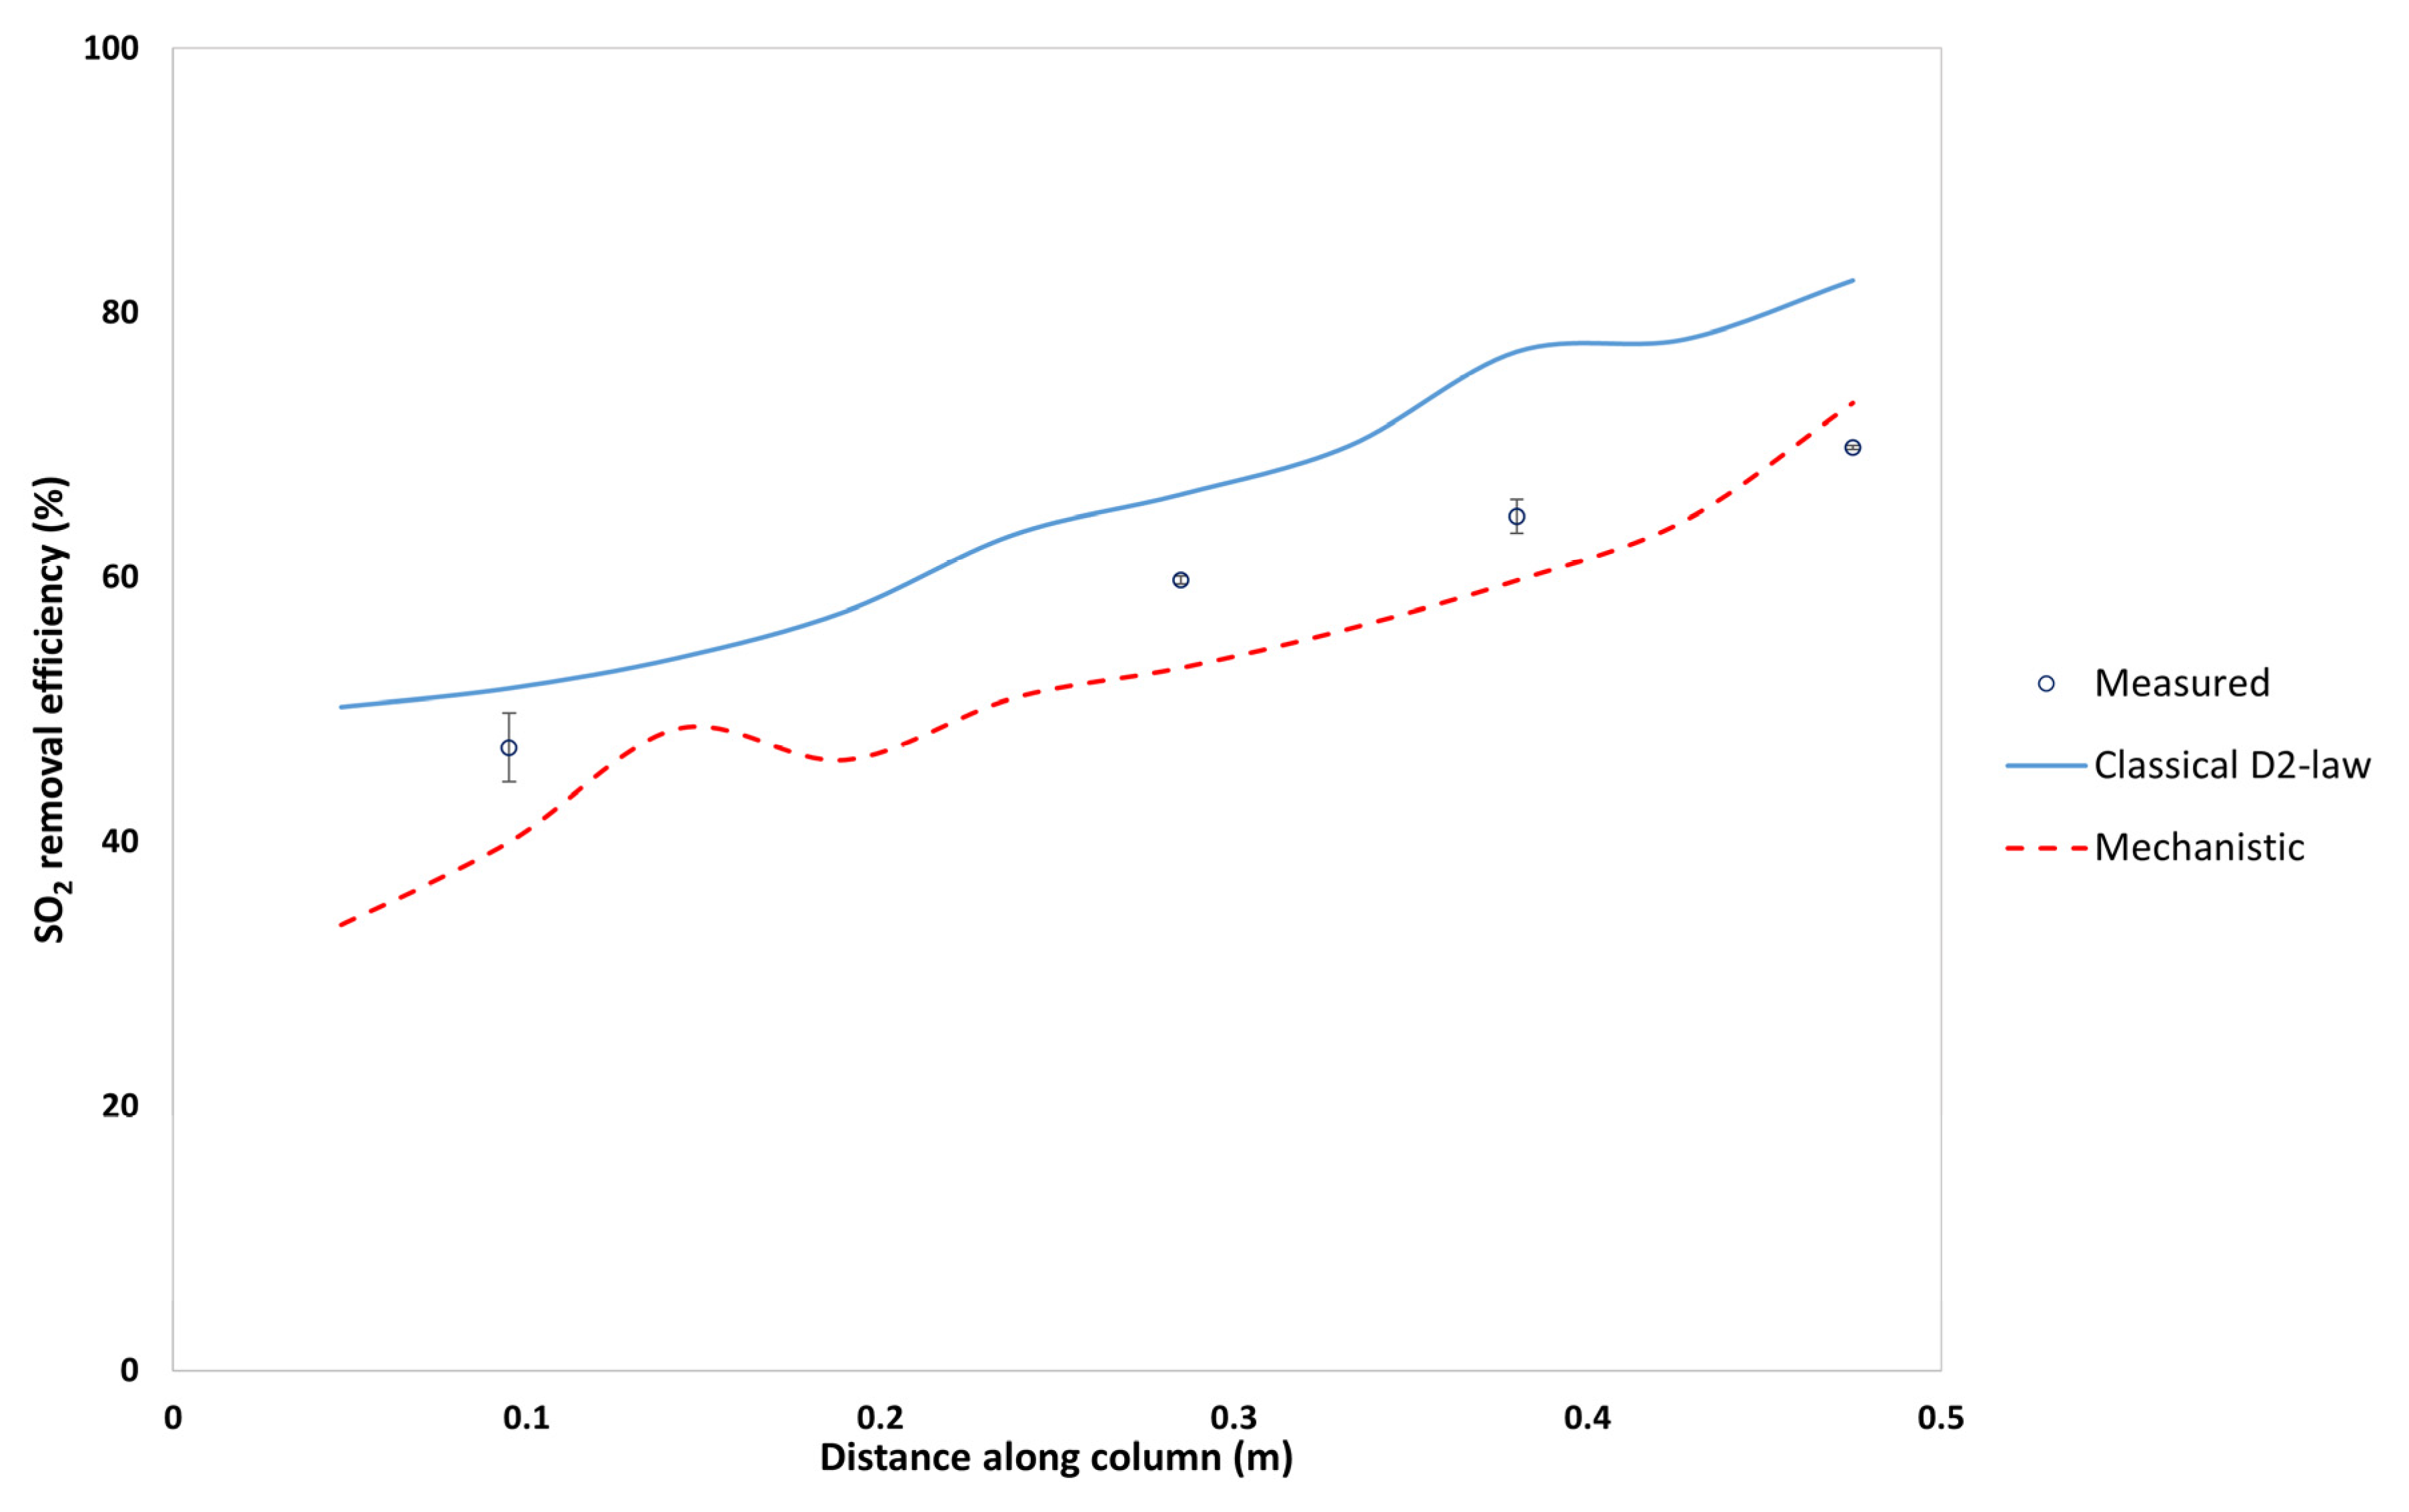
The classical D2-law model and mechanistic drying model were compared. Results indicated over-prediction of SO2-removal efficiency of the classical D2-law model compared to the mechanistic model. Such over-prediction was deemed to be a result of the classical D2-law model failing to take into account the mass transfer hindrance of the slurry solids on the SO2 mass transfer. The mechanistic model, which had previously been proven to be the best drying model, gave a better representation of the complete process incorporating SO2 absorption.
This work has highlighted the need for evaluating the applicability of the different drying models prior to their use in a comprehensive modelling framework for the spray dry scrubbing process. This is because the resultant SO2-removal efficiency is largely influenced by particle moisture, which in turn is a product of the drying process, and can only be accurately determined by considering the solids hindrance to mass transfer inside the droplet.
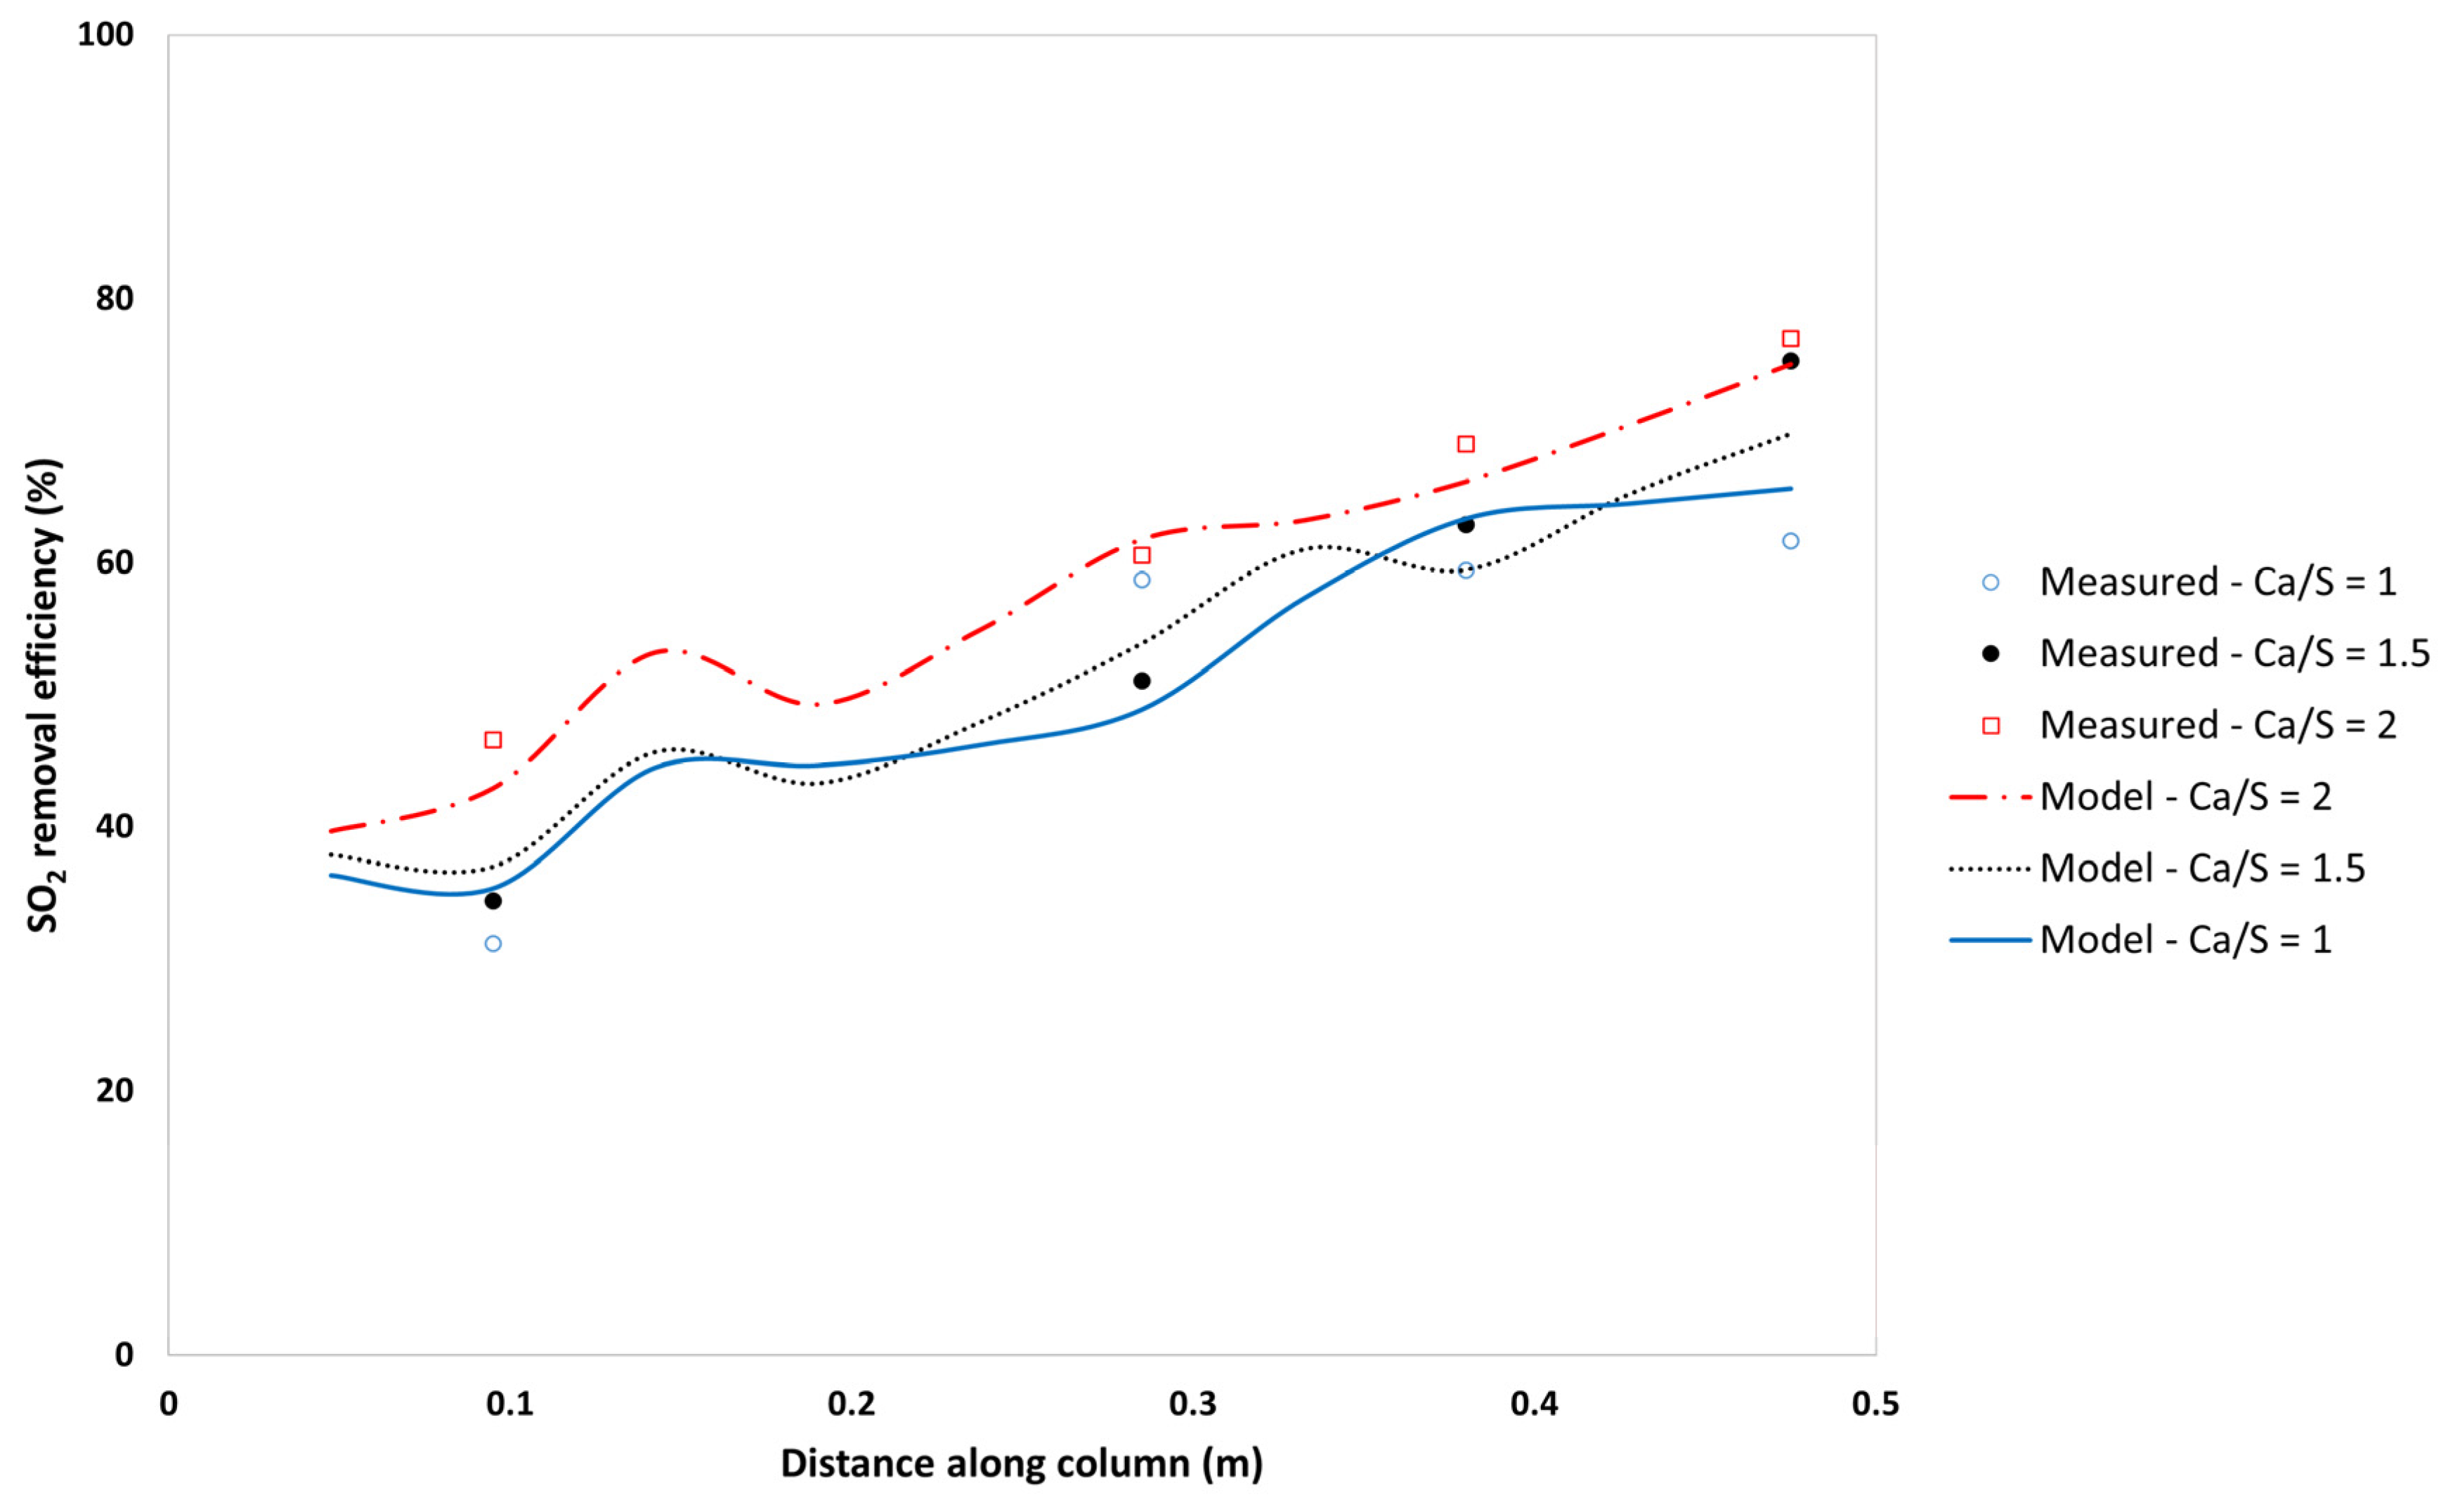
Furthermore, sensitivity analysis on key process variables was carried out and their resultant effects on SO2-removal efficiency were determined. Parameters that resulted in an increase in SO2-removal efficiency included the following: reducing the inlet flue-gas temperature, increasing the Ca/S ratio, and increasing the L/G ratio. Increasing the latter ratio had the effect of increasing the particle moisture content, which in turn increased the SO2 absorption rate, resulting in high efficiencies. A high particle moisture content was noted to be undesirable, however, due to problems with particulate handling systems, including downstream pneumatic conveying. A compromise must, therefore, be made between increasing SO2-removal efficiency at the risk of downstream operating equipment challenges as well as scrubber fouling. Sorbent utilisation, which is a measure of how effective the added sorbent is in removing SO2 in flue gas, was also determined. There was an inverse relationship between it and an increased Ca/S ratio. An increase in the efficiency resulted in a decrease in the sorbent utilisation, which, in practice, can be mitigated by recycling the used sorbent.
In conclusion, our studies have led to the development of a comprehensive model for the spray dry scrubbing process. Insight has been obtained into the complex chemical and physical processes inside the spray dry scrubber—information that the authors believe will subsequently be invaluable in optimizing both new and existing spray dry scrubbing systems. Potential further work from the study includes conducting a techno-economic assessment between semi-dry FGD as conducted in this work and wet FGD for a case where both technologies are applicable and water availability is not a concern. This stems from the fact that wet FGD is the limiting case for increasing the L/G ratio in semi-dry FGD. The authors also recommend proceeding with the study and evaluating other drying models beyond the two models investigated in this work, in predicting the SO2-removal efficiency in SDSs. These may include lumped-parameter models and even internal diffusion-based models, taking into consideration the increased computational cost associated with the more complex models.

Author Contributions

L.L.: Conceptualization, Methodology, Software, Validation, Formal analysis, Investigation, Resources, Data curation, Writing—original draft, Writing—review and editing, Visualization, Project administration R.C.E.: Conceptualization, Methodology, Resources, Writing—review and editing, Project administration, Supervision, Funding acquisition B.B.H.: Conceptualization, Methodology, Resources, Writing—review and editing, Project administration, Supervision, Funding acquisition L.K.: Methodology, Validation, Investigation, Data curation I.L.R.: Methodology, Software, Validation, Supervision, H.W.J.P.N.: Conceptualization, Resources, Writing—review and editing, Supervision, Funding acquisition H.L.R.: Conceptualization, Resources, Writing—review and editing, Supervision, Funding acquisition. All authors have read and agreed to the published version of the manuscript.

Funding

This research was funded by Eskom Holdings SOC Limited grant numbers GT/WR2011.11.08. and 4600061784. The authors gratefully acknowledge the financial support and assistance received from the Eskom Power Engineering Programme (EPEP). In particular, the financial support provided to Letsabisa Lerotholi, a student at the EPEP Emissions Control Specialisation Centre, North-West University (NWU), in collaboration with the Vaal University of Technology (VUT), is acknowledged.

Data Availability Statement

The data presented in this study are available on request from the corresponding author.

Acknowledgments

The authors are grateful for access to high computing power from the Centre for High Performance Computing of the national integrated cyber-infrastructure system (NICIS), supported by the Department of Science and Innovation (DSI), South Africa. Special thanks go to Preeya Sukdeo from Group Technology Engineering, Eskom Holdings SOC Ltd., for his input during the research.

Conflicts of Interest

Ignus Le Roux is employed by the company Aerotherm. The remaining authors declare that the research was conducted in the absence of any commercial or financial relationships that could be construed as a potential conflict of interest.

Nomenclatures

ρ Density (kg m–3) μ Viscosity (Pa s)
u Velocity (m s–1) μ t Eddy viscosity (Pa s)
w Species mass fraction (-) g Gravitational term (m1 s–2)
D Mass diffusivity (m–2 s–1)ReReynolds number (–)
t Time (s–1) P r Prandtl number (–)
E Energy per unit mass (J kg–1) S c Schmidt number (–)
P Pressure (Pa) C D Coefficient of drag (–)
p Partial pressure (Pa) C p Specific heat capacity (J K–1)
k c Thermal conductivity (W m–1 K–1) h Heat transfer coefficient (W m–2 K–1)
τ Stress tensor (Pa) A Area (m2)
τ R Reynolds stress tensor (Pa) h v a p Latent heat of vaporisation (J kg–1)
T Temperature (K)ki, gGas-phase mass transfer coefficient for component i (m s–1)
ω Specific dissipation rate (s–1)Ki,cOverall mass transfer coefficient for component i (m s–1)
k Turbulent kinetic energy (m2 s–2) S d i , d a g Geometric parameter (m)
x Position (m) A a g Agglomerate area (m2)
d Diameter (m) ϵ Tortuosity parameter (m)
v Particle velocity (m s–1) n Molar flow rate (mol)
Subscripts
ASpecies AmomMomentum
BSpecies Bkkth particle
dDropletggas
pParticlelliquid
mmass Bulk phase
sDroplet/particle surfaceEenergy
Superscripts
vector term·Rate

References

  1. Sun, W.; Zhou, Y.; Lv, J.; Wu, J. Assessment of multi-air emissions: Case of particulate matter (dust), SO2, NO and CO2 from iron and steel industry of China. J. Clean. Prod. 2019, 232, 350–358. [Google Scholar] [CrossRef]
  2. Liu, M.; Li, Y.; Xu, Y.; Chen, L.; Wang, Q.; Ma, Q.; Yuan, X. A multi-criteria group decision making framework for sustainability evaluation of sintering flue gas treatment technologies in the iron and steel industry. J. Clean. Prod. 2023, 389, 136048. [Google Scholar] [CrossRef]
  3. Bešenić, T.; Baleta, J.; Pachler, K.; Vujanović, M. Numerical modelling of sulfur dioxide absorption for spray scrubbing. Energy Convers. Manag. 2020, 217, 112762. [Google Scholar] [CrossRef]
  4. Lerotholi, L.; Everson, R.C.; Koech, L.; Neomagus, H.W.J.P.; Rutto, H.L.; Branken, D.; Hattingh, B.B.; Sukdeo, P. Semi-dry flue gas desulphurization in spray towers: A critical review of applicable models for computational fluid dynamics analysis. Clean Technol. Environ. Policy 2022, 24, 2011–2060. [Google Scholar] [CrossRef]
  5. Córdoba, P. Status of flue gas desulphurisation (FGD) systems from coal-fired power plants: Overview of the physic-chemical control processes of wet limestone FGDs. Fuel 2015, 144, 274–286. [Google Scholar] [CrossRef]
  6. Kumar, L.; Jana, S.K. Advances in absorbents and techniques used in wet and dry FGD: A critical review. Rev. Chem. Eng. 2021, 38, 843–880. [Google Scholar] [CrossRef]
  7. Ladwig, K.J.; Blythe, G.M. Flue-gas desulfurization products and other air emissions controls. In Coal Combustion Products; Robl, T., Overlink, A., Jones, R., Eds.; Elsevier: Cambridge, UK, 2017; pp. 67–95. [Google Scholar] [CrossRef]
  8. Srivastava, R.K.; Jozewicz, W. Flue gas desulfurization: The state of the art. J. Air Waste Manag. 2001, 51, 1676–1688. [Google Scholar] [CrossRef] [PubMed]
  9. Koech, L.; Rutto, H.; Lerotholi, L.; Everson, R.; Neomagus, H.; Branken, D.; Moganelwa, A. Spray drying absorption for desulphurization: A review of recent developments. Clean Technol. Environ. Policy 2021, 23, 1665–1686. [Google Scholar] [CrossRef]
  10. Carpenter, A.M. Low Water FGD Technologies; IEA Clean Coal Centre: London, UK, 2012. [Google Scholar]
  11. Koralegedara, N.H.; Pinto, P.X.; Dionysiou, D.D.; Al-Abed, S.R. Recent advances in flue gas desulfurization gypsum processes and applications—A review. J. Environ. Manag. 2019, 251, 109572. [Google Scholar] [CrossRef]
  12. Meuleman, E.; Cottrell, A.; Ghayur, A. Treatment of flue-gas impurities for liquid absorbent-based post-combustion CO2 capture processes. In Absorption-Based Post-Combustion Capture of Carbon Dioxide; Feron, P.H.M., Ed.; Elsevier: Cambridge, UK, 2016; pp. 519–551. [Google Scholar] [CrossRef]
  13. Scala, F.; D’Ascenzo, M.; Lancia, A. Modeling flue gas desulfurization by spray-dry absorption. Sep. Purif. Technol. 2004, 34, 143–153. [Google Scholar] [CrossRef]
  14. Hill, F.F.; Zank, J. Flue gas desulphurization by spray dry absorption. Chem. Eng. Process. 2000, 39, 45–52. [Google Scholar] [CrossRef]
  15. Katolicky, J.; Jicha, M. Influence of lime slurry droplet spectrum on the efficiency of semi-dry flue gas desulfurization. Chem. Eng. Technol. 2012, 36, 156–166. [Google Scholar] [CrossRef]
  16. Marocco, L.; Inzoli, F. Multiphase Euler–Lagrange CFD simulation applied to wet flue gas desulphurisation technology. Int. J. Multiph. Flow 2009, 35, 185–194. [Google Scholar] [CrossRef]
  17. Qu, J.; Qi, N.; Li, Z.; Zhang, K.; Wang, P.; Li, L. Mass transfer process intensification for SO2 absorption in a commercial-scale wet flue gas desulfurization scrubber. Chem. Eng. Process.—Process Intensif. 2021, 166, 108478. [Google Scholar] [CrossRef]
  18. Hong, M.; Xu, G.; Lu, P.; Huang, Z.; Miao, H.; Zhang, Y.; Ma, C.; Zhang, Q. CFD analysis of the spray droplet parameters effect on gas-droplet flow and evaporation characteristics in circulating fluidized bed desulfurization tower. Chem. Eng. Res. Design 2023, 196, 184–203. [Google Scholar] [CrossRef]
  19. Wang, X.; Li, Y.; Zhu, T.; Jing, P.; Wang, J. Simulation of the heterogeneous semi-dry flue gas desulfurization in a pilot CFB riser using the two-fluid model. Chem. Eng. J. 2015, 264, 479–486. [Google Scholar] [CrossRef]
  20. Jin, Y.; Li, Y.; Feng, M.; Cui, J. Research on the characteristics of flue gas purification reaction in spouted bed. Chem. Eng. Sci. 2023, 282, 119329. [Google Scholar] [CrossRef]
  21. Wang, X.; Wang, S.; Wang, R.; Yuan, Z.; Shao, B.; Fan, J. Numerical simulation of semi-dry desulfurization spouted bed using the discrete element method (DEM). Powder Technol. 2021, 378, 191–201. [Google Scholar] [CrossRef]
  22. Hrdlička, J.; Dlouhý, T. Full-scale evaluation of SO2 capture increase for semi-dry FGD technology. J. Energy Inst. 2018, 92, 1399–1405. [Google Scholar] [CrossRef]
  23. Koech, L.; Everson, R.C.; Hattingh, B.; Rutto, H.; Lerotholi, L.; Neomagus, H.W. Comparative study of sorbents for spray dry scrubbing of SO2 from flue gases. ACS Omega 2023, 8, 23401–23411. [Google Scholar] [CrossRef]
  24. Liu, P.; Yang, S.; Hu, J.; Wang, H. Numerical analysis of SO2 removal characteristics in industrial flue gas desulfurization reactor by spray drying adsorption. Sep. Purif. Technol. 2023, 323, 124475. [Google Scholar] [CrossRef]
  25. Katolicky, J.; Jicha, M. Optimization of Flue Gas Desulphurization Absorber by Means of Computational Fluid Dynamics Analysis. In Proceedings of the 12th International Conference on Heat Transfer, Fluid Mechanics and Thermodynamics, Costa de Sol, Spain, 11–13 July 2016. [Google Scholar]
  26. Mei, D.; Shi, J.; Zhu, Y.; Xu, X.; Xing, F.; Shi, L. Optimization of the operation parameters of SDA desulfurization tower by coupling chemical reaction model. Polish J. Chem. Technol. 2020, 22, 35–45. [Google Scholar] [CrossRef]
  27. Grosshans, H. Evaporation of a Droplet. Project Report 2012MVK160; Heat and Mass Transport: Lund, Sweden, 2012. [Google Scholar]
  28. Sirignano, W.A. Fluid Dynamics and Transport of Droplets and Sprays, 2nd ed.; Cambridge University Press: Cambridge, UK, 2010. [Google Scholar]
  29. Patel, K.; Chen, X.D.; Jeantet, R.; Schuck, P. One-dimensional simulation of co-current, dairy spray drying systems—Pros and cons. Dairy Sci. Technol. 2010, 90, 181–210. [Google Scholar] [CrossRef]
  30. Ochowiak, M.; Bielecki, Z.; Bielecki, M.; Włodarczak, S.; Krupińska, A.; Matuszak, M.; Choiński, D.; Lewtak, R.; Pavlenko, I. The D2-law of droplet evaporation when calculating the droplet evaporation process of liquid containing solid state catalyst particles. Energies 2022, 15, 7642. [Google Scholar] [CrossRef]
  31. Dalla Barba, F.; Wang, J.; Picano, F. Revisiting D2-law for the evaporation of dilute droplets. Phys. Fluids 2021, 33, 051701. [Google Scholar] [CrossRef]
  32. BÜCHI Labortechnik. B-290 Mini Spray Dryer Operation Manual. 2018. Available online: https://www.labotec.co.za/wp-content/uploads/2016/07/B-290-Mini-Spray-Dryer-Data-Sheet.pdf (accessed on 30 August 2024).
  33. Kievet, F.G. Modelling Quality in Spray Drying. Ph.D. Thesis, Eindhoven University of Technology, Eindhoven, The Netherlands, 1997. [Google Scholar]
  34. Gabites, J.R.; Abrahamson, J.; Winchester, J.A. Air flow patterns in an industrial milk powder spray dryer. Chem. Eng. Res. Des. 2010, 88, 899–910. [Google Scholar] [CrossRef]
  35. Langrish, T.A.G.; Williams, J.; Fletcher, D.F. Simulation of the effects of inlet swirl on gas flow patterns in a pilot-scale spray dryer. Chem. Eng. Res. Des. 2004, 82, 821–833. [Google Scholar] [CrossRef]
  36. Partridge, G.P.; Davis, W.T.; Counce, R.M.; Reed, G.D. A mechanistically based mathematical model of sulfur dioxide absorption into calcium hydroxide slurry in a spray dryer. Chem. Eng. Commun. 1990, 96, 97–112. [Google Scholar] [CrossRef]
  37. Mchabe, D.; Everson, R.C.; Ramachandran, P.A.; Neomagus, H.W.J.P.; Branken, D.J. Development of an integrated model for absorption of sulphur dioxide in limestone slurry. Chem. Eng. Sci. 2020, 229, 116050. [Google Scholar] [CrossRef]
  38. Neveux, T.; Le Moullec, Y. Wet industrial flue gas desulfurization unit: Model development and validation on industrial data. Ind. Eng. Chem. Res. 2011, 50, 7579–7592. [Google Scholar] [CrossRef]
  39. Hanus, M.J.; Langrish, T.A.G. Re-entrainment of wall deposits from a laboratory-scale spray dryer. Asia-Pac. J. Chem. Eng. 2007, 2, 90–107. [Google Scholar] [CrossRef]
  40. Welty, J.R. Engineering Heat Transfer—SI Version; John Wiley and Sons: New York, NY, USA, 1978. [Google Scholar]
  41. Woo, M.W.; Daud, W.R.W.; Mujumdar, A.S.; Wu, Z.; Meor Talib, M.Z.; Tasirin, S.M. CFD evaluation of droplet drying models in a spray dryer fitted with a rotary atomizer. Dry. Technol. 2008, 26, 1180–1198. [Google Scholar] [CrossRef]
  42. Poozesh, S.; Grib, S.W.; Renfro, M.W.; Marsac, P.J. Near-field dynamics of high-speed spray dryer coannular two fluid nozzle: Effects of operational conditions and formulations. Powder Technol. 2018, 333, 439–448. [Google Scholar] [CrossRef]
  43. Neathery, J.K. Model for flue-gas desulfurization in a circulating dry scrubber. AIChE J. 1996, 42, 259–268. [Google Scholar] [CrossRef]
Figure 1. Experimental set-up used for spray dry scrubbing of SO2 showing in green, cold streams and in red, hot streams (adapted, in part, with permission: B–290 Mini Spray Dryer operation manual [32]; copyright 2018 BÜCHI Labortechnik AG).
Processes 12 01862 g001
Figure 2. Extended two-film theory representing the absorption of SO2 in an SDS where i is at the gas–liquid interface and s is at the solid–liquid interface (adapted from Partridge et al. [36]).
Processes 12 01862 g002
Figure 3. Depiction of the simultaneous droplet drying and SO2 absorption with chemical reaction, where dc is the diameter of the core, drf is the diameter of the reaction front, ddr is the droplet diameter and dag is the agglomerate diameter (adapted from Hill and Zank [14]).
Processes 12 01862 g003
Figure 4. Grid independence analysis showing the variation of the key process parameters along the column for different grid sizes: (a) gas temperature and (b) SO2 removal efficiency.
Processes 12 01862 g004
Figure 5. Profiles of the model predicted: (a) radial and axial SO2-removal efficiency in the (b) x–z plane and in the (c) y–z plane within the column, and associated y–z profiles of the (d) humidity, (e) temperature and (f) velocity within the column, after 30 s solution time at an inlet temperature of 130 °C, a Ca/S ratio of 1, and an L/G ratio of 0.024.
Processes 12 01862 g005
Figure 6. Axial cross-sectional snapshot of droplets along the x–z plane after 30 s solution time, for an inlet temperature of 130 °C, a Ca/S ratio of 1, and an L/G ratio of 0.024: (a) the absorbed SO2 mass fraction [ppm] of the droplets with the asterix (*) representing the overall absorbed SO2 in the droplet, (b) the droplet residence time [s], (c) the mass fraction of water of the droplets and (d) the droplet or particle diameter [μm].
Processes 12 01862 g006
Figure 7. Axial profiles of the SO2-removal efficiency within the column showing both the x–z plane and y–z plane for (a) the classical D2-law model and (b) the mechanistic model at an inlet temperature of 130 °C, a Ca/S ratio of 1, and an L/G ratio of 0.024.
Processes 12 01862 g007
Figure 8. Axial SO2-removal efficiency: comparison of the classical D2-law and mechanistic models prediction, with experimental data (inlet temperature 130 °C, Ca/S ratio 1, L/G ratio 0.024).
Processes 12 01862 g008
Figure 9. Change in the axial SO2-removal efficiency along the column at various inlet flue-gas temperatures at a Ca/S ratio of 1.5 and an L/G ratio of 0.024.
Processes 12 01862 g009
Figure 10. Change in the axial SO2-removal efficiency along the column at 142 °C flue-gas inlet temperature and an L/G ratio of 0.024, with various Ca/S ratios.
Processes 12 01862 g010
Figure 11. Calculated sorbent utilisation along the column as a function of the Ca/S ratio at a constant inlet flue-gas temperature of 142 °C and an L/G of 0.024.
Processes 12 01862 g011
Figure 12. Axial variation in SO2-removal efficiency along the column with change in the L/G ratio at an inlet flue-gas temperature of 130 °C and Ca/S of 1.
Processes 12 01862 g012
Figure 13. Axial profiles of SO2-removal efficiency within the column showing both the x–z plane and the y–z plane for (a) an L/G ratio of 0.014 and (b) an L/G ratio of 0.049 at an inlet flue-gas temperature of 130 °C and a Ca/S ratio of 1.
Processes 12 01862 g013
Figure 14. Axial cross-sectional snapshot of droplets after 30 s solution time showing the particle mass fraction, for (a) an L/G ratio of 0.014 and (b) an L/G ratio of 0.049 at an inlet flue-gas temperature of 130 °C and a Ca/S ratio of 1.
Processes 12 01862 g014
Figure 15. Change in the exit SO2-removal efficiency and outlet product moisture content with change in the L/G ratio at a constant inlet flue-gas temperature of 130 °C and a Ca/S of 1.
Processes 12 01862 g015
Table 1. Process conditions for the validation experiments conducted for an L/G (kg/kg) ratio of 0.024.
Process VariablesCase 1Case 2Case 3Case 4Case 5Case 6Case 7
Tin (°C)108130142108130142142
Ca/S ratio
(mol/mol)
1111.51.51.52
Table 2. SO2 absorption regimes (adapted from Mchabe et al. [37]).
RegimeIIIIII
pHpH ≥ 6.83 at 323.15 K6.83 > pH > 3 at 323.15 KpH ≤ 6.83 at 323.15 K
Gas-side resistanceHighly significantSignificantInsignificant
Liquid-side resistanceInsignificantSignificantHighly significant
Dissociation of aqueous SO2Highly favouredFavouredNot favoured
H S O 3 concentrationInsignificantSignificantHighly significant
S O 3 2 concentrationHighly significantSignificantInsignificant
Table 3. Initial and boundary conditions used for the developed CFD models.
ParameterUnitsValue
Continuous phase—Flue gas
Inlet boundary—velocity inlet
Inlet temperature°C108; 130; 142
Inlet L/G ratio-0.014; 0.024; 0.034; 0.049
Inlet Ca/S ratio-1; 1.5; 2
Outlet boundary—pressure outletExit gas
Pressure (cyclone exit)kPa84.6
Wall
Convective heat transfer coefficientW/m2·K5
Thermal conductivityW/m·K0.74
Free stream temperature°C20
Dispersed phase—Lime slurry
Inlet boundary—velocity inletAtomisation air
Mass flow ratekg/h0.473
Dispersed phase—Injection properties
Mass flow ratekg/h0.9
Temperature°C20
Parcel number-80
Mean diameterµm10.5
Table 4. Comparison of the model-predicted and experimentally determined axial SO2-removal efficiency and flue-gas temperature for the sample points shown in Figure 1 and Figure 5, determined at an inlet temperature of 130 °C, a Ca/S ratio of 1, and an L/G ratio of 0.024.
Measured VariableAxial Distance from the Top of the ColumnRMSE
Level 1Level 2Level 3Level 4Level 5
Model SO2-removal efficiency40.046.253.260.073.25.7
Measured SO2-removal efficiency47.152.059.864.669.8
Absolute error (Efficiency)7.145.826.634.833.35
Model T (°C)86.762.655.458.852.24.1
Measured T (°C)81.867.158.555.356.3
Absolute error (Temperature)4.94.53.03.54.1
Table 5. Goodness-of-fit of the validated case studies (Details of the various cases are given in Table 1).
Process VariableCase 1Case 2Case 3Case 4Case 5Case 6Case 7
RMSE of the efficiency4.75.76.05.55.63.82.6
Coefficient of determination (R2)0.920.900.770.850.890.940.95
Table 6. Comparison of model outlet SO2-removal efficiency and calculated sorbent utilisation for various Ca/S ratios at a constant temperature of 142 °C and L/G of 0.024.
Process VariableCase 3Case 6Case 7
Ca/S ratio11.52
Model outlet efficiency (%)70.773.978.6
Model calculated outlet utilisation (%)70.749.339.3
Disclaimer/Publisher’s Note: The statements, opinions and data contained in all publications are solely those of the individual author(s) and contributor(s) and not of MDPI and/or the editor(s). MDPI and/or the editor(s) disclaim responsibility for any injury to people or property resulting from any ideas, methods, instructions or products referred to in the content.

