Article

Deep Integration and Innovation Development in the Logistics and Manufacturing Industries and Their Performances: A Case Study of Anhui Province, China

1
Business School, Suzhou University, Suzhou 234000, China
2
School of Music, Suzhou University, Suzhou 234000, China
3
School of Management, China University of Mining and Technology, Xuzhou 221008, China
4
School of Mechanical and Electronic Engineering, Suzhou University, Suzhou 234000, China
5
Antai College of Economics and Management, Shanghai Jiaotong University, Shanghai 200031, China
*
Author to whom correspondence should be addressed.
Processes 2024, 12(9), 1867; https://doi.org/10.3390/pr12091867
Submission received: 22 July 2024 / Revised: 23 August 2024 / Accepted: 23 August 2024 / Published: 31 August 2024

Abstract

:
The deep integration and innovative development of the logistics and manufacturing industries (LMDIIs) are crucial for reducing costs, increasing efficiency, and advancing manufacturing. To assess the development level and performance of the LMDIIs, we construct an evaluation index system, calculate the weights using the CRITIC method, and measure the comprehensive level of the LMDIIs using the TOPSIS method. We evaluate the coupling coordination of the LMDIIs and conduct a ridge regression analysis of their performance, using Anhui Province, China, as a case study. The results show that the comprehensive level of the LMDIIs in Anhui Province is low. The highest values for the logistics and manufacturing industries from 2013 to 2022 indicate great development potential. The coupling level is fluctuating upwards, and the coupling degree is growing slowly. The performance impact coefficients of the LMDIIs on the digital intelligence development of the manufacturing industry and the profit levels of the two industries indicate a significant promoting effect. However, the performance coefficient for the low-carbon transformation of the logistics industry is negative, indicating a restraining effect. Hence, we propose countermeasures and suggestions to further promote the LMDIIs and provide theoretical and methodological support for their research and management.

1. Introduction

1.1. Research Background

Manufacturing is a key indicator of a country’s comprehensive strength and international competitiveness, determining its status in the context of economic globalization [1]. Since the concept of Industry 4.0 was introduced, with the support of artificial intelligence (AI), big data, the Internet of Things, and other technologies, traditional industry boundaries have been broken. Logistics has become deeply integrated into all aspects of production and manufacturing across the entire supply chain, generating new forms of cooperation that support a highly flexible production model [2]. As a productive service industry closely linked to manufacturing (MU), the logistics industry (LU) plays a vital role in the transformation and upgrading of traditional manufacturing. The quality of logistics services has become a significant constraint on the production efficiency and business performance of the manufacturing sector [1]. Therefore, the integration and innovative development of the logistics and manufacturing industries (LMDIIs) is crucial for optimizing industrial structures, promoting industrial transformation and upgrading, ensuring the sustainable development of logistics and manufacturing, maintaining the stability of the supply chain, and fostering high-quality economic growth. Many countries are increasingly focusing on the LMDIIs [3]. China is an active promoter of the LMDIIs and, in 2020, introduced a policy to promote the implementation of a LMDIIs plan. This plan vigorously advanced the LMDIIs in key areas, such as bulk commodity logistics, production logistics, and consumer logistics.
However, in China, there has been a tendency to prioritize manufacturing over logistics. This has led to a simpler relationship in which the logistics industry primarily provides basic services to manufacturing. Moreover, this has prevented the formation of a mutually beneficial relationship, resulting in uneven development, insufficient integration, limited scope, and shallow depth in their collaboration. Numerous issues regarding the integration and innovative development of these two industries remain unexplored [4]. In this context, studying the integration and innovative development of these industries is of great practical significance for achieving their coordinated development. The current study addresses some challenges that urgently require attention, including the following: (1) the unclear degree of the LMDIIs’ development and the need for empirical evaluation methods; (2) the importance of the LMDIIs in enhancing the core competitiveness of manufacturing, reducing costs, increasing efficiency, and promoting the growth of logistics services, which necessitates a comprehensive assessment of the LMDIIs performance; and (3) the development of targeted recommendations for both the government and industry practitioners. These areas of study could broaden research perspectives on industrial integration, provide a theoretical basis for the deep integration of logistics and manufacturing in practice, and offer a pathway for the transformation and upgrading of both industries.
This article is structured as follows: The second section presents a literature review, including the research gaps and innovations as well as their theoretical and practical value. The third section presents the research methodology and indicators, including the modeling, indicator construction, data collection, and processing methods. The fourth section presents the empirical analysis, encompassing the background of the empirical research, results, policy recommendations, discussion, and implications. The fifth section provides the conclusion.

1.2. Research Review

The concept of industrial integration was first proposed by Rosenberg [5], who emphasized the significance of technological changes for improving resource allocation. Scholars primarily define industrial integration at the levels of technology, products, and industry, viewing it as a dynamic process where different industries intersect to create new industries or business forms. This process varies in intensity and degree across different stages, with overlaps between them. Enhancing the efficiency of the manufacturing system requires support from logistics systems, and the two systems are closely integrated and interdependent in production practices. Thus, manufacturing and logistics share a natural, synergistic evolutionary relationship.
Many scholars have contributed to research on the LU and MU industries. Their work has mainly focused on the following aspects: sustainable supply chain management in manufacturing [6]; collaborations between logistics and supply chain planning [7]; strategies for manufacturers and logistics service providers under closed-loop supply chain management [8]; product outsourcing and decision making for flexible production under global supply chain management [9]; increasing the profits of the retail channels of manufacturing companies [10]; the application of digital intelligence and new technologies to produce green, innovative products [11], establish circular supply chains, reduce costs and carbon emissions, and achieve the digital transformation of manufacturing companies [12].
Regarding the relationship between LU and MU, research has primarily addressed the measurement and evaluation of the coupling level of LU and MU integration and development, as well as the driving factors and integration modes thereof [13].
In evaluating the integration of the two industries, the assessment index system for their integrated development is typically constructed from the perspectives of foundation, scale, development, and operation. Methods such as the composite system synergy model, symbiosis degree model, and coupling coordination degree model can then be used to measure and evaluate the integration. For instance, Chen and Wang [14] employed the coupling coordination degree model to assess the level of integration between manufacturing and logistics. Their findings indicate that, while the integration of these industries in China is improving, the overall level remains low, with significant regional disparities. This underscores the need to promote coordinated regional development. Some scholars have focused on measuring the efficiency of these industries. For example, Chu et al. [15] used the DEA–Malmquist index to measure the total factor productivity of the two industries in China. Their results reveal that most regions in China exhibit inefficient linkages between the two industries, with some regions experiencing a decline in efficiency. However, in terms of reflecting the characteristics of LMDIIs in current research, the evaluation index system requires further improvement.
The integrated development of LU and MU is influenced by many complex and intertwined factors that have become critical for studying ways to enhance their integration [16,17]. Key factors identified by scholars include investment in technological research and development, innovation capacity, economic development level, urbanization level [18], market size, and openness to the outside world [19]. The most common research method for analyzing these influencing factors is a regression analysis based on econometric modeling, although sensitivity measurements and geodetector modeling are also frequently used by scholars [13]. There are abundant research results on influencing factors; however, there is still room for improvement in terms of specificity.
Regarding the development performance of industry integration, scholars have focused on the application of innovative technologies. For example, Agrawal et al. explored the use of AI in sustainable manufacturing between 2010 and 2021 [20]. Wang et al. examined whether a company’s DT can enhance its carbon performance [21,22]. Jum’a et al. modeled the impact of the big data analytics capability (BDAC) on a company’s supply chain innovation and sustainable supply chain performance [23]. Nwagwu et al. investigated the role of AI in improving supply chain performance in Pakistan’s manufacturing and logistics supply chain collaborations [24]. Lee et al. found that implementing instrumented supply chains using smart technologies can improve operational performance [25]. Zhu et al. explored the role of smart technologies, such as the Internet of Things (IoT), in the development of production and logistics digital twins [26], highlighting the significant role of smart technologies in advancing the LU and MU. Scholars have paid less attention to the performance of the LMDIIs. However, we can only achieve targeted development by clarifying its performance, and further exploration is required in terms of low-carbon green transformation and profitability.
Based on the evaluation of integration and analysis of influencing factors, scholars have proposed policy recommendations to promote the integration of the two industries. Most research has focused on the roles of government, industry associations, industrial structure, and resource integration [27]. Chen et al. [28] argue that relevant government departments and industry associations should strengthen the alignment of logistics and manufacturing standards, integrate resources, ensure efficient and low-cost factor allocation, and offer more supportive policies. Zhao and Tong [29] emphasize the need to develop modern logistics enterprises, improve logistics service capacity, enhance value-added logistics services, advance logistics informatization, establish a logistics information-sharing mechanism, build a market institutional framework to achieve complementary advantages and rational resource allocation, and fundamentally promote the integration of the logistics and manufacturing industries. These policy recommendations have effectively promoted the LMDIIs; however, there is still a lack of policy recommendations in terms of the performance of the LMDIIs.
Scholars have made considerable progress and achieved valuable results in research on the synergistic agglomeration of the two industries; however, the following research gaps remain:
(1)
The current degrees of LMDIIs are still unclear, and there is a lack of assessment of their coupling levels. Therefore, building a scientific and precise evaluation index system to assess the coupling level of LMDIIs has become an important issue.
(2)
Analyzing the comprehensive performance of LMDIIs not only allows for an examination of its impact on the development of the two industries but also helps identify weaknesses in its effectiveness. However, this area has been the subject of few related studies.
To address the above research gaps and challenges, this study begins by examining the essence of integration and innovation. It constructs an evaluation index system for LMDIIs, calculates weights using the CRITIC method, measures the development level of LU and MU using the TOPSIS method, adopts a coupling coordination model to measure the coupling level of LMDIIs, and finally applies ridge regression to evaluate the performance of LMDIIs. These approaches aim to promote the integration and innovative development of the two industries, marking an innovation in the present study. The innovations of this study will contribute to existing research and offer both theoretical and practical value, as follows:
(1)
Theoretical value: This study constructs an evaluation index system for LMDIIs based on its essential meaning to thereby enable its scientific measurement. Research on the comprehensive performance of LMDIIs offers a new perspective for studying the integration and innovation of the two industries.
(2)
Practical value: This study can assist the government and practitioners in scientifically measuring and evaluating the development level of LMDIIs, providing decision-making support for promoting high-quality economic development, upgrading the industrial structure, and formulating related policies.

2. Materials and Methods

This section synthesizes the methodology used in this study, including the methodological process, data application, data collection, and data modeling.

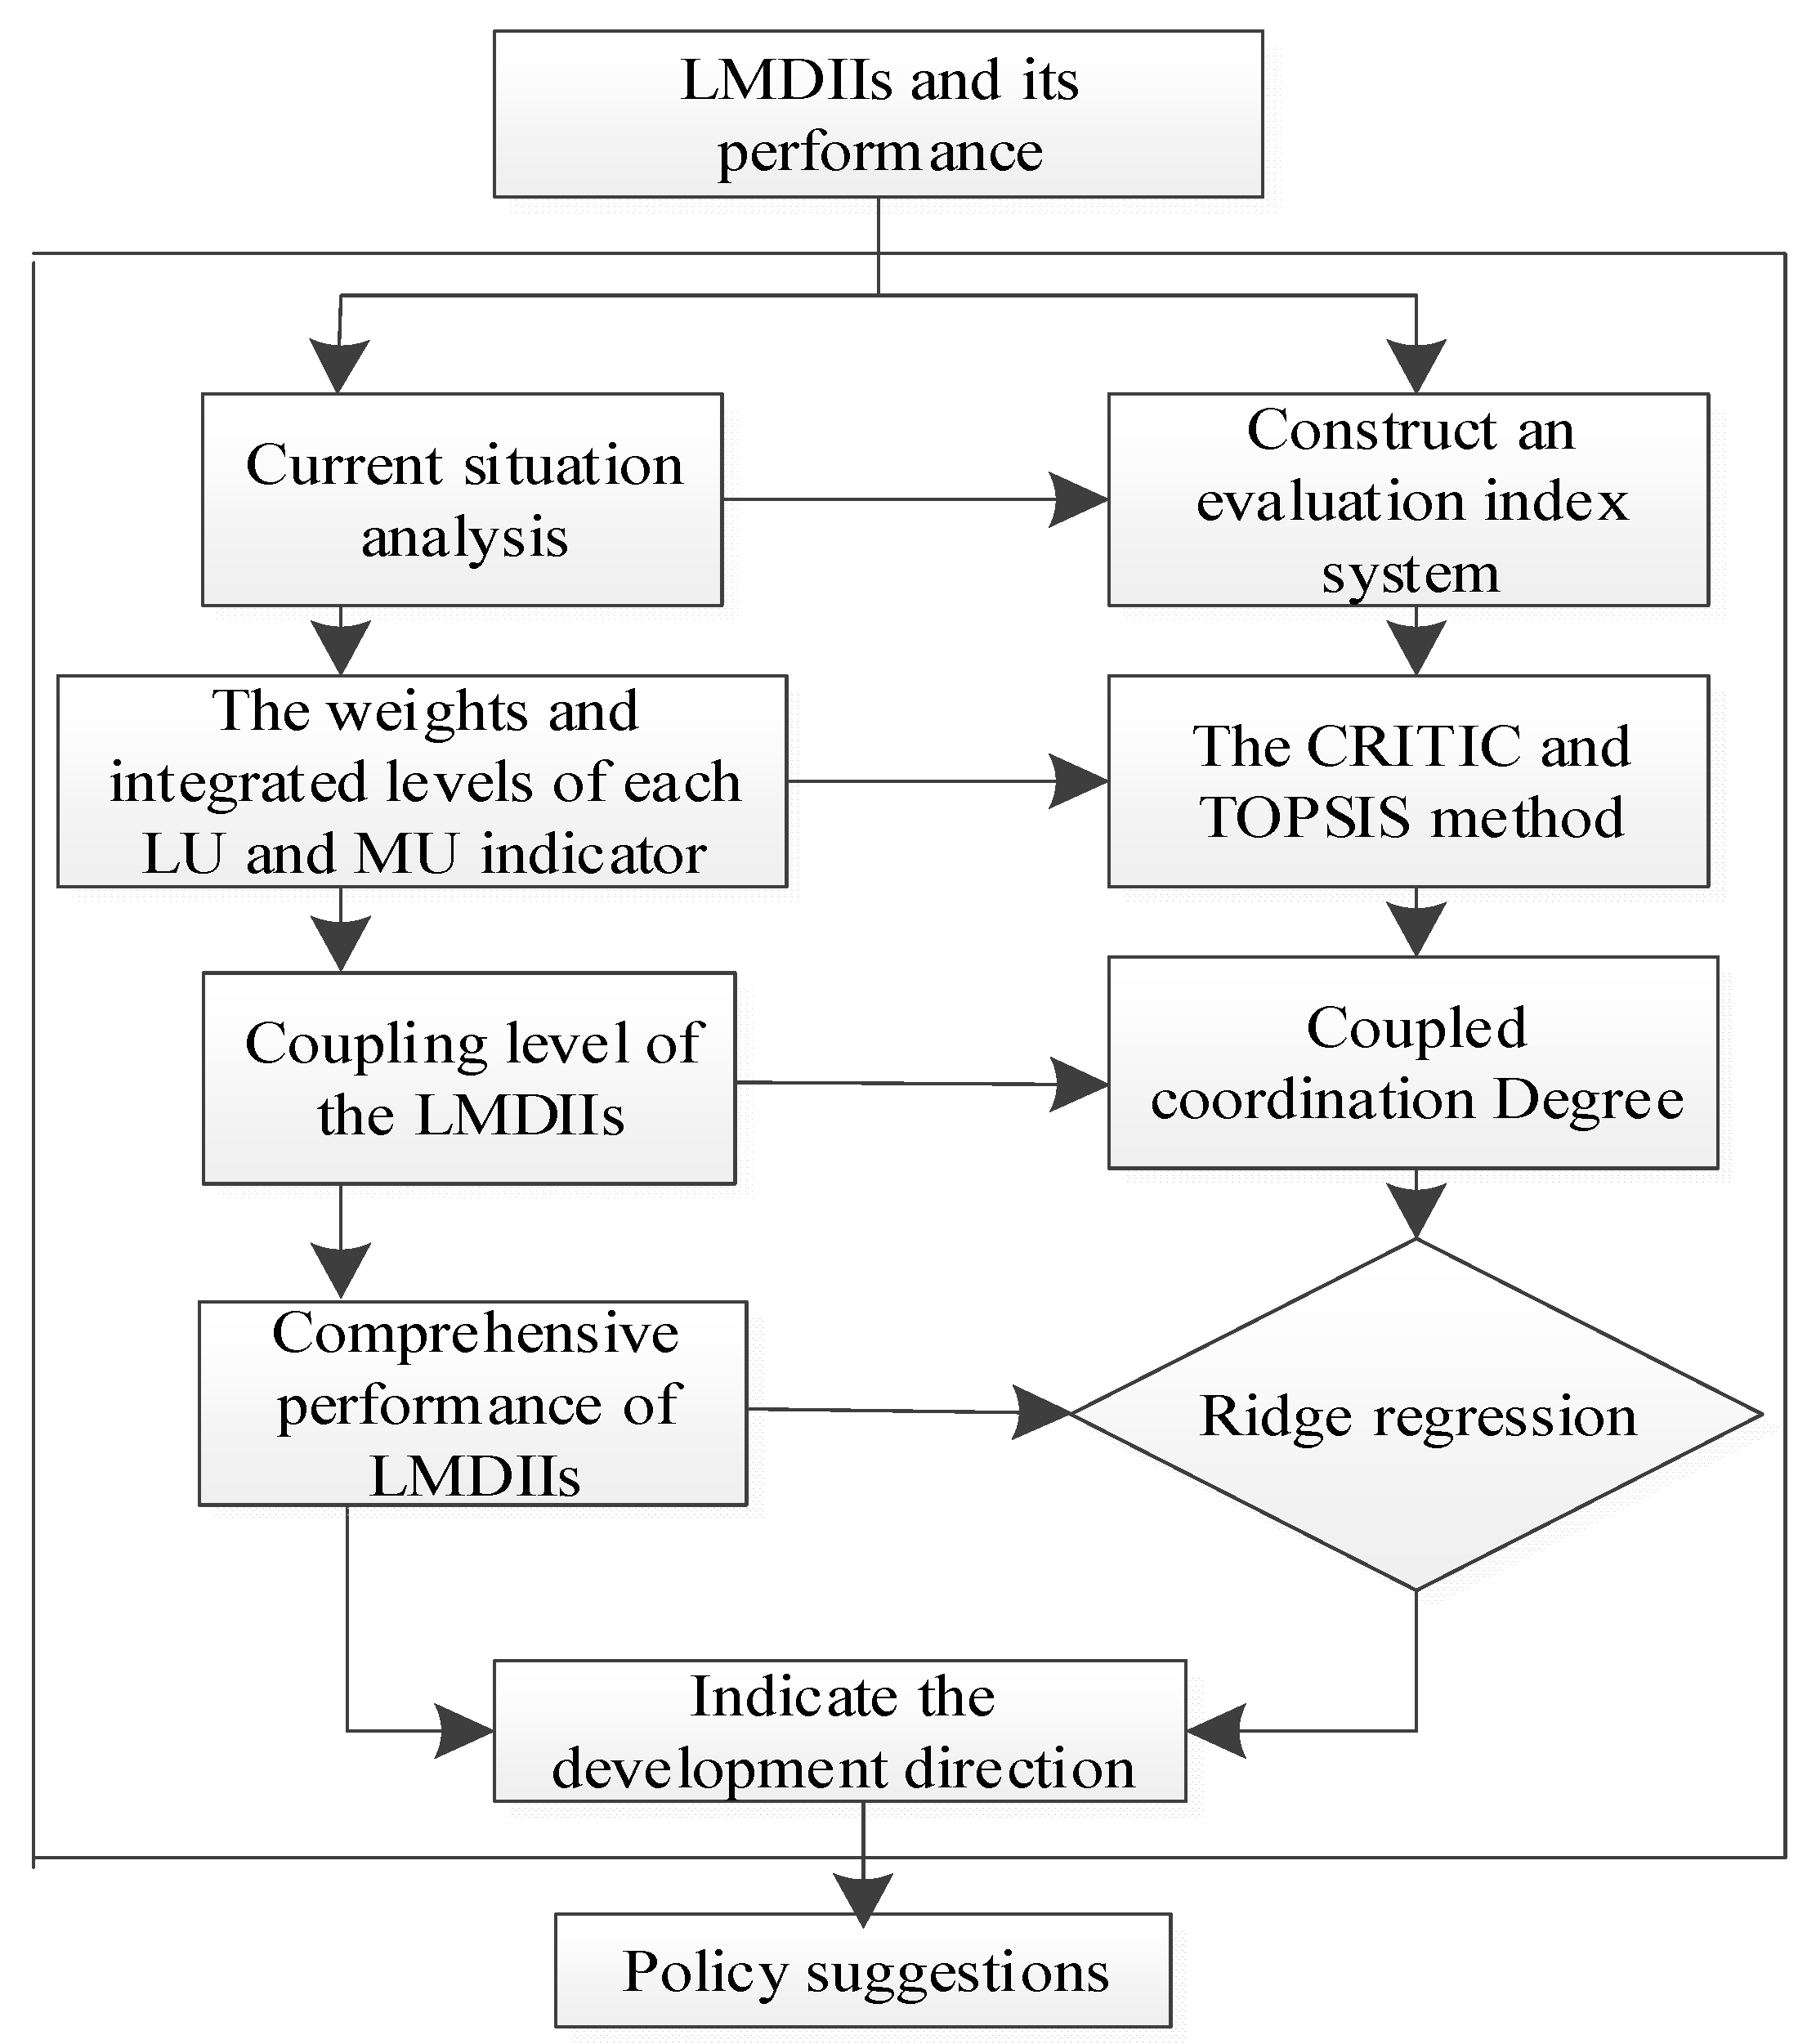
2.1. Methodology Flow

Given that LU and MU involve numerous elements, effectively using objective models to measure and evaluate the level of LMDIIs, studying their comprehensive performance in a way that closely reflects actual conditions, and ensuring that the proposed countermeasures and suggestions can effectively support local government decision making are significant challenges. Hence, a series of methods and models have been adopted to address these challenges, as illustrated in Figure 1.
First, we establish an evaluation index system for LMDIIs to measure the weights and integrated levels of each LU and MU indicator. The CRITIC method is employed to reduce the overlap of indicator information, whereas the TOPSIS method fully utilizes the original data. Their combined use accurately reflects the development level of LMDIIs.
Second, by measuring the coupling degree and comprehensive coordination evaluation index of LMDIIs, we can apply a coupling coordination model to assess their coupling level.
Third, ridge regression is used to analyze the comprehensive performance of LMDIIs, particularly their impact on the development of digital and intelligent technologies, low-carbon transformation, and profitability of the two industries. Based on the results of this analysis, we propose targeted countermeasures and make suggestions for the promotion of LMDIIs.

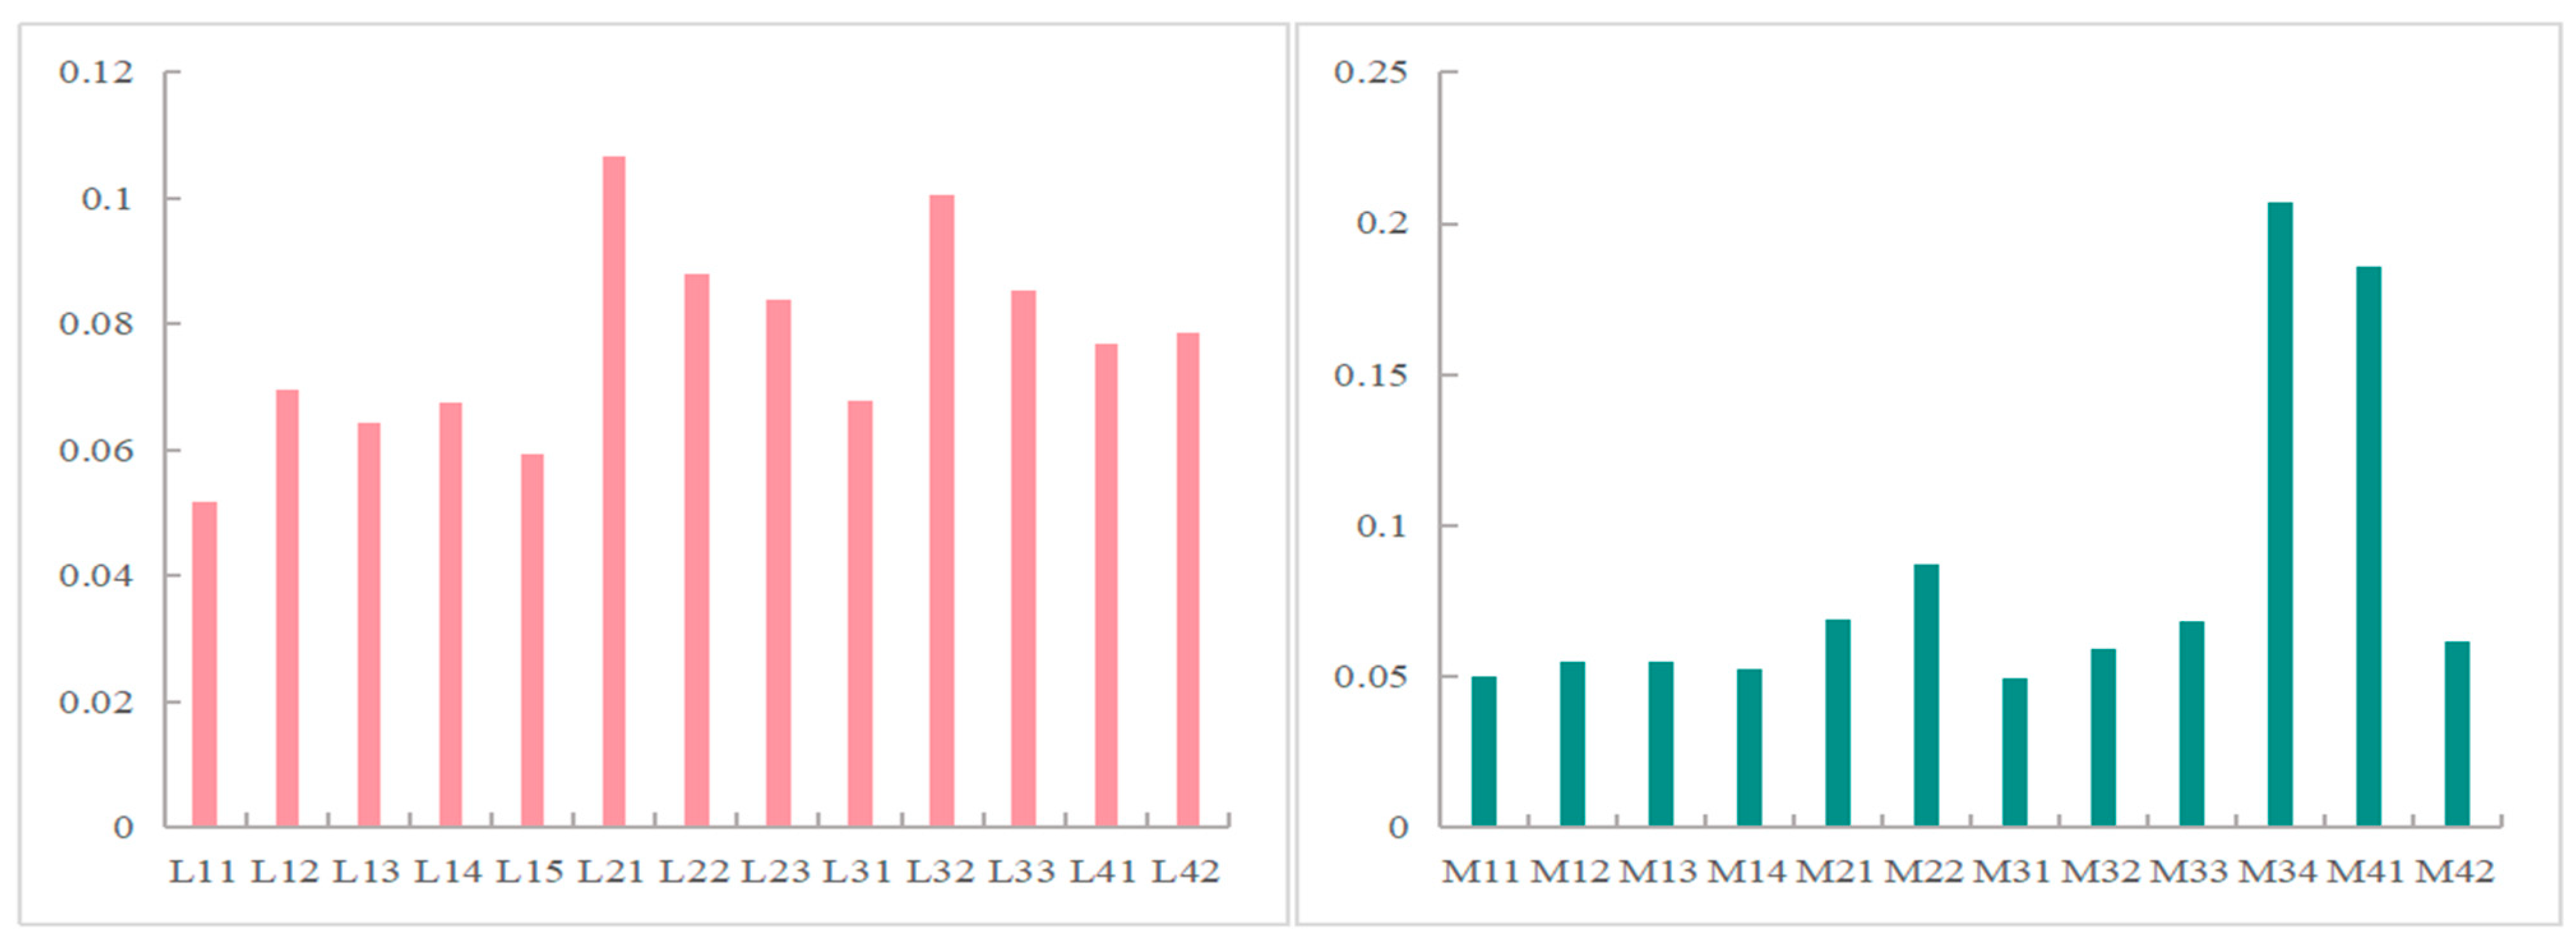
2.2. Data on Evaluation Indicators for the LMDIIs

LMDIIs refer to the active involvement of professional logistics enterprises or the logistics departments of MU in various stages of the manufacturing process, such as procurement, production, order processing, sales, distribution, and reverse logistics. This involvement aims to achieve deep strategic cooperation that is characterized by mutual integration (“you have me, and I have you”) and to realize efficient synergy across the entire logistics operation via supply chain innovation. The “deep integration” aspect emphasizes the input of specialized assets and optimization of supply chain processes that drive the progression of strategic relationships and elevate the level of cooperation. The “innovation and development” aspect is highlighted by the enhancement of technological capabilities and the transformation of organizational models. Thus, LMDIIs leverages asset investment, process optimization, technological advancement, and organizational synergy to achieve innovation, ecological sustainability, and efficient development in manufacturing logistics operations [30]. Here, asset investment includes fixed-asset investments, human investments, and the scale of an industrial organization. Process optimization refers to structural transformation, cost reduction, and quality improvement efforts. Technology upgrading refers to the performance of patents and innovation. Organizational collaboration refers to the coordination costs that need to be paid for cooperation between organizations. Good organizational collaboration refers to the effective organization of factor resources, the reduction in coordination costs, and the improvement of production cost efficiencies, particularly the cost efficiency of capital and labor. Table 1 shows the specific evaluation indicators.
The data for this evaluation index system were sourced from the China Statistical Yearbook, Patent Information Service Platform for China’s Key Industries, and provincial and municipal development bulletins. Owing to the emerging nature of the industry, specialized logistics statistics in China are limited. Hence, this study defines LU in accordance with the definitions of most scholars, which include transportation, warehousing, and postal services [31,32].
Table 1. Evaluation index system for the LMDIIs.
SubsystemsLevel 1 IndicatorsSecondary IndicatorsInterpretation of IndicatorsSources
Logistics industry
(L)
Asset investment
(L1)
Investment in fixed assetsInvestment in fixed assetsReference
[33]
Number of employed personsNumber of employed persons
Average wage of employed personsAverage wage of employed persons
Civilian goods vehicles ownershipCivilian goods vehicles ownership
Number of legal entitiesNumber of legal entities
Process optimization
(L2)
Service levelAverage population served per outletReference
[33]
Transportation structureRatio of railroad to road freight traffic
Cargo turnoverCargo turnover
Technology upgrades
(L3)
Patent scale of LUTotal number of patent applications of the LUReference
[34]
Logistics patent qualityNumber of patent applications for inventions in the LU/
Total number of patent applications in the LU
Logistics patent growth rateGrowth rate of total patent applications of the LU
Organizational synergy
(L4)
Logistics capital productivityValue added for logistics/investment in fixed assets of the LUReference
[33]
Logistics labor productivityValue added for logistics/number of people working in logistics
Manufacturing
Industry
(M)
Asset investment (M1)Total assets of industrial enterprises above designated sizeTotal assets of industrial enterprises above designated sizeReference
[33]
Investment in fixed assetsInvestment in fixed assets
Average wage of employed personsAverage wage of employed persons
Number of legal entitiesNumber of legal entities
Process optimization (M2)Product qualityQualified rate of product qualityReference
[33]
Production costsCost per USD 100 of operating income in manufacturing
Technology upgrade
(M3)
Number of patent applicationsNumber of patent applications by industrial enterprises above designated sizeReference
[33]
Number of new product development projectsNumber of new product development projects
Innovation input levelManufacturing R&D expenditures/main business revenueReference
[33]
Innovation output levelNumber of active invention patents/R&D expenditure
Organizational synergy
(M4)
Manufacturing capital productivityManufacturing value added/investment in fixed assetsReference
[33]
Manufacturing labor productivityManufacturing value added/number of people employed in manufacturing

2.3. Performance Data on the LMDIIs

LMDIIs focuses on enhancing traditional logistics and production processes through digital information technology and intelligent decision-making tools. This approach aims to improve information sharing and collaborative operations between logistics and manufacturing enterprises to optimize operational efficiency. LMDIIs will advance the development of digital and intelligent technologies within these industries. Green and low-carbon development are key objectives for both logistics and manufacturing; thus, assessing the green and low-carbon performance of LMDIIs in the context of carbon neutrality is crucial. We anticipate that LMDIIs will disrupt traditional industry spatial patterns and boundaries, enhance the efficiency of cooperation among innovative entities across different segments of the industrial chain, and effectively promote the low-carbon transformation of both industries. The background of LMDIIs is shaped by improvements in social productivity, rapid technological advancements, and innovations in business models that have led to specialized production and logistics that will enhance profitability in both sectors [35]. Therefore, the comprehensive performance of LMDIIs drives the development of digital and intelligent technologies, supports low-carbon transformation, and increases profitability in these industries.
In our analysis, the coupling level of LMDIIs is the independent variable, whereas the development of digital and intelligent technologies, low-carbon transformation, and profit levels are dependent variables. Based on a review of the relevant literature, regional GDP, Internet broadband access ports, local fiscal expenditures on environmental protection, and total retail sales of consumer goods were selected as control variables, and their causal relationships were studied [36]. Table 2 lists the specific indicators for each variable.
To account for price fluctuations, variables related to price, such as investments in fixed assets and value-added logistics, were adjusted to real values, using 2013 as the base year.

2.4. Data Pre-Processing

To address the differences in scale among indicators, the evaluation indicators for both LU and MU must be normalized to ensure consistency among the qualitative measures used. This study employs the min-max normalization method to standardize the raw indicator data. This method is straightforward, preserves the relationships within the original data, and does not alter the data structure [37]. However, it is sensitive to outliers or extreme values in the dataset, which can significantly impact the maximum and minimum values. This method is most suitable for numerical data for which the ranges are approximately equal [38]. The formulas used for the normalization are as follows:
Positive indicators:
X i j = X i j min X i j max X i j min X i j , i = 1 , 2 , , n ; j = 1 , 2 , , m
Negative indicators:
X i j = max X i j X i j max X i j min X i j , i = 1 , 2 , , n ; j = 1 , 2 , , m
where X i j represents the jth indicator in year i. For example, X11 is the first indicator of fixed-asset investment in 2013. In addition, n represents the number of years, and m represents the number of secondary indicators.

2.5. Methodology and Modeling

The methods and models employed in this study include the CRITIC weighting method, TOPSIS, the coupled coordination degree model, and the ridge regression model. The details of each method are presented next.

2.5.1. CRITIC Weighting Method

The Criteria Importance Through Intercriteria Correlation (CRITIC) method objectively measures the weights of features by assessing the contrast strengths between feature classes and the conflicts among them [39]. It minimizes the influence of strongly correlated indicators, reduces information overlap between indicators, and thus enhances the objectivity and reliability of the evaluation results. This method is considered to be superior to the entropy weight and standard deviation methods. However, it requires high-quality, reliable data and careful data handling; appropriate evaluation methods are crucial for its application [40]. The specific steps are as follows.
(1)
Solve for indicator variability. Let Sj denote the standard deviation of the jth indicator.
x j ¯ = 1 n i = 1 n x i j ;   S j = i = 1 n ( x i j x j ) 2 n 1
In the CRITIC method, the standard deviation measures the fluctuation in indicator values. A larger standard deviation indicates greater variation in the indicator values, which provides more information and strengthens the evaluation of that indicator, thereby warranting a higher weight.
(2)
The indicator conflict is represented by the correlation coefficient. Let rij denote the correlation between evaluation indicators i and j. Then,
R j = i = 1 p ( 1 r i j ) ,   where   r i j = ( x i x ¯ ) ( x j x ¯ ) ( x i x ¯ ) 2 ( x j x ¯ ) 2
The correlation coefficient assesses the degree of correlation between indicators. A stronger correlation with other indicators means that the indicator shares more information and has reduced conflict with others. This repetition reduces the unique contribution of the indicator to the evaluation, suggesting that its weight should be lowered.
(3)
Information, Cj. The greater the value of Cj is, the greater the role of the jth evaluation indicator in the evaluation indicator system, and the more weight should be assigned to it.
C j = S j i = 1 p ( 1 r i j ) = S j × R j
(4)
Find the weights. The objective weight of the jth indicator is denoted by Wj.
W j = C j / j = 1 p C j

2.5.2. Superior and Inferior Solution Distance Method for TOPSIS

The TOPSIS method effectively utilizes the information in the original data to accurately reflect the differences between evaluation options. However, it requires high data quality, necessitating accurate and complete data for reliable results [41,42]. The method operates on a normalized data matrix and uses the cosine approach to identify the optimal and worst options among a set of choices. It then calculates the distance of each evaluation object from these optimal and worst options to determine the relative proximity of each object to the optimal option, which serves as the basis for an evaluation of its advantages and disadvantages. TOPSIS is not strictly limited by data distribution or sample content, and its calculations are straightforward [43,44]. The specific steps are as follows:
(1)
Build an original matrix. Assuming that there are m objects to be evaluated and that each object has n evaluation indicators, we construct the original matrix:
X = x i j m × n , ( 0 i m , 0 j n )
In Equation (7), i represents the object to be evaluated (i = 1, 2, …, m), j represents the different evaluation indicators (j = 1, 2, …, n), and xij is the original value of the jth evaluation indicator for the ith evaluation object.
(2)
Normalize the data. Refer to Equations (1) and (2).
(3)
Determine the indicator weights. The CRITIC method is used to determine the weights.
(4)
Construct a weighted decision matrix. After determining the indicator weight wj via the CRITIC method, construct a weighted decision matrix = R = ( r i j ) m × n , where r i j   =   w j × y i j * . Determine the optimal and worst solutions ( K + , K ) based on the weighted decision matrix.
K +   = max ( r 1 j , r 2 j , r m j ) ,   K = min ( r 1 j , r 2 j , r m j )
(5)
Calculate the gap between each solution and the potential optimal solution.
D i + = j = 1 n ( r i j K j + ) 2     ,     D i = j = 1 n ( r i j K j ) 2
The smaller the value of D i + is, the closer the comprehensive level of the ith evaluation unit is to the positive ideal solution, and the smaller the   D i value is, the closer the comprehensive level of the ith evaluation unit is to the negative ideal solution.
(6)
Measure the proximity of the evaluation object to the optimal program.
C i = D i D i + + D i
The strengths and weaknesses of each program are assessed based on their closeness values, which range from 0 to 1. A higher closeness value indicates a better program score and greater desirability.

2.5.3. Coupled Coordination Degree Models

The coupling coordination degree model analyzes the coupling relationship between two systems by using three key indicators. This model is crucial for understanding the complex interactions between multiple systems. Before constructing the model, it is essential to ensure that the data being used are accurate and obtainable [45]. The first indicator is the coupling degree, which is denoted by C [46] and measures the extent of mutual reinforcement between two subsystems. Its computational formula is as follows:
C = 2 × U 1 × U 2 2 U 1 + U 2
where U1 and U2 represent the integrated development levels of the logistics and manufacturing subsystems, respectively.
The second is the degree of coordination. The degree of coordination represents the magnitude of benign coupling between two subsystems and is denoted by T [47]. Its computational formula is:
T = α U 1 + β U 2
In this formula, α   and   β represent the weights of the two subsystems. These terms are determined by the relative importance between the two subsystems. In this study, we consider that LU and MU are equally important. Hence, α   and   β take a value of 0.5.
Finally, the coupling coordination degree measures the level of coordinated development between two subsystems. This comprehensive index is used to assess the coupling level of the deep integration and innovative development of the two industries and is denoted by D [48]. The calculation expression is:
D = C × T
Here, D is the coupling coordination degree, which takes a value from the interval [0, 1]. The coordination level is divided into 10 grades, as listed in Table 3.

2.5.4. Ridge Regression Modeling

Ridge regression is used to analyze covariate data when there is bias in regression estimation. It is a modified version of least squares estimation, which sacrifices some information, thereby reducing the accuracy of the regression coefficients, but provides a more realistic and reliable regression model with better performance on pathological data [49,50]. However, ridge regression may force the correlations between variables to zero when there are many linearly correlated features [51]. This principle can be expressed as follows:
The (matrix) form of the regression analysis is:
  y = j = 1 p β j x j + β 0
The goal of solving the regression problem above via least squares is to minimize the following equation:
β ^ = a r g m i n β i = 1 N ( y i β 0 j = 1 p β j x i ) 2
Ridge regression adds a penalty term to the above minimization objective:
β ^ b r i d g e = a r g m i n β i = 1 N ( y i β 0 j = 1 p β j x i ) 2 + λ j = 1 p β j 2
Here, λ is the parameter to be solved; that is, ridge regression is a least squares regression with an L2 paradigm penalty.

3. Case Study

This study applies these research methods to Anhui Province, China, as a case study. Based on the calculation results, we discuss the coupling level of deep integration and innovation development in the logistics and manufacturing industries in Anhui Province, evaluate their comprehensive performance, propose countermeasures and suggestions to promote LMDIIs, and summarize key management insights.

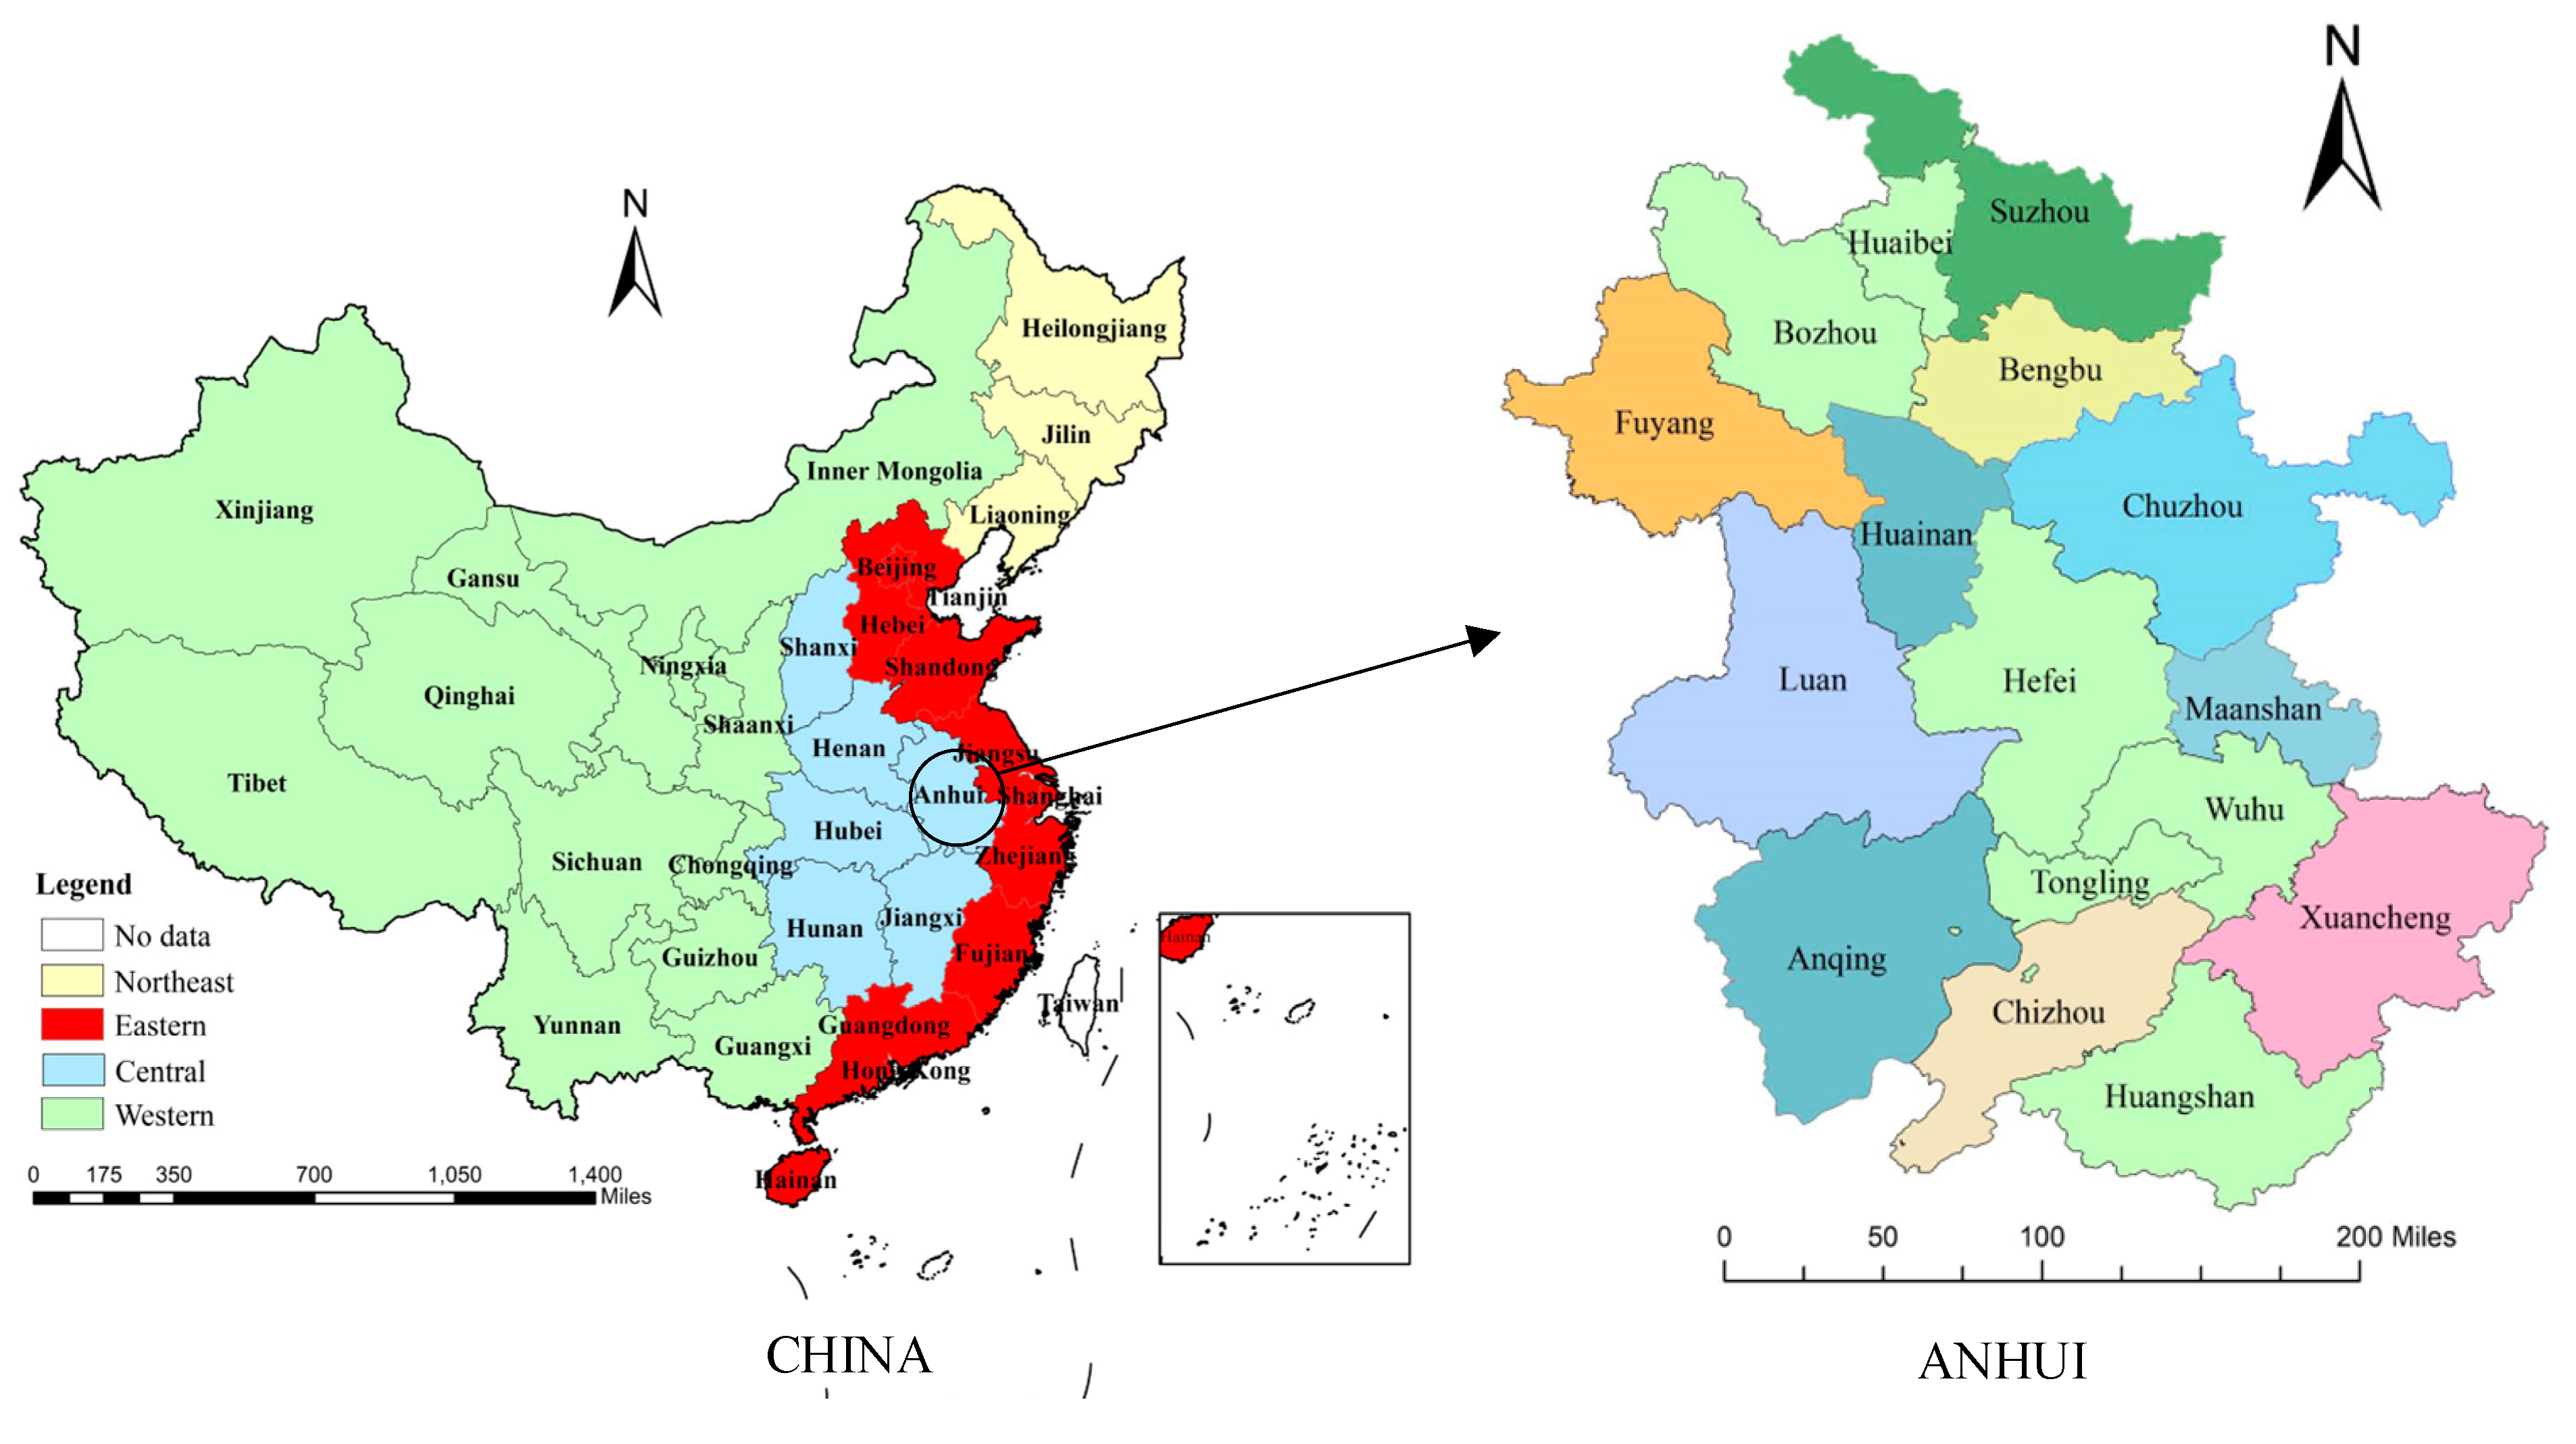
3.1. Case Study Background

Anhui Province is located in East China and is a key component of the Yangtze River Delta. Moreover, it is strategically important for the economic development of China and serves as a hub for various domestic economic regions. In 2022, Anhui Province had a total output value of CNY 4504.5 billion and a per capita GDP of CNY 73,603. The added value of the LU was CNY 217.17 billion, accounting for 4.8% of Anhui’s GDP, whereas the added value of the MU represented 26.5% of Anhui’s GDP, ranking twelfth in China and first in the Yangtze River Delta. However, Anhui still faces significant gaps in the scale and quality of its manufacturing, compared with those of other developed provinces. Anhui Province has prioritized the development of industry linkages and integration, and it has introduced several policies and established platforms to support these efforts. Despite these efforts, the integration of LMDIIs in Anhui is still in its early stages, and logistics is currently unable to keep pace with manufacturing development. Research has predominantly focused on more developed provinces and cities, such as those in the Yangtze River Economic Belt, Huaihe River Economic Belt, Zhuhai, and Jiangsu, leaving a gap in research specific to Anhui Province [50]. In this context, measuring the coupling level of LMDIIs in Anhui, analyzing its comprehensive performance, and proposing strategies by which to enhance it are crucial for promoting the high-quality development of Anhui’s economy and contributing to broader economic advancements. Figure 2 shows the case study area.

3.2. Empirical Results

3.2.1. Comprehensive Level of LMDIIs in Anhui Province

The raw data were standardized using Equations (1) and (2). Then, the CRITIC weighting method was applied to calculate the indicator weights. Figure 3 illustrates the results.
As shown in Figure 3, the LU service level, patent quality, and transportation structure have higher weights, as do the MU capital productivity, innovation output level, and production cost also have significant weights. These findings help explain the positioning of LMDIIs.
The TOPSIS method was used to calculate the comprehensive score of the LMDIIs in Anhui Province. Table 4 lists the results.
As shown in Table 4, the development level of the LMDIIs in Anhui Province has exhibited a fluctuating upward trend since 2013, although the rate of increase has been gradual. In 2013, the development levels were 0.4514 and 0.4197, respectively. After a decade of integration and innovation, these levels increased to 0.4804 and 0.4968, respectively, by 2022. During this period, the highest values achieved were 0.4853 and 0.5395, respectively, whereas the lowest values were 0.4033 and 0.4197, respectively. This indicates significant potential for further development of the LMDIIs in Anhui Province.

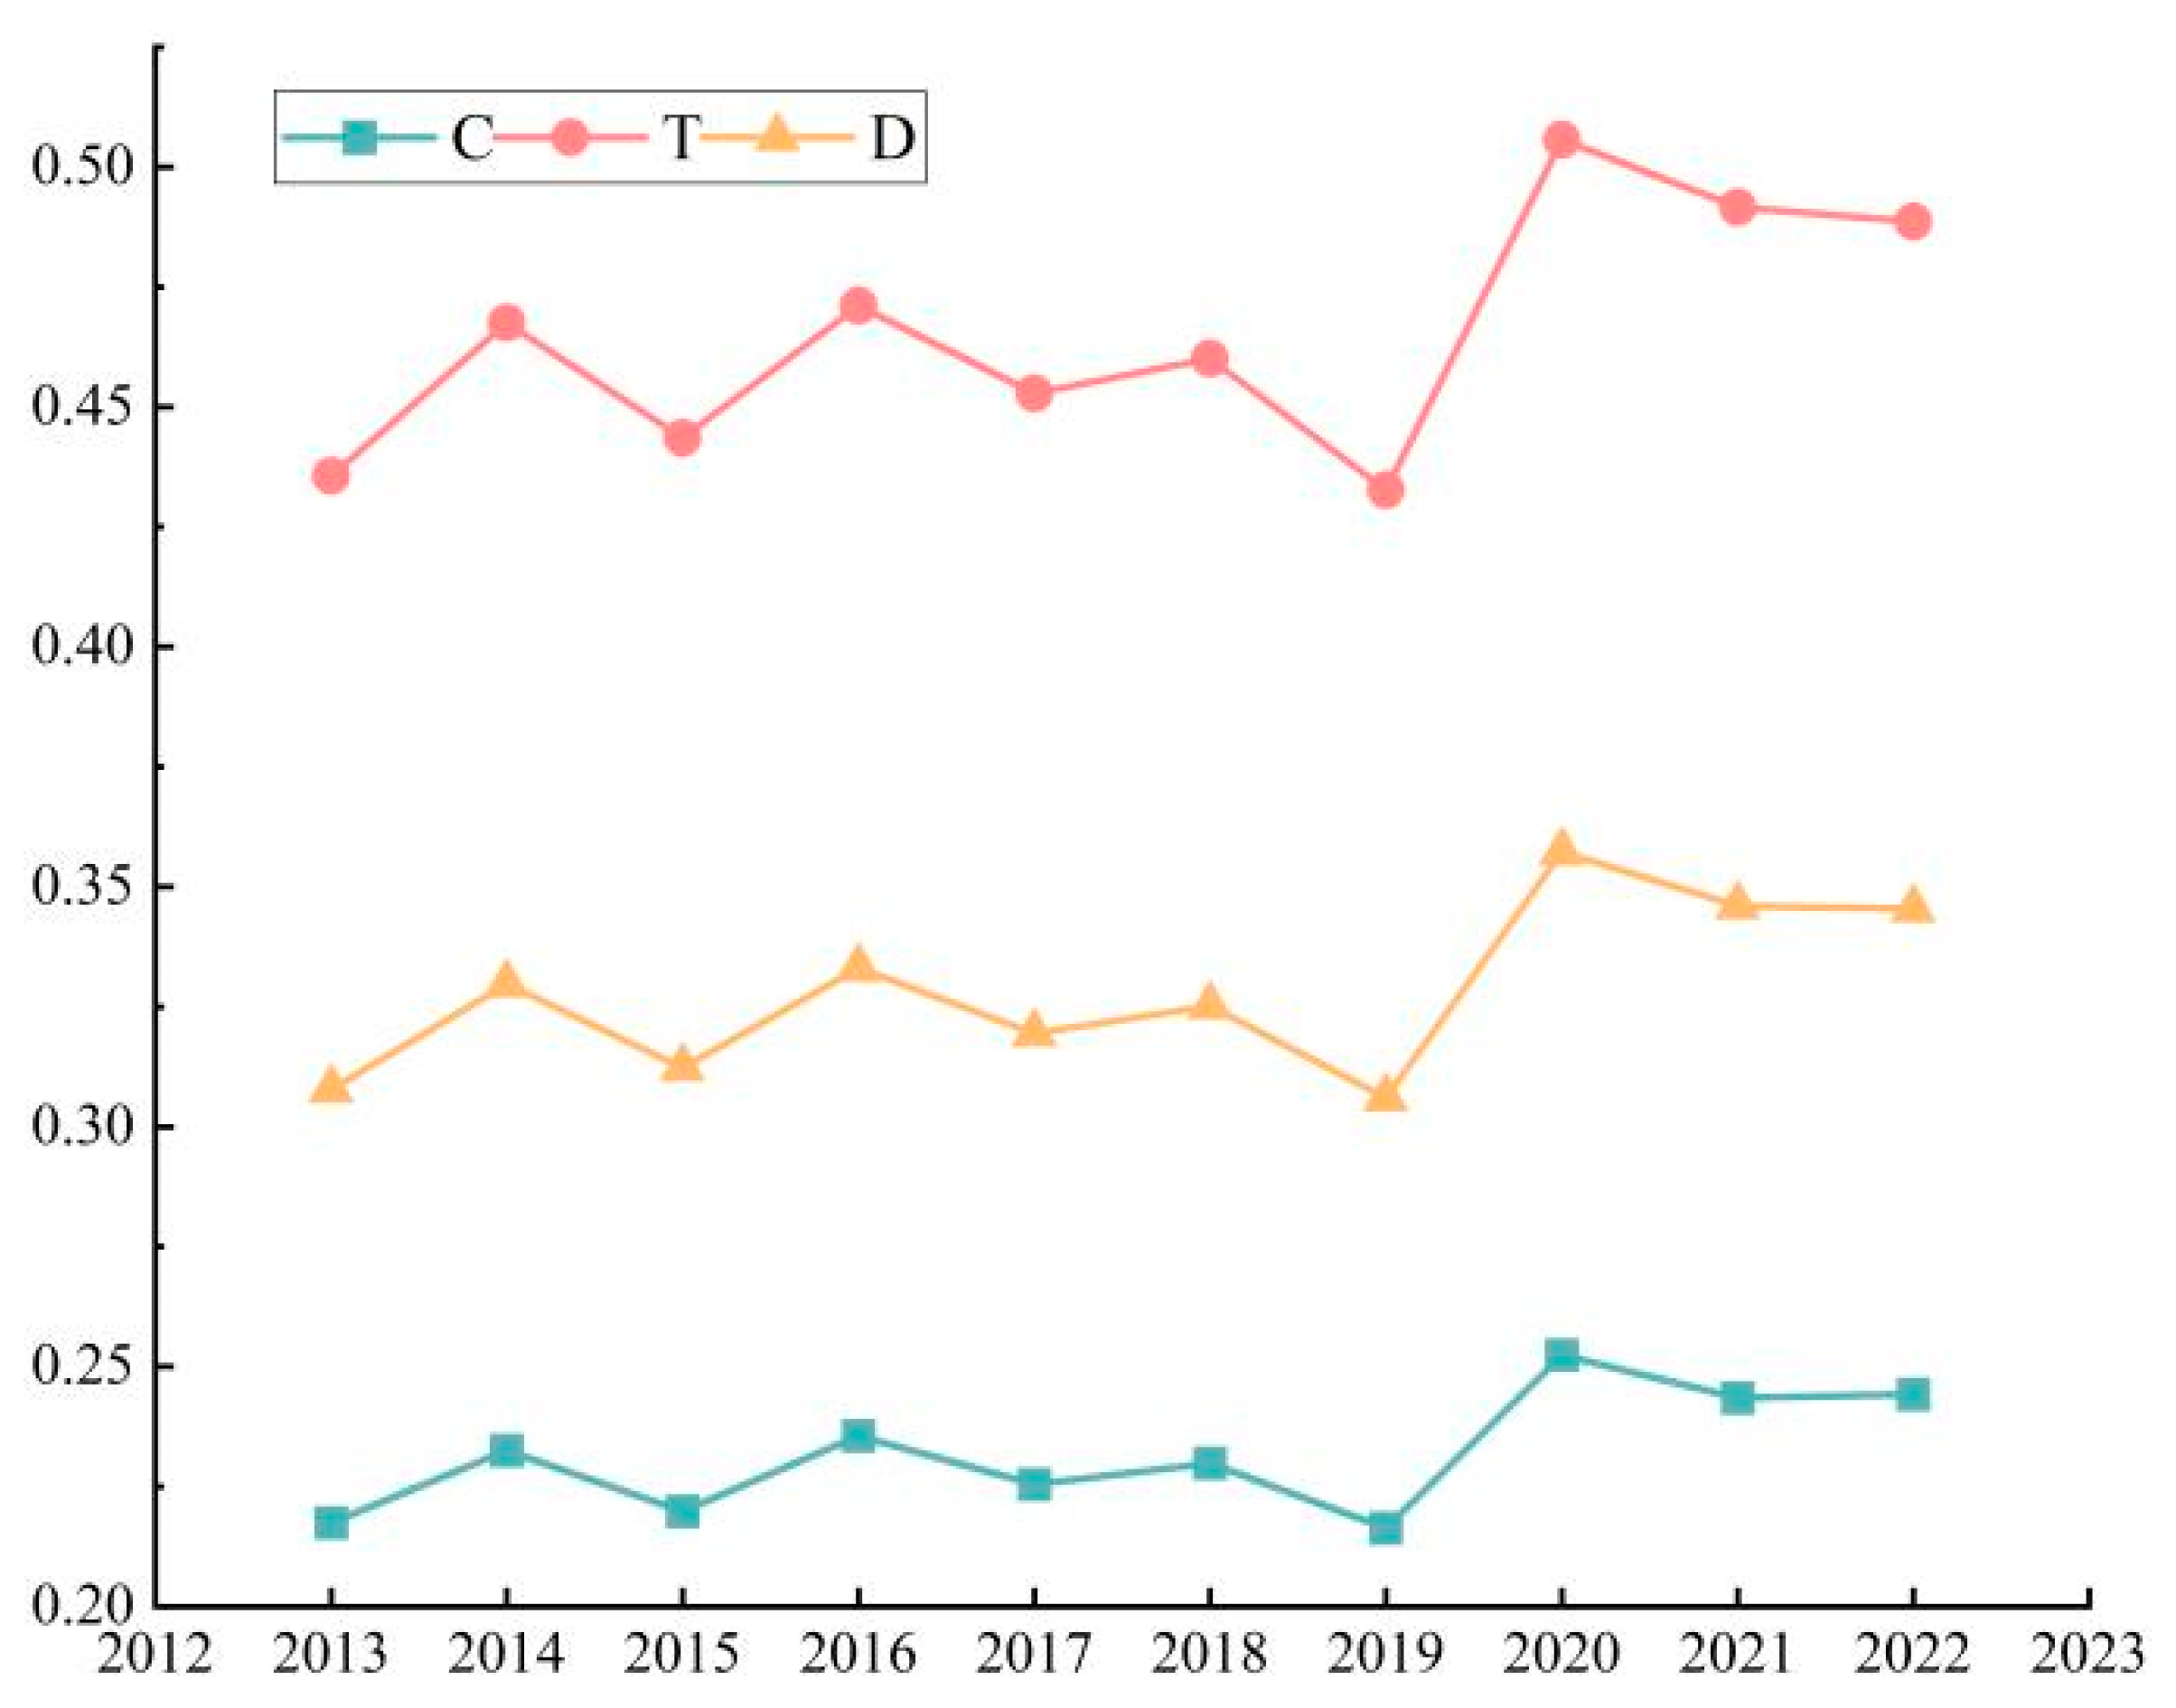
3.2.2. Coupling Level of LMDIIs in Anhui Province

Using the coupling coordination degree model, the coupling coordination relationship of the LMDIIs in Anhui Province was assessed based on Equations (6) and (7) along with the data results from Table 4. Table 5 and Figure 4 present the findings.
As shown in Table 5 and Figure 4, the coupling coordination degree of the LMDIIs in Anhui Province displays a fluctuating upward trend, albeit with slow growth. From 2013 to 2022, it remained in a state of mild dislocation, indicating that the integration between MU and LU in Anhui Province was insufficient. The weighted analysis results suggest that a significant factor contributing to this issue is the lack of advanced technological innovation. Both MU and LU infrastructures remain partially mechanized and are not fully intelligent. Therefore, it is crucial to enhance technical support for both MU and LU to improve the coupling level of integration and innovation development.

3.2.3. Comprehensive Performance of LMDIIs in Anhui Province

In the analysis, the coupling and coordination degree of the LMDIIs serves as the independent variable, and the regional GDP, Internet broadband access ports, local financial expenditures on environmental protection, and total retail sales of consumer goods serve as control variables. The dependent variables include the development of digital and intellectual technology, low-carbon transformation, and profit levels of the two industries. A ridge regression analysis was performed, and Table 6 presents the results.
As shown in Table 6, the F-test p-values for Y1 (LU digital intelligence development level) and Y4 (MU low-carbon transformation level) are 0.169 and 0.512, respectively, indicating no statistically significant regression relationship. In contrast, Y2, Y3, Y5, and Y6 are statistically significant. These results suggest that there is no regression relationship between the coupling level of the LMDIIs and the digital intelligence development of the LU or the low-carbon transformation of the MU. However, a regression relationship does exist between the digital intelligence development of the MU, the low-carbon transformation of the LU, and the profit levels of both industries. This lack of a significant relationship may be due to the LU mainly serving the MU, which may not prioritize technological innovation in the development of the LU. Therefore, a higher coupling level of the LMDIIs does not necessarily lead to better performance in the digital and intelligence development of the LU. In addition, rapid development in the MU often results in increased energy consumption and carbon emissions. In the current phase of deep integration and innovation, the MU may focus more on achieving efficient outputs to recover investments in process optimization and technological research rather than on energy consumption and structural optimization. Consequently, a higher level of LMDIIs in innovation and coupling does not necessarily correlate with improved green and low-carbon performance for the MU.

4. Discussion

Based on the above analysis, this study proposes the following recommendations for promoting LMDIIs.
(1)
Strengthen the greening effect of LMDIIs.
While promoting cost reduction and efficiency, both the government and enterprises should strive to balance the improvement of output efficiency with sustainable development by considering the environmental impacts of LMDIIs, such as its abilities to reduce pollution, lower energy consumption, and enhance resource utilization efficiency. Moreover, its contribution to sustainable social development should be evaluated. For instance, the comprehensive use of policy tools such as taxation and subsidies should encourage the LU and MU to invest in basic and applied research during their collaborative development. Key areas to target include product design, manufacturing processes, material flow, energy structure, technological and equipment bottlenecks, and the active advancement of the innovation and application of low-carbon technologies and models. A thorough performance evaluation should be conducted, including assessments of the administrative management system, green management system, use of new energy equipment, green packaging, energy efficiency, and environmental benefits in enterprise green logistics.
(2)
Upgrade digitization and stimulate scientific and technological innovation.
In the LMDIIs’ evaluation indicators, innovation-driven factors are notably significant. Patent quality accounts for 10.06% in the LU’s indicator system, making it the second-largest indicator by proportion, whereas innovation output represents 20.6% in the MU’s indicator system, making it the largest proportion. To support these efforts, education and training programs should enhance the digital skills of the workforce, ensure a sufficient talent pool for the digitalization process, encourage cross-industry collaboration, and leverage digital technology to break down traditional industry boundaries as well as create new business models and services. In the MU, fostering high-quality clustering, promoting science- and technology-driven innovation, and investing in scientific research are essential for long-term, stable development. In the LU, leveraging technologies such as the Internet, EDI, and AI can enhance specialization, create high-value-added industries, and improve the quality of logistics services.
(3)
Strengthen regional industrial clusters.
Anhui Province should leverage its unique industrial strengths and foster regional core industrial competitiveness via LMDIIs. To meet the evolving demands of the MU, such as green, intelligent, and high-end technologies, it is essential to continually enhance the support for LU development, bolster cross-regional resource flow capabilities, optimize regional layout and support functions, and fully utilize the advantages of Anhui’s seven major manufacturing cities. Strengthening cooperation between upstream and downstream enterprises will create a well-coordinated industrial chain. Establishing a public service platform for industrial clusters will provide essential services, including technology research and development, market information, and talent training. Accelerating the growth of new industries, such as intelligent logistics, and integrating specialized logistics enterprises into the entire manufacturing industrial chain will drive the transformation and upgrading of green and intelligent manufacturing.
As a major manufacturing hub in China, Anhui Province plays a crucial role in both national and global economic development. Hence, the policy recommendations for LMDIIs in Anhui can serve as a valuable reference for other regions worldwide. Future research can explore the effectiveness of these recommendations in different countries and regions to further inform LMDIIs strategies.

5. Conclusions

Compared with the existing literature [52,53,54], this study offers a novel examination of the coupling level and performance of innovation development in the integration of two industries. The main innovations of this study are as follows: We constructed an evaluation index system for LMDIIs. Subsequently, we used the CRITIC method to determine the weights and the TOPSIS method to assess the comprehensive level of LMDIIs. We employed the coupling coordination degree model to analyze the coupling level of LMDIIs in a more objective and scientific manner and used ridge regression to study the comprehensive performance of LMDIIs. Moreover, we proposed policy recommendations to promote LMDIIs.
LMDIIs facilitate cost reduction, efficiency improvement, and industrial upgrading for the MU. They also support the release and aggregation of logistics demand, integrate social logistics resources, and enhance the overall service quality of the LU. As such, LMDIIs are crucial for advancing global economic and social development. The field of LMDIIs is a complex, systematic project with extensive research potential. Future researchers should explore the completeness and accuracy of the evaluation index system for integrating and innovating within the two industries. Expanding data capacity by incorporating dynamic comparisons across more provinces and years will enable a more systematic analysis of coupling coordination and comprehensive LMDII performance. This approach will yield more effective recommendations and suggestions for the advancement of LMDIIs.

Author Contributions

Conceptualization, H.D.; Methodology, Y.G. (Yuchang Gao) and F.H.; Investigation, Y.G. (Yuxia Guo); Resources, C.L.; Data Curation, H.D. and Y.G. (Yuchang Gao); Writing—Original Draft Preparation, H.D. and Y.G. (Yuchang Gao); Writing—Review and Editing, F.H. and C.L. All authors have read and agreed to the published version of the manuscript.

Funding

This study was supported by the Anhui Research Project on Social Science Innovation and Development (2022CX062, H.D.; 2022CX061, F.H.; 2023CX055, Yuxia Guo); Doctoral Research Initiation Program (BSPK024, H.D.), and University-level Research and Innovation Team (2018kytd01, C.L.).

Data Availability Statement

The datasets used and analyzed during the current study are available from the corresponding author upon reasonable request.

Conflicts of Interest

The authors declare no conflicts of interest.

References

  1. Ma, H.S.; Zhao, F.; Yan, Y.S. Research on the Formation and Evolution Conditions of Collaborative Agglomeration between Manufacturing and Logistics Industries. J. Highw. Transp. Res. Dev. 2022, 39, 169–176. [Google Scholar]
  2. Neves, A.; Godina, R.; Azevedo, S.G. A comprehensive review of industrial symbiosis. J. Clean. Prod. 2020, 247, 1–44. [Google Scholar] [CrossRef]
  3. Su, J.; Shen, T.; Jin, S. Ecological efficiency evaluation and driving factor analysis of the coupling coordination of the logistics industry and manufacturing industry. Environ. Sci. Pollut. Res. 2022, 29, 62458–62474. [Google Scholar] [CrossRef]
  4. Liu, Y.; Shang, M.; Xu, J.; Zhang, L.; Hua, H. Value Chain and the Integrated Development of Manufacturing and Modernized Services: A Case Study of Shandong Province, China. Sustainability 2023, 15, 1439. [Google Scholar] [CrossRef]
  5. Rosenberg, N. Technological Change in the Machine Tool Industry,1840–1910. J. Econ. Hist. 1963, 23, 414–443. [Google Scholar] [CrossRef]
  6. Ahmed, H.; Al Bashar, M.; Md, A.T.; Md, A.R. Innovative Approaches to Sustainable Supply Chain Management in the Manufacturing Industry: A Systematic Literature Review. Glob. Mainstream J. Innov. Eng. Emerg. Technol. 2024, 2, 1–13. [Google Scholar]
  7. Abideen, A.Z.; Sorooshian, S.; Sundram, V.P.K.; Ahmed, M. Collaborative insights on horizontal logistics to integrate supply chain planning and transportation logistics planning-A systematic review and thematic mapping. J. Open Innov. Technol. Mark. Complex. 2023, 9, 100066. [Google Scholar] [CrossRef]
  8. Ullah, M.; Asghar, I.; Zahid, M.; Omair, M.; AlArjani, A.; Sarkar, B. Ramification of remanufacturing in a sustainable three-echelon closed-loop supply chain management for returnable products. J. Clean. Prod. 2021, 290, 125609. [Google Scholar] [CrossRef]
  9. Guchhait, R.; Sarkar, B. A decision-making problem for product outsourcing with flexible production under a global supply chain management. Int. J. Prod. Econ. 2024, 272, 109230. [Google Scholar] [CrossRef]
  10. Amankou, K.A.C.; Guchhait, R.; Sarkar, B.; Dem, H. Product-specified dual-channel retail management with significant consumer service. J. Retail. Consum. Serv. 2024, 79, 103788. [Google Scholar] [CrossRef]
  11. Sarkar, B.; Ullah, M.; Sarkar, M. Environmental and economic sustainability through innovative green products by remanufacturing. J. Clean. Prod. 2022, 332, 129813. [Google Scholar] [CrossRef]
  12. Sarkar, B.; Debnath, A.; Anthony, S.F.; Ahmed, W. Circular economy-driven two-stage supply chain management for nullifying waste. J. Clean. Prod. 2022, 339, 130513. [Google Scholar] [CrossRef]
  13. Chen, X.L. Research on the Measurement and Driving Mechanism of the Integration Development of China’s Logistics and Manufacturing Industries. Doctoral Dissertation, Jiangxi University of Finance and Economics, Nanchang, China, 2023; pp. 5–61. [Google Scholar]
  14. Chen, S.L.; Wang, D. Spatial differences and dynamic evolution of integration and development of manufacturing and LT. Stat. Decis. 2022, 22, 102–107. [Google Scholar]
  15. Chu, Y.C.; Lian, W.H.; Yan, Z.C. Measurement of linkage efficiency between manufacturing and LT based on DEA-GRA bilevel model. Stat. Decis. 2021, 1, 182–186. [Google Scholar]
  16. Zhang, W.; Zhang, X.; Zhang, M. How to Coordinate Economic, Logistics and Ecological Environment? Evidences from 30 Provinces and Cities in China. Sustainability 2020, 12, 1058. [Google Scholar] [CrossRef]
  17. Yu, C.; Li, Y.; He, X. Data mining-assisted short-term wind speed forecasting by wavelet packet decomposition and Elman neural network. J. Wind. Eng. Ind. Aerodyn. 2018, 175, 136–143. [Google Scholar] [CrossRef]
  18. Tian, Q.; Liu, Y.; Li, N.; Gao, G. Coordinated development of manufacturing and logistics industry-an empirical study based on East China. Mod. Manag. Sci. 2022, 1, 31–41. [Google Scholar]
  19. Yan, F. Spatial association and influencing factors of synergistic agglomeration of logistics and manufacturing industries. Stat. Decis. Mak. 2021, 7, 113–117. [Google Scholar]
  20. Agrawal, R.; Majumdar, A.; Kumar, A.; Luthra, S. Integration of artificial intelligence in sustainable manufacturing: Current status and future opportunities. Oper. Manag. Res. 2023, 16, 1720–1741. [Google Scholar] [CrossRef]
  21. Wang, S.Y.; Zhang, R.W.; Yang, Y.J.; Chen, J.S.; Yang, S. Has enterprise digital transformation facilitated the carbon performance in Industry 4.0 era? Evidence from Chinese industrial enterprises. Comput. Ind. Eng. 2023, 184, 109576. [Google Scholar] [CrossRef]
  22. Yang, G.Q.; Nie, Y.M.; Li, H.G.; Wang, H.S. Digital transformation and low-carbon technology innovation in manufacturing firms: The mediating role of dynamic capabilities. Int. J. Prod. Econ. 2023, 263, 108969. [Google Scholar] [CrossRef]
  23. Jum’a, L.; Zimon, D.; Madzik, P. Impact of big data technological and personal capabilities on sustainable performance on Jordanian manufacturing companies: The mediating role of innovation. J. Enterp. Inf. Manag. 2024, 37, 329–354. [Google Scholar] [CrossRef]
  24. Nwagwu, U.; Niaz, M.; Uchenna, M.C.; Saddique, F. The influence of artificial intelligence to enhancing supply chain performance under the mediating significance of supply chain collaboration in manufacturing and logistics organizations in Pakistan. Tradit. J. Multidiscip. Sci. 2023, 1, 29–40. [Google Scholar]
  25. Lee, K.L.; Wong, S.Y.; Alzoubi, H.M.; Al Kurdi, B.; Alshurideh, M.T.; El Khatib, M. Adopting smart supply chain and smart technologies to improve operational performance in manufacturing industry. Int. J. Eng. Bus. Manag. 2023, 15, 18479790231200614. [Google Scholar] [CrossRef]
  26. Zhu, Y.H.; Cheng, J.F.; Liu, Z.F.; Cheng, Q.; Zou, X.F.; Xu, H.; Wang, Y.; Tao, F. Production logistics digital twins: Research profiling, application, challenges and opportunities. Robot. Comput.-Integr. Manuf. 2023, 84, 102592. [Google Scholar] [CrossRef]
  27. Liu, Y. Synergistic Industrial Agglomeration and Coordinated Regional Economic Development from the Perspective of Spatial Economics. Ph.D. Thesis, Zhejiang University, Hangzhou, China, 2016; pp. 143–187. [Google Scholar]
  28. Chen, C.M.; Chen, J.X.; Gu, J. Study on the evolution of linkage development between manufacturing and logistics industry in China. J. Shandong Univ. (Philos. Soc. Sci. Ed.) 2020, 2, 73–81. [Google Scholar]
  29. Zhao, X.M.; Tong, J. The coordination degree of regional manufacturing industry and logistics industry-taking Shanghai as an example. Syst. Eng. 2018, 36, 95–103. [Google Scholar]
  30. Zhang, H.; Wu, S.L. The impact of synergistic agglomeration of logistics and manufacturing industries on residential consumption expansion—An empirical analysis based on dynamic spatial Durbin model. Consum. Econ. 2022, 38, 41–56. [Google Scholar]
  31. Ma, H.H.; Zhao, F.; Yan, Y.S. Study on the formation and evolution conditions of synergy agglomeration between manufacturing and LT. Highw. Transp. Sci. Technol. 2022, 2, 169–176. [Google Scholar]
  32. John, E.; Spillan, A.; Mintu-Wimsatt, A.K. Role of logistics strategy, coordination and customer service commitment on Chinese manufacturing firm competitiveness. Asia Pac. J. Mark. Logist. 2018, 30, 1365–1378. [Google Scholar]
  33. National Bureau of Statistics of the People’s Republic of China. China Statistical Yearbook; China Statistics Press: Beijing, China, 2014. [Google Scholar]
  34. China Key Industry Patent Information Service Platform. Available online: https://chinaip.cnipa.gov.cn/chinaip/index.html (accessed on 1 May 2024).
  35. Du, W.; Yang, Y.C. The coordinated development of manufacturing industry and logistics industry in the Yangtze River Economic Belt: Empirical study by stages based on Haken Model. PLoS ONE 2022, 17, e0263565. [Google Scholar] [CrossRef] [PubMed]
  36. Ali, A.; Cao, M.Q.; Allen, J.; Liu, Q.H.; Ling, Y.T.; Cheng, L. Investigation of the drivers of logistics outsourcing in the United Kingdom’s pharmaceutical manufacturing industry. Multimodal Transp. 2023, 2, 100064. [Google Scholar] [CrossRef]
  37. Liu, Z.; Cen, L. Integrated application in intelligent production and logistics management: Technical architectures concepts and business model analyses for the customized facial masks processing. Int. J. Comput. Integr. Manuf. 2019, 32, 4–5. [Google Scholar] [CrossRef]
  38. Ding, H.; Liu, Y.; Zhang, Y.; Wang, S.; Guo, Y.; Zhou, S.; Liu, C. Data-driven evaluation and optimization of the sustainable development of the logistics industry: Case study of the Yangtze River Delta in China. Environ. Sci. Pollut. Res. 2022, 29, 68815–68829. [Google Scholar] [CrossRef]
  39. Zhou, L.F.; Zhang, L.; Fang, Y.J. Logistics service scheduling with manufacturing provider selection in cloud manufacturing. Robot. Comput. Integr. Manuf. 2020, 65, 101914. [Google Scholar] [CrossRef]
  40. Lafuente, E.; Vaillant, Y.; Vendrell-Herrero, F. Editorial: Product-service innovation Systems-Opening-up servitization-based innovation to manufacturing industry. Technovation 2023, 120, 102665. [Google Scholar] [CrossRef]
  41. Yao, Z.Q.; Chen, S.; Hu, W.H.; Zhang, L.Q.; Wu, Q.; Zhang, Y. Temporal and spatial evolution of ESV and identification of human driving factors in dual-core area of Wanjiang urban belt. Resour. Environ. Yangtze River Basin 2022, 8, 1776–1786. [Google Scholar]
  42. Tang, Z.M.; Zhan, L.; Zhang, X.D.; Chen, G.G.; Zhou, M.; Tian, F.J.; Liu, H.Y.; Zhang, J.; Zhang, M. Comprehensive evaluation of selenium rich land resources in Changting County, Fujian Province based on niche theory and AHP-TOPSIS model. Rock Miner. Test. 2024, 43, 1–11. [Google Scholar]
  43. Song, Y.; Wang, J.; Ge, Y.; Xu, C. An optimal parameters-based geographic detector model enhances geographic characters of exploratory variables for spatial heterogeneity analysis: Cases with different types of spatial data. GIScience Remote Sens. 2020, 57, 593–610. [Google Scholar] [CrossRef]
  44. Chen, M.M.; Lv, J.P. Ecological security evaluation and obstacle factor diagnosis of cultivated land in the upper reaches of the Yellow River based on entropy weight TOPSIS. J. Yunnan Agric. Univ. (Soc. Sci.) 2024, 18, 1–9. [Google Scholar]
  45. Dong, T.; Yin, S.; Zhang, N. The Interaction Mechanism and Dynamic Evolution of Digital Green Innovation in the Integrated Green Building Supply Chain. Systems 2023, 11, 122. [Google Scholar] [CrossRef]
  46. Nie, Y.Y.; Yao, Q.Y.; Zhou, Z.B. Industrial synergy and high-quality economic development in Yangtze River Delta region. East China Econ. Manag. 2022, 10, 16–30. [Google Scholar]
  47. Liang, H.Y. Evolution characteristics, performance and promotion path of the integration and development of China’s manufacturing and logistics industries. Quant. Econ. Tech. Econ. Res. 2021, 10, 24–45. [Google Scholar]
  48. Ding, J.; Liu, B.L.; Shao, X.F. Spatial effects of industrial synergistic agglutination and regional green development efficiency: Evidence from China. Energy Econ. 2022, 112, 156. [Google Scholar] [CrossRef]
  49. Sun, Q.Q.; Zhou, J.J. The influence of informationization on manufacturing upgrading-an analysis from the perspective of technological innovation. Sci. Decis. 2021, 5, 44–64. [Google Scholar]
  50. Ge, C.B.; Yuan, X.J.; Yu, J.P.; Li, N. Trade Facilitation, Spatial Spillovers and the Status of Value Added Trade Network. Explor. Econ. Issues 2022, 7, 150–172. [Google Scholar]
  51. Almutiri, T.M.; Alomar, K.H.; Nofe, A.A. Integrating Multi-Omics Using Bayesian Ridge Regression with Iterative Similarity Bagging. Appl. Sci. 2024, 14, 5660. [Google Scholar] [CrossRef]
  52. Zhu, J.M.; Zhu, Z.H. The space-time evolution and driving mechanism of coordinated development of modern logistics industry and tourism industry. J. Clean. Prod. 2023, 423, 138620. [Google Scholar] [CrossRef]
  53. Nyimbili, P.H.; Erden, T.; Karaman, H. Integration of GIS, AHP and TOPSIS for earthquake hazard analysis. Nat. Hazards 2018, 92, 1523–1546. [Google Scholar] [CrossRef]
  54. Li, Y.; Zhou, B. Coupling coordination degree measurement and spatial characteristics analysis of green finance and technological innovation -Empirical analysis based on China. Heliyon 2024, 10, e33486. [Google Scholar] [CrossRef]
Figure 1. Method flow and application.
Processes 12 01867 g001
Figure 2. Case study area.
Processes 12 01867 g002
Figure 3. Indicator weights of the LU and MU.
Processes 12 01867 g003
Figure 4. Calculation results of the coupling coordination degree.
Processes 12 01867 g004
Table 2. Indicators of variables.
VariantLevel 1 IndicatorsSecondary IndicatorsNotation
Independent variableLevel of coupling between the two industries’ integration and innovative developmentDegree of coupling coordinationX1
Dependent variableLevel of technological development of the two industries in terms of digital intelligenceNumber of patent applications for inventionsY1
Number of active patentsY2
Levels of low-carbon transition in the two sectorsCarbon intensity of the LUY3
Carbon intensity of the MUY4
Profit levels of the two industriesValue added for the LUY5
Manufacturing value addedY6
Control variableLevel of economic developmentRegional GDPK1
Level of information technologyInternet broadband access portK2
Environmental protectionExpenditures on environmental protection in local financesK3
Market sizeTotal retail sales of consumer goodsK4
Table 3. Coupling coordination degree interval and classification of grade types.
Degree of Coupling CoordinationLevel of Coordination
0.0000–0.0999Extreme disorder
0.1000–0.1999High degree of disproportion
0.2000–0.2999Moderate disorder
0.3000–0.3999Low-grade disorder
0.4000–0.4999Slightly out of tune
0.5000–0.5999Weakly coordinated
0.6000–0.6999Low level of coordination
0.7000–0.7999Moderate coordination
0.8000–0.8999High degree of coordination
0.9000–0.1000Strongest coordination
Table 4. Comprehensive score of the level of LMDIIs in Anhui Province.
Year2013201420152016201720182019202020212022
L-Score0.45140.43490.40330.47460.42400.47360.43100.48530.44380.4804
M-Score0.41970.50020.48370.46760.48160.44670.43450.52600.53950.4968
Table 5. Coupling coordination degree results of the LMDIIs in Anhui Province.
YearCTDLevel of CoordinationDegree of Coupling Coordination
20130.21750.43560.30783Mild disorder
20140.23260.46750.32983Mild disorder
20150.21990.44350.31233Mild disorder
20160.23560.47110.33313Mild disorder
20170.22550.45280.31953Mild disorder
20180.22990.46010.32523Mild disorder
20190.21640.43270.30603Mild disorder
20200.25240.50570.35733Mild disorder
20210.24350.49160.34603Mild disorder
20220.24420.48860.34543Mild disorder
Table 6. Ridge regression results.
Non-Standardized Coefficient
Y1Y2Y3Y4Y5Y6
Constant−2.606−0.9841.6953.591−0.603−0.775
X18.6153.223−1.954−8.591.742.648
K1−0.8490.254−0.960.8520.8330.048
K20.9430.410.464−0.759−0.2920.382
K30.523−0.018−0.254−0.7940.2180.257
K4−0.1580.132−0.3770.4880.3190.207
R20.7780.980.9160.5570.940.937
F2.8140.2068.7221.00712.59111.949
(0.169 *)(0.002 ***)(0.028 **)(0.512 *)(0.015 **)(0.016 **)
Note: ***, **, and * represent 1%, 5%, and 10% significance levels, respectively.
Disclaimer/Publisher’s Note: The statements, opinions and data contained in all publications are solely those of the individual author(s) and contributor(s) and not of MDPI and/or the editor(s). MDPI and/or the editor(s) disclaim responsibility for any injury to people or property resulting from any ideas, methods, instructions or products referred to in the content.

