Article

Scaling up the Natural Mode of Action of Macrophyte Allelochemicals and Their Effect on Toxic Cyanobacteria Using a Nitrogen-Limited Chemostat

1
Water, Biodiversity and Climate Change Laboratory, Phycology, Biotechnology and Environmental Toxicology Research Unit, Faculty of Sciences Semlalia, Cadi Ayyad University, Av. Prince My Abdellah, P.O. Box 2390, Marrakech 40000, Morocco
2
AgroBioSciences, Plant Stress Physiology Laboratory, Mohammed VI Polytechnic University, Benguerir 43150, Morocco
3
iES Landau (Institute for Environmental Sciences), RPTU Kaiserslautern-Landau, 76829 Landau, Germany
4
UMR-I 02 INERIS-URCA-ULH SEBIO, University of Reims Champagne-Ardenne, 15, 51100 Reims, France
5
Environmental Microbiology and Toxicology Research Unit, Polydisciplinary Faculty of Khouribga (FPK), Sultan Moulay Slimane University, Beni Mellal 23000, Morocco
*
Author to whom correspondence should be addressed.
Processes 2024, 12(9), 1883; https://doi.org/10.3390/pr12091883
Submission received: 7 August 2024 / Revised: 26 August 2024 / Accepted: 30 August 2024 / Published: 2 September 2024

Abstract

:
This study investigates the inhibitory and hormetic effects of Myriophyllum spicatum extract on Microcystis aeruginosa in a controlled, continuous culture environment. To address the global challenge posed by harmful algal blooms, we used a range of extract concentrations to delineate the growth response patterns. At very low concentrations (6.25 and 12.5 mg/L), the addition of M. spicatum extract shows no discernible reduction in M. aeruginosa cell density or growth rate; instead, a slight increase is observed during exposure, suggesting a hormetic effect. However, at higher concentrations (75 and 100 mg/L), there is a drastic reduction of more than 50% in cell density and growth rate at 75 mg/L, with complete inhibition at 100 mg/L, leading to pronounced oxidative stress, damage to antioxidant defense systems, and increased cell mortality. Increased levels of malondialdehyde, catalase, and superoxide dismutase activities indicate the involvement of these enzymes in combating oxidative stress. Furthermore, intracellular and extracellular microcystins were significantly decreased at higher extract concentrations (50, 75, and 100 mg/L) in a dose-dependent manner. Our results indicate a dose-dependent response and provide insight into the potential application of natural water treatment solutions. Implications for ecological management and future research directions are discussed.

1. Introduction

Over the past decades, harmful cyanobacterial blooms fueled by nutrient enrichment have become a global concern, posing risks to ecological systems and human health [1,2,3]. These blooms, often dominated by Microcystis aeruginosa, are particularly prevalent in arid areas like Morocco, where freshwater scarcity compounds the issue [4]. With over 75% of drinking water sourced from surface reservoirs, the control and prevention of cyanobacterial blooms are imperative for water quality management [3].
Various methods, including physical, chemical, and biological approaches, have been employed to mitigate harmful algal blooms [5,6,7]. Among the biological methods, the utilization of seaweeds and plant-derived compounds, such as allelochemicals, has emerged as a promising eco-friendly strategy [4,8,9,10]. Notably, recent research by [11] sheds light on the dose–response relationship of submerged plant extracts on cyanobacteria growth. Their findings revealed that low dosages stimulated M. aeruginosa cell growth, while high dosages inhibited growth, exemplified by a range of inhibition rates across different submerged plants [11].
These observations align with prior studies showcasing the potential of allelochemicals from aquatic plants to regulate cyanobacteria proliferation. For instance, compounds isolated from Elodea nuttallii and Phragmites australis have demonstrated inhibitory effects on cyanobacteria, including M. aeruginosa [12,13]. Moreover, the study underscores the need for a nuanced understanding of dosage effects, suggesting that the concentration of allelochemicals influences their efficacy in controlling cell growth [11].
While previous investigations have primarily relied on batch cultures, which may limit the extrapolation of results to natural settings, this study’s continuous culture approach offers a promising alternative. By mimicking natural conditions and enabling long-term assessments, continuous culture techniques provide valuable insights into the dynamics of macrophyte–cyanobacteria interactions and the potential for sustained microalgae management strategies [11,14]. According to [15], this culture method and the permanent confinement of the cells may have serious limits in the inference of allelopathic results to the natural environment. These limits mainly concern the possible accumulation of allelochemical compounds and other metabolites in the culture enclosure and the short duration of the experiment resulting from the rapid decrease in algae growth during exposure. To avoid the limits of batch culture and to imitate the natural mode of emission of allelochemicals, the continuous culture technique needs to be tested. The controlled continuous culture (chemostat mode) works in a growth steady state (cell density ± stable, growth rate = dilution rate) controlled by a constant supply of a limiting nutrient [16]. This continuous system is much closer to the natural environment because the microalgae benefit from a constant renewal of the nutrient medium, preventing the accumulation of growth-inhibiting metabolites. It also offers the possibility of a long-term study of the growth and physiological response of microalgae exposed to gradual dosages of macrophyte extract and allows for the study of the decontamination of a culture in a healthy environment [14].
Therefore, this study aims to build upon existing knowledge by evaluating the effect of Myriophyllum spicatum ethyl acetate (MEA) extract on M. aeruginosa within a continuous culture system. Through this approach, we seek to elucidate the allelopathic effects of submerged plant extracts on cyanobacterial growth and physiology, offering valuable insights for sustainable water quality management strategies.

2. Materials and Methods

2.1. Plant Materials

The macrophyte biomass was collected from a Mediterranean natural lake, Dayet Aoua (33°39′10″ N, 5°02′30″ W, medium Atlas, Morocco) during the flowering period (May 2017). This species was the most abundant in the natural lake. It has a long stem with feathery leaves over 35 mm long, attached in groups of three to five. As the plant grows, the lower leaves die and fall due to the shade created by the new shoots (natural pruning). The hairless, branched stem spans 0.5 to 7 m in length. Flowering occurs when the plant reaches the water’s surface. The flower spike (inflorescence) is terminal and located above the water, before returning to the water after the fruit ripens. The upper part of the stem, between five and twenty nodes long, is about twice as wide as the rest of the stem and is very rigid and curved [17]. We identified the macrophytes as Myriophyllum spicatum L. and deposited voucher specimens in the author’s personal herbarium under reference number 5. The macrophyte sample was placed in sterile plastic bags and transported on ice to the laboratory, washed with distilled water to remove sediment and organic matter, and then air-dried before the leaves were ground and powdered.
The leaf powder of M. spicatum was subjected to aqueous extractions and organic fractionations according to the methods described by [18]. Briefly, 20 g of powder from M. spicatum was mixed with 300 mL of distilled water, soaked, and extracted at room temperature (20–25 °C) for 48 h. Then, the solution was filtered with GF/C glass fiber (47 mm, 1.2 μm). The filtrate was collected for further fractionations. The aqueous solution was adjusted to pH 12 with 2 M NaOH, and the alkaline extract was centrifuged at 6000 rpm for 10 min. The supernatant was transferred to a separating funnel and washed three times with 200 mL of hexane. The aqueous fraction was acidified to pH 5 with 2 M HCl and then extracted three times with 100 mL of ethyl acetate. Anhydrous sodium sulfate was added to the macrophytes ethyl acetate (MEA) extracts to remove water and then filtered through No. 2 filter paper. The fraction of the ethyl acetate extract was stored at 4 °C until used for HPLC analysis and biological test in the N-limited chemostat system.

2.2. Microalgae Strain and Medium

The toxic unicellular non-axenic strain of M. aeruginosa originated from the Phycology, Biotechnology, and Environmental Toxicology Research Unit collection, Faculty of Sciences Semlalia, Cadi Ayyad University, Marrakech, Morocco [8]. Cultures were acclimated to each test for 10–15 days in BG11 with several concentrations of nitrogen (200, 900, 1800, and 17,000 µmoles/L of NO3) to choose the best concentration to limit the growth rate of Microcystis aeruginosa.

2.3. Experimental Design of Continuous Culture in Chemostat Mode

Prior to inoculation into the continuous culture system, the unicellular M. aeruginosa strain was maintained in monoclonal culture on the BG11 medium. Continuous culture operated in chemostat mode with NO3 (1177 µmoles/L) as a limiting factor (preliminary batch culture experiments had indicated that the used NO3 concentration ensured the N limitation); the other nutrients were provided at the normal concentrations of the BG11 medium. The steady state of a continuous culture is characterized by a stable cell density (lnN2/N1 = 0) and by a Napierian growth rate (µe) equal to the dilution rate (D) [19], hence Equation (1):
µe = ln (N2/N1)/t2 − t1 + D
where N2 and N1 represent the cell density (cell/mL) of the culture at times t2 and t1, respectively.
This growth rate was expressed in the number of divisions per day by dividing µe/ln 2 = µ2.
D, the dilution rate (expressed in d−1), is measured by dividing the daily flow rate of the nutrient medium by the volume of the culture.
As indicated in the studies of [20,21], a chemostat cultivation system was designed as follows: The culture system was composed of a 10 L nutrient tank (in polycarbon), a growth chamber (6L DURAN® Flat Bottom Flask Narrow Neck) containing 3 L of the BG11 culture medium, and a harvest recipient (flask of 5 L) placed in the dark and at a temperature of 4 °C (Figure 1 and Figure 2). The flow rate of the BG11 nutrient medium is regulated via a peristaltic pump (LEAD FLUID® Technology Co., Ltd., Baoding, China) through silicone tubing. Aeration of the culture was performed by a sterile air supply (300 ± 10 mL.min−1) which allows for the transfer of the culture to overflow to a harvesting recipient through silicone tubing. The agitation and homogeneity of the culture were achieved by the revolution of a magnetic bar at 100 rpm. The chemostat was exposed in a culture chamber to a saturated luminous intensity of 230 µmol photon. m−2. s−1 from cool-white fluorescents and a light/dark cycle of 15 h/9 h at 26 ± 2 °C. Continuous culture was carried out under axenic conditions by autoclaving all recipients, glassware, tubing, and distilled water used to prepare the nutrient medium.

2.4. Determination of M. aeruginosa Growth, Oxidative Stress Parameters, and Toxicity

After inoculating the continuous culture system with the monoclonal unicellular M. aeruginosa strain, it was first operated in batch mode for 5 days and then switched to continuous mode by providing a continuous flow rate of the sterile N-limited BG11 medium. The culture was grown at two different flow rates (0.625 and 0.83 mL/min) which correspond, respectively, to dilution rates of 0.3 and 0.4 day−1. Once the culture reached steady-state growth (µe = D), i.e., when it has maintained a stable growth rate for more than two successive generations (TG = ln2/µe), MEA extract was administrated to the BG11 nutrient medium on day 0. As the other growth conditions were strictly controlled, this steady state represented the control situation against which changes in the growth and physiological state of the cyanobacterium following extract exposure were compared.
To evaluate the effect of MEA extracts on the growth and investigate the physiological response of M. aeruginosa, successive enrichment experiments of the nutrient medium with the MEA extract were carried out at concentrations of 6.25, 12.5, 25, 50, 75, and 100 mg/L on the same culture during 70 days. Every day, 5 mL were sampled from the growth chamber at a fixed time, 3 h after the beginning of the photoperiod, to measure the pH and the cell growth (Figure 1). The cell count was performed 5 times on the Mallassez hematimeter. To analyze the possible mechanism of the inhibitory effect, a daily additional 50 mL in replicates (n = 3) was sampled from the harvested volume (Figure 1). The total protein content was determined, in triplicate, according to [22]. The lipid peroxidation was reflected by changes in malondialdehyde (MDA) content, which was determined in triplicate, according to [23]. The activity of antioxidant enzymes, superoxide dismutase (SOD) and catalase (CAT), was assayed in triplicate using [24]’s and [25]’s methods, respectively.
To assess the effect of MEA extracts on toxin production, an ELISA test was performed. To this end, 100 mL water samples were taken before and after treatment. Two aliquots were taken from each sample: one to determine the concentration of dissolved extracellular microcystins (from the GF/C disk filtrate) and the other to measure the total toxin concentration after three freeze–thaw cycles. The intracellular toxin concentration was calculated by subtracting the extracellular amount from the total microcystin concentration.
Two mL of each sample was filtered through membrane filters (0.22 mm, Millex-GV, Millipore, Merck KGaA, Darmstadt, Germany) directly before analysis and then analyzed with a commercially available microcystin/nodularin ELISA (ADDA) kit (Eurofins Abraxis, Warminster, PA, USA) according to the manufacturer’s instructions by measuring the absorbance at 450 nm (Microplate Reader, Optic Inymen system, model: 2100-C, Barcelona, Spain). The limit of detection (LOD) was 0.15 µg/mL. The data are expressed as MC-LR equivalents.

2.5. Identification and Quantification of Phenolic Compounds by HPLC

For the purposes of identifying the phenolic compounds in MEA extract, we used the HPLC method described in our previous study [26] for other macrophytes.

2.6. Statistical Analysis

Statistical analysis was performed using IBM SPSS Statistics version 23. One-way analysis of variance (ANOVA) was conducted to determine differences in microcystin concentrations among treatment groups. Post-hoc Tukey tests were employed to identify specific pairwise differences between treatment means. Significance was set at p < 0.05.

3. Results and Discussion

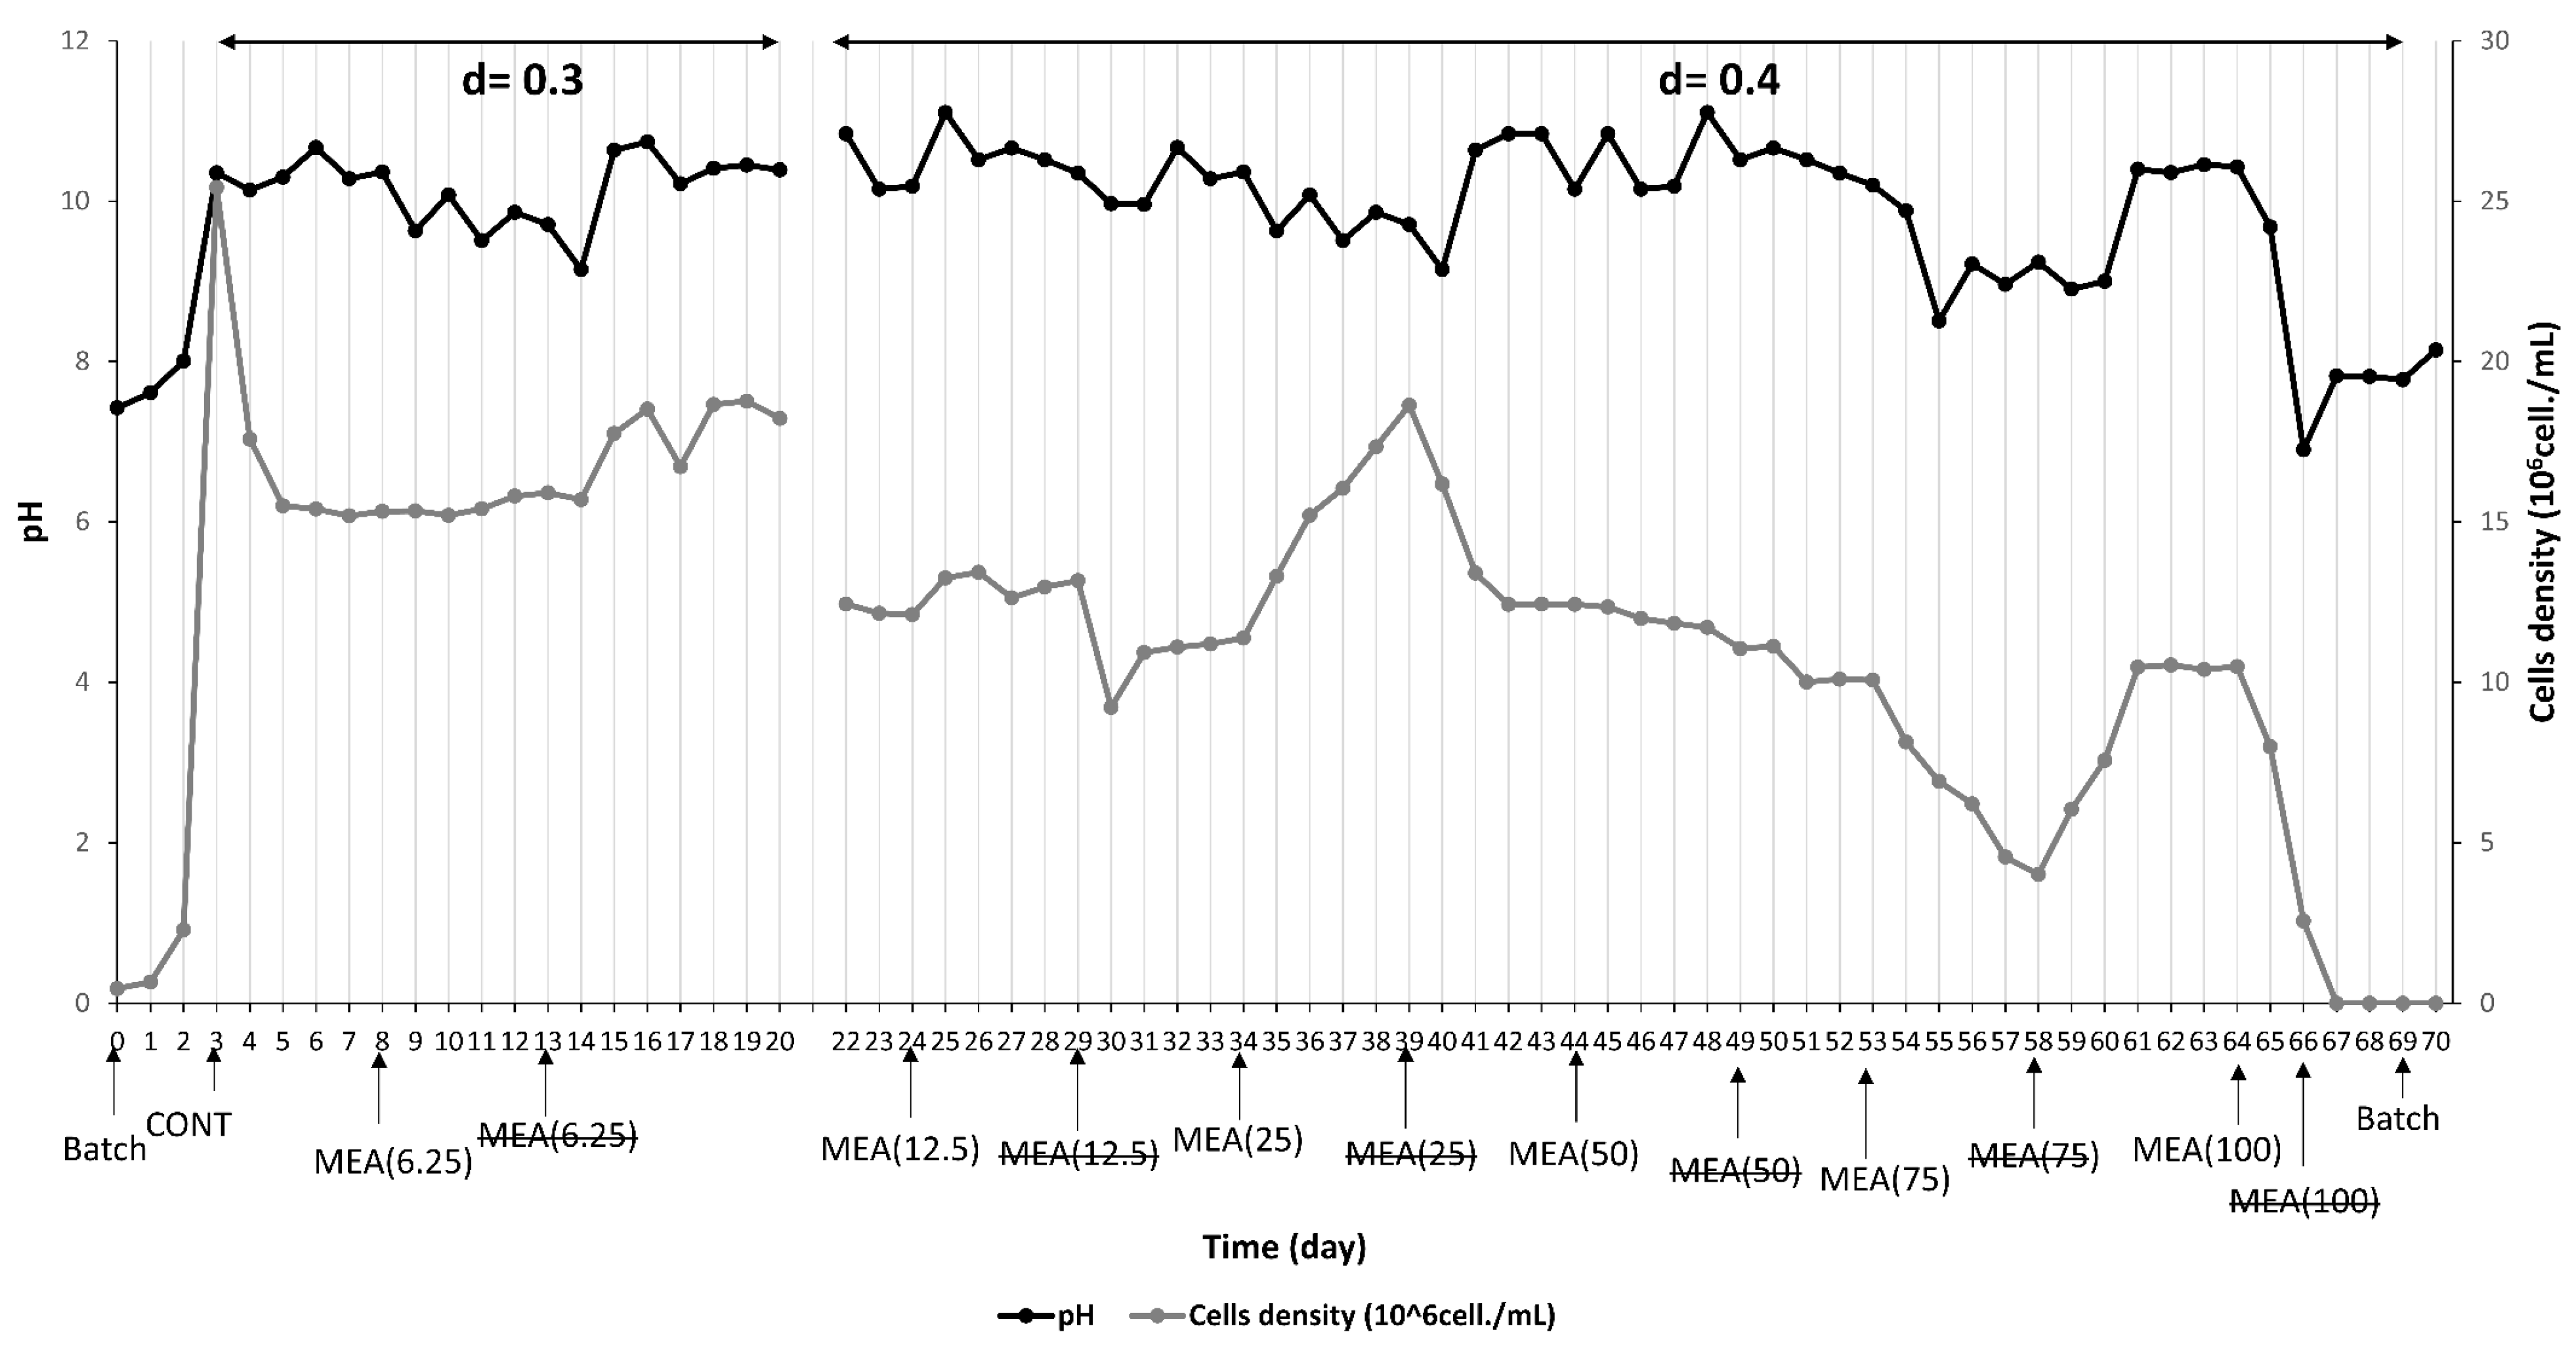
3.1. Effect of M. spicatum Extract on M. aeruginosa Growth

To assess the anti-cyanobacterial potential of M. spicatum ethyl acetate (MEA) extract, a continuous culture of M. aeruginosa was established at a dilution rate of 0.3 d−1, subsequently adjusted to 0.4 d−1, and subjected to increasing concentrations of the extract (6.25, 12.5, 25, 50, 75, and 100 mg/L) in the nutrient medium over a period of 70 days. The results, illustrated in Figure 2, depict the monitoring of cell density and growth rate throughout the experiment.
At the initial chemostat steady state (µe = D = 0.3 d−1), characterized by an average cell density of 15.19 ± 0.08 106 cells/mL, the addition of MEA extract at a very low concentration (6.25 mg/L), equivalent to the previously determined minimum inhibitory concentration (MIC) in batch culture [8], elicited no significant effect on either cell density or growth rate. However, upon withdrawal of the treatment, a subsequent increase in cell density and growth rate was observed.
When moving to a new steady-state condition (µe = D = 0.4 d−1), the introduction of the extract at 12.5 mg/L initially resulted in a slight enhancement of M. aeruginosa growth, particularly notable in the first two days of exposure. Subsequent exposure to 25 mg/L led to a more pronounced growth stimulation over five days, which aligns with the findings for Ceratophyllum sp., M. spicatum, Spartina alterniflora, and Vallisneria natans extracts at their respective low concentrations considered as the hormesis effect [11,27,28]. Conversely, a subtle inhibition of growth was observed at 50 mg/L, with more substantial inhibition (>50% reduction in cell density and growth rate) evident at 75 mg/L (Figure 2).
After the treatment at 75 mg/L (day 39), the cyanobacterial growth promptly recovered, exhibiting a significant increase in cell division rate for the first three days before returning to the initial steady state. In contrast, treatment with 100 mg/L of MEA extract resulted in complete inhibition of M. aeruginosa growth, with a notable reduction in cell density observed just two days post-exposure, followed by increased cell mortality. For instance, the inhibition rates observed with MEA extract at high dosages align with or surpass the inhibitory effects reported for other plant extracts. Notably, the inhibition rates for MEA extract at concentrations exceeding 50 mg/L are consistent with or higher than those observed for Ranunculus japonicus Thunb, Acorus calamus L., and Sagittaria sagittifolia extracts at their respective high dosages [29,30,31].
Table 1 represents a comparative overview of the effect of aqueous and organic solvent extracts from various macrophytes, such as Acorus gramineus, Acorus calamus, and Ranunculus aquatilis, which have demonstrated significant inhibitory effects, with inhibition rates reaching up to 100% in some cases. The mode of culture, concentration, and type of extract used significantly influence the extent of inhibition. In semi-continuous systems, the combination of plant extracts appears to sustain high inhibition rates over longer periods, as seen with Cyperus alternifolius and Canna generalis extracts. The comparison presented in Table 1 highlights the consistency and relevance of our results with those of recent studies, reinforcing the potential of plant extracts as effective inhibitors of Microcystis aeruginosa and contributing to the development of sustainable strategies for the management of harmful cyanobacterial blooms.
Our current study contributes to this growing body of research by evaluating the ethyl acetate extract of M. spicatum in a continuous culture system. The findings reveal a strong inhibitory effect on M. aeruginosa, with a 50% inhibition observed at 75 mg/L and complete inhibition at 100 mg/L, suggesting that this extract could be a promising candidate for managing harmful cyanobacterial blooms in aquatic environments.
The observed variations in cell density and growth rate highlight the differential responses of M. aeruginosa to varying concentrations of MEA extract in the continuous culture system. Notably, the continuous culture setup mitigates the confounding factors present in batch cultures, such as the accumulation of allelochemical compounds and metabolites, leading to a higher MIC (approximately tenfold) in the continuous culture system [8]. Consistent with this, the inhibitory effects of MEA extract were only evident at concentrations exceeding 50 mg/L in the chemostat system.
In a related study, Hua et al. (2018) [32] demonstrated a direct relationship between the reduction in M. aeruginosa growth and the activity of the cell antioxidant system in a semi-continuous culture system. Their findings underscored the role of allelochemical compounds, such as those found in rice straw extract, in limiting the activity of antioxidant enzymes, thereby inducing growth suspension and cell death in cyanobacteria.
The daily pH measurements in the culture have not shown any significant change after treatment by MEA extract (Figure 3).
Table 1. Comparative table of the inhibitory effects of different plant materials and their extracts on the growth of M. aeruginosa under different culture conditions.
Plant MaterialType of ExtractsTarget Organism Mode of CultureTested Concentration Inhibitory PercentageReferences
Acorus calamushexane extract of rhizomeM. aeruginosaBatch20 mg/L %IR = 100[33]
R. aquatilis and N. officinaleaqueous extractM. aeruginosaBatch75% of AE%IR = 100
%IR = 95
[4]
Spartina alternifloraaqueous extractM. aeruginosaBatch150 mg/L%IR = 99.4[28]
Cyperus alternifolius and Canna generalisextracts of culture solutionsM. aeruginosaSemi-continuous co-culture system2.34 mg/L%IR = 99.6[34]
P. cristatus, P. maackianus, P. lucens, V. spinulosa, C. demersum, and H. verticillatavolatile compounds M. aeruginosaBatch50 mg/L%IR = 30.2–41.7[35]
M. spicatumethyl acetate extractM. aeruginosaContinuous system75 mg/L
100 mg/L
%IR = 50
%IR = 100
In this study

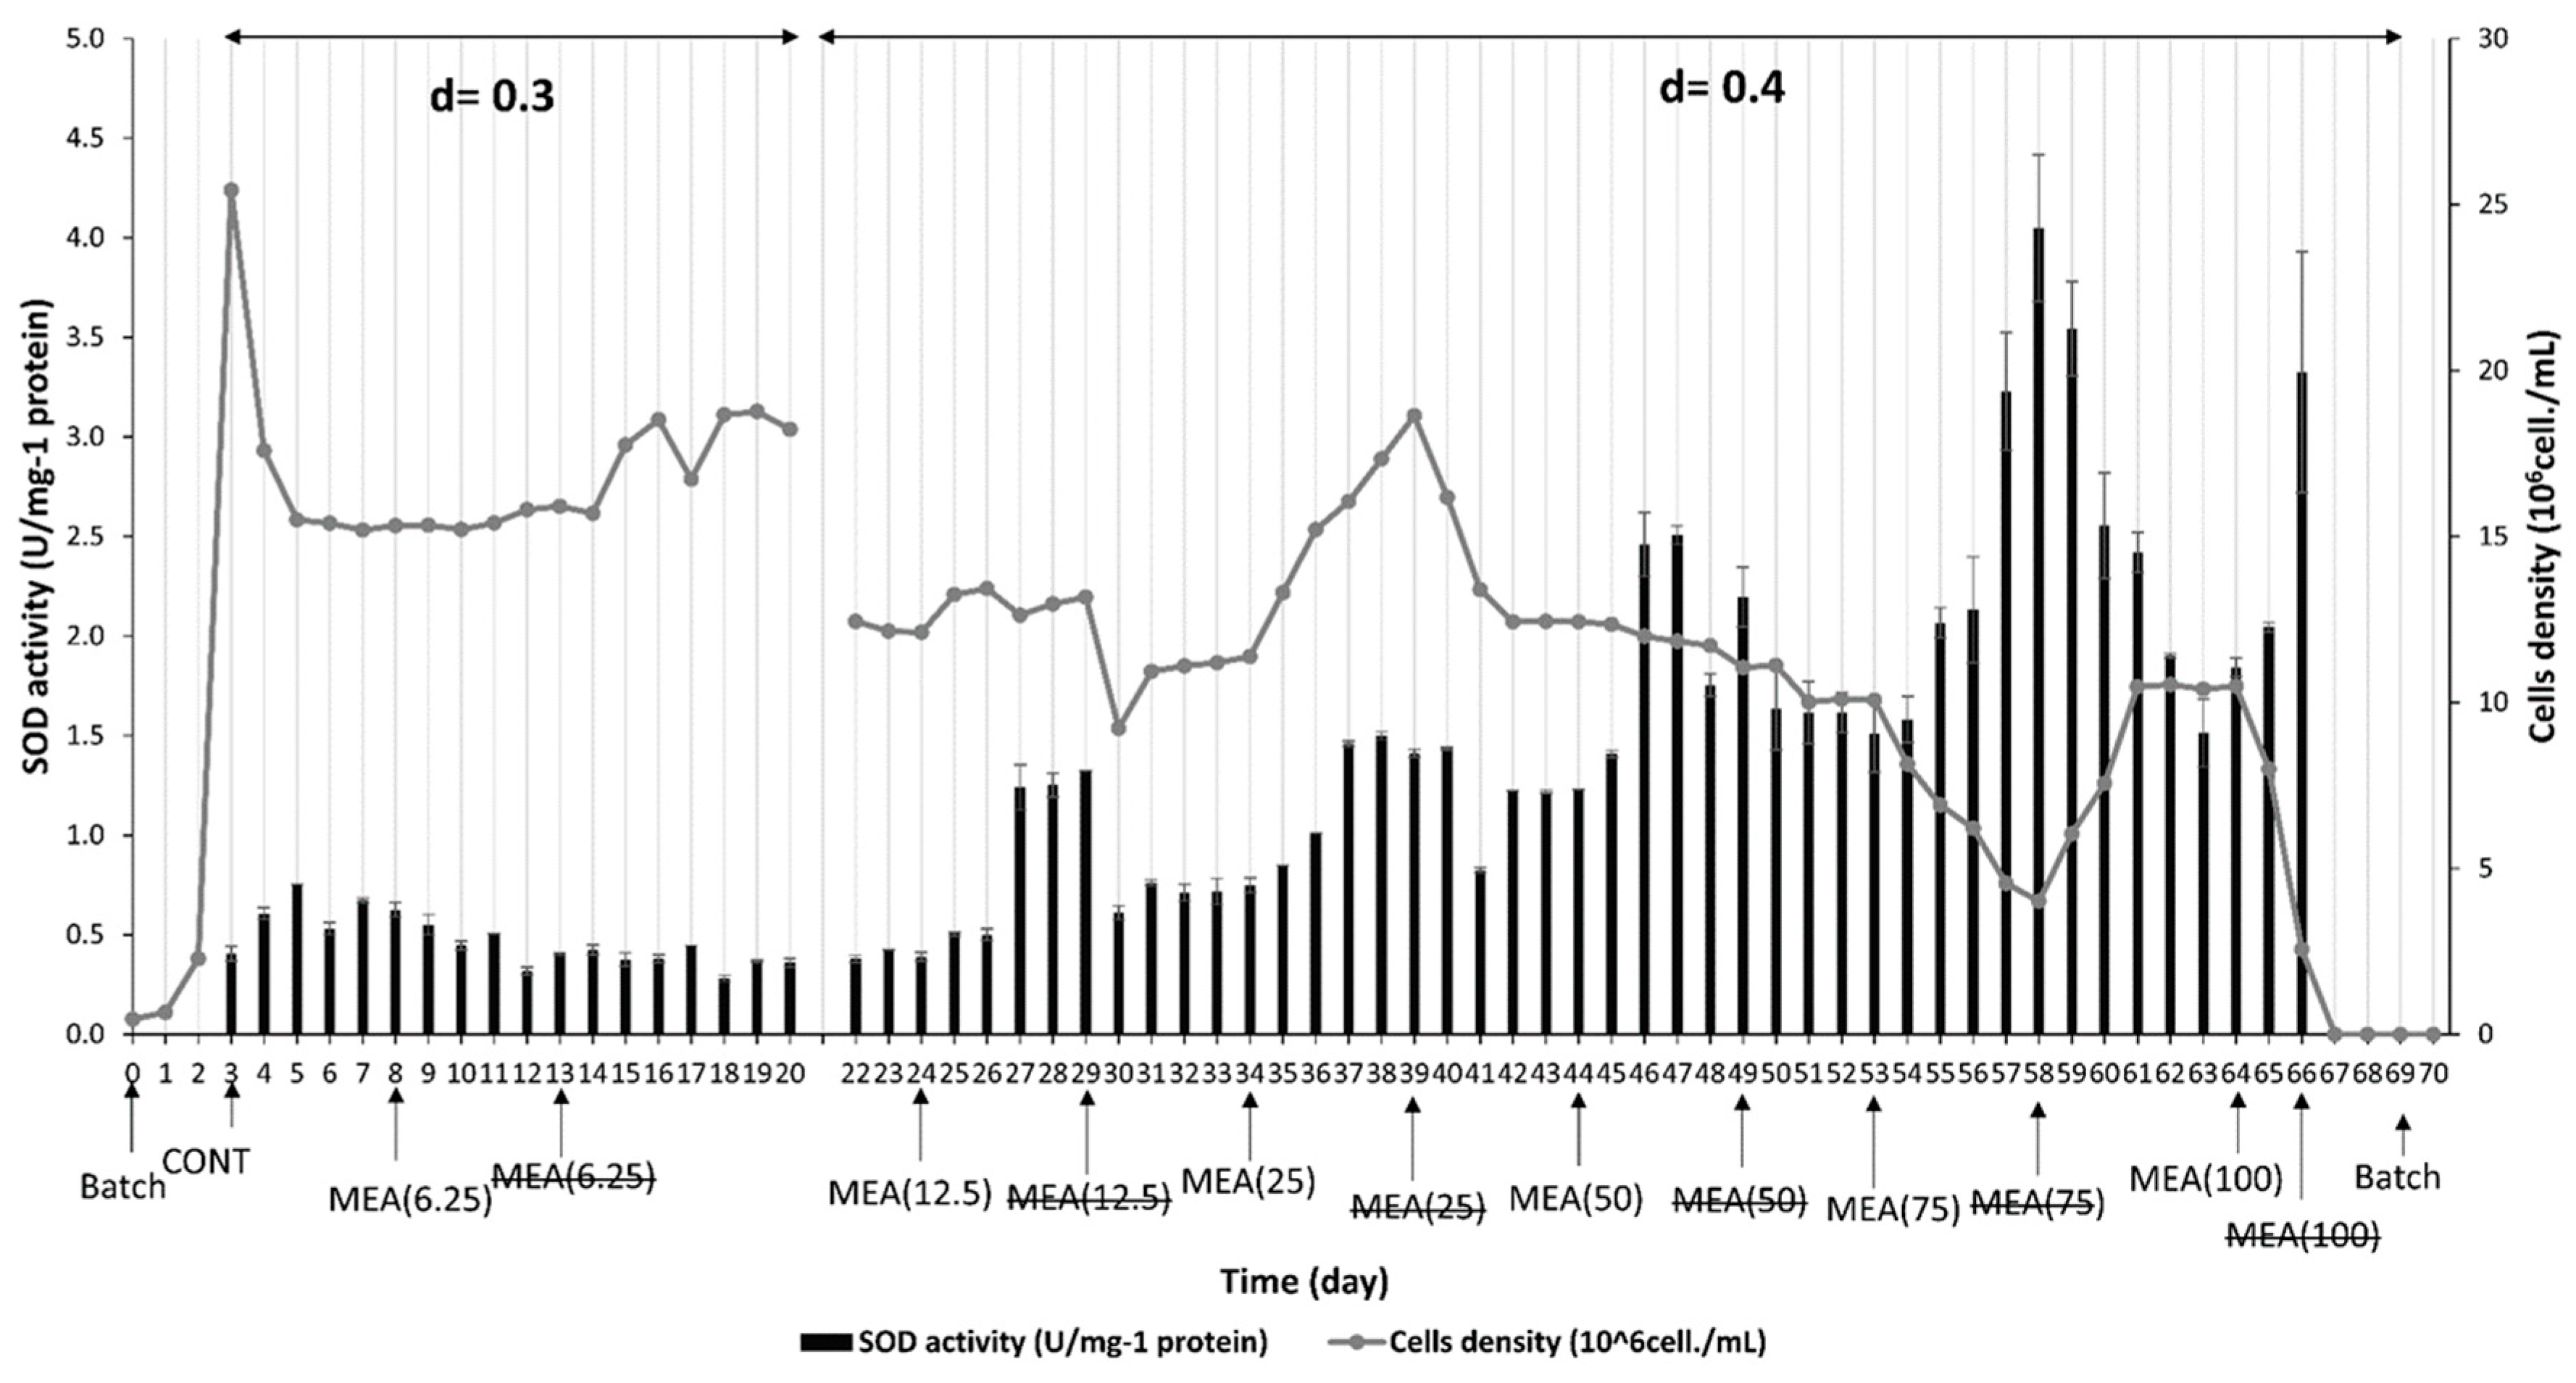
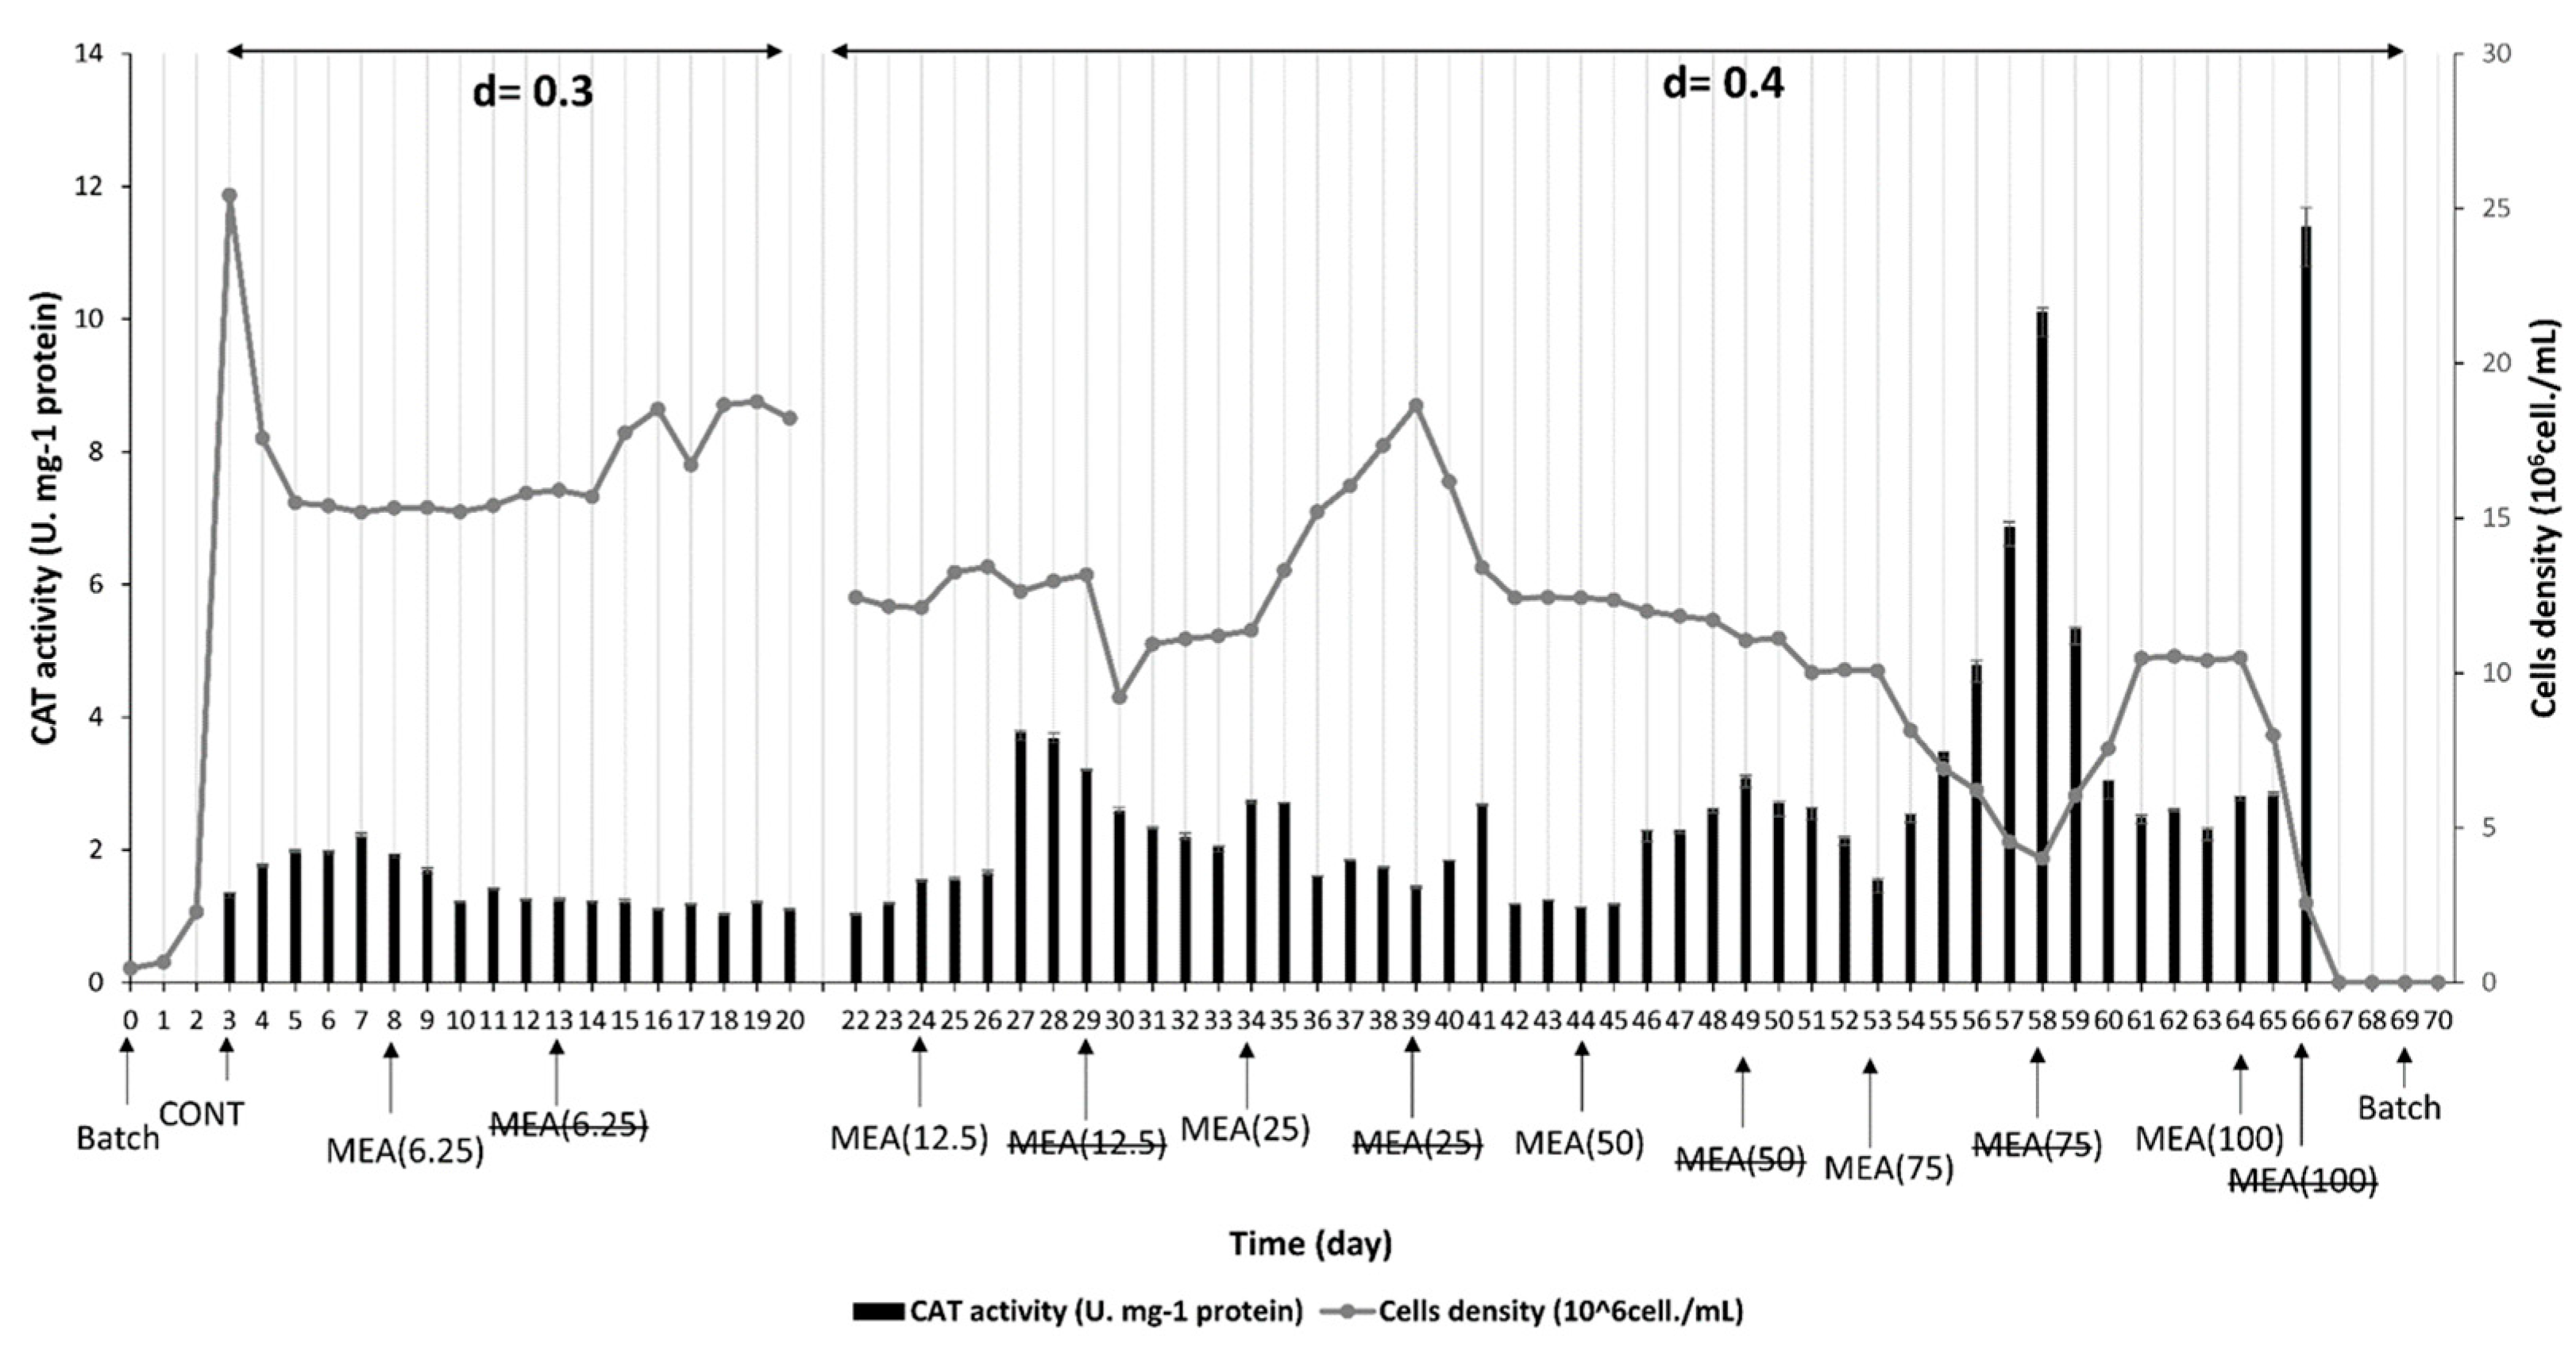
3.2. Effect of M. spicatum Extract on M. aeruginosa Physiological Responses

To investigate the effects of MEA extracts on M. aeruginosa, protein content and malondialdehyde (MDA) levels were measured as shown in Figure 4 and Figure 5. Low extract concentrations increased protein content, while higher concentrations (50, 75, and 100 mg/L) decreased it. Proteins, as sensitive targets of allelochemicals [36], are essential for cells. Inhibition of their synthesis disrupts cyanobacterial metabolism [36]. Furthermore, allelochemicals from several macrophytes have shown similar dose-dependent effects [37,38,39]. For example, pyrogallic acid extracted from M. spicatum inhibited protein synthesis and increased MDA levels, indicators of cellular health [40,41,42]. Lipid peroxidation, which correlates with membrane damage, often occurs when the concentration of allelochemicals exceeds the cellular defense capacity, compromising cellular integrity [43,44,45]. Cell membrane integrity, a critical indicator, is compromised by high concentrations of MEA extract and correlates with increased MDA levels, while MDA levels remained stable at lower concentrations [26,36,41,46,47].
Figure 6 and Figure 7 present the outcomes of assessing the activities of superoxide dismutase (SOD) and catalase (CAT) to ascertain the activation status of the cellular oxidative defense mechanism. The SOD and CAT activities in M. aeruginosa cells exhibited a significant concentration-dependent increase upon exposure to MEA extract. Nonetheless, the activities of SOD and CAT remained relatively steady during the steady-state phase. The generation of reactive oxygen species (ROS) in M. aeruginosa cells prompted various antioxidant reactions, including heightened activity of the antioxidant enzymes SOD and CAT [28,48,49,50]. Generally, SOD acts as the primary defense line against cellular oxidative stress induced by ROS, converting superoxide O2− into oxygen and H2O2, which is subsequently neutralized by CAT [32,48,51]. Meanwhile, CAT plays a crucial role in the natural conversion of H2O2 to oxygen and water [48,52]. The observed elevation in SOD and CAT activity in our investigation implies their involvement in counteracting oxidative stress within cells. This finding is noteworthy for potential strategies to manage toxic cyanobacterial blooms, suggesting that applying aqueous extracts at concentrations designed to inhibit M. aeruginosa growth could be effective.

3.3. Microcystin Analysis

The results of intra- and extracellular microcystin (MC) analysis are presented in Table 2. These results showed that the 6.25, 12.5, and 25 mg/L treatments of MEA extract significantly reduced the production of extracellular MCs with 8.51%, 36.31%, and 46.75%, respectively. On the other hand, the concentrations of intracellular MCs increased following the growth rate of M. aeruginosa. The 50 mg/L, 75 mg/L, and 100 mg/L treatments significantly reduced both forms of MCs (intracellular and extracellular) with a dose-dependent response. The 100 mg/L concentration of the extract totally reduced both MCs in only two days of treatment to a value below the LOD.
Although there are many known plants producing allelochemicals that can control cyanobacterial biomass, very few studies have addressed their effect on cyanotoxin production, which is the major health problem associated with harmful cyanobacterial blooms. In an experiment to test two natural allelopathic compounds from some bacteria on various parameters of M. aeruginosa FACHB 905, [9,30] observed a significant increase in MC-LR/L in the treated groups until day 5, followed by a significant decrease at day 8, consistent with a decrease in Microcystis sp. density. Likewise, [53] observed a more significant increase in the extracellular MC content in the M. aeruginosa culture under the exposure of pyrogallol allelochemical. However, [54] observed a concentration-dependent decrease in total MC levels in M. aeruginosa with increasing concentrations of the extract, fractions, and isolated flavonoids of Tridax procumbens, which correlated to the decrease in growth. In our previous study [9], microcystin analysis revealed that the aqueous extract of R. aquatilis also negatively affected the concentration of microcystins with a percentage of 84.5%, which is consistent with the decrease in cell density. On the other hand, MAEs also exerted allelopathic effects on the two CYN-producing cyanobacteria (Raphidiopsis raciborskii and Chrysosporum ovalisporum), causing a decrease in cell number. However, the effects on the toxin were very different, since the concentration of CYN was only 2.3-fold lower. However, the effects on Planktothrix rubescens were different. MAE only slightly reduced cell growth, while the final concentration of MCs increased compared to the negative control. These contrasting results warrant further investigation of macrophytes’ allelochemical effects on cyanotoxin production.

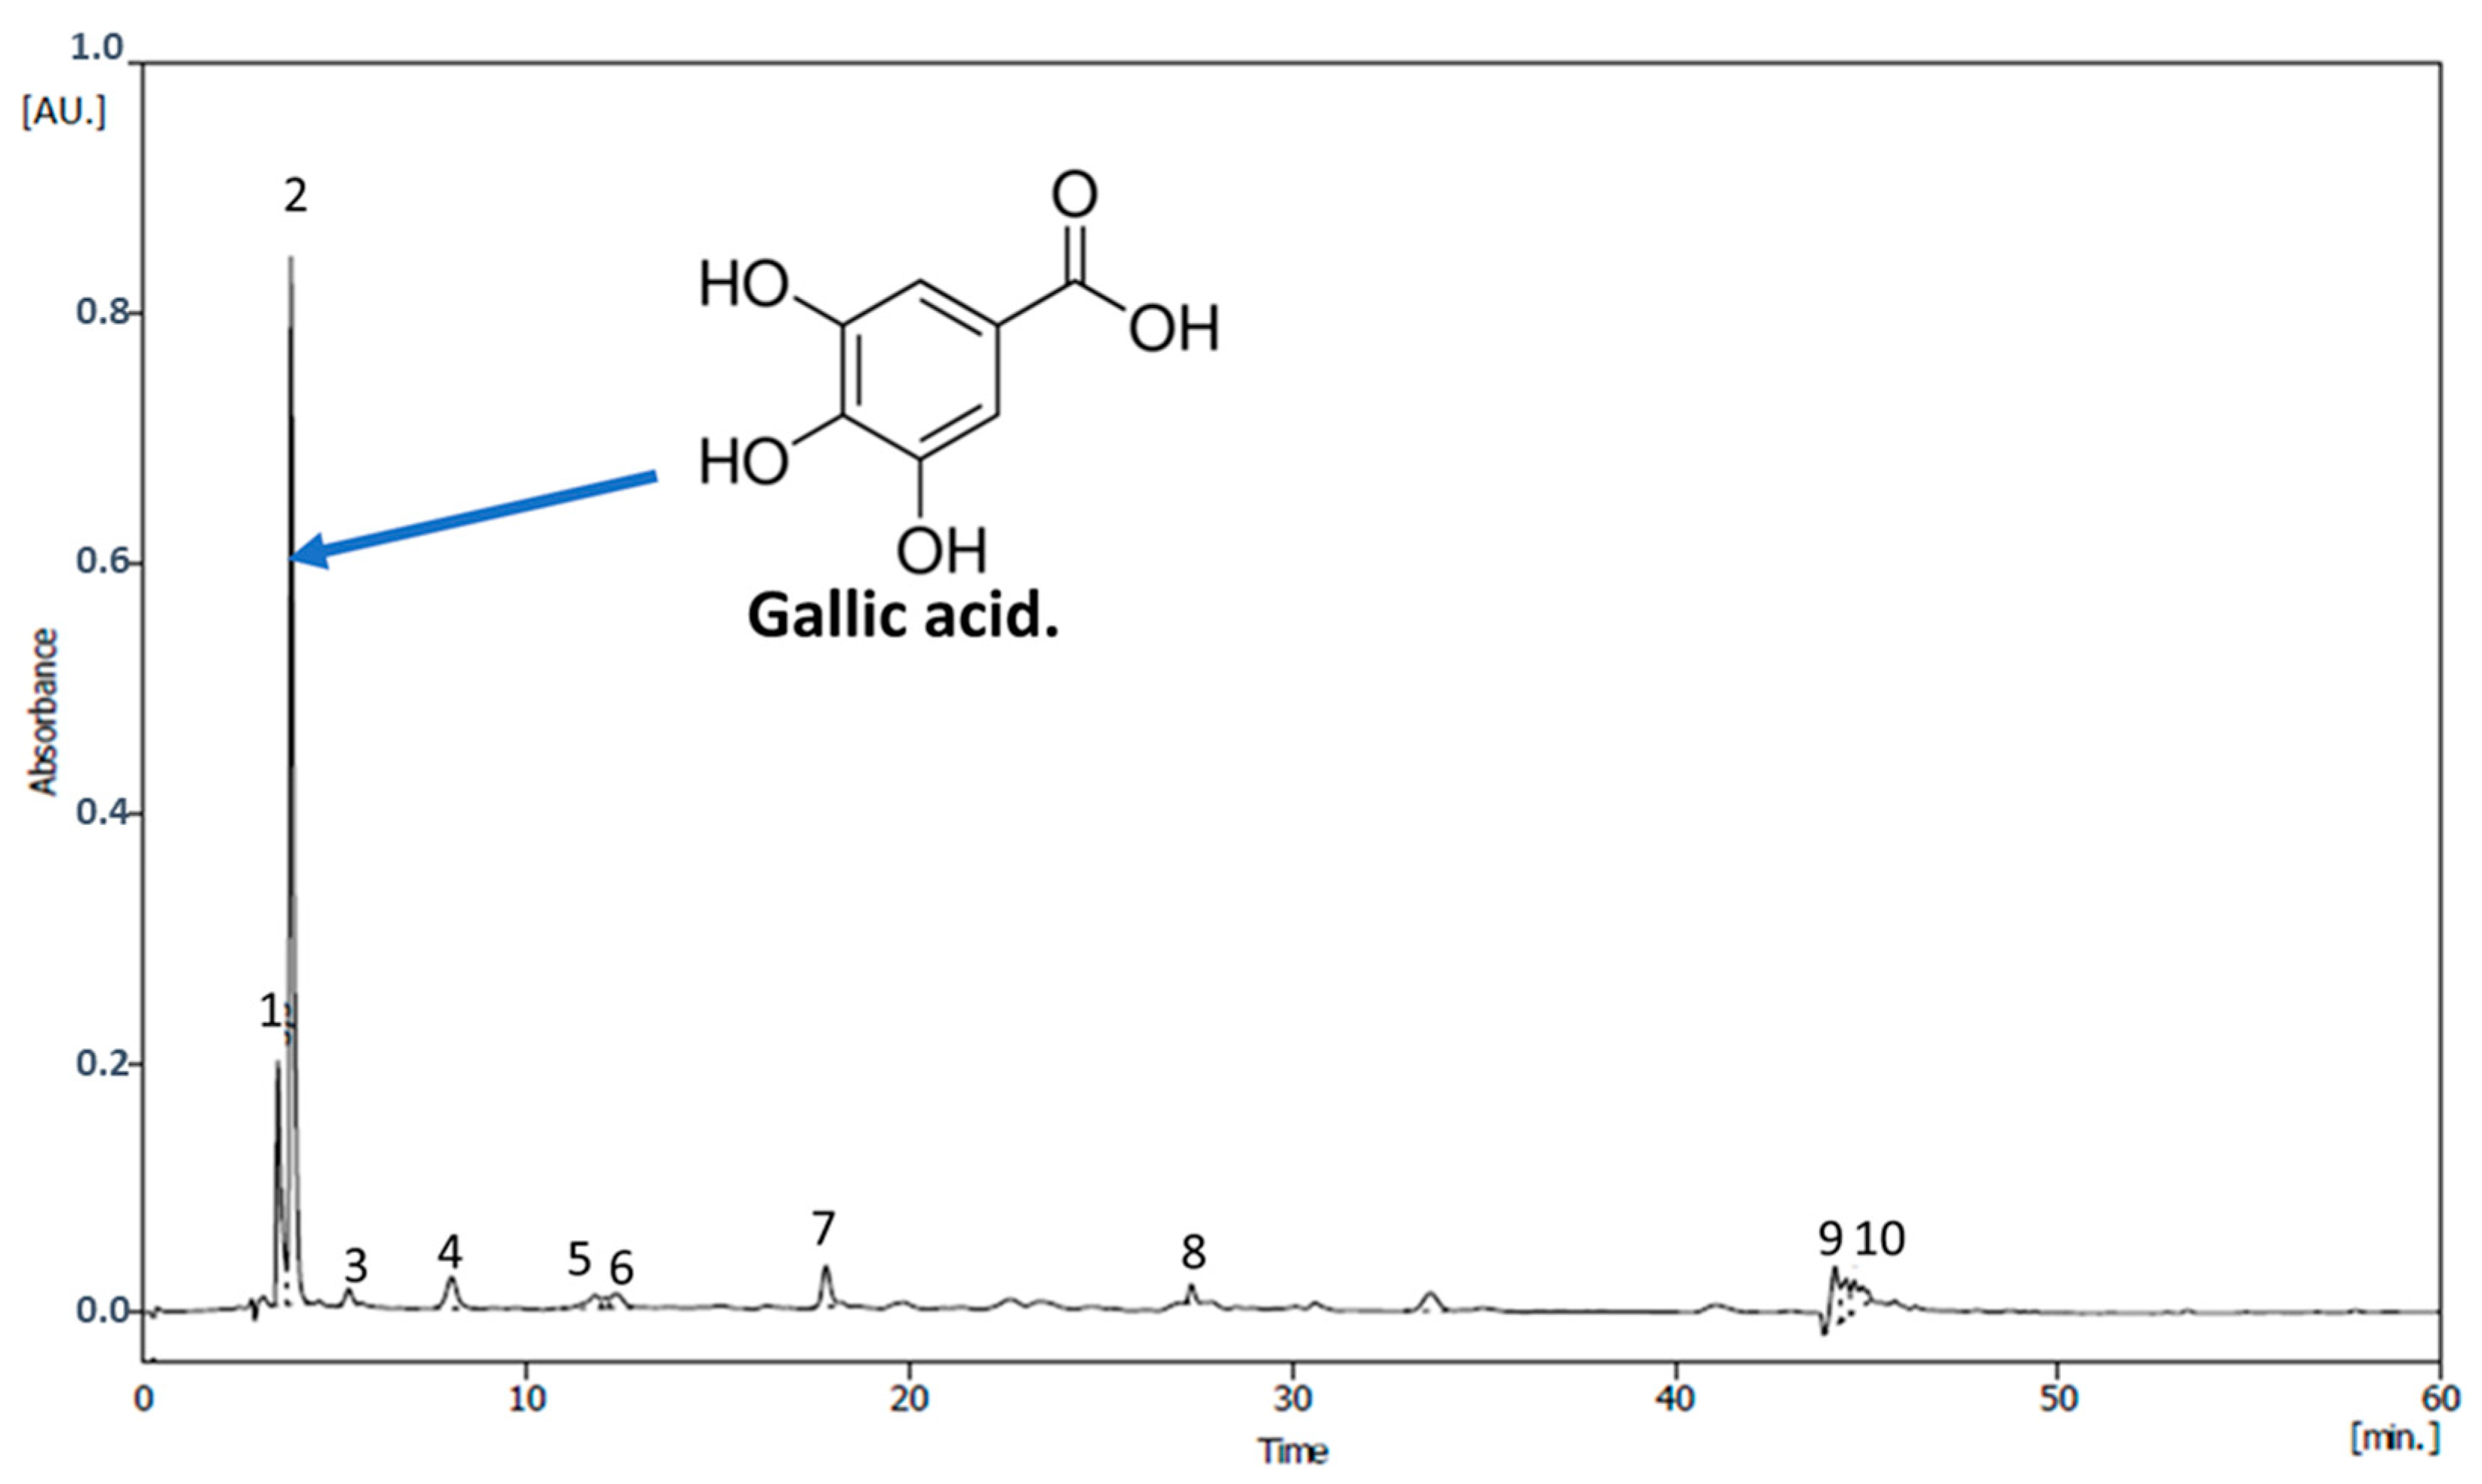
3.4. Phenolic Compounds of M. spicatum Extract

The qualitative and quantitative analysis of phenolic compounds in the ethyl-acetate extract of M. spicatum was conducted using HPLC. Table 3 and Figure 8 present the concentration, expressed in µg/g of dry weight, and retention time of the main individual components. The analysis revealed that the MEA extract contained a total of 2.02 mg/g DW of phenolics, comprising ten identified compounds: ascorbic acid (3.50 min), gallic acid (3.90 min), fumaric acid (5.40 min), tyrosol (8.00 min), catechin (11.80 min), chlorogenic acid (12.10 min), tannic acid (12.30 min), caffeic acid (17.80 min), p-coumaric acid (44.50 min), and quercetin (44.70 min). Despite this, some phenolic components present could not be identified. Gallic acid was found to be the predominant compound, with a content of 362.56 µg/g DW.
The allelopathic compounds produced by macrophytes exhibit inhibitory effects on various microalgae and play a significant role in the interaction between aquatic plants and phytoplankton species in aquatic ecosystems. Our findings suggest that certain identified allelopathic compounds may significantly affect M. aeruginosa. Phenolic compounds in M. spicatum extract can induce oxidative stress in M. aeruginosa by promoting the production of reactive oxygen species (ROS), which damage cellular lipids, proteins, and DNA, thus disrupting essential photosynthetic and membrane processes [6,7,55,56]: for example, gallic acid, pyrogallic acid, and didactic chemicals from M. spicatum promoting peroxidation of membrane lipids and increasing cell permeability and vulnerability [57,58,59,60], as well as hexadecenoic acid, stearic acid, linolenic acid, and α-asarone isolated from Potamogeton cordata, Alternanthera philoxeroides, Acorus calamus, and Typha latifolia [61].
Our research results show that the extract of M. spicatum has a significant inhibitory effect on the growth and physiological response of M. aeruginosa in a nitrogen-limited chemostat. This was inhibited during the continuous action of MEA extracts. In addition, the presence of phenolic compounds in ethyl acetate extracts of large plants is sufficient to limit cell growth and cause cell damage, as evidenced by the decrease in protein content and the increase in membrane lipid peroxidation. Enzymatic antioxidants (SOD and CAT) increase in response to excess ROS, showing a similar growth trend to antioxidants. The characterization of organic extracts revealed some important compounds, which are believed to inhibit the growth and oxidative damage of M. aeruginosa. These results indicate that macrophytes are potential producers of allelochemicals and can be suggested as natural alternatives to control cyanoHAB.
Our findings have ecological consequences, especially for managing harmful algal blooms (HABs) like M. aeruginosa. Phenolic chemicals from plants may inhibit cyanobacteria development. This strategy is environmentally benign and fits with green management practices. This method improves water quality and aquatic ecosystem biodiversity by lowering chemical algicide use. To make the proposed cure practicable and environmentally beneficial, further studies should optimize the usage of these compounds in varied ecosystems and analyze their long-term impacts on non-target creatures.

4. Conclusions

This study is the first attempt to investigate the allelochemical effect of macrophytes on the growth, physiological response, and cyanotoxins of the toxic unicellular M. aeruginosa strain using an N-limited continuous chemostat culture. This culture method allowed us to test the gradual dosage of the plant extract on the cyanobacterium maintained in prolonged growth (~70 days) to determine the minimum inhibitory concentration and sublethal and lethal dose. Exposure to a low dose of the macrophyte extract, close to the minimum inhibitory concentration (MIC = 6.25 mg) in batch culture, was not effective in the continuous system but induced a hormetic effect. The inhibition of M. aeruginosa by MEA extract was observed only from the dosage of 50 mg/L. Treatment with the highest concentrations (50 mg/L, 75 mg/L, and 100 mg/L) significantly reduced both forms of microcystins (intracellular and extracellular) with a dose-dependent response. Since the continuous culture system is often considered an open medium, it can simulate the continuous supply of allelochemicals, which is the main mode of allelopathic inhibition of macrophytes in the field. It could also provide a fairly accurate idea of the dosage of macrophyte extract to be applied for bloom control in the natural environment.

Author Contributions

Z.T.: conceptualization, methodology, software, investigation, validation, formal analysis, writing—original draft. M.L.: funding acquisition, visualization, resources, writing—review and editing, supervision, data curation. M.D.: writing—review and editing, supervision, data curation. K.M.: supervision, data curation, writing—review and editing. K.L.: data curation, formal analysis. W.E.B.: data curation, formal analysis. L.T.: data curation, formal analysis. E.M.R.: data curation, formal analysis. All authors have read and agreed to the published version of the manuscript.

Funding

This research received no external funding.

Data Availability Statement

All relevant data are included in the paper.

Acknowledgments

This work was supported by the Laboratory of Water, Biodiversity, and Climate Change Laboratory and the Phycology, Biotechnology, and Environmental Toxicology Research Unit. The authors thank the “Center of Analysis and Characterization” of Cadi Ayyad University for the HPLC analysis. The useful comments of anonymous reviewers are also acknowledged.

Conflicts of Interest

The authors declare that they have no conflicts of interest.

References

  1. Carmichael, W.W.; Boyer, G.L. Health Impacts from Cyanobacteria Harmful Algae Blooms: Implications for the North American Great Lakes. Harmful Algae 2016, 54, 194–212. [Google Scholar] [CrossRef]
  2. Harke, M.J.; Steffen, M.M.; Gobler, C.J.; Otten, T.G.; Wilhelm, S.W.; Wood, S.A.; Paerl, H.W. A Review of the Global Ecology, Genomics, and Biogeography of the Toxic Cyanobacterium, Microcystis Spp. Harmful Algae 2016, 54, 4–20. [Google Scholar] [CrossRef]
  3. Ndlela, L.L.; Oberholster, P.J.; Van Wyk, J.H.; Cheng, P.-H.H. An Overview of Cyanobacterial Bloom Occurrences and Research in Africa over the Last Decade. Harmful Algae 2016, 60, 11–26. [Google Scholar] [CrossRef]
  4. Tazart, Z.; Douma, M.; Tebaa, L.; Loudiki, M. Use of Macrophytes Allelopathy in the Biocontrol of Harmful Microcystis Aeruginosa Blooms. Water Sci. Technol. Water Supply 2019, 19, 245–253. [Google Scholar] [CrossRef]
  5. Gallardo-Rodríguez, J.J.; Astuya-Villalón, A.; Llanos-Rivera, A.; Avello-Fontalba, V.; Ulloa-Jofré, V. A Critical Review on Control Methods for Harmful Algal Blooms. Rev. Aquac. 2019, 11, 661–684. [Google Scholar] [CrossRef]
  6. Nascimento, P.; Vasconcelos, V.; Campos, A.; Barreiro, A. Screening of Plant Extracts for a Microcosm in Vivo Test of Inhibition of the Toxic Bloom-Forming Cyanobacteria Chrysosporum Ovalisporum. Algal Res. 2024, 80, 103552. [Google Scholar] [CrossRef]
  7. Ma, X.; Wang, X.; Zhou, S.; Ma, J.; Wang, J.; Chen, J.; Zeng, Y.; Chen, Q.; Qin, B.; Li, M. Plant Allelochemicals Inhibit the Growth and Colony Formation of Microcystis. J. Oceanol. Limnol. 2024, 1–14. [Google Scholar] [CrossRef]
  8. Tazart, Z.; Douma, M.; Caldeira, A.T.; Tebaa, L.; Mouhri, K.; Loudiki, M. Highlighting of the Antialgal Activity of Organic Extracts of Moroccan Macrophytes: Potential Use in Cyanobacteria Blooms Control. Environ. Sci. Pollut. Res. 2020, 27, 19630–19637. [Google Scholar] [CrossRef]
  9. Tazart, Z.; Manganelli, M.; Scardala, S.; Buratti, F.M.; Di Gregorio, F.N.; Douma, M.; Mouhri, K.; Testai, E.; Loudiki, M. Remediation Strategies to Control Toxic Cyanobacterial Blooms: Effects of Macrophyte Aqueous Extracts on Microcystis Aeruginosa (Growth, Toxin Production and Oxidative Stress Response) and on Bacterial Ectoenzymatic Activities. Microorganisms 2021, 9, 1782. [Google Scholar] [CrossRef]
  10. Mohamed, Z.A. Macrophytes-Cyanobacteria Allelopathic Interactions and Their Implications for Water Resources Management—A Review. Limnologica 2017, 63, 122–132. [Google Scholar] [CrossRef]
  11. Li, X.; Zhao, W.; Chen, J.; Wang, F. Dosage Impact of Submerged Plants Extracts on Microcystis Aeruginosa Growth: From Hormesis to Inhibition. Ecotoxicol. Environ. Saf. 2023, 268, 115703. [Google Scholar] [CrossRef]
  12. Gao, L.; Pan, X.; Zhang, D.; Mu, S.; Lee, D.J.; Halik, U. Extracellular Polymeric Substances Buffer against the Biocidal Effect of H2O2on the Bloom-Forming Cyanobacterium Microcystis Aeruginosa. Water Res. 2015, 69, 51–58. [Google Scholar] [CrossRef] [PubMed]
  13. Hu, H.; Hong, Y. Algal-Bloom Control by Allelopathy of Aquatic Macrophytes—A Review Algal-Bloom Control by Allelopathy of Aquatic Macrophytes—A Review. Front. Environ. Sci. Eng. China 2008, 2, 421–438. [Google Scholar] [CrossRef]
  14. Bastien, C.; Cǒté, R. Variations Temporelles de l’ultrastructure de Scenedesmus Quadricauda Exposée Au Cuivre Lors d’une Expérience à Long Terme. Int. Rev. Der Gesamten Hydrobiol. Und Hydrogr. 1989, 74, 207–219. [Google Scholar] [CrossRef]
  15. Walsh, G.E. Principles of Toxicity Testing with Marine Unicellular Algae. Environ. Toxicol. Chem. Int. J. 1988, 7, 979–987. [Google Scholar] [CrossRef]
  16. Marsot, P.; Mouhri, K. Morphogenèse et Croissance de La Diatomée Marine Phaeodactylum Tricornutum En Cultures Continues Dialysante et Non Dialysante. Vie Et Milieu/Life Environ. 1995, 199–205. [Google Scholar] [CrossRef]
  17. Aiken, S.G.; Newroth, P.R.; Wile, I. The Biology of Canadian Weeds.: 34. Myriophyllum spicatum L. Can. J. Plant Sci. 1979, 59, 201–215. [Google Scholar] [CrossRef]
  18. Xian, Q.; Chen, H.; Zou, H.; Yin, D. Allelopathic Activity of Volatile Substance from Submerged Macrophytes on Microcystin Aeruginosa. Acta Ecol. Sin. 2006, 26, 3549–3554. [Google Scholar] [CrossRef]
  19. Rhee, G.Y. Continous Culture in Phytoplankton Ecology. Adv. Aquat. Microbiol. 1980, 151–203. [Google Scholar]
  20. Cho, D.-H.; Ramanan, R.; Heo, J.; Shin, D.-S.; Oh, H.-M.; Kim, H.-S. Influence of Limiting Factors on Biomass and Lipid Productivities of Axenic Chlorella Vulgaris in Photobioreactor under Chemostat Cultivation. Bioresour. Technol. 2016, 211, 367–373. [Google Scholar] [CrossRef]
  21. Cho, K.; Cho, D.-H.; Heo, J.; Kim, U.; Lee, Y.J.; Choi, D.-Y.; Kim, H.-S. Nitrogen Modulation under Chemostat Cultivation Mode Induces Biomass and Lipid Production by Chlorella Vulgaris and Reduces Antenna Pigment Accumulation. Bioresour. Technol. 2019, 281, 118–125. [Google Scholar] [CrossRef]
  22. Bradford, M.M. A Rapid and Sensitive Method for the Quantitation of Microgram Quantities of Protein Utilizing the Principle of Protein-Dye Binding. Anal Biochem. 1976, 72, 248–254. [Google Scholar] [CrossRef]
  23. Lu, L.; Wu, Y.; Ding, H.; Zhang, W. The Combined and Second Exposure Effect of Copper (II) and Chlortetracycline on Fresh Water Algae, Chlorella Pyrenoidosa and Microcystis Aeruginosa. Environ. Toxicol. Pharmacol. 2015, 40, 140–148. [Google Scholar] [CrossRef] [PubMed]
  24. Beauchamp, C.; Fridovich, I. Superoxide Dismutase: Improved Assays and an Assay Applicable to Acrylamide Gels. Anal Biochem. 1971, 44, 276–287. [Google Scholar] [CrossRef]
  25. Rao, M.V.; Paliyath, G.; Ormrod, D.P. Ultraviolet-B- and Ozone-Induced Biochemical Changes in Antioxidant Enzymes of Arabidopsis Thaliana. Plant Physiol. 1996, 110, 125–136. [Google Scholar] [CrossRef]
  26. Tazart, Z.; Caldeira, A.T.; Douma, M.; Salvador, C.; Loudiki, M. Inhibitory Effect and Mechanism of Three Macrophytes Extract on Microcystis Aeruginosa Growth and Physiology. Water Environ. J. 2021, 35, 580–592. [Google Scholar] [CrossRef]
  27. Wang, F.; Zhao, W.; Chen, J.; Zhou, Y. Allelopathic Inhibitory Effect on the Growth of Microcystis Aeruginosa by Improved Ultrasonic-Cellulase Extract of Vallisneria. Chemosphere 2022, 298, 134245. [Google Scholar] [CrossRef] [PubMed]
  28. Yuan, R.; Li, Y.; Li, J.; Ji, S.; Wang, S.; Kong, F. The Allelopathic Effects of Aqueous Extracts from Spartina Alterniflora on Controlling the Microcystis Aeruginosa Blooms. Sci. Total Environ. 2020, 712, 136332. [Google Scholar] [CrossRef] [PubMed]
  29. Hachelaf, A.; Touil, A.; Zellagui, A.; Rhouati, S. Antioxidant and Antibacterial Activities of Essential Oil Extracted from Ranunculus arvensis L. Der Pharma Chem. 2015, 7, 170–173. [Google Scholar]
  30. Zhang, S.H.; Zhang, S.Y.; Li, G. Acorus Calamus Root Extracts to Control Harmful Cyanobacteria Blooms. Ecol. Eng. 2016, 94, 95–101. [Google Scholar] [CrossRef]
  31. Li, J.; Liu, Y.; Zhang, P.; Zeng, G.; Cai, X.; Liu, S.; Yin, Y.; Hu, X.; Hu, X.; Tan, X. Growth Inhibition and Oxidative Damage of Microcystis Aeruginosa Induced by Crude Extract of Sagittaria Trifolia Tubers. J. Environ. Sci. 2016, 43, 40–47. [Google Scholar] [CrossRef] [PubMed]
  32. Hua, Q.; Liu, Y.G.; Yan, Z.L.; Zeng, G.M.; Liu, S.B.; Wang, W.J.; Tan, X.F.; Deng, J.Q.; Tang, X.; Wang, Q.P. Allelopathic Effect of the Rice Straw Aqueous Extract on the Growth of Microcystis Aeruginosa. Ecotoxicol. Environ. Saf. 2018, 148, 953–959. [Google Scholar] [CrossRef]
  33. Zhang, S.; Benoit, G. Comparative Physiological Tolerance of Unicellular and Colonial Microcystis Aeruginosa to Extract from Acorus Calamus Rhizome. Aquat. Toxicol. 2019, 215, 105271. [Google Scholar] [CrossRef] [PubMed]
  34. Zhu, Z.; Liu, Y.; Zhang, P.; Zeng, G.; Hu, X.; Li, H.; Guo, Y.; Guo, X. Co-Culture with Cyperus Alternifolius Induces Physiological and Biochemical Inhibitory Effects in Microcystis Aeruginosa. Biochem. Syst. Ecol. 2014, 56, 118–124. [Google Scholar] [CrossRef]
  35. Wang, H.Q.; Liang, F.; Qiao, N.; Dong, J.X.; Zhang, L.Y.; Guo, Y.F. Chemical Composition of Volatile Oil from Two Emergent Plants and Their Algae Inhibition Activity. Pol. J. Environ. Stud. 2014, 23, 2371–2374. [Google Scholar]
  36. Zhu, X.; Dao, G.; Tao, Y.; Zhan, X.; Hu, H. A Review on Control of Harmful Algal Blooms by Plant-Derived Allelochemicals. J. Hazard. Mater. 2021, 401, 123403. [Google Scholar] [CrossRef]
  37. Chen, Y.; Xie, P.; Wang, Z.; Shang, R.; Wang, S. UV/Persulfate Preoxidation to Improve Coagulation Efficiency of Microcystis Aeruginosa. J. Hazard. Mater. 2017, 322, 508–515. [Google Scholar] [CrossRef] [PubMed]
  38. Jiang, M.; Zhou, Y.; Wang, N.; Xu, L.; Zheng, Z.; Zhang, J. Allelopathic Effects of Harmful Algal Extracts and Exudates on Biofilms on Leaves of Vallisneria Natans. Sci. Total Environ. 2019, 655, 823–830. [Google Scholar] [CrossRef] [PubMed]
  39. Yi, Y.-L.; Yu, X.-B.; Zhang, C.; Wang, G.-X. Growth Inhibition and Microcystin Degradation Effects of Acinetobacter Guillouiae A2 on Microcystis Aeruginosa. Res. Microbiol. 2015, 166, 93–101. [Google Scholar] [CrossRef] [PubMed]
  40. Gao, Y.N.; Ge, F.J.; Zhang, L.P.; He, Y.; Lu, Z.Y.; Zhang, Y.Y.; Liu, B.Y.; Zhou, Q.H.; Wu, Z.B. Enhanced Toxicity to the Cyanobacterium Microcystis Aeruginosa by Low-Dosage Repeated Exposure to the Allelochemical N-Phenyl-1-Naphthylamine. Chemosphere 2017, 174, 732–738. [Google Scholar] [CrossRef] [PubMed]
  41. Lu, Z.; Zhang, Y.; Gao, Y.; Liu, B.; Sun, X.; He, F.; Zhou, Q.; Wu, Z. Effects of Pyrogallic Acid on Microcystis Aeruginosa: Oxidative Stress Related Toxicity. Ecotoxicol. Environ. Saf. 2016, 132, 413–419. [Google Scholar] [CrossRef] [PubMed]
  42. Xie, J.; Zhao, L.; Liu, K.; Liu, W. Enantiomeric Environmental Behavior, Oxidative Stress and Toxin Release of Harmful Cyanobacteria Microcystis Aeruginosa in Response to Napropamide and Acetochlor. Environ. Pollut. 2019, 246, 728–733. [Google Scholar] [CrossRef]
  43. Singer, S.J.; Nicolson, G.L. The Fluid Mosaic Model of the Structure of Cell Membranes. Science 1972, 175, 720–731. [Google Scholar] [CrossRef] [PubMed]
  44. Qian, H.; Xu, J.; Lu, T.; Zhang, Q.; Qu, Q.; Yang, Z.; Pan, X. Responses of Unicellular Alga Chlorella Pyrenoidosa to Allelochemical Linoleic Acid. Sci. Total Environ. 2018, 625, 1415–1422. [Google Scholar] [CrossRef]
  45. Kong, Y.; Zou, P.; Yang, Q.; Xu, X.; Miao, L.; Zhu, L. Physiological Responses of Microcystis Aeruginosa under the Stress of Antialgal Actinomycetes. J. Hazard. Mater. 2013, 262, 274–280. [Google Scholar] [CrossRef] [PubMed]
  46. Wang, X.; Wang, P.; Wang, C.; Hu, B.; Ren, L.; Yang, Y. Microcystin Biosynthesis in Microcystis Aeruginosa: Indirect Regulation by Iron Variation. Ecotoxicol. Environ. Saf. 2018, 148, 942–952. [Google Scholar] [CrossRef]
  47. Zuo, S.; Zhou, S.; Ye, L.; Ma, S. Synergistic and Antagonistic Interactions among Five Allelochemicals with Antialgal Effects on Bloom-Forming Microcystis Aeruginosa. Ecol. Eng. 2016, 97, 486–492. [Google Scholar] [CrossRef]
  48. Gao, Y.; Lu, J.; Orr, P.T.; Chuang, A.; Franklin, H.M.; Michele, A. Enhanced Resistance of Co-Existing Toxigenic and Non-Toxigenic Microcystis Aeruginosa to Pyrogallol Compared with Monostrains. Toxicon 2020, 176, 47–54. [Google Scholar] [CrossRef] [PubMed]
  49. Kang, P.; Hong, J.; Kim, E.; Kim, B. Effects of Extracts of Reed and Cattail on the Growth of a Cyanobacterium, Microcystis Aeruginosa. J. Freshw. Ecol. 2020, 35, 123–134. [Google Scholar] [CrossRef]
  50. Sun, Y.Y.; Zhou, W.J.; Wang, H.; Guo, G.L.; Su, Z.X.; Pu, Y.F. Antialgal Compounds with Antialgal Activity against the Common Red Tide Microalgae from a Green Algae Ulva Pertusa. Ecotoxicol. Environ. Saf. 2018, 157, 61–66. [Google Scholar] [CrossRef]
  51. Wang, Z.; Song, G.; Li, Y.; Yu, G.; Hou, X.; Gan, Z.; Li, R. Science of the Total Environment The Diversity, Origin, and Evolutionary Analysis of Geosmin Synthase Gene in Cyanobacteria. Sci. Total Environ. 2019, 689, 789–796. [Google Scholar] [CrossRef]
  52. Zhang, F.; Ye, Q.; Chen, Q.; Yang, K.; Zhang, D.; Chen, Z.; Lu, S.; Shao, X.; Fan, Y.; Yao, L.; et al. Crossm Algicidal Activity of Novel Marine Bacterium Paracoccus sp. Appl. Environ. Microbiol. 2018, 84, e01015-18. [Google Scholar]
  53. Wang, J.; Liu, Q.; Feng, J.; Lv, J.P.; Xie, S.L. Effect of High-Doses Pyrogallol on Oxidative Damage, Transcriptional Responses and Microcystins Synthesis in Microcystis Aeruginosa TY001 (Cyanobacteria). Ecotoxicol. Environ. Saf. 2016, 134, 273–279. [Google Scholar] [CrossRef]
  54. Mecina, G.F.; Chia, M.A.; Cordeiro-Araújo, M.K.; Bittencourt-Oliveira, M.d.C.; Rosa, M.V.; Torres, A.; Gonzales Molinillo, J.M.; Macías, F.A.; da Silva, R.M.G. Effect of Flavonoids Isolated from Tridax Procumbens on the Growth and Toxin Production of Microcystis Aeruginos. Aquat. Toxicol. 2019, 211, 81–91. [Google Scholar] [CrossRef]
  55. Sim, D.Z.H.; Mowe, M.A.D.; Mitrovic, S.M.; Tulsian, N.K.; Anand, G.S.; Yeo, D.C.J. Nutrient Conditions Influence Allelopathic Capabilities of Ludwigia Adscendens and Other Tropical Macrophytes against Microcystis Aeruginosa. Freshw. Biol. 2024, 69, 538–555. [Google Scholar] [CrossRef]
  56. Tao, C.; Niu, X.; Zhang, D.; Liu, Y.; Zhou, L.; Han, Y.; Mo, Y.; Wu, K.; Lin, Y.; Lin, Z. Inhibitory Effect of Malonic Acid on Microcystis Aeruginosa: Cell Morphology, Oxidative Stress and Gene Expression. Algal Res. 2024, 80, 103513. [Google Scholar] [CrossRef]
  57. Nakai, S.; Inoue, Y.; Hosomi, M.; Murakami, A. Myriophyllum Spicatum-Released Allelopathic Polyphenols Inhibiting Growth of Blue-Green Algae Microcystis Aeruginosa. Water Res. 2000, 34, 3026–3032. [Google Scholar] [CrossRef]
  58. Nakai, S.; Zou, G.; Okuda, T.; Nishijima, W.; Hosomi, M.; Okada, M. Polyphenols and Fatty Acids Responsible for Anti-Cyanobacterial Allelopathic Effects of Submerged Macrophyte Myriophyllum Spicatum. Water Sci. Technol. 2012, 66, 993–999. [Google Scholar] [CrossRef] [PubMed]
  59. Hilt, S. Allelopathic Inhibition of Epiphytes by Submerged Macrophytes. Aquat. Bot. 2006, 85, 252–256. [Google Scholar] [CrossRef]
  60. Zhu, J.; Liu, B.; Wang, J.; Gao, Y.; Wu, Z. Study on the Mechanism of Allelopathic Influence on Cyanobacteria and Chlorophytes by Submerged Macrophyte (Myriophyllum Spicatum) and Its Secretion. Aquat. Toxicol. 2010, 98, 196–203. [Google Scholar] [CrossRef]
  61. Zhiqun, T.; Jian, Z.; Junli, Y.; Chunzi, W.; Danju, Z. Allelopathic Effects of Volatile Organic Compounds from Eucalyptus Grandis Rhizosphere Soil on Eisenia Fetida Assessed Using Avoidance Bioassays, Enzyme Activity, and Comet Assays. Chemosphere 2017, 173, 307–317. [Google Scholar] [CrossRef] [PubMed]
Figure 1. Design of chemostat cultivation system.
Processes 12 01883 g001
Figure 2. Variations in cell density and growth rate (div d−1) of M. aeruginosa exposed to different treatments of M. spicatum extract (6.25, 12.5, 25, 50, 75, and 100 mg/L. MEA = addition of M. spicatum extracts; MEA = end of exposure. Numbers in parentheses indicate the concentration of MEA extract. Error bars represent standard errors of the means of triplicate counts.
Processes 12 01883 g002
Figure 3. Variations in pH values in the continuous culture of M. aeruginosa exposed to MEA extract at different concentrations (6.25, 12.5, 25, 50, 75, and 100 mg/L). MEA = addition of M. spicatum extracts; MEA = end of exposure. Numbers in parentheses indicate the concentration of MEA extract. Error bars represent standard errors of the means of triplicate counts.
Processes 12 01883 g003
Figure 4. Variations in total protein content in M. aeruginosa cells exposed to MEA extract at different concentrations (6.25, 125.5, 25, 50, 75, and 100 mg/L). MEA = addition of M. spicatum extracts; MEA = end of exposure. Numbers in parentheses indicate the concentration of MEA extract. Error bars represent standard errors of the means of triplicate counts.
Processes 12 01883 g004
Figure 5. Variations in MDA level in M. aeruginosa cells exposed to MEA extract at different concentrations (6.25, 12.5, 25, 50, 75, and 100 mg/L). MEA = addition of M. spicatum extracts; MEA = end of exposure. Numbers in parentheses indicate the concentration of MEA extract. Error bars represent standard errors of the means of triplicate counts.
Processes 12 01883 g005
Figure 6. Variations in SOD activity in M. aeruginosa cells exposed to MEA extract at different concentrations (6.25, 12.5, 25, 50, 75, and 100 mg/L). MEA = addition of M. spicatum extracts; MEA = end of exposure. Numbers in parentheses indicate the concentration of MEA extract. Error bars represent standard errors of the means of triplicate counts.
Processes 12 01883 g006
Figure 7. Variations in catalase activity in M. aeruginosa cells exposed to MEA extract at different concentrations (6.25, 12.5, 25, 50, 75, and 100 mg/L). MEA = addition of M. spicatum extracts; MEA = end of exposure. Numbers in parentheses indicate the concentration of MEA extract. Error bars represent standard errors of the means of triplicate counts.
Processes 12 01883 g007
Figure 8. HPLC chromatogram for the main phenolic compounds identified in the ethyl acetate crude extract of M. spicatum.
Processes 12 01883 g008
Table 2. Effect of MEA extract on microcystin production.
TreatmentTIME (day)Intracellular (µg/L)Extracellular (µg/L)Reduction Rate for Intra-MCs in %Reduction Rate for Extra-MCs in %
false positive--0.72 ± 0.14----
continuous mode without plants530.47 ± 0.6028.84 ± 0.57----
with 6.5 mg/L830.21 ± 0.4715.4 ± 0.74No reduction28.51
1330.84 ± 0.6111.01 ± 0.22 *
with 12.5 mg/L248.85 ± 0.175.31 ± 0.10No reduction36.31
2930.71 ± 0.30 *8.93 ± 0.08 *
with 25 mg/L3421.71 ± 0.218.45 ± 0.08No reduction46.75
3942.208 ± 0.42 *4.5 ± 0.04 *
with 50 mg/L4510.199 ± 0.106.38 ± 0.0618.3754.70
508.26 ± 0.08 *2.89 ± 0.02 *
with 75 mg/L539.5 ± 0.323.52 ± 0.0552.6394.03
584.5 ± 0.2 *0.21 ± 0.12 *
with 100 mg/L646.199 ± 0.060.38 ± 0.003~100~100
66<0.1 *<0.1 *
batch mode70<0.1<0.1----
The data represent the mean ± SD of 3 replicates, * p < 0.05 indicates significant differences compared between, before starting, and at the end of each treatment.
Table 3. Concentrations of the main phenolic compounds identified in the M. spicatum ethyl acetate crude extract.
CompoundsRetention Time
[min]
Area
[mAU.s]
Concentration
[µg/g DW]
Ascorbic acid3.501622.20185.19
Gallic acid3.906056.40362.56
Fumaric acid5.40161.90126.78
Tyrosol8.00488.01139.82
Catechin11.80238.77129.85
Chlorogenic acid12.1089.45123.88
Tannic acid12.30247.80130.21
Caffeic acid17.80522.24141.19
Unknown27.40137.30125.79
Unknown33.60369.43135.08
Unknown44.20658.72146.65
p-coumaric acid44.50411.31136.75
Quercetin44.70490.69139.93
Disclaimer/Publisher’s Note: The statements, opinions and data contained in all publications are solely those of the individual author(s) and contributor(s) and not of MDPI and/or the editor(s). MDPI and/or the editor(s) disclaim responsibility for any injury to people or property resulting from any ideas, methods, instructions or products referred to in the content.

