Article

Research on the Influence of a Magnesium-Based Carbon Dioxide Battery System on CO2 Storage Performance

by
Haoran Yang
1,2,
Mian Wei
1,
Baodong Wang
3,
Leqi Wang
4,
Qiuyan Chen
2,
Chang Su
2,
Yongcheng Feng
2,
Xing Wang
5 and
Ke Li
2,*
1
Shanghai Marine Diesel Engine Research Institute, Shanghai 200011, China
2
Shanghai Qiyao Environmentally Technology Co., Ltd., Shanghai 200011, China
3
NICE Europe Research GmbH, 10587 Berlin, Germany
4
School of Engineering, The University of Edinburgh, Edinburgh EH8 9YL, UK
5
Shandong Shipping Bulk Co., Ltd., Qingdao 266034, China
*
Author to whom correspondence should be addressed.
Processes 2024, 12(9), 1896; https://doi.org/10.3390/pr12091896
Submission received: 9 July 2024 / Revised: 30 August 2024 / Accepted: 31 August 2024 / Published: 4 September 2024

Abstract

:
At present, the energy consumption and carbon emissions of maritime transportation have raised concerns about environmental issues. A potential way to reduce carbon emissions from vessels is the use of chemical-based carbon capture and storage (CCS) technology. However, this technology faces challenges such as high energy consumption, large space occupation, and high processing costs. Therefore, the development of a technology with low energy consumption and compact CO2 storage is crucial to promote the advancement of CCS technology. This paper introduces a magnesium CO2 battery system that converts CO2 into new energy, in the form of hydrogen, while storing CO2. By preparing highly efficient catalytic electrodes and testing the electrolyte and CO2 flow rate on the battery performance, the optimal process parameters were determined to be Pd/CeO2-oct for the electrodes, a 0.5 mol/L NaOH solution for the electrolyte, and a CO2 flow rate of 1 L/h. The battery system demonstrated high cycling stability and conversion efficiency at a current density of 8 mA·cm−2, with a stable cycling time of 600 min (20 cycles), a cathode hydrogen production of 10.135 mL, and a Faraday efficiency of 97.03%.

1. Introduction

With the rapid development of the global economy and the growth of the global population, anthropogenic energy consumption has increased dramatically. Much of the energy needed by humans is generated by chemical reactions, and much of the energy obtained through chemical reactions comes from fossil fuels. Fossil fuels are a primary energy source derived from the fossilized deposits of ancient organisms [1]. As fossil fuels are usually hydrocarbons, a large amount of carbon dioxide gas emissions are generated during the development and utilization of fossil energy, which causes increasingly serious environmental issues around the world, such as the greenhouse effect.
The transportation industry is a significant sector in society in terms of energy consumption and exhaust emissions. It has become the second-largest source of greenhouse gas emissions globally, with CO2 emissions accounting for more than 20% of the world’s total carbon [2]. The demand for maritime transportation is increasing, leading to the expansion of the global shipping business. Consequently, the issue of vessel carbon emissions has become more prominent within the transportation industry. According to the statistics of the International Maritime Organization (IMO) [3], the global shipping CO2 emissions reached 833 million tons in 2021, a 4.9% increase from the previous year, constituting 10.6% of the overall transport industry emissions. Therefore, vessel carbon emission control technology has become an inevitable trend in promoting green shipping [4,5]. Among these technologies, onboard CO2 capture and storage (OCCS) technology is considered an important potential means of achieving large-scale CO2 emission reductions in the future [6].
The OCCS system mainly consists of four units: capture, separation, liquefaction, and storage [7]. The liquefaction and storage units involve multiple process modules such as compression, cryogenic refrigeration, and storage tank. Hence, these two units take a lot of energy and space, accounting for 40% of the energy consumption and 60% of the space consumption for the entire CCS system. Moreover, when CO2 trans-shipment is carried out during the port call of a ship, the liquid CO2 stored during a voyage requires 10 h of trans-shipment time, which further cuts down on the convenience of the OCCS system. Therefore, the application of CCS based on the chemical absorption method [8] on short-haul small-sized ships, large container ships, and bulk carriers, where space for energy supply and arrangement is limited, has limited prospects. These challenges significantly impede the large-scale application of OCCS systems [9,10].
To solve the problems of the large-size and high energy consumption of an OCCS system, a type of CO2 battery storage technology was introduced. A CO2 battery utilizes the electrochemical reaction principles between metals and CO2 to store CO2 in a solid state without an external energy supply. During the CO2 storage process, the CO2 battery can produce H2, which might be helpful for powering ships [11,12,13]. At present, the research and application of a metal–CO2 battery in the vessel field are still in their initial stages [14], and many scholars are working to improve the performance of the CO2 conversion rate, the battery stability, and the durability. They have shown that the direct factors that affect these properties are the cathode and anode materials of the battery [15]. Usually, the cathode/anode materials used for catalysis are mainly from precious metal Pt/C [16], among which is Pt, with scarce production rates and a high price. Palladium (Pd) is also an element of group VIII, like Pt, and it shares a similar electronic structure and adsorption energy for H+. It is possible to use Pd catalysis to replace Pt catalysis [17,18]. In order to reduce the palladium metal content and improve its catalytic activity, a composite catalytic design has been widely used in many catalytic reactions [19,20]. Current research efforts have found that the synergistic effect between a precious metal and the metal oxide interface may play an important role in catalysts’ electrocatalytic activity and stability. Therefore, metal oxides (such as transition metal oxides and others [21,22]) are used as a carrier to support the metal palladium, which has also become a significant research direction for the preparation of catalytic materials for hydrogen reactions [23,24]. Among the various metal oxides, cerium dioxide (CeO2) is commonly used as a palladium carrier. On the one hand, cerium dioxide has a large number of hole structures and vacancies, which increase the specific surface area of the catalyst and the active site, affect the valence state of surface palladium and the electron cloud [25], and produce significant synergistic effects; on the other hand, cerium dioxide is insoluble in water and chemically stable, so it can achieve better stability in alkaline environments [26]. The design studies of palladium-based composites provide an effective strategy for optimizing the performance of battery cathode materials, thus improving the performance and stability of metal–CO2 molecules.
In this paper, we introduce a Mg-CO2 membrane-free cell system: the cathode is composed of Pd-based compounds, the anode is made of the metal Mg, and the electrolyte is an alkaline NaOH solution. During the operation of the battery system, the discharge reaction employs CO2. The conversion efficiency and discharge capacity of the Mg-CO2 membrane-free battery for CO2 were determined through electrochemical performance tests. The cathode material was prepared using a simple hydrothermal method and impregnating a Pd/CeO2 composite catalytic material. Microstructure, composition, and surface activity detection were used to examine the catalytic mechanism of Pd/CeO2, which was combined with the Mg-CO2 battery system to achieve a technology with low energy consumption and efficient CO2 absorption and conversion. These are useful for the OCCS technology’s applications and promotion of technical methods and theoretical research.

2. Materials and Methods

The cavity of the Mg-CO2 battery system was designed to be 240 × 110 × 140 mm, and it contained 2 L of the NaOH electrolyte. The two electrodes were designed to have a size of 70 × 70 × 4 mm and were encapsulated on a polypropylene plate in the electrolytic cell, maintaining at least 50 mm between the two electrodes. The cathode was a Pd/CeO2 composite catalyst and the anode was a Mg metal both of them connected to the auxiliary reference electrode. One end of the panel contained the CO2 air inlet, and the other end was the H2 outlet, as shown in Figure 1. An external electrochemical workstation collected the performance indicators of the Mg-CO2 battery, such as the constant flow discharge curve (CP), the open-circuit voltage–time curve (OCPT), and cyclic voltammetry (CV).

2.1. The Reaction Mechanism of the Mg-CO2 Battery

To gain a comprehensive understanding of the Mg-CO2 battery’s performance, this section introduces the reaction mechanism of the Mg-CO2 battery. According to the chemical properties of each component in the Mg-CO2 battery (mainly the chemical properties of the cathode, anode, and CO2) and the existing research literature, the main electrochemical reactions during the discharge process of the Mg-CO2 battery are the CO2 dissolution reaction [27,28,29], the magnesium oxidation reaction, and the hydrogen precipitation reaction, and the details of each reaction are as follows:
CO2 dissolution reaction: When CO2 is continuously passed through the electrolyte solution, CO2 will first dissolve and then undergo multi-step hydrolysis in the electrolyte solution. The specific steps and equilibrium constants are shown below (where k H is the phase equilibrium constant of the CO2 dissolution process, p k a 1 is the dissociation constant when the first dissociation occurs, and p k a 2 is the second dissociation constant when the second dissociation occurs).
CO 2 ( gas )   CO 2 ( dissolved ) ,   [ CO 2 ] p CO 2 = 1 k H ,   ( k H = 29.76   L · atm · mol 1 )
CO 2 ( aq ) + H 2 O ( l ) H 2 CO 3 ( aq ) ( k H = 1.70 × 10 3 )
H 2 CO 3 ( aq ) HCO 3 ( aq ) + H + ( aq ) ( p k a 1 = 6.35 )
HCO 3 ( aq ) CO 3 2 ( aq ) + H + ( aq ) ( p k a 2 = 10.33 )
Magnesium oxidation reaction: During the discharge process, the magnesium metal on the anode is continuously oxidized to divalent magnesium ions due to the continuous loss of electrons. The reaction, as well as its reaction potential, is shown below (where E a represents the overpotential of the anodic reaction).
Mg ( s ) Mg 2 + ( aq ) + 2 e + ( E a = 2.37 V   vs .   SHE )
Hydrogen precipitation reaction: During the discharge process, the electrolyte solution near the cathode precipitates hydrogen due to the continuous gain of electrons. The reaction and its reaction potential are shown below (where E c represents the overpotential of the cathode reaction).
2 H + ( aq ) + 2 e + H 2 ( g ) , ( E c = 0.44 V   vs .   SHE )
Combining the magnesium oxidation reaction and the hydrogen precipitation reaction [30], the total reaction of the entire discharge process of the Mg-CO2 battery as well as the theoretical potential of the battery can be obtained as follows (where E theo represents the potential difference in the positive and negative electrode reactions):
Mg ( s ) + 2 H + ( aq ) + HCO 3 ( aq )   H 2 ( g ) + Mg ( HCO 3 ) 2   ( aq )
E theo = E c E a = 0.44 V ( 2.37 V ) = 1.93 V
From the theoretical potential of the Mg-CO2 battery during discharge and the theoretical mass capacity of the magnesium metal (2205 mAh·g−1) [31], the theoretical energy density ( ED Mg ) of the magnesium metal in the Mg-CO2 battery can be calculated as follows:
ED Mg = C Mg · E theo = 2205   mAh · g 1 × 1.92 V = 4255   Wh · kg 1
C Mg = 2205   mAh · g 1

2.2. Preparation of CO2 Battery Materials

The chemicals used for the Mg-CO2 battery are listed in Table 1.
The Pd/CeO2 cathode’s preparation was divided into three steps: the CeO2 carrier’s preparation, the Pd/CeO2 catalyst’s preparation, and the Pd/CeO2 cathode’s coating.
(1)
CeO2 carrier preparation
Ce(NO3)3·6H2O, PVP, and NaOH were dissolved in 10 mL of deionized water in a molar ratio of 1:1:10, respectively. The Ce(NO3)3·6H2O solution and the PVP solution were mixed homogeneously [30]. Then, the excess NaOH was added dropwise until a precipitate was formed. The mixture was stirred for 15 min to ensure a sufficient reaction. The mixture was transferred to a Teflon reactor, and the reactor was placed in an oven. The nanocubes of CeO2 (CeO2-cube) were obtained by reacting the solution at 180 °C for 12 h, and the nanorods of CeO2 (CeO2-rod) were obtained by reacting the mixture at 120 °C for 12 h. The Na3PO4 was added to the mixture at the molar ratio of PVP: Na3PO4 = 1:1 and reacted at 180 °C for 24 h to obtain the nano-octahedral CeO2 (CeO2-oct). The product was washed more than three times by filtration with the deionized water to remove the remaining ions and unreacted substances. The product was dried in an oven at 110 °C for 12 h to remove water and any residual organic matter. The products were calcined in a muffle furnace for 4 h at 450 °C.
(2)
Pd/CeO2 catalyst preparation
A certain amount of CeO2 carrier (CeO2-cube, CeO2-rod, and CeO2-oct) powder was weighed. The corresponding mass of precursor Pd(NO3)2·2H2O was weighed according to 1 wt% of the mass of CeO2 by Pd. The CeO2 carrier and the Pd(NO3)2·2H2O precursor [31] were dissolved in the deionized water to form a mixture with continuous stirring for 12 h. Stirring was continued at 85 °C until a thick substance was formed, followed by drying the thick substance in an oven at 110 °C for 12 h. The dried material was removed from the oven for grinding and subsequently calcined in a muffle furnace at 450 °C for 2 h. Three different morphologies of Pd/CeO2 catalysts (Pd/CeO2-cube, Pd/CeO2-rod, and Pd/CeO2-oct) were obtained as nanocubes, nanorods, and nano-octahedra.
(3)
Pd/CeO2 cathode coating
A total of 20 mg of Pd/CeO2 catalyst (Pd/CeO2-cube, Pd/CeO2-rod, and Pd/CeO2-oct) powder was taken. A total of 60 μL of Nafion and 600 μL of CH3CH2OH were added to the powder. Then, the mixture was ultra-sonicated for 1 h at 100 W to form a uniformly dispersed and turbid catalyst slurry. The catalyst was pipetted onto the 20 mm × 20 mm × 1 mm Ni foam electrode drop by drop, and the Ni foam electrode was irradiated with an infrared lamp at the same time. The coated Ni foam electrode was placed in an oven and dried at 65 °C for 720 min. Three Pd/CeO2 cathodes with three different morphologies with a palladium loading of 50 μg/cm2 were produced.

2.3. Characterization

The X-ray diffraction (XRD) patterns of the studied materials were analyzed using a Bruker D8 advance X-ray diffractometer with a Cu K radiation source (=1.54178 Å)(Bruker, Karlsruhe, Germany). The surface morphology, composition, elements, and their contribution were analyzed by transmission electron microscopy (TEM) with 120 kV JEOL JEM-2100F (Akishima, Tokyo, Japan). The Brunauer–Emmet–Teller (BET) spectrum was obtained with a Bruker Vertex 70 spectrophotometer within the range of 4000–400 cm−1 (Bruker, Karlsruhe, Germany). The components of the produced gas were observed using a gas chromatograph (GC) with GC-2014 (Shimadzu, Kyoto, Japan).

3. Results and Discussion

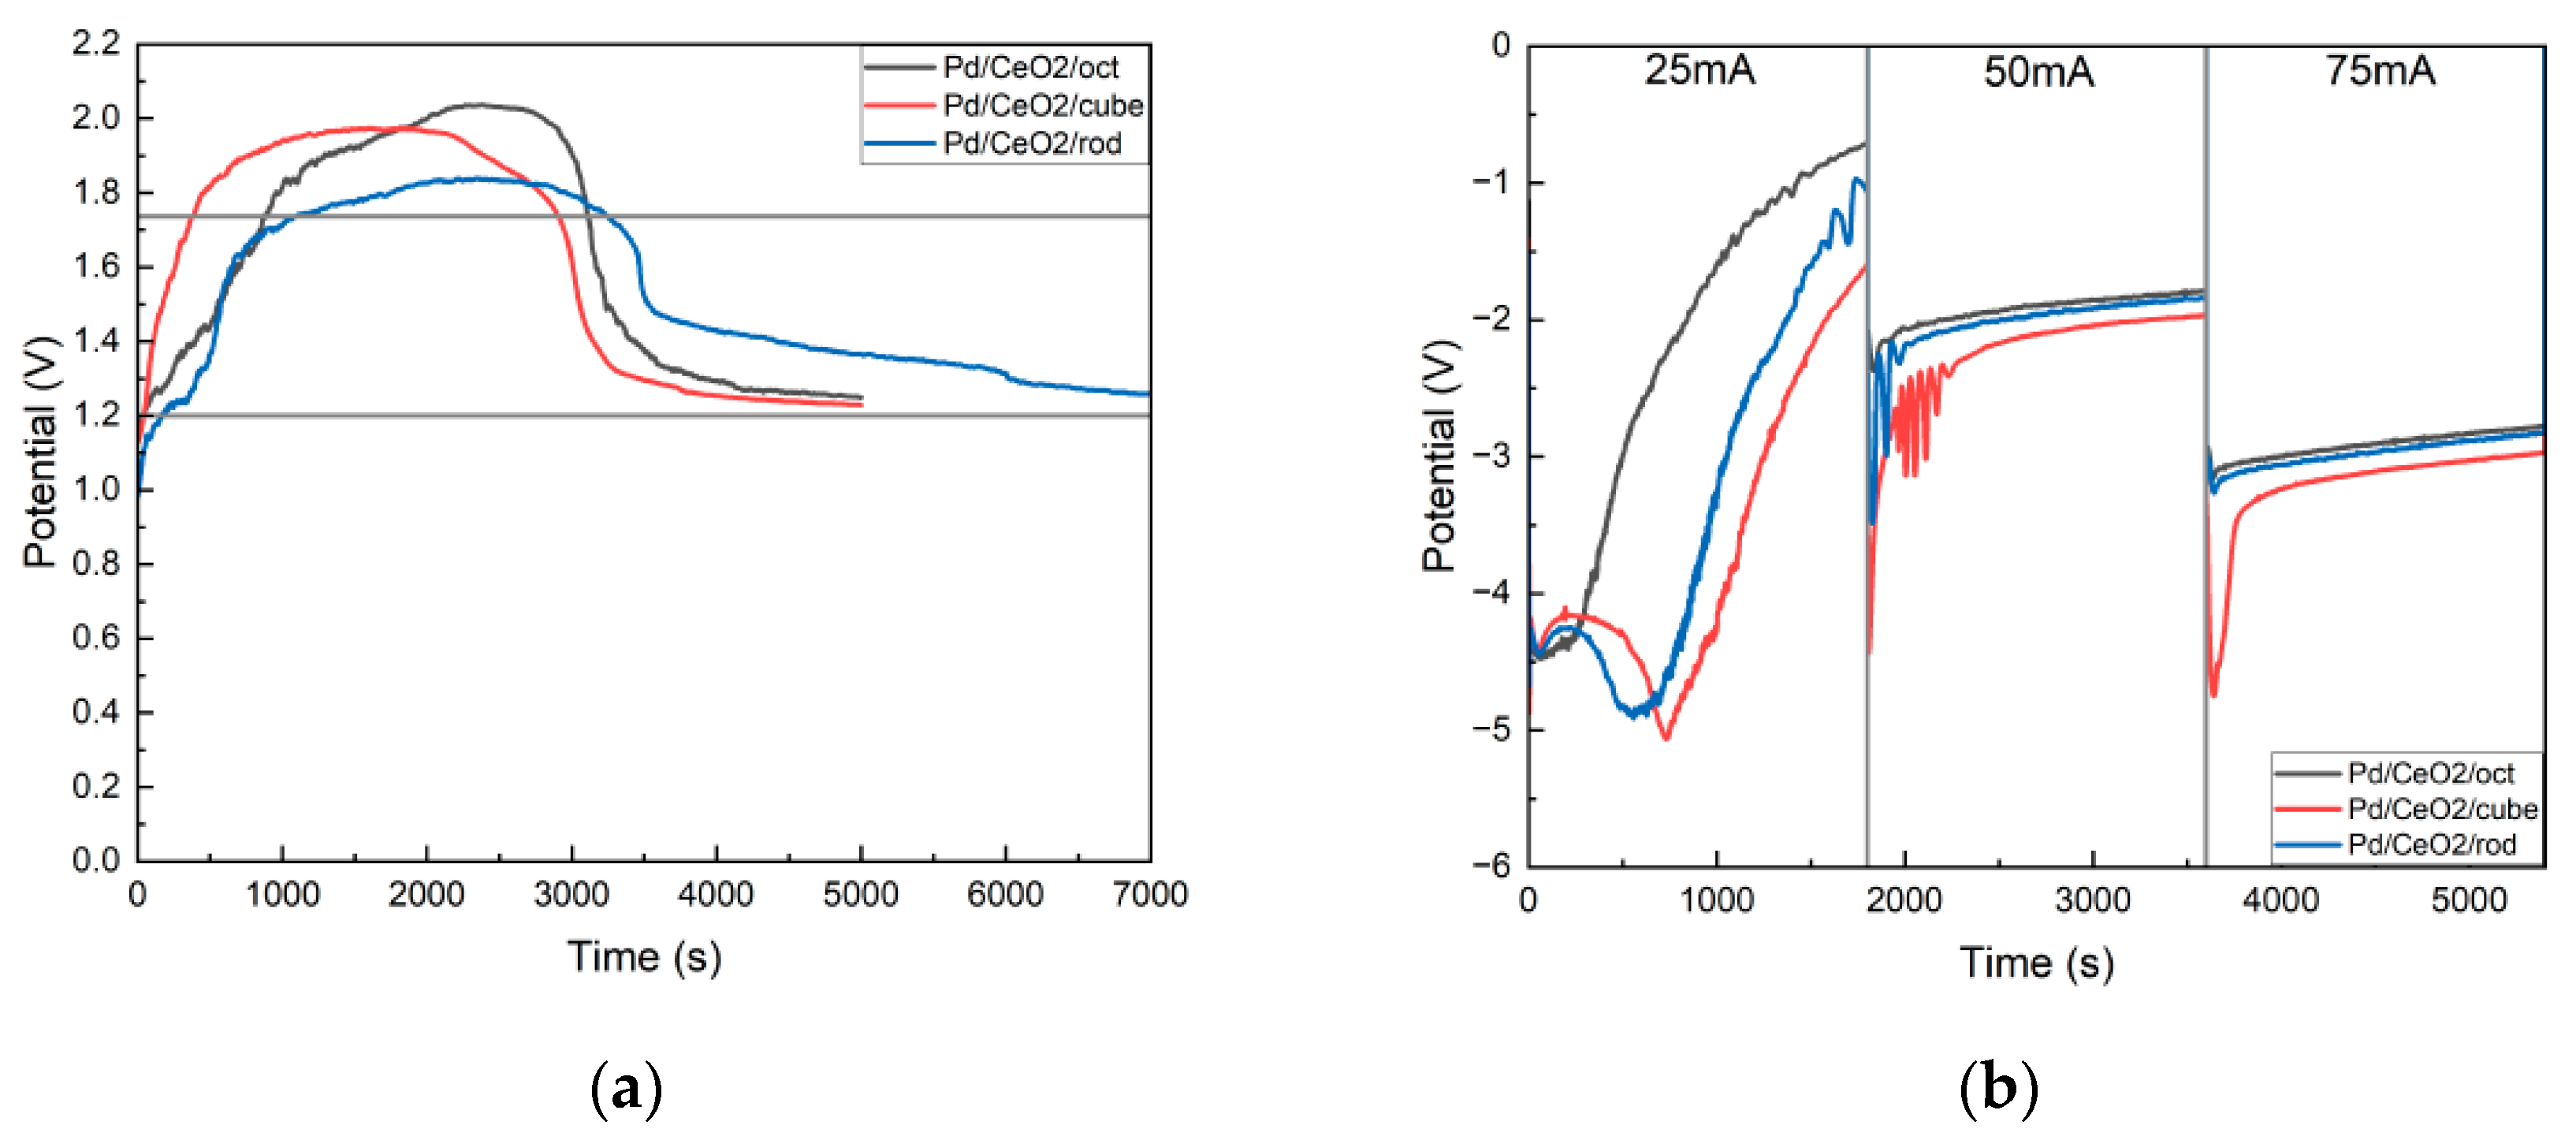
3.1. The Effect of the Catalytic Electrode on the Conversion Efficiency of Mg-CO2 Batteries with Molecules

The open-circuit voltage–time curve and constant discharge curve of Pd/CeO2 cathode Mg-CO2 batteries with three different morphologies (nanocubes, nanorods, and nano-octahedra) were determined at a CO2 flow rate of 1 L/h and a NaOH solution concentration of 0.05 mol/L, as illustrated in Figure 2.
The operating time difference in the Mg-CO2 battery systems with three different morphologies of Pd/CeO2 catalytic electrodes as positive electrodes in the high-voltage range was not significant, all measuring around 2200–2500 s. However, the voltage peak of the nanorod Pd/CeO2 cathode (Pd/CeO2-rod) was significantly lower than that of the nanocube (Pd/CeO2-cube) and nano-octahedral (Pd/CeO2-oct) morphologies, while the voltage peak of the Pd/CeO2-oct cathode was slightly higher than that of the Pd/CeO2-cube. At the same time, the Pd/CeO2-cube cathode had the fastest voltage response time, which was about half of that of the other two materials (Pd/CeO2-rod and Pd/CeO2-oct).
Under conditions of 50 mA and 75 mA constant current discharge (Figure 2b), the potential changes in the three cathodes were small, indicating that the electrocatalytic activity and stability of the three electrodes were relatively good. Among them, Pd/CeO2-cube and Pd/CeO2-rod had certain potential fluctuations [32]. In general, the Pd/CeO2-oct electrodes had the fastest voltage response speed and the lowest open-circuit voltage, showing better battery performance. It is worth noting that, in subsequent experiments, the Pd/CeO2 oct electrodes were used to study the performance of CO2 batteries.

3.2. The Effect of the Electrolyte Concentration on the Conversion Efficiency of the CO2 Molecules

The electrolyte concentration change was one of the factors affecting the ion transfer rate in the solution, and it affected the ability to transform the material [33]. To explore the trend in the effect of different electrolyte concentrations on the battery performance, a 0.5 mol/L NaOH solution at a high concentration, a 0.1 mol/L NaOH solution, a 0.05 mol/L NaOH solution, and a 0.1 mol/L NaCl solution without NaOH were configured (with NaCl enhancing the solution’s conductivity) for the CO2 battery charge and discharge test. To obtain the NaHCO3 time via calculation, as shown in Table 2, 0.1 mol/L and 0.05 mol/L NaOH quickly produced NaHCO3 due to the low ion concentration.
Combined with the open-circuit voltage curve of the CO2 battery test, as shown in Figure 3a, the incoming CO2 and NaOH reacted at the beginning, the solution’s pH value was high, and the open-circuit voltage was low. The open-circuit voltage corresponding to the NaCl solution increased at the beginning. After a period of time, the pH value gradually decreased as NaOH transformed into NaHCO3, with the open-circuit voltage increasing. And, the higher the NaOH concentration was, the longer the duration of its high-voltage phase. However, the above lowered the voltage value at the highest point of the curve. Therefore, in order to achieve the best battery performance, the concentration of the electrolyte should not be too high. Combined with the analysis of the constant discharge test in Figure 3b, the discharge curve of 0.5 mol/L NaOH was close to zero, and the discharge voltage was too low. Hence, it was not selected for further comparisons. In the reaction process of the primary battery, the function of NaOH was to provide the alkaline environment [34,35], accelerate ion transport, and improve CO2 absorption. The hydrogen evolution reaction was the main reaction that occurred at the anode in the CO2 battery system:
2 H + ( aq ) + 2 e H 2 ( g )
When the pH value of the solution was high, the concentration of hydrogen ions was very low, leading to the difficulty in discharging hydrogen ions and reducing the discharge voltage. Therefore, under the same current, the discharge curve of 0.05 mol/L NaOH showed the highest discharge voltage, meaning that it was the optimal electrolyte concentration of CO2. The rates of CO2 absorption by different concentrations of electrolyte are listed in Table 2.

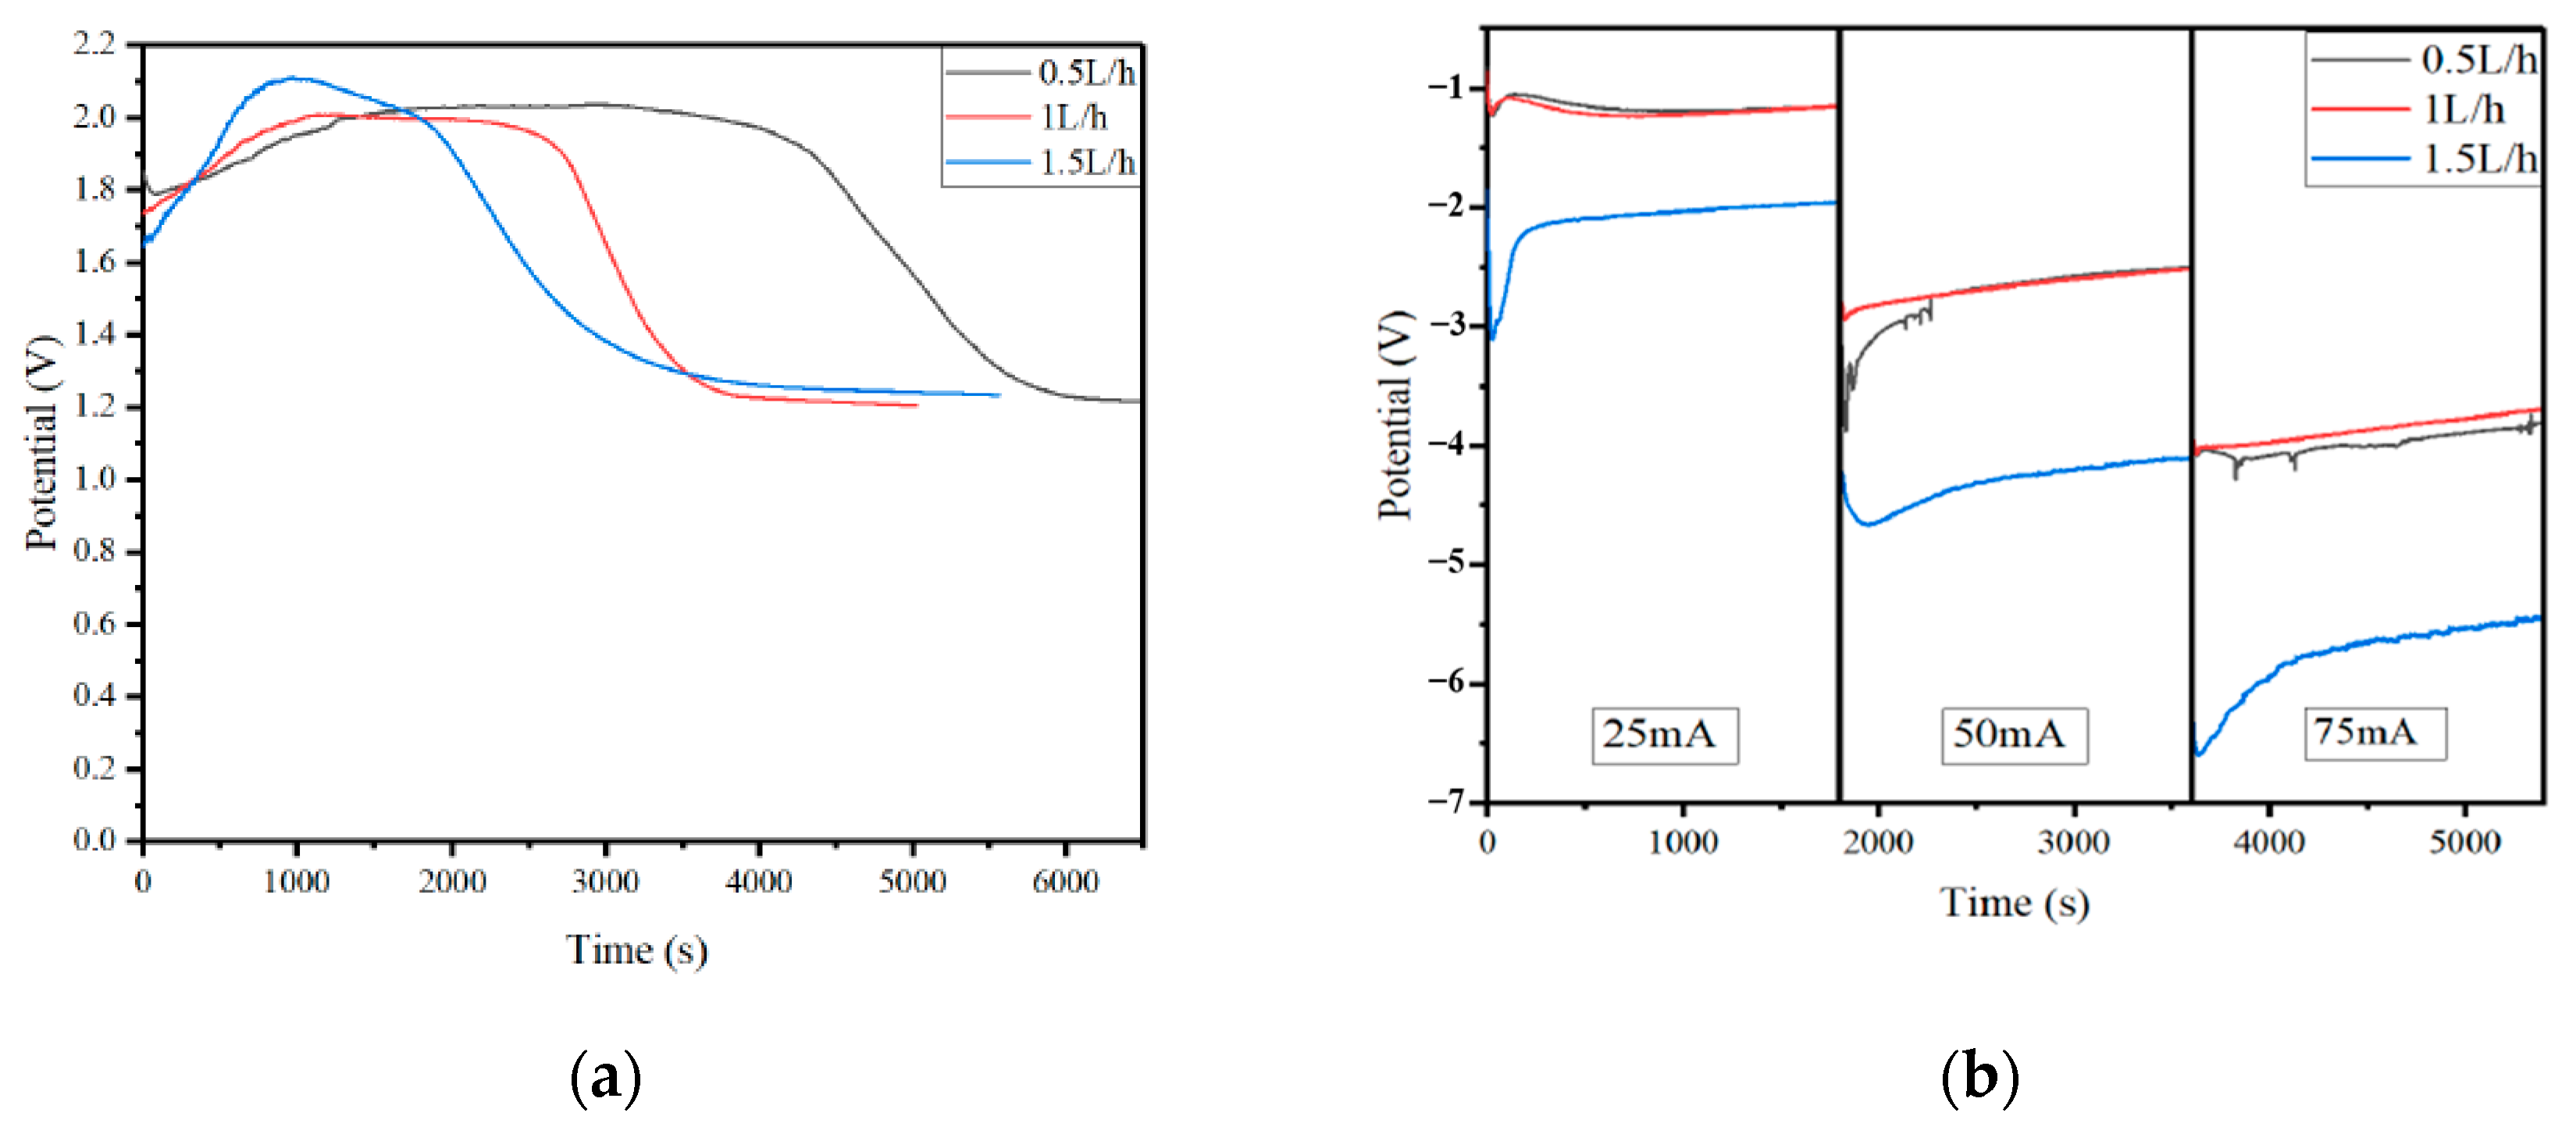
3.3. The Effect of CO2 Flow Change on the Conversion Efficiency of CO2 Molecules

In the process of CO2 battery conversion, the change in CO2 flow had a certain impact on the stability of the battery and the duration of the high-voltage phase. Therefore, a CO2 flow of 0.5 L/h, a CO2 flow of 1.0 L/h, and a CO2 flow of 1.5 L/h were selected to study the impact of flow on battery performance. The battery discharge curve in Figure 4 was thus obtained, calculating the battery’s NaHCO3 generation time, as shown in Table 3.
Contrary to the effect of the NaOH concentration on battery performance, it took longer for the NaOH reaction to produce NaHCO3 when the flow rate of CO2 was low. Additionally, the low decreasing rate of Ph increased the opening voltage. Hence, the battery performed better at a certain concentration of Ph, when it was in the high open-circuit voltage phase. At the same time, when the flow rate of CO2 increased, it also caused battery voltage instability, to a certain extent. Due to the fast flow rate of CO2, a large number of bubbles blocked the surface active site of the electrode, resulting in a decrease in the reaction rate. With the current increase, this phenomenon was more noticeable. It can be seen from the calculation results in Table 3 that the complete reaction time of the 1.5 L/h CO2 flow was close to that of the 1 L/h CO2 flow. Combining the battery’s voltage stability and the conversion rate, the CO2 flow rate was finally determined to be 1 L/h.

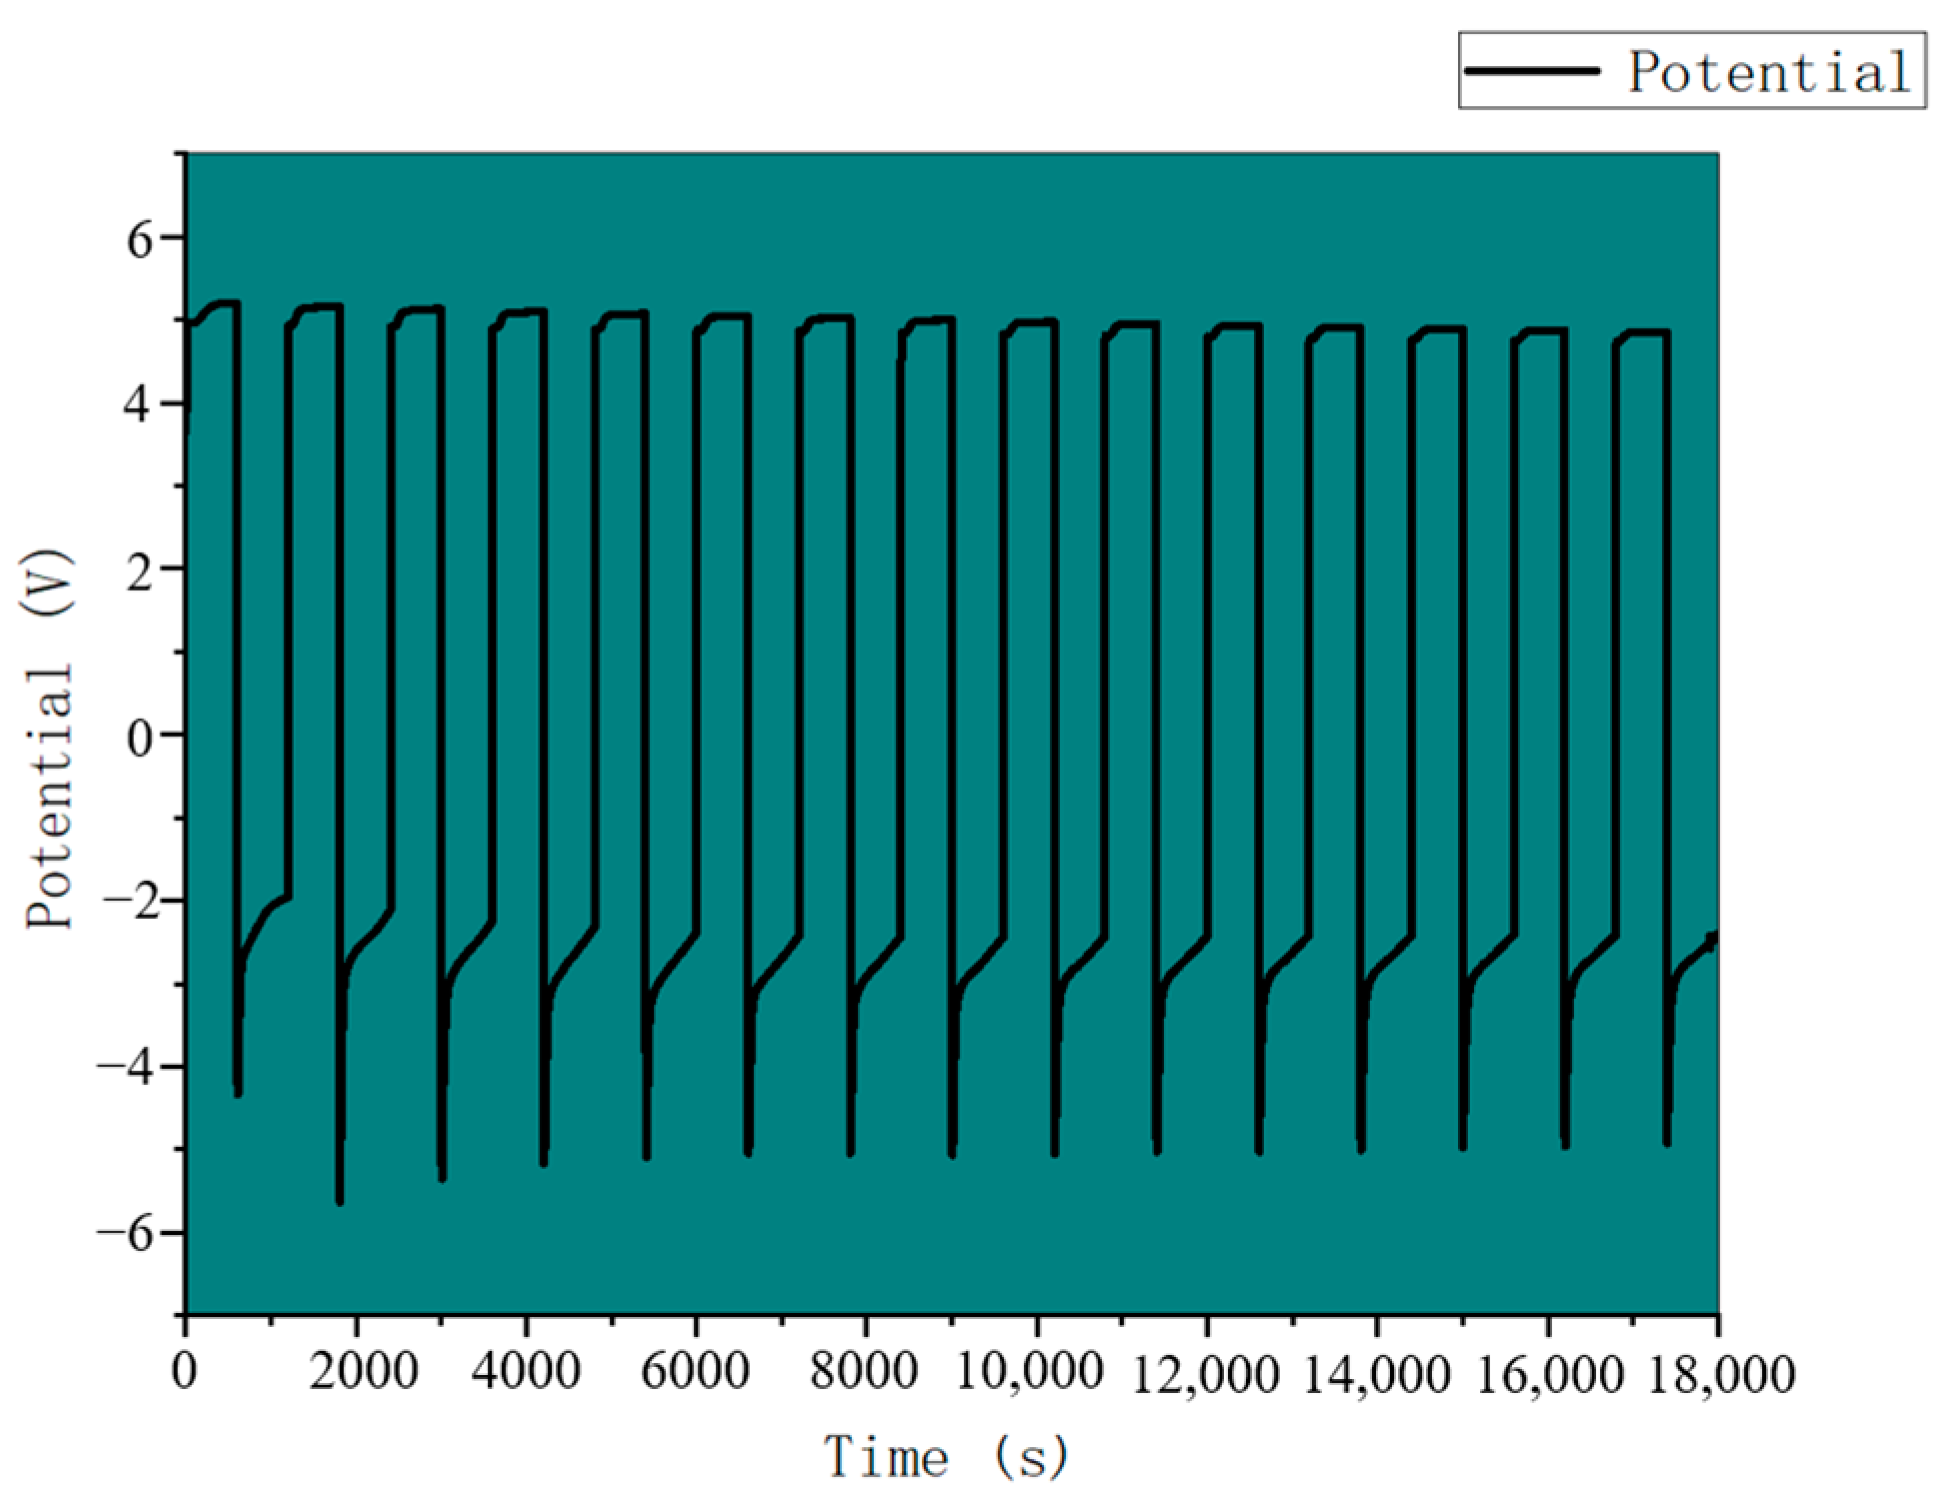
3.4. CO2 Battery System Performance Analysis

The process parameters of the CO2 battery were determined by the rate of CO2 absorption conversion and battery performance of the catalytic electrode [36], the NaOH concentration, and the CO2 flow of different nanostructures. In order to further determine the stable charging, discharging, and CO2 storage capacity of the CO2 battery, the CO2 long charging and discharging cycle test was carried out. As shown in Figure 5, the battery circulated for 600 min (20 charge and discharging cycles) at an 8 mA·cm−2 current density, showing excellent cycle performance, with an almost constant charge and discharge voltage clearance.
A further test was conducted on the gas outlet composition of the CO2 batteries under constant current discharge over 600 min. The total flow rate of the exported gas was 53.90 cm3/h, which was a mixture of CO2 and H2. Hydrogen gas accounted for 1.88% of the total gas volume obtained by gas chromatography, as shown in Figure S1, so the battery produced 10.135 cm3 hydrogen gas, and the Faraday efficiency was calculated as follows [37]:
FE = nF Q
where n is the mole number of the electron transfer in the electrochemical reaction (expressed in terms of the electron coefficient in the electrochemical equation), F is the Faraday constant, about 96,485 C/mol, and Q is the amount of charge converted through the electrochemical reaction in Coulomb [38].
The Faraday efficiency was calculated according to the results of the hydrogen production of the Mg-CO2 battery under certain constant current discharge conditions. The calculation formula was provided as follows:
FE = 2 V H 2 V m F Q
V H 2 was the volume of the hydrogen produced over a certain time, V m was the molar volume of gas, F was the Faraday constant, and Q was the discharge amount of the constant current discharge of the battery at a certain time. Then, the Faraday efficiency was calculated to be 97.03%, indicating that the Mg-CO2 battery had excellent charge transfer rate and CO2 conversion ability.

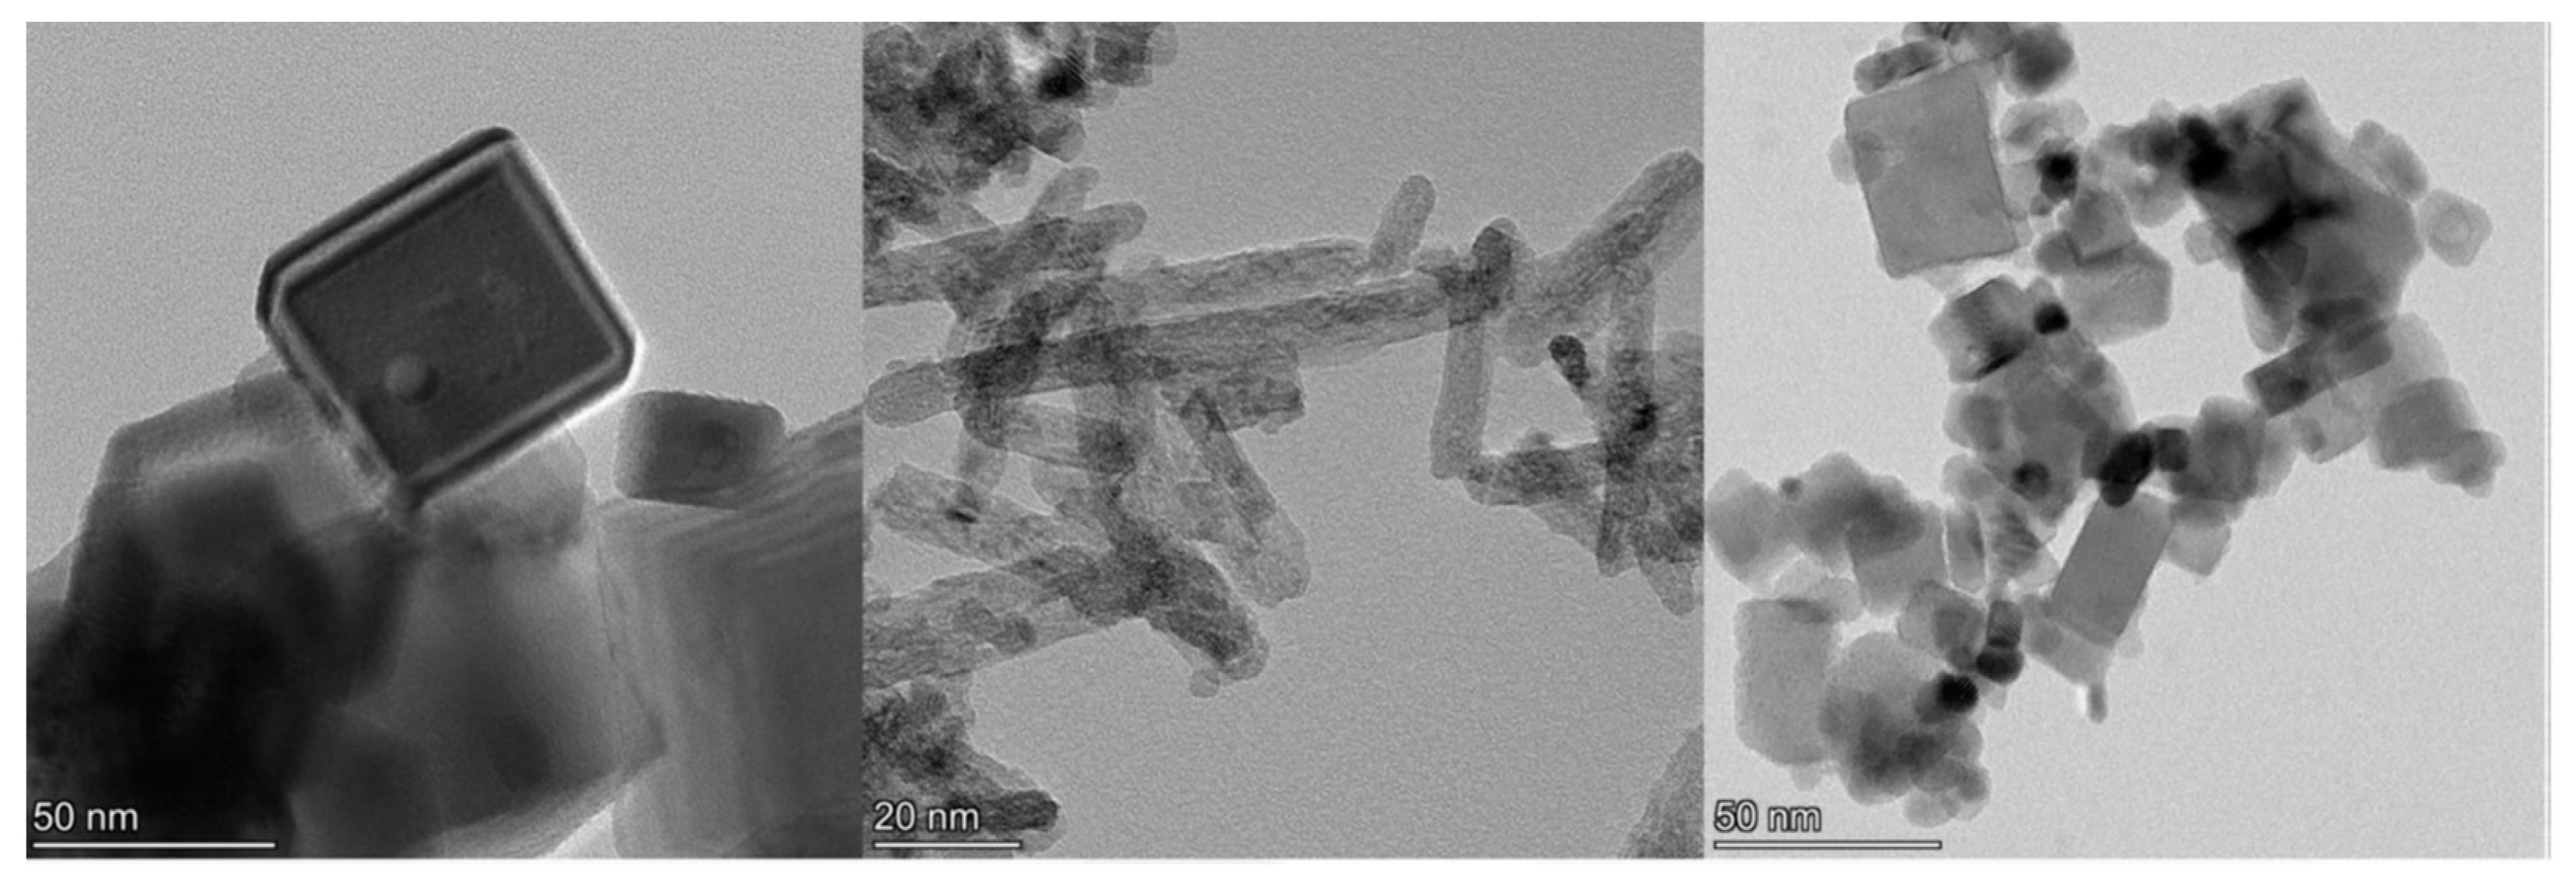
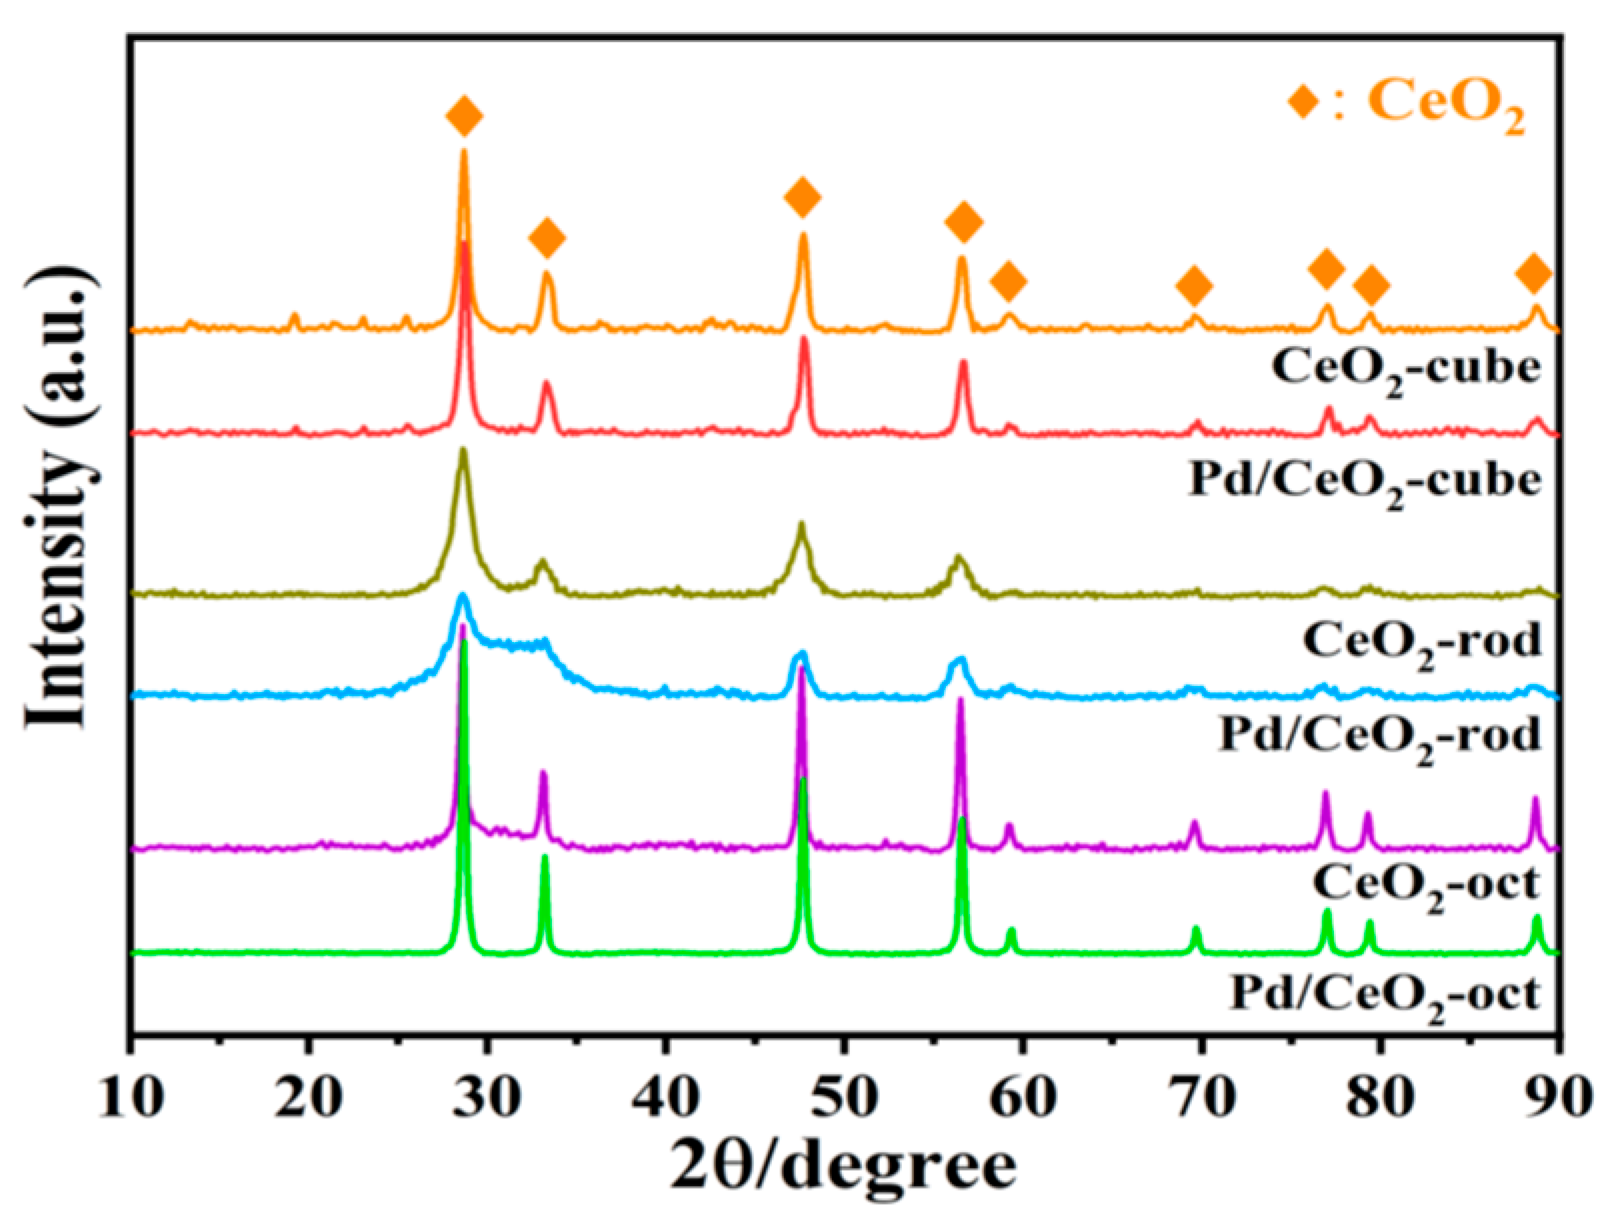
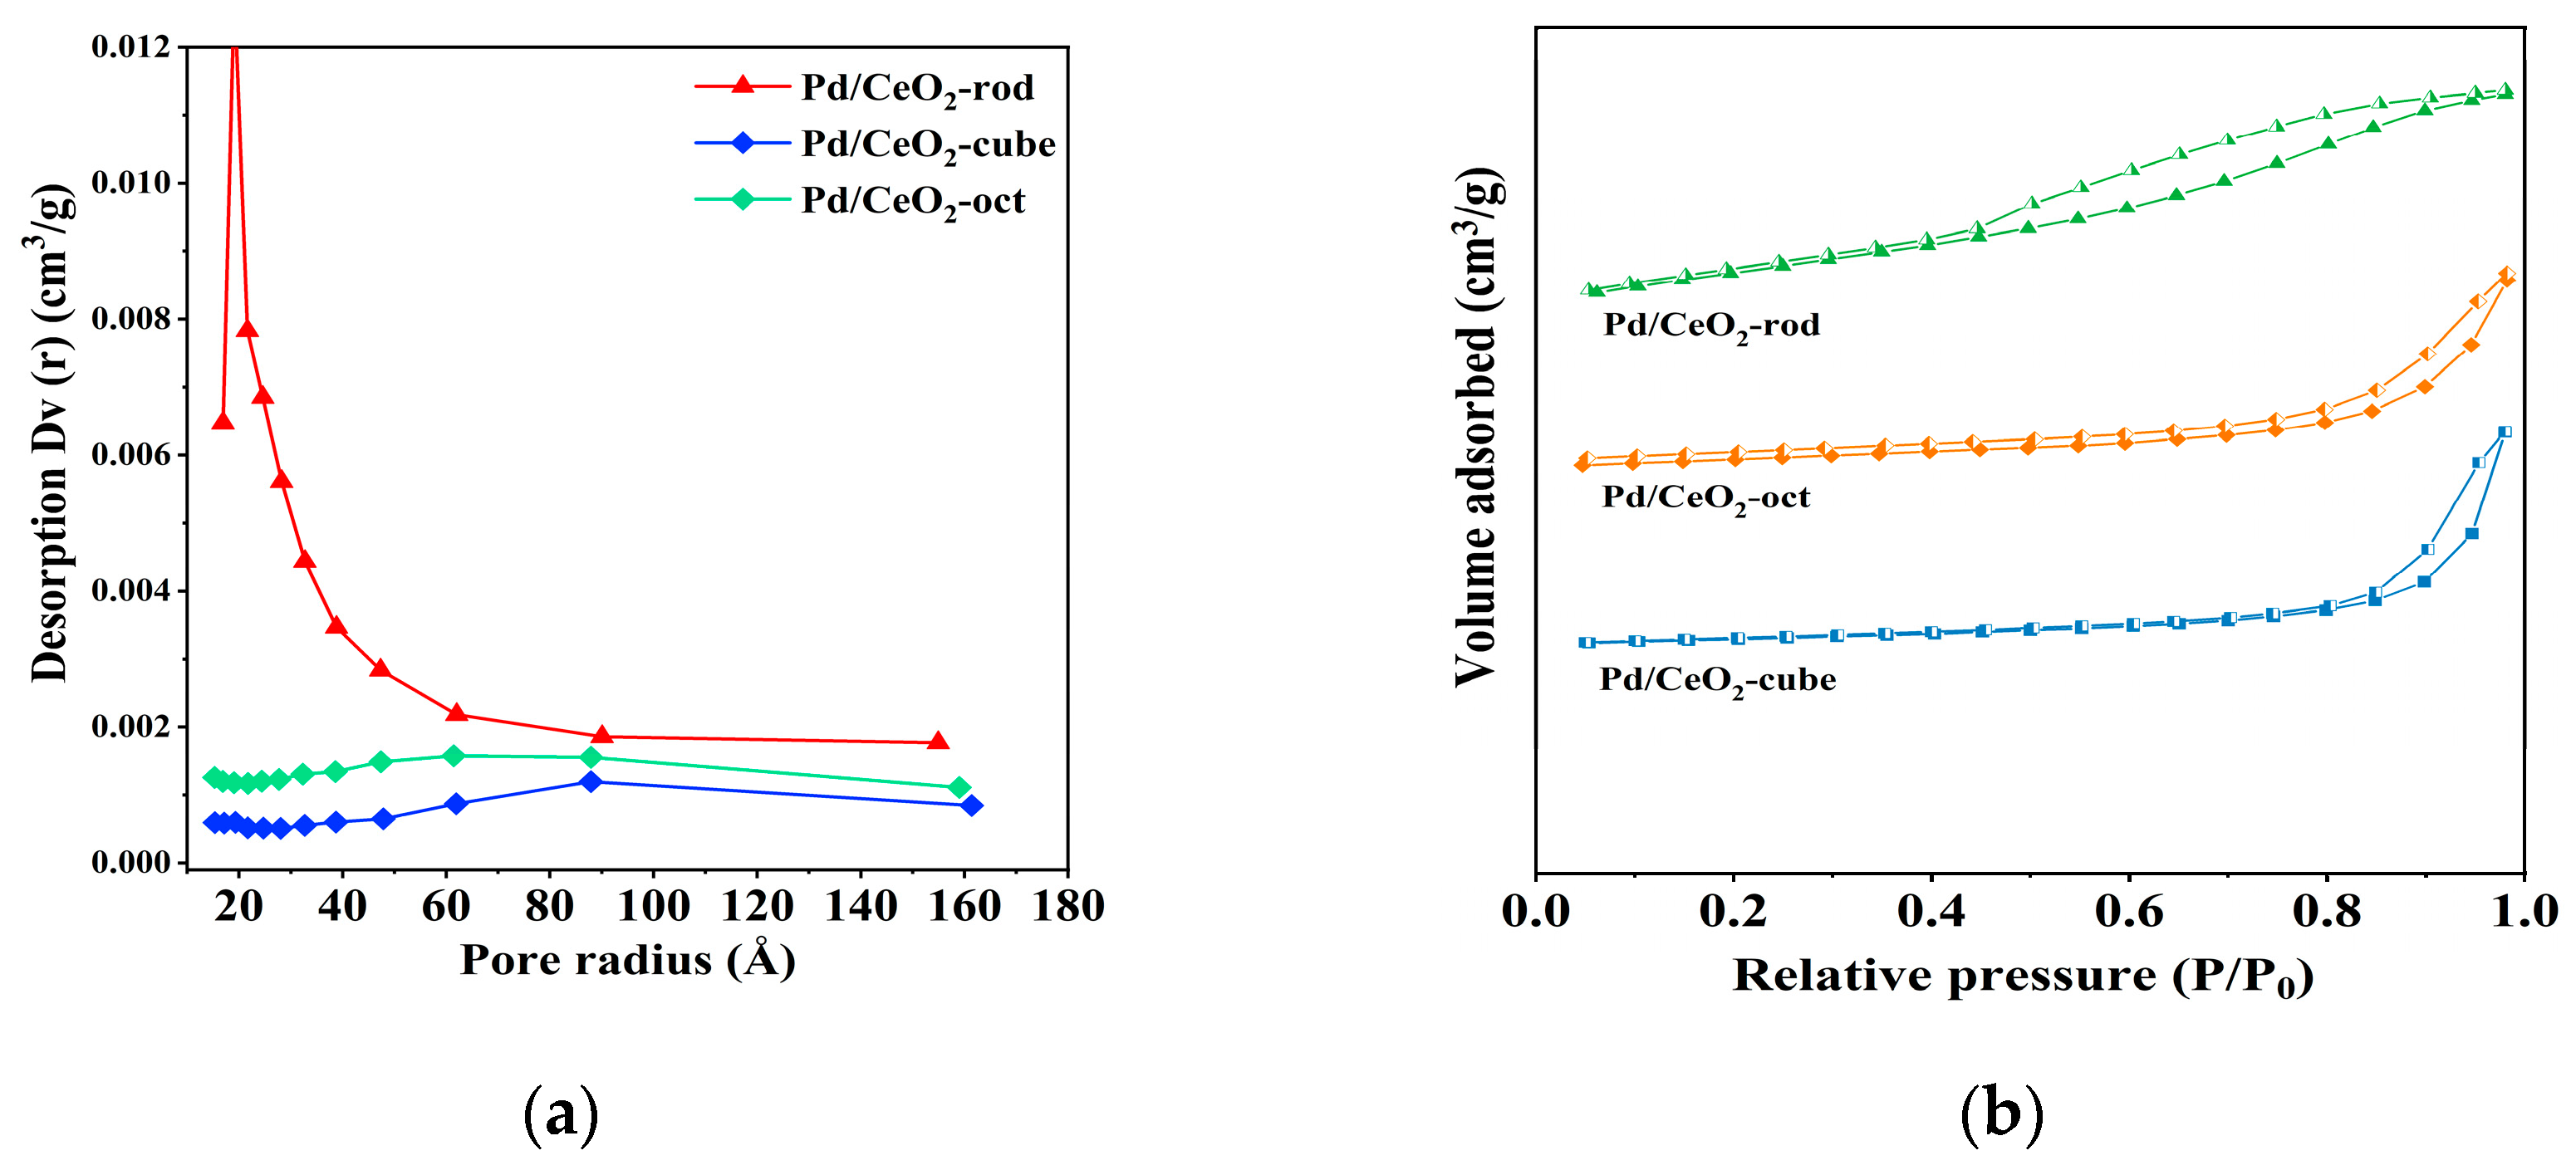
3.5. Characterization of Catalyst Structure

To further understand the Mg-CO2 battery’s performance, various characterization analyses of the Pd/CeO2 catalysts with different morphologies were carried out, containing the composition and crystal structure of the Pd/CeO2 catalysts, the surface morphology, the compositional distribution, and the elemental valence. These analyses could help reveal the mechanism of the hydrogen precipitation reaction catalyzed by the Pd/CeO2 catalysts from the structural level and evaluate the performance of the Pd/CeO2 catalysts in terms of the electrocatalytic activity and stability [39,40].
The TEM images of nanocube, nanorod, and nano-octahedral Pd/CeO2 catalysts are shown in Figure 6. It can be seen that the grain sizes and structures are different. In terms of grain size, the size of the nanocube CeO2 is around 50~100 nm, the length of the nanorod CeO2 is about 40~200 nm, and the size of the nano-octahedral CeO2 is about 20~50 nm. In terms of structure, the Pd/CeO2-cube exposes the (100) crystal plane of CeO2, the Pd/CeO2-rod exposes the (111) and (110) crystal planes of CeO2, and the Pd/CeO2-oct exposes the (111) crystal plane of CeO2. It can also be observed that the Pd species are more inclined to form nanoclusters or particles on the surface of the nanocubic and nano-octahedral CeO2, while, for the nanorod CeO2, the Pd species are distributed on the surface, in a highly dispersed state. Combined with the results of the battery performance tests in the previous section, this indicates that the Pd species has higher catalytic hydrogen precipitation activity and stability when forming nanoparticles or clusters compared to when it is highly dispersed on the surface.
The XRD spectra of the CeO2 carriers and the Pd/CeO2 catalysts with different morphologies are shown in Figure 7. It can be seen that the various catalysts show the same characteristic peaks of CeO2, and there is no relevant peak of the Pd species, which indicates that Pd is highly dispersed on the surface of the CeO2 carrier and that there is no noticeable agglomeration. According to Xiele’s formula [41], after calculating the grain size based on the diffracted peak with the largest intensity, it was found that the grain sizes of Pd/CeO2 became smaller, compared to those of its CeO2 carriers. This indicated that the interaction between Pd and CeO2 triggered lattice distortion and that the XRD patterns of the Pd/CeO2 catalyst were smaller than those of the CeO2 carrier. The diffraction half-peak width of Pd/CeO2 was widened, compared to that of the CeO2 carrier in the XRD spectra.
The BET analysis results of the Pd/CeO2 catalysts with different morphologies are shown in Figure 8. As can be seen from the left panel in Figure 8, the N2 isothermal adsorption and desorption curves of all three catalysts show H3-type hysteresis loops with IV-type adsorption isotherms, which indicates that the three catalysts have similar pore structures, such as microscopic flat-plate slits, cracks, and wedges [42]. The right panel in Figure 8 shows that the Pd/CeO2-rod catalyst has the smallest pore size and the largest pore volume, which means that d/CeO2-rod can accommodate the largest number of reactive molecules. As such, it might achieve a better catalytic performance. In addition, the Pd/CeO2-rod has the largest specific surface area, followed by Pd/CeO2-oct and Pd/CeO2-cube, which means that the Pd/CeO2-rod can provide the most active sites for the catalytic reaction and the Pd/CeO2-rod has an excellent catalytic performance.
However, according to the results of the battery test in the previous section, the electrocatalytic hydrogen precipitation activity and stability of the Pd/CeO2-rod catalyst were the worst. This indicated that the main factor affecting the activity and stability of electrocatalytic hydrogen deposition was not the pore structure of the Pd/CeO2 rod catalyst but the difference in the exposed CeO2 crystal planes supported.

4. Conclusions

This study examined the impact of catalytic electrode materials, electrolyte concentration, CO2 flow rate, and other components and process parameters on the discharge capacity and CO2 absorption and utilization efficiency of Mg-CO2 batteries. The findings revealed the successful preparation of high-surface-area nano catalytic materials, including nanocube CeO2, nanorod CeO2, and nano-octahedral CeO2 structures. Notably, the nano-octahedral CeO2 structure of Pd/CeO2-oct with small grains of 20–50 nm exhibited the best catalytic conversion activity and stability. The Mg-CO2 battery, utilizing an electrolyte comprising a 0.05 mol/L NaOH solution and a CO2 flow rate of 1 L/h, demonstrated an outstanding performance, showcasing a high cycling stability at a current density of 8 mA·cm−2 for 600 min (20 charge–discharge cycles). The battery’s hydrogen production measured 10.135 cm3, with a Faraday efficiency of 97.03%, indicating the feasibility of CO2 storage and utilization.
Using metal–CO2 batteries as rechargeable energy storage systems, carbon dioxide (CO2) was reduced to carbon-containing chemical products during discharge, leading to CO2 solidification and the consumption of metal elements. Metal salts were reduced by applying external energy during charging. In comparison to the CO2 compression-cooling storage process, the CO2 battery storage technology stored CO2 in solid form. The battery did not require an external energy supply. Additionally, during the storage period, CO2 batteries could discharge voltage to the outside, meeting the electricity needs of the system and some ships. Therefore, this CO2 battery storage technology could fundamentally address the issues of large system volumes and high energy consumption, laying the groundwork for achieving efficient carbon reduction in ships.

Supplementary Materials

The following supporting information can be downloaded at https://www.mdpi.com/article/10.3390/pr12091896/s1: Figure S1. Chromatogram of H2 mass fraction.

Author Contributions

Conceptualization, H.Y. and M.W.; methodology, B.W.; validation, L.W.; formal analysis, Q.C.; investigation, C.S.; resources, X.W.; writing—original draft preparation, Y.F.; and writing—review and editing, K.L. All authors have read and agreed to the published version of the manuscript.

Funding

This research was funded by the National Key R&D Program of China, with grants number 2022YFE0208900 and 2022YFE0124300.

Data Availability Statement

The original contributions presented in this study are included in this article and Supplementary Materials. Further inquiries can be directed to the corresponding author.

Conflicts of Interest

Haoran Yang and Mian Wei are employed by the Shanghai Marine Diesel Engine Research Institute. Haoran Yang, Qiuyan Chen, Chang Su, Yongcheng Feng, and Ke Li are employed by the Shanghai Qiyao Environmentally Technology Co., Ltd. Baodong Wang is employed by the NICE Europe Research GmbH. Xing Wang is employed by the Shandong Shipping Bulk Co., Ltd. The authors declare that the research was conducted in the absence of any commercial or financial relationships that could be construed as a potential conflict of interest.

References

  1. BP. BP Statistical Review of World Energy 2022; BP p.l.c.: London, UK, 2022. [Google Scholar]
  2. Marbán, G.; Valdés-Solís, T. Towards the hydrogen economy? Int. J. Hydrogen Energy 2007, 32, 1625–1637. [Google Scholar] [CrossRef]
  3. Mao, Z.; Ma, A.; Zhang, Z. Towards carbon neutrality in shipping: Impact of European Union’s emissions trading system for shipping and China’s response. Ocean. Coast. Manag. 2024, 249, 107006. [Google Scholar] [CrossRef]
  4. IPCC. Climate Change 2021—The Physical Science Basis. Chem. Int. 2021, 43, 22–23. [Google Scholar] [CrossRef]
  5. Xie, Z.; Zhang, X.; Zhang, Z. Metal–CO2 batteries on the road: CO2 from contamination gas to energy source. Adv. Mater. 2017, 29, 1605891. [Google Scholar] [CrossRef]
  6. Folger, P. Carbon Capture and Sequestration (CCS) in the United States; Congressional Research Service: Washington, DA, USA, 2017. [Google Scholar]
  7. Czernichowski-Lauriol, I.; Berenblyum, R.; Bigi, S.; Car, M.; Liebscher, A.; Persoglia, S.; Poulsen, N.; Stead, R.; Vercelli, S.; Vincent, C.J.; et al. CO2GeoNet Perspective on CO2 Capture and Storage: A Vital Technology for Completing the Climate Change Mitigation Portfolio. Energy Procedia 2017, 114, 7480–7491. [Google Scholar] [CrossRef]
  8. Hua, W.; Sha, Y.; Zhang, X.; Cao, H. Research Progress of Carbon Capture and Storage (CCS) Technology Based on the Shipping Industry. Ocean. Eng. 2023, 281, 114929. [Google Scholar] [CrossRef]
  9. Abanades, J.C.; Rubin, E.S.; Mazzotti, M. On the climate change mitigation potential of CO2 conversion to fuels. Energy Environ. Sci. 2017, 10, 2491–2499. [Google Scholar] [CrossRef]
  10. Vega, F.; Baena-Moreno, F.M.; Fernández, L.M.G.; Portillo, E.; Navarrete, B.; Zhang, Z. Current Status of CO2 Chemical Absorption Research Applied to CCS: Towards Full Deployment at Industrial Scale. Appl. Energy 2020, 260, 114313. [Google Scholar]
  11. Xie, J.; Wang, X.; Lv, J.; Huang, Y.; Wu, M.; Wang, Y.; Yao, J.Q. Frontispiece: Reversible Aqueous Zinc–CO2 Batteries Based on CO2–HCOOH Interconversion. Angew. Chem. 2018, 57, 16996–17001. [Google Scholar] [CrossRef] [PubMed]
  12. Kim, C.; Kim, J.; Joo, S.; Bu, Y.; Liu, M.; Cho, J.; Kim, G. Efficient CO2 Utilization via a Hybrid Na-CO2 System Based on CO2 Dissolution. iScience 2018, 9, 278–285. [Google Scholar] [CrossRef]
  13. Kim, J.; Seong, A.; Yang, Y.; Joo, S.; Kim, C.; Jeon, D.H.; Dai, L.; Kim, G. Indirect surpassing CO2 utilization in membrane-free CO2 battery. Nano Energy 2021, 82, 105741. [Google Scholar] [CrossRef]
  14. Takechi, K.; Shiga, T.; Asaoka, T. A Li–O2/CO2 battery. Chem. Commun. 2011, 47, 3463–3465. [Google Scholar] [CrossRef] [PubMed]
  15. Subbaraman, R.; Tripkovic, D.; Strmcnik, D.; Chang, K.C.; Uchimura, M.; Paulikas, A.P.; Stamenkovic, V.; Markovic, N.M. Enhancing Hydrogen Evolution Activity in Water Splitting by Tailoring Li+-Ni(OH)2-Pt Interfaces. Science 2011, 334, 1256–1260. [Google Scholar] [CrossRef]
  16. Morales-Guio, C.G.; Stern, L.-A.; Hu, X. Nanostructured hydrotreating catalysts for electrochemical hydrogen evolution. Chem. Soc. Rev. 2014, 43, 6555–6569. [Google Scholar] [CrossRef] [PubMed]
  17. Green, T.; Britz, D. Kinetics of the deuterium and hydrogen evolution reactions at palladium in alkaline solution. J. Electroanal. Chem. 1996, 412, 59–66. [Google Scholar] [CrossRef]
  18. Andonoglou, P.P.; Jannakoudakis, A.D. Palladium deposition on activated carbon fibre supports and electrocatalytic activity of the modified electrodes towards the hydrogen evolution reaction. Electrochim. Acta 1997, 42, 1905–1913. [Google Scholar] [CrossRef]
  19. Li, J.; Zhou, P.; Li, F.; Ren, R.; Liu, Y.; Niu, J.; Ma, J.; Zhang, X.; Tian, M.; Jin, J.; et al. Ni@Pd/PEI–rGO stack structures with controllable Pd shell thickness as advanced electrodes for efficient hydrogen evolution. J. Mater. Chem. A 2015, 3, 11261–11268. [Google Scholar] [CrossRef]
  20. Kukunuri, S.; Austeria, P.M.; Sampath, S. Electrically conducting palladium selenide (Pd4Se, Pd17Se15, Pd7Se4) phases: Synthesis and activity towards hydrogen evolution reaction. Chem. Commun. 2016, 52, 206–209. [Google Scholar] [CrossRef]
  21. Cargnello, M.; Doan-Nguyen, V.V.T.; Gordon, T.R.; Diaz, R.E.; Stach, E.A.; Gorte, R.J.; Fornasiero, P.; Murray, C.B. Control of Metal Nanocrystal Size Reveals Metal-Support Interface Role for Ceria Catalysts. Science 2013, 341, 771–773. [Google Scholar] [CrossRef]
  22. Lewera, A.; Timperman, L.; Roguska, A. Metal–support interactions between nanosized Pt and metal oxides (WO3 and TiO2) studied using X-ray photoelectron spectroscopy. J. Phys. Chem. C 2011, 115, 20153–20159. [Google Scholar] [CrossRef]
  23. Li, Z.Y.; Liu, Z.; Liang, J.C. Facile synthesis of Pd–Mn3O4/C as high-efficient electrocatalyst for oxygen evolution reaction. J. Materials Chem. A 2014, 2, 18236–18240. [Google Scholar] [CrossRef]
  24. Pradhan, D.; Su, Z.; Sindhwani, S.; Honek, J.F.; Leung, K.T. Electrochemical growth of ZnO nanobelt-like structures at 0 C: Synthesis, characterization, and in-situ glucose oxidase embedment. J. Phys. Chem. C 2011, 115, 18149–18156. [Google Scholar] [CrossRef]
  25. Titkov, A.I.; Salanov, A.N.; Koscheev, S.V. Mechanisms of Pd(1 1 0) surface reconstruction and oxidation: XPS, LEED and TDS study. Surf. Sci. 2006, 600, 4119–4125. [Google Scholar] [CrossRef]
  26. Spiel, C.; Blaha, P.; Suchorski, Y. CeO2/Pt(111) interface studied using first-principles density functional theory calculations. Phys. Rev. B 2011, 84, 045412. [Google Scholar] [CrossRef]
  27. Peng, C.; Xue, L.; Zhao, Z.; Guo, L.; Zhang, C.; Wang, A.; Mao, J.; Dou, S.X.; Guo, Z. Boosted Mg−CO2 Batteries by Amide-Mediated CO2 Capture Chemistry and Mg2+-Conducting Solid-Electrolyte Interphases. Angew. Chemie 2023, 136, e202313264. [Google Scholar] [CrossRef]
  28. Zhang, C.; Wang, A.; Guo, L.; Yi, J.; Luo, J. A Moisture-Assisted Rechargeable Mg-CO2 Battery. Angew. Chem. 2022, 61, e202200181. [Google Scholar] [CrossRef]
  29. Wei, S.; Shi, H.; Li, X.; Hu, X.; Xu, C.; Wang, X. A Green and Efficient Method for Preparing Graphene Using CO2@Mg In-Situ Reaction and Its Application in High-Performance Lithium-Ion Batteries. J. Alloys Compd. 2022, 902, 163700. [Google Scholar] [CrossRef]
  30. Miller, H.A.; Lavacchi, A.; Vizza, F. A Pd/C-CeO2 Anode Catalyst for High-Performance Platinum-Free Anion Exchange Membrane Fuel Cells. Angew. Chemie 2016, 55, 6004–6007. [Google Scholar] [CrossRef]
  31. Miller, H.A.; Vizza, F.; Marelli, M.; Zadick, A.; Dubau, L.; Chatenet, M.; Geiger, S.; Cherevko, S.; Doan, H.; Pavlicek, R.K.; et al. Highly active nanostructured palladium-ceria electrocatalysts for the hydrogen oxidation reaction in alkaline medium. Nano Energy 2017, 33, 293–305. [Google Scholar] [CrossRef]
  32. Wright, S.E. Comparison of the Theoretical Performance Potential of Fuel Cells and Heat Engines. Renew. Energy 2004, 29, 179–195. [Google Scholar] [CrossRef]
  33. Cabello, M.; Medina, A.; Alcántara, R.; Nacimiento, F.; Pérez-Vicente, C.; Tirado, J.L. A Theoretical and Experimental Study of Hexagonal Molybdenum Trioxide as Dual-Ion Electrode for Rechargeable Magnesium Battery. J. Alloys Compd. 2020, 831, 154795. [Google Scholar] [CrossRef]
  34. Yamada, Y.; Wang, J.; Ko, S.; Watanabe, E.; Yamada, A. Advances and Issues in Developing Salt-Concentrated Battery Electrolytes. Nat. Energy 2019, 4, 269–280. [Google Scholar] [CrossRef]
  35. Guo, X.; Li, Y.; Chen, N.; Wang, X.; Xie, Q. Construction of Sustainable Release Antimicrobial Microspheres Loaded with Potassium Diformate. J. Inorg. Mater. 2021, 36, 181–187. [Google Scholar] [CrossRef]
  36. Duan, J.; Chen, S.; Zhao, C. Ultrathin Metal-Organic Framework Array for Efficient Electrocatalytic Water Splitting. Nat. Commun. 2017, 8, 15341. [Google Scholar] [CrossRef]
  37. Ikäläinen, S.; Lantto, P.; Vaara, J. Fully Relativistic Calculations of Faraday and Nuclear Spin-Induced Optical Rotation in Xenon. J. Chem. Theory Comput. 2011, 8, 91–98. [Google Scholar] [CrossRef]
  38. Ciuparu, D.; Lyubovsky, M.R.; Altman, E.; Pfefferle, L.D.; Datye, A. CATALYTIC COMBUSTION OF METHANE OVER PALLADIUM-BASED CATALYSTS. Catal. Rev. 2002, 44, 593–649. [Google Scholar] [CrossRef]
  39. Xu, X.; Shuai, K.; Xu, B. Review on Copper and Palladium Based Catalysts for Methanol Steam Reforming to Produce Hydrogen. Catalysts 2017, 7, 183. [Google Scholar] [CrossRef]
  40. Liu, Y.; Zhou, R.J.; Mo, A.C.; Chen, Z.Q.; Wu, H.K. Synthesis and Characterization of Yttrium/Hydroxyapatite Nanoparticles. Key Eng. Mater. 2007, 330–332, 295–298. [Google Scholar] [CrossRef]
  41. Yan, L.-G.; Yang, K.; Shan, R.-R.; Yan, T.; Wei, J.; Yu, S.-J.; Yu, H.-Q.; Du, B. Kinetic, Isotherm and Thermodynamic Investigations of Phosphate Adsorption onto Core–Shell Fe3O4@LDHs Composites with Easy Magnetic Separation Assistance. J. Colloid Interface Sci. 2015, 448, 508–516. [Google Scholar] [CrossRef]
  42. Chalgin, A.; Song, C.; Tao, P.; Shang, W.; Deng, T.; Wu, J. Effect of Supporting Materials on the Electrocatalytic Activity, Stability and Selectivity of Noble Metal-Based Catalysts for Oxygen Reduction and Hydrogen Evolution Reactions. Prog. Nat. Sci. 2020, 30, 289–297. [Google Scholar] [CrossRef]
Figure 1. The schematic diagram of the Mg-CO2 battery system.
Processes 12 01896 g001
Figure 2. The discharge curves of the different catalytic electrodes: (a) open-circuit voltage–time curve (OCPT) and (b) constant flow discharge curve (CP).
Processes 12 01896 g002
Figure 3. The discharge curve of the CO2 molecule under different concentrations of electrolyte: (a) open-circuit voltage–time curve (OCPT) and (b) constant flow discharge curve (CP).
Processes 12 01896 g003
Figure 4. The discharge curve of CO2 molecules at different CO2 flow rates: (a) open-circuit voltage–time curve (OCPT) and (b) constant flow discharge curve (CP).
Processes 12 01896 g004
Figure 5. The circulation curve of the battery system at an 8 m·Acm−2 current density.
Processes 12 01896 g005
Figure 6. The TEM images of Pd/CeO2 catalysts with nanocube, nanorod, and nano-octahedral structures.
Processes 12 01896 g006
Figure 7. The XRD spectra of the CeO2 carrier and Pd/CeO2 catalyst with different morphologies.
Processes 12 01896 g007
Figure 8. The BET spectrum of the catalyst: (a) pore size distribution of BJH and (b) N2 adsorption–desorption isotherm.
Processes 12 01896 g008
Table 1. The chemicals used for Mg-CO2 batteries.
No.ItemChemistrySpecificationsManufacturer
1Palladium nitratePd(NO3)2·2H2O17.27 wt%Guyan chem., Kunming, China
2Cerium(III) nitrateCe(NO3)3·6H2OARMacklin, Shanghai, China
3Potassium hydroxideKOH95%Macklin, Shanghai, China
4Sodium hydroxideNaOH95%Macklin, Shanghai, China
5Carbon dioxideCO299.999%Peric, Handan, China
6Nafion perfluorinated resin solution-5 wt%Macklin, Shanghai, China
7EthanolCH3CH2OH99.5%Macklin, Shanghai, China
8Porous carbon nanotubeC97.5%Macklin, Shanghai, China
9VulcanXC-72 Carbon BlackC99.5%CABOT, Boston, MA, USA
10Magnesium flakeMg-Huabei Metal, Wuxi, China
11Nickel Foam SheetNi-Suzhou Metal, Suzhou, China
12PolyvinylpyrrolidonePVPARMacklin, Shanghai, China
13Trisodium phosphateNa3PO496%Macklin, Shanghai, China
Table 2. The rates of CO2 absorption by different concentrations of electrolyte.
NaOH Concentration (mol/L)CO2 Flow Rate (L/h)Complete Reaction Generation NaHCO3 Time (min)
0.51107.52
0.121.50
0.0510.75
Table 3. The CO2 absorption rates for different flows.
CO2 Traffic (L/h)NaOH Potency (mol/L)Complete Reaction Time to Generate NaHCO3 (min)
0.50.0521.5
110.75
1.57.17
Disclaimer/Publisher’s Note: The statements, opinions and data contained in all publications are solely those of the individual author(s) and contributor(s) and not of MDPI and/or the editor(s). MDPI and/or the editor(s) disclaim responsibility for any injury to people or property resulting from any ideas, methods, instructions or products referred to in the content.

