Article

An Optimization Study of 3D Printing Technology Utilizing a Hybrid Gel System Based on Astragalus Polysaccharide and Wheat Starch

1
School of Mechanical Engineering, Chongqing Three Gorges University, Chongqing 404100, China
2
Chongqing Three Gorges Vocational College, Chongqing 404100, China
3
CAS&GD Metal Material Development Co., Ltd., Chongqing 404100, China
*
Author to whom correspondence should be addressed.
Processes 2024, 12(9), 1898; https://doi.org/10.3390/pr12091898
Submission received: 7 August 2024 / Revised: 29 August 2024 / Accepted: 2 September 2024 / Published: 4 September 2024
(This article belongs to the Special Issue Research and Optimization of Food Processing Technology)

Abstract

:
This study utilizes a lab-developed pneumatic-extrusion condensing 3D food printer to prepare astragalus–starch mixed gels by blending different ratios of astragalus polysaccharide and wheat starch and applies these gels to 3D printing experiments. The aim of this paper is to investigate the impacts of mixed-gel concentrations on printing outcomes in order to identify the optimal blending ratio. Under this rationale, the effects of printing layer height and nozzle diameter on print quality were studied. Single-factor analysis and response surface methodology were employed to optimize the experiments and determine the optimal printing process parameters for the astragalus–starch mixed gels. The results indicate that an increase in astragalus polysaccharide content leads to a decrease in the sedimentation rate of the mixed gels and a tendency towards a more fluid consistency. After storage of samples in a sealed space for equal durations, it was found that an increase in astragalus polysaccharide content enhances the textural properties of the mixed gels, with optimal printing effects achieved at a 2% polysaccharide content. The optimal print quality is achieved when the ratio of nozzle diameter to layer height is between 0.5 and 0.55. The influence order of printing process parameters on the overall completion rate of the samples is nozzle diameter > printing speed > fill rate. The predicted optimal printing parameters are a nozzle diameter of 0.6 mm, a printing speed of 767 mm/min, and a fill rate of 83%, with a predicted overall completion rate of the printed samples at 99.45%. Experimental validation revealed an actual overall completion rate of the printed samples at 99.52%, slightly higher than the predicted value. This discrepancy was attributed to the precision of the measurement methods and the variability in the printing process. The study demonstrates that the addition of astragalus polysaccharide significantly improves the 3D printing molding effect of wheat starch, and the printing parameter settings obtained by response surface optimization effectively enhance printing accuracy. This research provides experimental evidence and parameter optimization references for the application of non-starch polysaccharides in starch-based 3D food printing.

1. Introduction

Wheat starch, a polysaccharide rich in amylopectin, is commonly used as a stabilizer and thickener in the food industry [1]. The viscosity and thermal stability of gelatinized wheat starch are relatively good, making it suitable as an ink for 3D printing. However, wheat starch also has a high viscosity, and a phenomenon of aging and retrogradation occurs during the printing process, which leads to a decrease in printing accuracy [2,3]. The use of 3D printing technology as an additive manufacturing technology can significantly reduce material waste compared to traditional subtractive manufacturing, and has been widely applied in various fields [4,5,6]. In the food sector, 3D printing technology can not only reduce the waste of food materials but also fabricate personalized foods, enhancing consumer acceptance [7].
Non-starch polysaccharides refer to complex polysaccharides other than starch, mainly non-alpha-glucose polysaccharides from plant cell walls, which possess a variety of bioactivities [8]. Astragalus polysaccharide, extracted from Astragalus membranaceus, is a water-soluble non-starch heteropolysaccharide with immunomodulatory and regulatory effects [9,10]. The pneumatic-extrusion 3D food printing technology requires the printing ink to have a certain fluidity; theoretically, various soft food materials can serve as printing inks, but their physicochemical properties and printing performance vary, and they need to be matched with different 3D printer parameters [11]. Therefore, it is crucial to study the characteristics of specific food printing inks and their degrees of compatibility with printing parameters.
The retrogradation and digestibility characteristics of starch and non-starch polysaccharide systems are currently hot topics in research [12,13]. Relevant studies have shown that the addition of non-starch polysaccharides can reduce the digestibility of starch and may alter the texture and water retention of gels, thereby affecting the quality and stability of the final product [14,15]. Recent research has indicated that the incorporation of non-starch polysaccharides can decrease the digestibility of starch, which may be beneficial in creating food products with specific nutritional profiles [16,17]. However, the mechanisms by which non-starch polysaccharides interact with starch to affect the printing process and the characteristics of the final product are not yet fully understood, indicating a research gap in the current literature.
This study aims to explore the impact of different concentrations of astragalus polysaccharides on the performance of wheat starch-based 3D printing ink and to optimize the blend ratio and printing parameters of the mixed gel to enhance printing outcomes and product attributes. Our approach, which combines sedimentation rate measurements, texture analysis, and 3D printing trials to assess the printability of the mixed gels [18,19], fills the gap in the existing research and contributes to the advancement of material science within the field of 3D printing.

2. Materials and Methods

2.1. Experimental Materials

The wheat starch used complies with the Chinese national standard GB/T 8883 [20] and was purchased from Enmiao Food Co., Ltd. in Nanyang, Henan Province, China. The astragalus polysaccharide is water-soluble and food-grade, with a polysaccharide content of no less than 90%, and was purchased from Ruihe Bioengineering Technology Co., Ltd. in Xi’an, Shaanxi Province, China.

2.2. Instruments and Equipment

  • Lab-made pneumatic-extrusion condensing 3D food printer;
  • JA3003 electronic analytical balance, Shanghai Zanwei Weighing Apparatus Co., Ltd., Shanghai, China;
  • TL-PRO texture analyzer, Beijing Ying Sheng Heng Tai Technology Co., Ltd., Beijing, China;
  • DF-101S constant-temperature oil bath magnetic stirrer, Shanghai Qiu Zuo Scientific Instruments Co., Ltd., Shanghai, China;
  • MC-7K centrifuge, Zhejiang Ou Mai Ke Testing Instruments Co., Ltd., Huzhou, Zhejiang, China.

Pneumatic-Extrusion Condensing 3D Food Printer

The mechanical system of the pneumatic-extrusion condensing 3D food printer consists of an XYZ motion system, a feeding system, and a condensing deposition platform, as shown in Figure 1. The condensing deposition platform is equipped with a cooling plate that regulates the platform temperature through a water-circulation cooling system to ensure the low-temperature environment required for the deposition of food materials, as shown in Figure 2. The working principle of the printer is as follows: After starting the printer, the air pump works in conjunction with the condensing system. The temperature of the deposition platform is quickly reduced to the preset level by the condensing circulating water. At the same time, the air pump generates extrusion power, and the dispensing machine connected to the air pump controls the extrusion rate to extrude the food material from the printing cylinder, and thereby constructs a three-dimensional food model on the deposition platform by stacking layer by layer, achieving automated food molding.

2.3. Experimental Methods

2.3.1. Preparation of Printing Materials

Take 75 g of deionized water and dissolve 0 g, 0.75 g, 2.25 g, 3 g, and 3.75 g of astragalus polysaccharide, respectively, to prepare astragalus polysaccharide solutions of varying concentrations. Then, add 15 g of wheat starch to each solution and mix thoroughly using a magnetic stirrer. Subsequently, place the mixtures in an 80 °C water bath and heat while stirring for 30 min to ensure complete gelatinization and homogeneity. After the heating process, allow the mixtures to cool to room temperature. Finally, seal the samples and store them in a 4 °C refrigerator for later use.

2.3.2. The 3D Printer Extrusion Layer Height Setting

To exclude the influence of layer height on the printed samples, the astragalus–starch mixed gel with 2% astragalus polysaccharide content was placed in a syringe barrel and used to print a 21 * 21 * 10 mm3 cubic model with the condensing 3D printer designed and built in the present laboratory. All printing experiments were conducted at room temperature, and with a deposition platform temperature of 5 °C. Through the pre-test, a nozzle with a diameter of 0.8 mm was selected, and the layer height was set to 45%, 50%, 55%, and 60% of the nozzle diameter to explore the best molding quality.

2.3.3. Single-Factor 3D Printing Parameter Setting

Place the prepared astragalus–starch mixed gels with different contents into the syringe barrel and use the lab-made condensing 3D printer to print a 212,110 cubic model. All printing experiments were conducted at room temperature with a deposition platform temperature of 5 °C. The different printing parameters are as follows:
(1) Test of different printing speeds: With a nozzle diameter of 0.8 mm, an extrusion line width of 0.96mm, a filling rate of 80%, and a filling structure setting of rectilinear, different printing speeds were set for the same target model based on the results of the preliminary experiment, specifically, 500 mm/min, 600 mm/min, 700 mm/min, 800 mm/min, 900 mm/min, and 1000 mm/min, in order to study the effect of printing speed on the quality of printed samples.
(2) Test of different filling rates: This test was conducted with a nozzle diameter of 0.8 mm, an extrusion line width of 0.96 mm, a printing speed of 900 mm/min, and a filling structure setting of rectilinear, in accord with the results of preliminary experiments. Different filling rates were set for the same target model, namely, 50%, 60%, 70%, 80%, 90%, and 100%, to study the effect of filling rate on the quality of printed samples.
(3) Test of different nozzle diameters: With an extrusion line width of 0.96 mm, a filling rate of 80%, a printing speed of 900 mm/min, and a filling structure of rectilinear, in accord with the results of preliminary experiments, different nozzle diameters were set for the same target model; these were set at 0.4 mm, 0.8 mm, 1.0 mm, and 1.5 mm in order to study the effect of nozzle diameter on the quality of printed samples.

2.3.4. Evaluation of 3D Printing Sample Molding Effect

Weigh the printed samples mentioned above and measure their corresponding dimensions with a vernier caliper. The molding effect is evaluated using the comprehensive completion rate (CCR), which includes two indicators: printing accuracy and quality index. The printing accuracy (P) is calculated based on the standard value S and actual value M of the printed samples; the sample quality is calculated using the quality index (Q), as shown below.
P = 100 ( M S ) S %
In Equation (1), P: printing accuracy, which mainly examines the length and height of the printed samples, %; S: standard value, the length and height dimensions of the printed standard piece, mm; M: actual value, the actual length and height dimensions of the printed samples, mm.
Q = 1 i = 1 n | W i W | n * W * 100
In Equation (2), Q: quality index, representing the percentage of product quality, %; W i : the weight of the i-th sample, g; W : the average weight of all samples, g; n: the number of samples evaluated.
The overall molding effect is evaluated using a comprehensive completion rate (CCR), including the two indicators of printing accuracy and quality index, as shown in Equation (3).
C C R = P + Q

2.3.5. Measurement of Texture Characteristics

The texture properties of the astragalus–starch mixed-gel 3D-printed samples were measured at the center using a texture analyzer. The samples were stored in a sealed space before testing. A cylindrical probe was selected, and the test parameters were set as follows: a 5 kg force sensor; pre-test speed, test speed, and post-test speed all at 1 mm/s; compression ratio of 25%; start trigger force of 5 g; and interval between two compressions of 5 s. The TPA (Texture Profile Analysis) indices recorded included hardness, elasticity, and adhesiveness.

2.3.6. Determination of Gel Deposition Rate

Take 3 g of the mixed-gel sample and place it in a beaker; add 30 mL of distilled water to mix evenly, and place it in a magnetic stirrer for heating in a water bath at 80 °C to prepare a 10% suspension. After it has been left standing for 1 h, centrifuge (7000 r/min, 10 min). The precipitate is then separated, and the supernatant discarded to obtain, using the calculation formula, the deposition rate (W), as shown in Equation (4).
W = W 1 W 0 W 0
In Equation (4), W: the deposition rate, indicating the degree to which particles precipitate from the solution, %; W 0 : the weight of the in the original sample, g; W 1 : the mass of the sediment after centrifugation, g.

2.3.7. Optimization of the Test Design of the Printing Process Response Surface

Single-factor tests were conducted to explore the optimal levels and ranges for filling rate, nozzle diameter, and printing speed, with the comprehensive completion rate (CCR) of the 3D-printed samples set as the response value. Based on this, a three-factor and three-level combination test design was performed to optimize the printing process parameters, with a total of 17 groups of tests. The test design scheme is shown in Table 1.

2.3.8. Printing Process Response Surface Optimization Test Design

Each group of experiments was repeated three times, and SPSS27.0 software was used to analyze the variance and levels of significance of the experimental data. The results were expressed as mean ± standard deviation (SD). Design Expert 13.0 software was used to analyze the response surface test. The Origin software platform (Design expert 13.0) was used to draw charts.

3. Results and Analysis

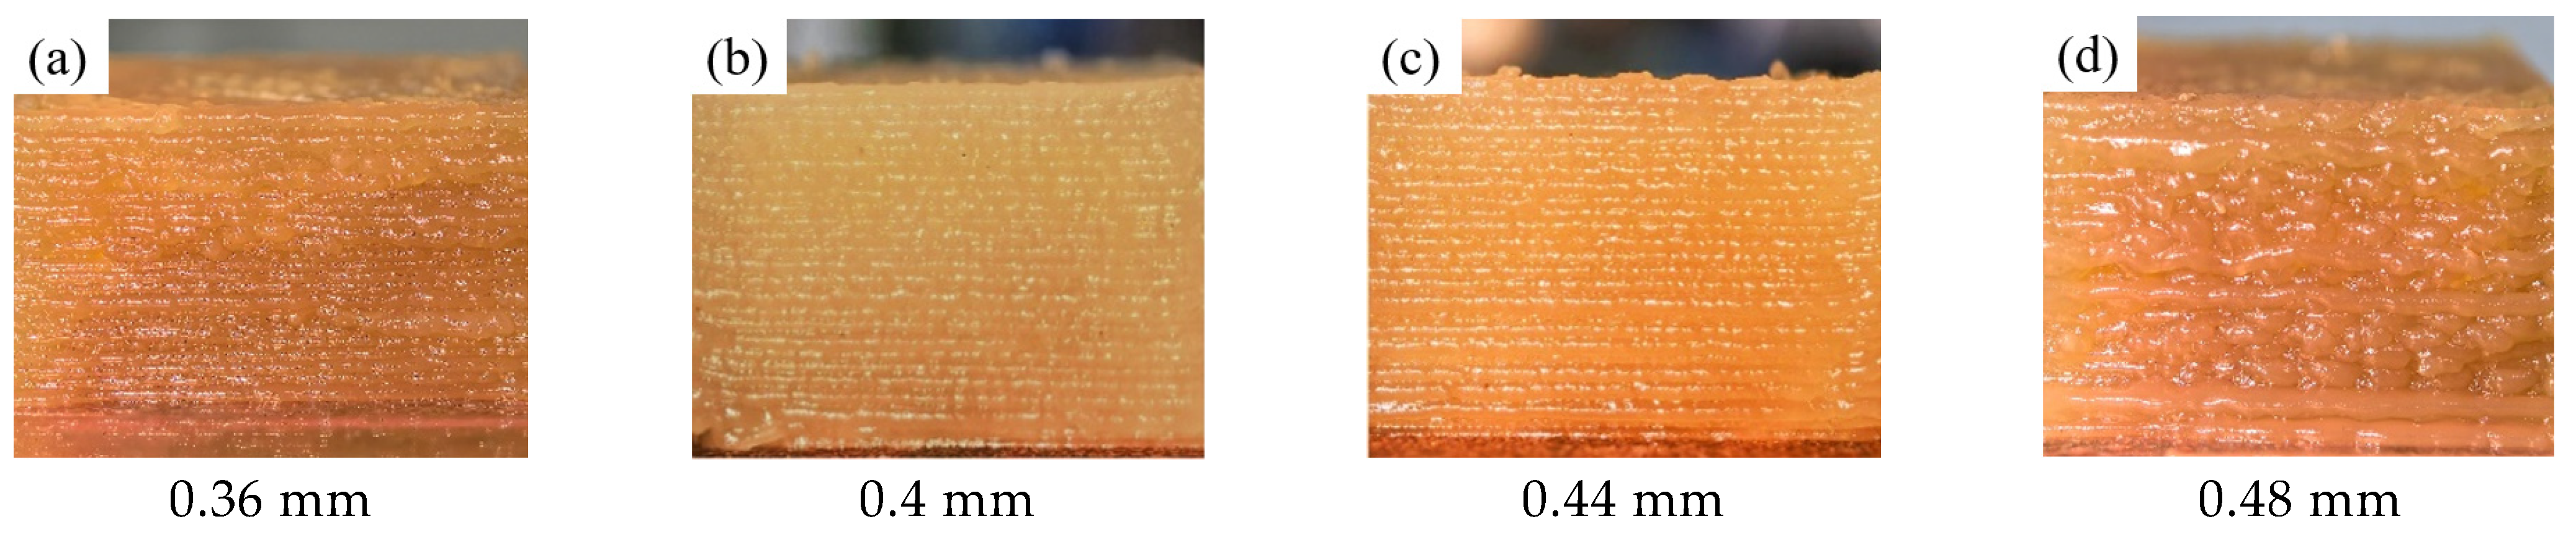
3.1. Determination of Printing Layer Height

The printing layer height primarily refers to the thickness of the material extruded and stacked along the Z-axis by the nozzle between the upper and lower layers during the printing process. The layer height significantly affects the precision of the printed samples. If the layer height is too high, the extrusion process cannot exert pressure on the lower layer, leading to sample collapse; if the layer height is too low, clogging or scraping may occur during extrusion, resulting in poor quality in the formed sample [21]. The 3D-printed samples with different layer heights under a nozzle diameter of 0.8 mm are shown in Figure 3.
As can be seen from Figure 3, the ratio of printing layer height to nozzle diameter significantly affects the printing precision and sample dimensions. When the printing layer height is 45% of the nozzle diameter (0.36 mm), the filling process results in accumulation and scraping, with the printed sample’s length and width being slightly greater than the standard values, but the height being slightly less than the standard value. When the printing layer height is 50–55% of the nozzle diameter (0.4 mm–0.44 mm), the printed sample achieves the highest precision and the clearest layer-definition. When the printing layer height is 60% of the nozzle diameter (0.48 mm), the extruded gel is affected by gravity and X/Y-axis acceleration during stacking, causing fluctuations upon stacking, leading to gel overflow; additionally, the printed sample’s length, width, and height are all greater than the standard values. Therefore, the optimal range for the layer-height-to-nozzle-diameter ratio is determined to be 0.5–0.55.

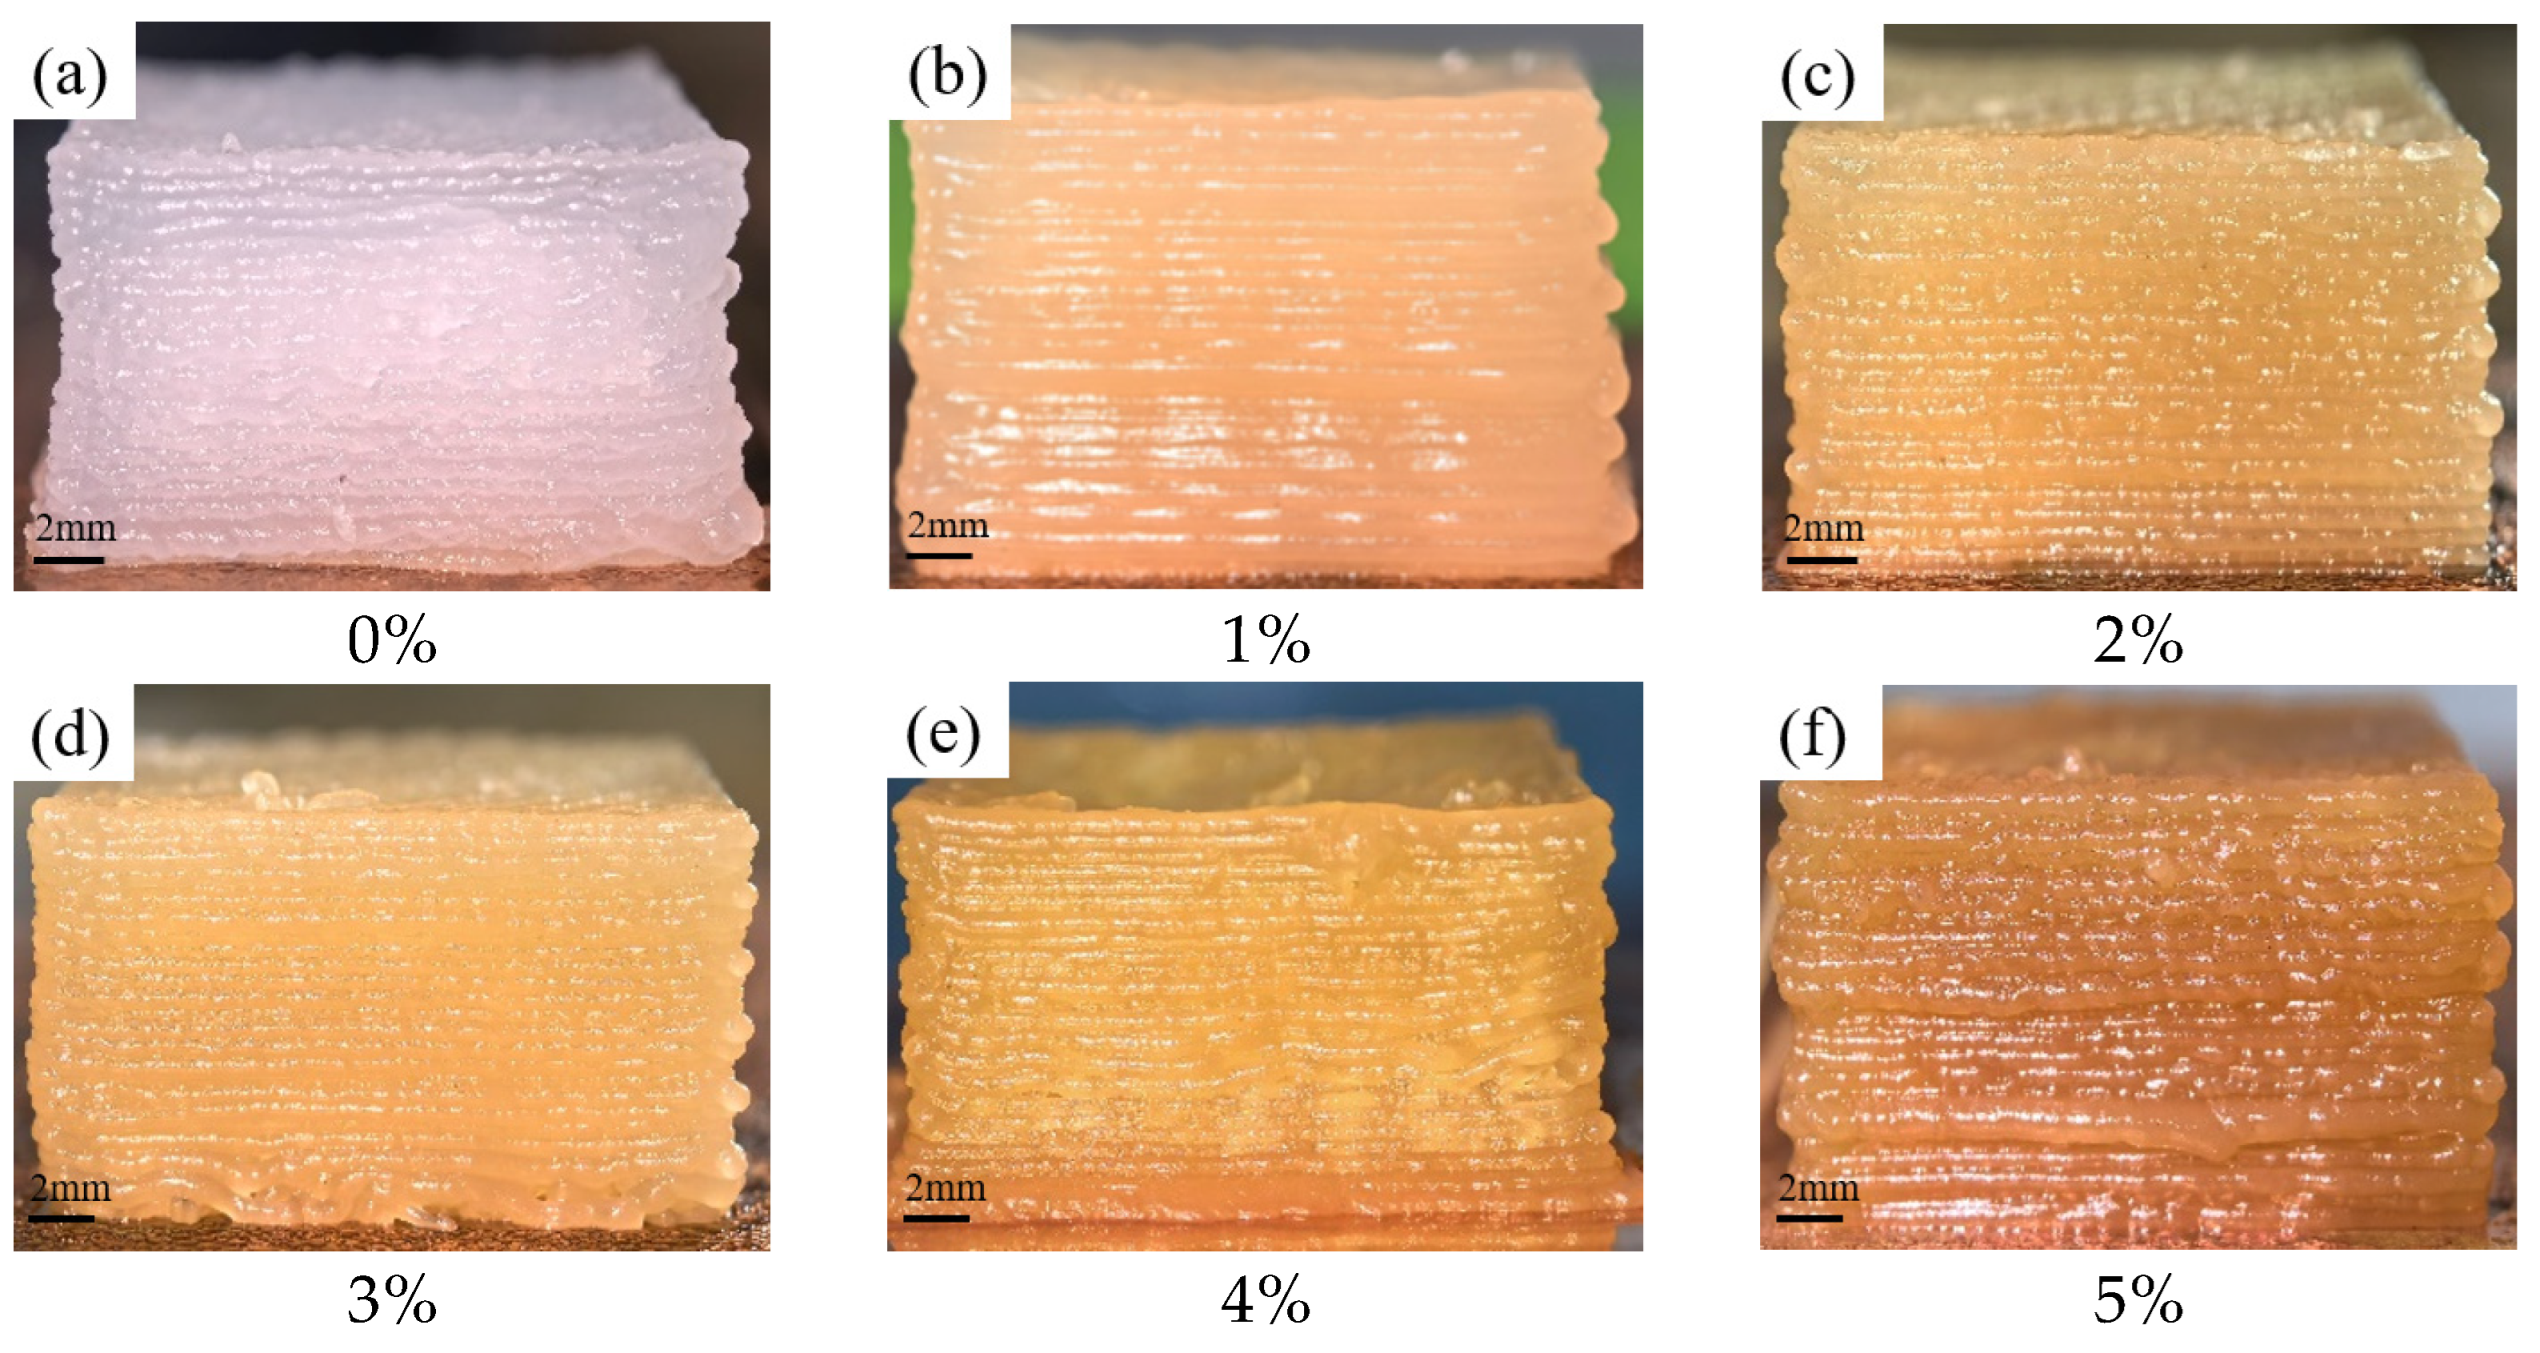
3.2. The Influence of Polysaccharide Content on the 3D Printing Performance of Astragalus–Starch Mixed Gels

Non-starch polysaccharides interact with starch through hydrogen bonding, and the addition of different concentrations of non-starch polysaccharides affects the printability of the mixed gel [22]. The printing effects of the Astragalus–starch mixed gel change under the influence of different amounts of astragalus polysaccharides. The 3D-printed samples with varying astragalus polysaccharide additions are shown in Figure 4.
From Figure 4, it can be observed that the precision of the printed samples follows a first increasing then decreasing trend. The sample in Figure 4a, without the addition of astragalus polysaccharides, exhibits a noticeable granular texture and is prone to clogging during printing. This may be due to the starch granules absorbing water and swelling during the water-bath process, which reduces the binding force between the particles, leading to a decrease in printing precision and overall completion rate; this phenomenon is consistent with current research results that use pure starch-based materials for 3D printing [23]. A high printing-precision is achieved when the concentration of astragalus polysaccharides is below 3%, as shown in Figure 4b. This is likely because the presence of astragalus polysaccharides competes for water molecules and restricts their movement, improving the rheological properties of the mixed gel and enhancing its stability [24]. This leads to improved printing smoothness and overall completion rate, a phenomenon consistent with the findings of Zheng [25], who discovered that polysaccharides and other substances form complexes with starch that strengthen the gel network’s cross-linking and optimize the 3D printing performance of the gel. When the polysaccharide concentration exceeds 3%, the printing accuracy decreases, as shown in Figure 4e,f. As the concentration of astragalus polysaccharide increases, the mixed gel gradually becomes more fluid, leading to a dilution of the gel during the extrusion and stacking process, along with edge overflow and a reduction in the comprehensive completion rate. This may be due to the fact that when the concentration of astragalus polysaccharide is too high, the intermolecular interactions become overly complex, leading to a tendency of the network structure to be disrupted and a decrease in gel stability. Therefore, based on single-factor exploration, a 2% astragalus–starch mixed gel is selected as the printing ink.

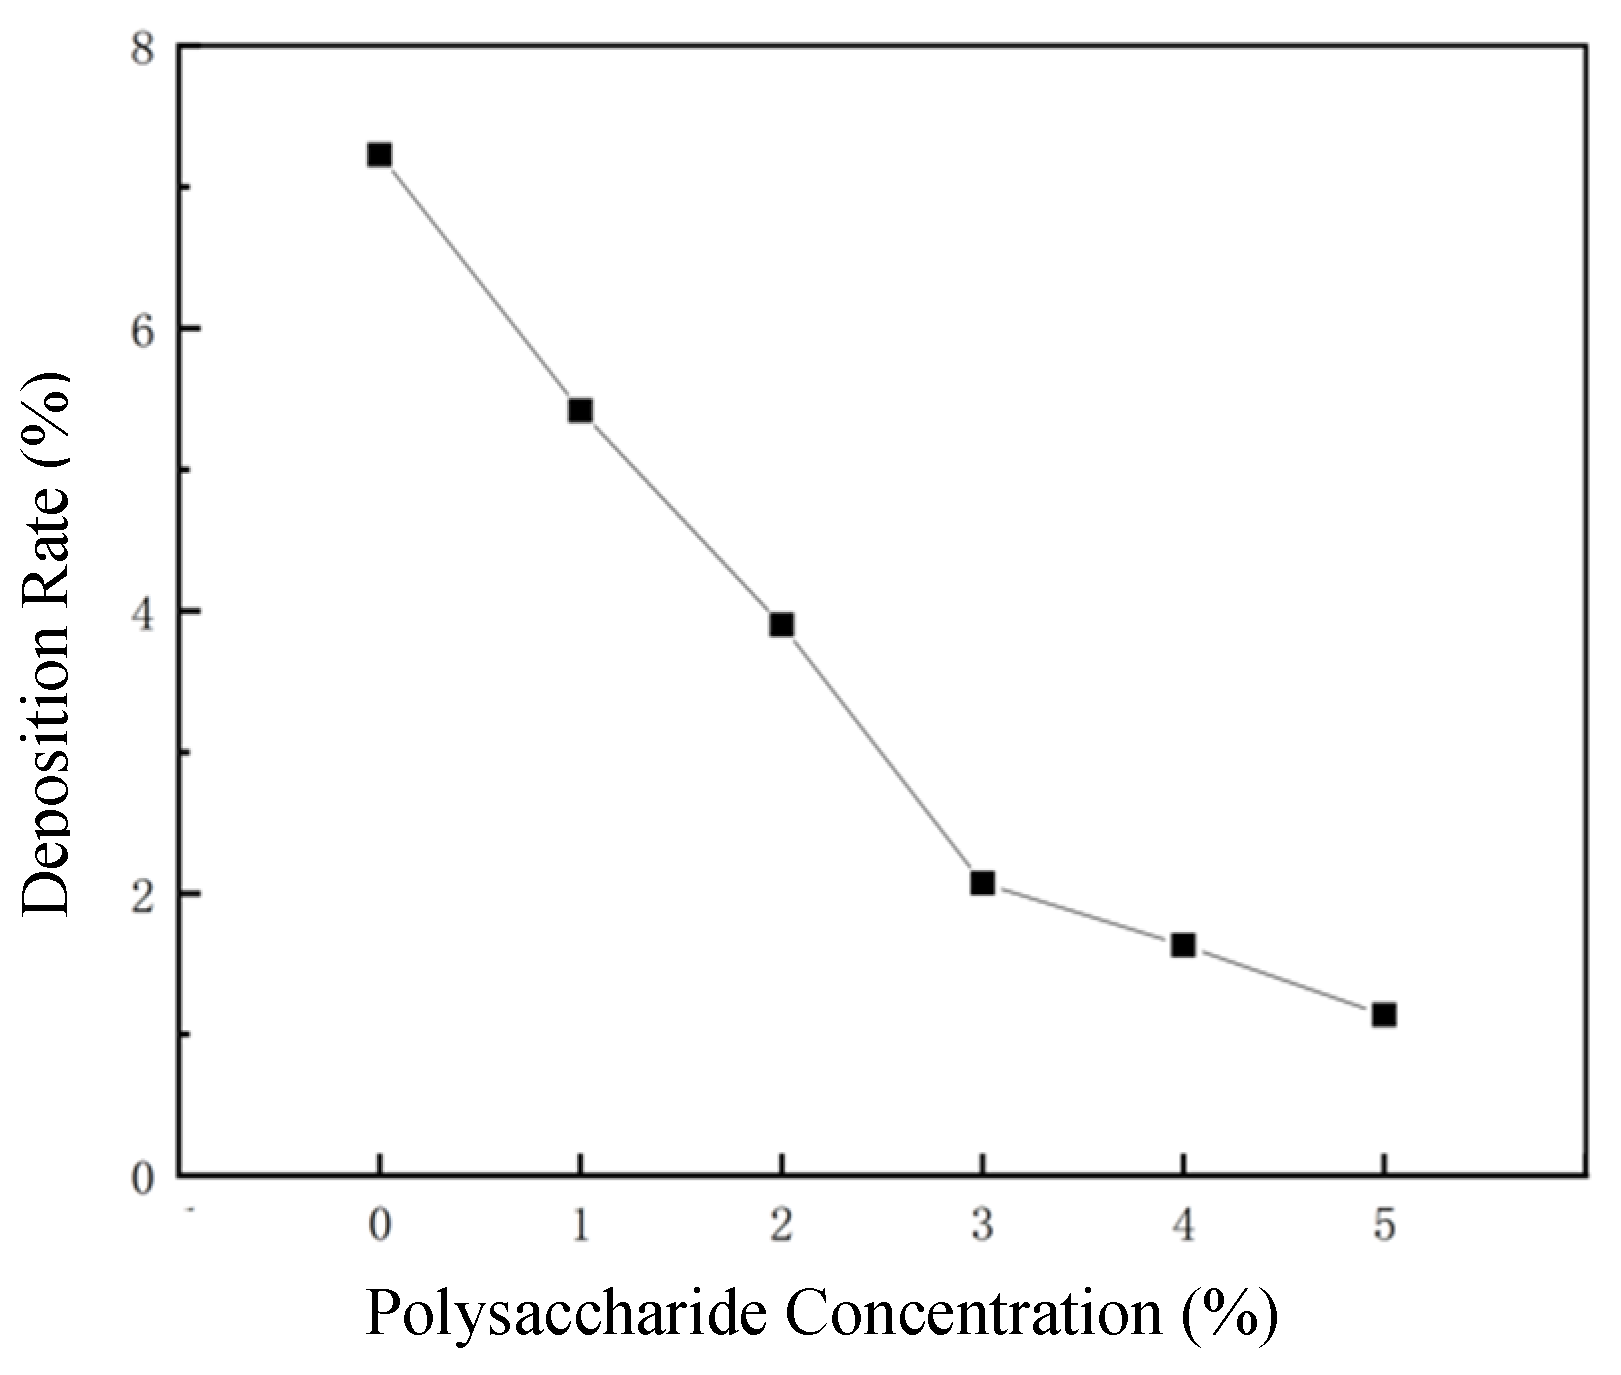
3.3. The Impact of Polysaccharide Content on the Deposition Rate of Astragalus–Starch Mixed Gels

Different concentrations of mixed gels affect the stacking effect and formation rate in 3D printing, with starch polysaccharides and non-starch polysaccharides mainly connected through hydrogen bonds, and exhibiting different retrogradation phenomena [26]. The deposition rate can assess the rheological properties and product quality of starch and its derivatives in the food industry [27]. Figure 5 illustrates the variation in the deposition rate of the mixed gel at different concentrations of astragalus polysaccharides.
As shown in Figure 5, the deposition rate of the printed samples significantly decreases with the increase in astragalus polysaccharide concentration. This may be because the addition of astragalus polysaccharides encapsulates the starch granules, inhibiting their swelling and resulting in a lower deposition rate [22]. Astragalus polysaccharides have high hydrophilicity, and as their concentration increases, they can form hydrogen bonds with water molecules, thereby enhancing the interaction between water and starch molecules. This interaction may lead to a reduction in the aggregation of starch molecules, decreasing the deposition rate and increasing the viscosity of the printed samples [28]. During the 3D printing process, pure wheat starch may expand upon extrusion, leading to the formation of clumps of starch granules in the filling layer and surface, affecting the uniformity of the printing layer and reducing printing accuracy. The addition of astragalus polysaccharides can inhibit the swelling of starch granules, making the extrusion process smoother and thus improving printing accuracy. However, when the polysaccharide concentration exceeds 3%, the gel becomes too diluted, which is not conducive to 3D printing formation. The variation in sedimentation rate is consistent with the actual performance of the 3D-printed samples, indicating that within a certain concentration range, non-starch polysaccharides enhance the gel structure through intermolecular interactions, thereby optimizing the 3D printing performance of starch polysaccharides. However, when the concentration exceeds a certain threshold, the gel structure may be compromised. Therefore, the optimal concentration range for astragalus polysaccharide is determined to be between 1% and 3%.

3.4. The Influence of Polysaccharide Content on the Textural Properties of Astragalus–Starch Mixed-Gel 3D Printing Samples

The textural properties of the mixed gel can reflect the physical characteristics after the gel has been formed, and in food, they can manifest as hardness, viscosity, and elasticity [29]. Elasticity reflects the ability of the mixed gel to recover within a certain period after being fully compressed. Hardness is the positive compression pressure required for the probe to compress the sample, which can also represent the elasticity of the printed sample at the initial compression. Viscosity can reflect the flowability of the mixed gel and will also affect its taste. The changes in hardness (g), viscosity (g), and elasticity (mm) with the concentration of polysaccharides are shown in Figure 5.
From Figure 6, it can be observed that the hardness, viscosity, and elasticity of the mixed gel all exhibit an increasing trend, which is consistent with the research findings of Cong [24]. The increase in viscosity may be due to the disruption of the ordered structure of wheat starch, in which amylose interacts with astragalus polysaccharides through hydrogen bonding and electrostatic forces [30,31]. The overall increase in elasticity is relatively small, with a slight enhancement in its compression recovery ability, possibly because the network structure of the mixed gel is strengthened, promoting the infiltration of free water into the gel network and transforming it into water that is less mobile [32]. The trend of increasing hardness is in line with the research results of Liu [33], possibly because the linear structure and branched segments of wheat starch interact with astragalus polysaccharide molecules, strengthening intermolecular hydrogen bonds and promoting the formation of an ordered structure [34].The overall upward trend in the texture testing results is attributed to the enhanced stability and compactness of the gel’s network structure after storage in a sealed space; it thereby exhibits higher hardness, stickiness, and elasticity in the texture tests [35].

3.5. The Impact of Single-Factor Parameters on the Precision of Printed Samples

3.5.1. The Influence of Fill Rate on the Precision of Printed Samples

The fill rate refers to the percentage of the internal filling of the sample, and its level affects the mechanical properties and appearance of the printed samples. A low fill rate can lead to a loose internal structure and even to collapse, while an excessively high fill rate can cause surface bulging and excessive internal stress, leading to sample deformation, and ultimately affecting the sample’s formation state [36]. The effects of different fill rates on 3D-printed samples are shown in Figure 7.
From Figure 7, it can be seen that when the fill rate is below 80%, as shown in sub-figures (a) to (c), due to insufficient internal support, the printed samples deform during the stacking process, resulting in poor stacking effects and a final formation state that is below standard values. When the fill rate is above 80%, as shown in sub-figures (e) and (f), there is a slight accumulation of gel during printing, leading to an expanded final formation state. When the fill rate is 80%, as shown in sub-figure (d), the printing precision is the highest. This may be because under this condition, the internal structure of the printed part has sufficient support to maintain stability while avoiding the problem of material accumulation. Additionally, a fill rate of 80% may provide a good balance for the printed samples, taking into account both printing efficiency and formation quality, and thus yielding the optimal fill rate of 80%.

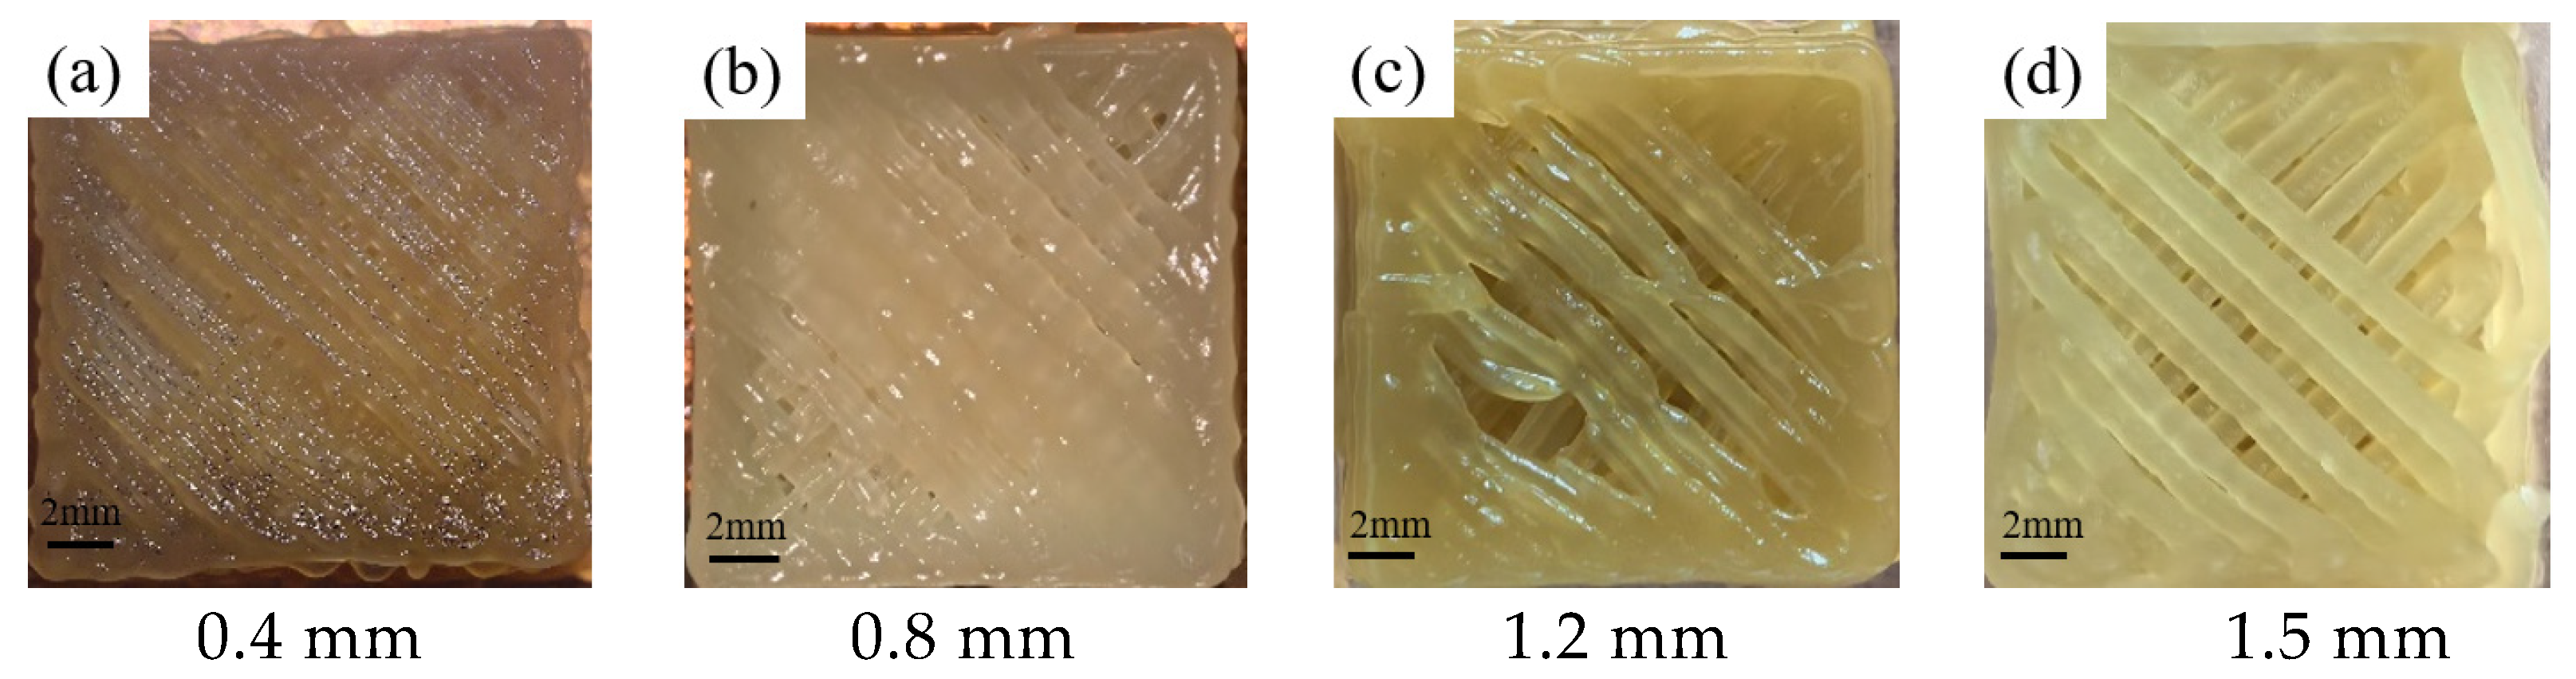
3.5.2. The Influence of Nozzle Diameter on the Precision of Printed Samples

Nozzle diameter is a key factor in determining the precision of 3D-printed samples, and is directly related to print clarity, the consistency of gel extrusion, and the overall stability of the printing process. A smaller nozzle diameter is conducive to enhancing the clarity of the printed samples, but it also requires the use of finer materials and increases the time required for printing [37]. The effects of different nozzle diameters on 3D-printed samples are shown in Figure 8.
From Figure 8, it can be seen that when the nozzle diameter is greater than 0.8 mm, as shown in Figure 8c,d, the interlayer gaps are too wide. This may be due to the large nozzle diameter, which cannot provide sufficient gel for filling and connection during the printing process, thus affecting the precision and surface quality of the printed samples. When the nozzle diameter is 0.4 mm, as shown in Figure 8a, the print surface is fine, but the extrusion pressure under this nozzle condition is very high, and the printing time and platform cooling time are too long, increasing machine wear. When the nozzle diameter is 0.8 mm, as shown in Figure 8b, the molding effect is good, the interlayer connection is tight without gaps, and it is not easy to clog the nozzle, which can balance printing precision and printing efficiency to achieve good molding quality. Therefore, the optimal nozzle diameter is determined to be 0.8 mm.

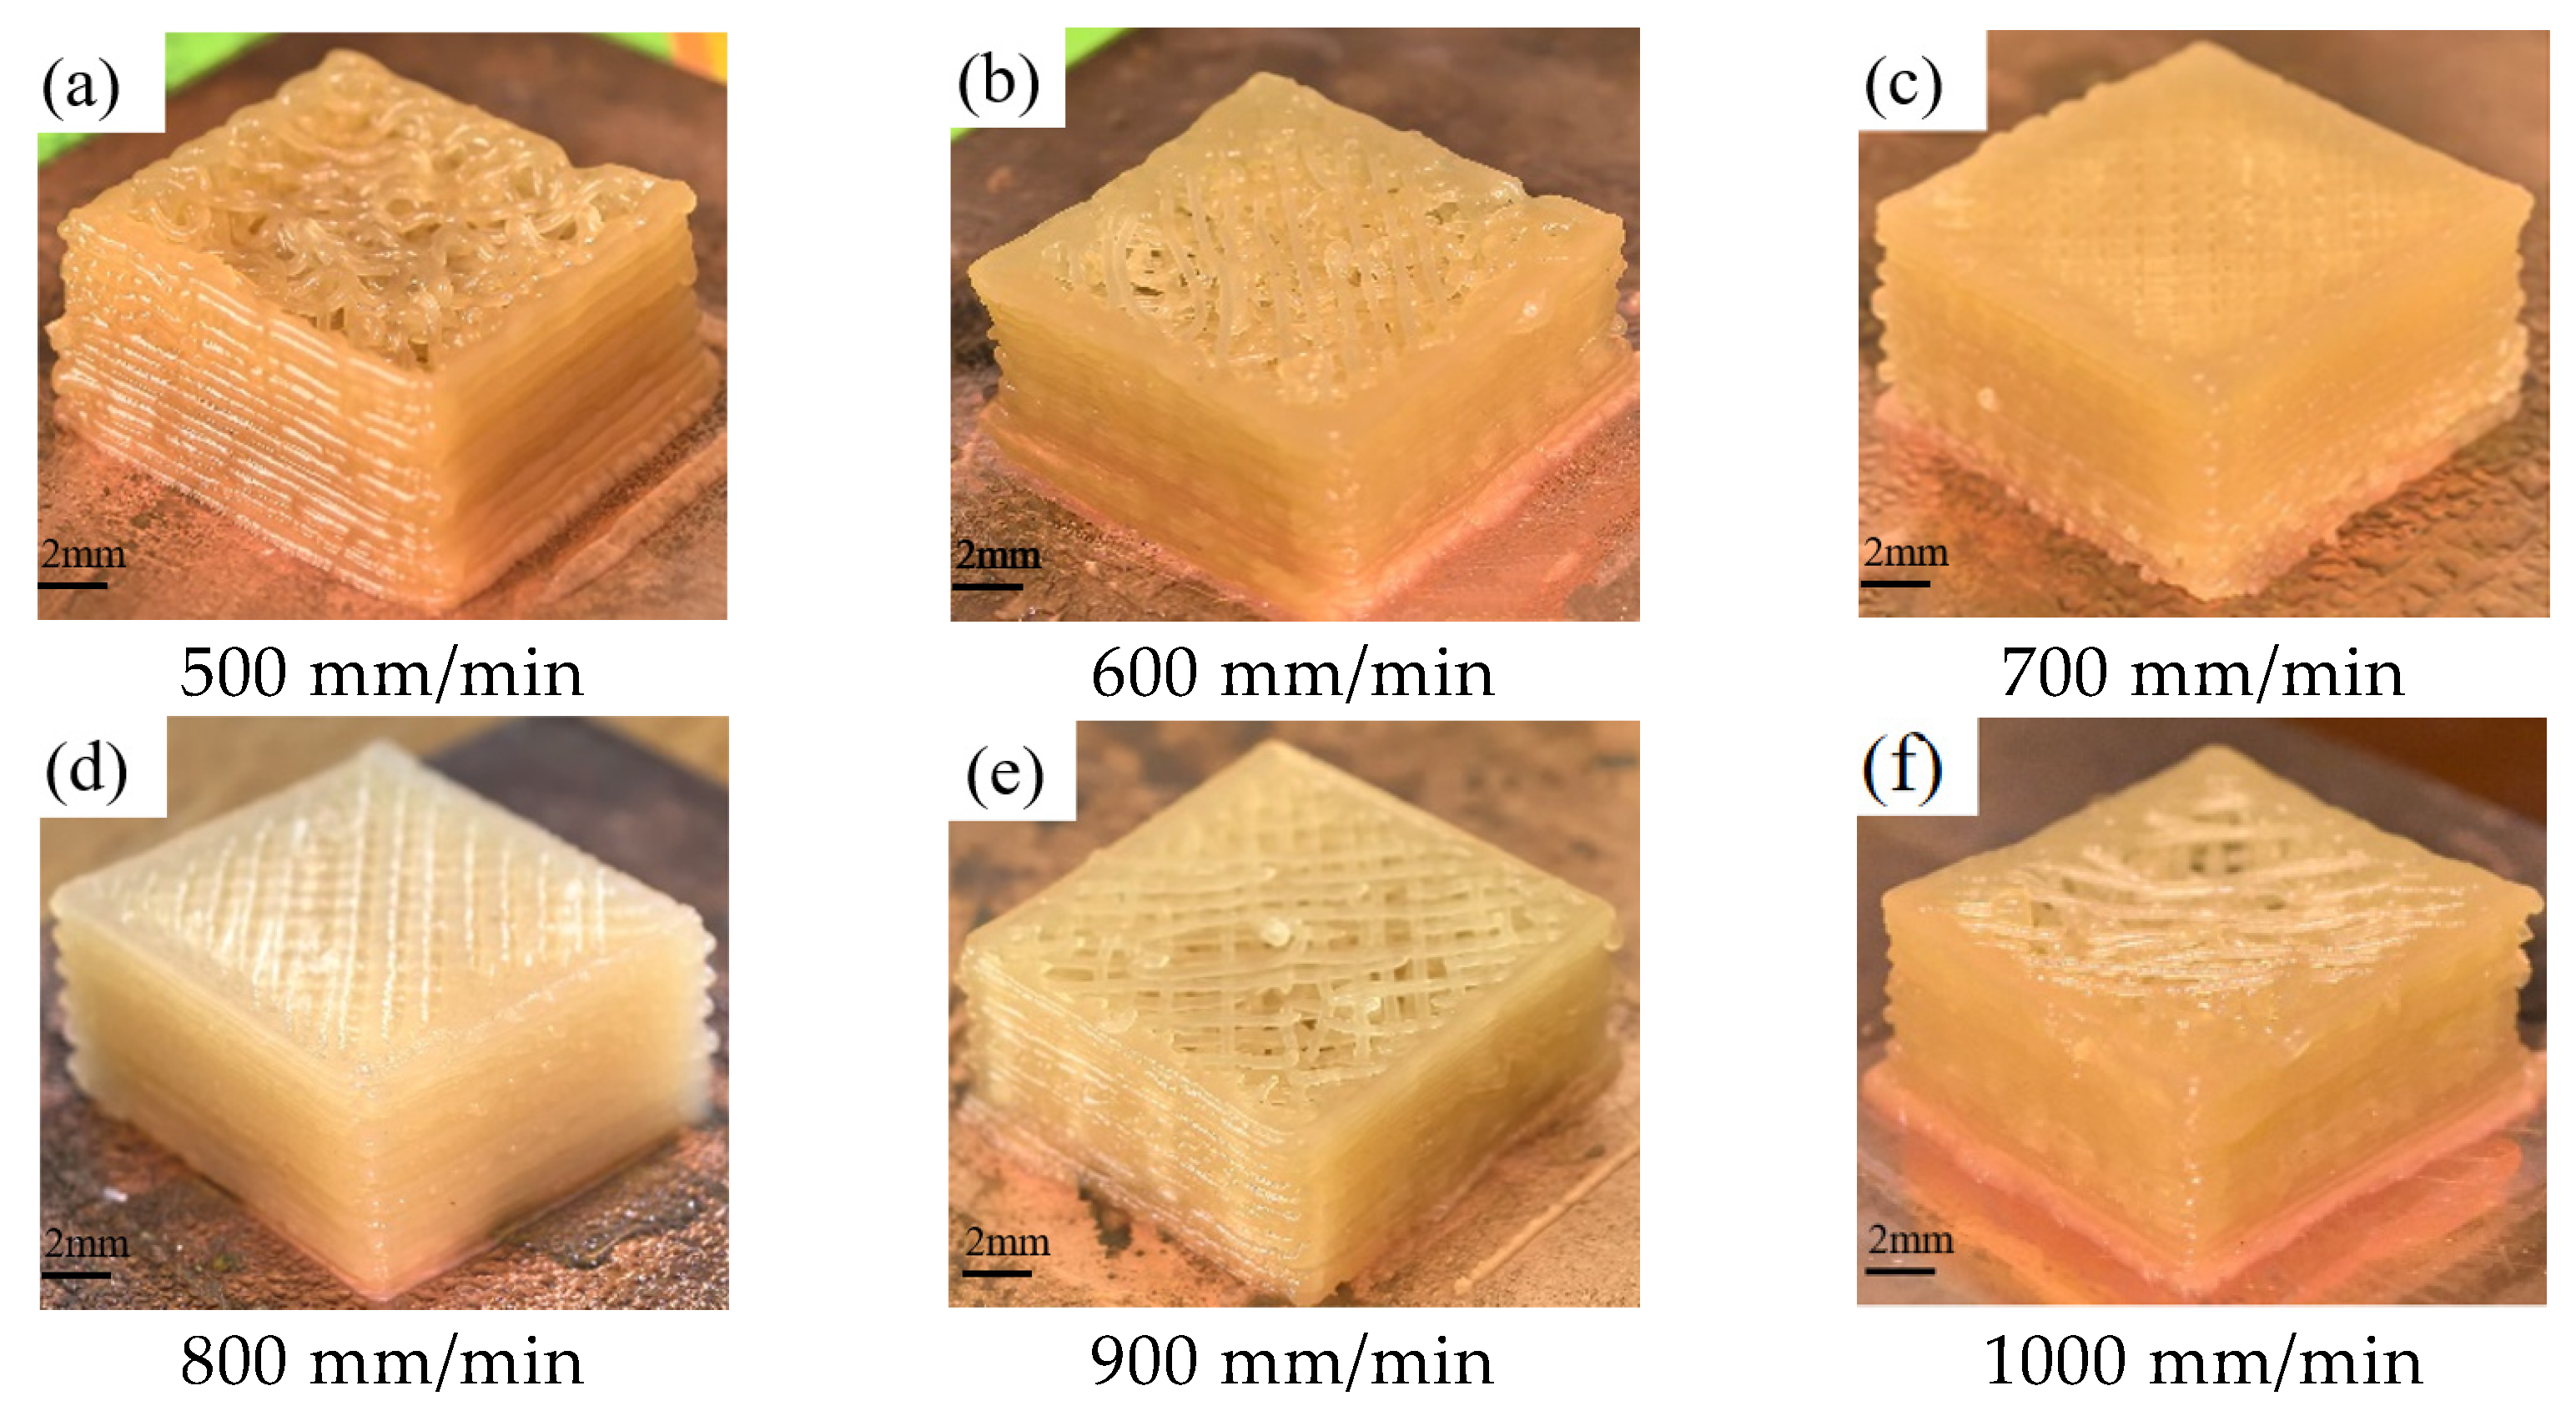
3.5.3. The Influence of Printing Speed on the Precision of Printed Samples

Printing speed refers to the movement speed of the 3D printer’s nozzle and is closely related to the extrusion rate of the gel. With a constant extrusion rate, an inappropriate printing speed can lead to a reduction in molding precision. The effects of different printing speeds on 3D-printed samples are shown in Figure 9.
From Figure 9, it can be seen that when the printing speed is less than 700 mm/min, as shown in Figure 9a,b, the printing speed is too slow, and the extruded gel has more time to fall on the deposition platform, causing the gel to accumulate and the filling layer to appear in a filamentous spiral. At printing speeds of 700 mm/min and 800 mm/min, as shown in Figure 9c,d, the printing speed is moderate, the gel material is complete, the surface is smooth, and the molding state is good. When the printing speed is greater than 900 mm/min, as shown in Figure 9e,f, the printing speed is too fast, and the extruded material is discontinuous between layers due to insufficient supply, severely affecting the molding quality. Therefore, the optimal printing speed is determined to be between 700 mm/min and 800 mm/min.

3.6. Response Surface Optimization Test Design and Results and Response Surface Model

3.6.1. Response Surface Test Design and Result Analysis

The aforementioned single-factor experiments determined the optimal levels and ranges of the printing parameters studied, with printing speed (A), filling rate (B), and nozzle diameter (C) as independent variables, and the comprehensive completion rate of the printed samples as the response value. The designed response surface test table is shown in Table 2.
Using the comprehensive completion rate of the printed samples as the response value, the data obtained from the response surface test were analyzed using multiple regression fitting analysis, resulting in a binary regression model equation:
C C R = ( 99.34 0.165 A 0.08 B 0.27 C 0.23 A B + 0.77 A C 0.2775 B C 0.63 A 2 0.93 B 2 0.46 C 2 ) %
The variance analysis (ANOVA) in the Design-Expert 13.0 software was used to test the significance of each coefficient in the equation, and the resulting regression-model variance analysis table is shown in Table 3 below. The F-value in the table represents the significance of the entire fitting equation, a value which can judge the degree of influence of the printing parameters (printing speed, filling rate, and nozzle diameter) on the response value (comprehensive completion rate), and the magnitude of the value is directly proportional to the degree of fit, resulting in an order of influence of printing parameters on the comprehensive completion rate of the printed samples of nozzle diameter (C) > printing speed (A) > filling rate (B). The p-value represents the probability that the factor has no significant effect on the test results. The model’s p < 0.0001 indicates a highly significant difference, and the lack of fit item p = 0.1427 > 0.05, indicating that the equation fits well with the actual situation. From the significance analysis of the P-value, it is known that AC, A2, B2, and C2 have a highly significant effects on the comprehensive completion rate of the printed samples (p < 0.01), BC has a significant effect, and the rest have no significant effect (p > 0.05). The adjusted determination coefficient R2Adj of the model is 0.9857, indicating that 98.57% of the test data can be explained by this equation, and the determination coefficient R2 is 0.9937, indicating that the regression equation fits well, has a small error, and can determine the optimization range of printing parameters in the 3D printing process.

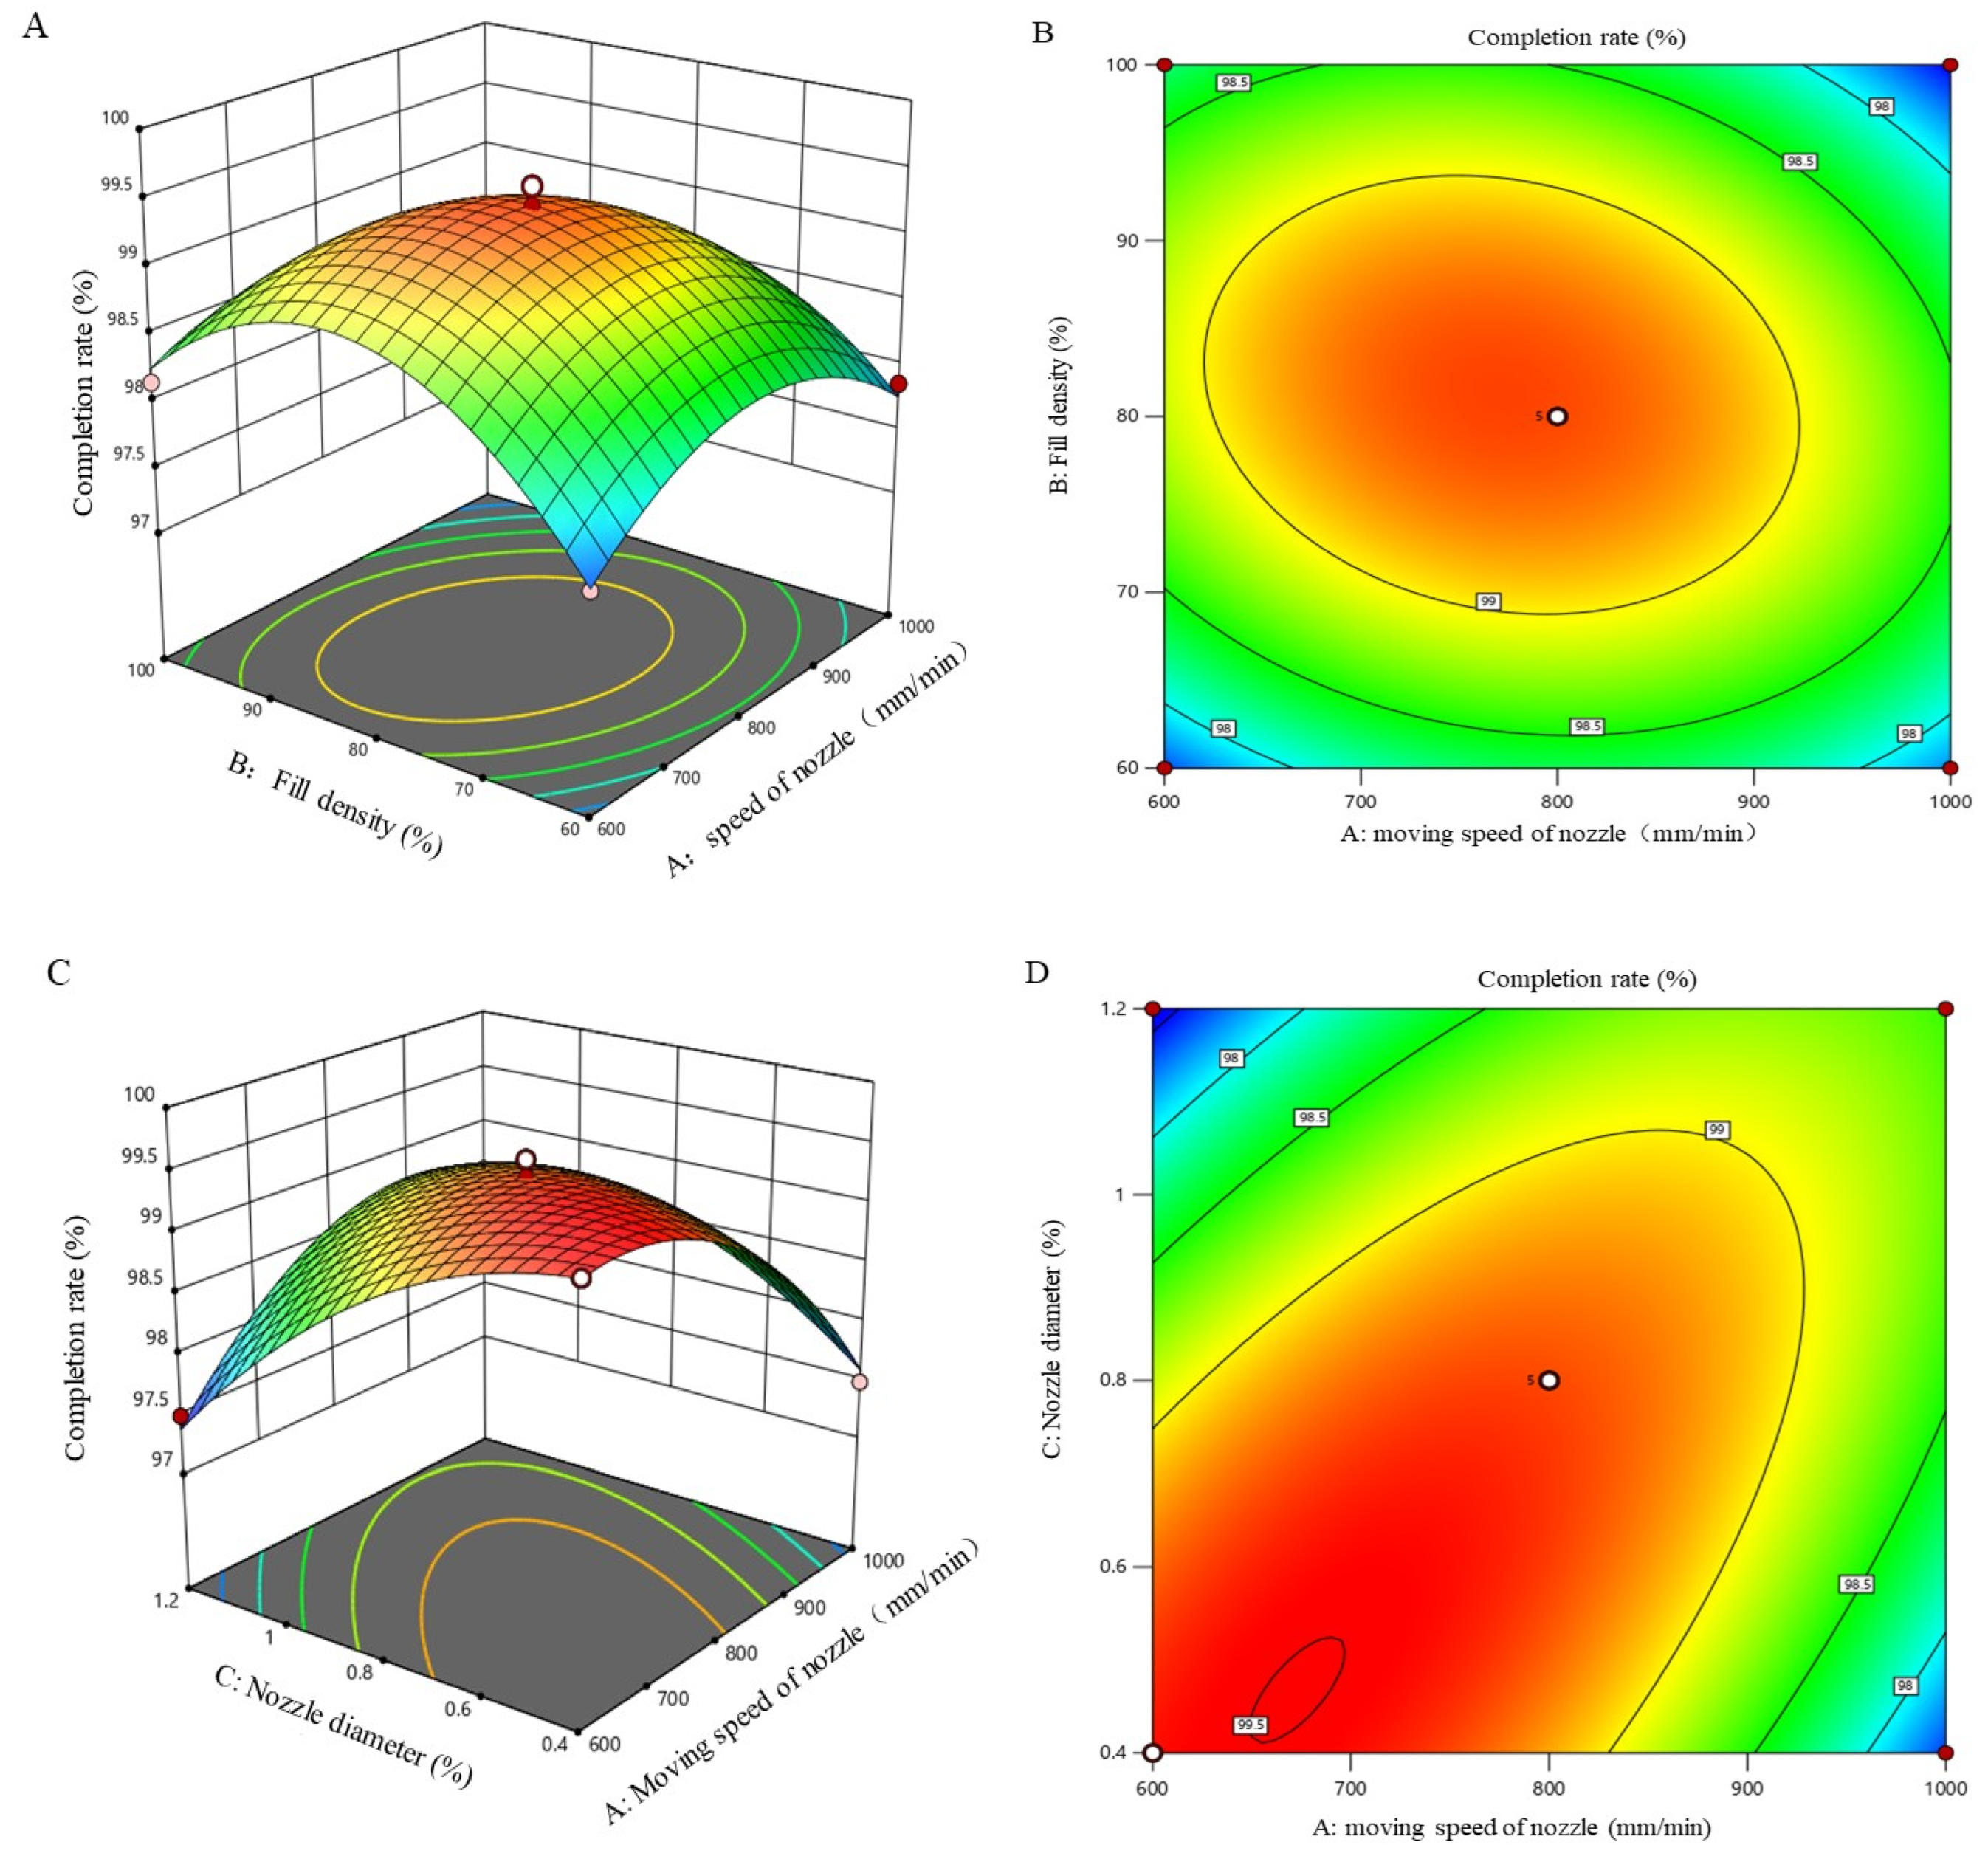
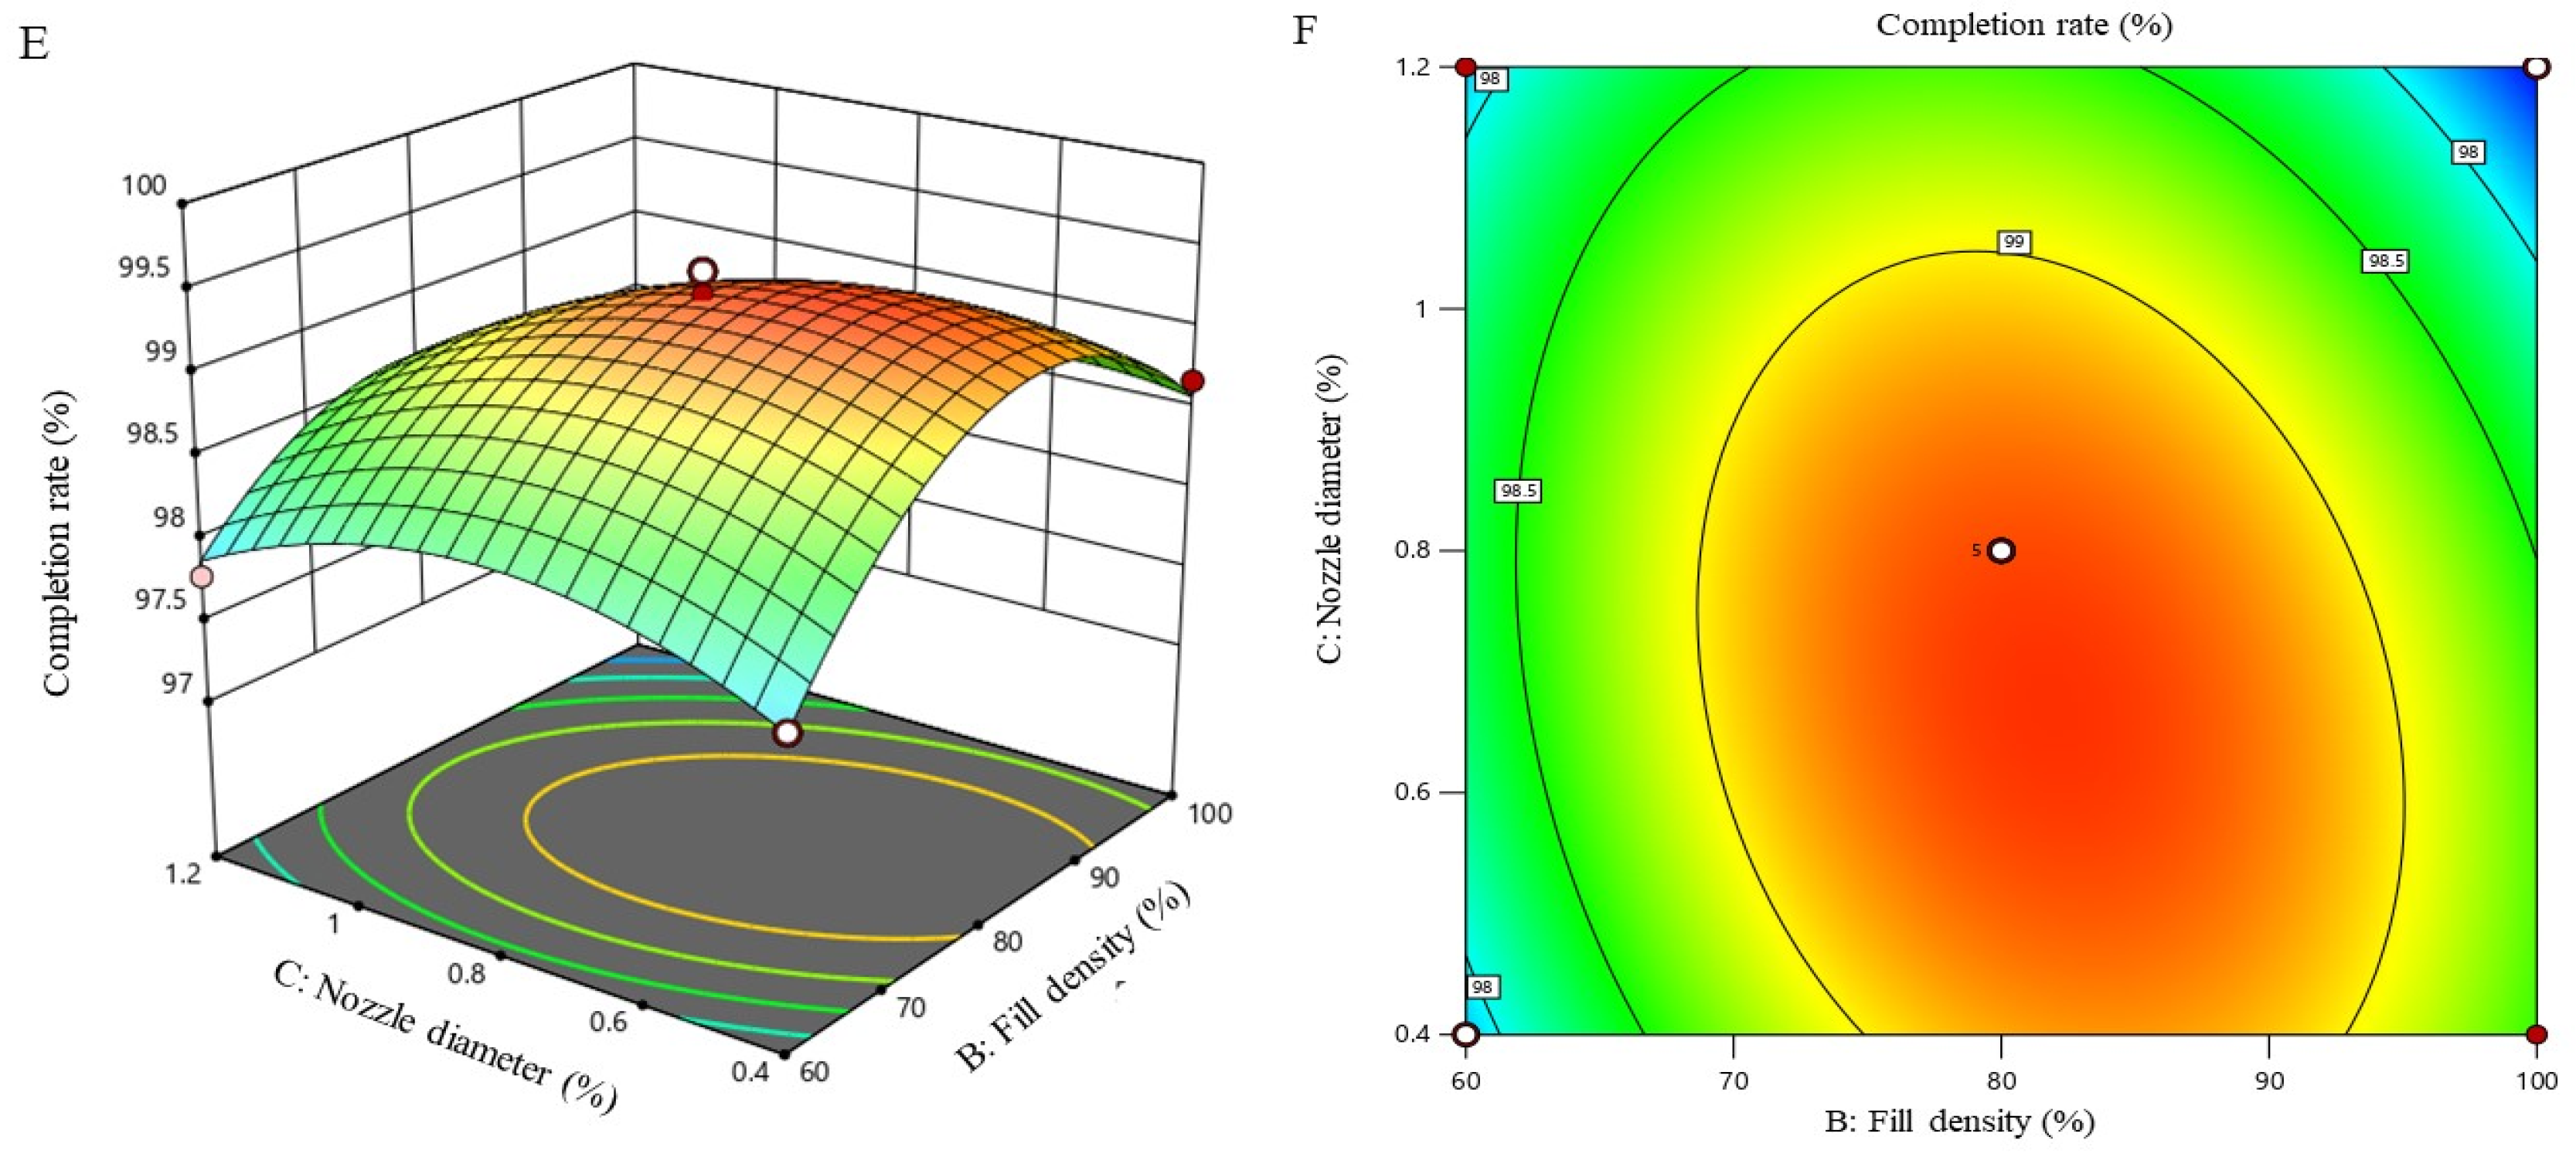
3.6.2. Response Surface Analysis and Determination of Optimal Printing Parameters

The relationship between printing parameters and the comprehensive completion rate (CCR) is not a simple linear relationship, but may exhibit extreme value characteristics [38]. Through contour plots and response surface plots (as shown in Figure 10), the interactive effects of printing parameters (printing speed A, filling rate B, and nozzle diameter C) on the CCR of the printed samples can be visually displayed. The contour plot and response surface plot of the interactive effects of printing parameters on the comprehensive completion rate of the printed samples are shown in Figure 10. The response surface diagram provides a visual representation of the interactive effects of printing parameters in the study, which helps to identify the optimal parameter combination for CCR under specific conditions. The contour plot further reveals the significance of the interaction between two parameters. Specifically, the elliptical shape of the contour lines indicates a significant interaction between the two factors, while contour lines close to a circular shape indicate a relatively weaker interaction [39,40].
As can be seen from Figure 10, the contour plot between nozzle diameter and printing speed shows steep curves, indicating a highly significant interaction. The effect between nozzle diameter and fill rate is significant, while the mutual influence among other factors is not significant. The ranked impacts of printing parameters on the sample completion rate, determined by intensity, are nozzle diameter, printing speed, and fill rate; this is a finding that is consistent with the results of the analysis of variance. During the 3D printing process, the performance and configuration of the printer directly affect print quality. The lab-made 3D food printer used in this experiment is suitable for small-scale applications such as households, with a relatively small print volume, and the mixed gel used possesses flexibility and elasticity. Therefore, even with a lower fill rate, the shape and surface quality of the printed samples can still be well maintained, and without changes in their mechanical properties; printing speed affects interlayer adhesion, while nozzle diameter determines layer thickness and path width, and the interplay of these factors significantly impacts the printing outcome.

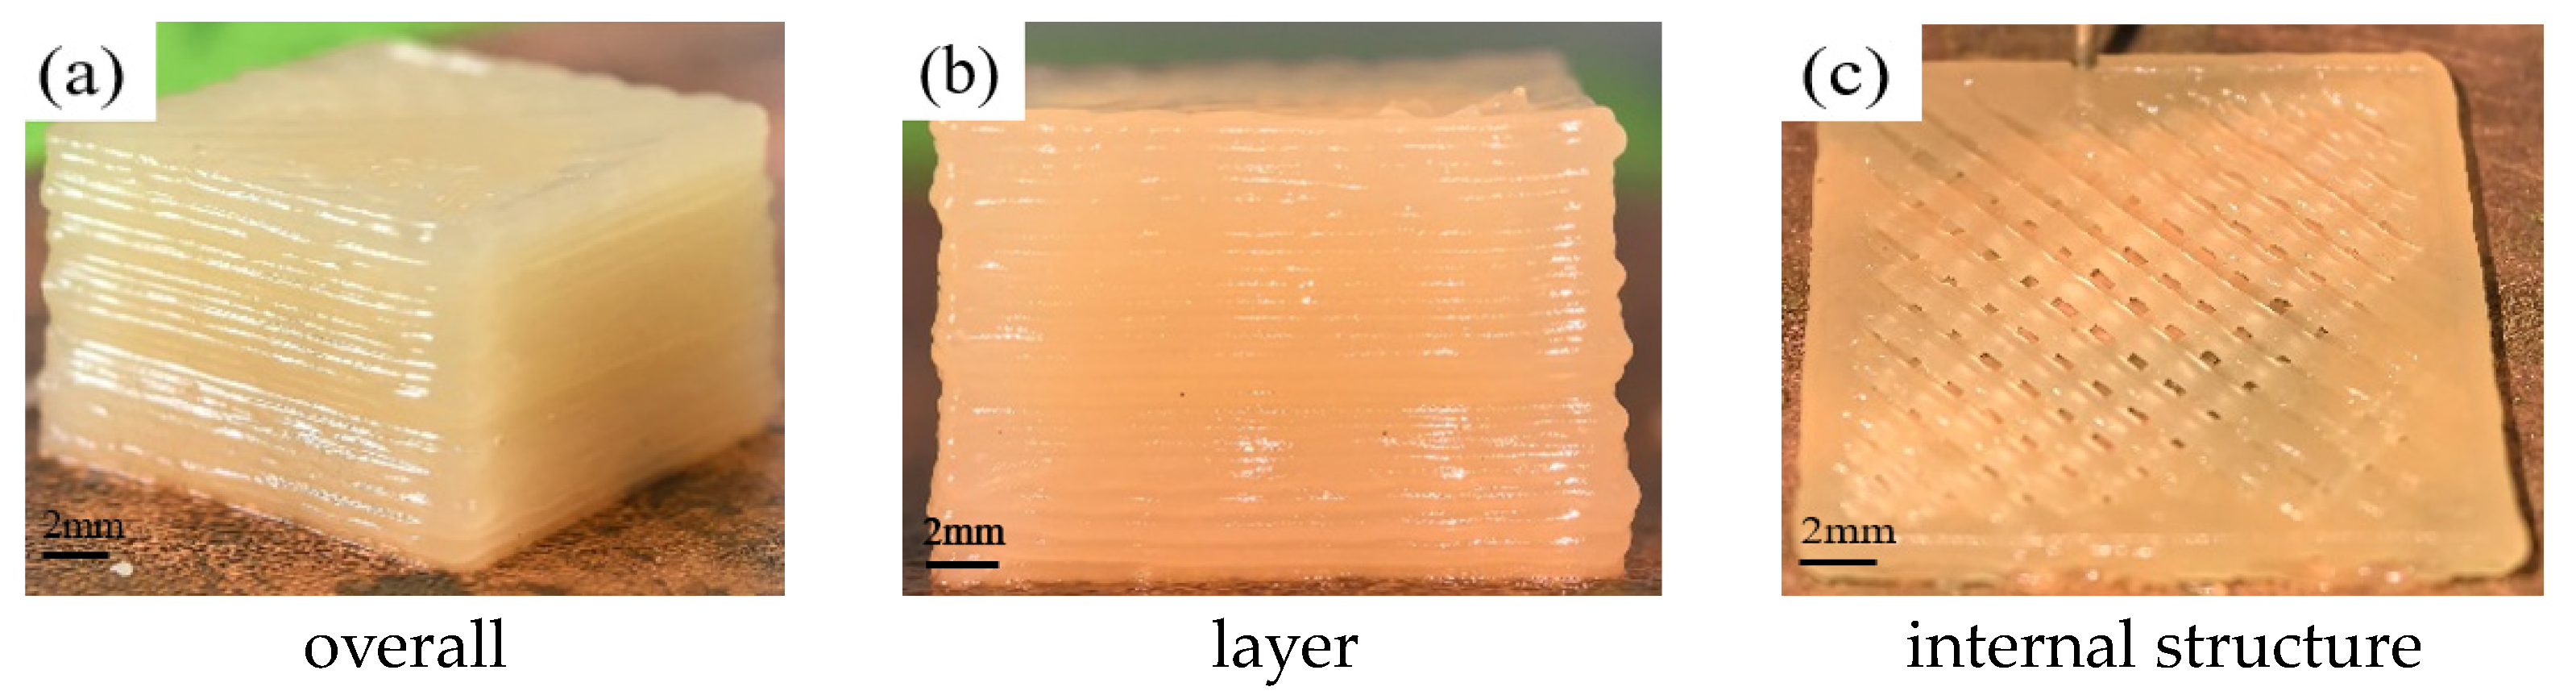
3.6.3. Verification of Optimal Printing Parameters

To verify the accuracy of the experimental predictions, an astragalus–starch hybrid gel with a 2% content of astragalus polysaccharides was used for printing tests, with the printing model being a cuboid of 21 * 21 * 10 mm3 dimensions. Considering practical conditions, the optimal printing process parameters were adjusted to the following: a nozzle diameter of 0.6 mm, a printing speed of 767 mm/min, a filling rate of 83%, an extrusion line width set to the default change, a deposition platform temperature of 5 °C, and a rectilinear filling structure. The resulting 3D-printed sample is shown in Figure 11. Measurements and calculations reveal that the comprehensive completion rate (CCR) of the printed samples is 99.52%, which is close to the predicted value, indicating that the parameter settings derived from this model can effectively enhance the precision of the printed samples.
The aforementioned verification experiments were conducted using the optimally blended gels. To substantiate the reliability of the conclusions, additional printing tests were performed under the same conditions using a mixed gel with 3% astragalus polysaccharide (3%) and pure wheat starch (0%) as printing materials. The results of the printing tests are depicted in Figure 12.
Measurements and calculations indicate that the comprehensive completion rate (CCR) of the printed samples with a 3% astragalus polysaccharide mixed gel is 99.34%, which is close to the predicted value. The CCR of the printed samples using pure wheat starch is 97.12%, slightly lower than the predicted value. However, the samples made from pure wheat starch exhibit a reduction in the edge overflow phenomenon of the cubic shape, demonstrating the highest CCR. This suggests that under the optimal printing process parameters, the precision of the printed samples has been effectively enhanced.

4. Conclusions

This study is based on a lab-developed pneumatic-extrusion condensation 3D food printer; it conducted a systematic investigation on different compounding ratios of astragalus polysaccharides and wheat starch. Through experiments, the astragalus–starch hybrid gel was successfully prepared, and the printing process parameters were optimized using single-factor analysis and response surface methodology. The main conclusions of the study are as follows:
(1) The impact of astragalus polysaccharide content on printing effects: The content of astragalus polysaccharides is a key process parameter affecting the comprehensive completion rate (CCR) of 3D-printed samples of astragalus–starch hybrid gel. As the concentration of astragalus polysaccharides increases, the deposition rate decreases. The experimental results indicate that the stacking and printing effects of the hybrid gel are optimal at an astragalus polysaccharide content of 2%. Additionally, the optimal printing effect is achieved when the ratio of nozzle diameter to layer height is between 0.5 and 0.55.
(2) Optimization of printing parameters: Through single-factor experiments, the test levels were determined to be a filling rate of 80%, a nozzle diameter of 0.8 mm, and a printing speed between 700 mm/min and 800 mm/min. Using the comprehensive completion rate (CCR) as the response value, a response surface optimization test was conducted. The optimization results show that the importance order of the parameters affecting the printing effect is nozzle diameter, printing speed, and filling rate. The optimal printing process parameters determined include the following: the nozzle diameter was 0.6 mm; the CCR of the printed samples reached 99.52%, which deviates only a little from the predicted printing speed of 767 mm/min; and the filling rate was 83%. Under these parameter settings and values, the effectiveness of the optimization method was verified.
The present study not only provides a scientific foundation for the 3D printing of astragalus–starch hybrid gels but also offers new perspectives and methodologies for the advancement of 3D food printing technology. Future research will delve deeper into the analysis of 3D printing outcomes and expand the scope of investigation into astragalus–starch hybrid gel materials. Key focuses will include elucidating the relationship between the textural properties and microstructure of the hybrid gels, as well as assessing the digestive efficiency of these gels in the human body. Through these endeavors, we aim to gain a more profound understanding of how astragalus polysaccharide concentration affects the functional characteristics of wheat starch and to facilitate the application of starch and non-starch polysaccharides in practical food processing.

Author Contributions

Conceptualization, L.T.; Methodology, L.T.; Software, L.T. and X.H.; Validation, L.T.; Formal analysis, S.Z.; Investigation, L.T.; Resources, G.X. and X.H.; Writing—original draft, L.T.; Writing—review & editing, L.T. and S.Z.; Visualization, S.O.; Project administration, G.X.; Funding acquisition, G.X. All authors have read and agreed to the published version of the manuscript.

Funding

This research received no external funding.

Data Availability Statement

Data is contained within the article.

Conflicts of Interest

Author Xiangyang Hao was employed by the company CAS&GD Metal Material Development Co., Ltd. The remaining authors declare that the research was conducted in the absence of any commercial or financial relationships that could be construed as a potential conflict of interest. The company CAS&GD Metal Material Development Co. Ltd. had no role in the design of the study; in the collection, analyses, or interpretation of data; in the writing of the manuscript, or in the decision to publish the results.

References

  1. Fan, C.; Cheng, L.; Hong, Y.; Li, Z.; Li, C.; Ban, X.; Gu, Z. Study on the gelatinization and digestive characteristics of wheat starch and potato starch under low moisture conditions. Int. J. Biol. Macromol. 2024, 269, 132192. [Google Scholar] [CrossRef] [PubMed]
  2. Zhu, Y.; Wu, H.; Zhu, J.; Shi, Z.; Zou, L.; Shen, R.; Yao, Y. Research progress on food 3D printing based on starch. Food Sci. 2024, 45, 257–265. [Google Scholar]
  3. Shi, S.; Wen, J.; Geng, H.; Zhan, X.; Liu, Y. Physicochemical properties, structural properties and gels 3D printing properties of wheat starch. Int. J. Biol. Macromol. 2024, 261, 129885. [Google Scholar] [CrossRef]
  4. Abedini, A.; Sohrabvandi, S.; Sadighara, P.; Hosseini, H.; Farhoodi, M.; Assadpour, E.; Sani, M.A.; Zhang, F.; Seyyedi-Mansour, S.; Jafari, S.M. Personalized nutrition with 3D-printed foods: A systematic review on the impact of different additives. Adv. Colloid Interface Sci. 2024, 328, 103181. [Google Scholar] [CrossRef]
  5. Warsi, S.B.F.; Panda, B.; Biswas, P. Exploring fiber addition methods and mechanical properties of fibre-reinforced 3D printed concrete: A review. Dev. Built Environ. 2023, 16, 100295. [Google Scholar] [CrossRef]
  6. KS, J.H.; Subramaniam, M.P.; KT, M.K.; Sreeram, P.; Parvathi, S.; Sari, P.S.; Pullanchiyodan, A.; Mulhivill, D.M.; Raghavan, P. Fabrication and challenges of 3D printed sensors for biomedical applications-Comprehensive review. Results Eng. 2024, 21, 101867. [Google Scholar]
  7. Agunbiade, A.O.; Song, L.; Agunbiade, O.J.; Ofoedu, C.E.; Chacha, J.S.; Duguma, H.T.; Hossaini, S.M.; Rasaq, W.A.; Shorstkii, I.; Osuji, C.M.; et al. Potentials of 3D extrusion-based printing in resolving food processing challenges: A perspective review. J. Food Process Eng. 2022, 45, e13996. [Google Scholar] [CrossRef]
  8. Chen, L.; Hao, X.; Li, X.; Wang, L.; Song, J.; Zhang, H.; Zhang, N. Research Progress on the Effect of Non-starch Polysaccharides on Starch Properties. Sci. Technol. Food Ind. 2024, 45, 386–394. [Google Scholar]
  9. Su, H.; Hou, J.; Liu, Q.; Hou, L. Research Progress on Antiviral Substance Basis and Mechanism of Astragalus Membranaceus. Chin. Arch. Tradit. Chin. Med. 2024, 1–16. Available online: http://kns.cnki.net/kcms/detail/21.1546.R.20240419.1351.024.html (accessed on 6 August 2024).
  10. Wang, D.; Cui, Q.; Yang, Y.J.; Liu, A.Q.; Zhang, G.; Yu, J.C. Application of dendritic cells in tumor immunotherapy and progress in the mechanism of anti-tumor effect of Astragalus polysaccharide (APS) modulating dendritic cells: A review. Biomed. Pharmacother. 2022, 155, 113541. [Google Scholar] [CrossRef]
  11. Mushtaq, R.T.; Wang, Y.; Bao, C.; Rehman, M.; Sharma, S.; Khan, A.M.; Elsayed, M.; Eldin, T.; Abbas, M. Maximizing performance and efficiency in 3D printing of polylactic acid biomaterials: Unveiling of microstructural morphology, and implications of process parameters and modeling of the mechanical strength, surface roughness, print time, and print energy for fused filament fabricated (FFF) bioparts. Int. J. Biol. Macromol. 2024, 259, 129201. [Google Scholar]
  12. Wang, X.; Fang, J.; Cheng, L.; Gu, Z.; Hong, Y. Interaction of starch and non-starch polysaccharides in raw potato flour and their effects on thickening stability. Int. J. Biol. Macromol. 2023, 242, 124702. [Google Scholar] [CrossRef] [PubMed]
  13. Shi, X.; Yu, M.; Yin, H.; Peng, L.; Cao, Y.; Wang, S. Multiscale structures, physicochemical properties, and in vitro digestibility of oat starch complexes co-gelatinized with jicama non-starch polysaccharides. Food Hydrocoll. 2023, 144, 108983. [Google Scholar] [CrossRef]
  14. Xiao, Y.; Liu, S.; Shen, M.; Jiang, L.; Ren, Y.; Luo, Y.; Xie, J. Effect of different Mesona chinensis polysaccharides on pasting, gelation, structural properties and in vitro digestibility of tapioca starch-Mesona chinensis polysaccharides gels. Food Hydrocoll. 2020, 99, 105327. [Google Scholar] [CrossRef]
  15. Gedrovica, I.; Karklina, D.; Fras, A.; Jablonka, O.; Boros, D. The non–starch polysaccharides quantity changes in pastry products where Jerusalem artichoke (Helianthus tuberosus L.) added. Procedia Food Sci. 2011, 1, 1638–1644. [Google Scholar] [CrossRef]
  16. Wu, X.; Zhang, Q.; Zhang, J.; Zhang, B.; Wu, X.; Yan, X. Effect of Cyperus esculentus polysaccharide on Cyperus esculentus starch: Pasting, rheology and in vitro digestibility. Food Chem. X 2024, 22, 101511. [Google Scholar] [CrossRef]
  17. Zhang, Y.; Yang, B.; Zhou, S.; Han, X.; Jiang, Y.; Zhou, X.; Yang, X.; Zhao, J. Pasting, rheology, structural properties and in vitro digestibility of potato starch complexes co-gelatinized with squash polysaccharides. Food Biosci. 2024, 61, 104932. [Google Scholar] [CrossRef]
  18. Xu, W.; Jiang, D.; Zhao, Q.; Wang, L. Study on printability of 3D printing carbon fiber reinforced eco-friendly concrete: Characterized by fluidity and consistency. Case Stud. Constr. Mater. 2024, 21, e03589. [Google Scholar] [CrossRef]
  19. Song, Z.; Dai, H.; Bo, L.; Song, C.; Liu, X.; Ren, J. Set yogurt incorporated with insoluble dietary fiber maintains non-sedimentation: Combined alkaline hydrogen peroxide modification and high-pressure homogenization process. LWT 2024, 206, 116617. [Google Scholar] [CrossRef]
  20. GB/T 8883-2017; Edible wheat starch. Chinese Standardization Technical Committee for Edible Starches and Starches Derivatives: Wuxi, China, 2017.
  21. ElShebiny, T.; Matthaios, S.; Menezes, L.M.; Tsolakis, I.A.; Palomo, J.M. Effect of printing technology, layer height, and orientation on assessment of 3D-printed models. J. World Fed. Orthod. 2024, 13, 169–174. [Google Scholar]
  22. Lan, G.; Xie, S.; Duan, Q.; Huang, W.; Huang, W.; Zhou, J.; Chen, P.; Xie, F. Effect of soybean polysaccharide and soybean oil on gelatinization and retrogradation properties of corn starch. Int. J. Biol. Macromol. 2024, 264, 130772. [Google Scholar] [CrossRef]
  23. Jia, R.; Cui, C.; Gao, L.; Qin, Y.; Ji, N.; Dai, L.; Wang, Y.; Xiong, L.; Shi, R.; Sun, Q. A review of starch swelling behavior: Its mechanism, determination methods, influencing factors, and influence on food quality. Carbohydr. Polym. 2023, 321, 121260. [Google Scholar] [CrossRef]
  24. Min, C.; Zhang, C.; Cao, Y.; Li, H.; Pu, H.; Huang, J.; Xiong, Y.L. Rheological, textural, and water-immobilizing properties of mung bean starch and flaxseed protein composite gels as potential dysphagia food: The effect of Astragalus polysaccharide. Int. J. Biol. Macromol. 2023, 239, 124236. [Google Scholar] [CrossRef] [PubMed]
  25. Zheng, L.; Liu, J.; Liu, R.; Xing, Y.; Jiang, H. 3D printing performance of gels from wheat starch, flour and whole meal. Food Chem. 2021, 356, 129546. [Google Scholar] [CrossRef] [PubMed]
  26. Wang, H.; Qiu, J.; Wu, Y.; Ouyang, J. Impact of soluble soybean polysaccharide on the gelatinization and retrogradation of corn starches with different amylose content. Food Res. Int. 2024, 184, 114254. [Google Scholar] [CrossRef] [PubMed]
  27. Wang, W.; Guan, L.; Seib, P.A.; Shi, Y.C. Settling volume and morphology changes in cross-linked and unmodified starches from wheat, waxy wheat, and waxy maize in relation to their pasting properties. Carbohydr. Polym. 2018, 196, 18–26. [Google Scholar] [CrossRef]
  28. Liu, Y.; Chen, J.; Wu, J.; Luo, S.; Chen, R.; Liu, C.; Gilbert, R.G. Modification of retrogradation property of rice starch by improved extrusion cooking technology. Carbohydr. Polym. 2019, 213, 192–198. [Google Scholar] [CrossRef]
  29. Ai, Z.; Zhang, M.; Li, H.; Ji, S.; Zhang, J.; Yang, Y. Effects of different heat treatments on the quality of wheat flour and its steamed cakes. Trans. Chin. Soc. Agric. Eng. 2024, 40, 317–324. [Google Scholar]
  30. Zhou, R.; Wang, Y.; Wang, Z.; Liu, K.; Wang, Q.; Bao, H. Effects of Auricularia auricula-judae polysaccharide on pasting, gelatinization, rheology, structural properties and in vitro digestibility of kidney bean starch. Int. J. Biol. Macromol. 2021, 191, 1105–1113. [Google Scholar] [CrossRef]
  31. Ren, Y.; Rong, L.; Shen, M.; Liu, W.; Xiao, W.; Luo, Y.; Xie, J. Interaction between rice starch and Mesona chinensis Benth polysaccharide gels: Pasting and gelling properties. Carbohydr. Polym. 2020, 240, 116316. [Google Scholar] [CrossRef]
  32. Li, Y.; Wu, T.; Wu, Y.; Zhao, C.; Xu, X.; Liu, J. Effect of Auricularia cornea Ehrenb. Polysaccharide on the Retrogradation and Digestion of Corn Starch. J. Chin. Inst. Food Sci. Technol. 2021, 21, 78–90. [Google Scholar] [CrossRef]
  33. Liu, C.; Zhang, H.; Chen, R.; Chen, J.; Liu, X.; Luo, S.; Chen, T. Effects of creeping fig seed polysaccharide on pasting, rheological, textural properties and in vitro digestibility of potato starch. Food Hydrocoll. 2021, 118, 106810. [Google Scholar] [CrossRef]
  34. Pan, X.; Chen, X.; Niu, H.; Shen, M.; Ye, X.; Mo, S.; Xie, J. large and small amplitude oscillatory shear techniques evaluate the nonlinear rheological properties of Ficus pumila polysaccharide-wheat starch gel. Int. J. Biol. Macromol. 2024, 270, 132352. [Google Scholar] [CrossRef] [PubMed]
  35. Yi, H.; Li, J.; Li, J.; Wang, P.; Wang, S.; Liu, H. Effect of Fermented Soybean Whey W/O Slow-Release Coagulants on Gel Properties of Soybean Whole Powder Emulsion. Food Sci. 2024, 1–12. Available online: http://kns.cnki.net/kcms/detail/11.2206.TS.20240821.1147.006.html (accessed on 6 August 2024).
  36. Zárybnická, L.; Machotová, J.; Pagáč, M.; Rychlý, J.; Vykydalová, A. The effect of filling density on flammability and mechanical properties of 3D-printed carbon fiber-reinforced nylon. Polym. Test. 2023, 120, 107944. [Google Scholar] [CrossRef]
  37. Vaneker, T.H.J.; Kuiper, S.; Willemstein, N.; Baran, I. Effects of nozzle design on CFRP print quality using Commingled Yarn. Procedia CIRP 2023, 120, 1492–1497. [Google Scholar] [CrossRef]
  38. Tian, H.; Geng, M.; Wo, X.; Shi, L.; Zhai, Y.; Ji, P. Development and conceptual design of a sewage Sludge-to-Fuel hybrid Process: Prediction and optimization under analysis of variance and response surface model. Energy Convers. Manag. 2024, 306, 118143. [Google Scholar] [CrossRef]
  39. Youssef, M.; Ei-Shatoury, E.H.; Ali, S.S.; El-Taweel, G.E. Enhancement of Phenol Degradation by Free and Immobilized Mixed Culture of Providencia stuartii PL4 and Pseudomonas aeruginosa PDM Isolated from Activated Sludge. Bioremediat. J. 2019, 23, 53–71. [Google Scholar] [CrossRef]
  40. Lee, C.P.; Hashimoto, M. Prediction of textural properties of 3D-printed food using response surface methodology. Heliyon 2024, 10, e27658. [Google Scholar] [CrossRef] [PubMed]
Figure 1. Pneumatic-extrusion condensing 3D food printer.
Processes 12 01898 g001
Figure 2. Condensed deposition platform.
Processes 12 01898 g002
Figure 3. The 3D-printed samples of different layers.
Processes 12 01898 g003
Figure 4. The 3D-printed samples with different additive amounts of astragalus polysaccharide.
Processes 12 01898 g004
Figure 5. Deposition rate of mixed gel under different concentrations of astragalus polysaccharide (%).
Processes 12 01898 g005
Figure 6. Hardness (g), viscosity (g), and elasticity (mm) of the mixed gel under different concentrations of astragalus polysaccharide.
Processes 12 01898 g006
Figure 7. Effects of different filling rates on 3D-printed parts.
Processes 12 01898 g007
Figure 8. Effects of different nozzle diameters on 3D-printed parts.
Processes 12 01898 g008
Figure 9. Effects of different printing speeds on 3D-printed parts.
Processes 12 01898 g009
Figure 10. The contour maps and response surface plots of effects of interaction between printing parameters on the comprehensive completion rate (CCR) of the printing. (A,B) Fill ratio and printing speed interaction effects on CCR; (C,D) Nozzle diameter and printing speed interaction effects on CCR; (E,F) Nozzle diameter and fill ratio interaction effects on CCR).
Processes 12 01898 g010aProcesses 12 01898 g010b
Figure 11. The 3D printing samples under optimal printing parameter settings.
Processes 12 01898 g011
Figure 12. The 3D printing samples under optimal printing parameter settings (a,b): 3%; (c,d): 0%.
Processes 12 01898 g012
Table 1. Design and level of experimental factors.
LevelFactors
Print Speed (mm/min)Filling Rates (%)Nozzle Diameter (mm)
−1600600.4
0800800.8
110001001.2
Table 2. Response surface test design and results of 3D printing parameters.
NO.FactorsComprehensive Completion Rate (%)
Print Speed (mm/min)Filling Rates (%)Nozzle Diameter (mm)
1600600.897.62
21000600.897.86
36001000.898.15
410001000.897.48
5600800.499.46
61000800.497.48
7600801.297.49
81000801.298.58
9800600.497.87
108001000.498.68
11800601.297.78
128001001.297.48
13800800.899.48
14800800.899.34
15800800.899.28
16800800.899.31
17800800.899.29
Table 3. Variance analysis of regression model for printing sample completion rate.
Source of VarianceSum of SquaresDegree of FreedomMean SquareF Valuep Value
Model10.5891.1890.14<0.0001 **
A0.217810.217816.700.0047 *
B0.054510.05454.170.0803
C0.583210.583244.710.0003 *
AB0.207010.207015.870.0053
AC2.3612.36180.65<0.0001 **
BC0.308010.308023.620.0018 *
A21.6811.68128.64<0.0001 **
B23.6513.65279.96<0.0001 **
C20.876510.876567.20<0.0001 **
Residual0.091370.0130
Lack of Fit0.064730.02163.240.1427
Pure Error0.026640.0066
Cor Total10.6716
* Significant difference (p < 0.05); **: Extremely significant difference (p < 0.01).
Disclaimer/Publisher’s Note: The statements, opinions and data contained in all publications are solely those of the individual author(s) and contributor(s) and not of MDPI and/or the editor(s). MDPI and/or the editor(s) disclaim responsibility for any injury to people or property resulting from any ideas, methods, instructions or products referred to in the content.

