Article

Co-Gasification of Plastic Waste Blended with Biomass: Process Modeling and Multi-Objective Optimization

by
Tanawat Aentung
1,2,
Yaneeporn Patcharavorachot
2,* and
Wei Wu
1,3,*
1
Department of Chemical Engineering, National Cheng Kung University, Tainan 70101, Taiwan
2
Department of Chemical Engineering, School of Engineering, King Mongkut’s Institute of Technology Ladkrabang, Bangkok 10520, Thailand
3
Academy of Innovative Semiconductor and Sustainable Manufacturing, National Cheng Kung University, Tainan 70101, Taiwan
*
Authors to whom correspondence should be addressed.
Processes 2024, 12(9), 1906; https://doi.org/10.3390/pr12091906
Submission received: 15 August 2024 / Revised: 30 August 2024 / Accepted: 1 September 2024 / Published: 5 September 2024

Abstract

:
Mixed plastic/biomass co-gasification stands out as a promising and environmentally friendly technology, since it reduces wide solid wastes and produces green hydrogen. High-quality syngas can be obtained by virtue of the process design and optimization of a downdraft fixed-bed co-gasifier. The design is based on the actual reaction zones within a real gasifier to ensure accurate results. The methodology shows that (i) the co-gasifier modeling is validated using the adiabatic RGibbs model in Aspen Plus, (ii) the performance of the co-gasifier is evaluated using cold-gas efficiency (CGE) and carbon conversion efficiency (CCE) as indicators, and (iii) the multi-objective optimization (MOO) is employed to optimize these indicators simultaneously, utilizing a standard genetic algorithm (GA) combined with response surface methodology (RSM) to identify the Pareto frontier. The optimal conditions, resulting in a CGE of 91.78% and a CCE of 83.77% at a gasifier temperature of 967.89 °C, a steam-to-feed ratio of 1.40, and a plastic-to-biomass ratio of 74.23%, were identified using the technique for order of preference by similarity to ideal solution (TOPSIS). The inclusion of plastics enhances gasifier performance and syngas quality, leading to significant improvements in CGE and CCE values.

1. Introduction

In 2020, fossil fuel usage declined to 83% of global energy consumption (from 86% in 2015), while renewable energy rose to 5.7% (from 3.3% in 2015) [1,2]. Increasing global energy consumption but declining fossil fuel resources, the gasification process is a promising thermochemical process for addressing low environmental impacts while using resources associated with waste disposal. To convert solid waste into syngas, a complicated gasifier design is necessary because the process involves five zones: drying, pyrolysis, combustion, gasification, and an ash pit in which the gasifying agent strongly affects biofuel production [3].
In Thailand, the substantial generation of agricultural residues and mismanaged plastic waste, up to 41 million ton/year and 16.8 kton/year, respectively, emphasizes the importance of solving this problem sustainably [4]. Although plastic waste offers high hydrogen and carbon content, operational complications, such as softening, sticking, and coke formation, are usually inevitable. Co-gasification is an effective technology for handling different feedstocks through various mixing ratios to enhance gas quality and simplify feedstock complexities [5]. For example, blending coal with the biomass and petcoke could improve the product yield as well as enhance the heating value of the product, and co-gasification has the potential to reduce tar yield and pollutant emissions [6]. Therefore, the selection of feedstock not only increases the quality and quantity of syngas but also aligns with environmental goals by repurposing waste as a valuable resource.
The variety of plastic types induces substantial challenges in the separation process, often requiring significant capital investment [7]. Thailand is a significant sugar exporter and sugarcane producer in the global sugarcane industry, boasting approximately 330,000 active sugarcane growers and cultivating over 1.7 million hectares of sugarcane. Notably, sugarcane production is expected to increase in the coming years and produce substantial waste as bagasse [8]. Repurposing these residues for energy production holds the potential to enhance energy output and mitigate agricultural waste. Research on plastic and biomass co-gasification is growing. M. Ajorloo et al. [9] found that using steam in plastic/biomass co-gasification enhances H2 production, improves syngas quality, and reduces tar. Similarly, K.G. Burra and A.K. Gupta [10] showed that co-gasifying biomass and plastic waste produces more syngas than individual gasifications combined.
Response surface methodology (RSM) often facilitates the optimization of experimental design. Numerous studies have employed it to enhance and optimize different processes, such as the co-gasification of coal and biomass for methanol production [11] and of mixed Indian lignocellulosic waste for co-gasification [12]. To improve syngas production via co-gasification, a multi-objective optimization strategy has been developed using a statistical methodology coupled with a genetic algorithm (GA) [13]. X. He et al. [14] investigated the multi-objective optimization of biomass gasification. The results revealed that the three objectives could not be optimized simultaneously due to their conflicting natures. However, the Pareto set offered the best compromise among the objectives, leading to an improvement in the gasification process. Similarly, Z. Gao et al. [15] applied multi-objective optimization in a gasification power generation cycle. The proposed system was optimized through the integration of an artificial neural network with the MOPSO algorithm. The analysis confirmed that the TOPSIS method was effective in determining the optimal results for the target parameters.
In this article, the modeling and optimal design of a plastic/biomass co-gasification process are addressed. The gasifier model is designed to replicate a real gasifier with four main zones, ensuring accuracy in the results. To reflect real-world conditions, in which sorting plastics is costly and time-consuming, mixed plastic waste is used. The approach includes the Aspen Plus model validation of the downdraft fixed-bed gasifier, the process design of syngas production via co-gasification, and a multi-objective optimization algorithm for improving product quality. A Pareto frontier plot is generated using the GA combined with RSM. The optimal operating conditions for the gasifier are identified using the TOPSIS method.

2. Methodology

2.1. Feedstock

Sugarcane bagasse and mixed plastic waste were utilized as feedstocks to mitigate environmental issues and enhance their value. Table 1 presents the results of the proximate and ultimate analysis for these feedstocks, conducted in accordance with the standards of the American Society for Testing and Materials (ASTM). The mixed plastic waste included polyethylene (PE), polyethylene terephthalate (PET), polypropylene (PP), and polystyrene (PS), while polyvinyl chloride (PVC) was excluded due to its production of hydrochloric acid during the process, which posed potential risks to the products and reactors.

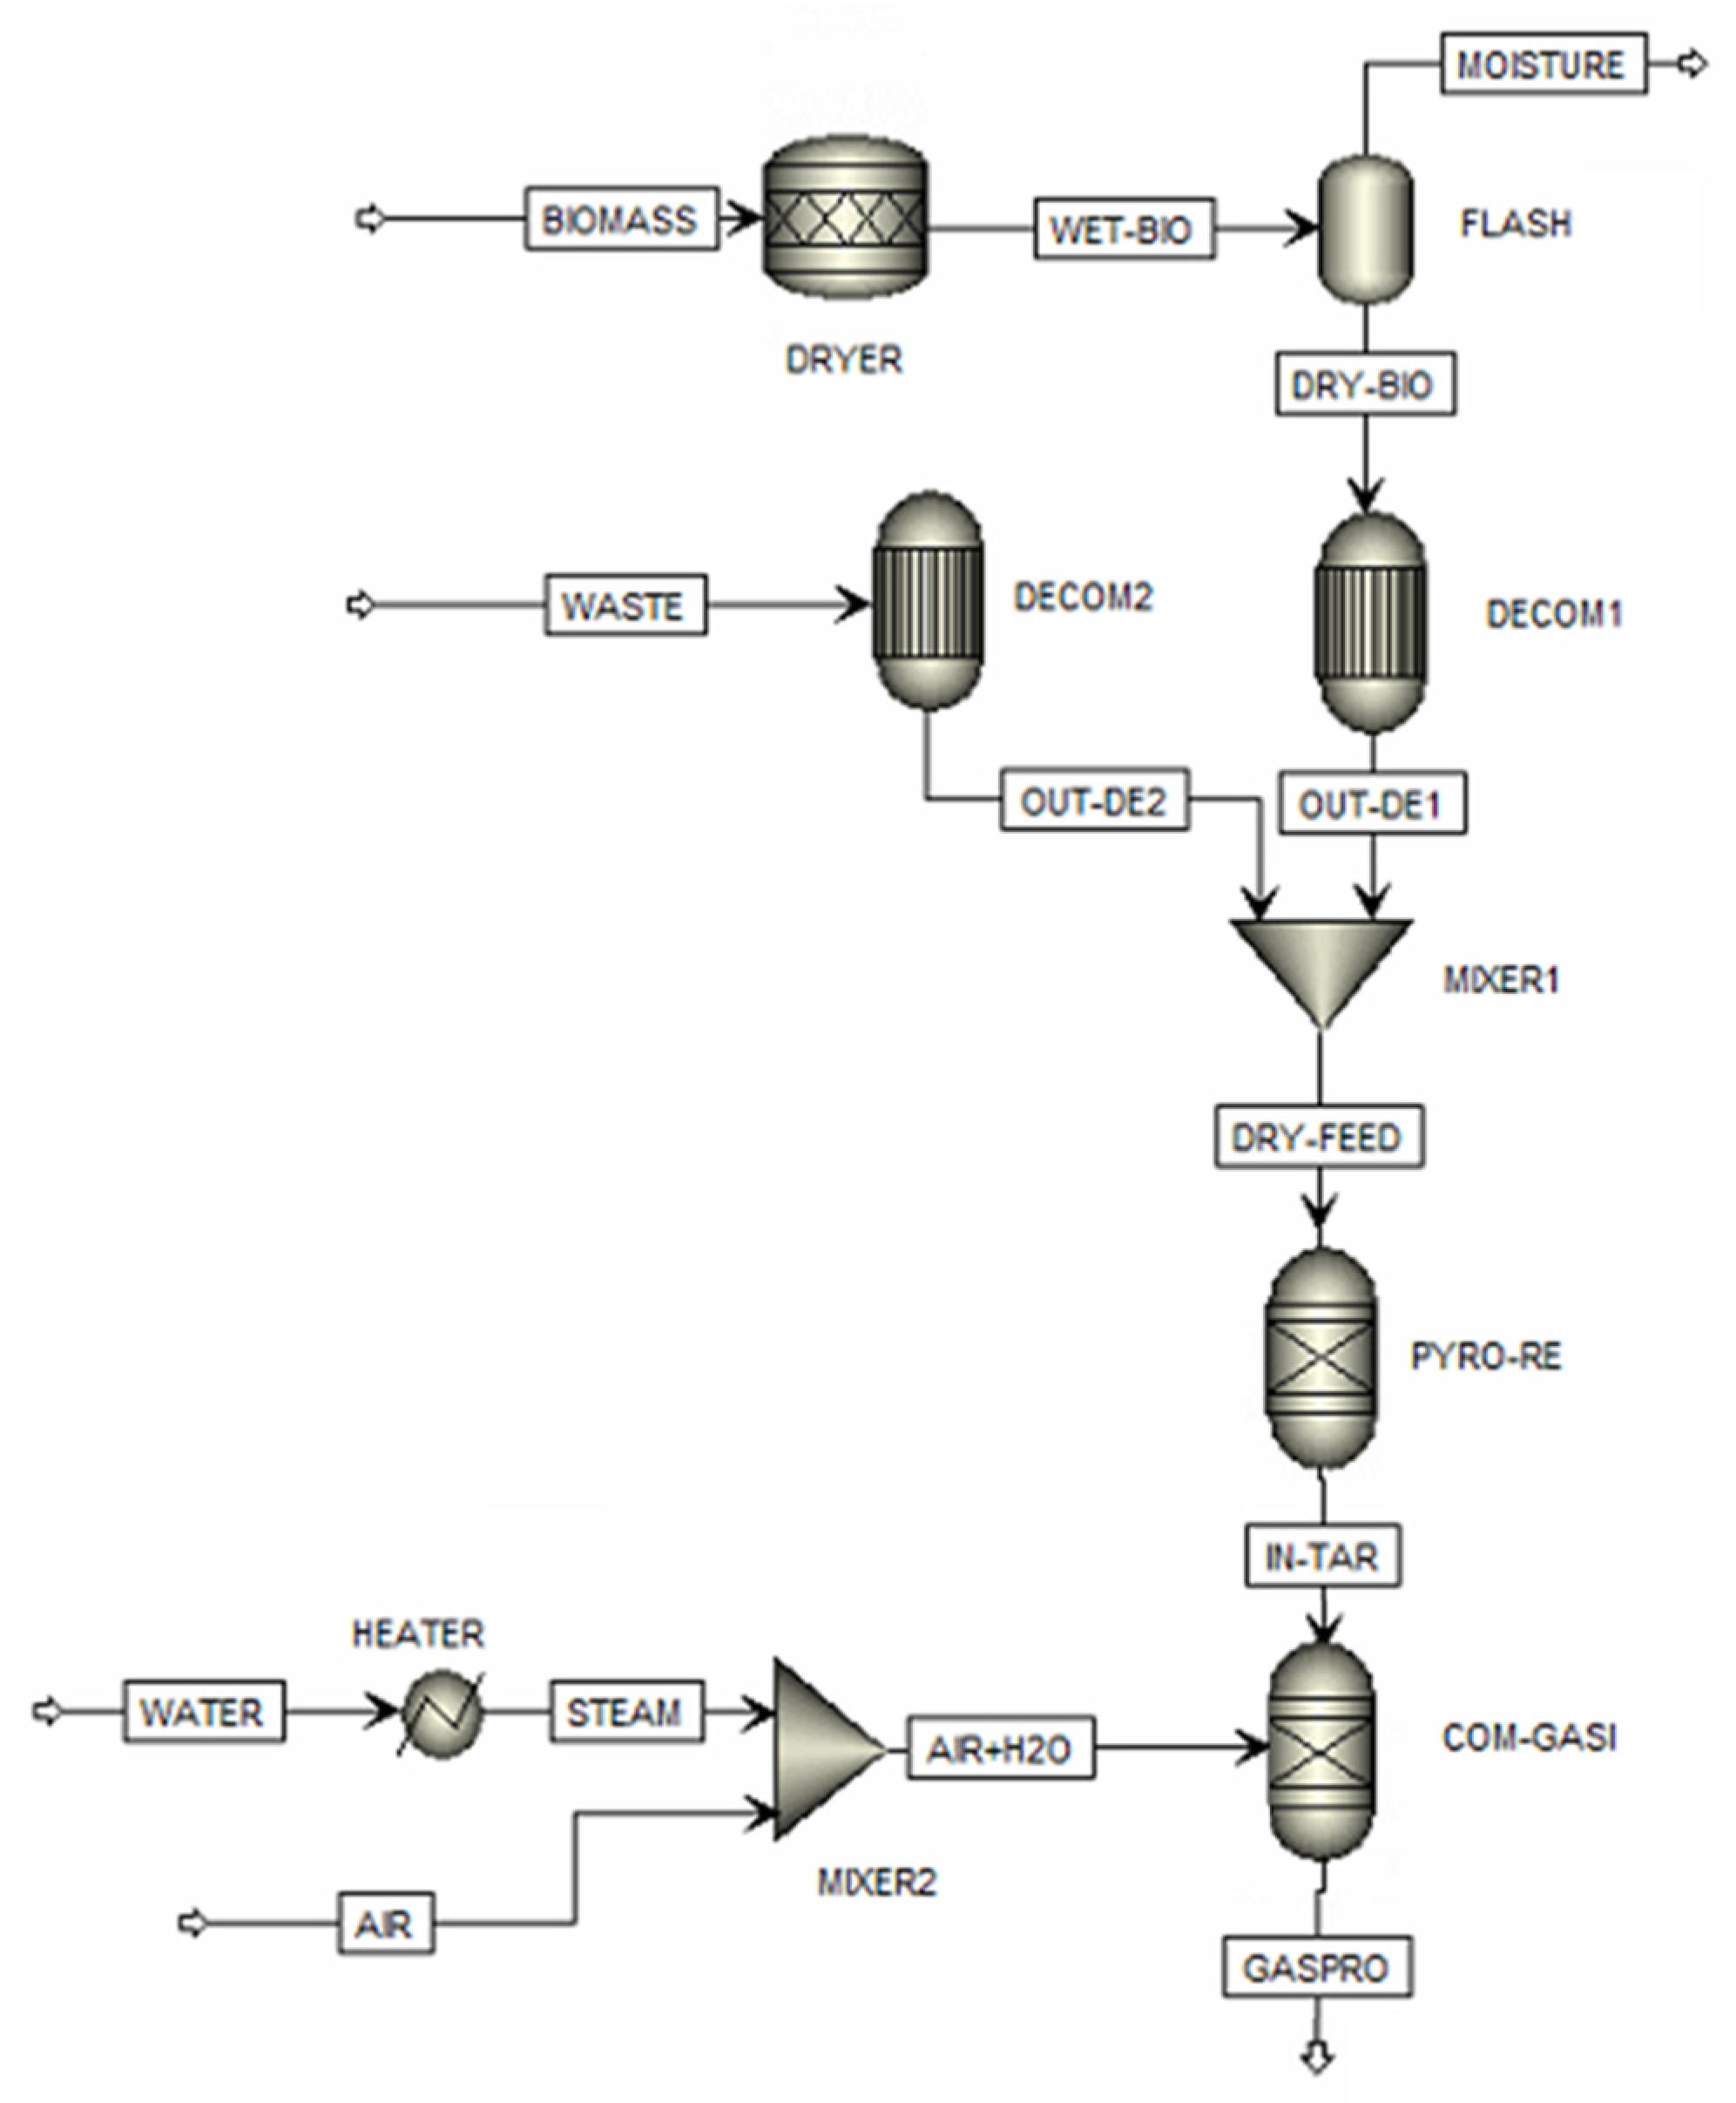
2.2. Process Modeling

Regarding the Aspen Plus modeling of the co-gasifier, the MIXCINC stream class, which includes MIXED, CISOLID, and NC without particle size distribution, was selected. The heat of formation, heat capacity, and density of the mixture were determined using the HCOALGEN and DCOALIGT models. The thermodynamic properties of conventional components were calculated using the Peng-Robinson equation of state with Boston-Mathias (PR-BM) modifications. The assumptions made are as follows:
  • The total flow rate of feedstocks is 100 kg/h, with the gasifying agent (steam) supplied to the process at 250 °C.
  • The simulation model operates under steady-state and isothermal conditions.
  • All gases are treated as real gases, comprising carbon monoxide (CO), carbon dioxide (CO2), methane (CH4), hydrogen (H2), hydrogen sulfide (H2S), nitrogen (N2), and water (H2O).
  • The simulation is based on a stoichiometric approach and operates at atmospheric pressure (~1 bar).
  • Tar formation and other heavy hydrocarbons are not considered.
  • Ash and carbon solids are assumed to be char.
  • No heat or pressure losses occur in the reactor.
The reactor models were selected based on specific objectives and assumptions. This study involves a gasifier model designed to simulate a real gasifier consisting of four main zones: drying, pyrolysis, combustion, and reduction zone. The water in the wet feedstock is converted into conventional water using an RStoic reactor, as the stoichiometry is known. The moisture, represented as a non-conventional component, reacts to form 1/18 (0.05556) moles of conventional water. The mixture of dry feedstock and moisture then enters a series of flash reactors to remove the remaining moisture. The decomposition of feedstock into conventional components is simulated using RYield reactors (DECOM1 and DECOM2). The chemical reactions that occur during the co-gasification process are simulated by RGibbs reactors (PYRO-RE and COM-GASI), based on minimizing Gibbs free energy [18].
The mixed plastic/biomass co-gasification model is shown in Figure 1. It shows that the plastic waste (PLASTIC stream) and sugarcane bagasse (BIOMASS stream) are blended with different ratios. The biomass has a high moisture content and must be dried in a dryer (DRYER) and flash drum (FLASH1). The components of the mixed stream are classified as non-conventional components by using the decomposition units (DECOM1 and DECOM2). These units convert non-conventional components into conventional components based on proximate and ultimate analyses, resulting in the production of elemental components and ash. The mixture from the mixer (MIXER1) is sent to the pyrolysis reactor (PYRO-RE) with an RGIBBS module to produce char and volatile matter, based on minimizing Gibbs free energy. Notably, char is characterized as ash and solid carbon, and tar formation (a mix of heavy hydrocarbon molecules) is excluded. Steam from the pyrolysis and the inlet steam, with water and air, flow into the gasifier (COM-GASI), and an RGibbs module finds the components of the product gases, e.g., CO, CO2, CH4, H2, H2S, N2, and H2O. The selected Aspen Plus modules and their operating conditions for the mixed plastic/biomass co-gasification process are shown in Table 2. Moreover, Table S1 in the Supplementary Materials provides the input/output stream data for the Aspen Plus simulation.
The reactions occurring in the co-gasification process are shown in Table 3. The determination of gasification performance relies on parameters in terms of lower heating value (LHV), syngas yield (GY), cold gas efficiency (CGE), and carbon conversion efficiency (CCE). The equations for computing the LHV of syngas (LHVg) and GY are provided in Equations (1) and (2), which are extracted from M. Ajorloo et al. [9].
LHVg (MJ/Nm3) = 0.108H2 + 0.126CO + 0.358CH4
GY   ( Nm 3 / kg fuel ) = volumetric   flow   rate   of   syngas   ( Nm 3 / h ) mass   flow   rate   of   feedstock   ( kg / h )
where H2, CO and CH4 are the mole percent of syngas (dry basis) obtained from the simulation model.
The CGE is a ratio of the energy in syngas, which was expressed by [20].
CGE   ( % ) = GY × LHV g × 100 LHV f
where LHVf stands for the LHV of the feedstock. The CCE is the percentage of carbon converted into gaseous products, which was expressed by [9].
CCE   ( % ) = 12 × GY × ( CO + CO 2 + CH 4 )   × 100 % 22.4 × C  
where C is the mass fraction of carbon in feedstock. The component elements of feedstock are shown in Table 4.

2.3. Response Surface Methodology

Response surface methodology (RSM) and analysis of variance (ANOVA) are statistical techniques for the optimization and design of experiments (DOE). Box–Behnken design (BBD) and central composite design (CCD) are both utilized in RSM [11,23]. This work utilized Design-Expert software to evaluate the process optimization using RSM with BBD. A three-level and a three-factor BBD (Table 5) were employed to assess the main, interaction, and quadratic significance of operating parameters. The response variables were based on CGE and CCE. The independent factors were coded with three levels, representing the maximum (+1), intermediate (0), and minimum (−1) levels, respectively. For statistical analysis, gasifier temperature (T), steam-to-feed ratio (S/F), and plastic-to-biomass ratio (P/B) were listed as A, B, and C, respectively.
A second-order polynomial equation can describe the mathematical relationship between the variables and the response [23]:
Y = β o + i = 1 n β i x i + i = 1 n β ii x i 2 + i = 1 n - 1 j = i + 1 n β ij x j
where Y represents the predicted response, N is the number of variables, xi is the independent variable, β o , β i , β ii and β ij are the intercept terms, the linear effect, the squared effect, and the interaction effect, respectively.

2.4. Sensitivity Analysis

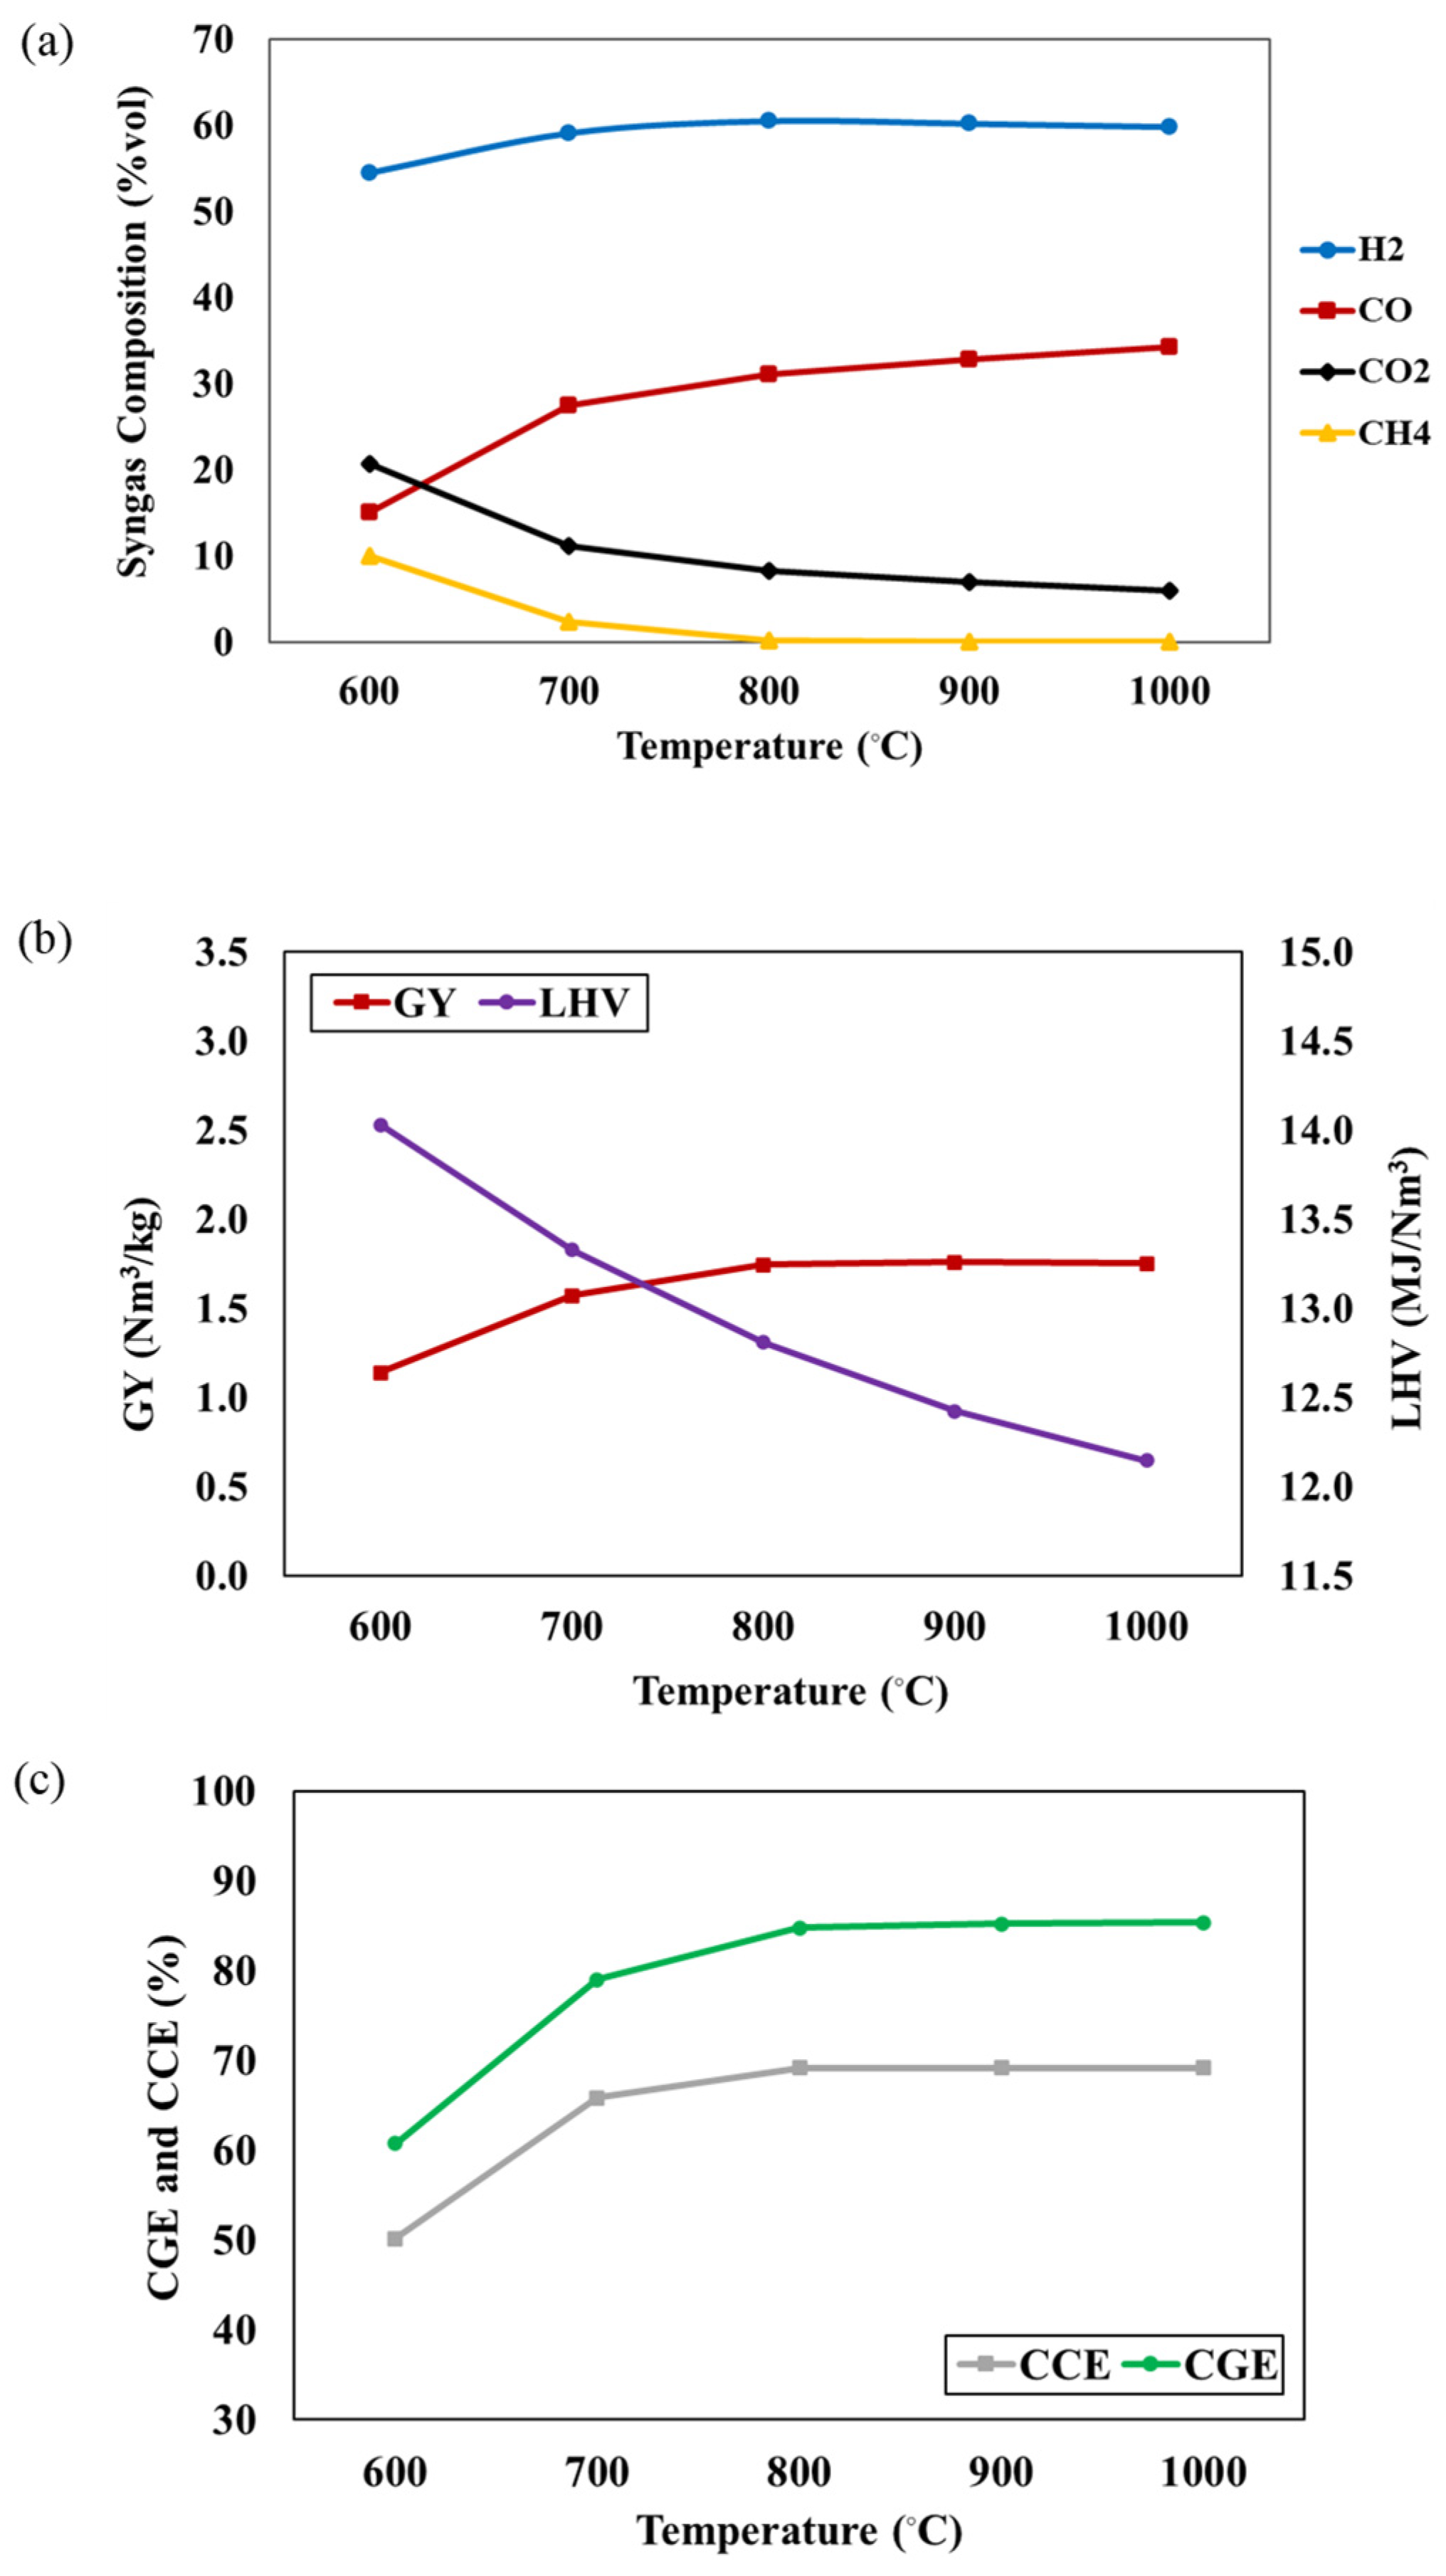
2.4.1. Effect of Gasifier Temperature

In this work, the effects of operating conditions (temperature, S/F ratio and P/B ratio) on the syngas compositions, CGE, and CCE are investigated. Figure 2a illustrates the impact of gasifier temperature, ranging from 600 °C to 1000 °C (S/F = 1 and P/B = 50:50). The results indicate an increase in H2 and CO concentrations, while CO2 and CH4 concentrations decrease as the gasifier temperature rises. This occurs because a rise in gasifier temperature promotes endothermic reactions, like water gas and Boudouard reactions, while inhibiting exothermic reactions like methanation and water gas shift reactions. The endothermic reactions contribute to a higher concentration of H2 and CO, accompanied by a decrease in CO2 concentration. Conversely, exothermic reactions favor backward reactions, resulting in reduced CH4 formation. Additionally, CH4 is consumed in the steam methane reforming reaction. The H2 concentration remains relatively constant with temperature variation. The decrease in CO2 concentration also results from the combined impact of the reversible water gas shift reaction and the Boudouard reaction. Figure 2b,c represent the effect of gasifier temperature on the GY, LHV, CGE, and CCE of syngas. Increasing the gasifier temperature leads to an increase in the GY, CGE, and CCE, while the LHV decreases. This trend is attributed to the promotion of endothermic reactions and syngas production, with a higher proportion of H2 and CO content and a lower hydrocarbon content at elevated temperatures. The reduction in the LHV is a consequence of a substantial decrease in CH4 content, as indicated by Equation R8. CH4 experiences a rapid decline from 600 °C to 800 °C, leading to a significant drop in the LHV from 14.03 to 12.15 MJ/Nm3 within this temperature range. This highlights the considerable impact of CH4 concentration on the LHV of syngas, according to Xiong et al. [19]. Khan et al. [24] reported that an increase in gasifier temperature can facilitate the tar cracking reactions and reforming reactions, leading to higher levels of H2 and CO, reduced CH4 content, and increased product gas yield, CGE, and CCE.

2.4.2. Effect of Steam-to-Feed Ratio

The effect of the S/F ratio on syngas compositions is depicted in Figure 3a, ranging from 0.5 to 1.5, while the gasifier temperature and P/B ratio are fixed at 800 °C and 50:50, respectively. The results indicate that a higher S/F ratio results in higher concentrations of H2 and CO2, accompanied by a decrease in CO and CH4 concentrations. The addition of steam into the process promotes gasification reactions, including water gas, water gas shift, and steam methane reforming, while also enhancing the tar conversion rate [25]. As a result, H2 and CO2 production are elevated. CO production is enhanced through the water gas shift, and CH4 is consumed in the steam methane reforming reaction. The influences of the S/F ratio on the GY, LHV, CGE, and CCE of the syngas are illustrated in Figure 3b,c. An increase in the S/F ratio leads to higher GY, CGE, and CCE, while the LHV decreases. The increased S/F ratio promotes gasification reactions (i.e., water gas, water gas shift, and steam methane reforming) and tar conversion rates, resulting in elevated H2 and CO2 concentrations and contributing to higher GY, CGE, and CCE. However, the steam methane reforming reaction consumes CH4 content, leading to a decrease in LHV. In the study of Pio et al. [26], it was reported that an autothermal pilot-scale gasifier provides a similar trend in GY, CGE, CCE, and LHV to that noted in our study when the S/F ratio increases. This trend reflects a trade-off between the concentrations of combustible gases caused by the increment in the S/F ratio. Additionally, many studies have reported a similar trend for low heating values [27,28].

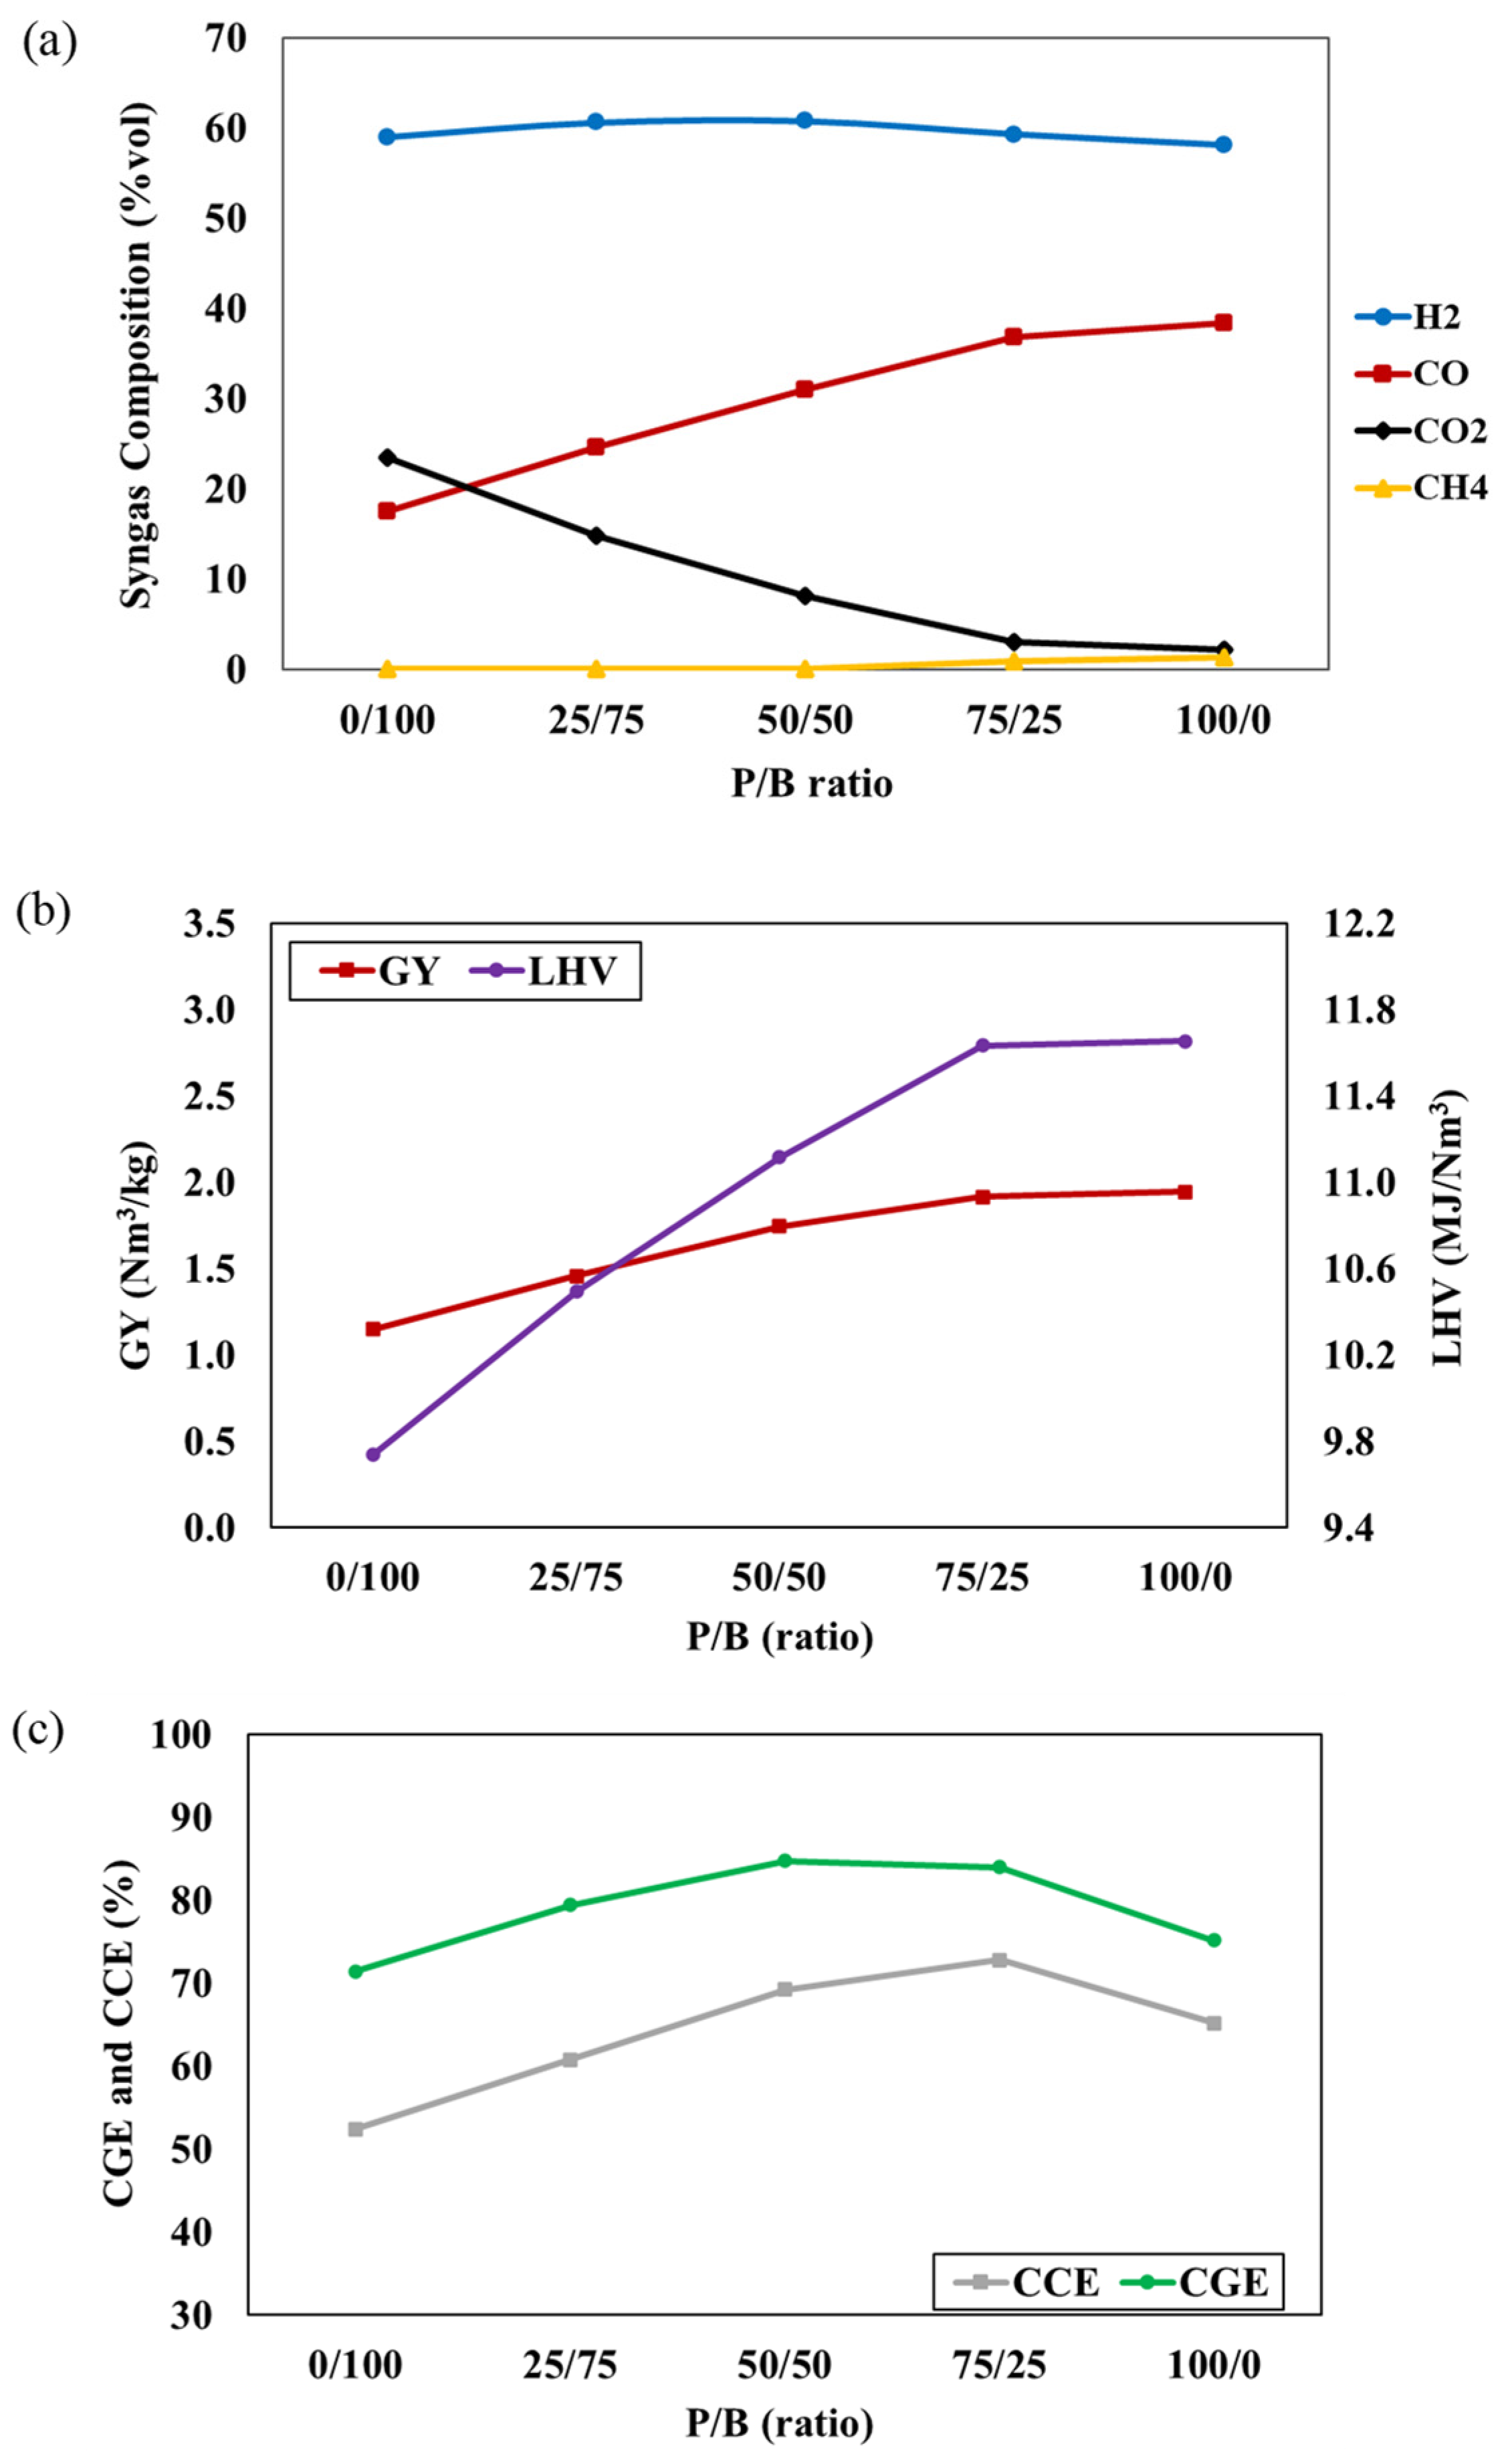
2.4.3. Effect of Blending Weight Ratio

Plastic/biomass co-gasification, a process known to enhance syngas quality by increasing volatile fractions and heating value [29], was explored in this study. The investigation involved varying the P/B ratio from 0 to 100%, while the gasifier temperature of 800 °C and an S/F ratio of 1 were kept constant. The results of syngas composition, depicted in Figure 4a, indicate that an increased P/B ratio results in higher concentrations of H2, CO, and CH4, whereas the CO2 concentrations decrease. This can be attributed to the ultimate analysis (biomass and plastic waste) and gasification reaction, where the higher carbon and hydrogen content of mixed plastic waste promotes the formation of H2, CO, and CH4. The decreased oxygen content in the feedstock, due to mixed plastic waste, leads to reduced CO2 concentrations and an increase in P/B ratio. These conditions promote the partial oxidation reaction and inhibit the combustion reaction. The higher carbon content in plastic waste also accelerates the Boudouard reaction, elevating CO concentration and lowering CO2 concentration. However, a slight decrease in CO content at 100% plastic feedstock is observed due to the declining biomass fraction, resulting in decreased oxygen content. Figure 4b,c show the impact of the P/B ratio on the GY, LHV, CGE, and CCE of syngas. It can be observed that increasing the P/B ratio leads to an increase in all values. This is attributed to the higher plastic content providing increased volatile matter, lower fixed carbon, and an improved heating value in the mixed feedstock. These factors contribute to elevated syngas production and LHV, facilitated by the higher carbon and hydrogen content, leading to an increased CGE, according to Equation (3). Additionally, the higher carbon content promotes more carbon conversion into synthetic gas, while the higher concentrations of CO and CH4 result in an increased CCE [30]. However, a reduction in CGE and CCE values is noted at 100% plastic feedstock due to the declining biomass fraction, leading to a decrease in oxygen content. This result reduces the combustion reaction, leading to a decline in CO and CO2 concentration. These observations align with several studies reported in the literature [9,31].

3. Results and Discussion

3.1. Model Validation

This study evaluates the model’s efficacy in predicting realistic results by comparing the simulation results with experimental data from Lopez et al. [21] and Nguyen et al. [22].
In the work of Lopez et al., pinewood waste and high-density polyethylene (HDPE) were used as feedstock at 850 °C and 1 bar, with a P/B ratio of 50:50 and an S/F ratio of 1. Nguyen et al. used woodchips as the feedstock at 800 °C and 1 bar, with an S/F ratio of 1.2 and an ER of 0.07. The validation of the model, following the feed and conditions from the two studies detailed in Table 6, indicates a strong correlation between the simulated and experimental data for syngas composition under identical feedstock and operating conditions. The root mean square (RMSE) values are 2.51 and 4.48, respectively.

3.2. Process Optimization

The performance of the co-gasifier is predominantly affected by CGE and CCE. For maximizing the performance indicators of CGE and CCE, both objectives induce conflicting goals. The study utilized a three-level and three-factor full factorial design to optimize the variables using RSM with BBD.
BBD is favored over central composite design (CCD) because it requires fewer design points and avoids extreme treatment combinations. Its cost-effectiveness and efficiency have been widely recognized, as reflected in numerous publications. When combined with MOO and GAs, BBD effectively resolves conflicting objectives, saving both time and cost [32]. This approach involved performing 15 randomized experiments using Design-Expert software to identify the optimal operational conditions that maximize CGE and CCE. The significance of the parameters in the model was assessed using analysis of variance (ANOVA) results, which involved evaluating F-values, p-values, and R2 values. Statistical significance is indicated by lower p-values (<0.05) and higher F-values, as shown in Table 7. Both the CGE and CCE models exhibit high R2 values of 0.9907 and 0.9954, respectively. The adjusted coefficient of determination (R2adj), which accounts for the number of terms in the model, was above 0.9, confirming the high accuracy of the model. Additionally, the predicted (R2pred) and R2adj values were largely consistent, reaching 85%, which supports the suitability of the selected variables in the regression model [33,34]. This detailed analysis is crucial for optimizing the gasification process and ensuring that the best possible operational conditions are determined for maximum performance.
In this study, statistical significance is determined by p-values below 0.05, adhering to a significance threshold of 0.05. Table 8 meticulously outlines the impacts of various operating conditions on CGE and CCE, elucidating the magnitude and importance of these effects. Notably, all factors (linear, interaction, and squared) are statistically significant for both CGE and CCE at the 0.05 level, except for the linear effect of the P/B ratio on CGE, which is hindered by high data variability. The research underscores the specificity of examining the effect of the bending weight ratio within a 25–75 range, highlighting the potential alterations in outcomes if the range is expanded to 0–100. Furthermore, the S/F ratio emerges as the most critical factor influencing both CGE and CCE. The important implications of these interaction effects on CGE and CCE also include the complexity of optimizing the gasification process. Moreover, the regression equation provides an algebraic model (Equation (5)) of the relationship between the response and the variables. The regression equations for CGE and CCE, influenced by the GY and LHV of syngas, describe the mathematical relationships between variables and responses, as shown in Equations (6) and (7).
CGE (%) = −128.9 + 0.3415A+ 107.1B − 0.328C − 0.000186A2 − 33.37B2
− 0.00684C2 − 0.0407AB + 0.000905AC
(6)
CCE (%) = −9.3 + 0.2318A + 89.53B − 0.235C − 0.000118A2 − 31.55B2
− 0.00725C2 − 0.02986AB + 0.000778AC + 0.4590BC
(7)

3.3. Response Surface

The surface plots generated using Design-Expert software are three-dimensional representations that depict the combined influence of various process parameters on the responses, with two parameters varying along the horizontal axes (x and y) and the response variable (CGE or CCE) changing along the vertical axis (z). When there are more than two variables, the remaining variables are held constant at their central values [23,35]. These graphical representations offer insights into the simultaneous impacts of changes in gasifier temperature, S/F ratio, and P/B ratio on the responses (CGE and CCE). The surface plots indicate that the interactions between temperature and S/F ratio have a more significant impact on enhancing CGE and CCE compared to interactions involving the P/B ratio.
Figure 5a–c demonstrate the combined impact of gasifier temperature and S/F ratio on the CGE value of syngas. The variables were adjusted within the specified ranges listed in Table 9, while the CGE values were maintained between 40% and 100%. The CGE value is more responsive to changes in the S/F ratio than to variations in the gasifier temperature, as observed in Figure 5b. At an S/F ratio of 0.5, increasing the temperature can enhance the CGE value from 44.99% at T= 600 °C to 69.44% at T= 1000 °C. Similarly, raising the S/F ratio from 0.5 to 1.5 at T= 800 °C results in an increase in the CGE value from 66.01% to 84.92%. At S/F ratio of 1.25, raising the temperature induces a negative impact on the CGE value at T = 900 °C. Figure 5c shows that the S/F and P/B ratios affect the CGE value from 63.67% to 88.32% at T = 800 °C. Figure 5d shows that raising the S/F ratio from 0.5 to 1.5 at T = 800 °C results in an increase in the CCE value from 66.00% to 84.92%. The interaction impact of P/B ratio with gasifier temperature and S/F ratio are found in Figure 5e,f, respectively. These 3D plots show a positive effect on the CCE value when increasing the operating parameters. Additionally, the interaction of the S/B and P/B ratios is more effective on the CCE value than other interactions, as observed in Figure 5d–f.

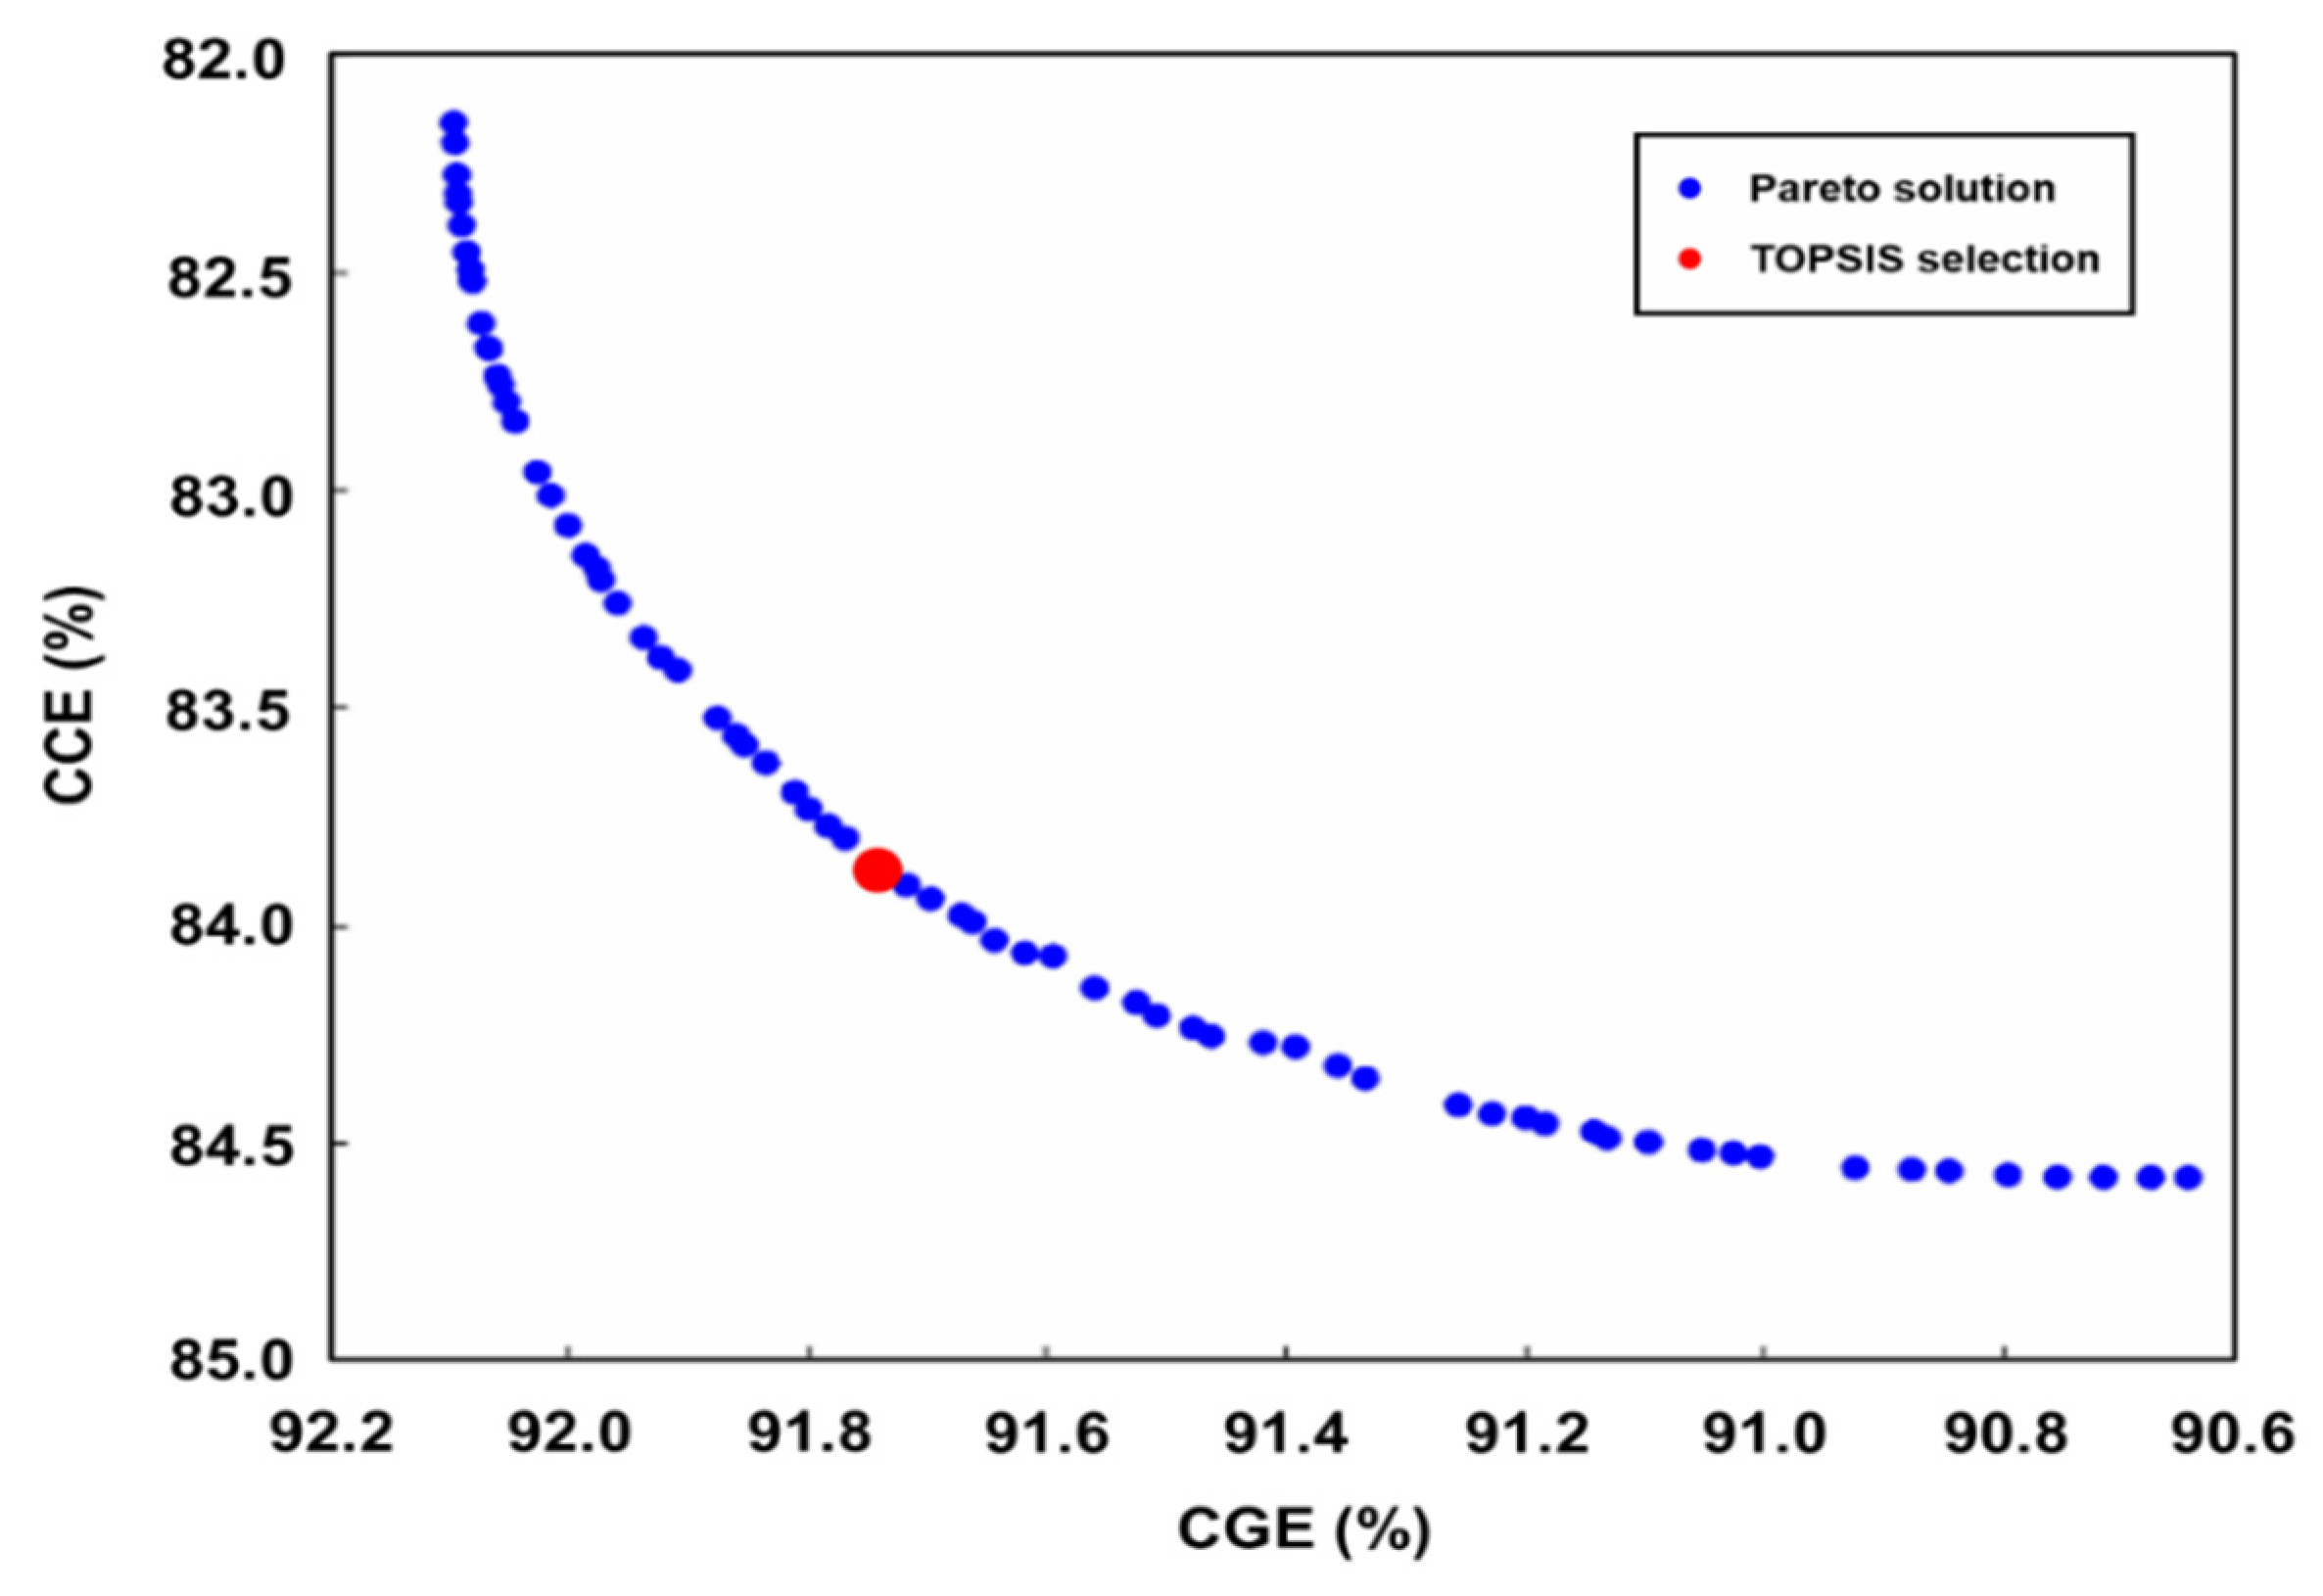
3.4. Muti-Objective Optimization

To address the MOO problem, this algorithm is as follows:
min T , S / F , P / B   C G E
min T , S / F , P / B   C C E
Subject to
600 T 1000 0.5 S / F 1.5 25 P / B 75
where CGE and CCE are objective functions and T, S/F, and P/B are selected variables. In this work, the GA tool in Matlab® R2024a is used to solve the MOO and identify the set of Pareto frontier points. The GA operates on the principles of natural selection to optimize the gasification process. It starts with a range of potential solutions and evaluates each using the equations for CGE (Equation (6)) and CCE (Equation (7)). The goal is to maximize CGE and CCE by minimizing their negative values, as described in Equations (8) and (9), while adjusting the variables within the constraints specified in Equation (10). The GA iteratively evolves a population of solutions by selecting parents based on fitness and generating offspring through crossover and mutation. To address the best solution from the Pareto front for maximizing both CGE and CCE simultaneously, TOPSIS is employed as a multi-criteria decision-making method that identifies solutions from a finite set of alternatives based upon their distance to the ideal solution and their distance from the negative-ideal solution. The steps and equations involved in the TOPSIS method are presented below:
(1)
Construct the normalized decision matrix:
R = x i j k = 1 m x k j 2
where xij represents the value of the i alternative for the j criterion, m is the total number of alternatives, and k is an index that runs over all alternatives from 1 to m.
(2)
Construct the weighted normalized decision matrix:
V = wj · R
where wj is the weight of the j criterion.
(3)
Determine the ideal (I+) and negative-ideal (I) solutions:
I + = { ( max V   i f   j   J 1 ; m i n   V   i f   j   J 2 ) } = { V 1 + ,   V 2 + ,   ,   V n + }
I = { ( min V   i f   j   J 1 ; m a x   V   i f   j   J 2 ) } = { V 1 ,   V 2 ,   ,   V n }
where J1 is the set of benefit criteria and J2 is the set of cost criteria.
Notably, the separation measures L i + and L i are defined as the Euclidean distance. TOPSIS facilitates the ranking of alternatives by investigating the distances from both the ideal and negative-ideal solutions, thereby supporting decision-making in various contexts. The alternatives are ranked in descending sequence according to their calculated relative closeness to the ideal solution [39].
L i + = j = 1 n ( V V j + ) 2
L i = j = 1 n ( V V j ) 2
S = L i L i + L i 0 S 1
The Pareto frontier plot shown in Figure 6 represents the trade-off between two conflicting objectives in a multi-objective optimization problem which is solved by a specific GA in Matlab. Each blue dot on the plot represents a solution that lies on the Pareto frontier, meaning that these solutions are non-dominated with respect to each other. In other words, no other solutions are better for all objectives simultaneously. The Pareto frontier typically shows a trade-off between two conflicting objectives, as evidenced by the curve, where improvements in one objective lead to compromises in the other. The red dot indicates the solution selected by the TOPSIS. It is a multi-criteria decision-making method that identifies the solutions closest to the ideal solution and farthest from the nadir solution. The red dot’s position on the Pareto frontier suggests that it is a balanced choice, offering a compromise that is closest to the ideal point, considering the specific weightage or importance assigned to each objective. This selection is critical in practical applications, where an optimal trade-off solution is one that is efficient and balanced among all considered criteria.
The GA with TOPSIS method calculates and identifies optimal operating conditions for high CGE and CCE. The optimized conditions for achieving the highest CGE and CCE values are found to be T = 967.89 °C, S/B ratio = 1.40, and P/B ratio = 74.23. The resulting optimum CGE and CCE values are 91.78% and 83.77%, respectively. The evaluated values for CGE and CCE indicate that the settings appear to yield favorable results for all responses. The Pareto frontier illustrates the trade-offs between CGE and CCE, and the TOPSIS selection shows the optimal results between the two objectives. The examination revealed that the statistical results closely resembled the values obtained from the simulation, as shown in Table 8, with small errors of 0.8 and 2.2. Therefore, these values confirm the high accuracy and effectiveness of the decision parameters for optimized responses [7,36].
The comparison between the CGE and CCE values in Table 9 highlights the impact of feedstock type and operating conditions on the performance of the gasification process. Table 8, which shows the optimized results from the current research, indicates higher CGE (91.78%) and CCE (83.77%) values than those reported in Table 9 from other studies. The higher values in this study suggest that the optimization process effectively enhanced the efficiency of the co-gasification. This underscores the importance of process optimization in achieving the best result. Additionally, mixing plastics with biomass in the gasification process can improve gasifier performance and syngas quality. The positive impact of the plastic blend addition on syngas production was evident, with an increase in CGE and CCE values at a plastic content of 74.23%wt (plastic: biomass mixture). This finding is consistent with previous research [7,40].

4. Conclusion and Recommendations

4.1. Conclusions

The design and optimization of a mixed plastic/biomass co-gasification process is addressed through Aspen Plus modeling and optimization with a GA. The sugarcane bagasse and mixed plastic wastes of PE, PET, PP, and PS are treated as feedstocks. The co-gasifier model is designed to simulate a real gasifier consisting of four main zones, using the RGibbs model in Aspen Plus. Due to the research relying on experimental data with limited information, the use of the RGibbs model effectively addresses this challenge. Model validation is guaranteed by experimental results under the same conditions, with errors of 2.51% and 4.48%, respectively. Sensitivity analysis indicates that increasing the reactor temperature and S/F ratio enhance the syngas composition and LHV, whereas the GY decreases. However, increasing the plastic content promotes GY, which contributes to elevated syngas production. These findings show that reactor temperature, S/F ratios, and P/B ratios strongly dominate the performance of the co-gasifier in terms of CGE and CCE. RSM combined with a GA is utilized to optimize the process and identify a Pareto frontier plot. The TOPSIS method is employed to determine the best operating conditions of the co-gasifier from the Pareto frontier plot to achieve indicators of both CGE and CCE, with 91.78% and 83.77%, respectively. The comparison between the predicted and simulation results shows that GA with TOPSIS accurately predicts the co-gasification outcomes, with errors of 0.8% for CGE and 2.2% for CCE. This demonstrates the model’s reliability in optimizing the process efficiently. Additionally, the CGE and CCE values achieved are within a favorable range. Mixing plastics with biomass is feasible and enhances both gasifier efficiency and syngas quality.

4.2. Recommendations

Future research should delve deeper into the intricate interactions between process variables in co-gasification. This includes exploring additional factors, such as kinetic parameters, catalyst utilization, and tar formation. Additionally, pilot-scale testing of the optimized operating conditions is essential for validating the simulation results and confirming the feasibility of the proposed process improvements.

Supplementary Materials

The following supporting information can be downloaded at: https://www.mdpi.com/article/10.3390/pr12091906/s1, Table S1: Summary of stream data from the Aspen Plus simulation.

Author Contributions

Conceptualization, T.A. and W.W.; methodology, T.A.; software, T.A.; validation, T.A.; formal analysis, T.A.; investigation, W.W.; resources, W.W.; data curation, T.A.; writing—original draft preparation, T.A.; writing—review and editing, Y.P. and W.W.; visualization, Y.P. and W.W.; supervision, Y.P. and W.W.; project administration, Y.P.; funding acquisition, Y.P. and W.W. All authors have read and agreed to the published version of the manuscript.

Funding

The National Science and Technology Council, Taiwan (Grant No. 113-2221-E-006-019) and King Mongkut’s Institute of Technology, Ladkrabang (Grant No. 2567-02-01-002).

Data Availability Statement

All data that support the findings of this study are included within the article.

Conflicts of Interest

The authors declare no conflict of interest.

Nomenclature

BBDBox–Behnken design
CCECarbon conversion efficiency (%)
CGECold-gas efficiency (%)
GAGenetic algorithm
GYSyngas yield (Nm3/kg)
LHVLower heating value (MJ/kg)
P/BPlastic to biomass ratio
RMSERoot mean square error
RSMResponse surface methodology
S/FSteam-to-feed ratio
TOPSISTechnique for Order of Preference by Similarity to Ideal Solution

References

  1. Batel, S.; Rudolph, D. A Critical Approach to the Social Acceptance of Renewable Energy Infrastructures: Going beyond Green Growth and Sustainability; Springer International Publishing: Berlin/Heidelberg, Germany, 2021. [Google Scholar] [CrossRef]
  2. Holechek, J.L.; Geli, H.M.E.; Sawalhah, M.N.; Valdez, R. A Global Assessment: Can Renewable Energy Replace Fossil Fuels by 2050. Sustainability 2022, 14, 4792. [Google Scholar] [CrossRef]
  3. Ali, A.M.; Shahbaz, M.; Inayat, M.; Shahzad, K.; Al-Zahrani, A.A.; Mahpudz, A.B. Conversion of municipals waste into syngas and methanol via steam gasification using CaO as sorbent: An Aspen Plus modelling. Fuel 2023, 349, 128640. [Google Scholar] [CrossRef]
  4. The ASEAN Circular Economy Stakeholder Platform. Plastic Material Flow and Value Chain Analysis; Chulalongkorn University: Bangkok, Thailand, 2023; Available online: https://ce.acsdsd.org/knowledge/plastic-material-flow-and-value-chain-analysis-thailand/ (accessed on 3 July 2024).
  5. Aentung, T.; Wu, W.; Patcharavorachot, Y. Process design and muti-objective optimization of solid waste/biomass co-gasification considering tar formation. J. Taiwan Inst. Chem. Eng. 2024, 164, 105688. [Google Scholar] [CrossRef]
  6. Li, X.; He, J.; Liu, M.; Bai, J.; Bai, Z.; Li, W. Interaction between Coal and Biomass during Co-Gasification: A Perspective Based on the Separation of Blended Char. Processes 2022, 10, 286. [Google Scholar] [CrossRef]
  7. Salisu, J.; Gao, N.; Quan, C. Techno-economic Assessment of Co-gasification of Rice Husk and Plastic Waste as an Off-grid Power Source for Small Scale Rice Milling—An Aspen Plus Model. J. Anal. Appl. Pyrolysis 2021, 158, 105157. [Google Scholar] [CrossRef]
  8. Jusakulvijit, P.; Bezama, A.; Thrän, D. The Availability and Assessment of Potential Agricultural Residues for the Regional Development of Second-Generation Bioethanol in Thailand. Waste Biomass Valorization 2021, 12, 6091–6118. [Google Scholar] [CrossRef]
  9. Ajorloo, M.; Ghodrat, M.; Scott, J.; Strezov, V. Modelling and statistical analysis of plastic biomass mixture co-gasification. Energy 2022, 256, 124638. [Google Scholar] [CrossRef]
  10. Burra, K.G.; Gupta, A.K. Synergistic effects in steam gasification of combined biomass and plastic waste mixtures. Appl. Energy 2018, 211, 230–236. [Google Scholar] [CrossRef]
  11. Bezerra, M.A.; Santelli, R.E.; Oliveira, E.P.; Villar, L.S.; Escaleira, L.A. Response surface methodology (RSM) as a tool for optimization in analytical chemistry. Talanta 2008, 76, 965–977. [Google Scholar] [CrossRef]
  12. Pati, S.; De, S.; Chowdhury, R. Process modelling and thermodynamic performance optimization of mixed Indian lignocellulosic waste co-gasification. Int. J. Energy Res. 2021, 45, 17175–17188. [Google Scholar] [CrossRef]
  13. Abikak, Y.; Bakhshyan, A.; Dyussenova, S.; Gladyshev, S.; Kassymzhanova, A. Optimization of Hydrochemical Leaching Process of Kaolinite Fraction of Bauxite with Response Surface Methodology. Processes 2024, 12, 1440. [Google Scholar] [CrossRef]
  14. He, X.; Wang, C.H.; Shoemaker, C.A. Multi-objective optimization of an integrated biomass waste fixed-bed gasification system for power and biochar co-production. Comput. Chem. Eng. 2021, 154, 107457. [Google Scholar] [CrossRef]
  15. Gao, Z.; Miao, J.; Zhao, J.; Mesri, M. Comprehensive economic analysis and multi-objective optimization of an integrated gasification power generation cycle. Process Saf. Environ. Prot. 2021, 155, 61–79. [Google Scholar] [CrossRef]
  16. De Pinho, J.M.; Leiroz, A. Detailed One-Dimensional Analysis of Sugarcane Bagasse Gasification Process in Bubbling Fluidized Beds. 14th Brazilian Congress of Thermal Sciences and Engineering, Rio de Janeiro, 2012. Available online: https://www.researchgate.net/publication/281107852 (accessed on 20 July 2024).
  17. Islam, M.N.; Beg, M.R.A. Fixed Bed Pyrolysis of Waste Plastic for Alternative Fuel Production. J. Energy Environ. 2004, 3, 69–80. Available online: https://www.researchgate.net/publication/242411263 (accessed on 20 July 2024).
  18. Hasan, M.M.; Rasul, M.G.; Jahirul, M.I.; Sattar, M.A. An Aspen plus process simulation model for exploring the feasibility and profitability of pyrolysis process for plastic waste management. J. Environ. Manag. 2024, 355, 120557. [Google Scholar] [CrossRef] [PubMed]
  19. Xiong, S.; He, J.; Yang, Z.; Guo, M.; Yan, Y.; Ran, J. Thermodynamic analysis of CaO enhanced steam gasification process of food waste with high moisture and low moisture. Energy 2020, 194, 116831. [Google Scholar] [CrossRef]
  20. Singh, D.K.; Tirkey, J.V. Modeling and multi-objective optimization of variable air gasification performance parameters using Syzygium cumini biomass by integrating ASPEN Plus with Response surface methodology (RSM). Int. J. Hydrogen Energy 2021, 46, 18816–18831. [Google Scholar] [CrossRef]
  21. Lopez, G.; Erkiaga, A.; Amutio, M.; Bilbao, J.; Olazar, M. Effect of polyethylene co-feeding in the steam gasification of biomass in a conical spouted bed reactor. Fuel 2015, 153, 393–401. [Google Scholar] [CrossRef]
  22. Nguyen, N.M.; Alobaid, F.; May, J.; Peters, J.; Epple, B. Experimental study on steam gasification of torrefied woodchips in a bubbling fluidized bed reactor. Energy 2020, 202, 117744. [Google Scholar] [CrossRef]
  23. Montgomery, D.C. Design and Analysis of Experiments Ninth Edition; John Wiley & Sons, Inc.: Hoboken, NJ, USA, 2017. [Google Scholar]
  24. Khan, M.M.; Xu, S.; Wang, C. Catalytic gasification of coal in a decoupled dual loop gasification system over alkali-feldspar. J. Energy Inst. 2021, 98, 77–84. [Google Scholar] [CrossRef]
  25. Song, W.; Deng, C.; Guo, S. Effect of Steam on the Tar Reforming during Circulating Fluidized Bed Char Gasification. ACS Omega 2021, 6, 11192–11198. [Google Scholar] [CrossRef] [PubMed]
  26. Pio, D.T.; Gomes, H.G.M.F.; Tarelho, L.A.C.; Vilas-Boas, A.C.M.; Matos, M.A.A.; Lemos, F.M.S. Superheated steam injection as primary measure to improve producer gas quality from biomass air gasification in an autothermal pilot-scale gasifier. Renew. Energy 2022, 181, 1223–1236. [Google Scholar] [CrossRef]
  27. Salisu, J.; Gao, N.; Quan, C.; Yanik, J.; Artioli, N. Co-gasification of rice husk and plastic in the presence of CaO using a novel ANN model-incorporated Aspen plus simulation. J. Energy Inst. 2023, 108, 101239. [Google Scholar] [CrossRef]
  28. Ma, C.; Zhou, Y.; Wang, J.; Li, X. Numerical study on solar spouted bed reactor for conversion of biomass into hydrogen-rich gas by steam gasification. Int. J. Hydrogen Energy 2020, 45, 33136–33150. [Google Scholar] [CrossRef]
  29. Inayat, M.; Sulaiman, S.A.; Kurnia, J.C.; Shahbaz, M. Effect of various blended fuels on syngas quality and performance in catalytic co-gasification: A review. Renew. Sustain. Energy Rev. 2019, 105, 252–267. [Google Scholar] [CrossRef]
  30. Galvagno, A.; Prestipino, M.; Chiodo, V.; Maisano, S.; Brusca, S.; Lanzafame, R. Biomass blend effect on energy production in a co-gasification-CHP system. In AIP Conference Proceedings; American Institute of Physics Inc.: College Park, MD, USA, 2019. [Google Scholar] [CrossRef]
  31. Yuan, P.; Hu, X.; Li, Y.; Guo, T.; Ma, J.; Guo, Q. Multi-scale experimental and autothermal simulation of bituminous coal and corn straw chemical looping co-gasification for cleaner production of syngas. J. Clean. Prod. 2024, 434, 140166. [Google Scholar] [CrossRef]
  32. Chen, Y.D.; Chen, W.Q.; Huang, B.; Huang, M.J. Process optimization of K2C2O4-activated carbon from kenaf core using Box-Behnken design. Chem. Eng. Res. Des. 2013, 91, 1783–1789. [Google Scholar] [CrossRef]
  33. Glyk, A.; Solle, D.; Scheper, T.; Beutel, S. Optimization of PEG-salt aqueous two-phase systems by design of experiments. Chemom. Intell. Lab. Syst. 2015, 149, 12–21. [Google Scholar] [CrossRef]
  34. Lou, H.; Li, W.; Li, C.; Wang, X. Systematic investigation on parameters of solution blown micro/nanofibers using response surface methodology based on box-Behnken design. J. Appl. Polym. Sci. 2013, 130, 1383–1391. [Google Scholar] [CrossRef]
  35. Wilcox, R.R. Applying Contemporary Statistical Techniques; Elsevier: Amsterdam, The Netherlands, 2003. [Google Scholar]
  36. Shehzad, A.; Bashir, M.J.K.; Horttanainen, M.; Manttari, M.; Havukainen, J.; Abbas, G. Modeling and comparative assessment of bubbling fluidized bed gasification system for syngas production—A gateway for a cleaner future in Pakistan. Environ. Technol. 2018, 39, 1841–1850. [Google Scholar] [CrossRef]
  37. Inayat, M.; Sulaiman, S.A.; Sanaullah, K. Effect of blending ratio on co-gasification performance of tropical plant-based biomass. In IET Conference Publications; Institution of Engineering and Technology: Stevenage, UK, 2016. [Google Scholar] [CrossRef]
  38. Xiao, X.; Wang, X.; Zheng, Z.; Qin, W.; Zhou, Y. Catalytic coal gasification process simulation with alkaline organicwastewater in a fluidized bed reactor using aspen plus. Energies 2019, 12, 1367. [Google Scholar] [CrossRef]
  39. Méndez, M.; Frutos, M.; Miguel, F.; Aguasca-Colomo, R. Topsis decision on approximate pareto fronts by using evolutionary algorithms: Application to an engineering design problem. Mathematics 2020, 8, 2072. [Google Scholar] [CrossRef]
  40. Erdem, K.; Han, D.G.; Midilli, A. A parametric study on hydrogen production by fluidized bed co-gasification of biomass and waste plastics. Int. J. Hydrogen Energy 2024, 52, 1434–1444. [Google Scholar] [CrossRef]
Figure 1. Aspen Plus modeling of the co-gasifier.
Processes 12 01906 g001
Figure 2. The effect of gasifier temperature on (a) syngas compositions, (b) GY and LHV, and (c) CGE and CCE of syngas at S/F ratio = 1 and P/B ratio = 50:50.
Processes 12 01906 g002
Figure 3. The effect of S/F ratio on (a) syngas compositions, (b) GY and LHV, and (c) CGE and CCE of syngas at T = 800 °C and P/B ratio = 50:50.
Processes 12 01906 g003
Figure 4. The effect of P/B ratio on (a) syngas compositions, (b) GY and LHV, and (c) CGE and CCE of syngas at T = 800 °C and S/F ratio = 1.
Processes 12 01906 g004
Figure 5. 3D surface plot of operating condition on (ac) CGE and (df) CCE value using Design-Expert software.
Processes 12 01906 g005
Figure 6. Pareto frontier plot from the genetic algorithm.
Processes 12 01906 g006
Table 1. Results of proximate and ultimate analysis for biomass and solid waste.
CharacteristicsSugarcane Bagasse [16]Mixed Plastic [17]
Proximate analysis (%wt, dry basis)
Moisture content4.260.41
Volatile matter11.520.28
Fixed carbon81.4697.28
Ash content7.022.44
Ultimate analysis (%wt, dry basis)
Carbon47.6383.93
Hydrogen6.1612.84
Oxygen *38.460.79
Nitrogen0.420.00
Sulfur0.310.00
LHV [MJ/kg]16.3530.28
* Calculated by the difference (O = 100-C-H-N-S-Ash).
Table 2. Overall unit model and operating conditions.
Unit NameUnit ModuleOperating Conditions
Temperature [°C]Pressure [bar]
DRYERRSTOIC1501
FLASHFLASH1501
DECOMP1RYIELD5001
DECOMP2RYIELD5001
MIXER1MIXER-1
PYRO-RERGIBBS7001
HEATERHEATER2501
MIXER2MIXER-1
GASIFIERRGIBBS600–10001
Table 3. The co-gasification reaction at equilibrium [19].
Reaction∆H [kJ/mol]
Partial oxidationC + 0.5O2 → CO−110(R1)
CombustionH2 + 0.5O2 → H2O−242(R2)
C + O2 → CO2−393(R3)
BoudouardC + CO2 → 2CO+172(R4)
Water gasC + H2O → CO + H2+131(R5)
MethanationC + 2H2 → CH4−75(R6)
Water gas shiftCO + H2O ↔ CO2 + H2−41(R7)
Steam methane reformingCH4 + H2O ↔ CO + 3H2+206(R8)
Formation of H2SH2 + S → H2S−20.2(R9)
Table 4. Results of proximate and ultimate analyses of feedstocks.
CharacteristicsLopez et al. [21]Nguyen et al. [22]
Pinewood WasteHDPEWoodchips
Proximate analysis (%wt, dry basis)
Moisture content9.400.005.28
Volatile matter18.430.3024.09
Fixed carbon81.0299.7074.69
Ash content0.550.001.21
Ultimate analysis (%wt, dry basis)
Carbon49.0685.7154.46
Hydrogen6.0314.295.99
Oxygen44.320.0038.09
Nitrogen0.040.000.24
Sulphur0.000.000.00
Table 5. The independent variables with factors and levels.
FactorVariableLevel
−101
AT [°C]6008001000
BS/F0.511.5
CP/B255075
Table 6. The comparison results of experimental data with the simulation result.
Syngas CompositionSyngas Product [%vol. dry]
Lopez et al. [21]This StudyNguyen et al. [22]This Study
H257.061.048.053.6
CO28.027.625.028.2
CO28.07.322.017.1
CH47.04.15.01.1
RMSE a (%)2.514.48
a Root mean square error.
Table 7. ANOVA results of CGE and CCE values.
SourceCGECCE
F-Valuep-ValueF-Valuep-Value
Model59.380.000120.280.000
A-T163.340.000339.810.000
B-S/F228.220.000497.050.000
C-P/B0.430.54227.920.003
A243.100.00131.250.003
B254.430.00187.850.000
C214.300.01329.020.003
AB14.040.01313.640.014
AC17.340.00923.160.005
BC12.610.01650.360.001
R2 99.07%99.54%
R2 (Adjusted)97.40%98.71%
R2 (Predicted)85.17%92.64%
Table 8. Comparison of optimization results between predicted and Aspen simulation results.
Optimal ResultGA with TOPSISAspen PlusError
CGE (%)91.7892.580.800
CCE (%)83.7785.972.200
Table 9. Summary of literature on the gasification process.
AuthorsFeedstocksOperating ConditionKey Findings
A. Shehzad et al. [36]MSWT = 500–900 °C
ER = 0.2–0.7
Moisture content = 0–56%
CGE = 32–95%
CCE = 45–98%
M. Inayat et al. [37]OPF and CST = 600 °C
Air flow rate = 380 L/min
Blending ratio = 0–100%
CGE = 58–70%
CCE = 90–98%
X. Xiao et al. [38]CoalT = 550–900 °C
Steam/coal = 0–5
ER = 0–1
CGE = 35–84%
CCE = 45–85%
Disclaimer/Publisher’s Note: The statements, opinions and data contained in all publications are solely those of the individual author(s) and contributor(s) and not of MDPI and/or the editor(s). MDPI and/or the editor(s) disclaim responsibility for any injury to people or property resulting from any ideas, methods, instructions or products referred to in the content.

