Article

The Synergistic Effect of CeO2 and Micron-Cu Enhances the Hydrogenation of CO2 to CO

1
State Key Laboratory of Coal Combustion, School of Energy and Power Engineering, Huazhong University of Science and Technology, Wuhan 430074, China
2
Key Laboratory of New Materials and Facilities for Rural Renewable Energy of Ministry of Agriculture and Rural Affairs, College of Mechanical & Electrical Engineering, Henan Agricultural University, Zhengzhou 450002, China
3
Key Laboratory for Thermal Science and Power Engineering of Ministry of Education, Beijing Key Laboratory of CO2 Utilization and Reduction Technology, Department of Energy and Power Engineering, Tsinghua University, Beijing 100084, China
4
Ministry of Education Key Laboratory for Earth System Modeling, Department of Earth System Science, Tsinghua University, Beijing 100084, China
*
Author to whom correspondence should be addressed.
These authors contributed equally to this work.
Processes 2024, 12(9), 1912; https://doi.org/10.3390/pr12091912
Submission received: 29 July 2024 / Revised: 24 August 2024 / Accepted: 3 September 2024 / Published: 6 September 2024

Abstract

:
The catalytic applications of micron Cu powder are limited due to its large particle size and small specific surface area. Modifying micro-Cu powder to achieve a high catalytic performance is a challenge in the application of micron copper. In this work, micro-Cu was used to synthesize a CeO2–Cu catalyst, and the phase composition and surface pore structure were analyzed using XRD, BET, etc. The CO2 hydrogenation performance of the CeO2–Cu catalyst was analyzed in comparison with CeO2 and Cu, and we found that the CeO2–Cu catalyst exhibited a synergistic effect between Cu and cerium, resulting in a much higher hydrogenation performance at 500 °C than CeO2 or Cu alone. H2-TPR and TEM characterization revealed that the CeO2–Cu catalyst formed interfacial interactions with a relatively large Ce–Cu interface, where cerium oxide could promote the reduction of CuO and lower the reduction temperature. Additionally, cerium oxide formed a confinement structure for Cu, and the CeO2–Cu catalyst exhibited a higher oxygen vacancy concentration, thereby promoting the CO2 hydrogenation performance. Cu–CeO2 interaction provides valuable insights into the catalytic application of micron Cu powder.

1. Introduction

As industrialization accelerates, the demand for energy from humans is increasing, leading to the consumption of a large amount of fossil energy and the emission of a large amount of CO2 into the atmosphere, disrupting the atmospheric carbon balance [1,2]. The increase in CO2 concentration triggers a series of environmental problems, such as ocean acidification and the greenhouse effect [3,4,5,6]. The rising global temperature not only accelerates the melting of the Arctic glaciers and the rise in sea levels but also increases the frequency of extreme weather events, causing damage to the human living environment [7]. Therefore, reducing CO2 emissions and in doing so lowering the concentration of CO2 in the atmosphere is an urgent challenge that needs to be addressed [8,9,10].
The hydrogenation of CO2 is currently one of the most researched and effective methods for CO2 reduction [9,11,12]. This involves using unstable electricity generated from renewable energy sources (such as solar and wind power) to electrolyze water for hydrogen production, and then obtaining high-value-added products such as CO, methane, and ethylene through the hydrogenation of CO2 [13,14,15,16]. CO2 hydrogenation reduces the concentration of carbon dioxide in the atmosphere and converts CO2 into high-value-added products, generating economic benefits [17]. Among various CO2 hydrogenation methods, the process of converting CO2 to CO via an RWGS reaction is widely studied due to the high application flexibility of the resulting CO [18]. CO, as the main component of syngas, can be utilized not only for methanol synthesis but also for the Fischer–Tropsch (F-T) reaction [19,20,21]. Additionally, CO can be applied in chemical reactions to synthesize acetic acid, phosgene, and other substances [18]. Due to the endothermic nature of the reverse water–gas shift (RWGS) reaction under atmospheric pressure, the reaction requires high temperatures [22]. However, high temperatures can lead to catalyst deactivation and hydrogenation side reactions, resulting in reduced CO selectivity [23]. Therefore, it is necessary to design efficient catalysts to lower the reaction temperature and regulate product selectivity.
Cu-based catalysts have been widely applied in CO2 hydrogenation reactions in recent years due to their low reduction temperature and excellent hydrogenation CO selectivity [24]. However, the CO2 hydrogenation conversion activity in the low-temperature conditions is relatively low [25,26,27]. Chen’s research revealed that the RWGS reaction mainly occurs at the metal–support interface, where the metal activates the hydrogen molecule and the metal–support interface adsorbs and activates CO2 [11,28]. Increasing the metal–support interface will thus be beneficial for the RWGS reaction [29,30]. Currently, catalyst design research has primarily focused on nano-Cu catalysts, while micron-sized Cu powder produced from ball milling of industrial waste copper has received less application due to its large particle size and small specific surface area, resulting in poor CO2 hydrogenation activity [31]. Therefore, modifying the micron-sized Cu powder to improve its catalytic capability presents a current challenge in applying industrial waste copper in CO2 catalytic reactions.
The interfacial structure of the metal and oxide support plays a pivotal role in the reverse water–gas shift (RWGS), and reconstructing the Cu–CeO2 interface will improve CO2 hydrogenation performance [30,32,33]. Zhang and co-workers found that the Cu–CeO2 interface is related to the RWGS activity, and increasing the Cu–CeO2 interface benefits CO generation [24]. Furthermore, Zhou et al. found that Cu can be doped into the CeO2 lattice, increasing CeO2 lattice spacing, resulting in more Ce3+ formation, and inducing the generation of more oxygen vacancies, and that the oxygen vacancies together with Ce3+ can serve as active sites to activate CO2 and enhance the CO2 hydrogenation reaction [34]. Our previous work also demonstrated that Cu interacted with CeO2 to form a Cu–O–Ce interface and induced more oxygen vacancy formation [31]. The oxygen vacancies around the Cu–CeO2 interface enhanced CO2 adsorption and promoted CO2 conversion. CO2 reacted with active hydrogen to form COOH, and then COOH species dissociated into CO and OH adsorbed on the surface of Cu–CeO2. Therefore, constructing a Cu–CeO2 interface may be advantageous for enhancing micro-Cu CO2 hydrogenation performance. However, little work has investigated the relationship between Cu and CeO2, though it may play a vital role in understanding the CO2 hydrogenation performance of Cu–Ce-based catalysts.
In this work, the CeO2–Cu catalyst was synthesized with micron-sized Cu, and the ceria–Cu interface was constructed for CO2 utilization. The phase composition and surface pore structure information of the CeO2–Cu catalyst were analyzed with XRD, BET, etc. The catalytic performance of CO2 hydrogenation was analyzed and compared with CeO2 and Cu alone. A synergistic effect appeared with Cu and cerium oxide. H2-TPR and TEM characterization were measured to reveal the CeO2–Cu interfacial interactions and CeO2 effect on micro-Cu. Additionally, the CeO2–Cu structure and oxygen vacancy information were investigated to reveal the enhancement of CeO2 for CO2 hydrogenation performance.

2. Experimental Section

2.1. Synthesis of Catalysts

All the chemicals (micro Cu, Ce(NO3)3·6H2O) were purchased from Aladdin Chemistry Co., Ltd., Shanghai, China without any further purification. The CeO2–Cu catalyst was synthesized using a precipitation method. Firstly, a certain amount of Ce(NO3)3·6H2O was dispersed and dissolved in ethanol, and then 0.5 g of micro-Cu powder was added, followed by stirring at room temperature for 30 min. Subsequently, a grey solid was obtained by adding ammonia water for precipitation, which was washed three times with water by centrifugation, and then dried to obtain the grey–black sample named CeO2–Cu. The CeO2 catalyst was also synthesized using a precipitation method. Initially, a certain amount of Ce(NO3)3·6H2O was dispersed and dissolved in water, and then a grey solid was obtained by adding ammonia water for precipitation; the solid was washed three times with water by centrifugation, and then dried to obtain the light yellow sample named CeO2.

2.2. Characterization

X-ray powder diffraction (XRD) was employed using a D8 X-ray diffractometer (from Bruker AXS, Karlsruhe, Germany) to conduct crystal structure analysis of CeO2–Cu, CeO2, and Cu samples. Cu Kα (λ = 0.15418 nm) was utilized with parameters set at 40 kV, 40 mA, a testing range from 20 to 80°, and a scan step size of 0.01313°. The final spectrum was compared with the JCPDS card library to determine the composition of the powders. The BET surface area analyzer 3H-2000PS (Beishide Instrument Technology (Beijing) Co., Ltd., Beijing, China) was used to investigate differences in pore size distribution and specific surface area of the CeO2–Cu, CeO2, and Cu samples. Before the BET testing, all the materials were pre-heated at 180 °C for 180 min to decrease the absorbed gases. The scanning transmission electron microscope (STEM) Talos F200X (from FEI, Eindhoven, The Netherlands) was utilized to analyze the elemental composition of the CeO2–Cu, CeO2, and Cu samples, as well as to select a line for energy-dispersive X-ray spectroscopy (EDS) analysis. Prior to the TEM analysis, the CeO2–Cu, CeO2, and Cu samples were pretreated under ultra-sonication for 0.5 h, to achieve a uniform dispersion in an ethanol solvent, and then with the evaporation of three suspensions dropped on a gold grid.
Hydrogen Temperature Programmed Reduction (H2-TPR) was performed using a chemisorption analyzer (AutoChem II, Micromeritics, Norcross, GA, USA), and the hydrogen signal was monitored and analyzed online using a TCD detector. CeO2–Cu, CeO2, and Cu samples were first pretreated at 400 °C with pure He gas (30 mL/min) for 20 min to degas the adsorbed molecules (such as oxygen, nitrogen, carbon dioxide, or water), and then cooled to room temperature before introducing 10% H2/Ar (30 mL/min). Subsequently, the samples underwent programmed temperature ramping from 30 °C to 500 °C at a rate of 10 °C/min. The H2 consumption during the temperature ramping was determined with a TCD detector. LabRAM HR800 (LabRAM Odyssey, Longjumeau, France) was measured to collect Raman spectroscopy of the CeO2–Cu, CeO2, and Cu samples.

2.3. Evaluation of Catalytic Performance

The performance of CeO2–Cu, CeO2, and Cu catalysts was evaluated with a microreactor furnace (PH950, Apera Instruments, Shanghai, China) under atmospheric pressure. First, 50 mg of the catalyst was loaded into a U-shaped tube (d = 8 mm) and subjected to a pre-reduction treatment at 400 °C in a reducing atmosphere. After cooling to room temperature, the reactants (1%CO2 + 4%H2 + 95%Ar, Ar was balanced gas) were introduced, and the temperature was ramped up at a rate of 10 °C/min for activity testing in the range of 500−700 °C. Online analysis of CO2 hydrogenation products was performed using gas chromatography (GC-2020, Hengxin, Jiangsu, China), which was equipped with packed columns (ZKAT-Z13 PLOT, ATEO) and a flame ionization detector with mechanized nickel, which exhibited the separation and quantification of CO2, CO, and CH4. The formula for calculating the CO2 conversion rate and CO selectivity are listed as follows:
CO2 Conversion = ([CO2]in − [CO2]out)/[CO2]int ∗ 100%
CO Selectivity = [CO]out/([CO2]in − [CO2]out) ∗ 100%

3. Results and Discussion

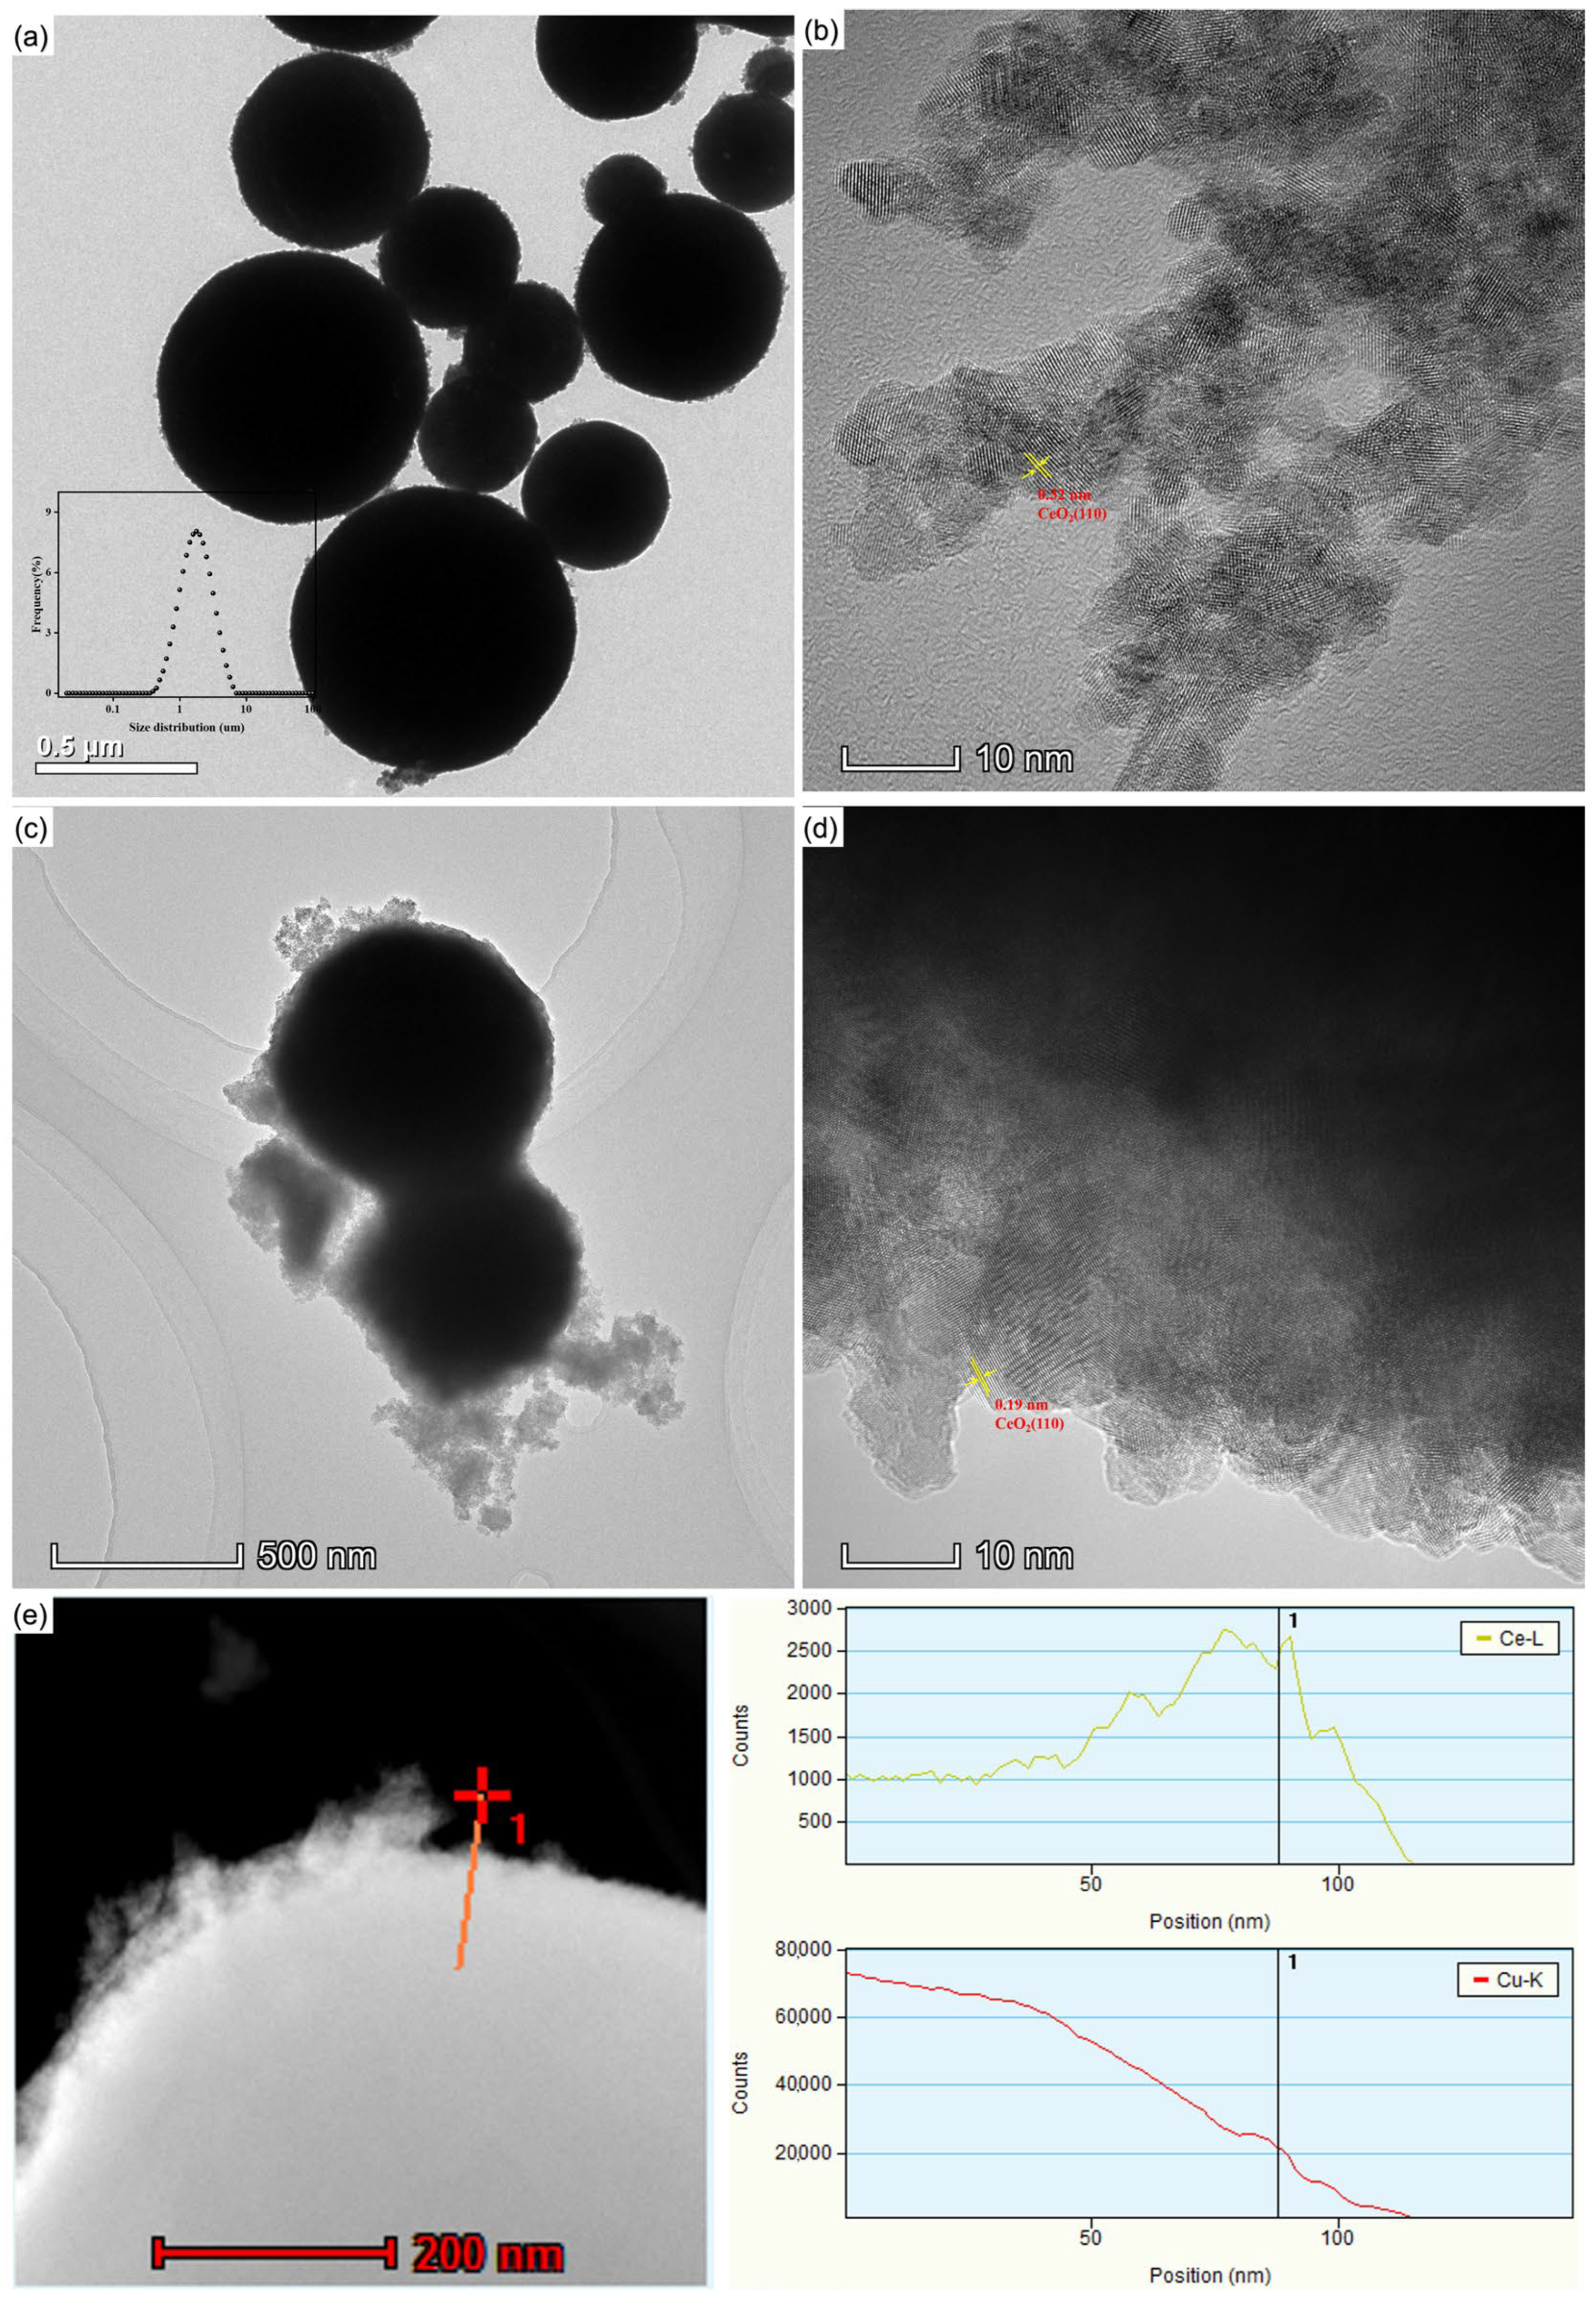
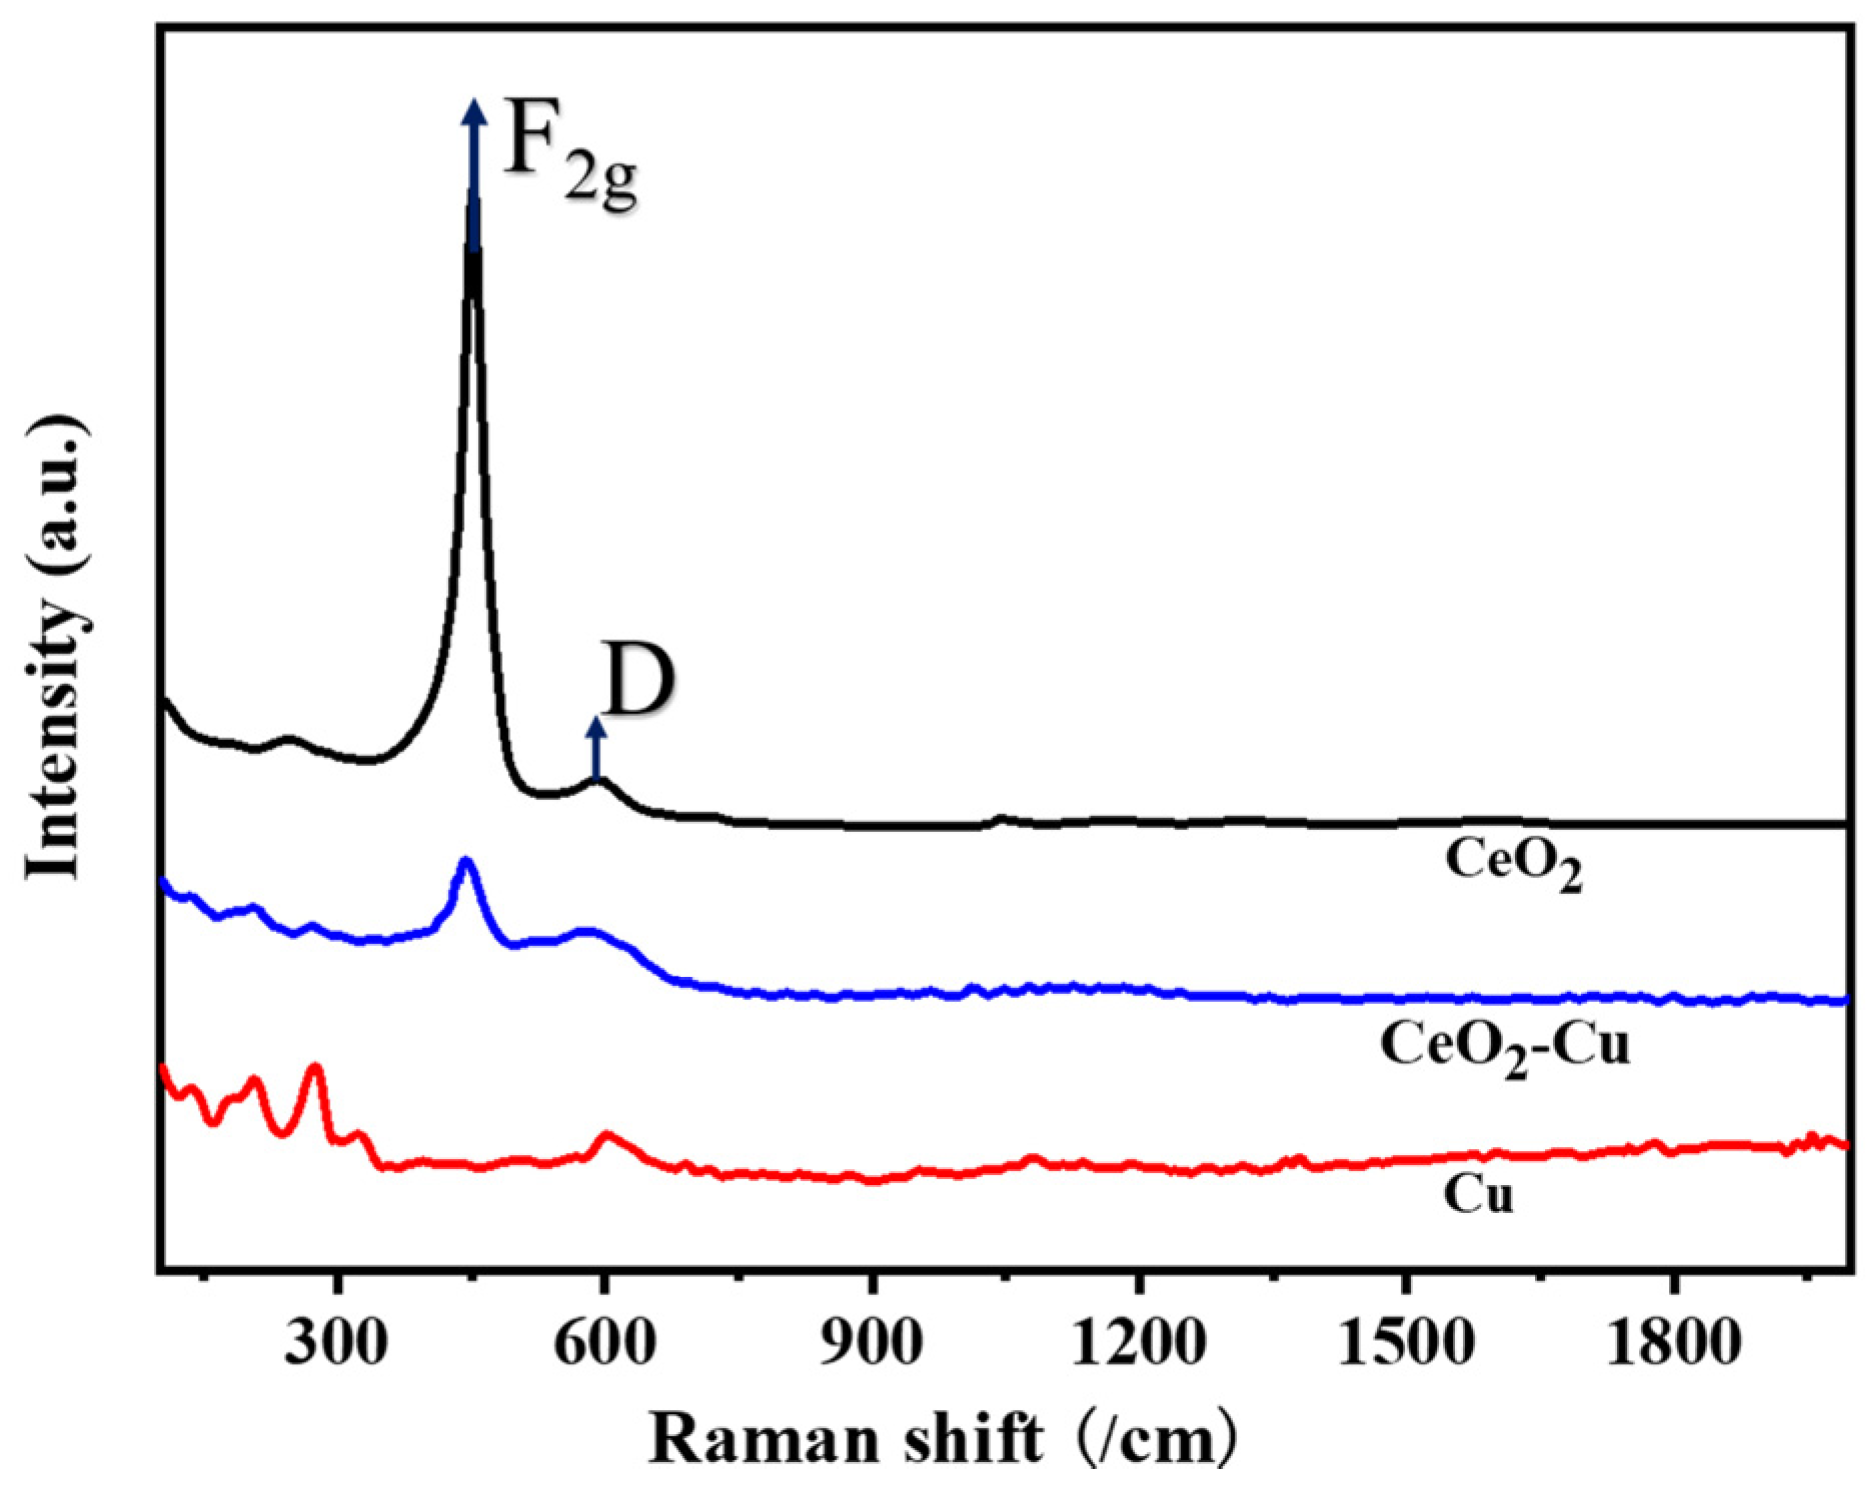
3.1. Characterization

In order to study the effect of cerium addition on the structure of micro-copper powders, XRD characterization was performed on CeO2–Cu, CeO2, and micro-Cu, and the results are shown in Figure 1. The peaks located at 28.549°, 33.077°, 47.483°, 56.342°, 59.09°, 69.416°, 76.704°, and 79.077° could be assigned to the fluorite cubic structure of CeO2 (JCPDS#34-0394). The peaks located at 43°, 51°, and 74° were consistent with the Cu metallic phase (CPDS#04-0836). It can be observed that in the XRD spectrum of the CeO2–Cu sample synthesized with cerium nitrate, the signal for CeO2 is weak, the peak for Cu is strong, and there is essentially no peak for CuO. Micro-Cu exhibited a strong Cu peak, while the signal intensity for the cerium oxide sample was relatively weak, consistent with the weak CeO2 signal for the CeO2–Cu sample, indicating poor crystallinity of CeO2 prepared by the cerium nitrate precipitation method. The weak signal peak for CeO2 in CeO2–Cu may be attributed to the strong interaction between Ce and Cu. The Cu signal peaks in the CeO2–Cu synthesized from the cerium nitrate precursor and in the micro-Cu both exhibited strong signals, with the Cu signal peak in micro-Cu was stronger than that in CeO2–Cu, indicating a possible interaction between cerium oxide and Cu, leading to a weakening of the metal Cu signal peak. The difference in the signal peaks of Cu substances suggests an interaction between CeO2 and micrometer-sized Cu. The interaction between CeO2 and micrometer-sized Cu may lead to the formation of more oxygen vacancies in CeO2, which could potentially promote reactivity.
To study the effect of cerium addition on the surface pore structure of micro-Cu powder, a specific surface area analysis was conducted on CeO2–Cu, CeO2, and micro-Cu. The results of nitrogen adsorption–desorption isotherms and pore size distribution are shown in Figure 2, while the specific surface area and average pore size results are presented in Table 1. After loading with ceria species, the specific surface area of CeO2–Cu was larger than that of micro-Cu but smaller than that of ceria, and the pore size distribution shifted towards that of CeO2. There was a significant difference in the pore size distribution between CeO2–Cu and micro-Cu, indicating that ceria addition has an impact on the pore size distribution of Cu and that the difference in the pore size distribution of CeO2–Cu may result from the interaction between CeO2 and micro-Cu.

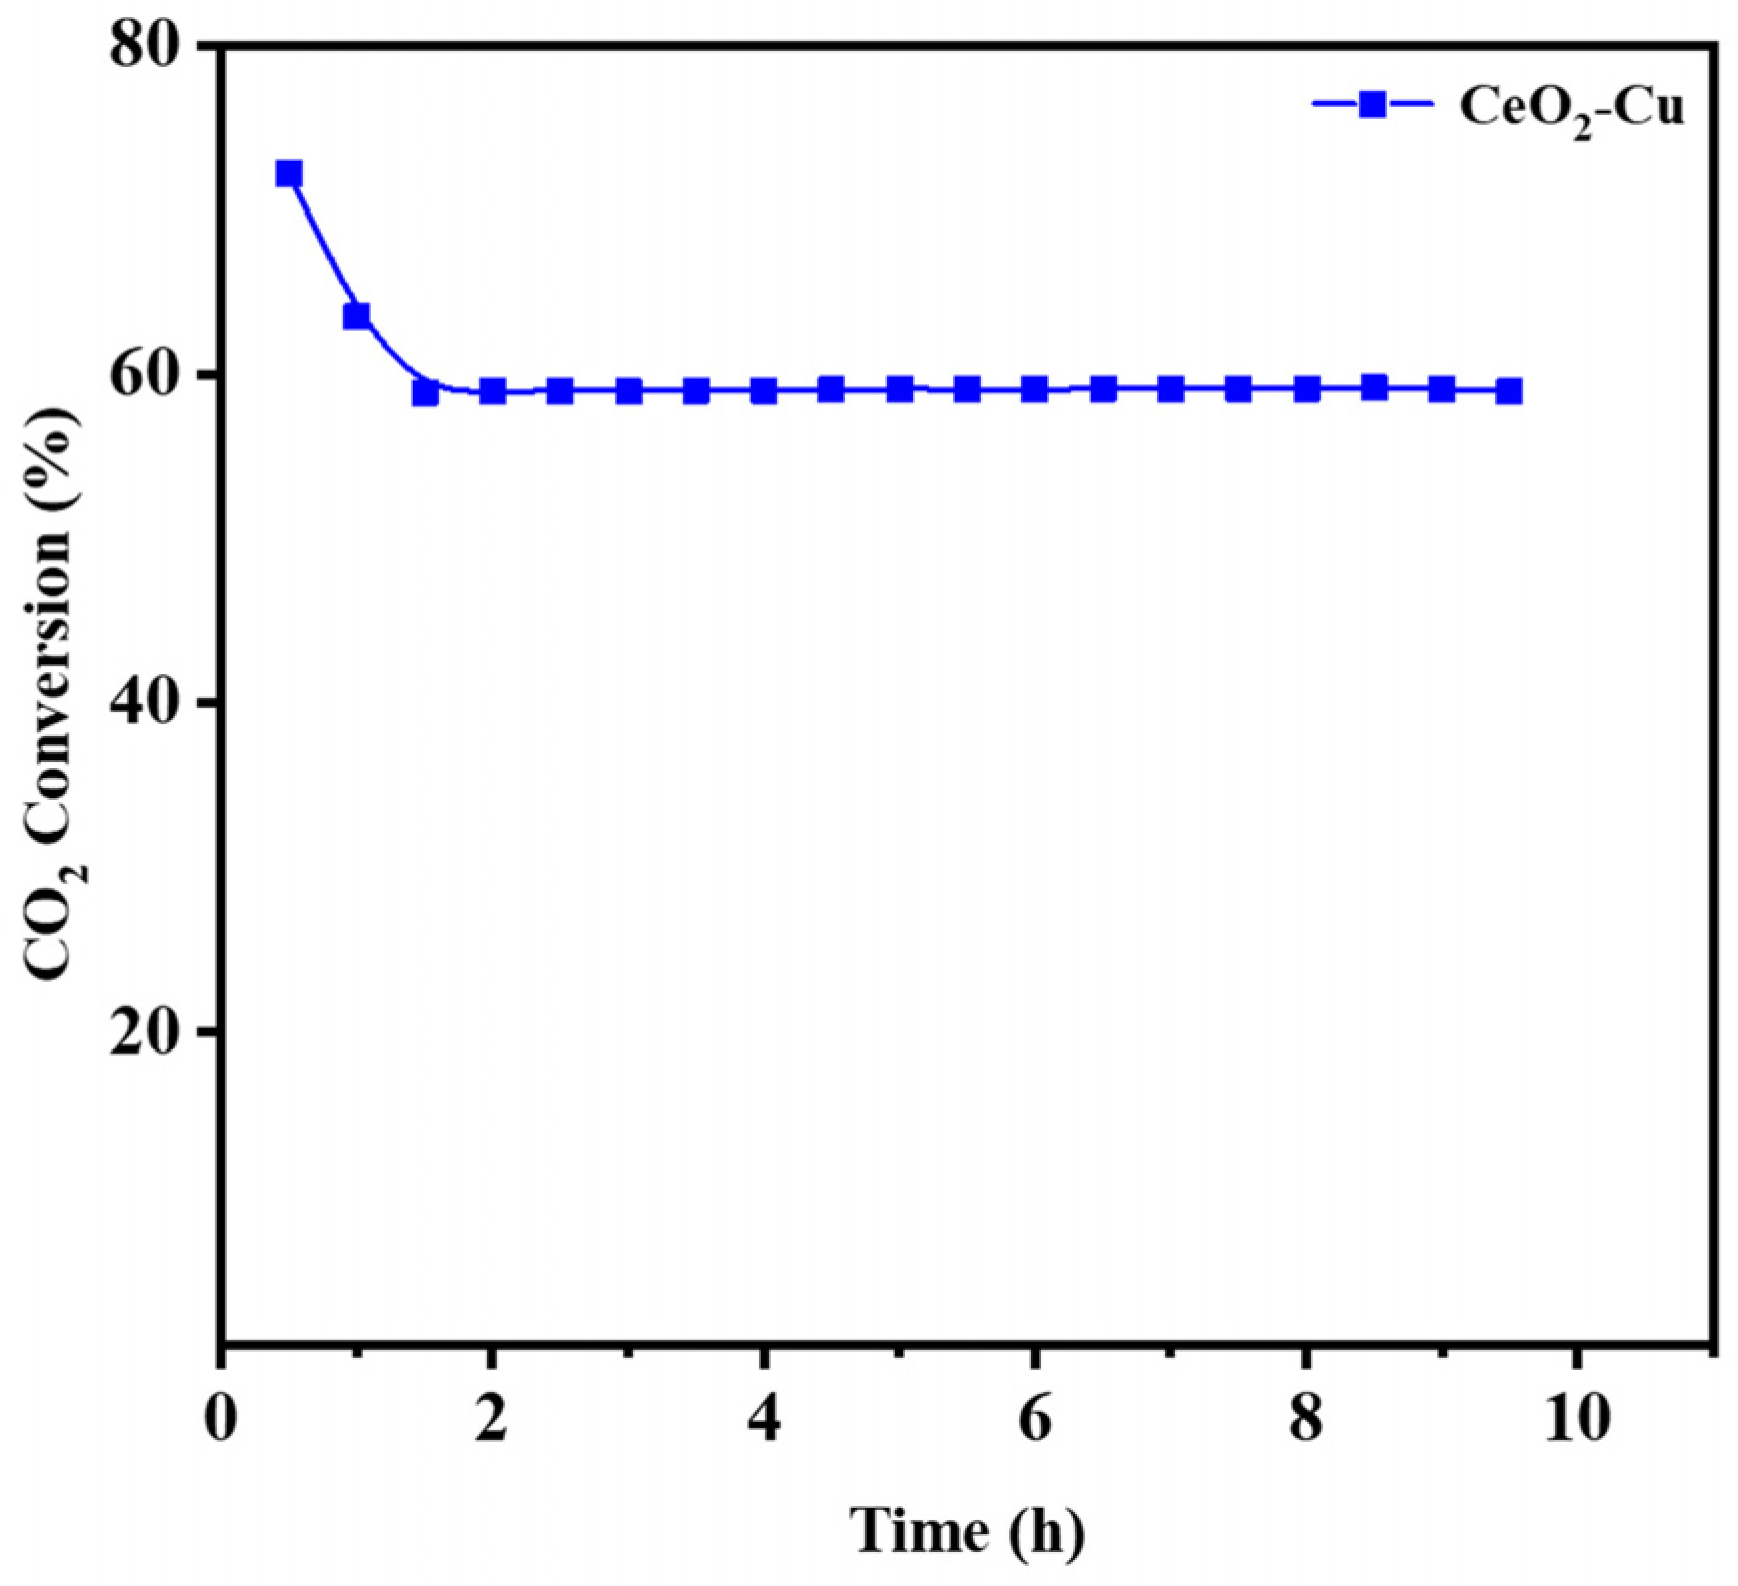
3.2. CO2 Hydrogenation Performance

To analyze the effect of cerium addition on the catalytic performance of micro-Cu, the CO2 hydrogenation activities of CeO2–Cu, CeO2, and Cu micro-powders were studied. Activity tests were conducted in the 500−700 °C range, and the CO2 hydrogenation activities of CeO2–Cu, CeO2, and Cu catalysts are shown in Figure 3. At 500 °C, the CO2 hydrogenation activity of the CeO2–Cu catalyst reached 49.82%, which is more than 204 times higher than that of the Cu catalyst (0.244%). In contrast, the CeO2 catalyst showed minimal CO2 hydrogenation activity at this temperature (4.627%), and the CO selectivity of all three catalysts for CO2 hydrogenation was 100%. The results of CO2 hydrogenation activities for CeO2–Cu, CeO2, and Cu catalysts indicated a synergistic effect between Cu and CeO2 in CeO2–Cu. While the CO2 conversion activity of individual Cu or CeO2 was poor at 500 °C, when Cu was combined with ceria, Cu–CeO2 supported more active sites for the RWGS reaction, exhibiting a higher CO2 conversion rate. These results suggested that both ceria and copper are involved in the CO2 hydrogenation process, with Cu playing a key role in activating hydrogen at moderate temperatures, while ceria provides active sites to promote CO2 activation and form carbonates for further hydrogenation conversion [11,24].
Increasing the temperature can promote the activation of CO2 and H2 molecules, thereby enhancing the CO2 hydrogenation activity. At high temperatures, the CO selectivity of the CO2 hydrogenation products for CeO2–Cu, CeO2, and Cu catalysts is 100%, indicating that the ceria addition does not affect the hydrogenation selectivity of Cu under atmospheric pressure conditions. These results were consistent with the results of previous studies on Cu-catalyzed hydrogenation [31,35]. Under atmospheric pressure, CuO species were reduced to a metallic state and exhibited high CO selectivity during the CO2 hydrogenation process.
The hydrogenation performance of the cerium oxide was reported to be mainly determined by oxygen vacancies on the CeO2 surface, and oxygen vacancies were key to activating hydrogen molecules [36]. Pure cerium oxide exhibited relatively poor activity, and increasing the temperature could significantly promote the hydrogenation activity of cerium oxide. In the Cu–CeO2 catalyst system, the metal Cu can activate hydrogen molecules at low temperatures, producing active hydrogen, which then interacts with activated carbonates to produce formate or carboxylate and further hydrogenates to generate CO and water. During the RWGS reaction, the CO2 conversion activity of Cu–CeO2 at 500 °C is nearly 10.7 times higher than that of cerium oxide, possibly due to the reduction properties of the metal Cu, and the active Cu sites are beneficial for hydrogen activation. At 700 °C, the CO2 hydrogenation activity of CeO2–Cu is similar to that of CeO2 catalysts, and it was 8.9 times higher than that of micro-Cu. Increasing the temperature induced a similar hydrogenation behavior between Cu–CeO2 and cerium oxide, indicating that Cu metal has little effect on hydrogenation activity. CeO2 could provide a function of H2 activation and CO2 activation, and the CO2 conversion rate was no longer limited by hydrogen activation at high temperatures. Previous studies revealed that hydrogen activation is no longer the main limitation of cerium oxide under high-temperature conditions; instead, the activation of CO2 molecules becomes the main factor affecting its activity [36,37,38]. Therefore, the micro-Cu catalyst exhibited relatively poor hydrogenation activity at 700 °C. On the surface of Cu, the surface charge is not conducive to the activation of CO2 molecules, hence the poor catalytic activity of Cu [39]. The construction of Cu–CeO2 can induce Cu–CeO2 interface formation, thereby significantly enhancing the CO2 hydrogenation activity via the interface oxygen vacancies and achieving efficient CO2 conversion [40]. Metal Cu and oxygen vacancies around the Cu–CeO2 interfacial area could serve as active sites for the RWGS reaction. Therefore, a higher CO2 conversion rate appeared for Cu–CeO2 than Cu or CeO2 solely, and there was a synergistic effect between Cu and cerium oxide with Cu–CeO2, enhancing the RWGS reaction performance.

3.3. CeO2 Effect on Micro-Cu

In order to study the influence of CeO2 addition on the microstructure of micro-Cu, the morphologies of CeO2–Cu, CeO2, and Cu were characterized, and the results obtained from transmission electron microscopy (TEM) are shown in Figure 4. The micro-Cu particles exhibited spherical shapes with relatively large sizes, with an average particle size distribution of 1.88 μm (Cu powders were dispersed in water, and the size distribution of micron Cu powders was measured using a mastersizer 2000, Malvern Instruments, Malvern, UK), and there could be some CuOx species on the surface of micron Cu (Figure 4a) [31].
CeO2 prepared by ammonia precipitation displayed relatively small particles, mainly showing the (110)-crystal facet (Figure 4b). The CeO2–Cu catalyst mainly presents a morphology where CeO2 wraps around micron Cu, while some cerium oxide is in a dispersed state. The synthesized CeO2–Cu appeared similar in morphology to the micron Cu material. In Figure 4c, the black area within the large spherical particles represents the metal Cu particles, while the surrounding white shadows indicate the presence of cerium oxide. Micro-Cu was confined with CeO2 species, and the CeO2 shell was relatively thin. To further reveal information on the CeO2–Cu interface, TEM energy-dispersive X-ray spectroscopy (EDS) was used to investigate the elemental distribution on the surface of CeO2–Cu. It was found that the edge of the spherical CeO2–Cu is mainly composed of cerium oxide. Figure 4d,e illustrate that the cerium oxide distribution is relatively uniform, with CeO2 being the main component on the surface of the catalyst. When the Ce peak reaches its maximum, there is a localized increase in the Cu signal peak, indicating a higher local content of Cu elements in the cerium oxide region, possibly due to the interaction between CeO2 and Cu.
CeO2 addition on the surface of micro-Cu resulted in CeO2–Cu interactions, which impacted the microstructural porosity and surface elemental distribution of Cu. In order to understand the influence of cerium oxide addition on the reduction performance of Cu catalysts, H2-TPR tests were conducted on CeO2–Cu, Cu, and CeO2 catalysts, as shown in Figure 5. The reduction peak of micrometer-sized Cu appeared at 276 °C, mainly stemming from the reduction peak of the surface copper oxide on micrometer-sized Cu [31]. The reduction peak of cerium oxide appeared at 460 °C, primarily originating from the reduction peak of the oxygen adsorbed on the surface of cerium oxide [24]. For CeO2–Cu, two reduction peaks were observed between 100 and 300 °C, attributed to the reduction peaks of Cu2O and CuOx, which strongly interact with CeO2. The addition of cerium oxide led to a shift in the reduction peak position of Cu, indicating that the addition of cerium oxide facilitated the reduction of CuO, consistent with the conclusion that CeO2 promotes the reduction of CuOx in the Cu–Ce system [11].
In order to further analyze the enhancement effect of CeO2 addition on Cu, Raman spectroscopy was conducted to confirm the role of oxygen vacancies of CeO2–Cu and CeO2 catalysts, and the results are shown in Figure 6. Two peaks appeared in the region of 200−800 cm−1. The strong peak that appeared at 456 cm−1 could correspond to the F2g vibration mode of local octahedral symmetry in CeO2. The broad Raman peak that appeared at around 600 cm−1 could be ascribed to the lattice-defect-induced (D) mode resulting from oxygen defects. The presence of oxide peaks on the surface of micron Cu indicated the existence of CuOx species [41]. After adding cerium oxide to micro-Cu, the F2g vibration peak of cerium oxide significantly weakened, possibly due to the interaction between Cu and CeO2. A reduction in the F2g peak and a low Raman shift to the D peak appeared on CeO2–Cu, indicating the presence of a Cu–O–CeO2 structure [40]. The value of ID/IF2g was calculated to reveal the concentration of oxygen vacancies in the CeO2–Cu and CeO2 catalysts. It was found that the oxygen vacancy concentration (ID/IF2g = 0.387) on the surface of CeO2–Cu was higher than that of pure CeO2 (ID/IF2g = 0.062). The oxygen vacancy concentration was regarded as the leading active site for the CO2 hydrogenation reaction, capable of activating CO2 molecules to produce carbonates for further hydrogenation to produce CO [36,42]. Therefore, Cu–CeO2 exhibited higher hydrogenation activity than that of cerium oxide at 700 °C during the hydrogenation process.
Metal sintering at high temperatures under a reduced atmosphere was the leading cause of deactivation during the RWGS reaction. A long-lifetime reaction test is a crucial indicator to evaluate the CeO2–Cu catalyst. The stability test of the RWGS reaction was operated at 700 °C, and it was found that the CeO2–Cu catalyst maintained good stability (Figure 7). The microstructure of Cu–CeO2 after the RWGS reaction was analyzed to reveal the elemental distribution of Cu–CeO2. It was observed that after high-temperature reactions, cerium oxide particles underwent sintering and increased in size, while micro-Cu was enveloped by a shell formed by cerium oxide (Figure 8). Therefore, Cu–CeO2 exhibits good CO2 hydrogenation stability at high temperatures.

4. Conclusions

This work focused on the synthesis of a CeO2–Cu catalyst, by introducing cerium salt on the surface of micron Cu, and applied the RWGS reaction. The experimental results indicated that the modified CeO2–Cu catalyst demonstrated efficient activity in the CO2 hydrogenation process. Specifically, CeO2–Cu exhibited a superior catalytic performance, reaching a conversion rate of 49.82% at 500 °C, which was 204 times higher than that of micro-Cu and 10.9 times higher than that of CeO2. A synergistic effect appeared between CeO2 and Cu species within the CeO2–Cu catalyst. Cu species and oxygen vacancies formed around the Cu–CeO2 interface, which enhanced the CO2 hydrogenation performance. Furthermore, results from TEM and BET analysis confirmed the CeO2-confined structure in the CeO2–Cu catalyst, as well as the existence of a significant Ce–Cu interface. These structural characteristics contribute to the catalyst’s excellent CO2 hydrogenation performance.
Micron-sized Cu powders are generated through ball-milling from industrial waste copper. The application of micron Cu is usually limited due to its large particle size and small specific surface area. Modified micro-Cu powder, designed to overcome this limitation and achieve a high catalytic performance, offers an insight into the application potential of industrial waste copper.

Author Contributions

B.L.: methodology, formal analysis, writing—original draft, writing—review and editing. H.S.: formal analysis, writing—original draft. L.L.: resources, formal analysis, writing—original draft. Z.Y.: formal analysis, writing—original draft. Y.G.: writing—review and editing, visualization. Y.X.: writing—review and editing, resources, funding acquisition. All authors have read and agreed to the published version of the manuscript.

Funding

This research was funded by the National Natural Science Foundation of China (52206147) and the China Postdoctoral Science Foundation (grant 2023M741884).

Data Availability Statement

The data presented in this study are available on request from the corresponding author.

Acknowledgments

This research was funded by the National Natural Science Foundation of China (52206147) and the China Postdoctoral Science Foundation (grant 2023M741884). The authors are also thankful for Zhongkebaice Technology Service Co., Ltd. (Beijing, China) providing training on and access to measurements for the TEM, H2-TPR, Raman, and XRD testing.

Conflicts of Interest

The authors declare no conflict of interest.

References

  1. Chen, J.; Xu, Y.; Liao, P.; Wang, H.; Zhou, H. Recent progress in integrated CO2 capture and conversion process using dual function materials: A state-of-the-art review. Carbon Capt. Sci. Technol. 2022, 4, 100052. [Google Scholar] [CrossRef]
  2. Ma, J.; Kong, H.; Wang, J.; Zhong, H.; Li, B.; Song, J.; Kammen, D.M. Carbon-neutral pathway to mitigating transport-power grid cross-sector effects. Innovation 2024, 5, 100611. [Google Scholar] [CrossRef] [PubMed]
  3. Mathias Dautzenberg, F.; Lu, Y.; Xu, B. Controlling the global mean temperature by decarbonization. Acta Phys.-Chim. Sin. 2020, 37, 2008066. [Google Scholar] [CrossRef]
  4. Dai, A.; Luo, D.; Song, M.; Liu, J. Arctic amplification is caused by sea-ice loss under increasing CO2. Nat. Commun. 2019, 10, 121. [Google Scholar] [CrossRef] [PubMed]
  5. Scanes, E.; Scanes, P.R.; Ross, P.M. Climate change rapidly warms and acidifies Australian estuaries. Nat. Commun. 2020, 11, 1803. [Google Scholar] [CrossRef]
  6. Geng, T.; Jia, F.; Cai, W.; Wu, L.; Gan, B.; Jing, Z.; Li, S.; McPhaden, M.J. Increased occurrences of consecutive la niña events under global warming. Nature 2023, 619, 774–781. [Google Scholar] [CrossRef]
  7. Zantye, M.S.; Arora, A.; Hasan, M.M.F. Renewable-integrated flexible carbon capture: A synergistic path forward to clean energy future. Energy Environ. Sci. 2021, 14, 3986–4008. [Google Scholar] [CrossRef]
  8. Hepburn, C.; Adlen, E.; Beddington, J.; Carter, E.A.; Fuss, S.; Mac Dowell, N.; Minx, J.C.; Smith, P.; Williams, C.K. The technological and economic prospects for CO2 utilization and removal. Nature 2019, 575, 87–97. [Google Scholar] [CrossRef]
  9. Shi, Y.; Shou, H.; Li, H.; Zhan, G.; Liu, X.; Yang, Z.; Mao, C.; Cheng, J.; Zhang, X.; Jiang, Y.; et al. Visible light-driven conversion of carbon-sequestrated seawater into stoichiometric co and HClO with nitrogen-doped BiOCl atomic layers. Angew. Chem. Int. Ed. 2023, 62, e202302286. [Google Scholar] [CrossRef]
  10. Jing, R.; Wang, R.; Xing, L.; Li, Q.; Wang, L. Industrial perspective on the current status of carbon capture application in china’s nonpower industries. Sep. Purif. Technol. 2024, 334, 125993. [Google Scholar] [CrossRef]
  11. Porosoff, M.D.; Yan, B.; Chen, J.G. Catalytic reduction of CO2 by H2 for synthesis of CO, methanol and hydrocarbons: Challenges and opportunities. Energy Environ. Sci. 2016, 9, 62–73. [Google Scholar] [CrossRef]
  12. Kattel, S.; Liu, P.; Chen, J.G. Tuning selectivity of CO2 hydrogenation reactions at the metal/oxide interface. J. Am. Chem. Soc. 2017, 139, 9739–9754. [Google Scholar] [CrossRef] [PubMed]
  13. Wang, Y.; Winter, L.R.; Chen, J.G.; Yan, B. CO2 hydrogenation over heterogeneous catalysts at atmospheric pressure: From electronic properties to product selectivity. Green Chem. 2021, 23, 249–267. [Google Scholar] [CrossRef]
  14. Wang, I.; Huang, S.; Wang, S.; Bie, X.; Zhou, H.; Li, Z. Mechanistic study of integrated CO2 capture and utilization over cu and al-modified calcined limestone with high stability using mfb-tga-ms. Sep. Purif. Technol. 2024, 333, 125975. [Google Scholar] [CrossRef]
  15. Fatimah, M.; Qyyum, M.A.; Lee, M.; Alshareef, R.S.; Aslam, M.; Saeed, B.; Dai, L.; Gilani, M.A.; Bazmi, A.A.; Chang, I.S.; et al. Industrial waste gases as a resource for sustainable hydrogen production: Resource availability, production potential, challenges, and prospects. Carbon Capt. Sci. Technol. 2024, 12, 100228. [Google Scholar] [CrossRef]
  16. Davies, W.G.; Babamohammadi, S.; Yan, Y.; Clough, P.T.; Masoudi Soltani, S. Exergy analysis in intensification of sorption-enhanced steam methane reforming for clean hydrogen production: Comparative study and efficiency optimisation. Carbon Capt. Sci. Technol. 2024, 12, 100202. [Google Scholar] [CrossRef]
  17. Wang, W.; Wang, S.; Ma, X.; Gong, J. Recent advances in catalytic hydrogenation of carbon dioxide. Chem. Soc. Rev. 2011, 40, 3703–3727. [Google Scholar] [CrossRef]
  18. Centi, G.; Quadrelli, E.A.; Perathoner, S. Catalysis for CO2 conversion: A key technology for rapid introduction of renewable energy in the value chain of chemical industries. Energy Environ. Sci. 2013, 6, 1711. [Google Scholar] [CrossRef]
  19. Zhang, C.; Li, Y.; Chu, Z.; Fang, Y.; Han, K.; He, Z. Analysis of integrated CO2 capture and utilization via calcium-looping in-situ dry reforming of methane and fischer-tropsch for synthetic fuels production. Sep. Purif. Technol. 2024, 329, 125109. [Google Scholar] [CrossRef]
  20. Zhang, Z.; Huang, G.; Tang, X.; Yin, H.; Kang, J.; Zhang, Q.; Wang, Y. Zn and na promoted fe catalysts for sustainable production of high-valued olefins by CO2 hydrogenation. Fuel 2022, 309, 122105. [Google Scholar] [CrossRef]
  21. Wang, Y.; Gao, W.; Kazumi, S.; Fang, Y.; Shi, L.; Yoneyama, Y.; Yang, G.; Tsubaki, N. Solvent-free anchoring nano-sized zeolite on layered double hydroxide for highly selective transformation of syngas to gasoline-range hydrocarbons. Fuel 2019, 253, 249–256. [Google Scholar] [CrossRef]
  22. Yang, L.; Pastor-Pérez, L.; Gu, S.; Sepúlveda-Escribano, A.; Reina, T.R. Highly efficient Ni/CeO2-Al2O3 catalysts for CO2 upgrading via reverse water-gas shift: Effect of selected transition metal promoters. Appl. Catal. B Environ. 2018, 232, 464–471. [Google Scholar] [CrossRef]
  23. Galhardo, T.S.; Braga, A.H.; Arpini, B.H.; Szanyi, J.; Goncalves, R.V.; Zornio, B.F.; Miranda, C.R.; Rossi, L.M. Optimizing active sites for high co selectivity during CO2 hydrogenation over supported nickel catalysts. J. Am. Chem. Soc. 2021, 143, 4268–4280. [Google Scholar] [CrossRef] [PubMed]
  24. Lu, B.; Zhang, Z.; Li, X.; Luo, C.; Xu, Y.; Zhang, L. High-efficiency CuCe(rod) catalysts for CO2 hydrogenation with high Cu content. Fuel 2020, 276, 118135. [Google Scholar] [CrossRef]
  25. Chen, C.; Cheng, W.; Lin, S. Mechanism of CO formation in reverse water–gas shift reaction over Cu/Al2O3 catalyst. Catal. Lett. 2000, 68, 45–48. [Google Scholar] [CrossRef]
  26. Chen, C.-S.; Cheng, W.-H.; Lin, S.-S. Study of iron-promoted Cu/SiO2 catalyst on high temperature reverse water gas shift reaction. Appl. Catal. A Gen. 2004, 257, 97–106. [Google Scholar] [CrossRef]
  27. Chen, C.S.; Cheng, W.H.; Lin, S.S. Study of reverse water gas shift reaction by TPD, TPR and CO2 hydrogenation over potassium-promoted Cu/Sio2 catalyst. Appl. Catal. A Gen. 2003, 238, 55–67. [Google Scholar] [CrossRef]
  28. Jiang, X.; Nie, X.; Guo, X.; Song, C.; Chen, J.G. Recent advances in carbon dioxide hydrogenation to methanol via heterogeneous catalysis. Chem. Rev. 2020, 120, 7984–8034. [Google Scholar] [CrossRef]
  29. Chen, A.; Yu, X.; Zhou, Y.; Miao, S.; Li, Y.; Kuld, S.; Sehested, J.; Liu, J.; Aoki, T.; Hong, S.; et al. Structure of the catalytically active copper–ceria interfacial perimeter. Nat. Catal. 2019, 2, 334–341. [Google Scholar] [CrossRef]
  30. Konsolakis, M. The role of copper–ceria interactions in catalysis science: Recent theoretical and experimental advances. Appl. Catal. B Environ. 2016, 198, 49–66. [Google Scholar] [CrossRef]
  31. Lu, B.; Xu, Y.; Zhang, Z.; Wu, F.; Li, X.; Luo, C.; Zhang, L. CO2 hydrogenation on CeO2@Cu catalyst synthesized via a solution auto-combustion method. J. CO2 Util. 2021, 54, 101757. [Google Scholar] [CrossRef]
  32. Muravev, V.; Spezzati, G.; Su, Y.-Q.; Parastaev, A.; Chiang, F.-K.; Longo, A.; Escudero, C.; Kosinov, N.; Hensen, E.J.M. Interface dynamics of Pd–CeO2 single-atom catalysts during co oxidation. Nat. Catal. 2021, 4, 469–478. [Google Scholar] [CrossRef]
  33. Dong, L.; Yao, X.; Chen, Y. Interactions among supported copper-based catalyst components and their effects on performance: A review. Chin. J. Catal. 2013, 34, 851–864. [Google Scholar] [CrossRef]
  34. Zhou, G.; Dai, B.; Xie, H.; Zhang, G.; Xiong, K.; Zheng, X. Cecu composite catalyst for co synthesis by reverse water–gas shift reaction: Effect of Ce/Cu mole ratio. J. CO2 Util. 2017, 21, 292–301. [Google Scholar] [CrossRef]
  35. Lin, L.; Yao, S.; Liu, Z.; Zhang, F.; Li, N.; Vovchok, D.; Martínez-Arias, A.; Castañeda, R.; Lin, J.; Senanayake, S.D.; et al. In situ characterization of Cu/CeO2 nanocatalysts for CO2 hydrogenation: Morphological effects of nanostructured ceria on the catalytic activity. J. Phys. Chem. C 2018, 122, 12934–12943. [Google Scholar] [CrossRef]
  36. Lu, B.; Zhang, T.; Zhang, L.; Xu, Y.; Zhang, Z.; Wu, F.; Li, X.; Luo, C. Promotion effects of oxygen vacancies on activity of na-doped CeO2 catalysts for reverse water gas shift reaction. Appl. Surf. Sci. 2022, 587, 152881. [Google Scholar] [CrossRef]
  37. Liu, Y.; Li, Z.; Xu, H.; Han, Y. Reverse water–gas shift reaction over ceria nanocube synthesized by hydrothermal method. Catal. Commun. 2016, 76, 1–6. [Google Scholar] [CrossRef]
  38. Wang, W.; Zhang, Y.; Wang, Z.; Yan, J.; Ge, Q.; Liu, C. Reverse water gas shift over In2O3–CeO2 catalysts. Catal. Today 2016, 259, 402–408. [Google Scholar] [CrossRef]
  39. Zhou, Y.; Chen, A.; Ning, J.; Shen, W. Electronic and geometric structure of the copper-ceria interface on Cu/CeO2 catalysts. Chin. J. Catal. 2020, 41, 928–937. [Google Scholar] [CrossRef]
  40. Lu, B.; Wu, F.; Li, X.; Luo, C.; Zhang, L. Reconstruction of interface oxygen vacancy for boosting CO2 hydrogenation by Cu/CeO2 catalysts with thermal treatment. Carbon Capt. Sci. Technol. 2024, 10, 100173. [Google Scholar] [CrossRef]
  41. Li, W.; Feng, X.; Zhang, Z.; Jin, X.; Liu, D.; Zhang, Y. A controllable surface etching strategy for well-defined spiny yolk@shell CuO@CeO2 cubes and their catalytic performance boost. Adv. Funct. Mater. 2018, 28, 1802559. [Google Scholar] [CrossRef]
  42. Cao, F.; Xiao, Y.; Zhang, Z.; Li, J.; Xia, Z.; Hu, X.; Ma, Y.; Qu, Y. Influence of oxygen vacancies of CeO2 on reverse water gas shift reaction. J. Catal. 2022, 414, 25–32. [Google Scholar] [CrossRef]
Figure 1. XRD patterns for CeO2–Cu, CeO2, and micro-Cu.
Processes 12 01912 g001
Figure 2. (a). N2 adsorption–desorption isotherms and (b) pore diameter distributions of CeO2–Cu, CeO2, and Cu catalysts.
Processes 12 01912 g002
Figure 3. Hydrogenation performance of CeO2–Cu, CeO2, and Cu: (a) CO2 conversion activity, (b) CO selectivity (100 mL/min).
Processes 12 01912 g003
Figure 4. TEM images of CeO2–Cu, Cu, and CeO2: (a) TEM image of Cu powder, (b) HRTEM of CeO2, (c) TEM image of CeO2–Cu powder, (d) HRTEM of CeO2–Cu, (e) HADDF of CeO2–Cu, and line distribution of Ce and Cu.
Processes 12 01912 g004
Figure 5. H2-TPR of CeO2–Cu, Cu, and CeO2 catalysts.
Processes 12 01912 g005
Figure 6. Raman spectrum of CeO2–Cu, Cu, and CeO2 catalysts.
Processes 12 01912 g006
Figure 7. CO2 conversion of the CeO2–Cu catalyst at 700 °C and a flow speed of 100 mL/min.
Processes 12 01912 g007
Figure 8. TEM image (a) and HRTEM image (b) of CeO2–Cu after RWGS reaction.
Processes 12 01912 g008
Table 1. Specific surface areas and pore information of CeO2–Cu, CeO2, and Cu catalysts.
CatalystgCeO2/gCu (Wt%)SBET (m2/g)Pore Volume (mL/g)Average Pore
Diameter (nm)
Cu 2.680.2212.36
CeO2 149.870.4075.02
CeO2–Cu2013.540.02776.03
Disclaimer/Publisher’s Note: The statements, opinions and data contained in all publications are solely those of the individual author(s) and contributor(s) and not of MDPI and/or the editor(s). MDPI and/or the editor(s) disclaim responsibility for any injury to people or property resulting from any ideas, methods, instructions or products referred to in the content.

