Article

Research on Carbon Dioxide Computational Fluid Dynamics Simulation of Urban Green Spaces under Different Vegetation Spatial Layout Morphologies

1
College of Architecture and Urban Planning, Tongji University, Shanghai 200092, China
2
Shanghai Xiandai Architectural Design & Urban Planning Research Institute Co., Ltd., Shanghai 200041, China
3
Shanghai Academy of Landscape Architecture Science and Planning, Shanghai 200232, China
4
Key Laboratory of National Forestry and Grassland Administration on Ecological Landscaping of Challenging Urban Sites, Shanghai 200232, China
5
School of Landscape Architecture, Nanjing Forestry University, Nanjing 210037, China
6
Shanghai Landscape Industry Co., Ltd., Shanghai 200041, China
*
Author to whom correspondence should be addressed.
Processes 2024, 12(9), 1931; https://doi.org/10.3390/pr12091931
Submission received: 11 July 2024 / Revised: 11 August 2024 / Accepted: 12 August 2024 / Published: 9 September 2024
(This article belongs to the Section Environmental and Green Processes)

Abstract

:
Urban green spaces (UGSs) are considered an important natural approach for improving urban climatic conditions, promoting sustainable urban development, and advancing the global “Carbon Peak and Carbon Neutrality” targets. Previous studies have found that different vegetation spatial morphologies significantly impact the capacity to obstruct and absorb CO2, but it is not yet well understood which morphology can retain and absorb more CO2. This study takes Nantong Central Park as an example and conducts a CFD (Computational Fluid Dynamics) carbon flow simulation for CO2 under different vegetation spatial morphologies to identify their CO2 retention and absorption effects. First, the carbon sink benefits of elements such as “vegetation, soil, and wetlands” within the park were calculated, and the elements with the highest carbon sink benefits were identified. Then, the park was divided into carbon welcoming zones, carbon flow zones, and carbon shadow zones for carbon flow simulation with the highest carbon sink benefits. The results show that in the carbon welcome area, the one-block long fan-shaped plant community with a spatial density of 40 m thickness can best meet the requirements of absorption and induction of a small amount of carbon dioxide, with the smallest air vortex and uniform distribution of carbon dioxide in the surrounding area. In the carbon flow area, combined with the visual effect, the planting pattern of 6 m spacing herringbone combined with natural structure was adopted, which has a good carbon dioxide blocking and absorption capacity. In the carbon-shaded area, a herringbone planting pattern with a total width of 40 m and a base angle of 60° was chosen, which had the strongest hindrance and absorption capacity. Urban park environment optimization can use Fluent simulation to analyze the flow of carbon dioxide between different elements affected by wind dynamics at the same time. Based on the results, the form, layout, and spatial distance are adjusted and optimized. This study can better guide the spatial layout of vegetation and contribute to the realization of the goal of “carbon peak and carbon neutrality”.

1. Introduction

Urban green spaces (UGSs) play a pivotal role in addressing climate change and promoting the healthy development of urban ecosystems [1]. UGSs are considered a vital pathway for achieving “Carbon Peak and Carbon Neutrality” goals by absorbing carbon dioxide and other greenhouse gases [2,3,4,5,6]. Reports from the Intergovernmental Panel on Climate Change (IPCC) indicate that cities, with their high-intensity economic and social activities, are major areas of carbon emissions [7,8], with China’s urban carbon emissions accounting for as much as 85%. Reducing urban carbon emissions and increasing the carbon sequestration capacity of urban green spaces have become important measures for China to achieve its “Carbon Peak and Carbon Neutrality” targets [9,10,11].
Numerous studies show that the carbon sequestration capacity of UGSs depends on various factors, including the type and structure of vegetation, and the design and maintenance methods for parks [12]. Fan et al. noted that the diameter at the breast height of trees, community density, and stratification are significantly related to carbon sequestration [13]. Wang and others found that individual plant characteristics, bio-community structure, and plant growth affect the carbon sequestration efficiency of urban parks [14]. These studies have focused more on the ecological processes and functions of the plants themselves, overlooking the interaction between green elements [1,15,16]. First, the vegetation type and structure in urban green spaces have a significant impact on carbon sequestration capacity. Different types of vegetation (e.g., trees, shrubs, herbaceous plants) have different growth rates, root characteristics, and carbon storage capacities. However, studying the carbon sequestration and sequestration capacity of each vegetation type alone does not provide a comprehensive assessment of the carbon sequestration function of the entire system. Second, soils and wetlands also play an important role in urban green spaces. Both the storage of organic matter in soils and the wet conditions of wetlands affect the process of carbon dioxide uptake and sequestration. However, the interactions between these soils and wetlands and vegetation and their contribution to the carbon cycle are often overlooked. However, there are still a few studies focusing on the complex carbon cycle interactions between green elements, and more on the direct impact of a single factor on carbon sink function. According to studies related to the flow field theory around buildings [17], different morphologies and layout distances between elements result in different carbon sequestration capacities. This paper uses the Fluent 15.5 software for CFD (Computational Fluid Dynamics) simulation to simulate the carbon sink effects of different element morphologies, layout forms, and spatial distances. Among UGSs, trees have the strongest carbon sequestration capacity [18,19]. To simplify the model, this paper only considers the combination of trees with other environmental elements within UGSs.
Based on the above analysis, the Central Park of Nantong Innovation District was selected as a case study in this study, focusing on Fluent carbon flow simulation scenarios for micro-scale urban green spaces. To this end, this paper calculates the carbon sink benefits of the three elements of “vegetation, soil, and wetland” in the park, identifies the factors with the highest carbon sink benefits, and uses CFD to simulate the carbon flow scenario for Nantong Central Park. Finally, the carbon sequestration capacity of Nantong Central Park is evaluated. The results of the study will have a positive impact on the improvement of the carbon sequestration capacity of Nantong Central Park. During the modeling process, different spatial distributions and local vegetation configurations were considered, including tree species, size, density, and layout. Subsequently, Fluent is used to perform fluid dynamics simulations to analyze the spatial results of carbon flow under various scenarios. First, the computational domain, i.e., the three-dimensional space of the simulation area, including the urban green space and its surrounding environment, is defined in Fluent. Then, the computational domain is meshed and a suitable flow model is selected. Next, conditions are set for the entry and exit of air and carbon particles into and out of the computational domain, with the inlet usually set to a certain velocity or flow rate and the outlet set to a free outflow. In addition, conditions are defined for the surfaces of buildings, ground, and trees, which affect the deposition and resuspension process of carbon particles. The initial carbon concentration distribution in the computational domain is also set. The movement and distribution of carbon particles in the air are simulated by setting the boundary and initial conditions in order to analyze the effect of different green space configurations on carbon flow.

2. Materials

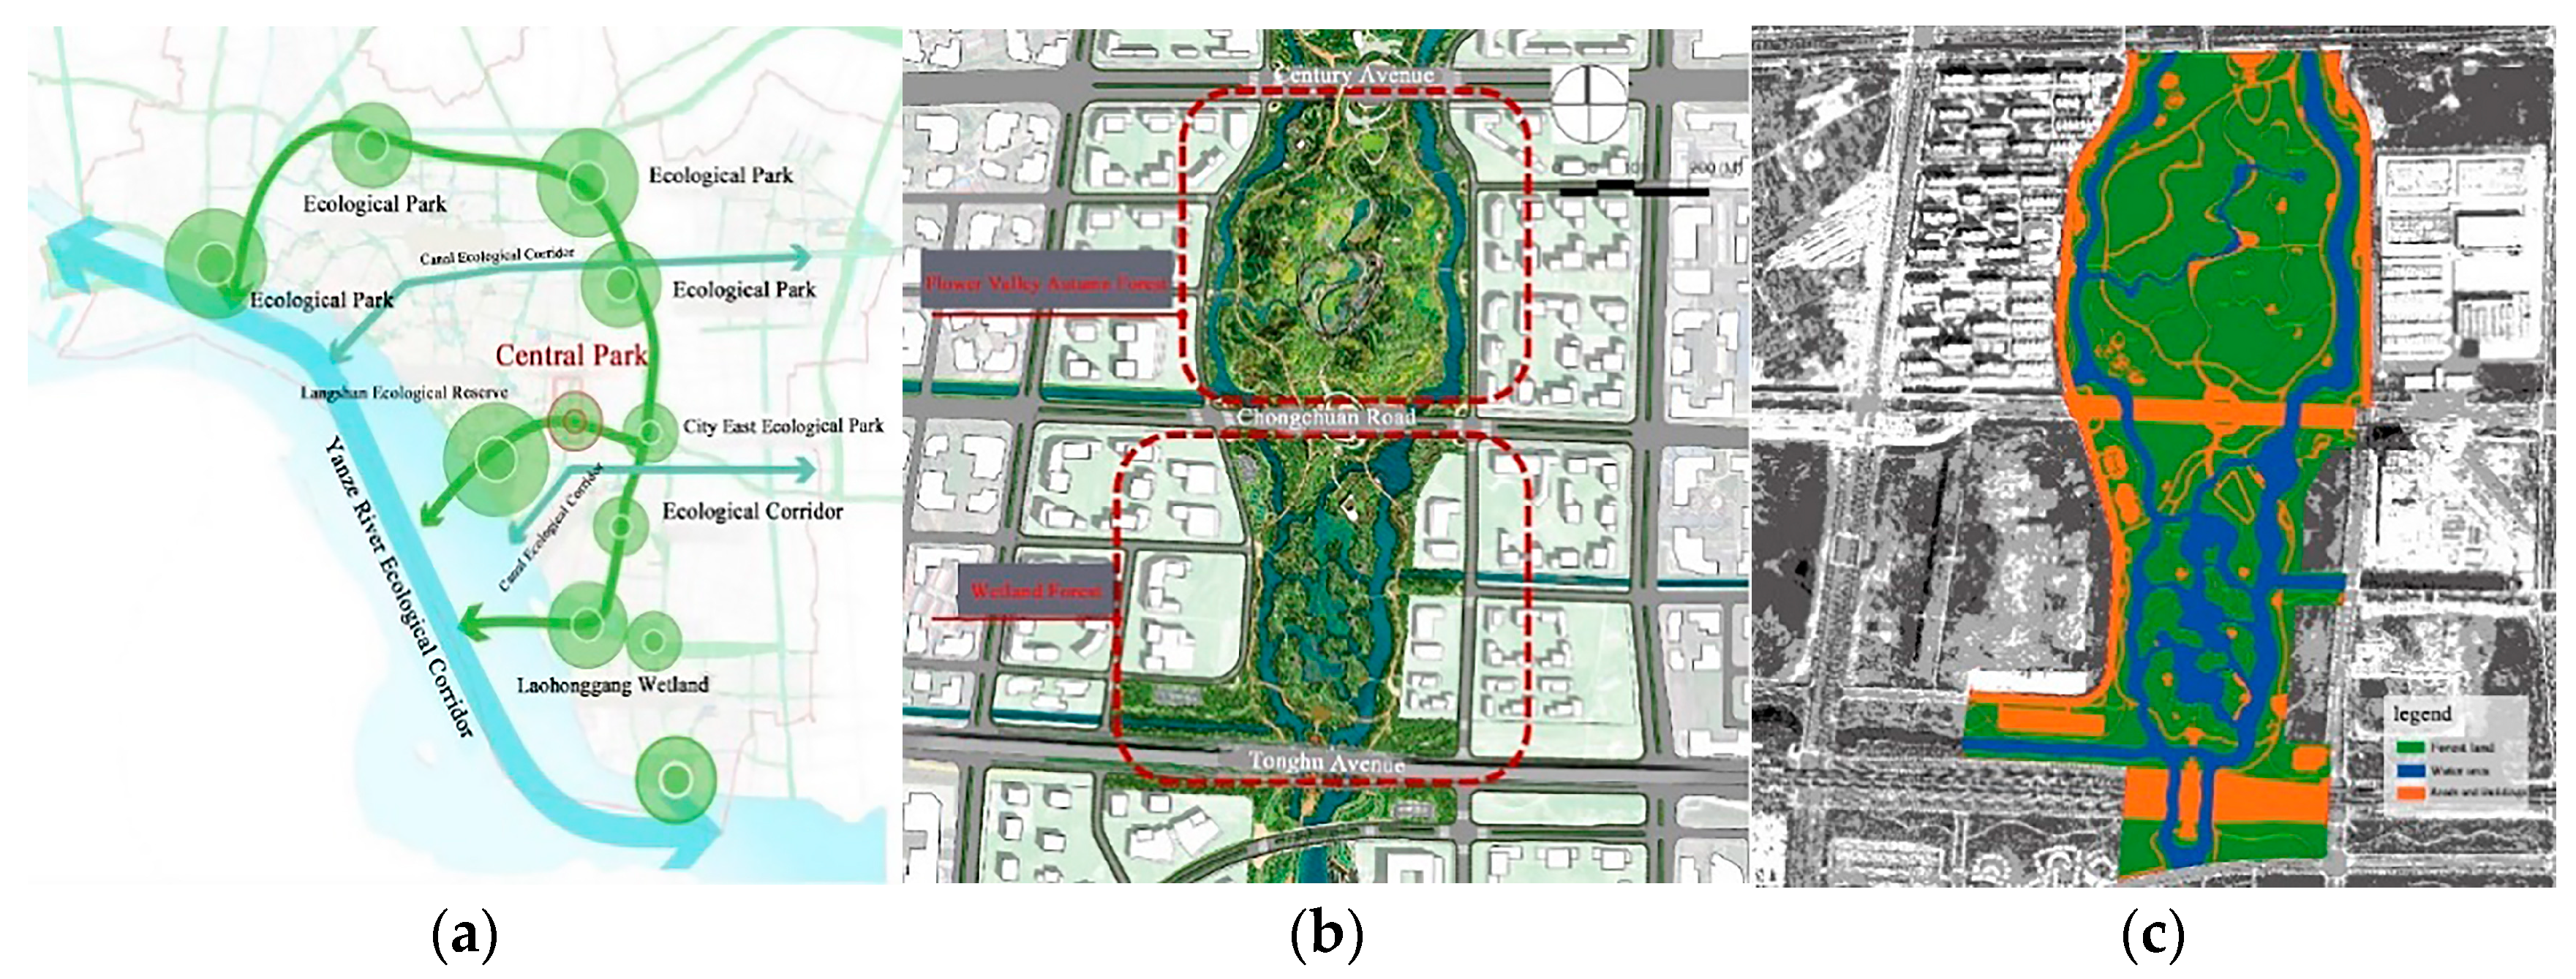
2.1. Overview of the Study Area

Nantong region of Jiangsu, China is located on the northern wing of the Yangtze River Delta (Figure 1). As the fashion and leisure recreation center of the Delta, it has been focusing on creating an eco-city suitable for living and business in recent years. The Zhongchuang District, as a demonstration of a garden city, follows a multi-level, multi-functional, and composite ecological green space system network guided by “green corridors around the city, green wedges into the city, green belts throughout the city, and green spots dotted in the city”, with regional distribution of a large number of ecological patches such as forest parks, wetland parks, and a network of ecological corridors with a crisscrossing water system, forming a complex ecosystem, eventually forming a closed ecological circle with the Yangtze River Wetland Corridor. Previous green space system planning lacked a scientific model for the quantitative research of carbon sink benefits. This study aims to provide a scientific reference to offer a theoretical basis for exploring a low-carbon construction model for urban green spaces (Figure 1a). The research subject is Nantong Central Park, which is bordered by Century Avenue to the north, Tonghu Avenue to the south, and planned roads to the east and west, with a length of about 1200 m from north to south and about 500 m from east to west, totaling about 60 hectares. The master plan is shown in Figure 1b below. The distribution of various land spaces within the park is shown in Figure 1c. The park economic indicator table is shown in Table 1. It can be seen that the green space area is 73.19%, accounting for the highest proportion.

2.2. Data Acquisition and Processing

Using ENVI 5.6 software, the remote sensing imagery of Zhongchuang District’s Central Park was interpreted to analyze the coverage information of the main landscape elements within the park (Figure 1c). Combined with construction drawings and on-site field research, land use information was gathered (including impervious surfaces, soil, vegetation, and water bodies). The data were then synthesized for a comprehensive quantitative study based on three elements: vegetation carbon sink, soil carbon sink, and wetland water body carbon sink.

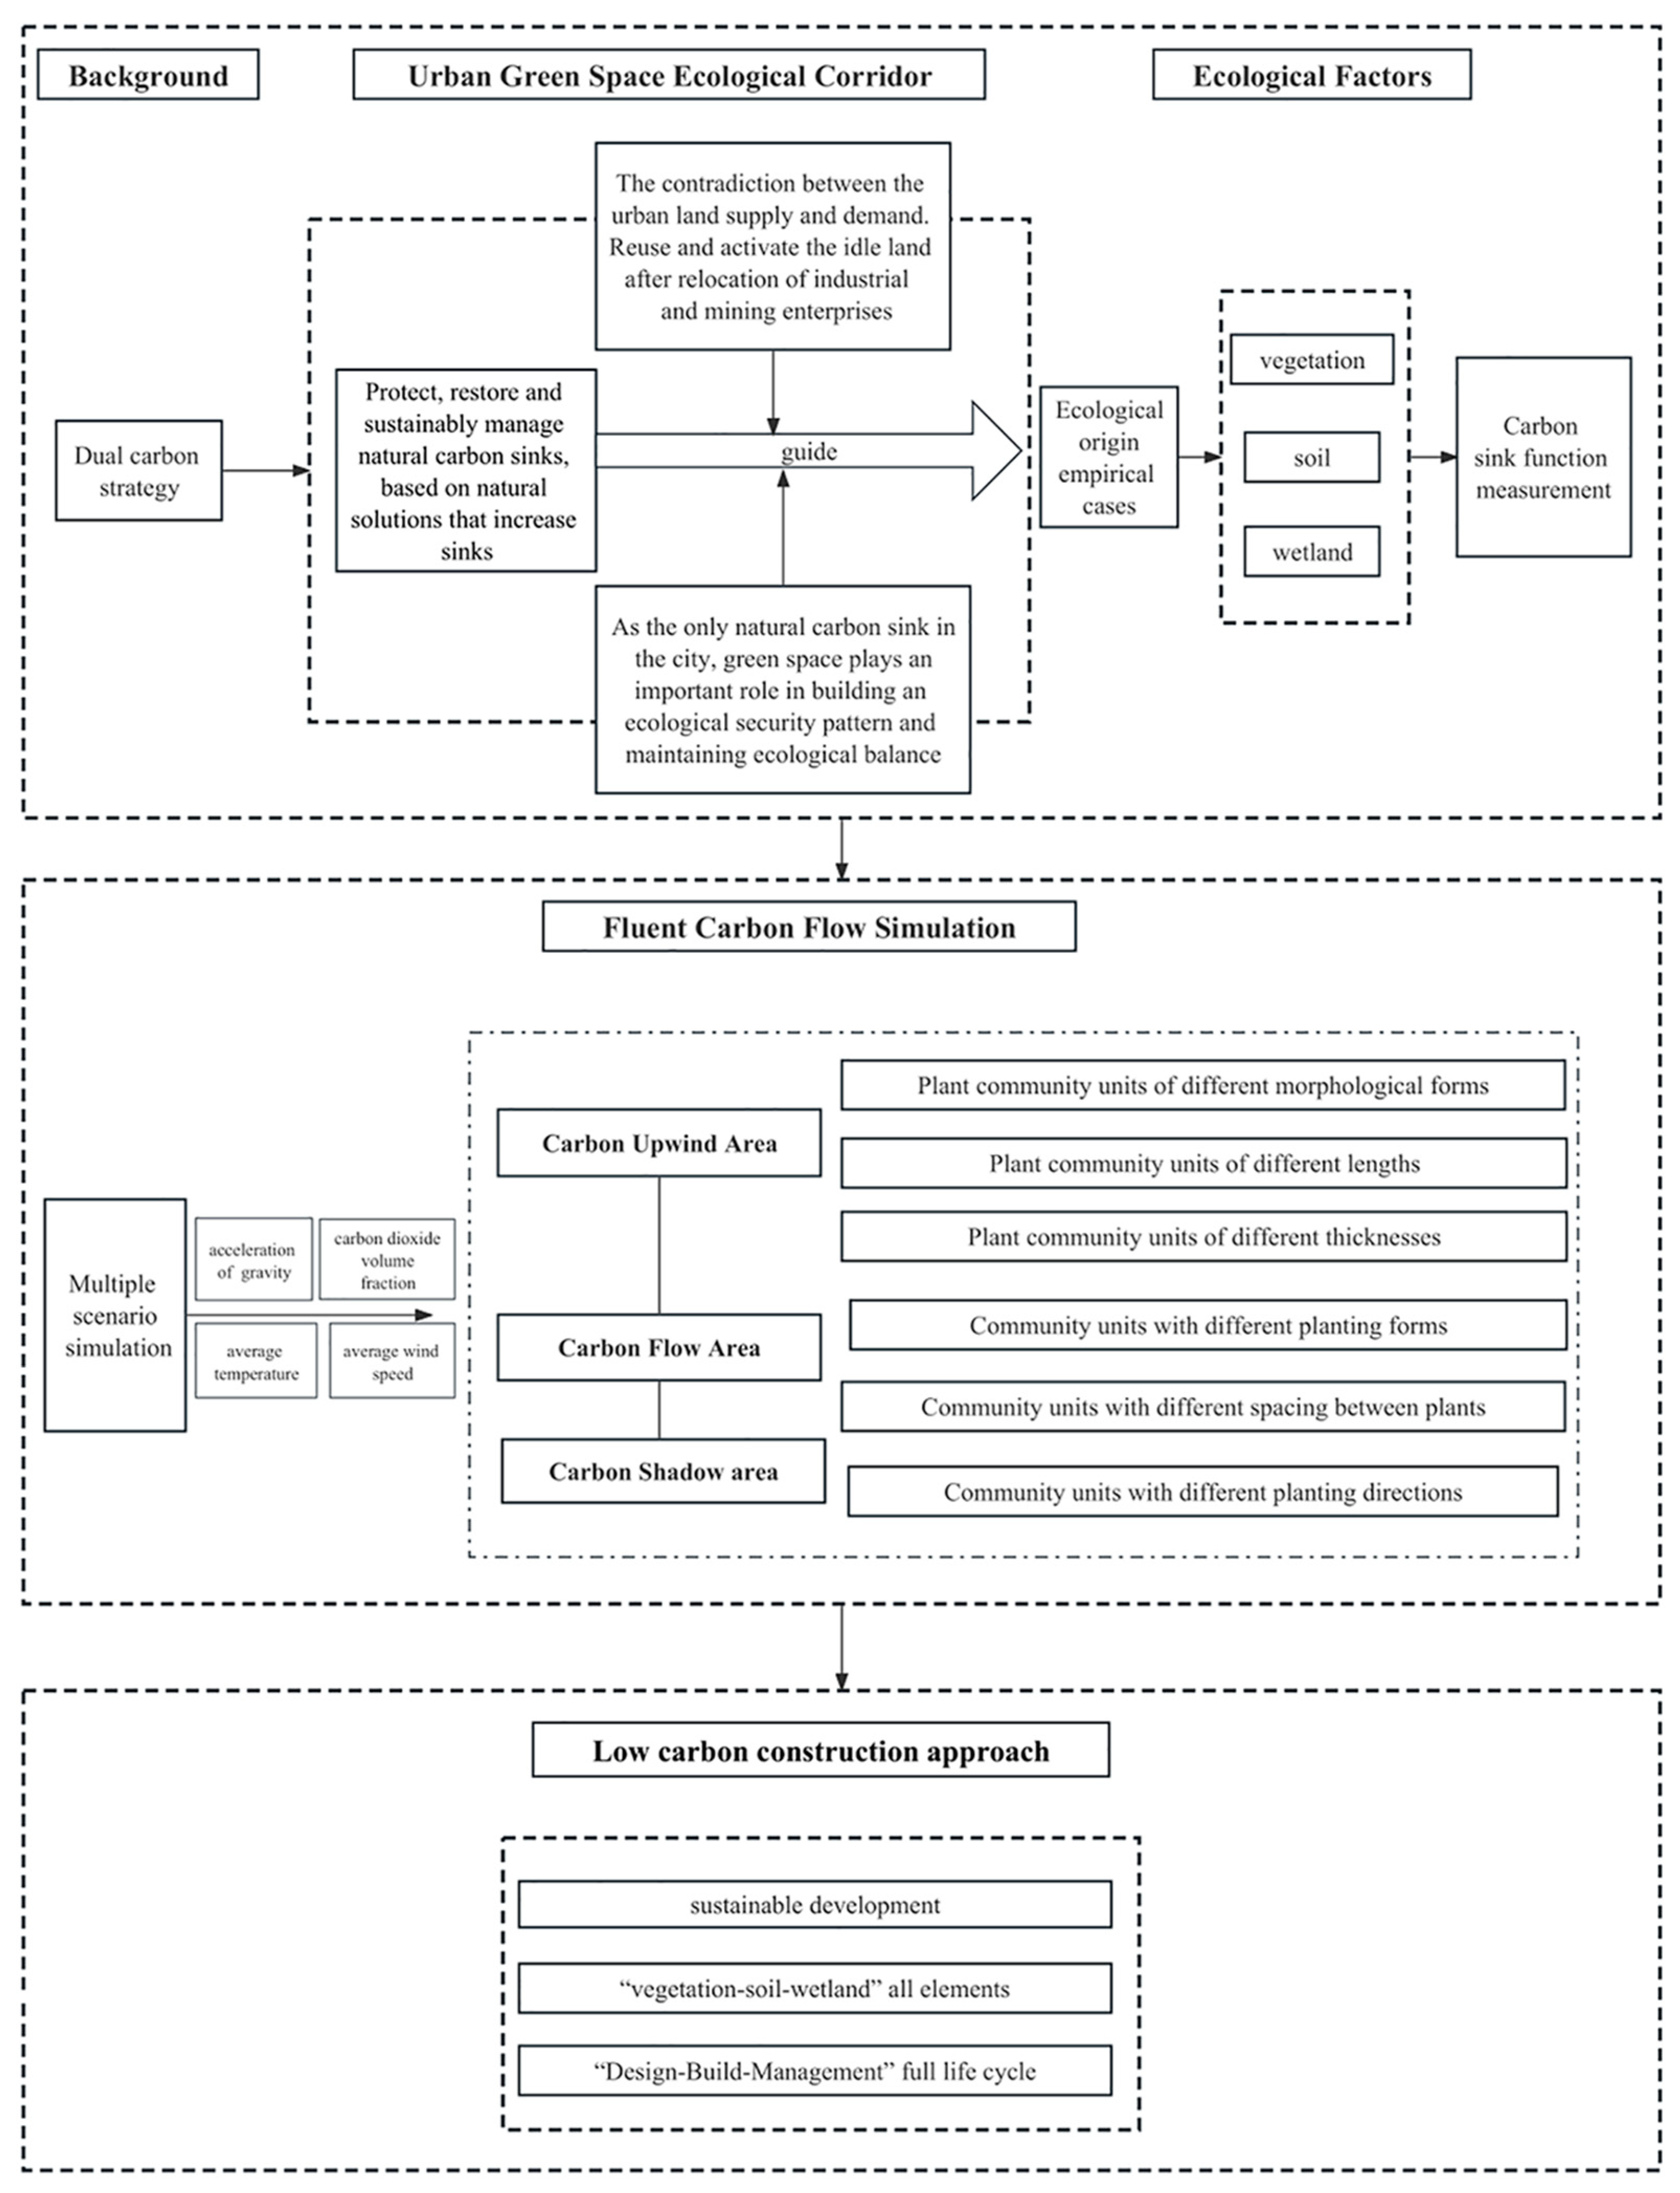
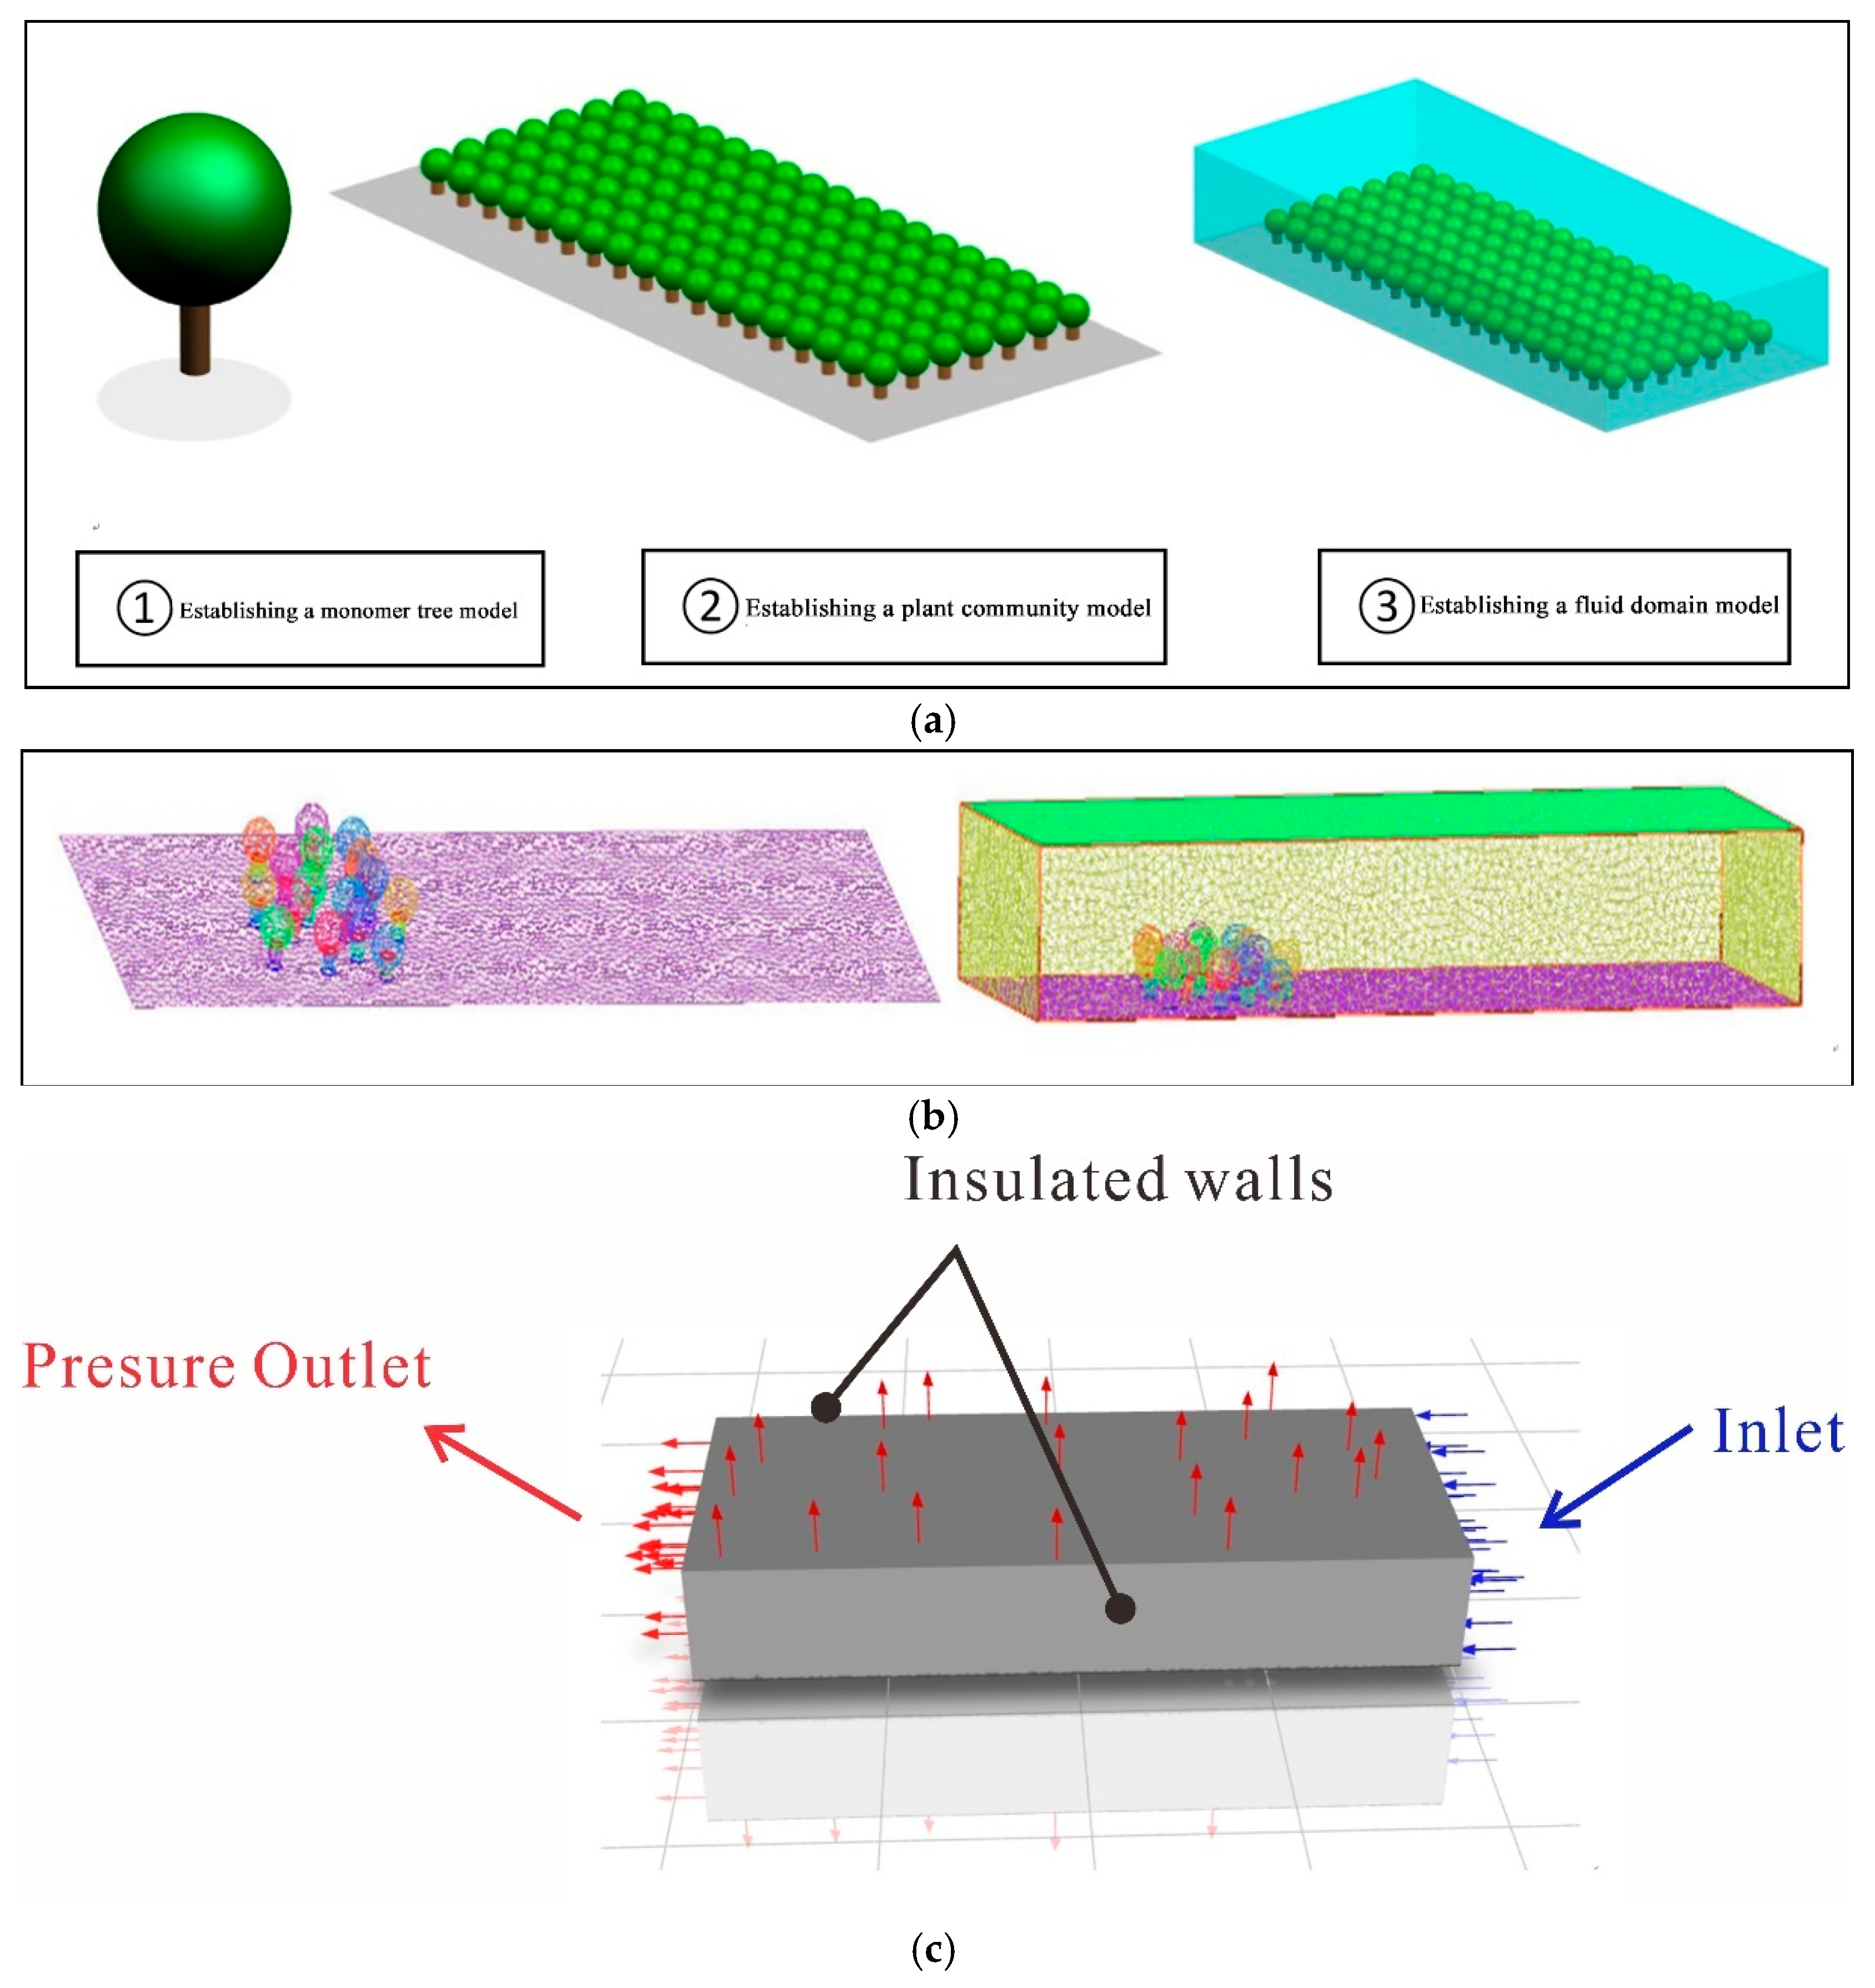
2.3. Research Methods

This study calculates the carbon sink benefits of the three elements “vegetation, soil, and wetlands” inside the park, identifies the element with the highest carbon sink benefit, and simulates the carbon flow using CFD (Computational Fluid Dynamics). Using Fluent software, the site underwent carbon flow simulations under six different scenarios within three regions to clarify the contributions of different elements (Figure 2). Based on the strategy of “carbon peak and carbon neutrality”, this study will build ecological corridors for urban green spaces. Through Fluent simulating the carbon sink benefits of the three elements of “vegetation, soil and wetland” in the park, six scenarios in the three areas of carbon welcome, carbon flow, and carbon shadow were simulated to determine the optimal planting pattern and analyze the low-carbon construction method in detail.
According to related studies on the flow field theory around buildings [20], the flow field around buildings is divided into five zones: the windward area, crossflow area, vortex area, wind shadow area, and corner flow area (Figure 3a). The windward area is the side facing the wind direction, where the wind directly affects the building, causing increased pressure. Here, the airflow is relatively stable, and the wind speed decreases on the building surface. The crossflow area is where the wind flows through parts of the building (e.g., ventilation openings, doors, windows). Wind speed and direction may change due to the internal layout and size of the openings. The vortex area is located on the sides and top of the building, where wind flow creates vortices. The building blocks the wind, often leading to unstable wind speeds and variable directions, causing these effects. The wind shadow area behind the building, where the wind is blocked, creates a low-pressure area. Wind speeds are usually lower here, but vortex and turbulence may occur. The corner flow area is at the corners of the building, where the wind is influenced by the building’s shape, potentially creating complex flow patterns. The wind speed and direction here can vary greatly depending on the shape of the building. Considering the comprehensive performance, landscape pattern, research scale, and goals of this study, and the fact that the simulation subjects are trees without crossflow and corner flow characteristics of research building forms, these were integrated into the vortex area for consideration in the simplified model. From the perspective of carbon sequestration, based on the east-to-west action of carbon flow, this study focuses on three levels within the site space for discussion (Figure 3b): the carbon welcoming zone, carbon flow zone, and carbon shadow zone. The carbon welcoming zone is located on the eastern edge of the site, adjoining the surrounding commercial and residential areas, functioning to introduce carbon dioxide and sequester a small amount of carbon. The carbon flow zone is at the core of the site, mainly consisting of woodland and grassland, with the function of fully contacting and fixing large amounts of carbon. The carbon shadow zone is on the west side of the site, currently with rivers and rows of planted trees, with the function of using the linear green space to absorb and retain the remaining carbon. Figure 3 reveals this relationship.

2.3.1. Simulation Parameter Settings
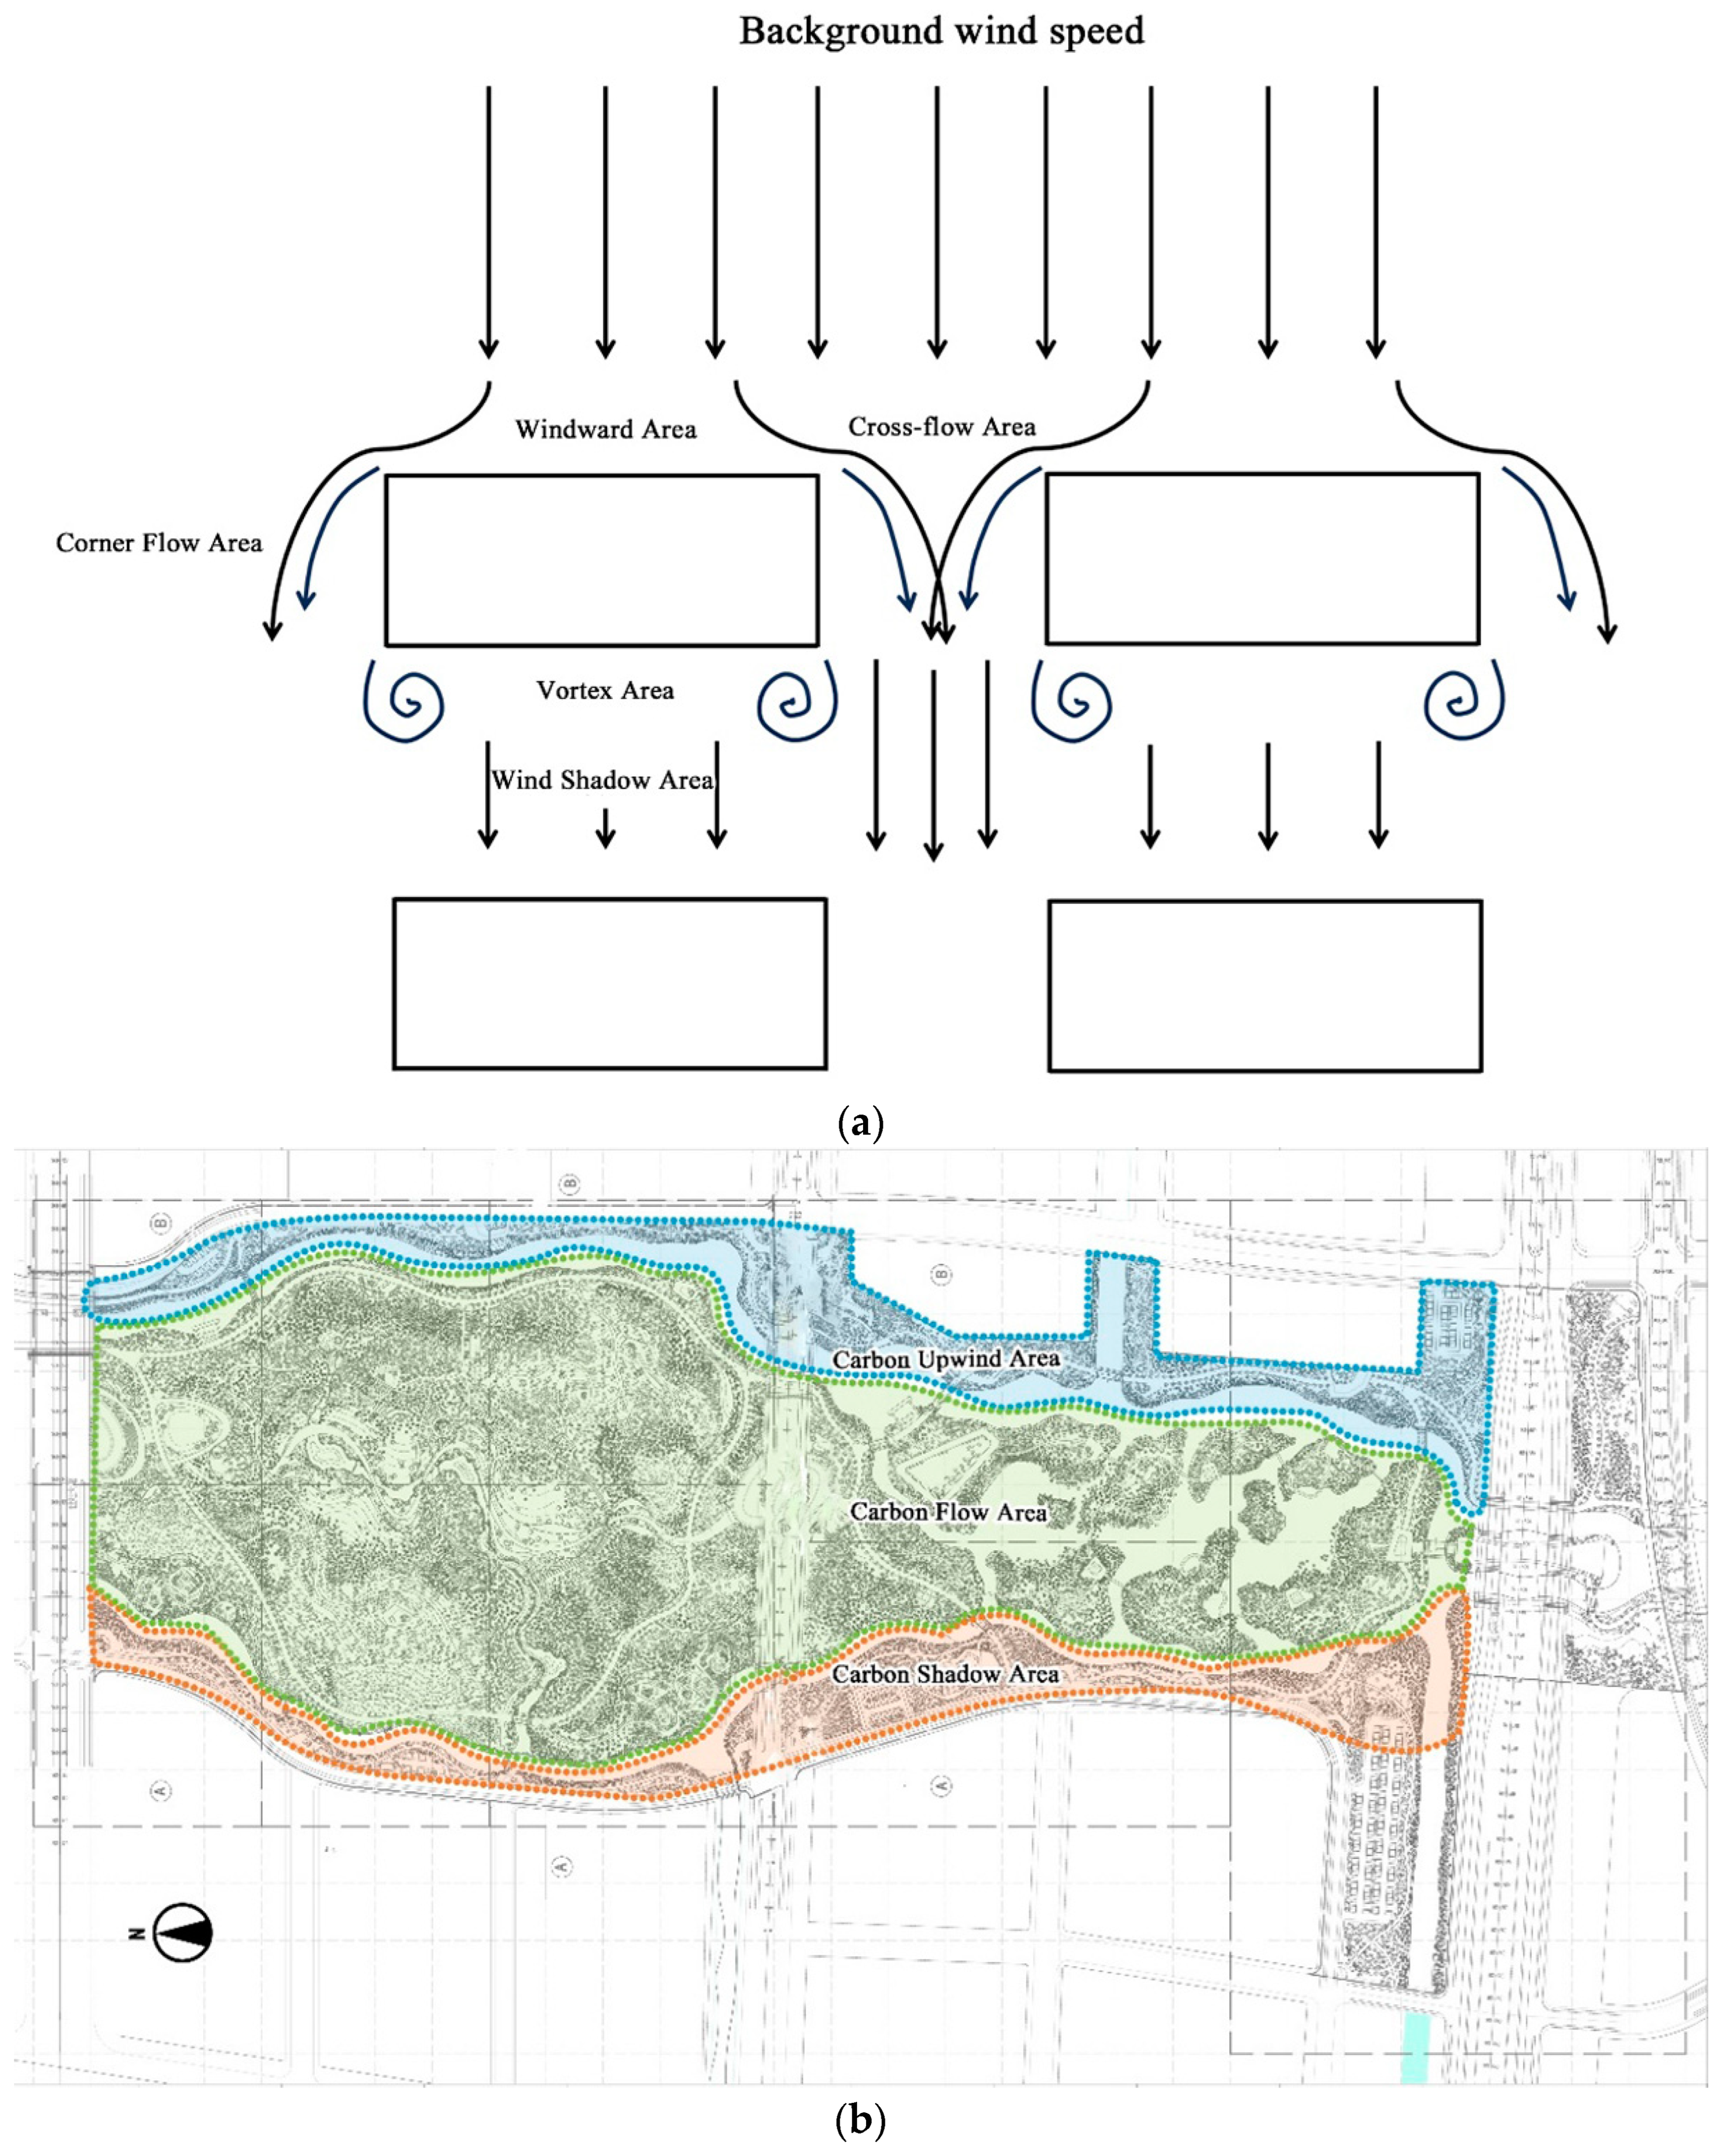
Fluent 15.5 is a relatively mature Computational Fluid Dynamics (CFD) software, frequently used to simulate complex flows ranging from incompressible to highly compressible fluids, primarily comprising pre-processing, solving, and post-processing modules [21,22]. Pre-processing involves constructing the fluid domain model and setting boundary conditions. Rhino was utilized for modeling the spatial configuration of tree communities, forming the physical model depicted in Figure 4.
Fluid dynamics (CFD) models were used for simulation. Among them, the Fluent software used is the ANSYS Fluent 15.x family: Fluent 15.5. Throughout the simulation, the fluid is assumed to be continuous and incompressible, and wall friction and heat transfer are considered according to the setting. A mesh independence analysis is first performed to determine the suitability of the selected mesh. During calibration, the mesh is detailed enough to capture the detailed structure in the fluid flow. Based on the datum mesh, a series of meshes of varying fineness are generated. This can be created using the mesh generation software or the built-in mesh generation tool in the CFD software. It is ensured that each mesh has a high enough resolution in critical areas (e.g., vegetation spaces, around buildings, etc.) to capture important turbulent structures and flow characteristics in the flow field. The same CFD simulation settings and boundary condition settings are used for each mesh. Finally, the convergence of the grid is ensured, and as the grid resolution increases, the physical quantity (CO2 concentration) of the simulation results in the critical area tends to stabilize. Then, a suitable model is selected to ensure that it can simulate the fluid flow state well; the specific conditions are described below. Secondly, the parameters in the model are adjusted to improve the accuracy of the simulation according to the standard test cases in the literature. Calculations are based on actual meteorological data from Nantong (Table 2) to simulate various scenarios of carbon flow within the site. In order to verify the accuracy of the numerical simulation, three turbulence models were selected for comparative analysis, namely, the k-omega model, the k-epsilon model, and the BSL-EARSM (Baseline Reynolds Stress Model with Explicit Algebraic Reynolds Stress Model) model. During the setup of the model, we strictly controlled the number of computational meshes at 6.5 million to ensure a balance between the accuracy and efficiency of the calculations. At the same time, in order to obtain a convergent numerical solution, the calculated residuals were set to 1 × 10⁻⁵. This setting can effectively reduce the calculation error and improve the reliability of the simulation results. After the numerical simulation, error analysis of the calculated results of different models was carried out. The temperature error of the k-omega model is 31.7%, that of the k-epsilon model is 19.7%, and that of the BSL-EARSM model is 18.9%. From the results, it can be seen that the BSL-EARSM model shows higher accuracy and the lowest temperature error compared with the other two models. However, despite the significant accuracy advantage of the BSL-EARSM model, its computational cost is correspondingly high, which is mainly reflected in the significant increase in computational time. Since the main purpose of this study is to find a method with higher computational efficiency under the premise of ensuring a certain accuracy, we chose the K-epsilon model as the final numerical simulation model for practical application. The model can provide a relatively low-temperature error while ensuring that the calculation time is controllable, which meets the basic requirements of engineering applications. Through the establishment of the physical model of the fluid domain and the 3D computational mesh of the fluid domain, the simulation of the carbon flow scenario is realized, and the boundary conditions are further set as follows: Inlet (Vin = 2.45 m/s) on the right side and Pressure Outlet (0 Pa) on the left side. The left and right sides of the wall and the bottom are set as adirfiabatic walls. The k-epsilon model is chosen for turbulence simulation. The turbulent kinetic energy coefficient is 0.05 and the turbulent dissipation rate is selected as 0.09. For larger vegetation, such as trees and shrubs, a porous media model is used for simulation. Think of the interior of vegetation as an area with specific resistance and mass transfer properties, rather than simply as a solid obstacle. Specifically, the porous media model allows fluids to pass through vegetation, accurately simulating the obstruction of vegetation to wind and air currents. Using a porous media model to simulate wind flow through trees and shrubs, there is some resistance, depending on factors such as the density of vegetation, the shape and arrangement of leaves, and so on. This resistance directly affects the speed and direction of airflow In addition, the porous media model takes into account the heat exchange and humidity changes between the plant and the surrounding air, allowing for a more comprehensive simulation of the plant’s impact on the environment. Grass in the grassland can be seen as a fine porous medium, and its resistance and influence on airflow can likewise be achieved by adjusting the relevant parameters. Unlike trees and shrubs, grass is denser and lower in height, so it has higher resistance in the model to better reflect how much airflow is being obstructed. Fluent simulations were used to simulate carbon flow in the park. In order to facilitate an understanding of the long-term average distribution of carbon flow in the park, steady-state conditions were selected for the study, and physical quantities such as flow, temperature, and concentration in the system do not change with time, providing a general overview that is suitable for detailed environmental impact assessment and short-term prediction. Post-processing involves using the visualization results of the simulation to analyze the carbon flow absorption in different scenarios and further assess their carbon sequestration capabilities. In the CFD simulation of carbon sequestration in Nantong Park, a hexahedral unstructured mesh was used. First, the reliability of the mesh was verified. The number of grids in the four groups of models is 3.67 million, 4.13 million, 4.66 million, 5.03 million, and 5.49 million, respectively. The calculation results show that the deviation of the calculated value of the model of 5.03 million and the model of 5.49 million is less than 0.1%. Considering the calculation accuracy and calculation time, it was decided to adopt a model with a grid size of 0.001 and a mesh number of 5.03 million. The calculated convergence residuals of a single model can reach 0.00001, which can be considered to achieve the convergence accuracy of this project. The time required for a single model calculation is about 24 h.

2.3.2. Zoning

The park is divided into three areas for the simulation of carbon flow with the highest carbon sequestration benefits: the carbon welcoming zone, the carbon flow zone, and the carbon shadow zone.
Carbon Welcoming Zone: To determine the type of separation used between the plant communities in this green space as the morphological structure of the “carbon welcoming zone”, the study modeled three types of plant community units based on literature research: rectangular plant communities (with intervals parallel to the direction of gas diffusion), parallelogram plant communities (with intervals inclined in one direction), and fan-shaped plant communities (with intervals inclined in two directions). The study compared the carbon dioxide concentration cloud maps, air vortex cloud maps, and velocity cloud maps under different plant community unit morphologies. By referencing the literature, the study simulated carbon flow scenarios for fan-shaped plant community units of 1, 0.5, and 1.5 times the length of 500 m on the east side of the planned site. It compared the carbon dioxide concentration cloud maps, air vortex cloud maps, and velocity cloud maps under different lengths of the fan-shaped plant community units. Considering the current site conditions and the selection of tree specifications, the study simulated the carbon dioxide flow of fan-shaped plant community units with thicknesses of 20 m, 40 m, and 60 m for one block length. It compared the carbon dioxide concentration cloud maps, air vortex cloud maps, and velocity cloud maps under different thicknesses of one block-length fan-shaped plant community units.
Carbon Flow Zone: The plant community space was divided into grid, herringbone, and natural structures, with simulations conducted for each of these three planting patterns. The study compared the carbon dioxide concentration cloud maps, air vortex cloud maps, and velocity cloud maps under different plant community spaces. Simulations were performed for different plant spacing conditions within the grid structure to determine the ability of the 9 m × 9 m, 6 m × 6 m, and 3 m × 3 m spaced communities to obstruct and absorb carbon dioxide.
Carbon Shadow Zone: The study compared the carbon dioxide concentration cloud maps, air vortex cloud maps, and velocity cloud maps for basic herringbone planting units with bottom angles of 30°, 60°, and 75° (Table 3).

3. Results

3.1. Carbon Sequestration of Various Green Space Elements

3.1.1. Vegetation

The carbon sequestration of plants is the main source of carbon sequestration in park landscapes. The vegetation in the park is divided into trees, shrubs, and ground covers (including herbaceous plants) for calculation. The total vegetation carbon sequestration is the sum of these parts. The carbon sequestration performance of trees is calculated using methods proposed by the Chinese scholars Privitera et al. and Fu et al. [16,17], while the performance of shrubs and herbaceous ground covers is based on methods from Weissert et al. [18], combined with results from Tominaga et al. [19] and Balogh [20]. This calculation provides daily carbon dioxide absorption rates per tree and shrub, and per square meter of lawn, along with average carbon sink rates for trees, shrubs, and herbaceous ground covers (Table 4):
By organizing park information and actual measurements, the vegetation carbon sequestration is estimated at 7763.661 tons per year for trees, 3061.047 tons for shrubs, and 71.2 tons for herbaceous ground covers, totaling 10,895.908 tons of carbon sequestration per year for all vegetation. Among the different types of vegetation, trees have the most significant carbon sequestration capacity. Thus, trees with strong carbon sequestration capabilities and large sizes can significantly enhance the overall carbon sequestration benefits and value of the green space. In comparison, soil and wetland water bodies contribute relatively less to carbon sequestration.

3.1.2. Soil

Soil carbon storage represents the primary mechanism for carbon fixation in urban green spaces. Studies by Riddle et al. [21] in New York City have shown that the amount of organic carbon fixed by soils in green spaces under natural formation is much higher than that fixed by compacted soils and impermeable surfaces, mainly because soil compaction increases soil bulk density, which is not conducive to soil respiration and other carbon cycle processes [22]. According to literature research [23], when soil carbon sequestration is primarily by surface soil absorption, the calculation formula is:
W = C × A
where W is the annual soil carbon sequestration, C is the post-afforestation soil carbon sink rate of 0.579 t/hm2·a, and A is the green space soil area. Considering the impact of the slope, the park’s green space area is multiplied by a coefficient of 1.5, making the soil area 688,245 square meters, and thus the annual soil carbon sequestration is 39.85 tons.

3.1.3. Water Bodies

As a type of ecosystem structure, wetlands also need to meet low carbon and sustainable development requirements, maintain biodiversity, and enhance the environmental stability and carbon sequestration capacity of wetland water bodies while comprehensively controlling carbon emissions during construction. According to research by Privitera [16], when wetland water body carbon sequestration is primarily by surface absorption, the calculation formula is:
W = Z × A
where W is the total carbon sequestration of the water body, Z is the water body carbon sequestration rate of 0.567 t/hm2·a, and A is the water surface area. The park’s water area is taken as 80,500 square meters, making the annual wetland water body carbon sequestration 4.57 tons.

3.2. Scenario Simulation

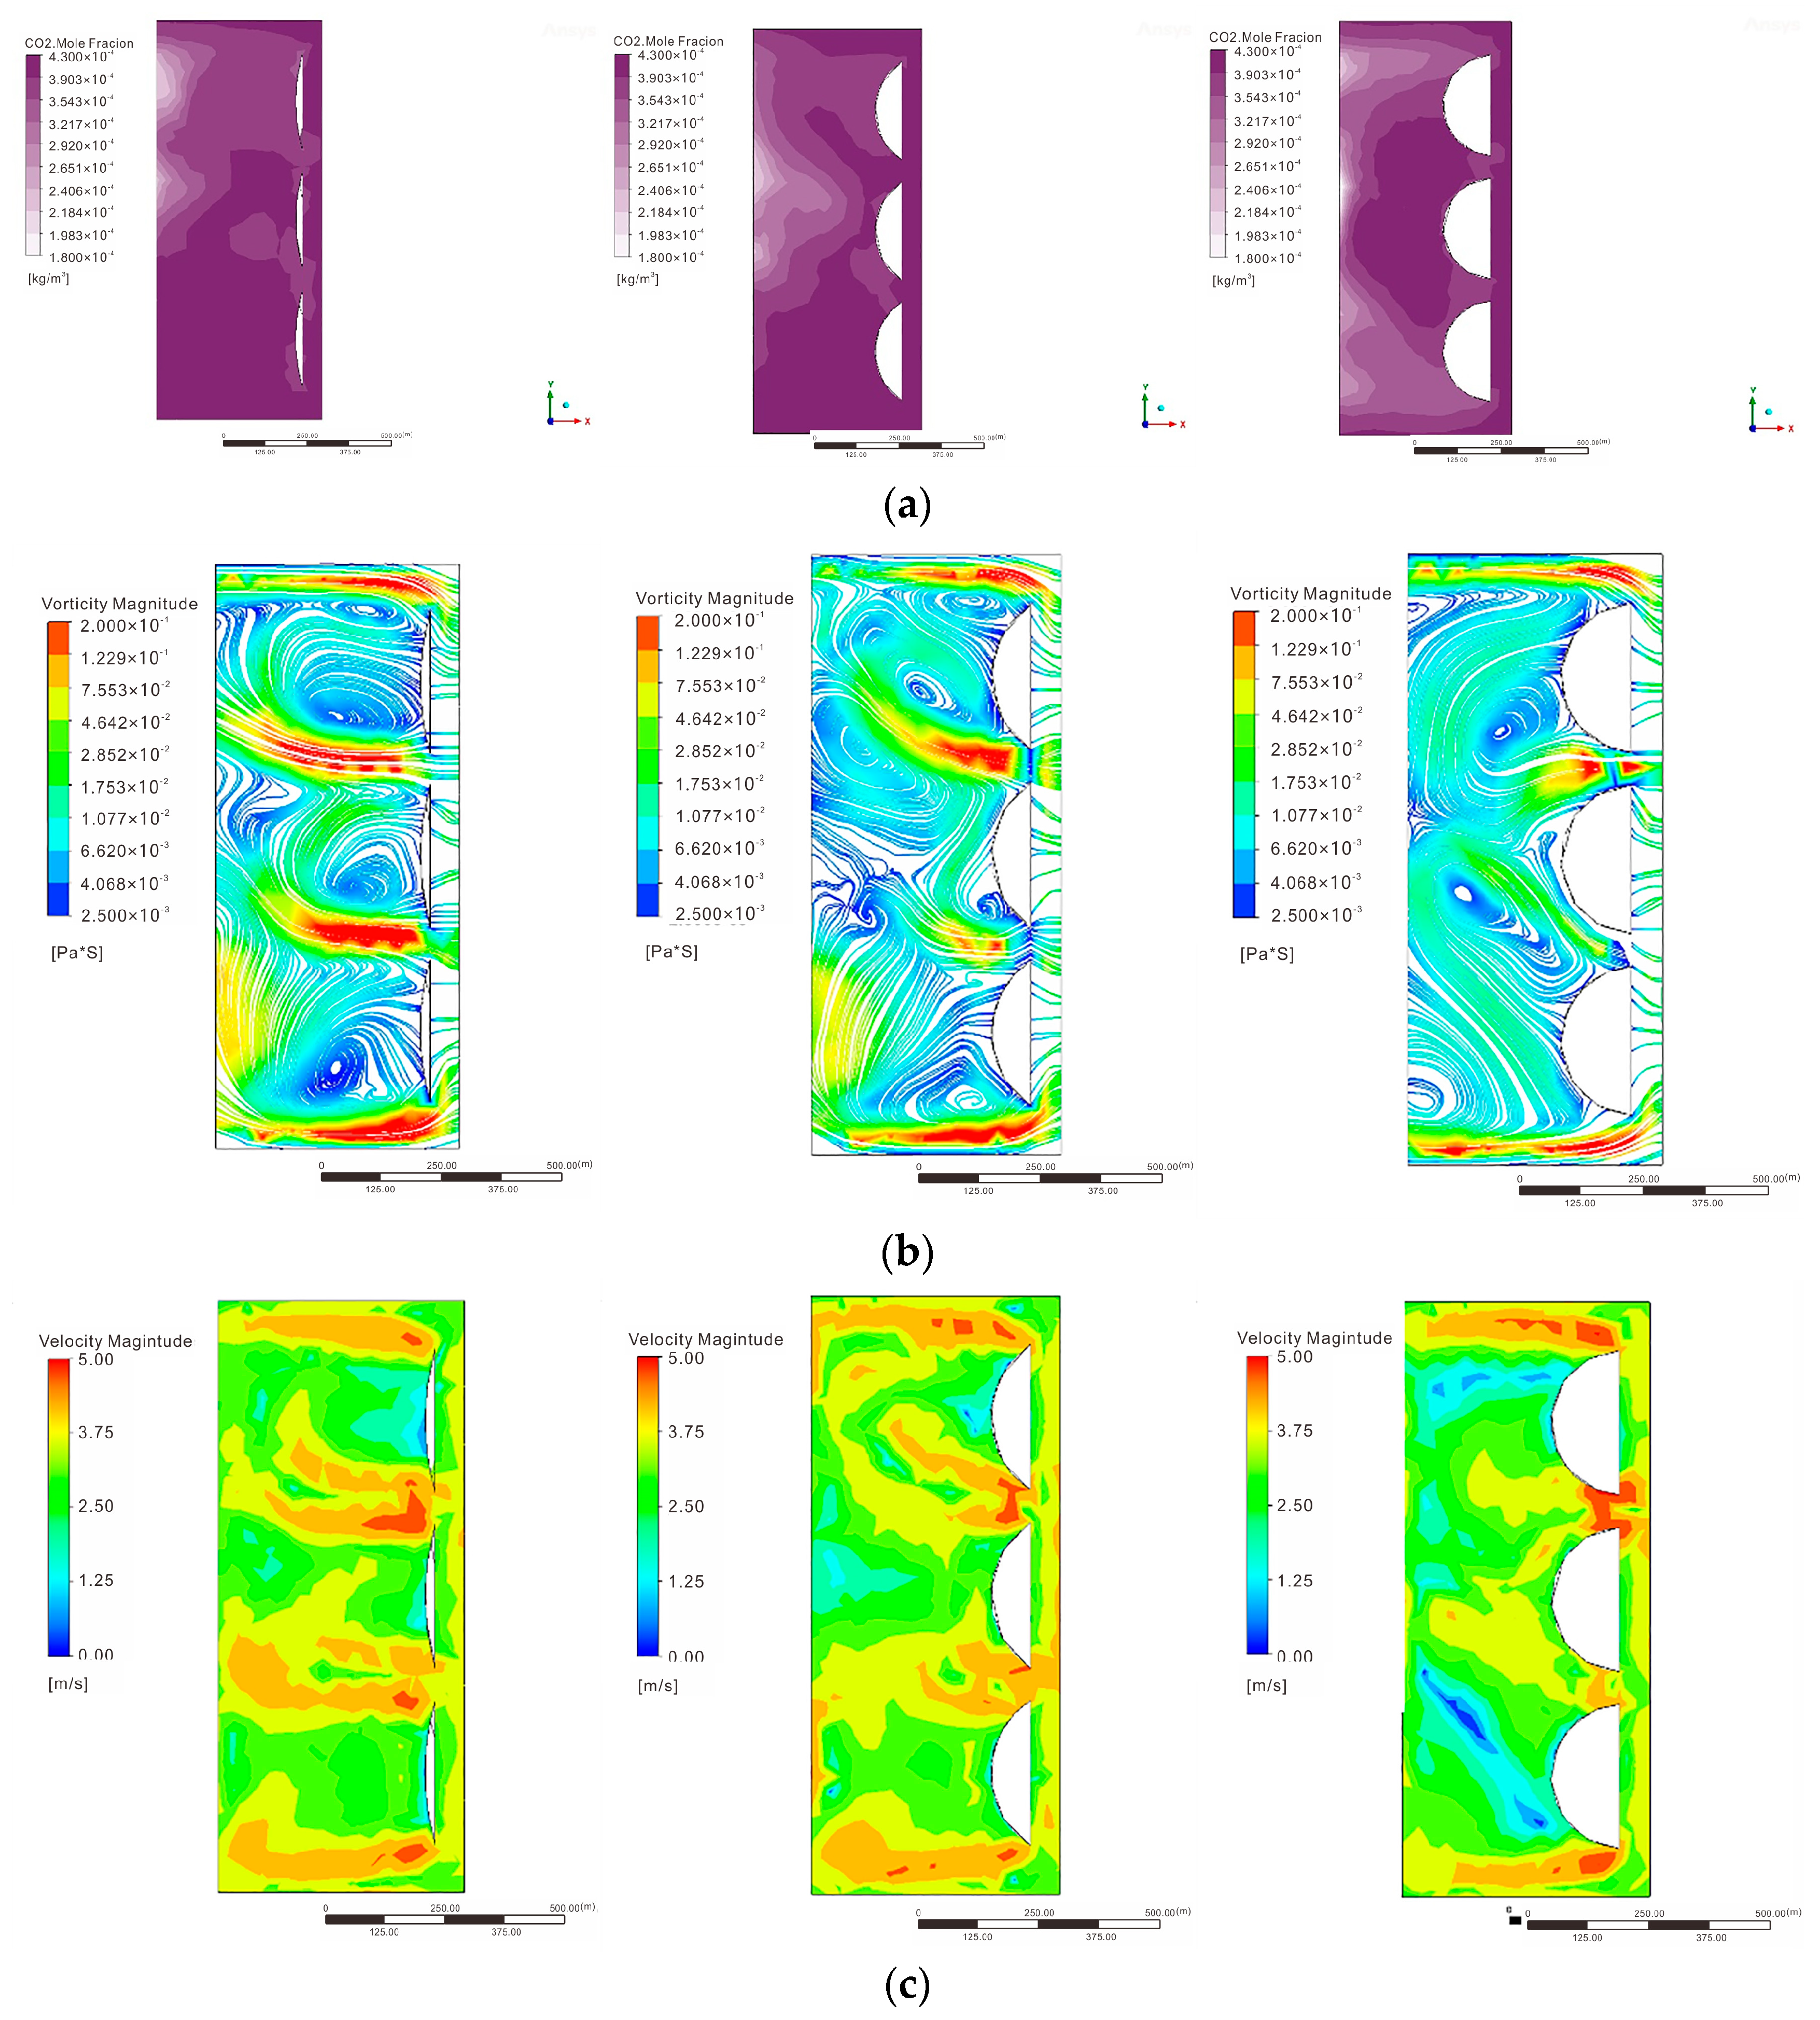
3.2.1. Carbon Welcoming Zone

Based on the carbon sequestration calculation results mentioned earlier, it is evident that the “vegetation, soil, and wetlands” elements in urban green spaces make a significant contribution to urban carbon sequestration, with trees being the most prominent in carbon sequestration capacity. Using CAD (version 2021) and Fluent software for simulating the structure, layout, and morphological parameters of the tree communities in the scenario is meaningful for the study of low-carbon construction in urban green spaces.
In order to determine the form of separation used between plant communities in this green space, the study modeled three types of plant community units: rectangular, parallelogram, and fan-shaped plant communities. It was found that the fan-shaped plant communities created the smallest air vortexes in the flow direction, with large turbulence forming channels between the trees and a uniform distribution of carbon dioxide around them. The parallelogram plant communities formed large air vortexes in the flow direction, with significant turbulence between the tree units, but lower surrounding carbon dioxide concentrations. The rectangular plant communities were similar to the parallelogram ones, with large air vortexes formed in the flow direction but less turbulence between the trees and the lowest range of carbon dioxide concentrations. Therefore, the fan-shaped plant community units were chosen as the most suitable morphological structure for the “carbon welcoming zone” as they facilitate minimal carbon dioxide absorption and guidance (Figure 5).
By simulating fan-shaped plant community units of 1, 0.5, and 1.5 times the length of 500 m on the east side of the planned site, it was found that a one-block length unit caused the smallest air vortexes in the flow direction, with large turbulence forming channels between the trees and lower surrounding carbon dioxide concentrations. The 0.5 block length unit formed a large air vortex in the flow direction, with significant turbulence between the trees and the lowest surrounding carbon dioxide concentrations. The 1.5 block length unit had the smallest air vortexes in the flow direction, but the most turbulence between the trees and almost no low carbon dioxide concentration areas around them. Consequently, a one-block length unit was chosen as the best for guiding and absorbing carbon dioxide (Figure 6).
Considering the current site conditions and the selection of tree specifications, the study simulated the carbon dioxide flow of fan-shaped plant community units with thicknesses of 20 m, 40 m, and 60 m for one block length. It is found that the 20 m thickness has the most air vortexes in the flow direction, with significant turbulence between the tree units and almost no low carbon dioxide concentration areas around them. The 40 m thickness has smaller air vortexes formed in the flow direction, with less turbulence forming channels between the trees and lower surrounding carbon dioxide concentrations. The 60 m thickness has similar air vortexes to the 40 m thickness in the flow direction, but the most turbulence between the trees and unevenly distributed carbon dioxide concentrations around them. Therefore, a 40 m thick one-block length fan-shaped plant community is chosen as the most conducive to the guidance and absorption of carbon dioxide (Figure 7).

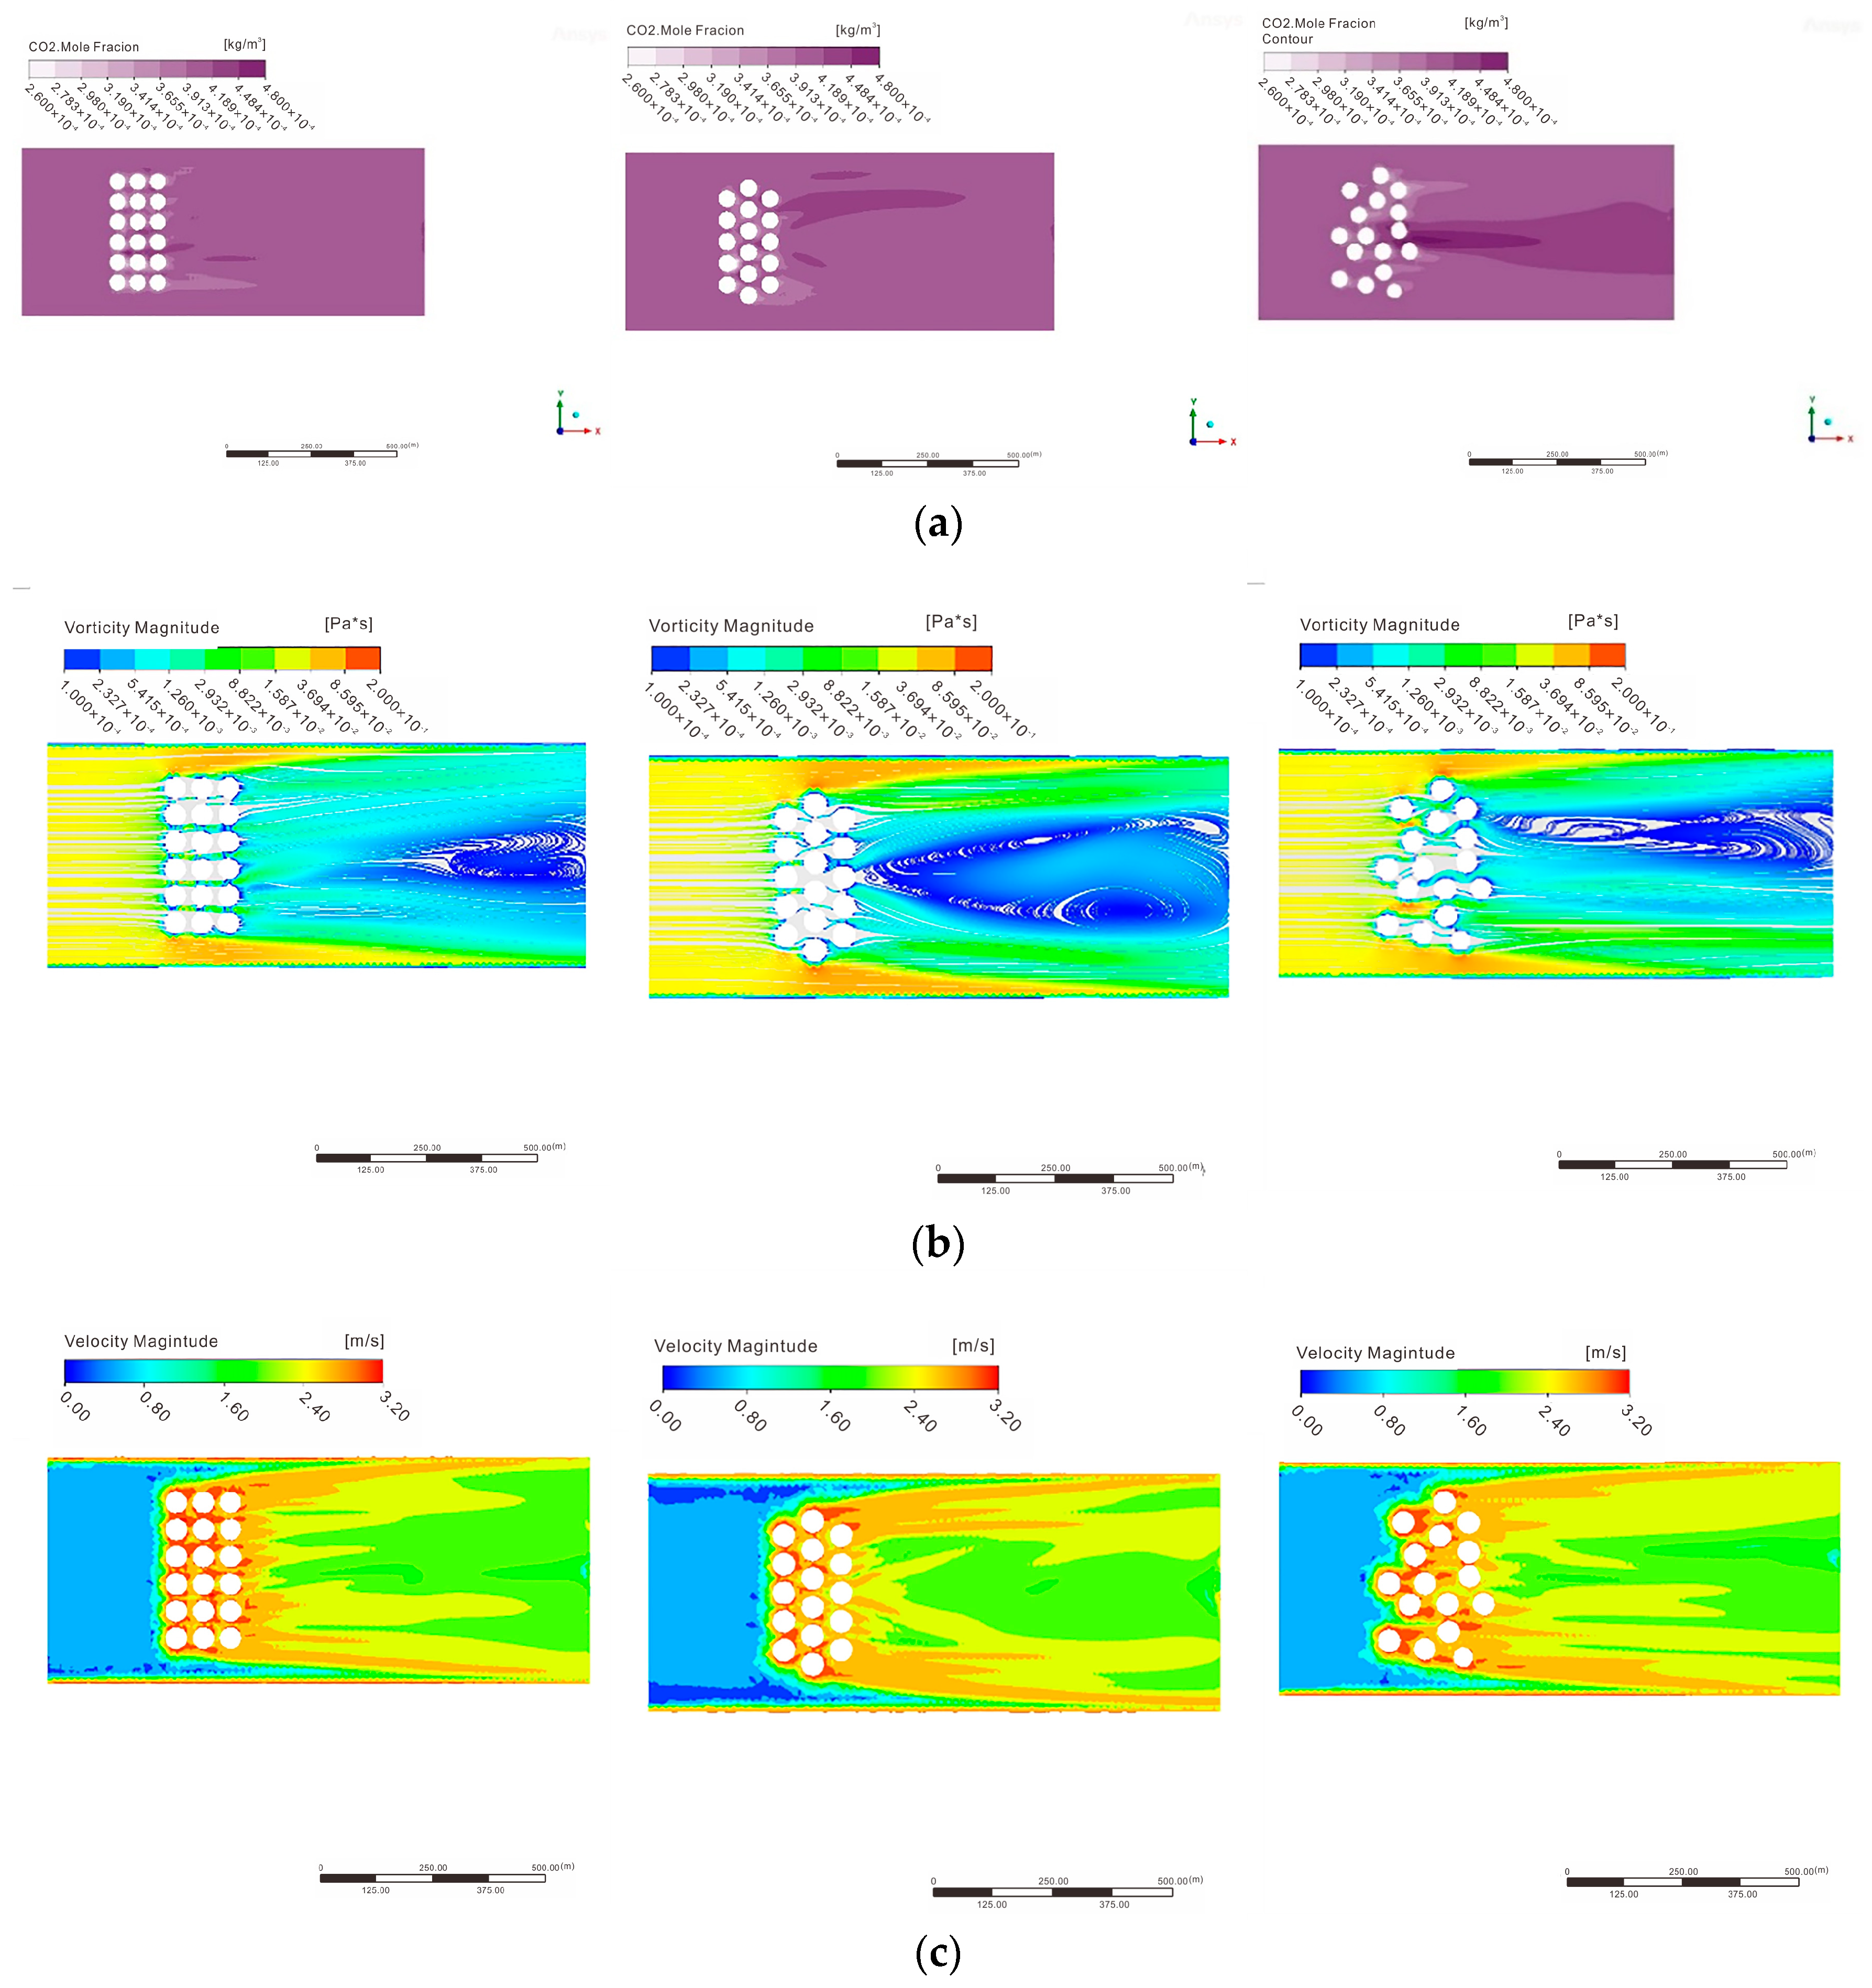
3.2.2. Carbon Flow Area

By integrating the literature, the spatial structure of plant communities was divided into grid, herringbone, and natural structures. Simulations were conducted for the three types of planting morphologies. Comparing the carbon dioxide concentration maps, air eddy maps, and velocity maps (Figure 8) under different plant community spaces, it is evident that the grid structure has the smallest air vortices in the direction of incoming flow, with a uniform distribution of carbon dioxide concentration around it; the herringbone structure causes large air eddies after the incoming flow direction, with lower surrounding carbon dioxide concentration; the natural structure has smaller air vortices after the incoming flow direction, with the largest range of carbon dioxide concentration around it. In conclusion, the herringbone structure is superior to the grid and natural structures. However, the natural structure offers the best visual effect, thus this project adopts a planting pattern that combines the herringbone and natural structures to construct the “Carbon Flow Area”.

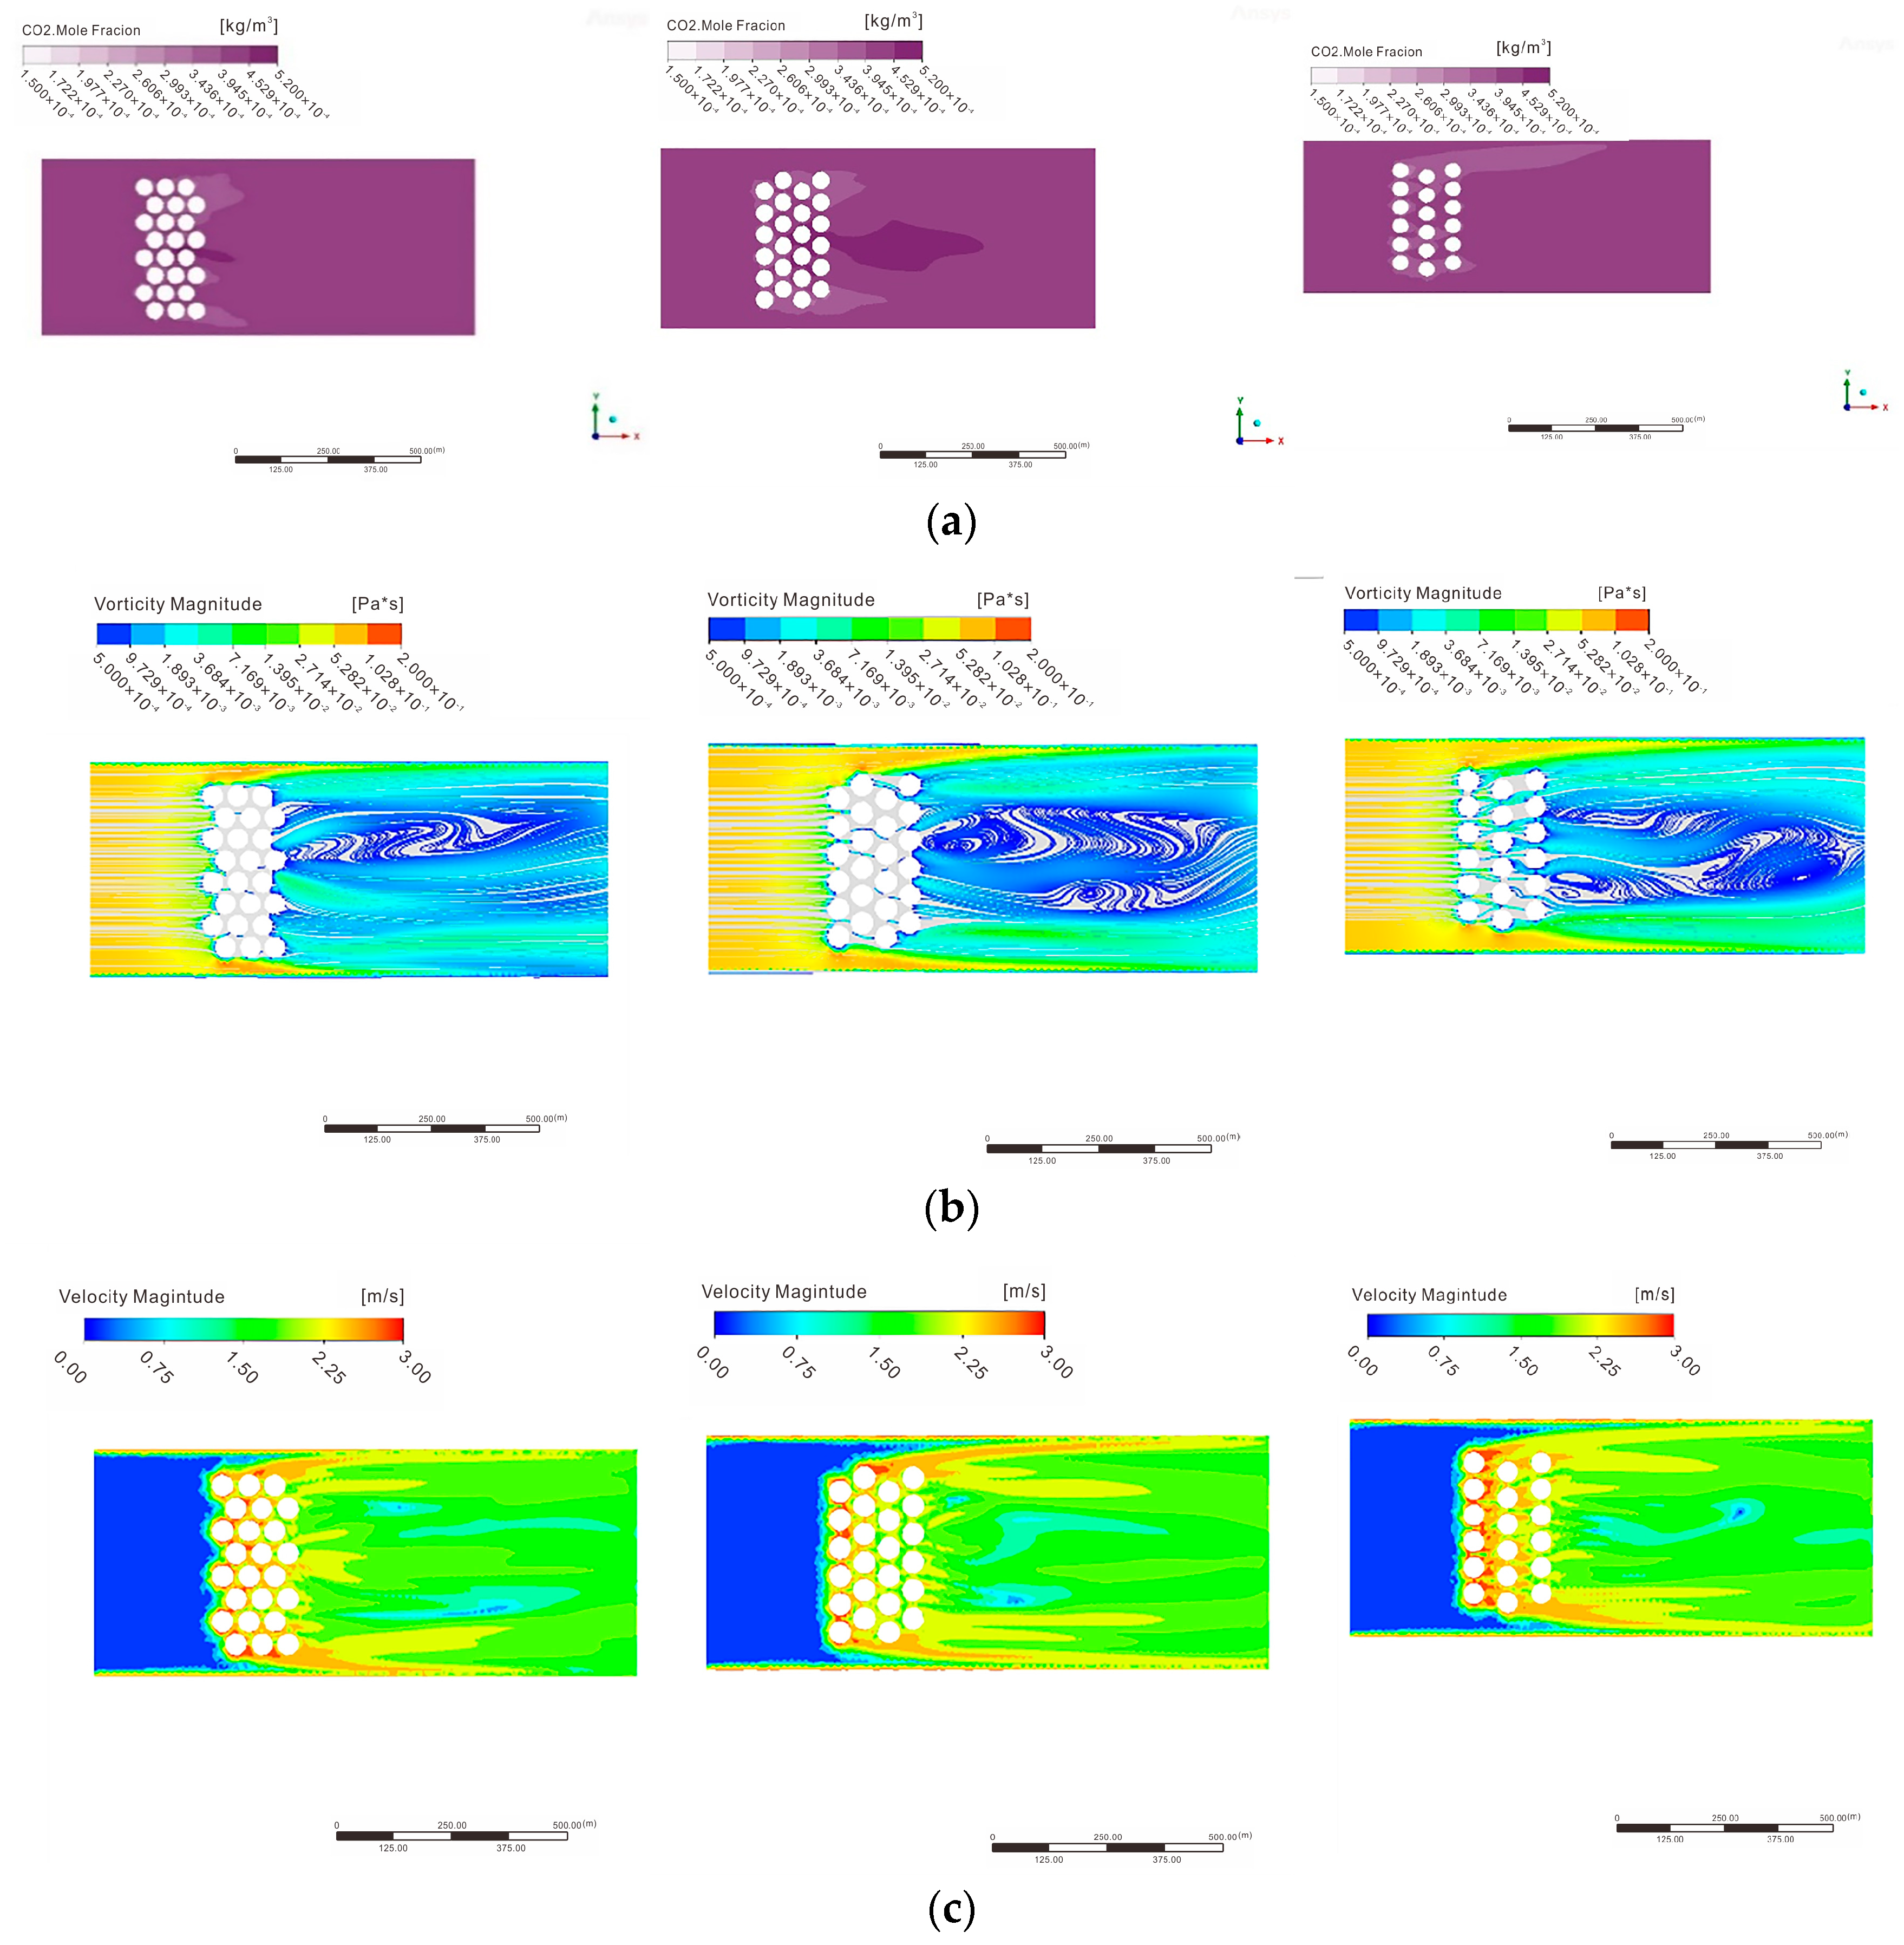
3.2.3. Carbon Shadow Area

According to the previous simulation analysis, a forest belt of about 40 m in thickness has a good carbon obstruction and filtration effect. As analyzed above, the herringbone structure is best suited as the basic structure for the “Carbon Shadow Area” due to its excellent obstruction of the carbon dioxide fluid. Comparing carbon dioxide concentration maps, air eddy maps, and velocity maps (Figure 9) under basic herringbone planting units with bottom angles of 30°, 60°, and 75°, it is found that as the bottom angle widens, the fluid flow speed between trees gradually decreases, slight vortices form after the incoming flow, which promotes full contact and absorption of carbon dioxide. However, if the bottom angle is too large or too small, a large amount of airflow will pass directly through the gaps outside or inside the tree group, reducing the efficiency of carbon fixation. In conclusion, a bottom angle of 60° for the herringbone planting pattern is chosen as it has the least carbon dioxide streamlines passing through the tree group, the strongest obstruction ability, and the strongest absorption ability. Finally, a herringbone planting pattern with a total width of 40 m and a bottom angle of 60° is determined for the “Carbon Shadow Area”.

4. Discussion

4.1. Discussion on Fluent Simulation Results

The spatial distribution of the carbon-receiving area under different scenario simulations shows that the fan-shaped plant community has the smallest air vortices after the direction of incoming flow, and the turbulence between tree groups forms a channel, with a uniform distribution of carbon dioxide around it; this morphological structure of the “carbon-receiving area” is most capable of satisfying the requirements for minor carbon dioxide absorption and induction. Scenario simulations under different lengths of plant community units show that one block length has smaller air vortices after the direction of incoming flow, and the turbulence between tree groups forms a channel, with a lower range of carbon dioxide concentration around it; this is more conducive to the induction and absorption of carbon dioxide. Scenario simulations under different thicknesses of plant community units show that a 40 m thickness has smaller air vortices after the direction of incoming flow. The turbulence between tree groups forms a channel, with a lower concentration of carbon dioxide around it [24,25,26]. Thus, choosing a space-intensive 40 m thickness of one block-length fan-shaped plant community is more conducive to the induction and absorption of carbon dioxide. The conclusions of the three scenario simulations are that choosing a space-intensive 40 m thickness of one block-length fan-shaped plant community is more conducive to the induction and absorption of carbon dioxide. The low-carbon construction approach includes creating a composite, multi-age, mixed plant community with refined techniques to achieve a natural succession cycle of plants; imitating the local natural forest phase, letting nature work, and creating a composite and sustainable “near-natural” community forest habitat; cleverly using local resources and conditions, and through refined techniques to effectively reduce carbon source emissions.
Within the carbon flow area are two scenario simulations with different planting form community units under scenario simulation. The herringbone structure plant community space forms a large air eddy in the direction of incoming flow, with lower surrounding carbon dioxide concentration. Combined with visual effects, this project adopts a planting pattern that combines the herringbone and natural structures to construct the “Carbon Flow Area”, which has a very good carbon dioxide obstruction reaction capability. Scenario simulations under different plant spacing community units show that the 6 m × 6 m spacing has a uniform distribution of carbon dioxide around it, and the conclusion of the two scenario simulations is that choosing a 6 m spacing herringbone structure community combined with a natural plant community as the “Carbon Flow Area” plant community space model has a very good carbon dioxide obstruction and absorption capacity. The low-carbon construction approach includes adapting measures to local conditions, preferring local tree species to increase adaptability to the local environment, effectively intensifying land use and protectively utilizing site advantages and natural landscape elements, using new vegetation of the same genus and species as the existing trees on the site, striving to achieve a stable, healthy, and self-circulating ecological community. Enhancing plant diversity and the productivity of the ecosystem helps to improve the carbon sink capacity of plants and soil.
Within the carbon shadow area, there is one scenario simulation, with different planting angle community units under scenario simulation, choosing a 60° bottom angle herringbone planting form that has the least carbon dioxide streamlines passing through the tree group, the strongest obstruction ability, and the strongest absorption ability. The final decision is a total width of 40 m and a bottom angle of 60° herringbone planting for the “Carbon Shadow Area” planting mode. In summary, this study simulates the structure, layout, and morphological parameters of tree communities in the scene based on Fluent simulation. The park is divided into three areas: carbon welcome area, carbon flow area, and carbon shadow area for carbon flow simulation. The experimental results showed that the fan-shaped plant community with a length and thickness of 40 m was more conducive to the introduction and absorption of carbon dioxide as a “carbon receiving area”. The combination of natural plant community and herringbone structure, with a plant spacing of 6 m, was used as a community space model of “carbon flow zone”, which had good carbon dioxide interception and absorption capacity. The herringbone planting form with a base angle of 60° was selected as the “carbon shadow area”, which had the strongest carbon dioxide interception and absorption capacity. The low-carbon construction approach includes more efficient use of land resources, leaving biological corridors, letting nature work, and enhancing the diversity of the plant community and its carbon sink capacity.

4.2. Low-Carbon Construction Approaches Throughout the Whole Life Cycle

Carbon sequestration strategies, as documented in a large body of literature, have been relatively generalized, primarily focusing on optimizing green spaces themselves. However, constrained by the coordinated development of ecological and economic environments, it is impossible to indefinitely increase the proportion of urban green spaces. Cities face limited land resources, so increasing the area of green space is limited by space. This requires maximizing the versatility of green spaces in a limited space, including maximizing carbon sequestration. How to enable the same area of green space to provide better ecological benefits and to enhance the carbon sequestration function of urban green spaces more scientifically and efficiently throughout the “whole life cycle” is an important aspect of low-carbon construction approaches.
Planning and Design: According to the research results, vegetation types and structures with good carbon sequestration capacity were selected to achieve better carbon dioxide sequestration and absorption effects. In urban planning, green spaces should be reasonably arranged according to the characteristics and uses of different areas to maximize the overall carbon sequestration benefits; skillfully utilize local resources and conditions, and through refined techniques, effectively reduce carbon emissions; mimic hills and imitate waters, comply with the existing texture as the basis for construction, reduce disturbances and changes to the on-site environment, and minimize earthwork excavation and backfilling; choose indigenous tree species and high carbon sequestration species that are suitable for the local conditions, saving construction costs; avoid designing high-energy-consuming features or buildings for excessive landscape effects; utilize site advantages and natural landscape elements protectively.
Construction and Technology: Make the most of on-site materials, which has a significant impact on reducing carbon emissions. In the design area, choose low-carbon environmental materials such as timber, crushed stone, and soft pavement. During the construction process, organize construction routes, use appropriate transportation means, reduce dust during transport, and stagger transport to effectively reduce carbon emissions from construction [27]. By effectively and reasonably allocating construction personnel, optimizing the construction organization process of each subsection, and adopting modular construction units, construction efficiency and resource recycling rates are improved [28].
Increase soil organic matter content and improve soil carbon storage capacity through appropriate soil management practices, such as compost application and plant residue return. Protect urban wetland systems, maintain their moist state, and promote carbon sequestration and storage processes in wetland ecosystems.
Maintenance and Management: The carbon emissions from plant maintenance, water and fertilizer measures, and pest management are significant, with irrigation causing the highest emissions. The main carbon emissions from green space irrigation come from the fuel consumption of maintenance vehicles; thus, during maintenance, it is necessary to source water locally as much as possible to reduce the mechanical consumption from long-distance irrigation by harnessing natural processes and enhancing the biodiversity and stable development of plant communities, thus improving the plants’ carbon sequestration capacity. Employ intelligent management measures to dynamically manage the routes of construction and maintenance personnel and vehicles, and reasonably allocate them to improve maintenance efficiency [16,29,30].
Environmental impact: On the one hand, increasing urban green spaces can help reduce the concentration of carbon dioxide in the air and improve air quality, which is beneficial to the health of residents. On the other hand, green space cover can provide more ecosystem services, such as reducing the urban heat island effect, improving water management and protecting biodiversity.
Economic impact: On the one hand, by reducing the urban heat island effect, green spaces can reduce the air conditioning demand of urban residents and save energy costs. On the other hand, cities with high-quality green spaces are more attractive, able to attract residents and businesses, and promote economic development.
In summary, when conducting low-carbon construction in urban green spaces, it is necessary to form a scientifically rational spatial pattern of land use types at every stage, from design to construction and subsequent maintenance, in order to achieve the goal of regulating the urban climate. During the implementation phase, fully utilize new carbon sequestration technologies and research and promote new energy-saving measures. During the maintenance phase, manage scientifically and maintain low-carbon standards. Specifically, a sustainable design concept needs to thoroughly consider elements such as “vegetation, soil, and wetland water bodies”, and introducing a low-carbon construction system covering all stages of “planning and design, construction implementation, and maintenance management” may be an important strategy for effectively forming a comprehensive carbon sequestration benefit [1,31].
With the continuous deepening of carbon neutrality research, landscape gardening should play to its strengths and carry out ecological engineering from the perspective of emission reduction and carbon sequestration, creating a large public environmental ecosystem with self-circulating and self-repairing functions [32,33,34]. How to enhance urban carbon sequestration capacity through coordinated urban–rural construction has become a new proposition for the transformation of concepts and the enrichment of the discipline’s content in the field of landscape architecture.

4.3. Shortcomings and Prospects

This study investigates the research site independently from the larger environment and considers carbon dioxide as a continuous-phase gas. The research is somewhat limited as it studies the flow direction, concentration, and wind speed without considering larger-scale impacts. Moreover, for the calculation of carbon sequestration for different types of vegetation, the data statistics still have some shortcomings. For instance, the research subject belongs to a micro-scale, the model is relatively simple, and the calculation of carbon sequestration benefits for trees, shrubs, and grasses in this paper uses an average estimation method, which may differ from the overall actual situation. Lastly, the data statistics use information from the year the park was established, which may not account for subsequent changes due to human interference and commercial display purposes.
Currently, there is a scarcity of research on the evolutionary mechanisms, simulation predictions, and optimization of urban park carbon sequestration. Future research could be based on the existing simulation prediction results at the urban scale, focusing on optimizing national spatial planning strategies on a larger and more macroscopic scale [35]. Coupling spatial positioning with the ecological processes of carbon sequestration (quantitatively assessing carbon sequestration from a spatial perspective) and analyzing them to discover the carbon sequestration development patterns of urban-scale or larger ecosystems will provide foundational help for the formulation of new policies or the proposal of innovative development models [36].

5. Conclusions

This paper investigates the contribution of vegetation carbon sequestration capacity under different scenarios such as planting angle, community unit, and thickness using Fluent software simulation. The study finds:
(1)
Among different types of vegetation, trees have the most prominent carbon sequestration capacity. Thus, large, strong carbon-sequestering trees can significantly enhance the comprehensive carbon sequestration benefits and value of green spaces. Compared to the carbon sequestration contribution of vegetation, the carbon sequestration amount of soil and wetland water bodies is smaller.
(2)
The results from Fluent software show that a fan-shaped plant community with a thickness of 40 m for one block length, serving as a “carbon reception area”, is more conducive to the introduction and absorption of carbon dioxide. A community space model combining a natural plant community with a herringbone structure with a 6 m spacing between plants, serving as a “carbon flow area”, has a good capacity for carbon dioxide interception and absorption. Choosing a herringbone planting form with a bottom angle of 60° as the “carbon shadow area” has the strongest carbon dioxide interception and absorption capacities.
(3)
Optimizing the urban park environment involves using Fluent simulation to elucidate the flow of carbon dioxide influenced by wind dynamics among different elements, while also adjusting and optimizing their form, layout, and spatial distances. This approach proves beneficial and effective.
(4)
Ecological implications. Based on the above simulation results, by optimizing the planting angle, community unit, and vegetation thickness, not only can the carbon sequestration capacity be enhanced, but the absorption and filtration functions of vegetation may also be improved, and the overall ecosystem service function can be improved. Enhancing the absorption capacity of carbon dioxide helps to reduce the concentration of greenhouse gases in the atmosphere, thereby mitigating the effects of climate change. Diverse vegetation layouts help to improve soil structure and increase soil organic matter content, which in turn improves soil health. Further creating a more stable and self-sustaining ecosystem will help improve the long-term stability of the ecological environment, and provide an important reference for future ecological protection and restoration.

Author Contributions

J.L.: Writing—original draft, Investigation, Data curation, Formal analysis, Conceptualization, Methodology, Validation, Writing—review & editing. L.Z.: Writing—original draft, Funding acquisition, Conceptualization, Methodology, Supervision, Validation, Project administration, Writing—review & editing. H.Y.: Resources, Writing—review & editing. Y.Z.: Resources, Writing—review & editing. All authors have read and agreed to the published version of the manuscript.

Funding

This work was supported by the key project of the National Natural Science Foundation of China General Project “Correlation Mechanism of Multi-Scale Structure and Functional Connectivity of Urban Ecological Corridors” (No. 32171569); the National Natural Science Foundation of China Funded by the National Key R&D Program Project “Construction of Multi-functional Coupling Networks and Ecological Restoration Technology of Typical Urban Corridors” (No. 2022YFC3802604); Shanghai’s 2023 “Technology Innovation Action Plan” Social Development Science and Technology Research Project “Research and Demonstration of Key Technologies for the Construction of Megacity Shanghai Park City” (No. 23DZ1204400); Natural Science Foundation of Shanghai (23ZR1459700); and Shanghai Sailing Program (22YF1444000).

Data Availability Statement

The original contributions presented in the study are included in the article, further inquiries can be directed to the corresponding author.

Acknowledgments

We thank Jing Li for his in-depth guidance during the conceptualization and writing of the paper, as well as his contribution in data acquisition and revision of the returned manuscript. Thanks to Zhang Lang for his contribution in providing writing ideas and the revision process. Thanks to Hao-Ran Yu for his meticulous revision and enhancement of this paper to make it better. Thanks to Zhu Yi for his continuous support and encouragement during the writing process.

Conflicts of Interest

Author Jing Li was employed by the company Shanghai Xiandai Architectural Design & Urban Planning Research Institute Co., Ltd. Author Yi Zhu was employed by the company Shanghai Landscape Industry Co., Ltd. The remaining authors declare that the research was conducted in the absence of any commercial or financial relationships that could be construed as a potential conflict of interest. The Shanghai Xiandai Architectural Design & Urban Planning Research Institute Co., Ltd. and Shanghai Landscape Industry Co., Ltd. had no role in the design of the study; in the collection, analyses, or interpretation of data; in the writing of the manuscript, or in the decision to publish the results.

References

  1. Ali, G.; Pumijumnong, N.; Cui, S. Valuation and validation of carbon sources and sinks through land cover/use change analysis: The case of Bangkok metropolitan area. Land Use Policy 2018, 70, 471–478. [Google Scholar] [CrossRef]
  2. Amoatey, P.; Sulaiman, H. Quantifying carbon storage potential of urban plantations and landscapes in Muscat, Oman. Environ. Dev. Sustain. 2020, 22, 7969–7984. [Google Scholar] [CrossRef]
  3. Dennis, M.; Beesley, L.; Hardman, M.; James, P. Ecosystem (Dis)benefits Arising from Formal and Informal Land-Use in Manchester (UK); a Case Study of Urban Soil Characteristics Associated with Local Green Space Management. Agronomy 2020, 10, 552. [Google Scholar] [CrossRef]
  4. Xing, L.; Zhang, G.; Zhang, L.; Yi, Y.; Lin, Y.; Jiang, Z.; Zheng, X. The application of hyperspectral technology in vegetation characteristic monitoring. Garden 2020, 11, 8–14. [Google Scholar]
  5. Zhang, G.; Xing, L.; Zhang, L.; Zhong, Q.; Yi, Y. Research progress on monitoring methods for carbon sequestration measurement in urban green spaces. Garden 2022, 39, 4–9. [Google Scholar] [CrossRef]
  6. Zhang, G.; Zhong, Q.; Zhang, L. Research on the construction of carbon sequestration capacity in urban garden greening aimed at carbon neutrality. Landsc. Gard. 2022, 29, 12–16. [Google Scholar] [CrossRef]
  7. Luo, B.; Bian, D.; Bai, M.; La, B. Spatiotemporal variation characteristics of NPP in the alpine pastoral areas of northern Tibet and forecasts under a 2 °C global warming scenario. J. Glaciol. Geocryol. 2020, 42, 653–661. [Google Scholar]
  8. Yuan, Q.; Wu, S.; Dai, E.; Zhao, D.; Ren, P.; Zhang, X. Vulnerability assessment of potential vegetation NPP in China under the past 50 years of climate change. Acta Geogr. Sin. 2016, 71, 797–806. [Google Scholar] [CrossRef]
  9. Azimi, M.; Bian, Z. Provincial and regional analysis of carbon neutrality policy and the environmental Kuznets curve: Examining their effect on CO2 emissions in China. Environ. Sci. Pollut. Res. 2023, 30, 46234–46247. [Google Scholar] [CrossRef]
  10. Bherwani, H.; Banerji, T.; Menon, R. Role and value of urban forests in carbon sequestration: Review and assessment in Indian context. Environ. Dev. Sustain. 2024, 26, 603–626. [Google Scholar] [CrossRef]
  11. Lin, Y.; Yi, Y.; Zhang, G.; Zhang, L.; Xing, L. The application and development trend of hyperspectral remote sensing technology in the survey of urban green spaces. Garden 2020, 6, 70–75. [Google Scholar]
  12. Nero, B.F.; Callo-Concha, D.; Anning, A.; Denich, M. Urban Green Spaces Enhance Climate Change Mitigation in Cities of the Global South: The Case of Kumasi, Ghana. Procedia Eng. 2017, 198, 69–83. [Google Scholar] [CrossRef]
  13. Fan, L.; Wang, J.; Han, D.; Gao, J.; Yao, Y. Research on Promoting Carbon Sequestration of Urban Green Space Distribution Characteristics and Planting Design Models in Xi’an. Sustainability 2023, 15, 572. [Google Scholar] [CrossRef]
  14. Wang, Y.; Chang, Q.; Li, X. Promoting sustainable carbon sequestration of plants in urban greenspace by planting design: A case study in parks of Beijing. Urban Urban Gree 2021, 64, 127291. [Google Scholar] [CrossRef]
  15. Zhou, L.; Upchurch, E.R.; Liu, Y.; Anfinsen, B.-T.; Hashemian, Y.; Yuan, Z. Evaluating Subsea Capping Stack Usage for CO2 Blowouts. In Proceedings of the Offshore Technology Conference, Houston, TX, USA, 6–9 May 2024; p. D031S040R004. [Google Scholar] [CrossRef]
  16. Privitera, R.; Palermo, V.; Martinico, F.; Fichera, A.; La Rosa, D. Towards lower carbon cities: Urban morphology contribution in climate change adaptation strategies. Eur. Plan. Stud. 2018, 26, 812–837. [Google Scholar] [CrossRef]
  17. Fu, D.; Bu, B.; Wu, J.; Singh, R.P. Investigation on the carbon sequestration capacity of vegetation along a heavy traffic load expressway. J. Environ. Manag. 2019, 241, 549–557. [Google Scholar] [CrossRef] [PubMed]
  18. Weissert, L.F.; Salmond, J.A.; Schwendenmann, L. Photosynthetic CO2 uptake and carbon sequestration potential of deciduous and evergreen tree species in an urban environment. Urban Ecosyst. 2017, 20, 663–674. [Google Scholar] [CrossRef]
  19. Tominaga, Y. Flow around a high-rise building using steady and unsteady RANS CFD: Effect of large-scale fluctuations on the velocity statistics. J. Wind Eng. Ind. Aerod. 2015, 142, 93–103. [Google Scholar] [CrossRef]
  20. Balogh, M.; Parente, A.; Benocci, C. RANS simulation of ABL flow over complex terrains applying an Enhanced k-ε model and wall function formulation: Implementation and comparison for fluent and OpenFOAM. J. Wind Eng. Ind. Aerod. 2012, 104–106, 360–368. [Google Scholar] [CrossRef]
  21. Riddle, A.; Carruthers, D.; Sharpe, A.; McHugh, C.; Stocker, J. Comparisons between FLUENT and ADMS for atmospheric dispersion modelling. Atmos. Environ. 2004, 38, 1029–1038. [Google Scholar] [CrossRef]
  22. Zhang, Y.; Meng, W.; Yun, H.; Xu, W.; Hu, B.; He, M.; Mo, X.; Zhang, L. Is urban green space a carbon sink or source?—A case study of China based on LCA method. Environ. Impact Assess. Rev. 2022, 94, 106766. [Google Scholar] [CrossRef]
  23. Zhao, D.; Cai, J.; Xu, Y.; Liu, Y.; Yao, M. Carbon sinks in urban public green spaces under carbon neutrality: A bibliometric analysis and systematic literature review. Urban Urban Gree 2023, 86, 128037. [Google Scholar] [CrossRef]
  24. Baldocchi, D. Assessing the eddy covariance technique for evaluating carbon dioxide exchange rates of ecosystems: Past, present and future. Glob. Change Biol. 2003, 9, 479–492. [Google Scholar] [CrossRef]
  25. Finnigan, J. Turbulence in plant canopies. Annu. Rev. Fluid Mech. 2000, 32, 519–571. [Google Scholar] [CrossRef]
  26. Katul, G.G.; Hsieh, C.I.; Kuhn, G.; Ellsworth, D.; Nie, D. Turbulent eddy motion at the forest-atmosphere interface. J. Geophys. Res. Atmos. 1997, 102, 13409–13421. [Google Scholar] [CrossRef]
  27. Wang, Y.; Tong, X.; Guan, C.; Shi, Q.; Zhang, J.; Li, J.; Lin, X. The relationship between the net primary productivity of typical artificial forests in China and forest age. J. Appl. Ecol. 2023, 34, 2017–2028. [Google Scholar] [CrossRef]
  28. Sun, X. Estimation of Net Primary Productivity and Its Uncertainty in the Natural Secondary Forests of Maoer Mountain. Master’s Thesis, Northeast Forestry University, Harbin, China, 2021. (In Chinese with English abstract). [Google Scholar]
  29. Zhang, Y.; Lang, M.; Liu, M.; Xie, B.; Chang, Q. Characteristics of vegetation carbon sequestration changes in the Loess Plateau under the synergistic effect of land use transition and altitude. Acta Ecol. Sin. 2022, 42, 3897–3908. [Google Scholar] [CrossRef]
  30. Lahoti, S.; Lahoti, A.; Joshi, R.K.; Saito, O. Vegetation Structure, Species Composition, and Carbon Sink Potential of Urban Green Spaces in Nagpur City, India. Land 2020, 9, 107. [Google Scholar] [CrossRef]
  31. Cong, R.; Huang, Y.; Yu, H.; Zhang, J.; Wang, X. Discussion on the problems and countermeasures of transformation development in the Greater and Lesser Xing’an Ranges under the “Dual Carbon” background. Temp. For. Res. 2022, 5, 70–75. [Google Scholar]
  32. Liu, S.; Yang, Y.; Wang, H. Development strategies and countermeasures for Chinese artificial forest management: Transitioning from single-objective management pursuing timber yield to multi-objective management enhancing ecosystem service quality and benefits. Acta Ecol. Sin. 2018, 38, 1–10. [Google Scholar] [CrossRef]
  33. Wu, B.; Yang, J.; Qiu, M. Bibliometric analysis of forest ecological compensation literature based on knowledge graphs. Resour. Dev. Mark. 2023, 39, 274–283. [Google Scholar] [CrossRef]
  34. Crisp, D.; Atlas, R.M.; Breon, F.M.; Brown, L.R.; Burrows, J.P.; Ciais, P.; Connor, B.J.; Doney, S.C.; Fung, I.Y.; Jacob, D.J.; et al. The Orbiting Carbon Observatory (OCO) mission. Adv. Space Res. 2004, 34, 700–709. [Google Scholar] [CrossRef]
  35. Felzer, B.S.; Andrade, C. Future (2020–2099) Carbon and Water Dynamics of Lehigh Valley Based on Land Use and Land Cover Change. Environments 2024, 11, 133. [Google Scholar] [CrossRef]
  36. Chen, W.Y. The role of urban green infrastructure in offsetting carbon emissions in 35 major Chinese cities: A nationwide estimate. Cities 2015, 44, 112–120. [Google Scholar] [CrossRef]
Figure 1. Schematic diagram of green space planning. (a) Schematic diagram of the site of the Nantong Central Park. (b) Masterplan of the park. (c) Comprehensive GIS information extraction map of Nantong Park.
Processes 12 01931 g001
Figure 2. A research framework for the simulation of “vegetation, soil, and wetland” based on CFD.
Processes 12 01931 g002
Figure 3. Flow field distribution in Nantong Park. (a) Classification of fluid fields around buildings and their typical distribution maps. (b) Schematic diagram of the fluid field in Nantong Park.
Processes 12 01931 g003
Figure 4. Modeling and boundary condition setting. (a) Schematic of the steps for establishing a fluid domain physical model. (b) Establishment of a three-dimensional computational grid in the fluid domain. (c) Model after interface definition and fluid assignment.
Processes 12 01931 g004
Figure 5. Scenario simulation of different plant forms in the carbon welcoming zone. (a) Simulated carbon dioxide concentration cloud map of carbon flow in different forms of plant community units. (b) Cloud diagram of simulated air vortex flow for carbon flow in different forms of plant community units. (c)Simulated velocity cloud maps of plant community units with different morphologies.
Processes 12 01931 g005
Figure 6. Simulation of plant scenarios with different lengths in the carbon welcoming zone. (a) Simulated carbon dioxide concentration cloud map of carbon flow in plant community units of different lengths. (b) Simulated air vortex cloud map of carbon flow in plant community units of different lengths. (c) Simulated velocity cloud maps of carbon flow in plant community units of different lengths.
Processes 12 01931 g006
Figure 7. Simulation of plant scenarios with different thicknesses in the carbon welcoming zone. (a) Simulated carbon dioxide concentration cloud map of carbon flow in plant community units with different thicknesses. (b) Simulated air vortex cloud map of carbon flow in plant community units with different thicknesses. (c) Cloud map of carbon flow simulation speed for plant community units with different thicknesses.
Processes 12 01931 g007
Figure 8. Scenario simulation of different planting forms in carbon flow areas. (a) Simulated carbon dioxide concentration cloud map of carbon flow in community units with different planting forms. (b) Cloud diagram of simulated air vortex flow for carbon flow in community units with different planting forms. (c) Cloud map of carbon flow simulation speed for different planting forms of community units.
Processes 12 01931 g008
Figure 9. Simulation of scenarios with different planting angles in carbon shadow areas. (a) Carbon flow of community unit simulated carbon dioxide concentration cloud map at different planting angles. (b) Simulation of air vorticity cloud by carbon flow of community unit at different planting angles. (c) Carbon flow simulation velocity cloud map of community unit at different planting angles.
Processes 12 01931 g009
Table 1. Park economic indicator table.
Land Use TypeArea (m2)Percentage (%)
Green space458,83073.19
wetland80,50012.84
Road squares and buildings87,57013.97
total626,900100
Table 2. Modeling and boundary condition setting.
Simulation ParametersNumerical Value
average temperature15 °C
average wind speed2.45 m/s
carbon dioxide volume fraction396 × 10−6
acceleration due to principle and modeling diagram9.81 m/s2
Table 3. Simulation of different scenarios of carbon welcoming area, carbon flow area, and carbon shadow area.
ZoneMulti-Scenario SimulationComparison of Multiple Scenarios
carbon welcoming zoneDifferent forms of plant community unitsThree scenario simulations of rectangular plant communities (with intervals parallel to the direction of gas escape), parallelogram plant communities (with intervals tilted in one direction), and fan-shaped plant communities (with intervals tilted in two directions)
Different lengths of plant community unitsThree scenario simulations of 500 m fan-shaped plant community units on the east side of a planned site with 1, 0.5, and 1.5 planning sites
Different thicknesses of plant community unitsThree scenario simulations of fan-shaped plant community units in a block length of 20 m, 40 m, and 60 m thickness
carbon flow zoneDifferent planting forms of plant community unitsScenario simulation of three planting forms: grid structure, pin-shaped structure, and natural structure
Different plant spacings of plant community units9 m × 9 m, 6 m × 6 m, 3 m × 3 m of communities with three plant spacings of 3 m
carbon shadow zoneDifferent planting angles of plant community unitsThree scenario simulations of planting units with base angles of 30°, 60°, and 75° as basic product shapes
Table 4. Daily carbon dioxide absorption by vegetation/average carbon sink rate of vegetation/vegetation information statistics table.
Amount of Green (m2)Absorb Carbon Dioxide (kg/d)Carbon Sink Rate (kg/(m2·a))Area (m2)
arbor145.52.6120.49378,900
shrub8.80.1210.9280,830
lawn7.00.1070.4178,000
Disclaimer/Publisher’s Note: The statements, opinions and data contained in all publications are solely those of the individual author(s) and contributor(s) and not of MDPI and/or the editor(s). MDPI and/or the editor(s) disclaim responsibility for any injury to people or property resulting from any ideas, methods, instructions or products referred to in the content.

