


Experimental and Statistical Analysis of Concrete Eco-Cobble Using Organic and Synthetic Fibers

 ,
, 
Abstract
:1. Introduction
1.1. Overview
1.2. Literature Review
1.2.1. Coconut Fiber in Concrete
1.2.2. Synthetic Fibers in Concrete
1.2.3. Natural Fibers and Composite Materials in Concrete
1.3. Aim of This Work and Scientific Contributions
2. Materials and Methods
2.1. Main Properties of the Materials Used
2.2. Fiber Properties and Impact
2.3. Technical Standards Used
2.4. Experimental Design
- Concrete: 90% (low) to 100% (high), with a 10% variation (∆%).
- Coconut Fiber: 0% (low) to 10% (high).
- PET Fiber: 0% (low) to 10% (high).
- ➢
- Fiber Type and Dosage: The design mixes were selected to evaluate the effects of different types and amounts of fibers on the performance of the eco-cobble. Various fiber dosages were tested, ranging from 0% to 10% for both coconut and PET fibers, to assess their influence on strength, durability, and workability. This approach allowed us to identify the optimal mix that balances mechanical performance and sustainability.
- ➢
- Comparative Analysis: The mixes were selected to provide a comparative analysis between different fiber combinations. This selection enabled a direct comparison between the effects of PET fibers (synthetic) and coconut fibers (natural) on the material’s properties, offering insights into the advantages and limitations of each fiber type.
- ➢
- Consistency in Testing: Some design mixes are repeated to ensure testing consistency and verify the reproducibility of results. Repeated testing of specific mixes helps confirm the reliability of the data and identify any variability that might occur during the experimentation process.
- ➢
- Quality Control: Repeating mixes also serves as a quality control measure to ensure that the results are robust and not affected by anomalies in the preparation or testing procedures. This repetition helps validate the experimental results and refine the conclusions drawn from the data.
- ➢
- Incremental Analysis: Repeating certain mixes with slight variations allows for a detailed comparative evaluation of how different fiber content affects the performance metrics. This point is particularly useful for analyzing the incremental impact of adding or altering fiber types in the mixture.
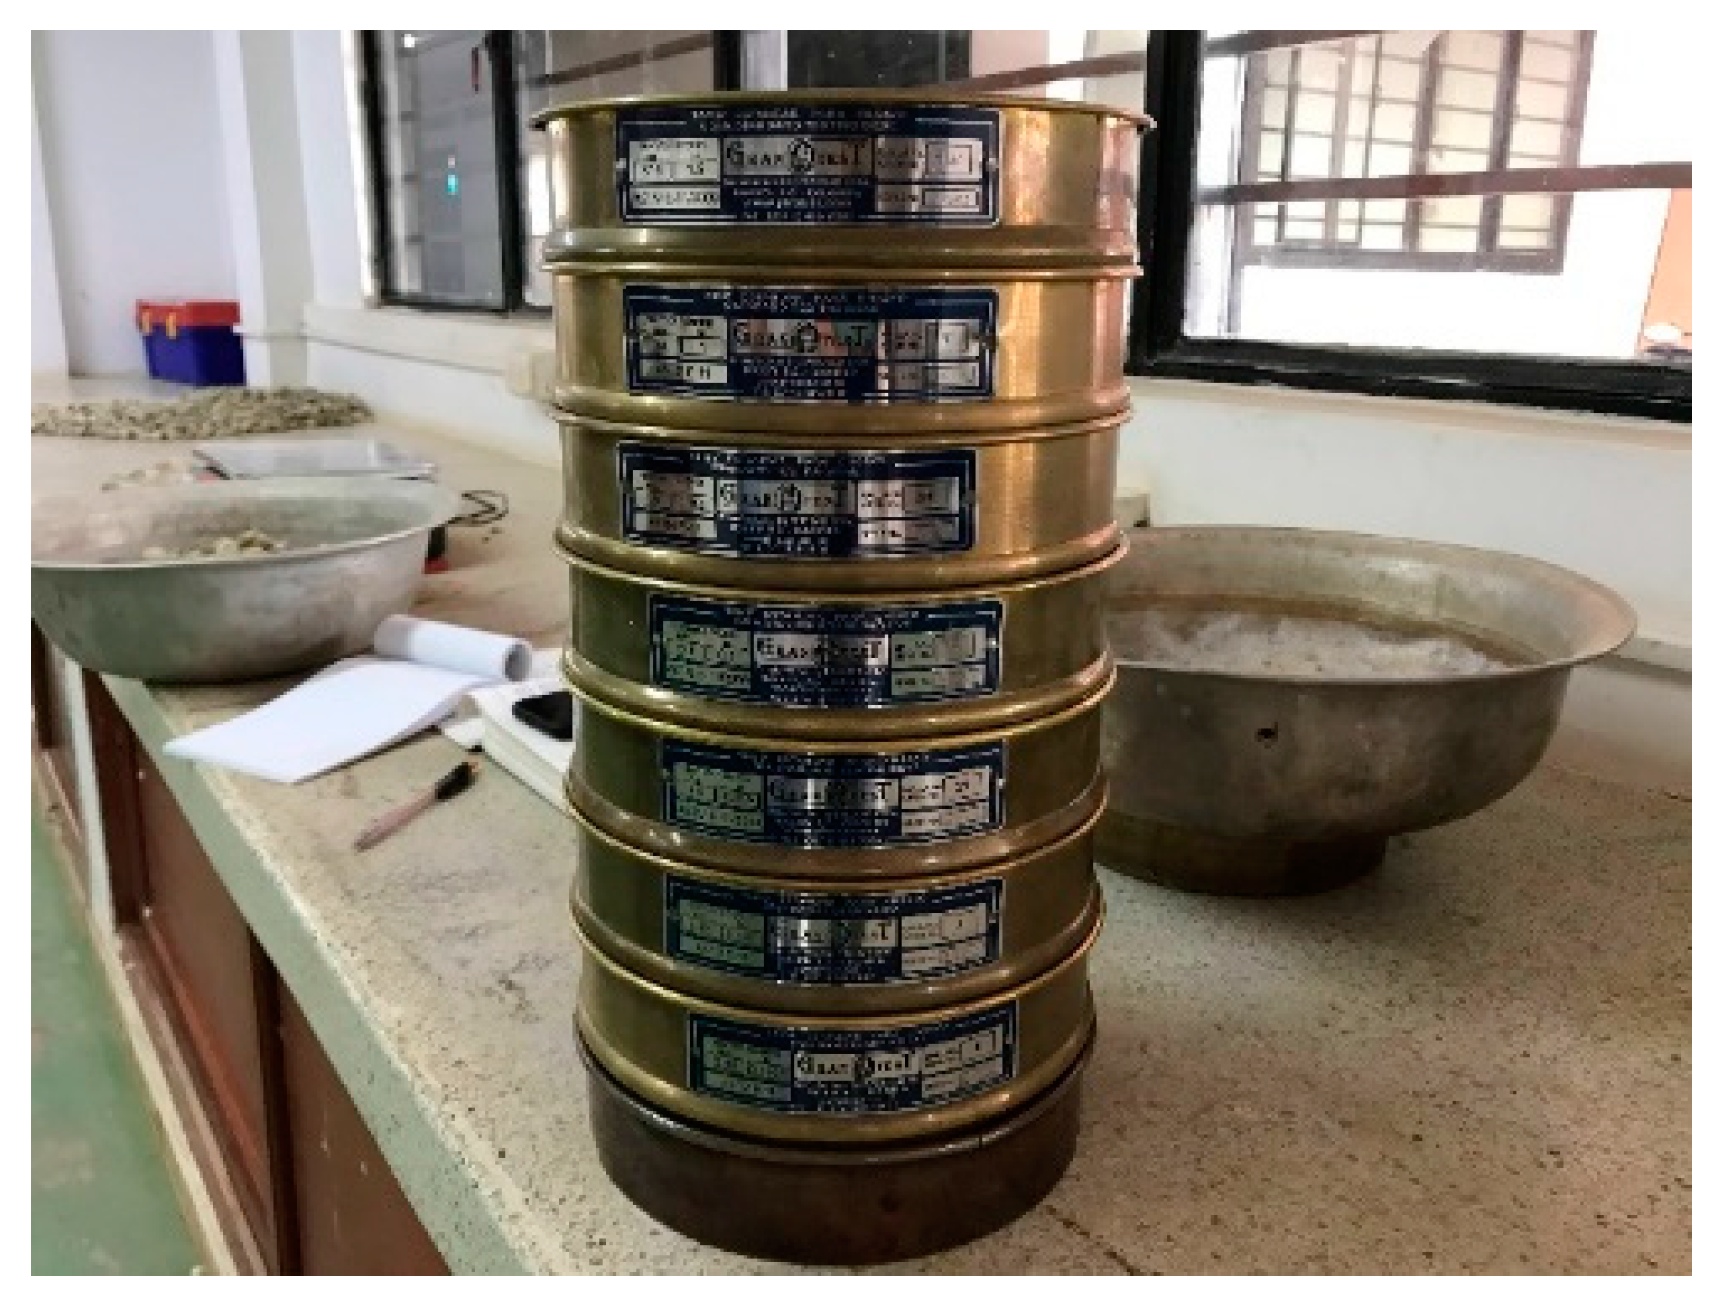
2.5. Granulometric Analysis of Coarse and Fine Aggregates (INV E-213)
- The sieves with openings of 1 ½″, 1″, 3/4″, 1/2″, 3/8″, No. 4, and bottom are used to separate the coarse aggregate.
- Then, the retained weights on each sieve are obtained, which is the amount of material in grams retained on each sieve.
- The retained percentage is calculated using Equation (1), which indicates that the retained weight of each sieve should be divided by the total weight of the sample. For the sample under study, a weight of 6010.6 gr was used. Below is the step-by-step calculation for the retained percentage for the 1 ½″ and 1″ sieves.
- The accumulated withheld percentage is the sum of the previous withheld percentages.
- The percentage that passes (% Pass) subtracts 100% minus each accumulated percentage withheld.
- The use of sieves with openings of 3/4″, 1/2″, 3/8″, No. 4, No. 8, No. 16, No. 30, No. 50, No. 100, No. 200, and background is used for fine aggregate.
- Afterward, the weight retained in each sieve is obtained. This weight is the amount of grams of material retained in each sieve.
- The percentage retained is calculated by dividing the retained weight of each sieve by the total weight of the sample, with a total weight of 1556.2 gr. Then, Equation (1) is used again.
- The accumulated withheld percentage is the sum of the previous withheld percentages.
- The percentage that passes is the subtraction of 100% minus each accumulated percentage withheld.
2.6. Cobble Development
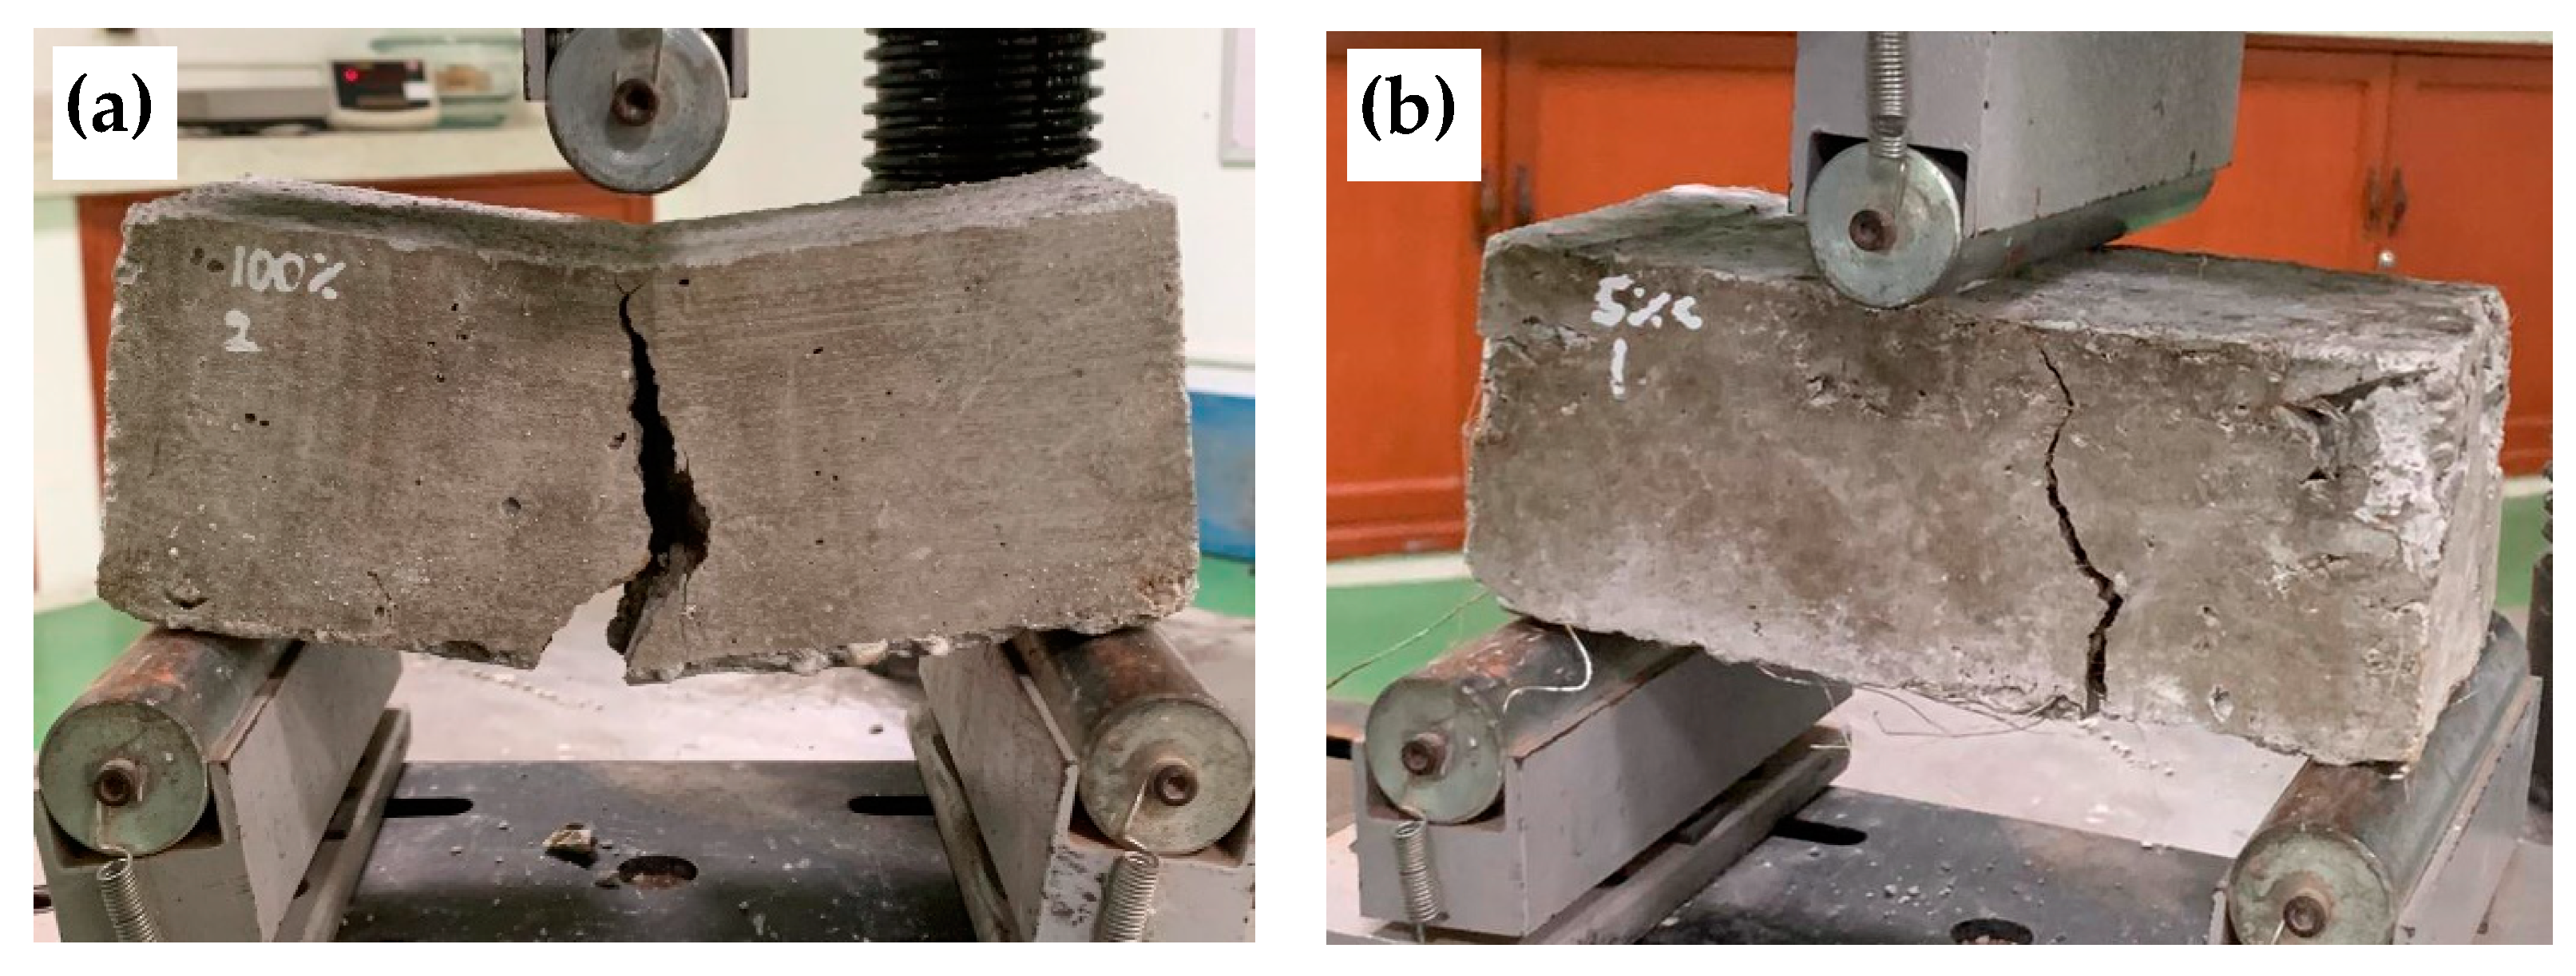
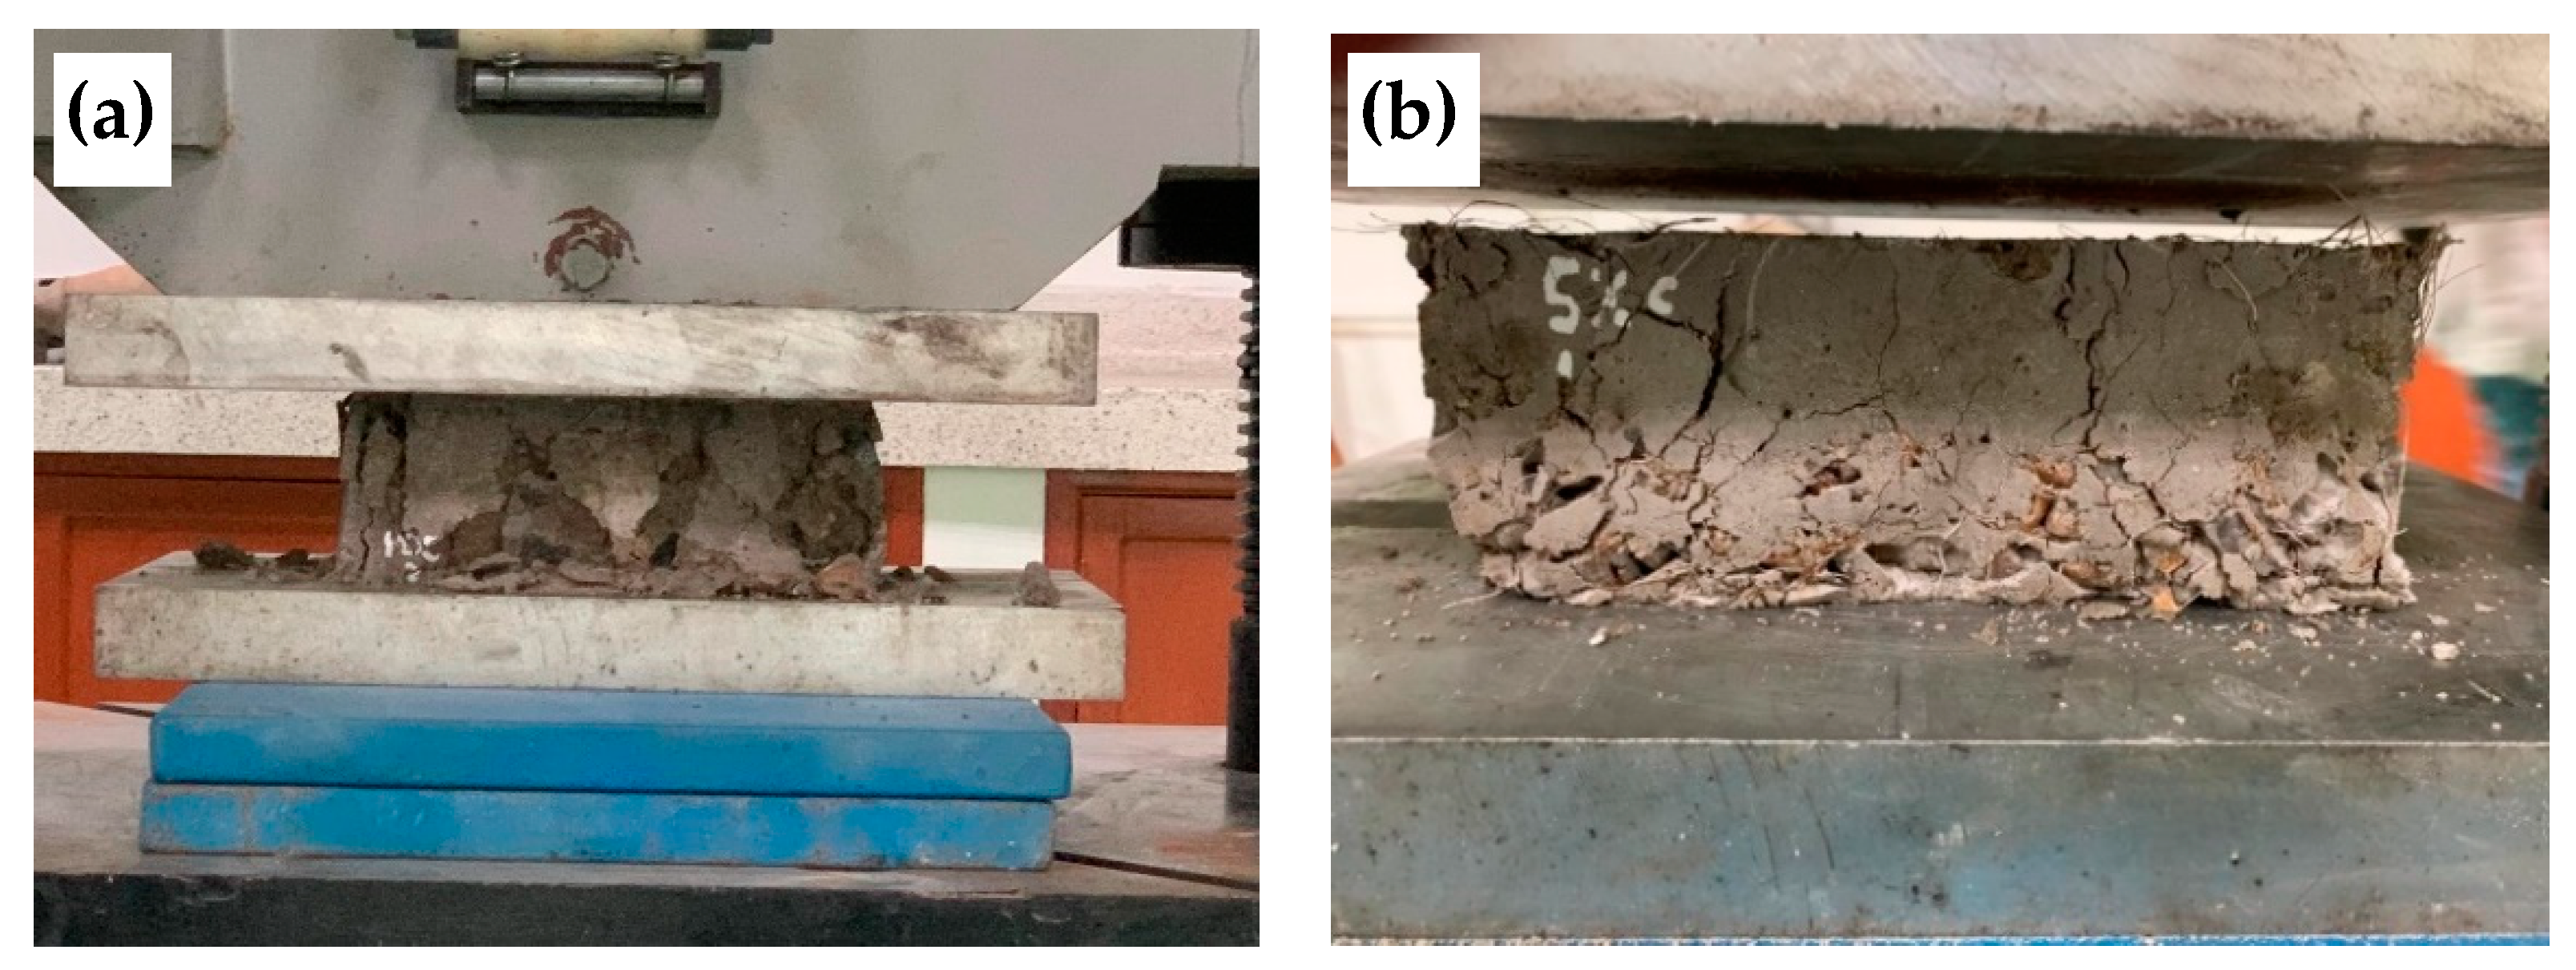
2.7. Mechanical Tests
2.8. Statistical Analysis
- ➢
- Design of Experiments: A central composite design (CCD) was used to systematically vary the levels of PET and coconut fibers in the mixtures. This design allows for the evaluation of quadratic effects and interaction effects between the variables.
- ➢
- Model Fitting: The collected data were fitted to a second-order polynomial model to create response surfaces. This model aids in visualizing how changes in fiber dosages affect the mechanical properties and in identifying optimal conditions for desired performance.
- ➢
- Optimization: RSM was used to identify the optimal combination of PET and coconut fiber dosages that maximize the desired properties (e.g., compressive strength, flexural strength) while minimizing undesirable attributes (e.g., water absorption); this analysis is based on predictive equations.
3. Results and Discussions
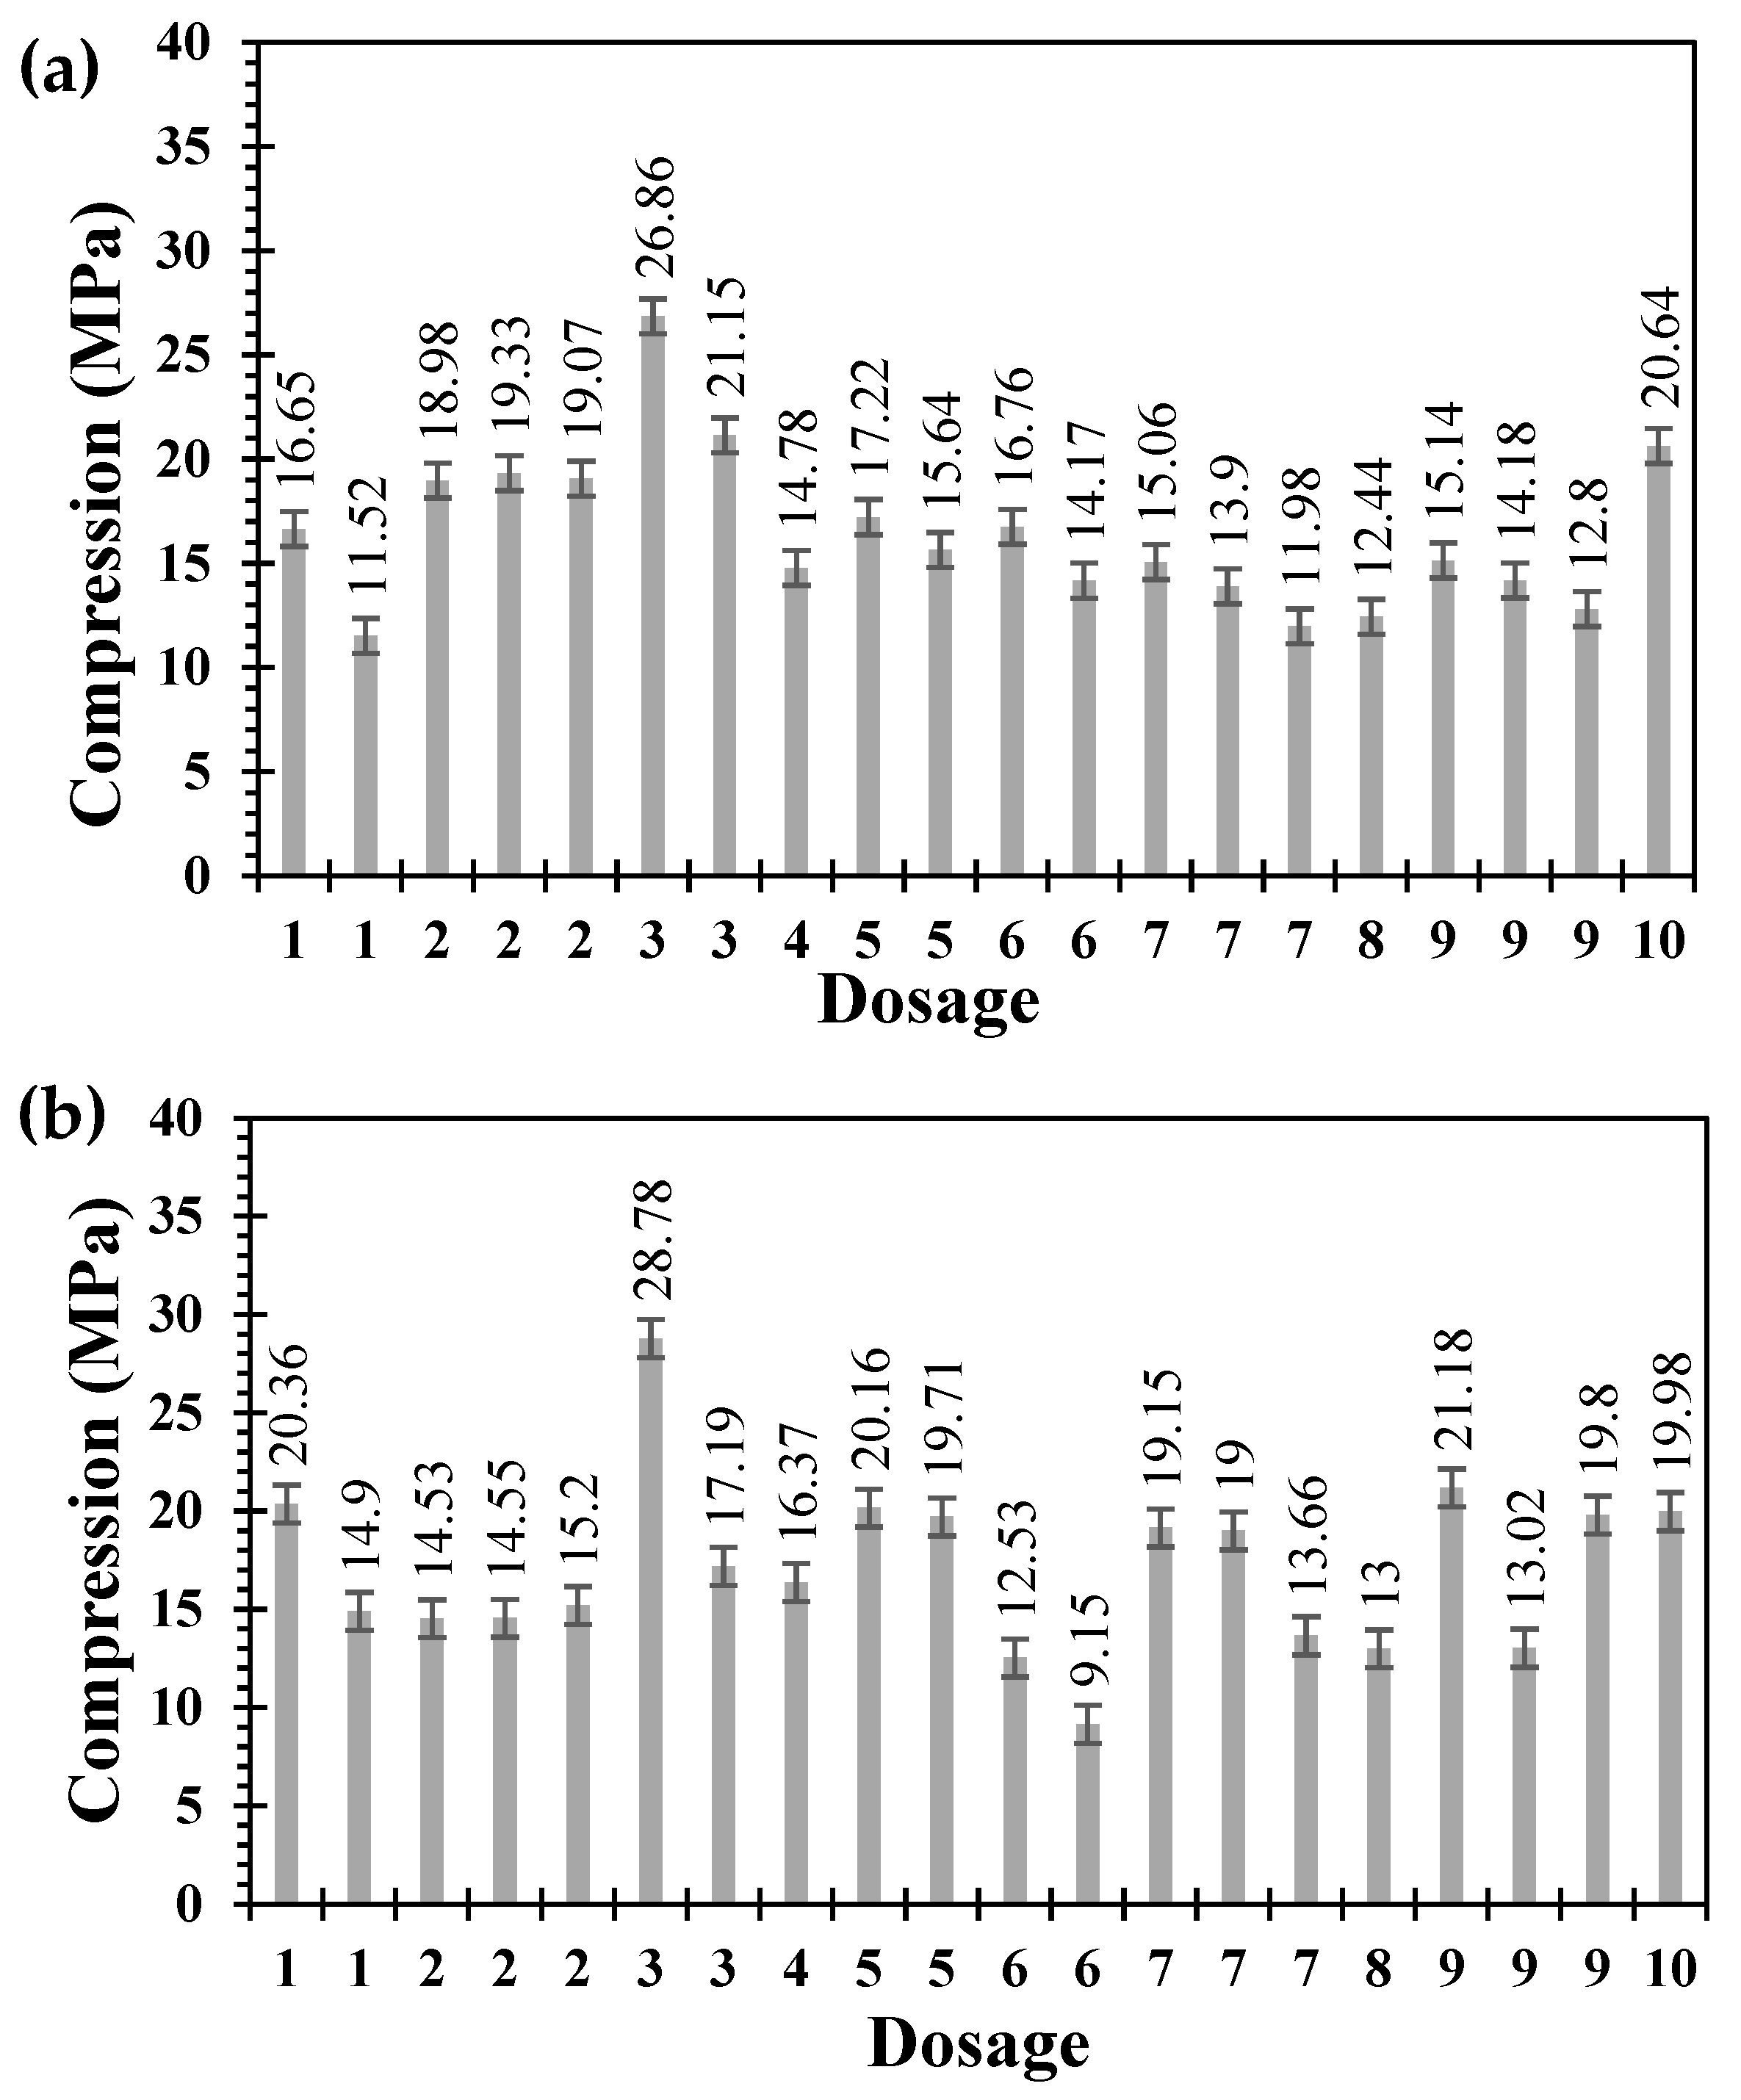
3.1. Mechanical Test Results
3.2. Statistical Analysis Results
3.2.1. ANOVA for the Analyzed Variables
3.2.2. Quadratic of Results for Model Adjustment
3.2.3. Response Surface Methodology (RSM)
Response Surface Methodology (RSM) for Compression at 14 and 28 Days
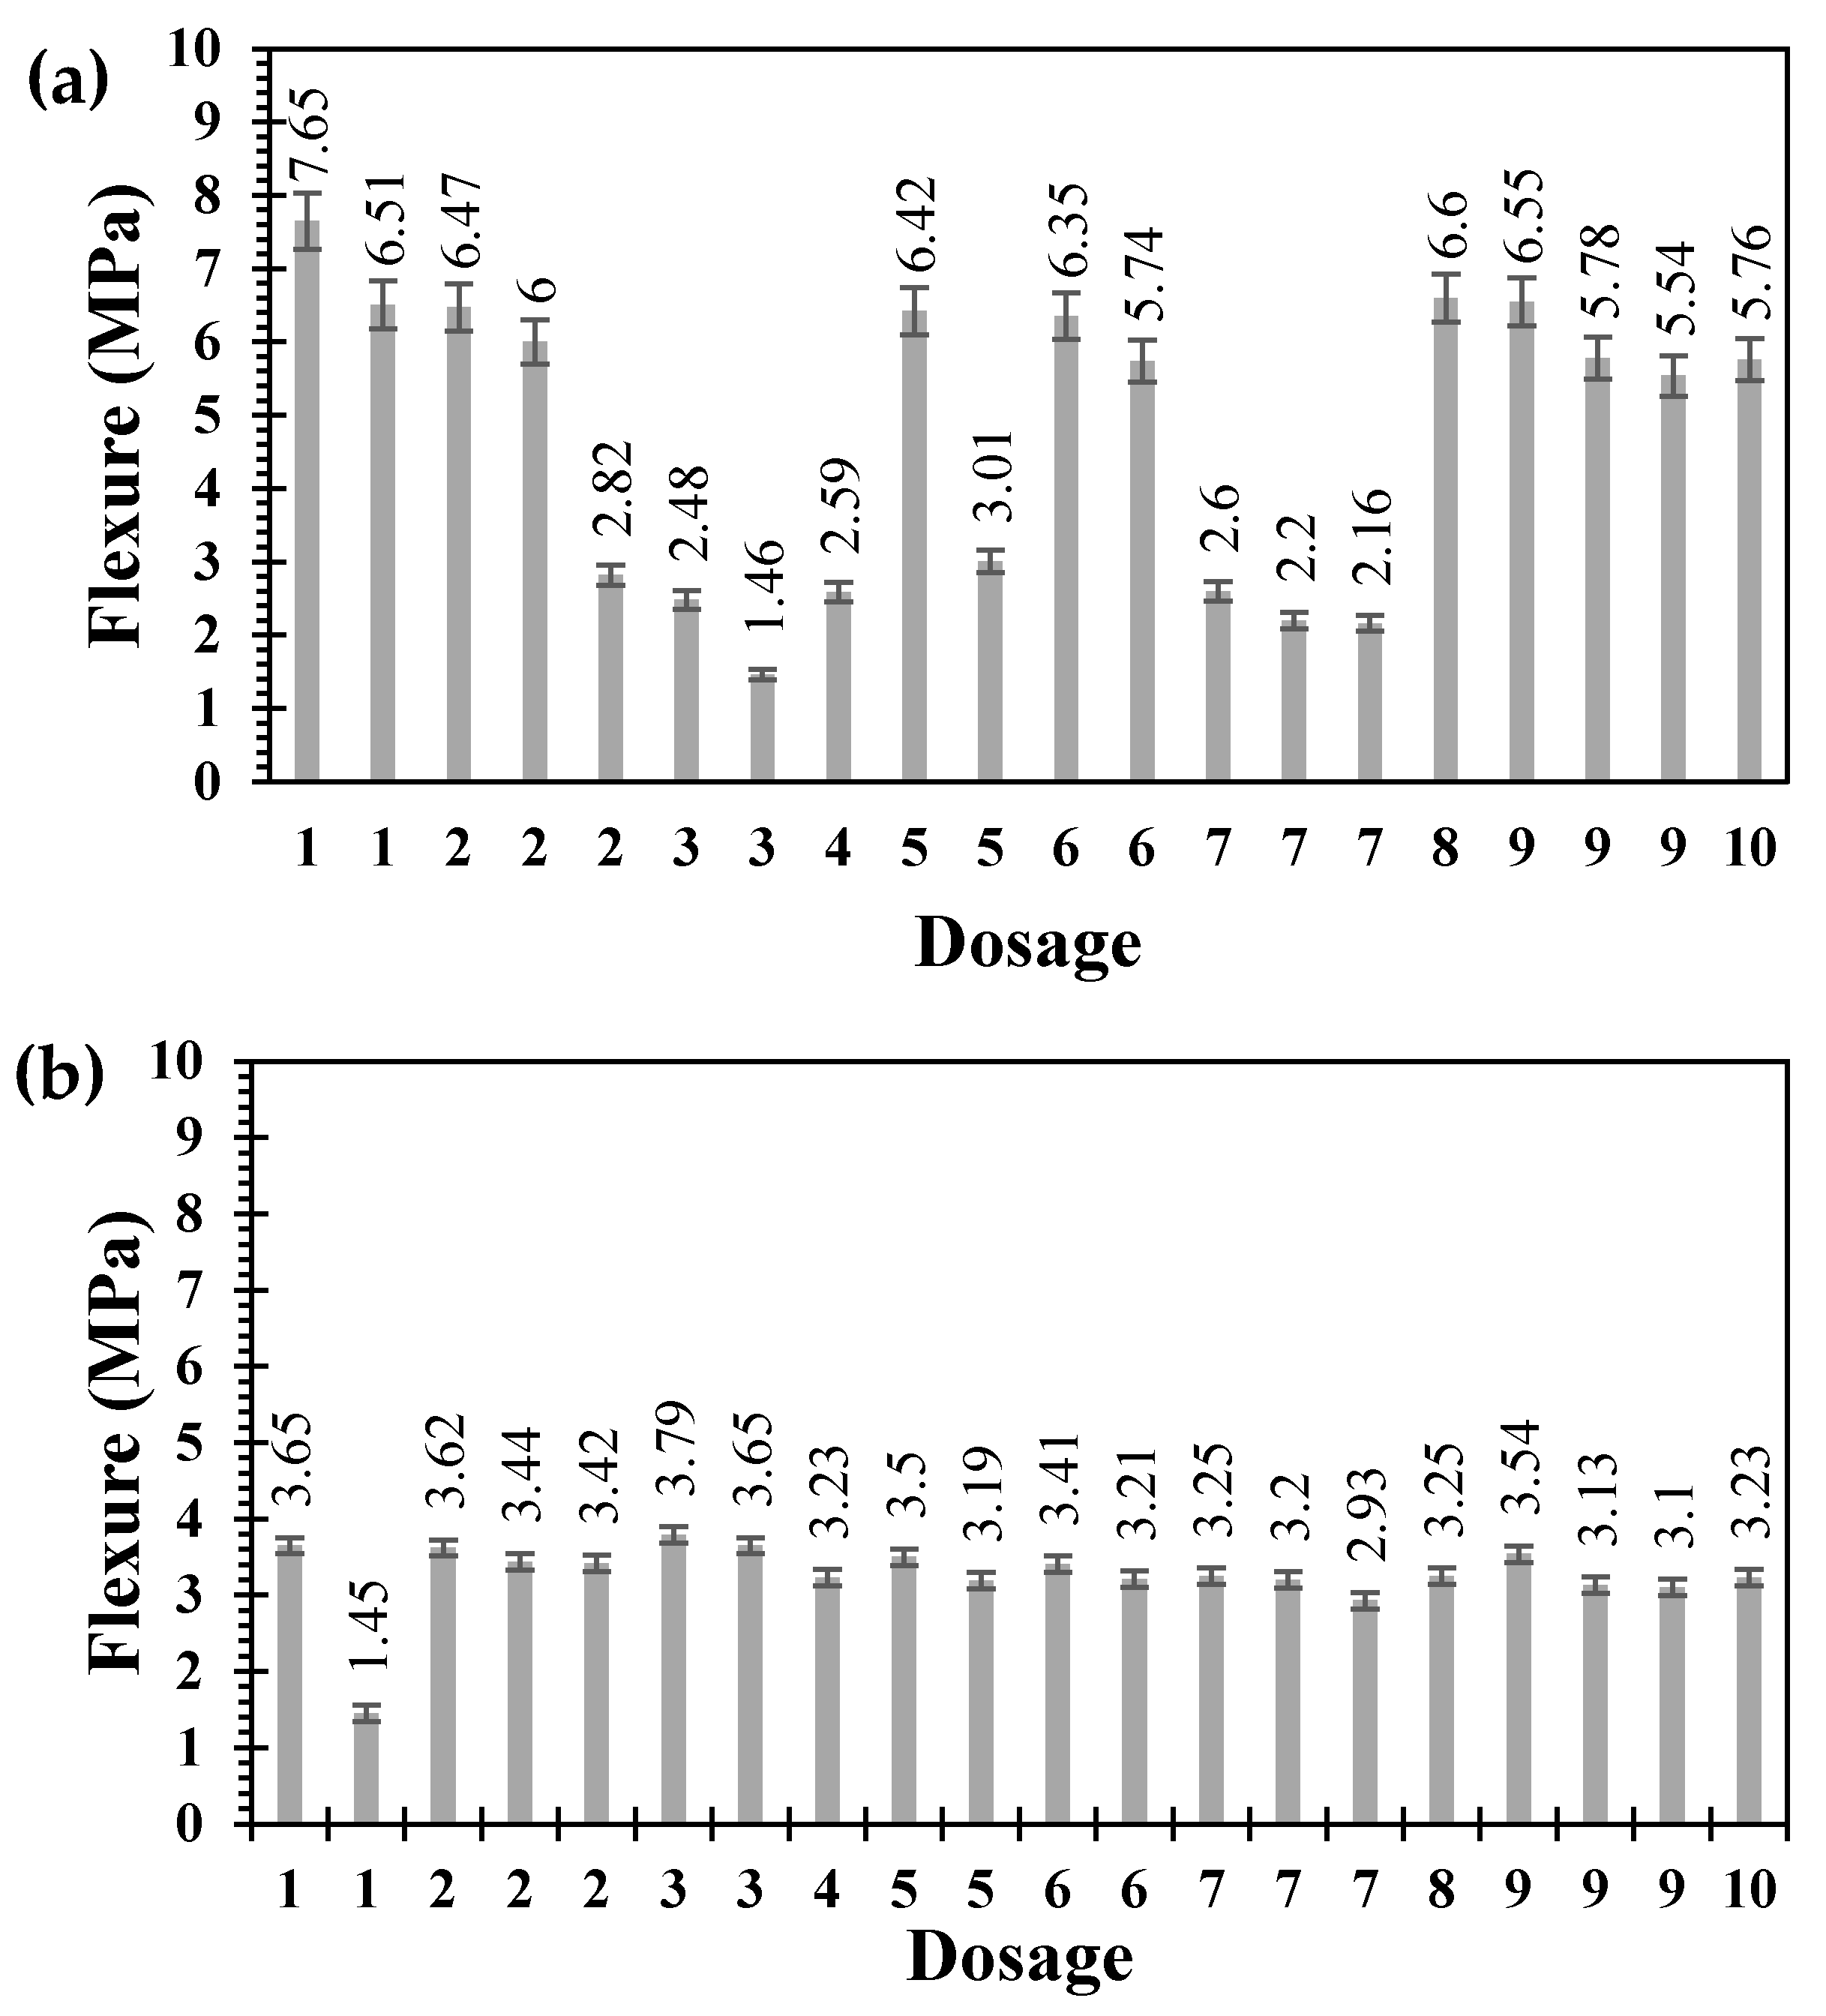
RSM for Flexure at 14 and 28 Days
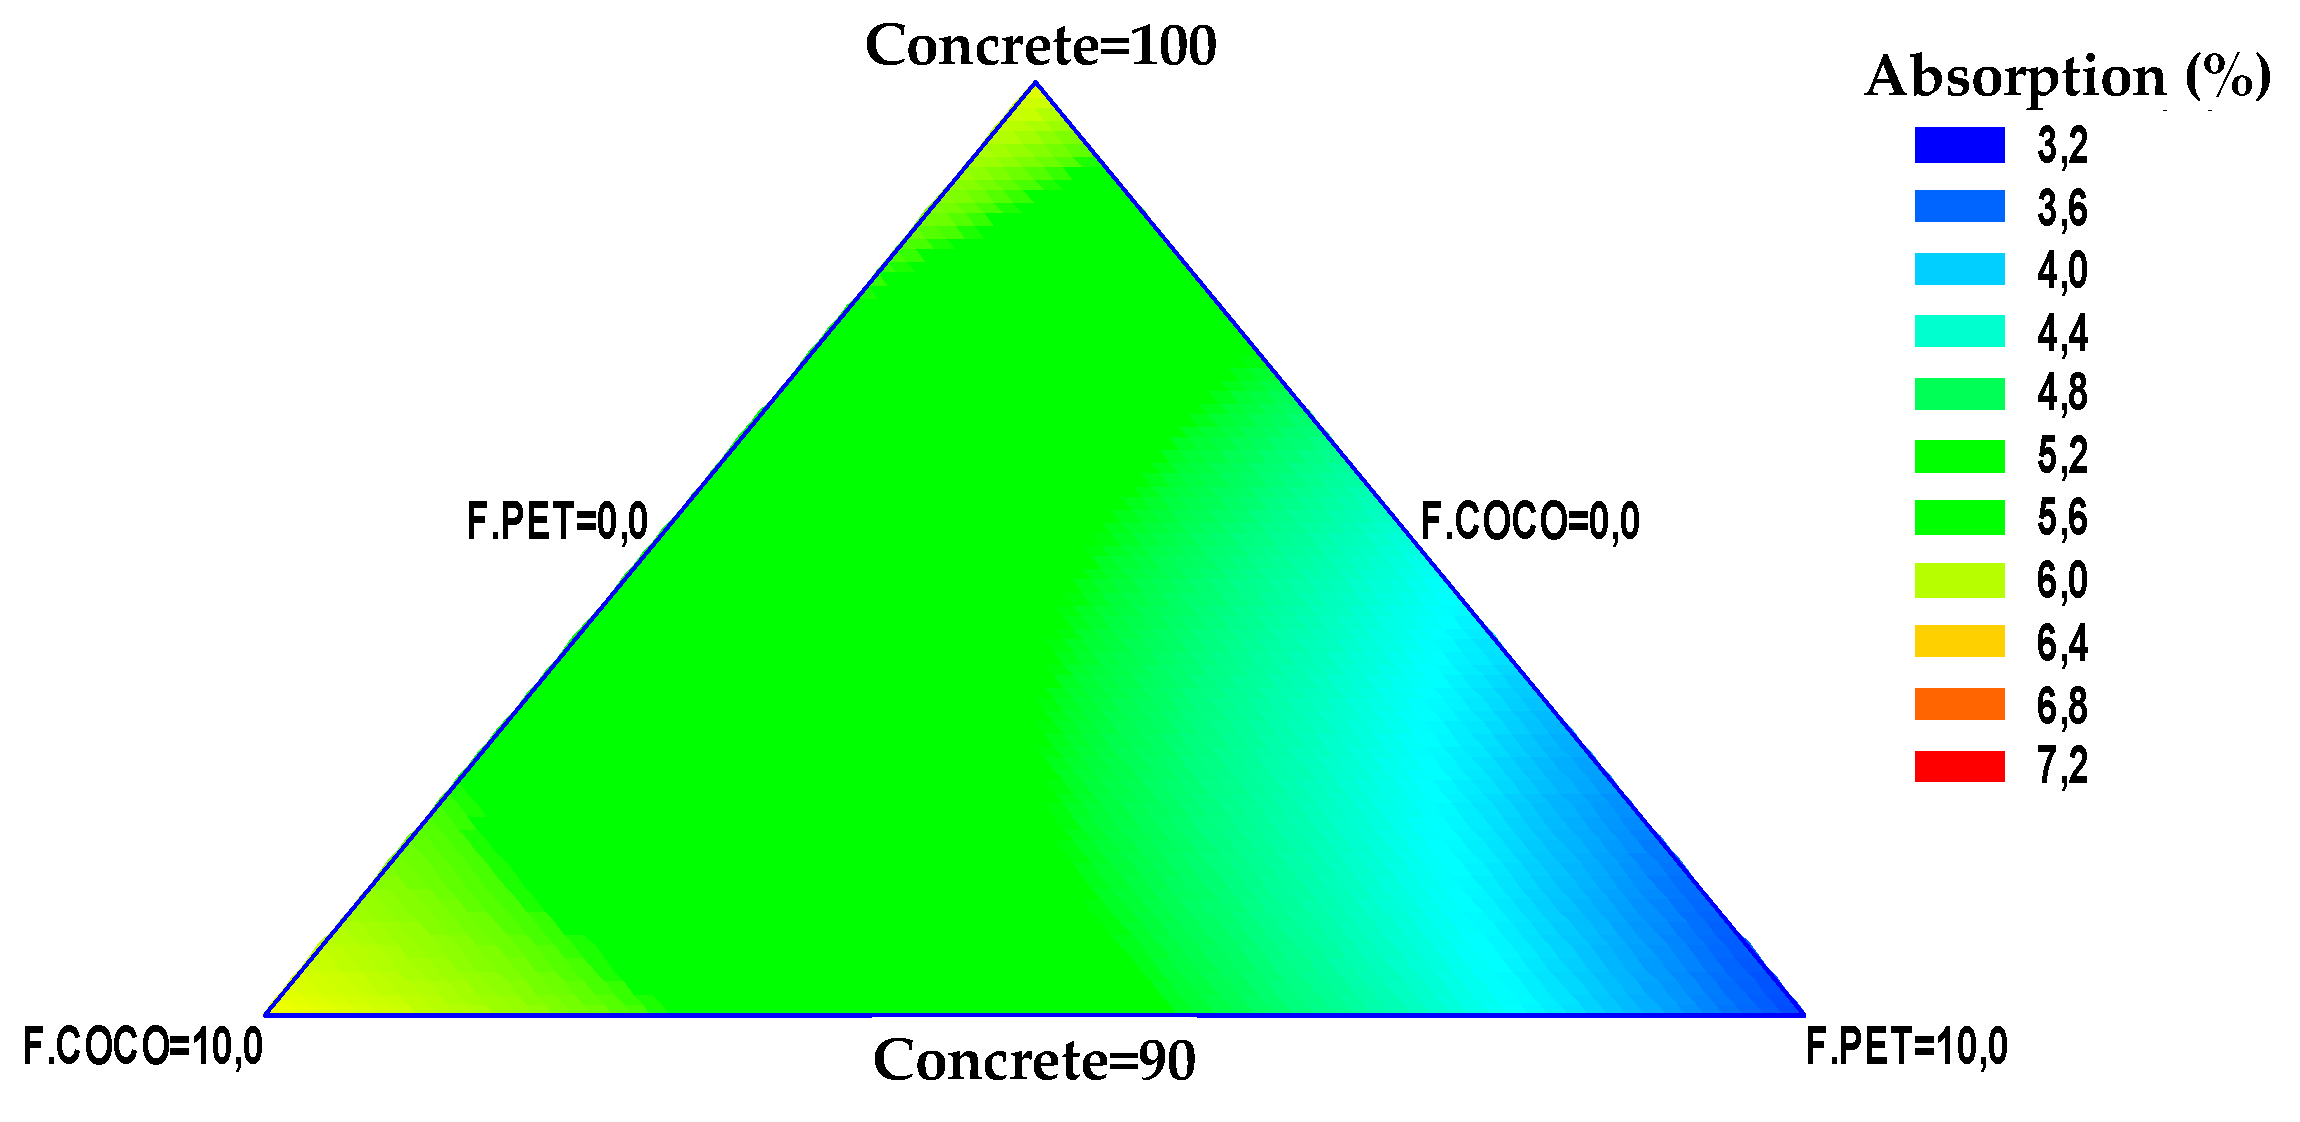
RSM for Absorption
3.3. Response Optimization According to Statgraphics
4. Conclusions
Author Contributions
Funding
Data Availability Statement
Acknowledgments
Conflicts of Interest
Symbology Lists
| PET: Polyethylene Terephthalate |
| COMP: Compressive Strength |
| CAR.MAX: Maximum Load Capacity |
| TEN: Tension/Flexure |
| E = Modulus of elasticity (MPa) |
| ν = Poisson’s ratio |
| fc′ = Compressive strength (MPa) |
| ϵ = Unit strain |
| σ = Stress (MPa) |
| τ = Shear stress (MPa) |
| G = Shear modulus (MPa) |
| ρ = Density (kg/m3) |
| ϕ = Diameter (mm) |
| d = Effective diameter (mm) |
| A = Area (mm2) |
| L = Length (mm) |
| V = Volume (mm3) |
| t = thickness (mm) |
| P = Load (N) |
| M = Bending moment (N mm) |
| Q = Shear force (N) |
| k = Thermal conductivity coefficient (W/m K) |
| Cp = Heat capacity (J/kg K) |
| α = Coefficient of thermal expansion (1/K) |
| T = Temperature (K) |
References
- Jaramillo, H.Y.; Vasco-Echeverri, O.H.; Moreno-Pacheco, L.A.; García-León, R.A. Biomaterials in Concrete for Engineering Applications: A Bibliometric Review. Infrastructures 2023, 8, 161. [Google Scholar] [CrossRef]
- Rodgers, L. La enorme fuente de emisiones de CO2 que está por todas partes y que quizás no conocías. BBC Newa 2018, 17, 12. [Google Scholar]
- Greenpeace. La Contaminacion Plástica en Colombia y el Mundo. 2018. Available online: https://www.greenpeace.org/colombia/tag/plasticos/ (accessed on 13 June 2024).
- Greenpeace. Situación Actual de Los Plásticos en Colombia y su Impacto en el Medio Ambiente. 2019. Available online: https://greenpeace.co/pdf/2019/gp_informe_plasticos_colombia_02.pdf (accessed on 13 June 2024).
- DNP Colombia Rellenos Sanitarios de 321 Municipios Colapsarán en Cinco Años, Advierte el DPN. Available online: https://2022.dnp.gov.co/Paginas/Rellenos-sanitarios-de-321-municipios-colapsar%C3%A1n-en-cinco-a%C3%B1os,-advierte-el-DNP--.aspx#:~:text=Bogot%C3%A1%20(%40DNP_Colombia).,disposici%C3%B3n%20final%20de%20residuos%20s%C3%B3lidos (accessed on 13 June 2024).
- Jiménez, C.; Augusto, Q. Situacion del Coco en Colombia. 2012. Available online: https://sioc.minagricultura.gov.co/Coco/Normatividad/2012%20Acuerdo%20de%20Competitividad%20Coco.pdf (accessed on 13 June 2024).
- Gestores de Residuos—Semana. Colombia: Encuentran Nuevos Usos a Los Desechos del Coco. 2021. Available online: https://www.semana.com/mejor-colombia/articulo/generar-ingresos-a-partir-de-la-basura-san-juan-de-uraba-encontro-la-formula-para-hacer-crecer-la-industria-del-coco-en-colombia/202100/ (accessed on 13 June 2024).
- Vila, P.; Pereyra, M.N.; Gutiérrez, Á. Resistencia a la compresión de adoquines de hormigón. Resultados tendientes a validar el ensayo en medio adoquín. Rev. ALCONPAT 2017, 7, 247–261. [Google Scholar] [CrossRef]
- Santillán, M.; Ciencia UNAM-DGDC. Concreto Reforzado con Fibras Aporta Beneficios a la Construcción. Available online: https://ciencia.unam.mx/leer/1069/concreto-reforzado-con-fibras-aporta-beneficios-a-la-construccion (accessed on 13 June 2024).
- Saucedo Rodriguez, J.A.; Atoche Zamora, J.J.; Muñoz Pérez, S.P. Uso de los agregados PET en la elaboración del concreto: Revisión de la literatura. Rev. Av. Investig. Ing. 2021, 18, 1–12. [Google Scholar] [CrossRef]
- Vidal, E.F. Aplicacion de la Estopa de coco Para Mejorar la Resistencia de Adoquines de Concreto en la Calle San Juan-Manzana W1 Distrito de Independencia 2019; Escuela Académico Profesional de Ingeniería Civil: Lima, Peru, 2019. [Google Scholar]
- Mundaca, S.; Gonzales, F. Incorporación de Fibra de Coco Para Mejorar la Permeabilidad del Adoquín en Vías Peatonales; Universidad César Vallejo: Trujillo, Peru, 2019. [Google Scholar]
- Yerramala, A.; Ramachandrudu, C. Properties of Concrete with Coconut Shells as AggregateReplacement. Int. J. Eng. Invent. 2012, 1, 21–31. [Google Scholar]
- Mayancela, J.R. Analisis Comparativo de la Resistencia a Compresiòn Entre un Adoquìn Convencional y Adoquines Preparados con Diferentes Fibras: Sintètica(polipropileno), Orgànica(estopa de coco, Inorganica(vidrio). Bachelor’s Thesis, Universidad Tecnica de Ambato, Ambato, Ecuador, 2021. Volume 593. [Google Scholar]
- Quintero Garcia, S.L.; Gonzalez Salcedo, L.O. Uso de fibra de estopa de coco para mejorar las propiedades mecanicas del concreto. Ing. Desarro. 2006, 20, 135–150. [Google Scholar]
- Yara-Amaya, F.A. Bioadoquines con Fibras de Coco y Fique, Nueva Apuesta en Construcción. Available online: https://agenciadenoticias.unal.edu.co/detalle/bioadoquines-con-fibras-de-coco-y-fique-nueva-apuesta-en-construccion (accessed on 13 June 2024).
- Krishnamoorthy, M.; Tensing, D.; Sivaraja, M.; Krishnaraja, A.R. Durability Studies on Polyethylene Terephthalate (PET) Fibre Reinforced Concrete. Int. J. Civ. Eng. Technol. 2017, 8, 634–640. [Google Scholar]
- Saikia, N.; Brito, J. De Waste polyethylene terephthalate as an aggregate in concrete. Mater. Res. 2013, 16, 341–350. [Google Scholar] [CrossRef]
- Di Marco Morales, R.O. Diseño y elaboración de un sistema de adoquines de bajo costo y material reciclado para construcciones en núcleos rurales. Rev. ESAICA 2015, 1, 30. [Google Scholar] [CrossRef]
- Ascencio, E.; Montoya, L.; Campo, J. Diseño y Elaboracion de un Prototipo de Pavimento Articulado “Adoplas” a Base de Plastico Residual Recuperado PET y PP; Universidad Coperativa de Colombia: Bogota City, Colombia, 2021; Volume 15. [Google Scholar]
- Omar, R.; León, H.A.; Ladrillos con Adicion de PET. Una Solución Amigable Para Núcleos Rurales del Municipio del Socorro. 2017. Available online: https://www.unilibre.edu.co/bogota/pdfs/2017/5sim/p/39D.pdf (accessed on 16 August 2024).
- Peñaranda, M.; Rincon, M. Analisis Comparativo del Comportamiento a Flexiòn y Compresiòn del Concreto con Adiciòn de Macro-Fibras de Plastico Reciclado; Universidad Francisco de Paula Santander: Cúcuta, Colombia, 2014. [Google Scholar]
- Florez, C. Propiedades FFisico-Quimicas del Concreto de 24 MPa con el Uso de Polietileno de Tereflalato Reciclado(botella PET) y el Concreto Convencional en la Ciudad de Cucuta; Universidad Francisco de Paula Santander: Cúcuta, Colombia, 2014. [Google Scholar]
- Tami, J.; Landinez, P. Analisis del Desempeño Mecanico y de Porosidad de una Matriz de Concreto Reforzado con Diferentes Porcentajes de Fibras de Tereftalato de Polietileno(PET) Reciclado; Universidad Francisco de Paula Santander: Cúcuta, Colombia, 2017. [Google Scholar]
- Manrique, A. Influencia de la Adiciòn de Fibra de Coco en la Fromulacion de Pastas Ceramicas y su Efecto en el Comportamiento Fisico-Mecanico y Estructural; Universidad Francisco de Paula Santander: Cúcuta, Colombia, 2017. [Google Scholar]
- Lainez, W.L.; Villacis, S.A. Hormigon Liviano con Desecho de coco Como Sustituto Parcial de agregado Grueso; Universidad Estatal Peninsula de Santa Elena: La Libertad, Ecuador, 2015. [Google Scholar]
- Ojeda, J.B. Uso del Cuesco de la Palma Africana en la Fabricación de Adoquines y Bloques de Mampostería. Energy Technol. Am. Educ. Innov. Technol. Pract. 2009, 1–10. Available online: https://www.laccei.org/LACCEI2009-Venezuela/Papers/p202.pdf (accessed on 13 June 2024).
- García-León, R.A.; Gómez-Camperos, J.A.; Jaramillo, H.Y. Scientometric Review of Trends on the Mechanical Properties of Additive Manufacturing and 3D Printing. J. Mater. Eng. Perform. 2021, 30, 4724–4734. [Google Scholar] [CrossRef]
- Giraldelli, M.A.; Alves Pereira, O.; Dos Santos, S.F.; Aguiar Brasil, M.; Teodoro Pinheiro, S.K. Propriedade da Fibra de Coco: Uma Revisão Sistemática. Uniciências 2021, 24, 34–38. [Google Scholar] [CrossRef]
- Chen, L.; Zhang, X.; Liu, G. Analysis of dynamic mechanical properties of sprayed fiber-reinforced concrete based on the energy conversion principle. Constr. Build. Mater. 2020, 254, 119167. [Google Scholar] [CrossRef]
- Abdullah, S.; Abdulwahid, M. The Effect of Adding Different Types of Natural Fibers on Mechanical Properties and Impact Resistance of Concrete. Res. J. Appl. Sci. Eng. Technol. 2015, 9, 1091–1096. [Google Scholar] [CrossRef]
- Alateah, A.H. Graphene concrete: Recent advances in production methods, performance properties, environmental impact and economic viability. Case Stud. Constr. Mater. 2023, 19, e02653. [Google Scholar] [CrossRef]
- Hamada, H.M.; Shi, J.; Al Jawahery, M.S.; Majdi, A.; Yousif, S.T.; Kaplan, G. Application of natural fibres in cement concrete: A critical review. Mater. Today Commun. 2023, 35, 105833. [Google Scholar] [CrossRef]
- INVIAS Sección 200. Man. Normas Ensayos Mater. Para Carretereas. 2013. Available online: https://www.umv.gov.co/sisgestion2019/Documentos/APOYO/GLAB/GLAB-DE-002_V1_Normas__Invia_Seccion__200-13.pdf (accessed on 29 November 2023).
- García-León, R.A.; Flórez-Solano, E.; Rodríguez-Castilla, M. Application of the procedure of the iso 50001:2011 standard for energy planning in a company ceramic sector. DYNA 2019, 86, 113. [Google Scholar] [CrossRef]
- NTC-2017; Adoquines de Concreto Para Pavimentos. Norma Técnica Colombiana: Bogotá, Colombia, 2018; pp. 1–20. Available online: https://tienda.icontec.org/gp-adoquines-de-concreto-para-pavimentos-ntc2017-2018.html (accessed on 29 November 2023).
- ACI-330R-08; Guide for the Design and Construction of Concrete Parking Lots. ACI: Indianapolis, IN, USA, 2008. Available online: https://www.concrete.org/store.aspx (accessed on 7 December 2023).
- Toirac Corral, J. Caracterización granulométrica de las plantas productoras de arena en la República Dominicana, su impacto en la calidad y costo del hormigón. Cienc. Soc. 2012, 37, 293–334. [Google Scholar] [CrossRef]
- Rincon Cardenas, W.F.; Sanchez Torres, A.A.; Garcia Leon, R.A. Análisis Bibliométrico y Experimental Sobre el Mejoramiento de las Propiedades Mecánicas del Cemento con el Uso de Aditivos; Universidad Francisco de Paula Santander Ocaña: Ocaña, Colombiaia, 2022. [Google Scholar]
- García-León, R.A.; Flórez Solano, E. Determinación de la ventana del proceso productivo en la fabricación de bloques H-10 en Ocaña Norte de Santander y la región. Ingenio UFPSO 2016, 9, 35–43. [Google Scholar] [CrossRef]
- Bencardino, F.; Mazzuca, P.; do Carmo, R.; Costa, H.; Curto, R. Cement-Based Mortars with Waste Paper Sludge-Derived Cellulose Fibers for Building Applications. Fibers 2024, 12, 13. [Google Scholar] [CrossRef]
- Minitab Explicación de las Sumas de Los Cuadrados. Available online: https://support.minitab.com/es-mx/minitab/help-and-how-to/statistical-modeling/anova/supporting-topics/anova-statistics/understanding-sums-of-squares/ (accessed on 13 June 2024).
- García-León, R.A.; Martínez-Trinidad, J.; Guevara-Morales, A.; Campos-Silva, I.; Figueroa-López, U. Wear Maps and Statistical Approach of AISI 316L Alloy under Dry Sliding Conditions. J. Mater. Eng. Perform. 2021, 30, 6175–6190. [Google Scholar] [CrossRef]
- García-León, R.A.; Martinez-Trinidad, J.; Zepeda-Bautista, R.; Campos-Silva, I.; Guevara-Morales, A.; Martínez-Londoño, J.; Barbosa-Saldaña, J. Dry sliding wear test on borided AISI 316L stainless steel under ball-on-flat configuration: A statistical analysis. Tribol. Int. 2021, 157, 106885. [Google Scholar] [CrossRef]
- Statgraphics Resumen Captura de Datos Resumen del Análisis Gráfica de Superficie. Available online: https://www.statgraphics.net/wp-content/uploads/2015/03/Centurion-XVI-Manual-Principal.pdf (accessed on 13 June 2024).
- Alfonso, O.M.L. Características y Cualidades de Los Adoquines de Concreto. 2023. Available online: https://360enconcreto.com/blog/detalle/adoquines-de-concreto/ (accessed on 1 December 2023).


| Mixture | Concrete (%) | F. Coconut (%) | F. PET (%) |
|---|---|---|---|
| 1 | 95.0 | 5.0 | 0.0 |
| 2 | 100.0 | 0.0 | 0.0 |
| 3 | 95.0 | 0.0 | 5.0 |
| 4 | 91.667 | 1.667 | 6.667 |
| 5 | 93.333 | 3.333 | 3.333 |
| 6 | 90.0 | 5.0 | 5.0 |
| 7 | 90.0 | 0.0 | 10.0 |
| 8 | 96.667 | 1.667 | 1.667 |
| 9 | 90.0 | 10.0 | 0.0 |
| 10 | 91.667 | 6.667 | 1.667 |
| 11 | 100.0 | 0.0 | 0.0 |
| 12 | 90.0 | 10.0 | 0.0 |
| 13 | 90.0 | 0.0 | 10.0 |
| 14 | 95.0 | 5.0 | 0.0 |
| 15 | 95.0 | 0.0 | 5.0 |
| 16 | 90.0 | 5.0 | 5.0 |
| 17 | 93.333 | 3.333 | 3.333 |
| 18 | 100.0 | 0.0 | 0.0 |
| 19 | 90.0 | 10.0 | 0.0 |
| 20 | 90.0 | 0.0 | 10.0 |
| Mixture | Dosage (Kg%) | Cobble Number | Test Amount | 14 Days | 28 Days |
|---|---|---|---|---|---|
| 1 | 95 + 5 + 0 | 2 | 3 | 6 | 6 |
| 2 | 100 + 0 + 0 | 3 | 3 | 9 | 9 |
| 3 | 95 + 0 + 5 | 2 | 3 | 6 | 6 |
| 4 | 91.6 + 1.6 + 6.6 | 1 | 3 | 3 | 3 |
| 5 | 93.3 + 3.3 + 3.3 | 2 | 3 | 6 | 6 |
| 6 | 90 + 5 + 5 | 2 | 3 | 6 | 6 |
| 7 | 90 + 0 + 10 | 3 | 3 | 9 | 9 |
| 8 | 96.6 + 1.6 + 1.6 | 1 | 3 | 3 | 3 |
| 9 | 90 + 10 + 0 | 3 | 3 | 9 | 9 |
| 10 | 91.6 + 6.6 + 1.6 | 1 | 3 | 3 | 3 |
| - | - | - | Total | 60 | 60 |
| Property | Equation | Equation No. | Result | |
|---|---|---|---|---|
| Fine | Coarse | |||
| Density | (2) | 1281.234 kg/m3 | ||
| Degradation resistance | (3) | 9.04% | ||
| Relative density | (4) | 1.227 | 1.4528 | |
| Apparent density | (5) | 1548.484 | 1456.653 | |
| Absorption | (6) | 17.046 | 1127 | |
| Mixture | Concrete (%) | F. Coconut (%) | F. PET (%) | Compression Resistance | Flexural Strength | Absorption (%) | ||||||
|---|---|---|---|---|---|---|---|---|---|---|---|---|
| 14 Days (MPa) | Max. Load. (Psi) | 28 Days (MPa) | Max. Load. (Psi) | 14 Days (MPa) | Max. Load. (Psi) | 28 Days (MPa) | Max. Load. (Psi) | |||||
| 1 | 95 | 5 | 0 | 16.6 | 339.7 | 14.9 | 311.5 | 7.6 | 19.9 | 1.4 | 8.1 | 5.75 |
| 2 | 100 | 0 | 0 | 19.3 | 386.5 | 14.5 | 303.9 | 2.8 | 6.9 | 3.4 | 19.8 | 6.22 |
| 3 | 95 | 0 | 5 | 26.8 | 561.7 | 17.2 | 361.1 | 2.4 | 19.9 | 3.7 | 20.7 | 4.07 |
| 4 | 92 | 2 | 7 | 14.7 | 301.5 | 16.3 | 344.0 | 2.5 | 7.0 | 3.2 | 19.0 | 4.93 |
| 5 | 93 | 3 | 3 | 17.2 | 363.6 | 19.7 | 414.1 | 3.0 | 8.4 | 3.5 | 18.2 | 4.36 |
| 6 | 90 | 5 | 5 | 14.1 | 297.7 | 9.10 | 187.6 | 6.3 | 17.0 | 3.2 | 17.5 | 5.34 |
| 7 | 90 | 0 | 10 | 15.1 | 318.0 | 19.1 | 392.7 | 2.1 | 17.7 | 2.9 | 18.4 | 3.50 |
| 8 | 97 | 2 | 2 | 12.4 | 255.0 | 13.0 | 270.5 | 6.6 | 17.1 | 3.2 | 17.8 | 5.73 |
| 9 | 90 | 10 | 0 | 15.1 | 310.3 | 19.8 | 414.0 | 6.5 | 17.3 | 3.5 | 18.0 | 6.05 |
| 10 | 92 | 7 | 2 | 20.6 | 412.7 | 19.9 | 415.8 | 5.7 | 15.4 | 3.2 | 19.0 | 5.65 |
| 11 | 100 | 0 | 0 | 18.9 | 379.5 | 14.5 | 307.1 | 6.4 | 16.1 | 3.4 | 18.8 | 5.90 |
| 12 | 90 | 10 | 0 | 14.1 | 295.0 | 21.1 | 442.9 | 5.7 | 15.4 | 3.1 | 17.1 | 6.25 |
| 13 | 90 | 0 | 10 | 11.9 | 249.2 | 19.0 | 389.5 | 2.2 | 17.4 | 3.2 | 19.0 | 3.28 |
| 14 | 95 | 5 | 0 | 11.5 | 235.0 | 20.3 | 423.7 | 6.5 | 17.6 | 3.6 | 21.0 | 5.54 |
| 15 | 95 | 0 | 5 | 21.1 | 440.1 | 28.7 | 598.9 | 1.4 | 12.0 | 3.6 | 21.0 | 4.39 |
| 16 | 90 | 5 | 5 | 16.7 | 348.8 | 12.5 | 267.2 | 5.7 | 17.4 | 3.4 | 19.6 | 5.06 |
| 17 | 93 | 3 | 3 | 15.6 | 327.0 | 20.1 | 413.4 | 6.4 | 18.6 | 3.1 | 17.5 | 4.68 |
| 18 | 100 | 0 | 0 | 19.0 | 391.0 | 15.2 | 316.3 | 6.0 | 14.8 | 3.6 | 20.2 | 6.06 |
| 19 | 90 | 10 | 0 | 12.8 | 259.8 | 13.0 | 273.5 | 5.5 | 16.3 | 3.1 | 19.4 | 6.15 |
| 20 | 90 | 0 | 10 | 13.9 | 284.9 | 13.6 | 280.0 | 2.6 | 20.1 | 3.2 | 18.5 | 3.39 |
| Test | Source | Sum of Squares | Gl | Middle Square | F-Ratio | p-Value | |
|---|---|---|---|---|---|---|---|
| COMPRESSION (MPa) | 14 days | Half | 5388.06 | 1 | 5388.06 | - | - |
| Linear | 54.64 | 2 | 27.32 | 2.18 | 0.1438 | ||
| Quadratic | 83.21 | 3 | 27.73 | 2.99 | 0.0672 | ||
| Special Cubic | 8.31 | 1 | 8.31 | 0.89 | 0.3634 | ||
| Error | 121.74 | 13 | 9.36 | - | - | ||
| Total | 5655.97 | 20 | - | - | - | ||
| 28 days | Half | 5855.73 | 1 | 5855.73 | - | - | |
| Linear | 0.78 | 2 | 0.39 | 0.02 | 0.9813 | ||
| Quadratic | 149.62 | 3 | 49.87 | 3.42 | 0.0471 | ||
| Special Cubic | 4.68 | 1 | 4.68 | 0.30 | 0.5902 | ||
| Error | 199.65 | 13 | 15.36 | - | - | ||
| Total | 6210.47 | 20 | - | - | - | ||
| FLEXURE (MPa) | 14 days | Half | 448.31 | 1 | 448.31 | - | - |
| Linear | 42.49 | 2 | 21.24 | 10.48 | 0.0011 | ||
| Quadratic | 14.18 | 3 | 4.73 | 3.27 | 0.0532 | ||
| Special Cubic | 0.24 | 1 | 0.25 | 0.16 | 0.6935 | ||
| Error | 20.01 | 13 | 1.54 | - | - | ||
| Total | 525.25 | 20 | - | - | - | ||
| 28 days | Half | 199.27 | 1 | 199.27 | - | - | |
| Linear | 0.44 | 2 | 0.22 | 0.60 | 0.5616 | ||
| Quadratic | 5.21 | 3 | 1.74 | 21.45 | 0.0000 | ||
| Special Cubic | 0.60 | 1 | 0.60 | 14.70 | 0.0021 | ||
| Error | 0.53 | 13 | 0.04 | - | - | ||
| Total | 206.06 | 20 | - | - | - | ||
| ABSORPTION (%) | Half | 523.26 | 1 | 523.26 | - | ||
| Linear | 16.08 | 2 | 8.04 | 53.76 | 0.0000 | ||
| Quadratic | 1.17 | 3 | 0.39 | 4.00 | 0.0298 | ||
| Special Cubic | 0.05 | 1 | 0.05 | 0.57 | 0.4648 | ||
| Error | 1.31 | 13 | 0.10 | - | - | ||
| Total | 541.89 | 20 | - | - | - | ||
| Test | Source | Sum of Squares | Gl | Middle Square | F-Ratio | p-Value | |
|---|---|---|---|---|---|---|---|
| COMPRESSION (MPa) | 14 | Quadratic Model | 137.85 | 5 | 27.57 | 2.97 | 0.0495 |
| Total error | 130.05 | 14 | 9.28 | - | - | ||
| Total (corr.) | 267.91 | 19 | - | - | - | ||
| 28 | Quadratic Model | 150.41 | 5 | 30.08 | 2.06 | 0.1316 | |
| Total error | 204.33 | 14 | 14.59 | - | - | ||
| Total (corr.) | 354.74 | 19 | - | - | - | ||
| FLEXURE (MPa) | 14 | Quadratic Model | 56.68 | 5 | 11.33 | 7.830 | 0.0011 |
| Total error | 20.26 | 14 | 1.44 | - | - | ||
| Total (corr.) | 76.94 | 19 | - | - | - | ||
| 28 | Quadratic Model | 5.65 | 5 | 1.13 | 13.97 | 0.0001 | |
| Total error | 1.13 | 14 | 0.08 | - | - | ||
| Total (corr.) | 6.79 | 19 | - | - | - | ||
| ABSORPTION (%) | Quadratic Model | 17.25 | 5 | 3.45 | 35.31 | 0.0000 | |
| Total error | 1.36 | 14 | 0.09 | - | - | ||
| Total (corr.) | 18.62 | 19 | - | - | - | ||
| Test | Parameter | Error | Statistics | |||
|---|---|---|---|---|---|---|
| Estimated | Standard | T | p-Value | |||
| COMPRESSION | 14 days | A | 18.63 | 1.73 | - | - |
| B | 14.84 | 1.73 | - | - | ||
| C | 13.53 | 1.73 | - | - | ||
| AB | −13.18 | 9.08 | −1.45 | 0.1687 | ||
| AC | 23.60 | 9.08 | 2.59 | 0.0210 | ||
| BC | 4.80 | 9.08 | 0.52 | 0.6054 | ||
| 28 days | A | 14.10 | 2.17 | - | - | |
| B | 18.35 | 2.17 | - | - | ||
| C | 17.10 | 2.17 | - | - | ||
| AB | 7.17 | 11.38 | 0.63 | 0.5387 | ||
| AC | 27.96 | 11.38 | 2.45 | 0.0277 | ||
| BC | −23.05 | 11.38 | −2.02 | 0.0624 | ||
| FLEXURE | 14 days | A | 5.29 | 0.68 | - | - |
| B | 5.90 | 0.68 | - | - | ||
| C | 2.24 | 0.68 | - | - | ||
| AB | 6.04 | 3.58 | 1.68 | 0.1139 | ||
| AC | −7.22 | 3.58 | −2.01 | 0.0636 | ||
| BC | 6.34 | 3.58 | 1.76 | 0.0985 | ||
| 28 days | A | 3.47 | 0.16 | - | - | |
| B | 3.26 | 0.16 | - | - | ||
| C | 3.06 | 0.16 | - | - | ||
| AB | −6.25 | 0.84 | −7.36 | 0.0000 | ||
| AC | 2.52 | 0.84 | 2.97 | 0.0100 | ||
| BC | 1.43 | 0.84 | 1.69 | 0.1119 | ||
| ABSORPTION | A | 6.09 | 0.17 | - | - | |
| B | 6.14 | 0.17 | - | - | ||
| C | 3.45 | 0.17 | - | - | ||
| AB | −2.07 | 0.93 | −2.22 | 0.0432 | ||
| AC | −1.93 | 0.93 | −2.07 | 0.0564 | ||
| BC | 1.58 | 0.93 | 1.70 | 0.1110 | ||
| Statistic | COMPRESSION (MPa) | FLEXURE (MPa) | ABSORPTION (%) | ||
|---|---|---|---|---|---|
| 14 | 28 | 14 | 28 | ||
| R2 (%) | 51.45 | 42.39 | 73.66 | 83.30 | 92.65 |
| R2 (adjusted by G.l.)% | 34.11 | 21.82 | 64.26 | 77.33 | 90.03 |
| Standard Error | 3.04 | 3.82 | 1.20 | 0.28 | 0.31 |
| MAE | 1.87 | 2.69 | 0.77 | 0.20 | 0.18 |
| Durbin-Watson Statistic | 1.63 | 2.01 | 1.23 | 2.29 | 2.31 |
| p = 0.2131 | p = 0.5151 | p = 0.0434 | p = 0.7395 | p = 0.7501 | |
| Days | Compression (MPa) | Max. Load (MPa) |
|---|---|---|
| 14 |  | 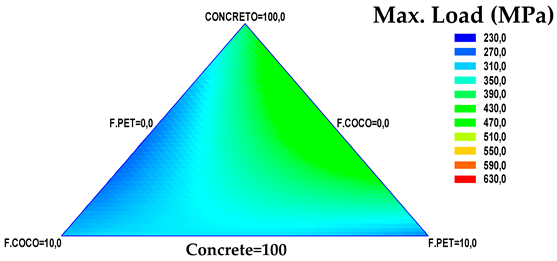 |
| 28 |  | 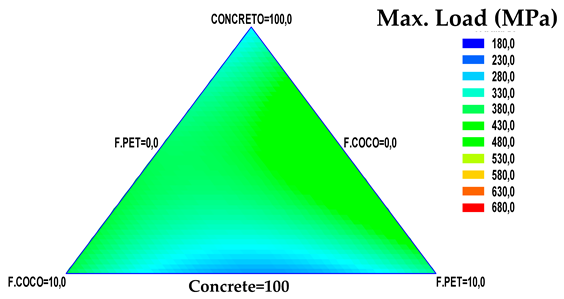 |
| Days | Compression (MPa) | Max. Load (MPa) |
|---|---|---|
| 14 |  | 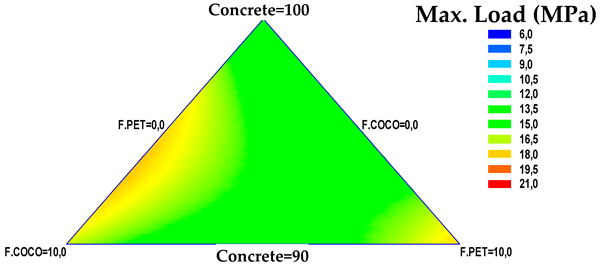 |
| 28 |  | 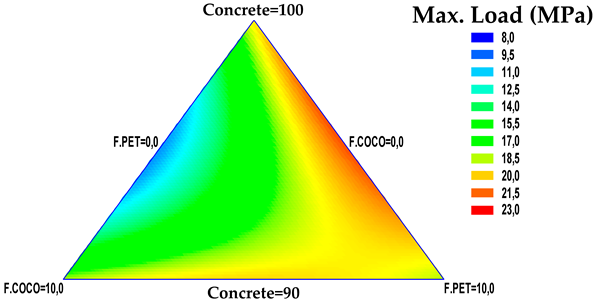 |
| Test | Concrete (%) | F. Coconut (%) | F. PET (%) |
|---|---|---|---|
| Compression 14 days | 96.08 | 1.8 × 10⁻⁸ | 3.92 |
| Compression 28 days | 94.46 | 5.53 × 10⁻⁹ | 5.55 |
| Flexure 14 days | 94.49 | 5.50 | 3.51 × 10⁻⁹ |
| Flexure 28 days | 95.82 | 1.96 × 10⁻⁹ | 4.17 |
| FLEXURE (MPa) | 14 | 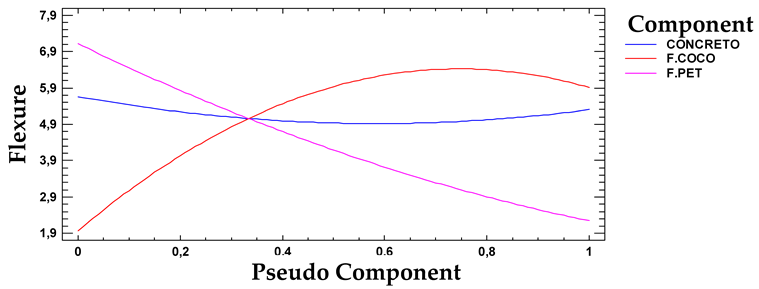 |
| 28 | 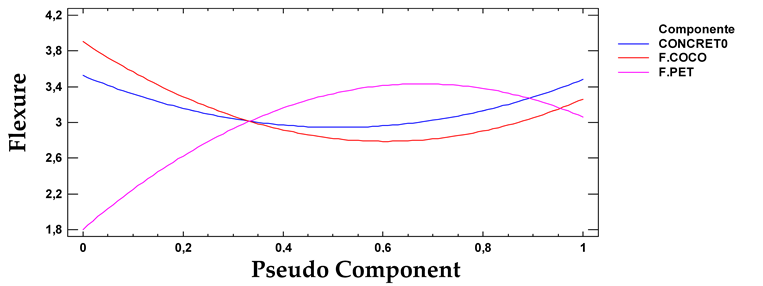 | |
| COMPRESSION (MPa) | 14 |  |
| 28 | 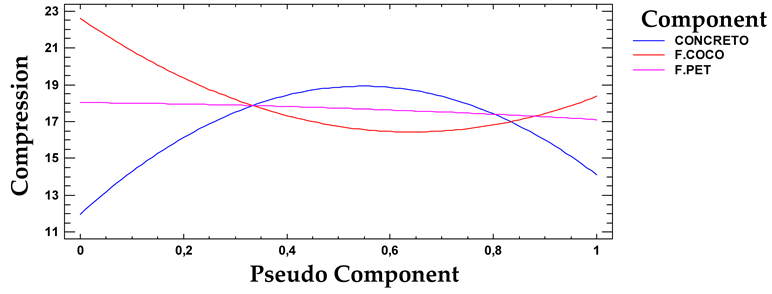 | |
| ABSORPTION (%) | 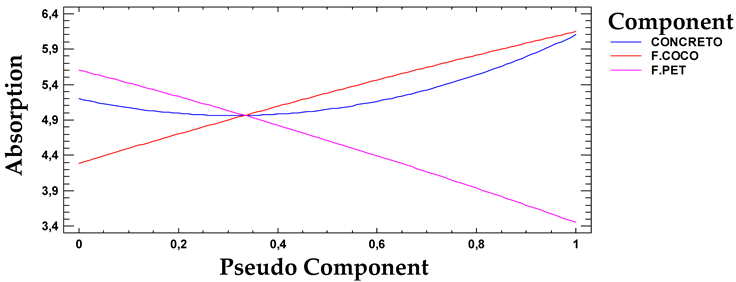 | |
Disclaimer/Publisher’s Note: The statements, opinions and data contained in all publications are solely those of the individual author(s) and contributor(s) and not of MDPI and/or the editor(s). MDPI and/or the editor(s) disclaim responsibility for any injury to people or property resulting from any ideas, methods, instructions or products referred to in the content. |
© 2024 by the authors. Licensee MDPI, Basel, Switzerland. This article is an open access article distributed under the terms and conditions of the Creative Commons Attribution (CC BY) license (https://creativecommons.org/licenses/by/4.0/).
Share and Cite
García-León, R.A.; Trigos-Caceres, J.; Castilla-Quintero, N.; Afanador-García, N.; Gómez-Camperos, J. Experimental and Statistical Analysis of Concrete Eco-Cobble Using Organic and Synthetic Fibers. Processes 2024, 12, 1936. https://doi.org/10.3390/pr12091936
García-León RA, Trigos-Caceres J, Castilla-Quintero N, Afanador-García N, Gómez-Camperos J. Experimental and Statistical Analysis of Concrete Eco-Cobble Using Organic and Synthetic Fibers. Processes. 2024; 12(9):1936. https://doi.org/10.3390/pr12091936
Chicago/Turabian StyleGarcía-León, Ricardo Andrés, Jorge Trigos-Caceres, Natalia Castilla-Quintero, Nelson Afanador-García, and July Gómez-Camperos. 2024. "Experimental and Statistical Analysis of Concrete Eco-Cobble Using Organic and Synthetic Fibers" Processes 12, no. 9: 1936. https://doi.org/10.3390/pr12091936