Article

Research on Erosion Damage Laws and Structural Optimization of Bypass Valve for Positive Displacement Motors

1
Shenhua Geological Exploration Co., Ltd., Beijing 100089, China
2
College of Engineering and Technology, China University of Geosciences (Beijing), Beijing 100083, China
3
Hydrology and Water Resources Center of Inner Mongolia Autonomous Region, Hohhot 010010, China
*
Authors to whom correspondence should be addressed.
Processes 2024, 12(9), 1953; https://doi.org/10.3390/pr12091953
Submission received: 22 July 2024 / Revised: 30 August 2024 / Accepted: 9 September 2024 / Published: 11 September 2024
(This article belongs to the Special Issue Oil and Gas Drilling Processes: Control and Optimization)

Abstract

:
The bypass valve of a positive displacement motor is a key component for regulating the bottom hole pressure and ensuring the normal circulation of drilling fluid during the drilling process. Severe erosion damage to the bypass valve significantly affects the service life of the positive displacement motor, yet there is currently a lack of related research. In this research, the flow characteristics of drilling fluid inside the valve core were analyzed through flow field simulation, and the main factors influencing erosion damage to the valve core were investigated. The results indicate that the side holes and flow channel structure of the valve core are the main causes of erosion. Based on this, two optimization schemes are proposed, namely, reducing the number of bypass side holes to 4 and optimizing the flow channel cone angle to 45°. The simulation results show that the erosion rate of the optimized valve core is significantly reduced, and the service life is effectively improved. Finally, a valve core life prediction model is established using a back propagation (BP) neural network to evaluate the optimization effect. The results show that the applicable flow range and maximum service life of the optimized valve core are increased by approximately 60% and 75.4%, respectively, validating the effectiveness of the optimization scheme.

1. Introduction

Geological drilling is a technique that utilizes specialized tools to drill holes from the surface of the earth downwards and retrieve core samples from within the boreholes [1,2]. Nearly 70% of the Earth’s surface is covered by oceans, which harbor abundant oil and gas resources [3], mineral resources [4], and biological resources [5]. Employing marine geological drilling techniques to drill the seabed and obtain high-quality seabed core samples is a crucial technological approach for realizing the exploration and development of marine resources [6,7].
Positive displacement motors are essential equipment in marine drilling. Their operating principle resembles that of a hydraulic motor, where they rotate under the scouring action of drilling fluid within the borehole, thereby breaking down rock layers and drilling deeper into the Earth. Relevant scholars have carried out research on screw drilling tools, mainly focusing on the optimization of drilling technology and the improvement of service life. For the performance optimization of screw drilling tools, the research results mainly include impedance modeling optimization [8], drilling tool parameter optimization [9], and new drilling tool modeling and design [10,11]. In terms of positive displacement motor drilling processes, related achievements concentrate on increasing drilling speed in hard-to-drill formations [12], shallow soft formations [13], and abrasive formations [14], configuring and optimizing positive displacement motor parameters to reduce axial vibration [15,16], stick–slip vibration [17] impact on drilling processes, and some researchers have optimized the power configuration of small screw drilling tools for perforation [18] to enhance positive displacement motor performance.
In terms of improving the service life of screw drilling tools, the relevant research results have been studied from the failure analysis and optimization of drive shaft threads [19,20,21,22], stator and rotor coordination [23,24], rubber shock absorption [25], the use of thick-walled rubber stators [26], bearing wear analysis and optimization [27,28], powertrain failure analysis [29], the establishment of a mechanical specific energy model [30], and unconventional formation practice [31]. The service life of screw drilling tools has been greatly improved. In addition, some scholars have used measurement and prediction methods to optimize the life of screw drills, such as speed and direction measurement [32], state and performance prediction [33], and stall prediction [34].
However, the existing results do not consider the influence of the bypass valve of the positive displacement motors on the service life of the drill. As the core component of the positive displacement motors, the bypass valve often needs to be opened and closed during the working process. The mismatch of drilling fluid flow and bypass valve structure will lead to excessive wear and erosion of the bypass valve, thereby reducing the working life of the positive displacement motors and increasing the cost of drilling. Therefore, it is necessary to study the erosion damage law of the bypass valve of the positive displacement motors and optimize its structure on this basis, so as to reduce wear and erosion, improve the service life of the positive displacement motors, and reduce the drilling cost.

2. Bypass Valve Working Principle

As illustrated in Figure 1a,b, the positive displacement motor serves primarily as downhole power machinery. It utilizes the mud pump to deliver drilling fluid to the motor, creating a specific pressure differential between the upper and lower ends. This pressure differential drives the rotation of the motor rotor. The resulting torque and rotational speed are transmitted to the drill bit via the cardan shaft and transmission shaft. The bypass valve, a crucial component of the positive displacement motor, primarily consists of the valve body, valve core, valve sleeve, and spring. It plays an essential role in regulating downhole pressure, ensuring normal circulation of drilling fluid, and preventing unexpected downhole incidents.
The fundamental working principle of the bypass valve is depicted in Figure 1c. When the bypass valve is in the open position, the spring elevates the valve core, thereby permitting the drilling fluid to flow from the drill string to the annular space through the bypass side hole. As drilling operations advance, fluctuations in hydraulic pressure influence the position of the spring surrounding the valve core, resulting in the spring compressing and closing the bypass side hole. This mechanism facilitates the circulation of drilling fluid throughout the system, supplying power to the motor. At the onset of drilling operations, the bypass valve mitigates the influence of hydraulic pressure, enabling the spring to reset the valve core and reopen the bypass valve. Consequently, this allows the fluid within the drill string to flow smoothly into the annular passage of the wellbore, thus ensuring the continuity and efficiency of drilling operations.

3. Valve Core Flow Field Simulation Model

This study employs flow field simulations on the vulnerable component of the bypass valve, specifically the valve core, to analyze the flow characteristics of drilling fluid within the core and the distribution of particles in the flow field. The results facilitate the identification of erosion and wear mechanisms within the valve core, offering valuable insights for subsequent structural optimization. The fluid models utilized in the flow field simulation of the valve core include the continuous phase model, discrete phase model, turbulence model, and erosion model, which are detailed below.
The flow of the two-phase mixture in the flow passage of the bypass valve is chaotic and irregular. The basic control equations involved in the finite volume analysis for the valve core are represented by Equation (1).
ρ t + ( ρ u ) x + ( ρ v ) y + ( ρ w ) z = 0 ,
where ρ represents fluid density; t represents time; u, v, and w represent velocity components; and x, y, and z represent coordinate components.
When conducting erosion analysis on the valve core of the bypass valve, the sand concentration inside is typically between 1% and 2%. The volume fraction of the discrete phase is low, generally less than 10%. Therefore, the discrete phase model (DPM) is chosen to track solid particles. This model considers the influence of particles on the flow and also roughly accounts for turbulent diffusion. The equations for the motion of solid particles are shown in Equations (2) and (3).
d x p i d t = u p i ,
ρ t + u ( ρ u ) x + v ( ρ v ) y + w ( ρ w ) z = 0 ,
Turbulence, as a form of fluid motion, is characterized by its irregular nature and the presence of velocity components perpendicular to the direction of fluid motion. Since the drilling fluid passing through the valve core is in a turbulent state under high Reynolds number, the kinetic energy equation for the turbulence model chosen for calculation is shown in Equation (4).
( ρ K ) t + ( ρ μ i K ) x i = x j [ ( μ + σ K σ ω ) K x j ] + P K P ε ,
where K represents turbulent kinetic energy; μ represents the dynamic viscosity coefficient of the fluid; σK and σω are turbulence constants; PK is the production term for turbulent kinetic energy; and ε is the turbulence dissipation rate.
The factors influencing erosion are numerous, and the mechanism of erosion is quite complex. Erosion is typically quantified using the erosion rate. In this research, the simulation of the valve core considers the following influencing factors: the impact angle of solid particles, the velocity of the impacting particles, the shape of the particles, and the properties of the wall material. Therefore, the expression for the erosion model used is shown in Equation (5).
R = γ = 1 N p a r t i c l e s m p C ( d p ) f ( α ) v b ( v ) A f a c e ,
where R represents the erosion wear rate on the surface of the structural component, γ is the number of particles, Nparticles is the total number of particles, C(dp) is the particle size distribution function, v is the velocity of the impacting particles, b(v) is a function of the relative velocity between particles and the structural component, and α is the angle between the trajectory of the impacting particles and the surface of the structural component.

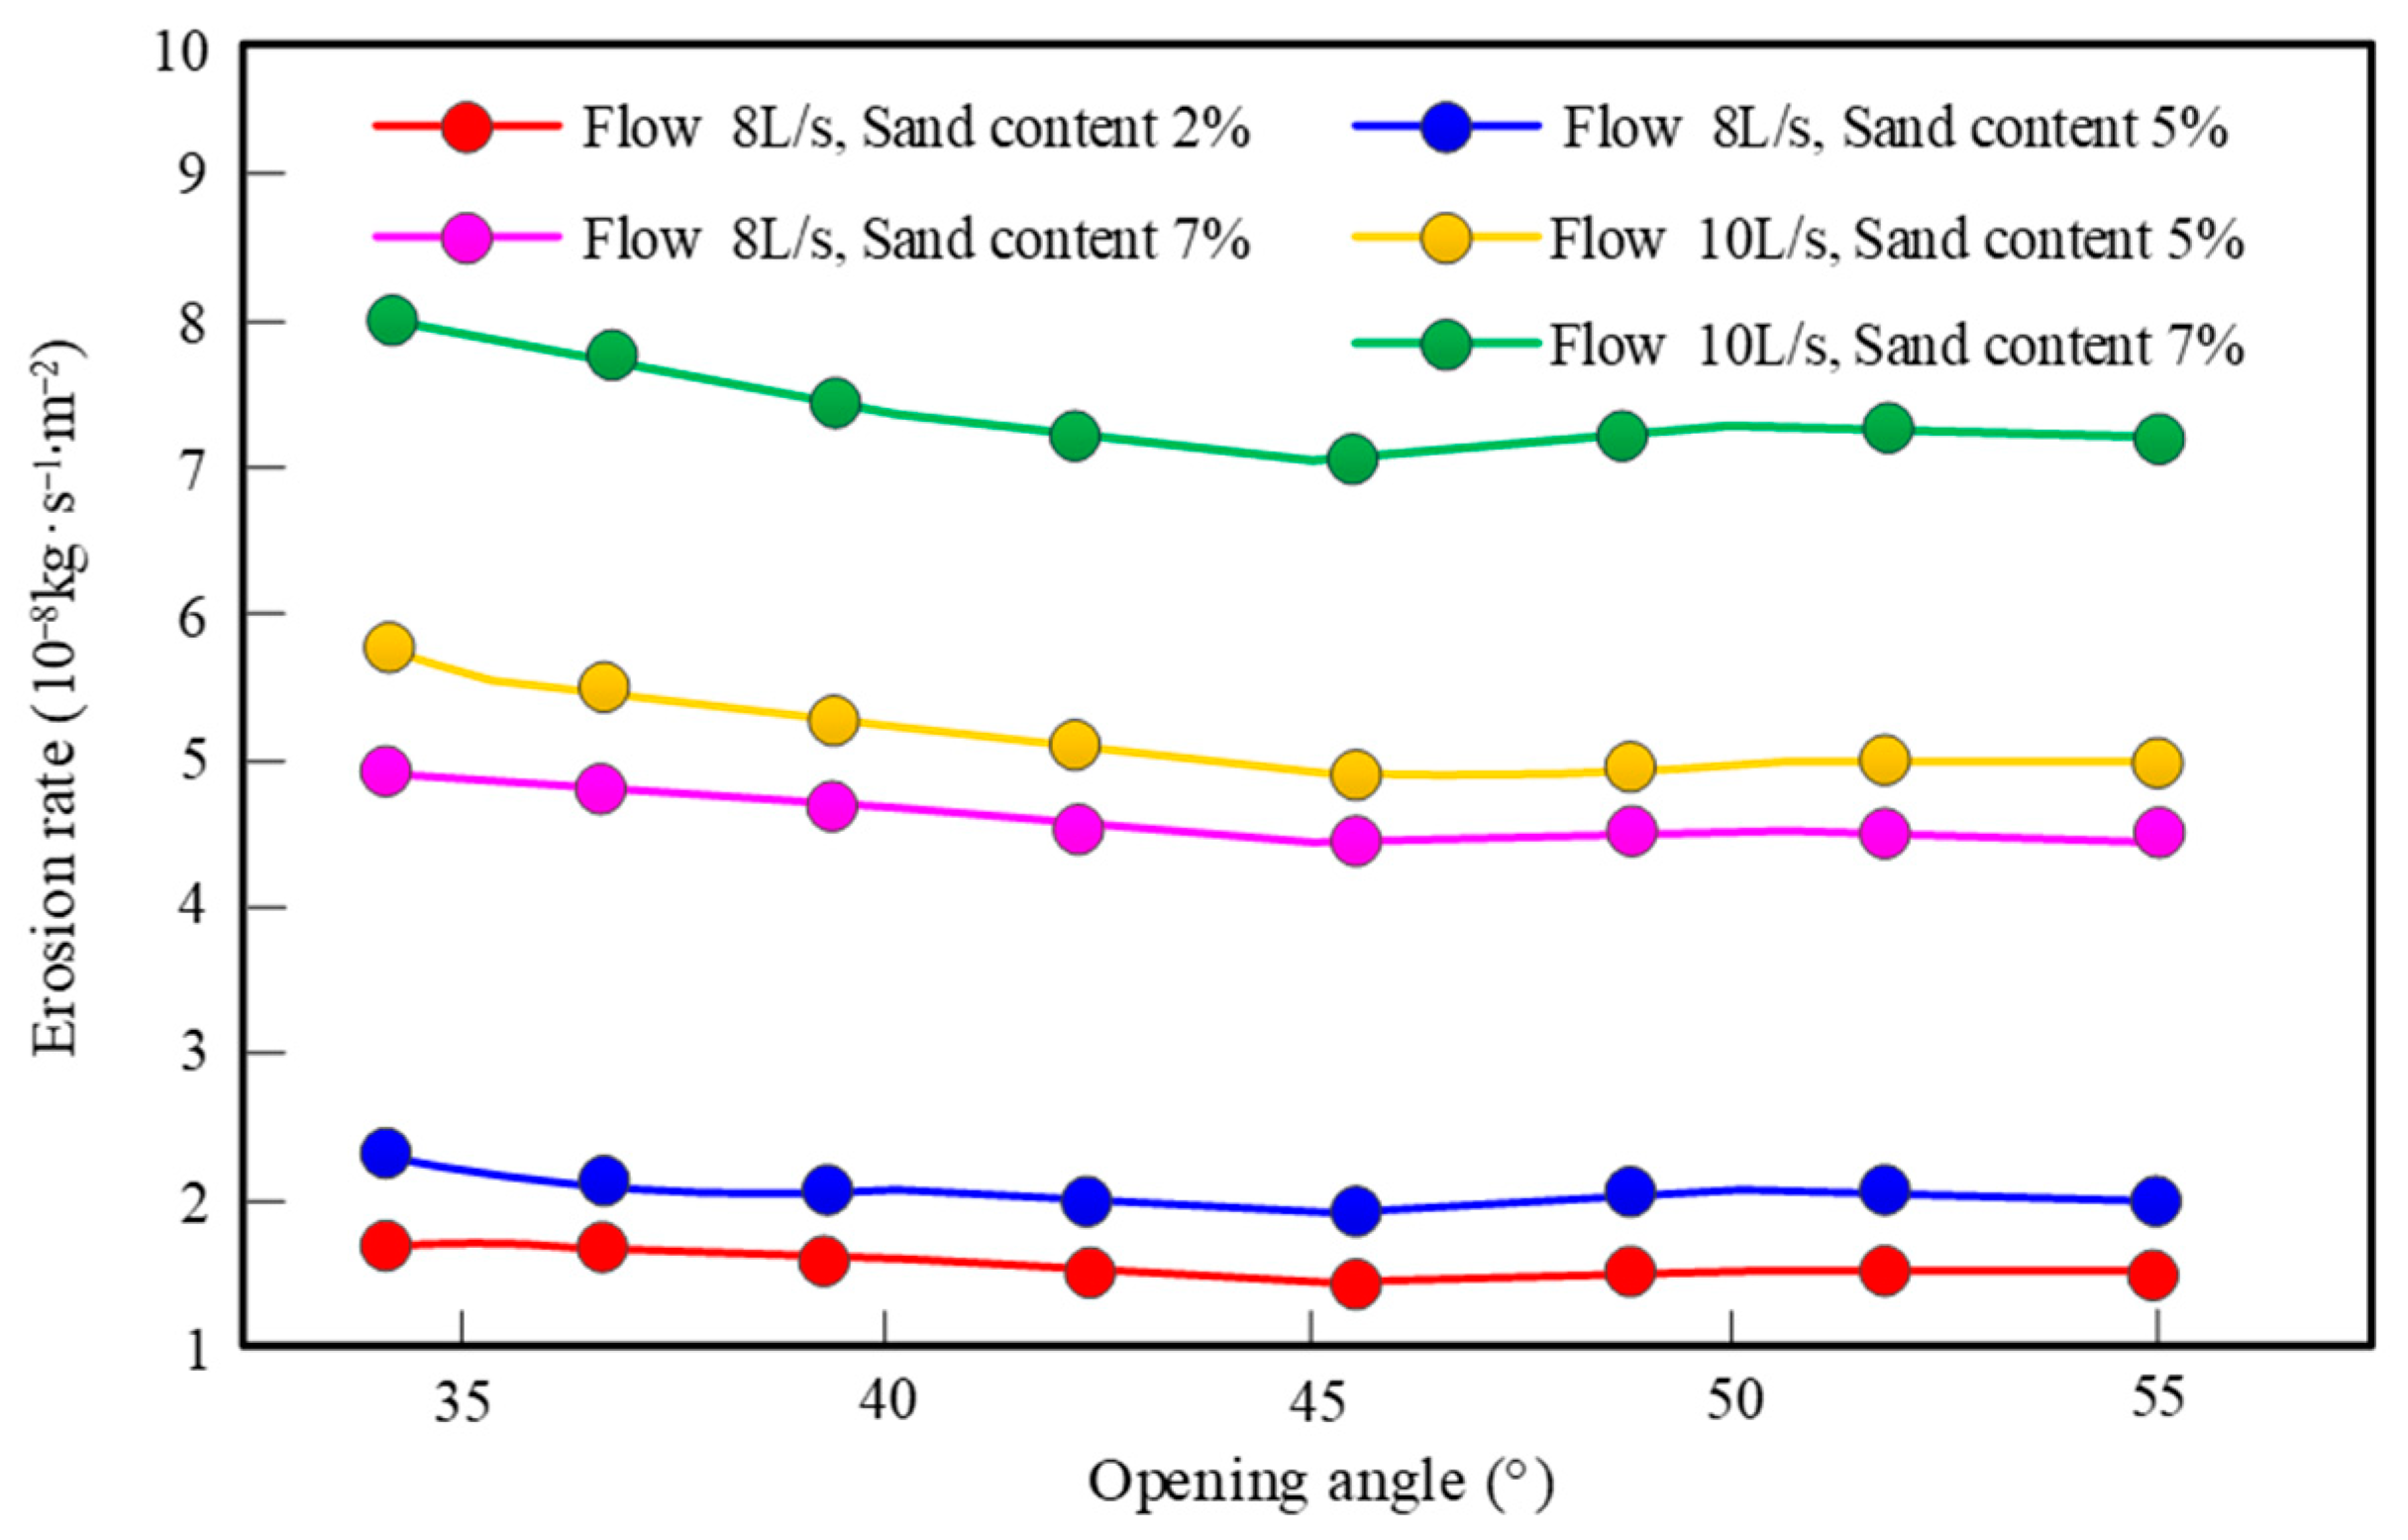
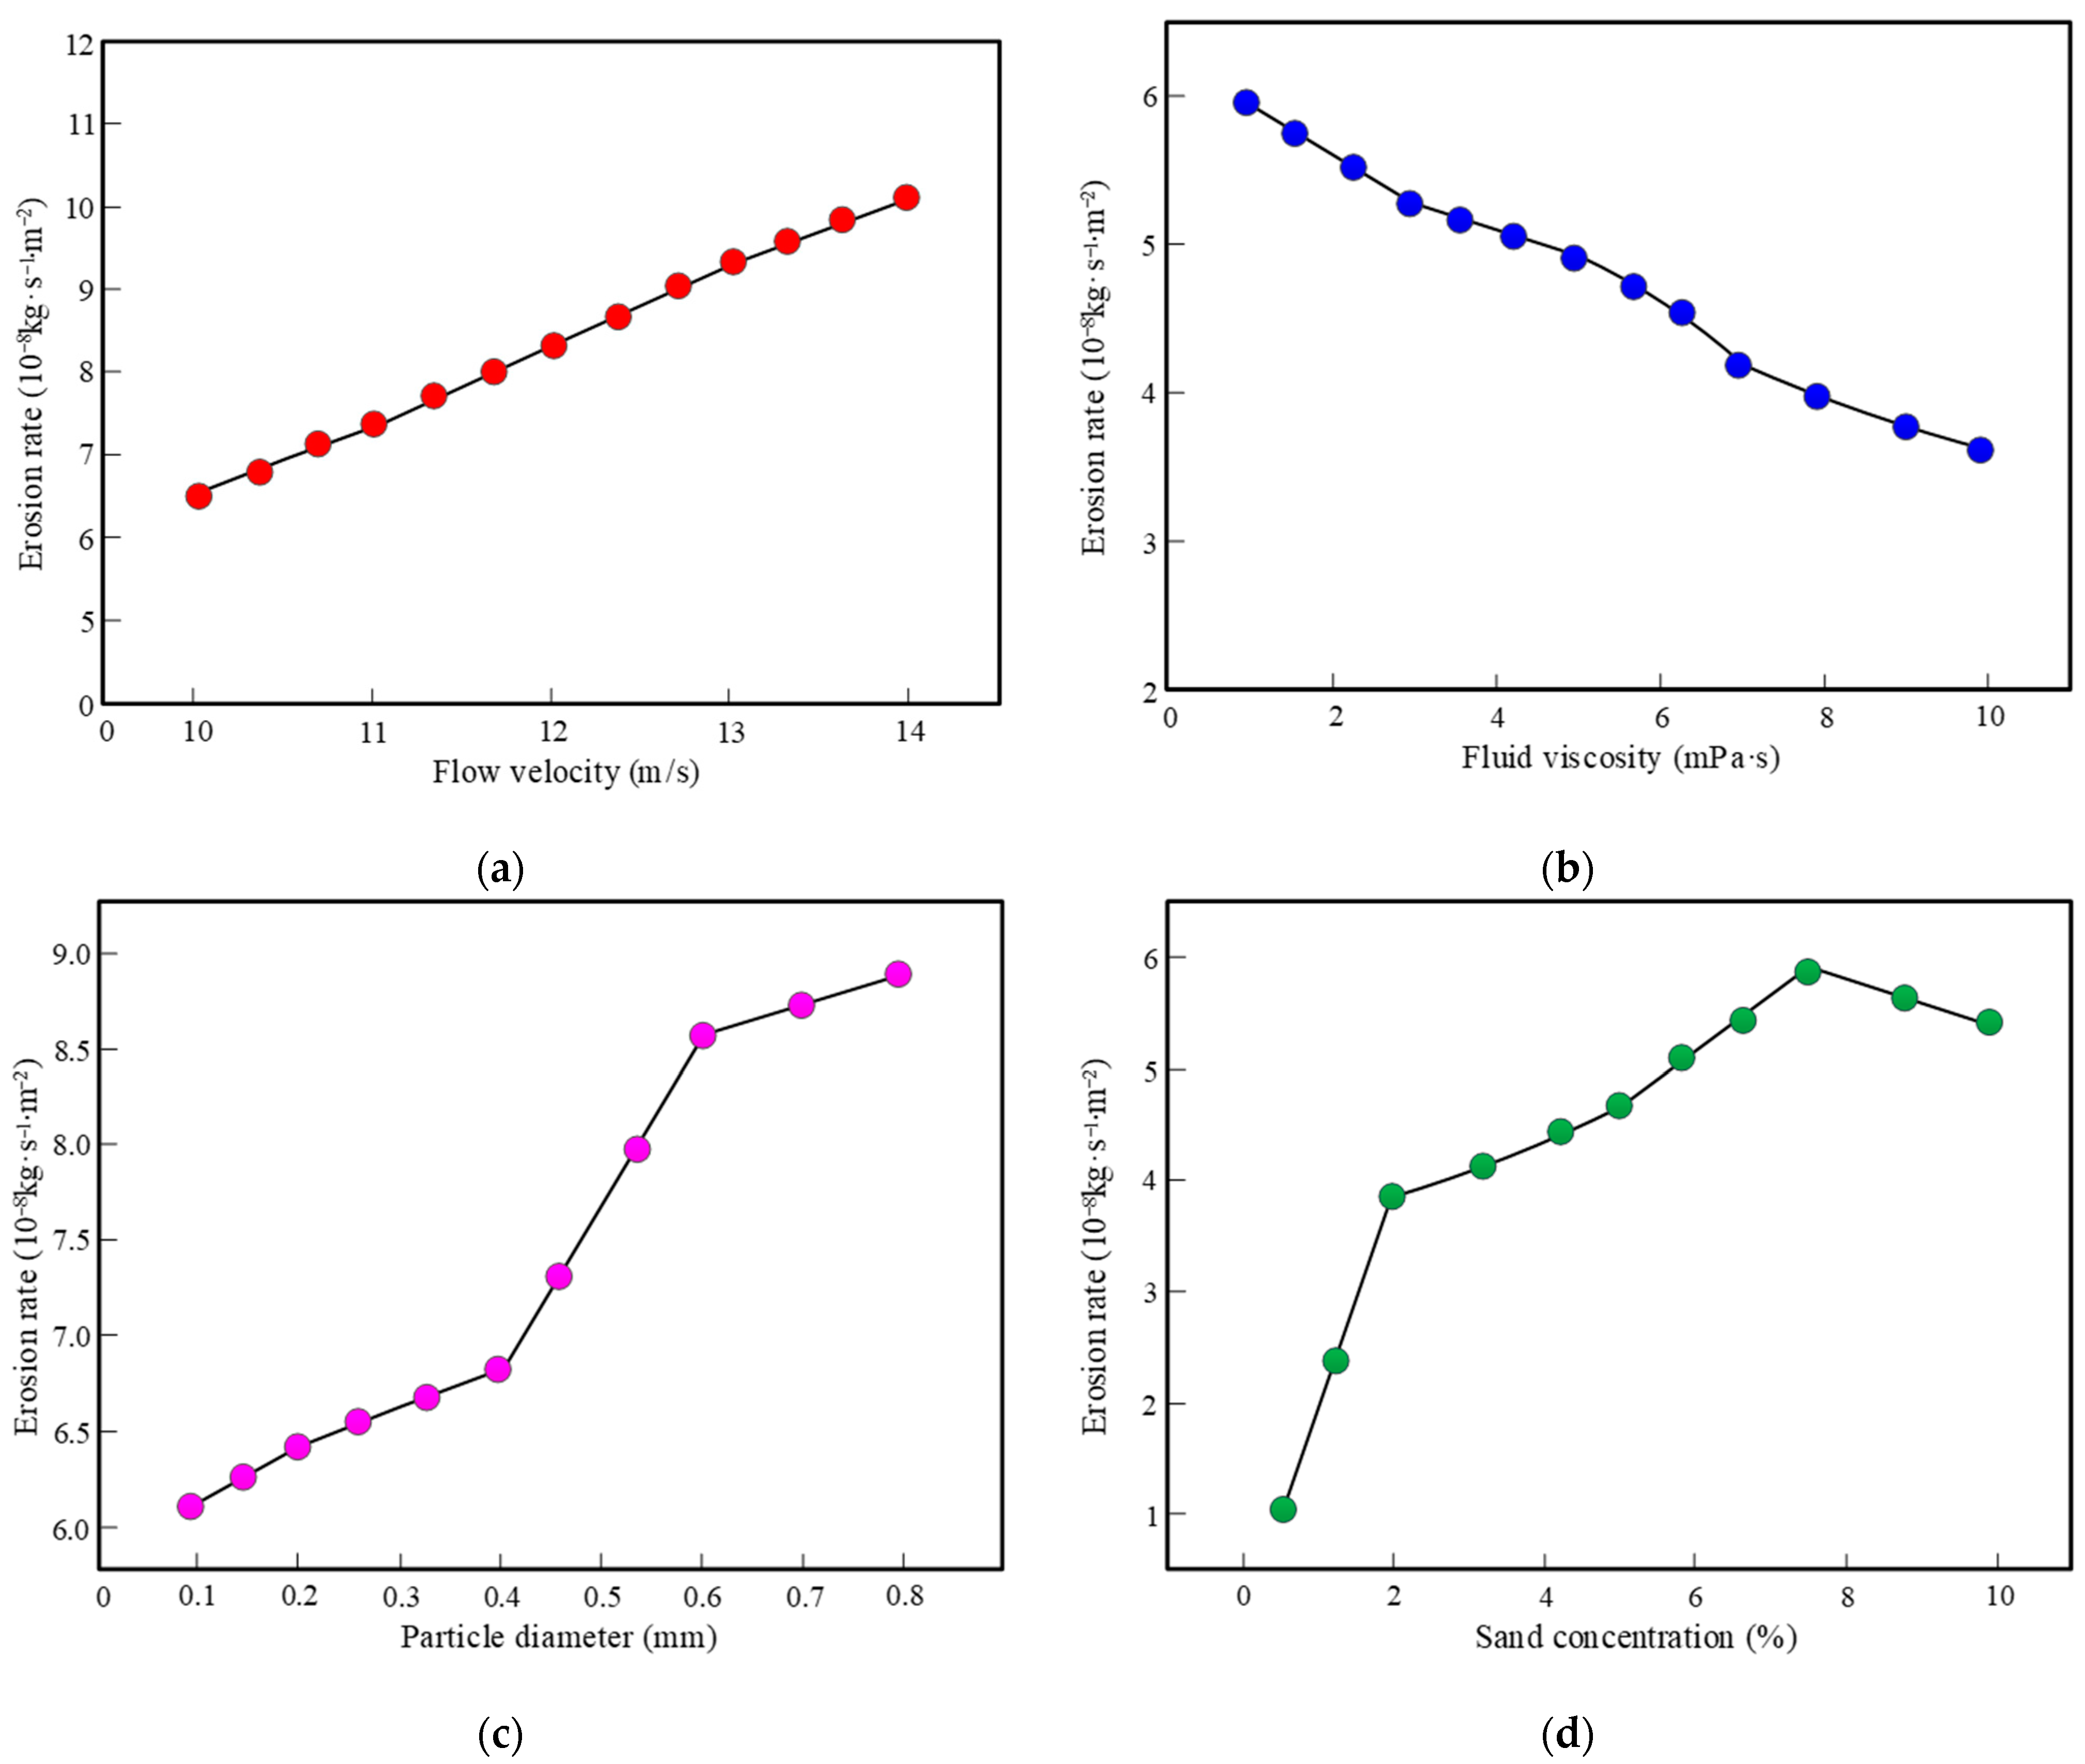
4. Simulation of Influencing Factors on Valve Core Erosion

This research employs Ansys Fluent software 2021 to conduct simulation analyses aimed at obtaining contour plots of velocity and pressure distribution within the flow field of the valve core. It establishes particle velocity monitoring lines to examine flow behavior and generate a distribution map of solid particle volume fraction. Based on these findings, the primary factors influencing internal erosion in the valve core are identified, and subsequent optimization of the valve core is carried out. The specific details are provided below.

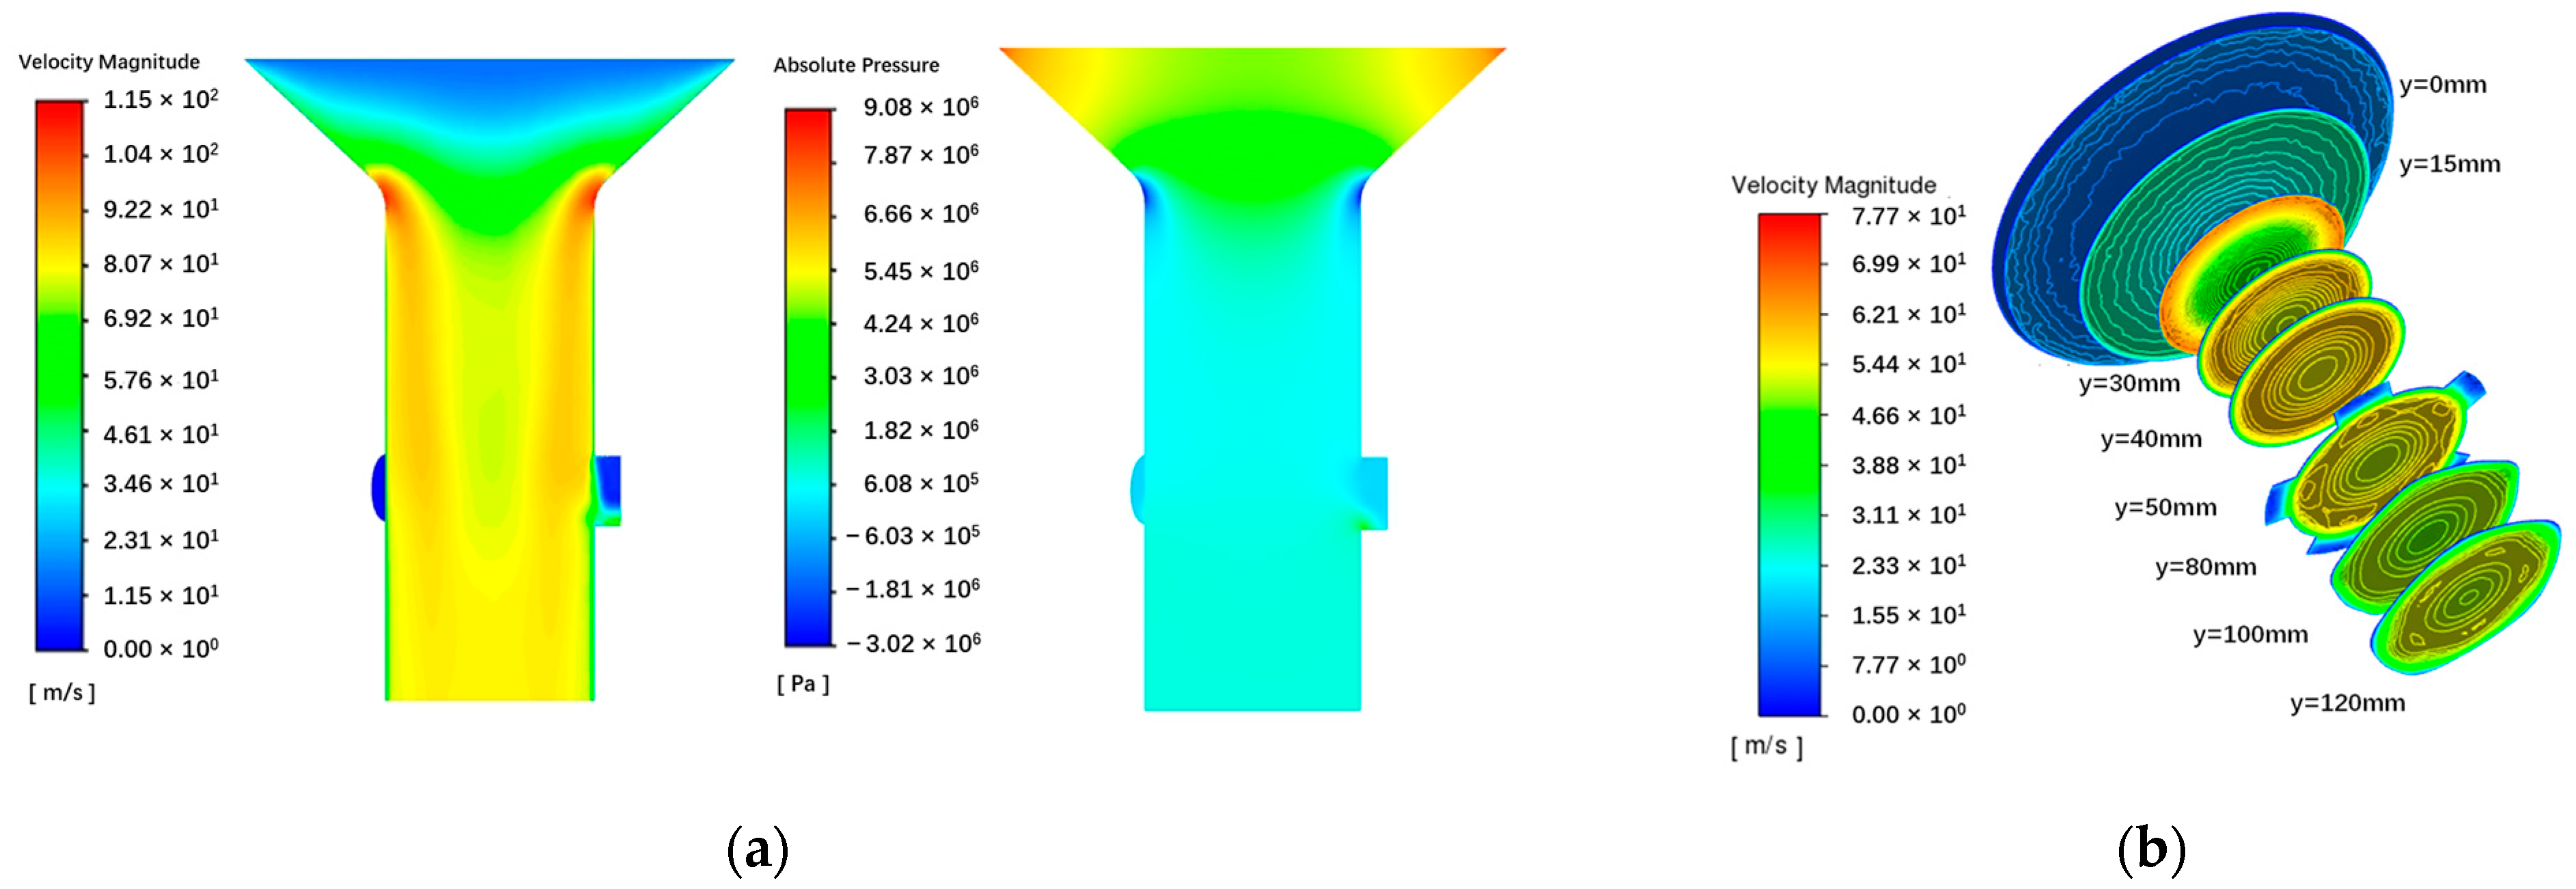
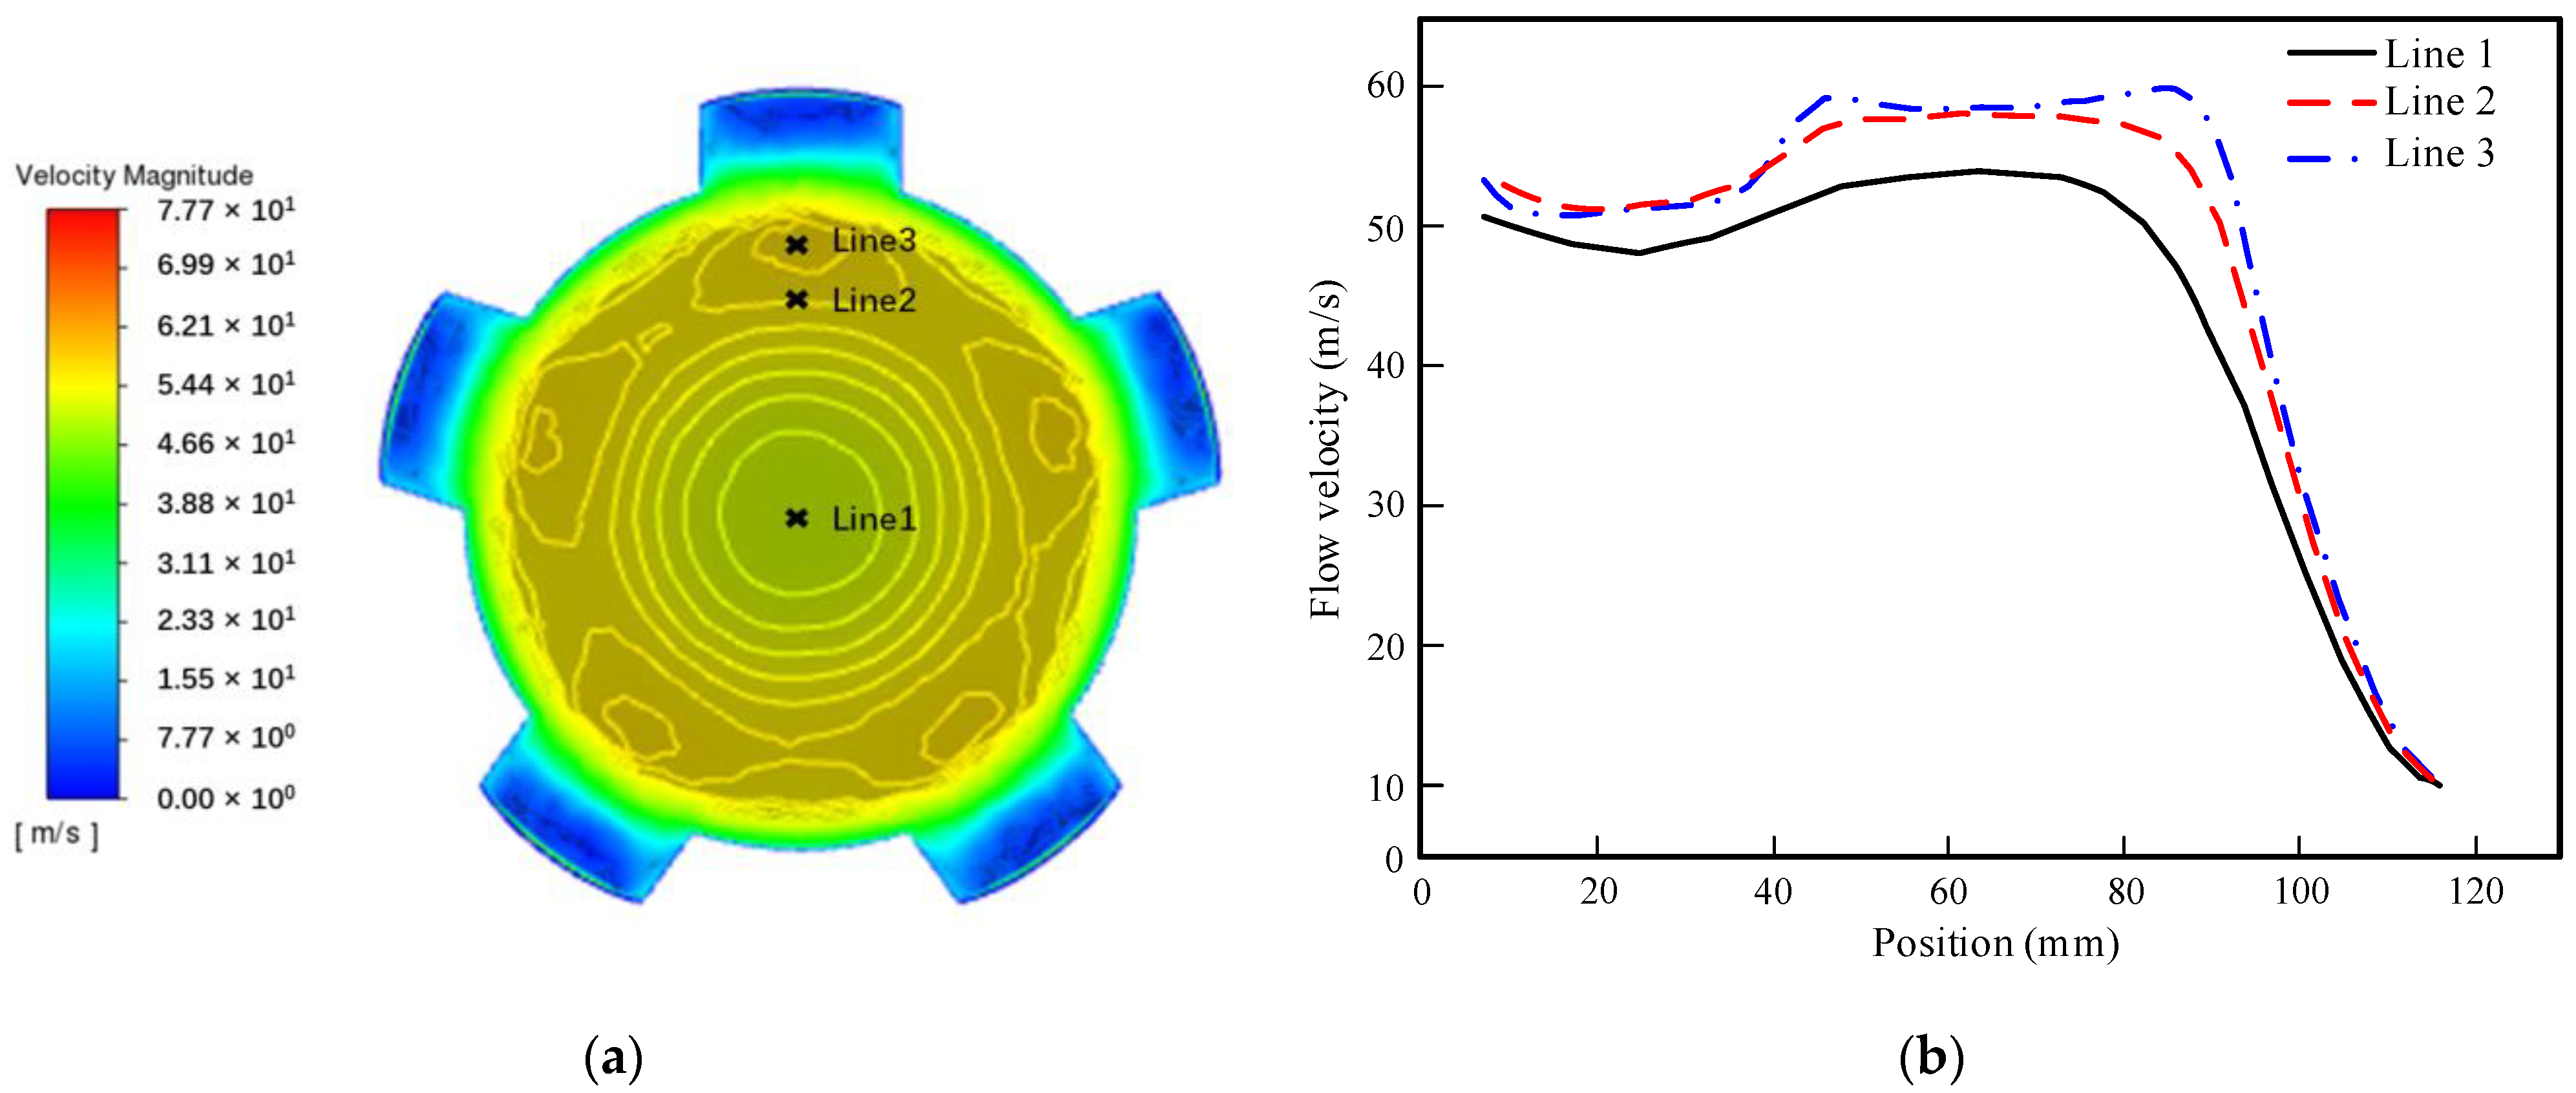
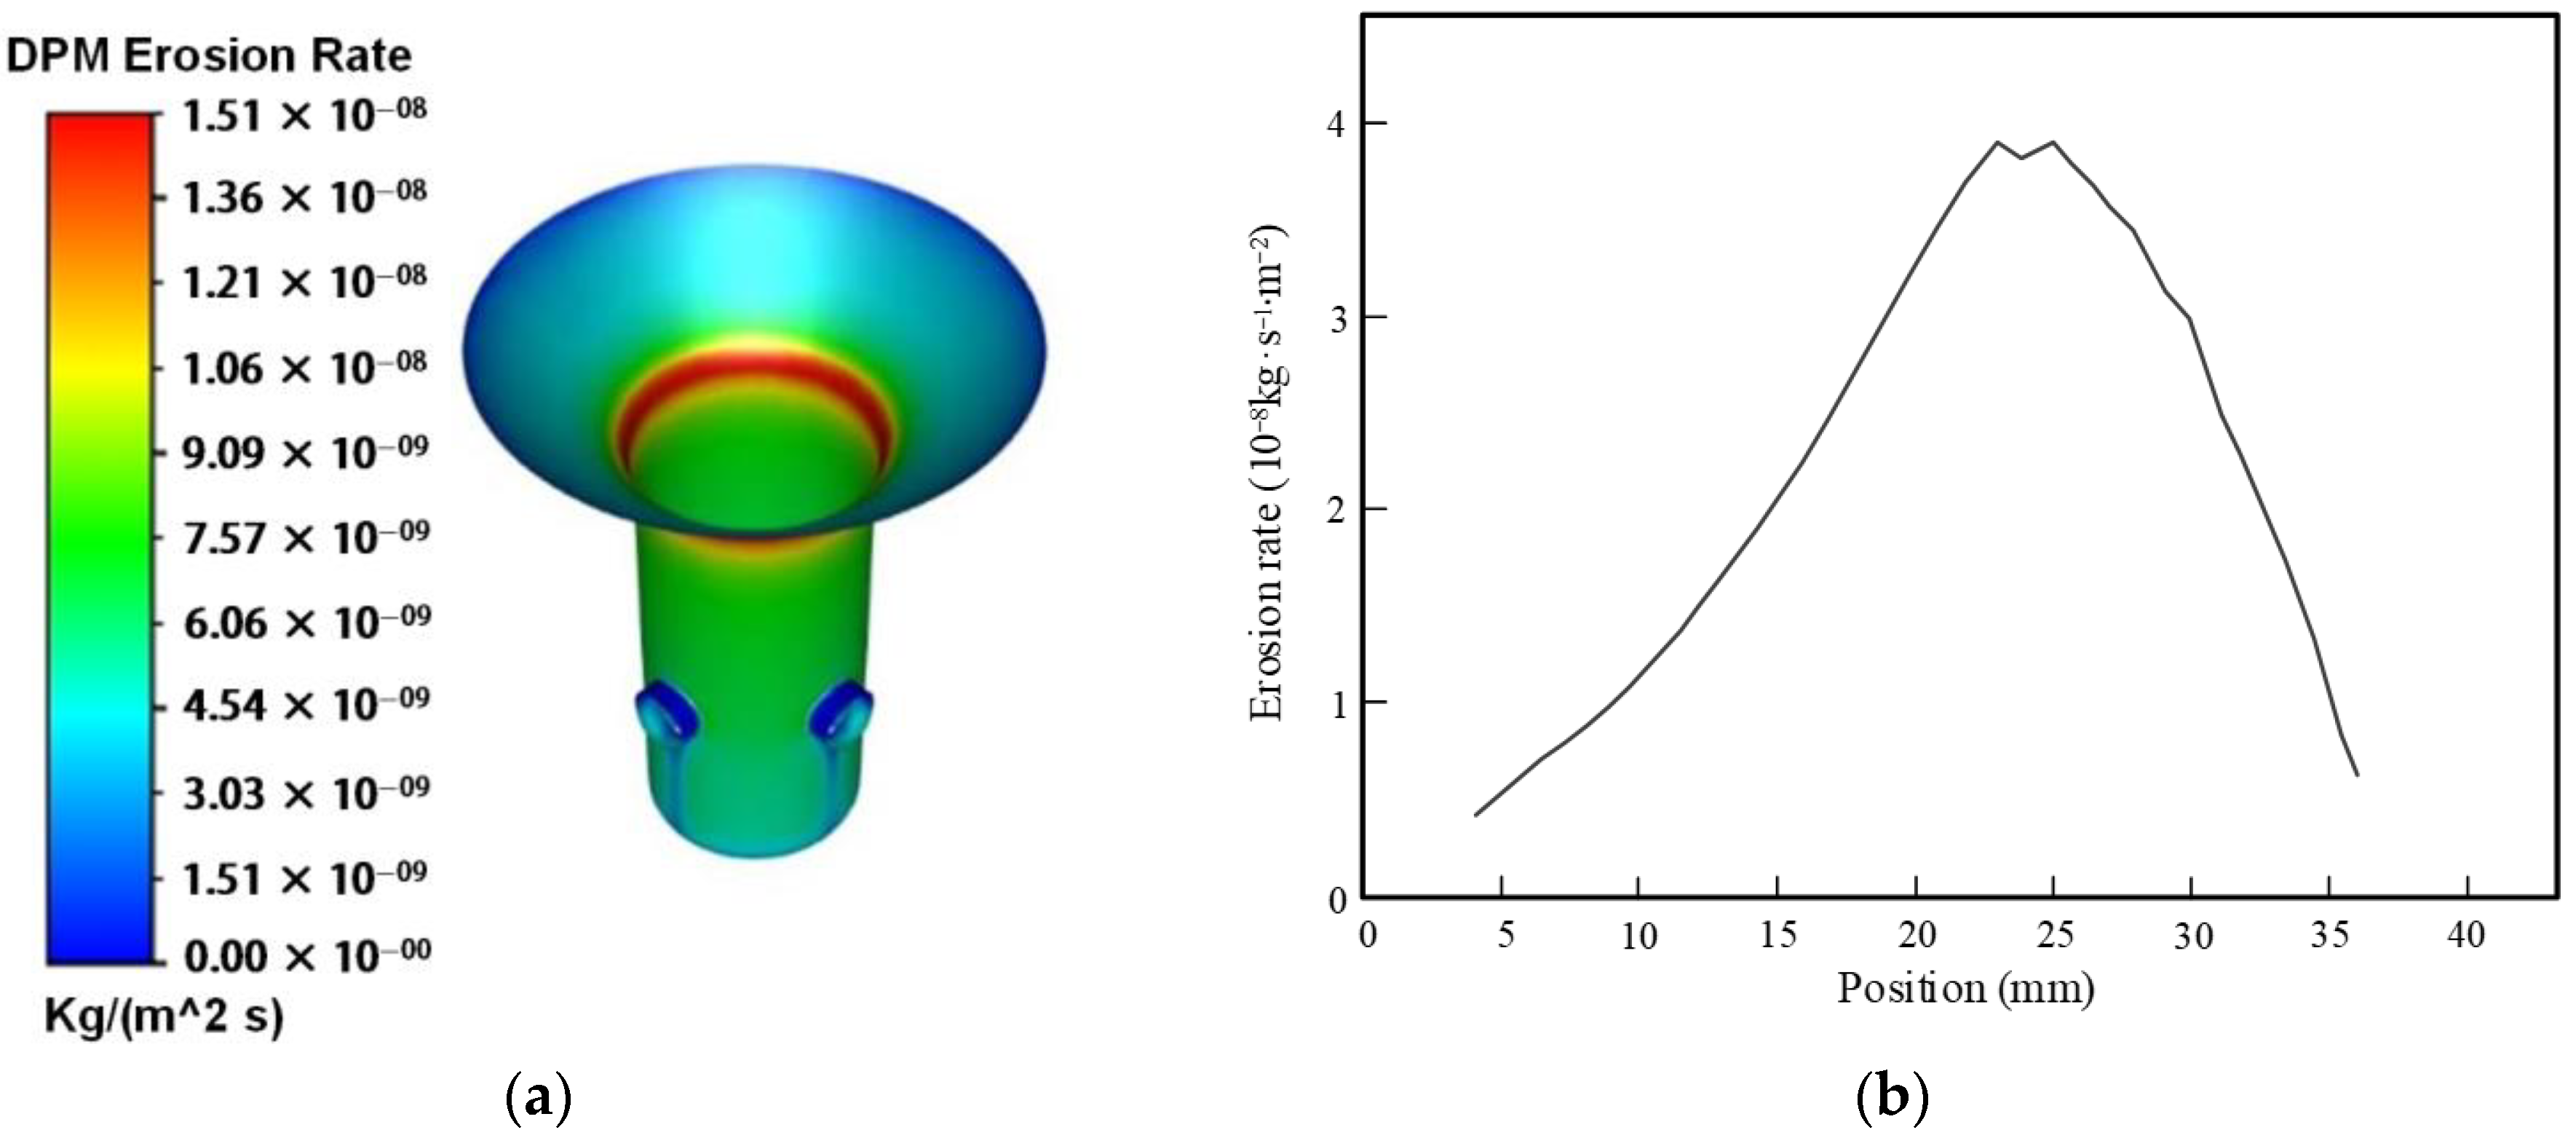
4.1. Flow Field Simulation and Analysis

The fluid domain within the valve core is modeled as axisymmetric; therefore, the XOY section of this domain is selected for analyzing flow behavior. Figure 2a displays the velocity and pressure contour plots of the valve core flow field in the XOY section, derived from simulation calculations. At the inlet of the valve core, characterized by a relatively large opening area, the mud enters smoothly. As the valve core structure changes abruptly, the cross-sectional area of the flow passage decreases, leading to a gradual increase in mud velocity. The maximum velocity is 11.2 m/s at the valve core’s varying diameter section. Meanwhile, the pressure inside the valve core gradually decreases from the inlet to the outlet, creating a certain pressure gradient between the inlet and outlet with a pressure difference of 11.73 MPa.
The mud velocity and pressure primarily change at the valve core’s varying diameter section and side holes. It can be seen that the structural variation inside the valve core not only changes the flow direction of the drilling fluid but also leads to phenomena such as localized pressure reduction, increased mud velocity, and complex flow conditions within the valve core. This is because when solid particles move from a large diameter to a small diameter, the concentration of solid particles per unit space increases, resulting in a gradual increase in velocity. However, within a uniformly sized cylindrical pipeline, the velocity of solid particles gradually decreases due to the loss of kinetic energy during movement. The drilling fluid flows at a fast speed with a large velocity gradient inside the valve core, which explains why the valve core experiences significant axial impact from the drilling fluid, leading to the detachment of the elastic sealing ring in the holes between the valve core and the valve sleeve, ultimately reducing the valve core’s lifespan.
Figure 2b presents the typical cross-sectional velocity contour plot within the valve core’s flow domain. With the flow trend from the inlet to the outlet and under the pressure exerted by the annular vortex flow, the maximum velocity difference occurs at y = 30 mm, and the velocity contour surfaces gradually shrink inward from the outer ring. At y = 50 mm, the velocity difference begins to decrease, and the overall velocity stabilizes. Additionally, the maximum velocity value on the cross-section exhibits a decreasing trend. From the velocity contour plots at different positions, it can be observed that the annular vortex region gradually decreases after the varying diameter section, reaching its maximum area at y = 30 mm. As the distance from the outlet decreases, the intensity of the swirling flow gradually weakens, and the phenomenon of vortex dissipation becomes less apparent. The velocity distribution within the entire flow passage becomes more uniform, approaching the average flow velocity.

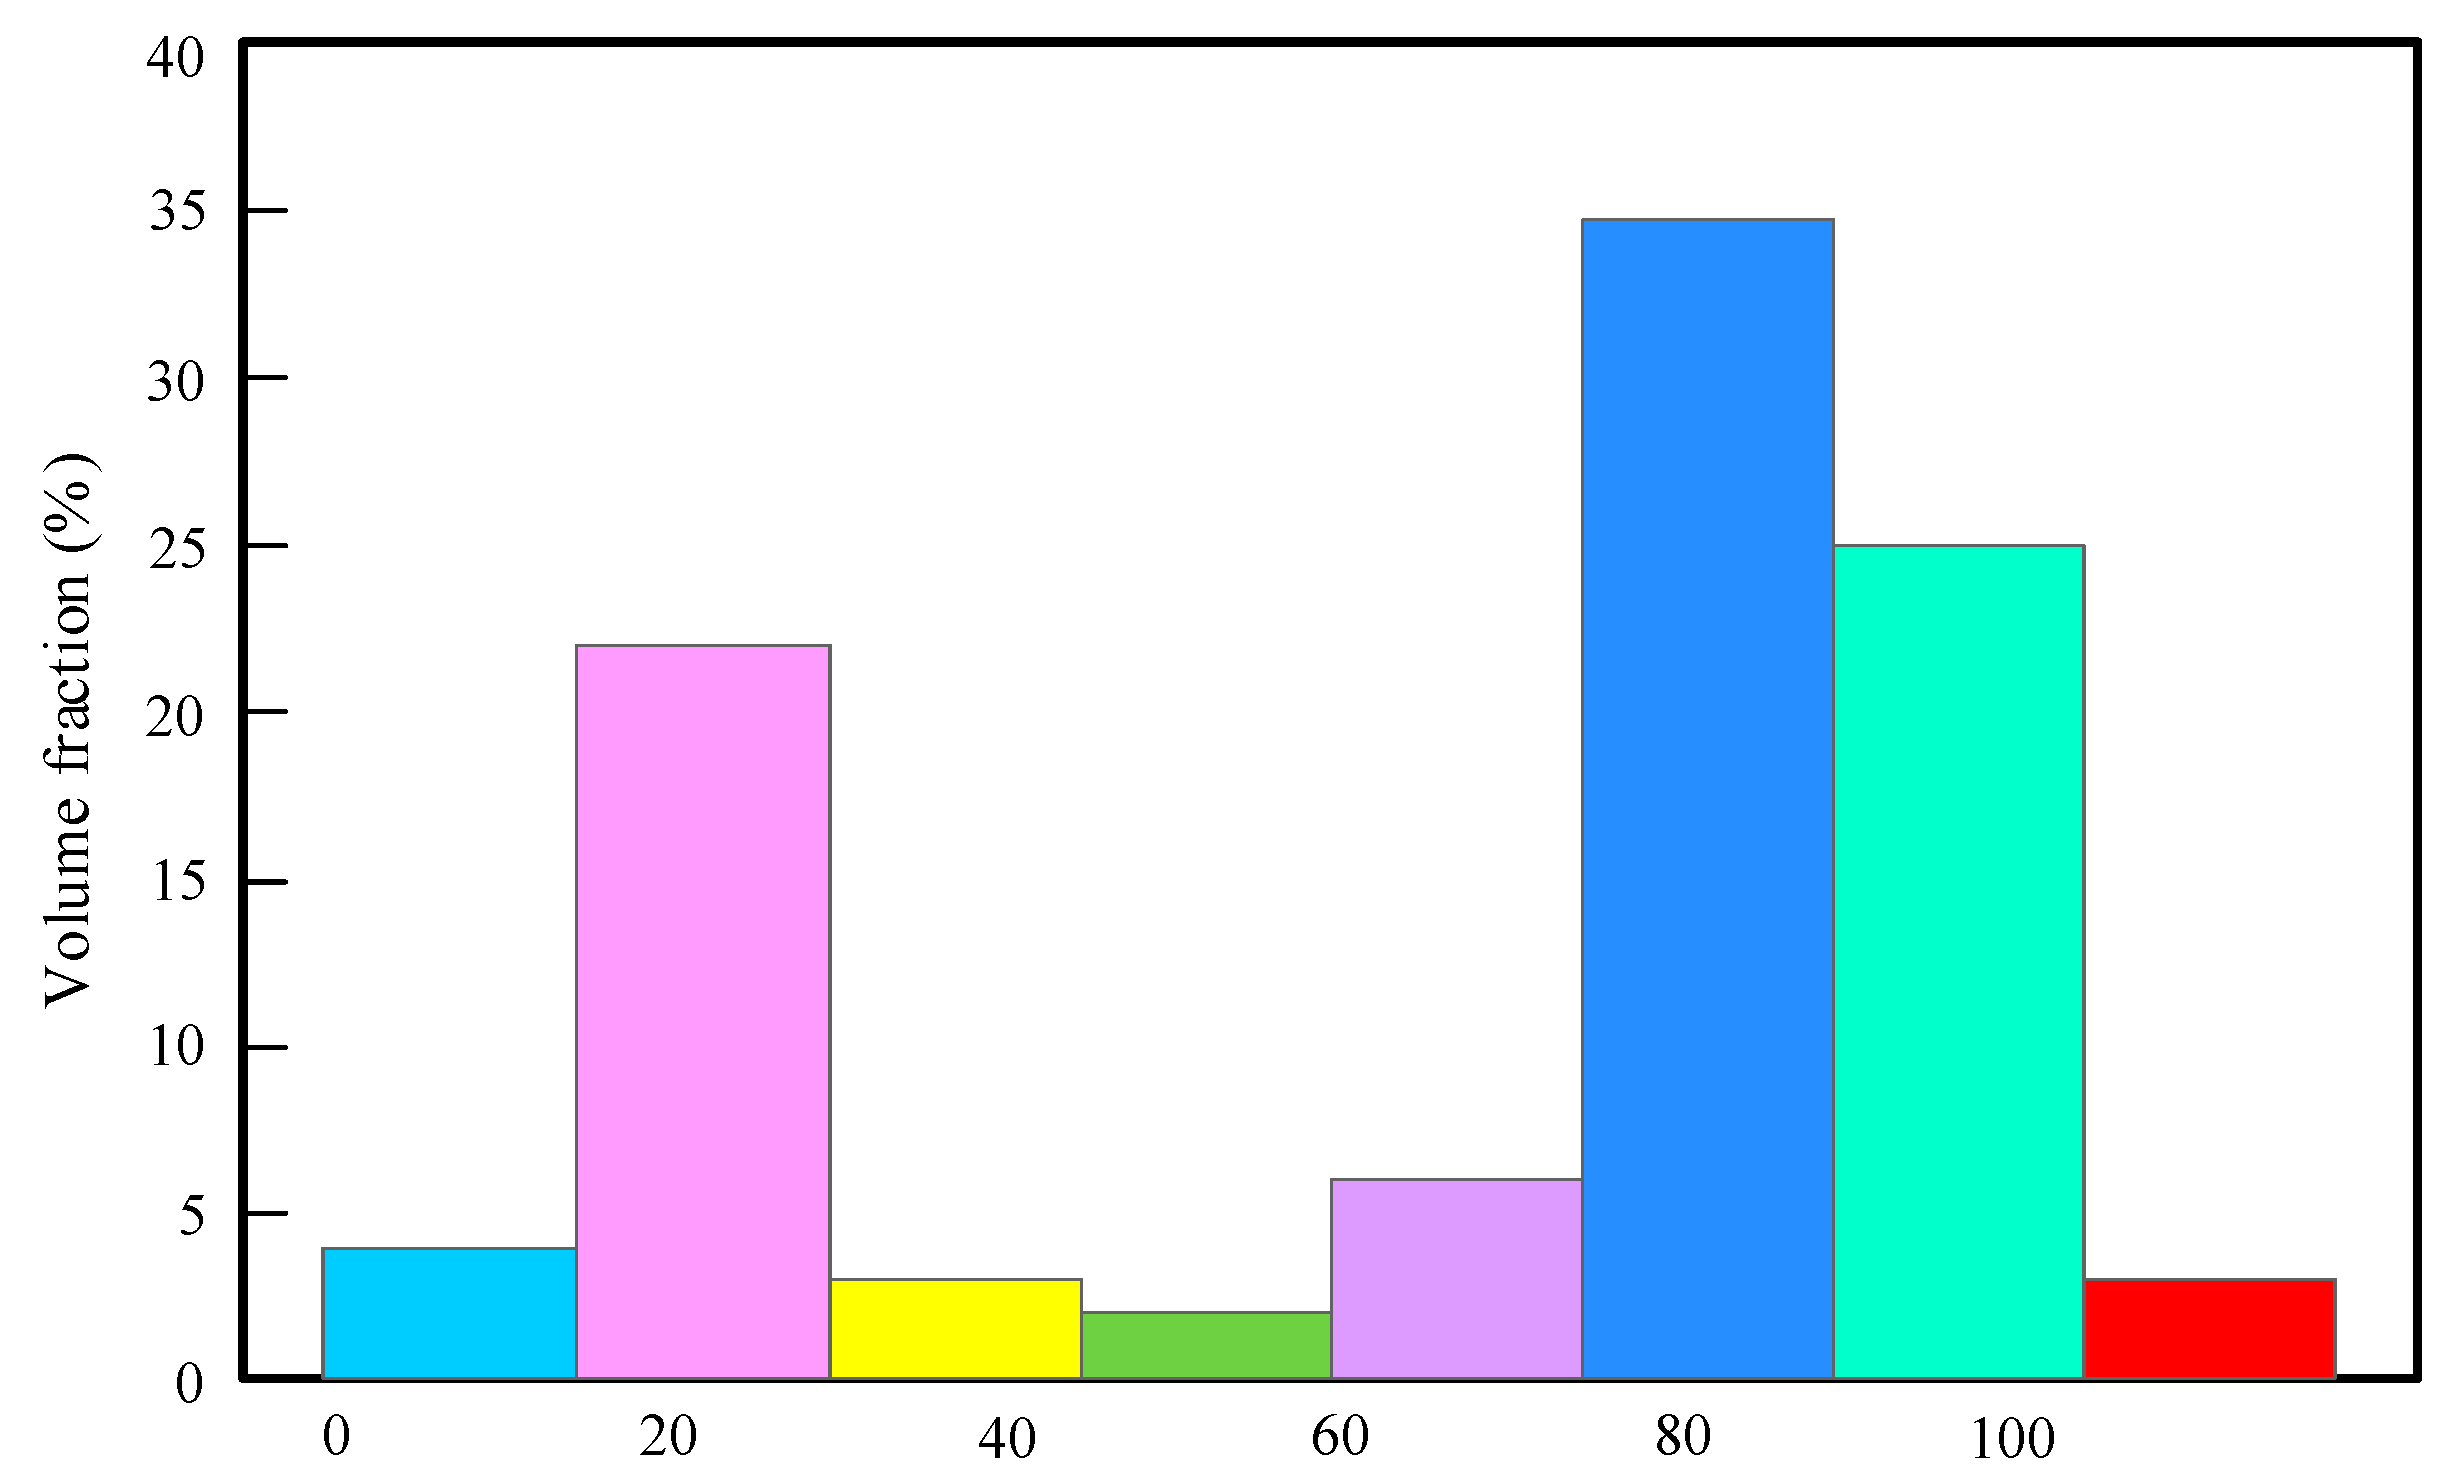
4.2. Particle Motion Simulation and Analysis

Create three velocity monitoring lines, Line 1, Line 2, and Line 3, along the y-axis direction in the valve core as shown in Figure 3a. Line 1 represents the central axis passing through the center of the passage, Line 3 represents the central axis inside the circular vortex close to the wall, and Line 2 represents the outermost isovelocity surface within the circular vortex. Plot the velocity data obtained from each monitoring line to generate the velocity profile curves shown in Figure 3b. It can be observed that the trend of the three curves is roughly similar. During the flow process from the inlet of the valve core to the variable-diameter section, the velocity gradually increases. This occurs because the particle concentration per unit space increases as solid particles move from a larger diameter to a smaller diameter, resulting in a gradual increase in velocity. In the process from the variable-diameter section to the side hole, the velocity reaches a relatively high value and tends to stabilize. Finally, from the side hole to the outlet of the valve core, the velocity gradually decreases. This occurs because the side hole diverts part of the mainstream flow, resulting in a decrease in the number of particles in the central mainstream that flow out from the outlet. The difference lies in the fact that the average velocity of Line 1, Line 2, and Line 3 increases successively. This occurs because the motion of particles tends to be smoother in the central axial region, while particles closer to the wall are more likely to collide with the wall, leading to more complex particle motion.
As shown in Figure 4, the histogram of the particle volume fraction distribution along the y-axis inside the valve core reveals that the solid particles are primarily concentrated between 78 mm and 100 mm, reaching a maximum proportion of 36.53%. This region is located directly below the bypass side holes. A secondary peak in particle volume fraction is observed around 20 mm from the valve core inlet, with a proportion of approximately 25%. This area coincides with the inlet diameter change. The distribution of solid particles in other locations is generally uniform and relatively low. Notably, the particle volume fraction at the valve core outlet is significantly smaller. This is attributed to the flow diversion effect of the five bypass side holes within the valve core, which directs the majority of the solid particles towards the annular space, reducing the particle content in the fluid flowing towards the motor.

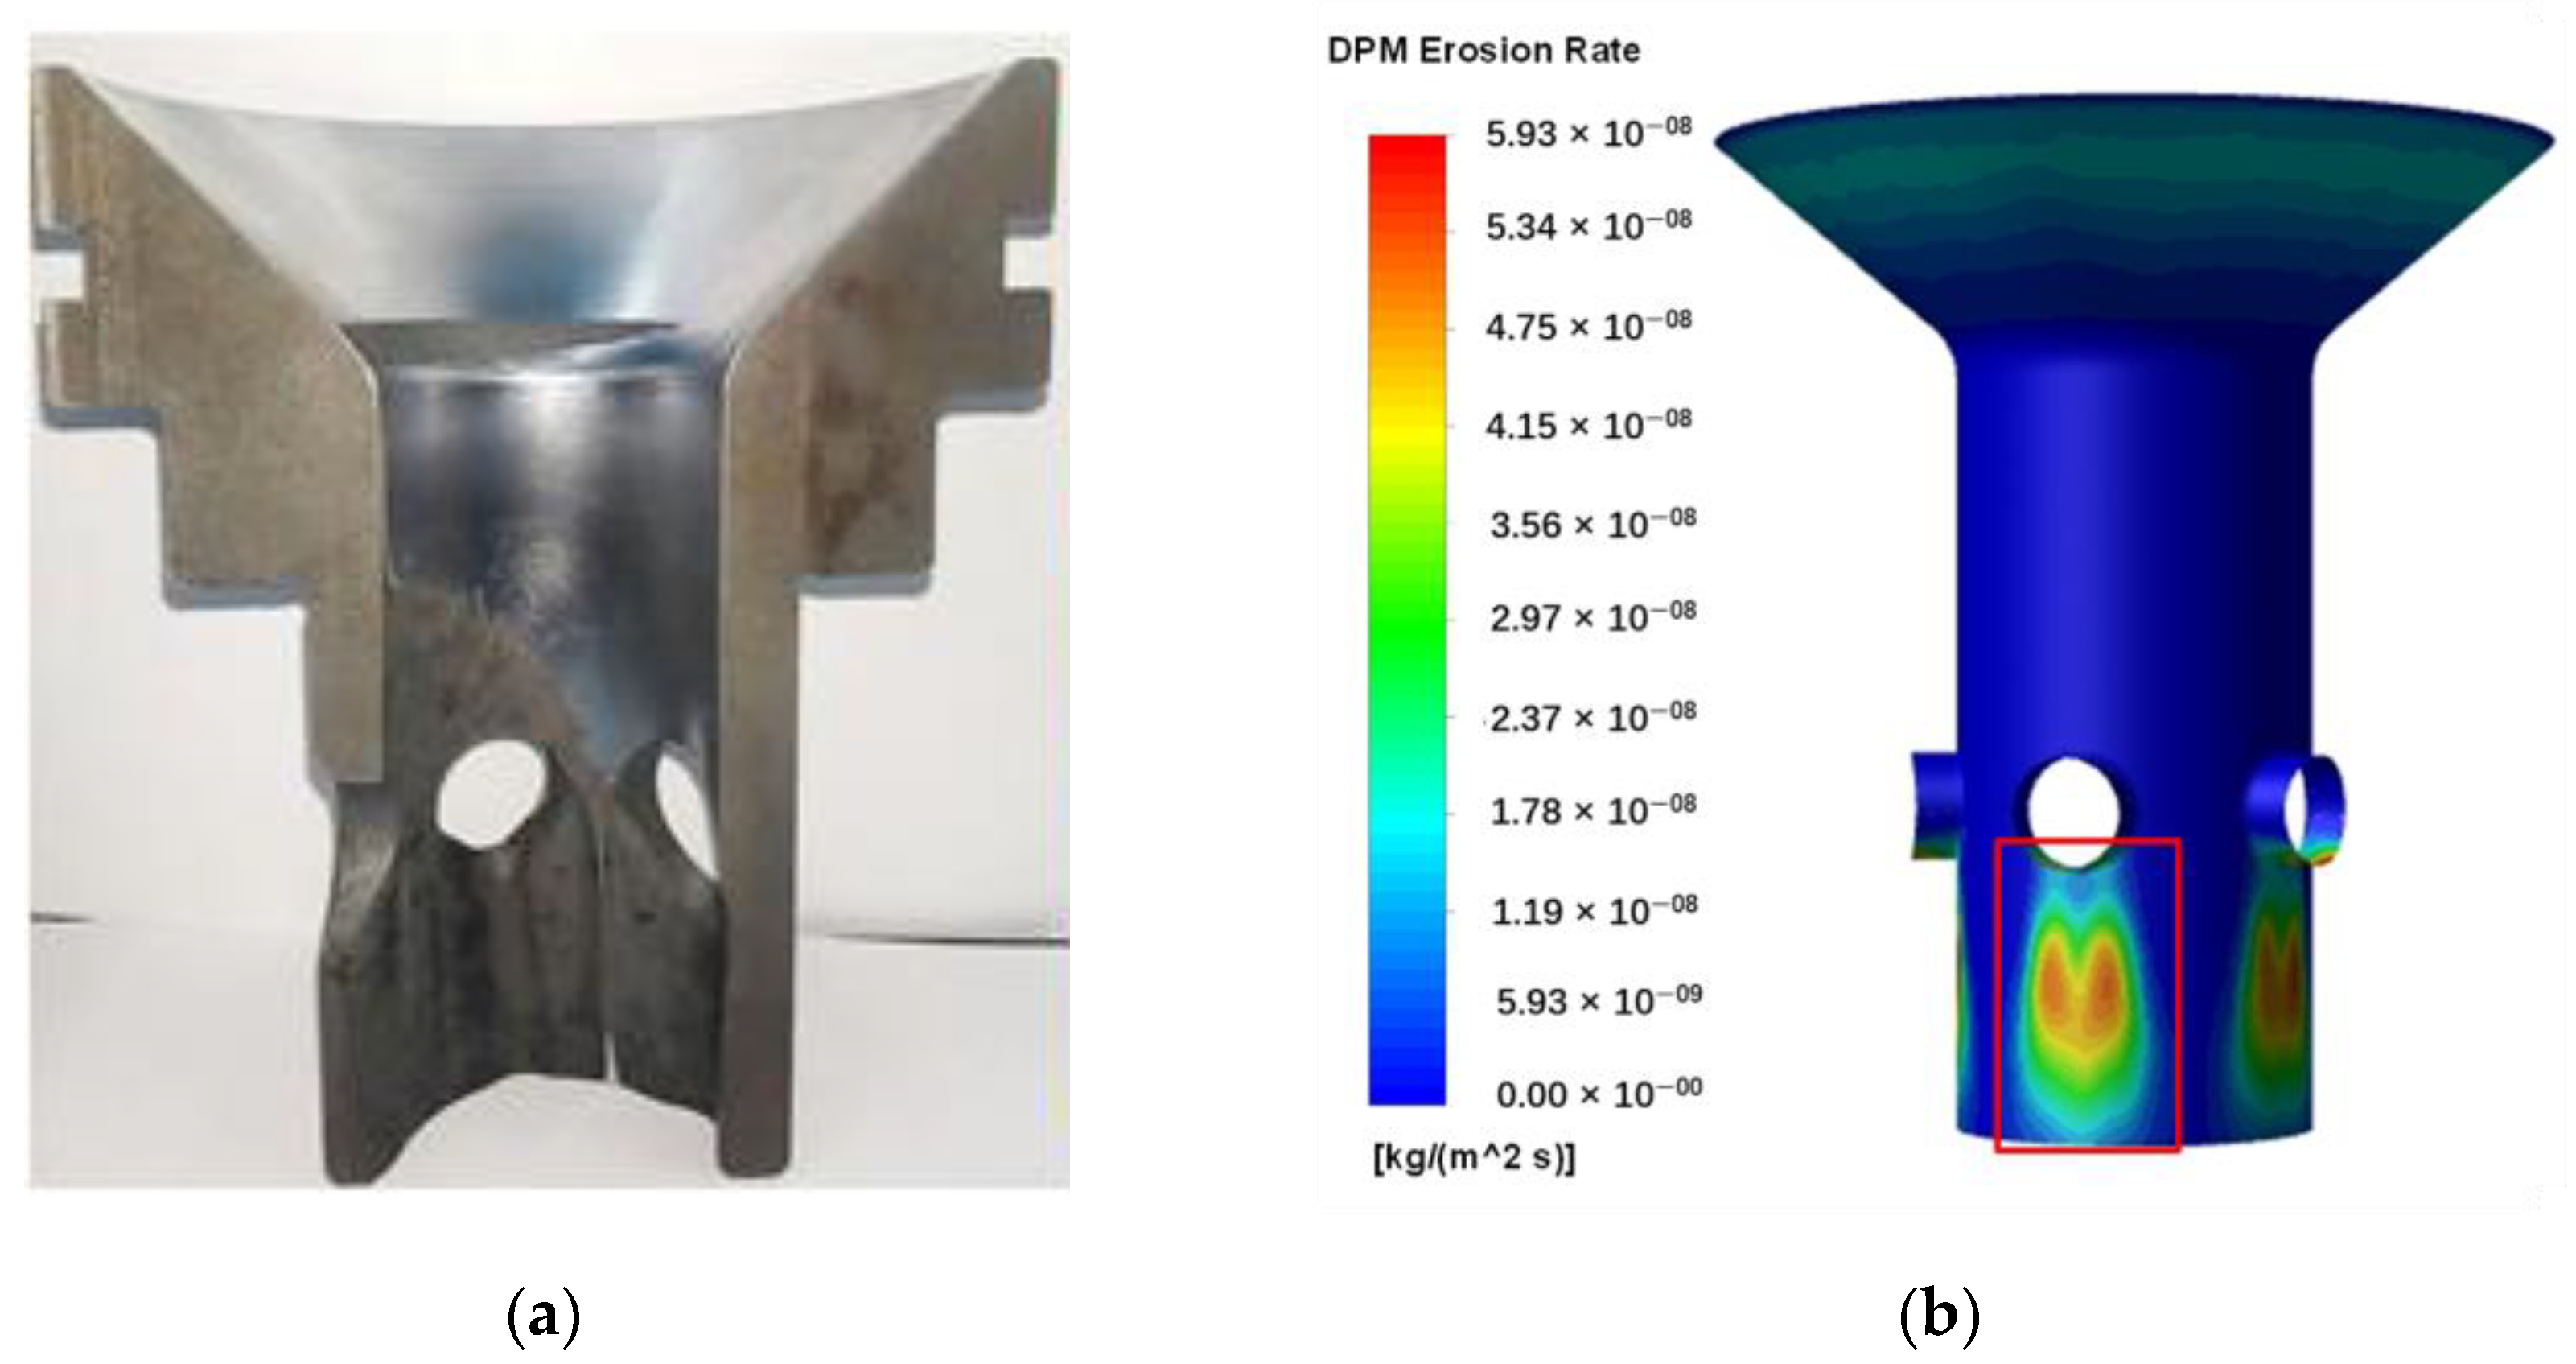
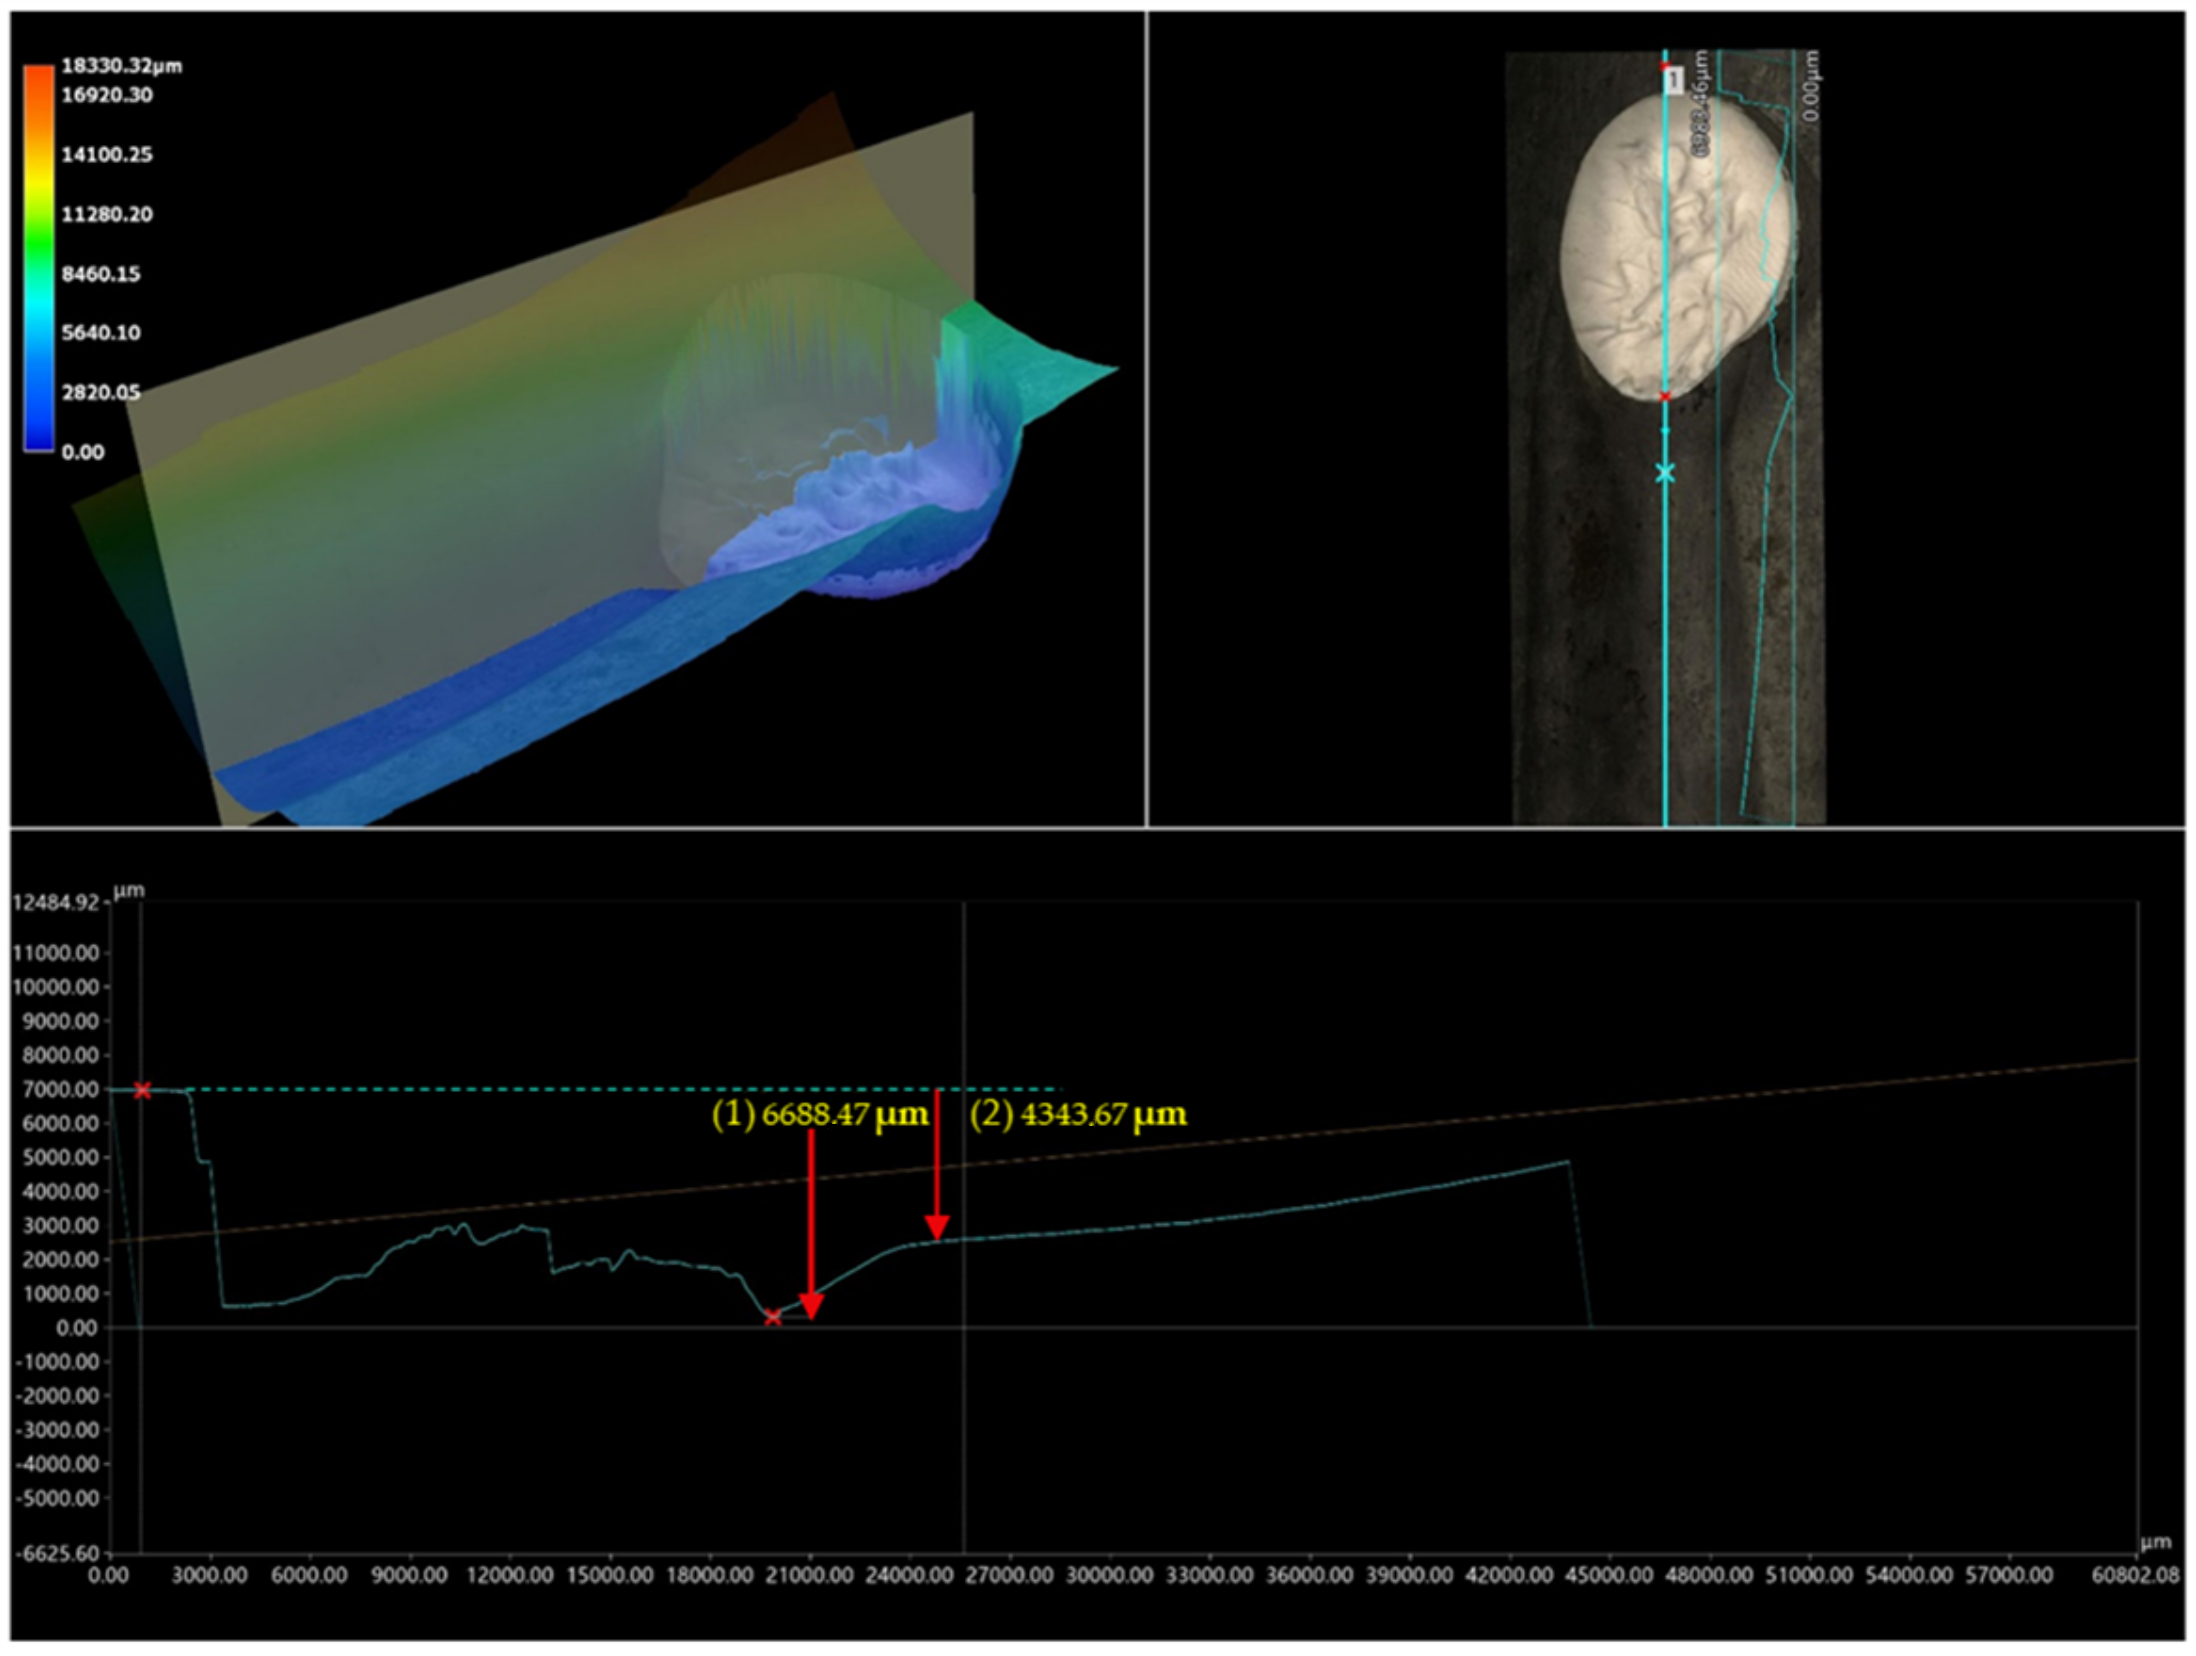
4.3. Experimental and Simulation Verification

In order to verify the reliability of the simulation analysis, the indoor erosion experiment was carried out on the valve core of the bypass valve, and the actual picture of the erosion valve core of the bypass valve was obtained as shown in Figure 5a. It can be observed that the erosion area inside the valve core of the bypass valve is mainly concentrated on the inner wall surface of the variable diameter and the lower end of the side hole of the valve core. The variable diameter is only some erosion wear on the surface, and the lower end of the side hole of the valve core has been seriously damaged by erosion into a pit. The erosion cloud diagram obtained by Fluent software 2021 simulation is shown in Figure 5b. It can be found that the main erosion area predicted by the simulation is at the lower end of the side hole of the valve core, which is roughly the same as the physical diagram.
In addition to the comparison of the erosion area, the erosion depth data can also be used as an important criterion for simulation verification. After the experiment, the three-dimensional erosion depth of the valve core surface after erosion is measured by the ultra-depth-of-field three-dimensional microscopic system. As shown in the right two of Figure 6, through the straight line on the y-axis of the side hole center, the red × 1 is the measurement base point, because it is relatively smooth and not eroded. The second red × on the straight line is the lowest point on the line segment, and the height difference with the base point is 6.668 mm. The blue × point is the deepest erosion point in the lower part of the area, and the height difference with the base point is 4.314 mm. The difference between the two points is 2.354 mm.
Quantitative calculation of the depth of wear and erosion of the valve core [35]:
R = C ρ R ,
where C is the unit conversion constant, ρ is the wall material density, R is the erosion rate.
Considering the erosion physical time of solid particles on the wall, the above equation can be further transformed into the following:
D = R t ,
where D is the depth of erosion pit per unit area, t is erosion time.
According to this, the calculation results of the simulation can be quantified in depth for the above formula. As shown in Figure 5b, the maximum erosion rate of the inner wall of the spool is located on the cylindrical wall under the bypass side hole. According to the range of erosion rate in this area and the calculation time of the simulation setting of 120 min, the maximum erosion damage depth and the average erosion damage depth can be calculated. The calculated maximum predicted erosion depth is 1.974 mm, and the error relative to the actual measured value is 16%, which can verify the correctness of the simulation results.

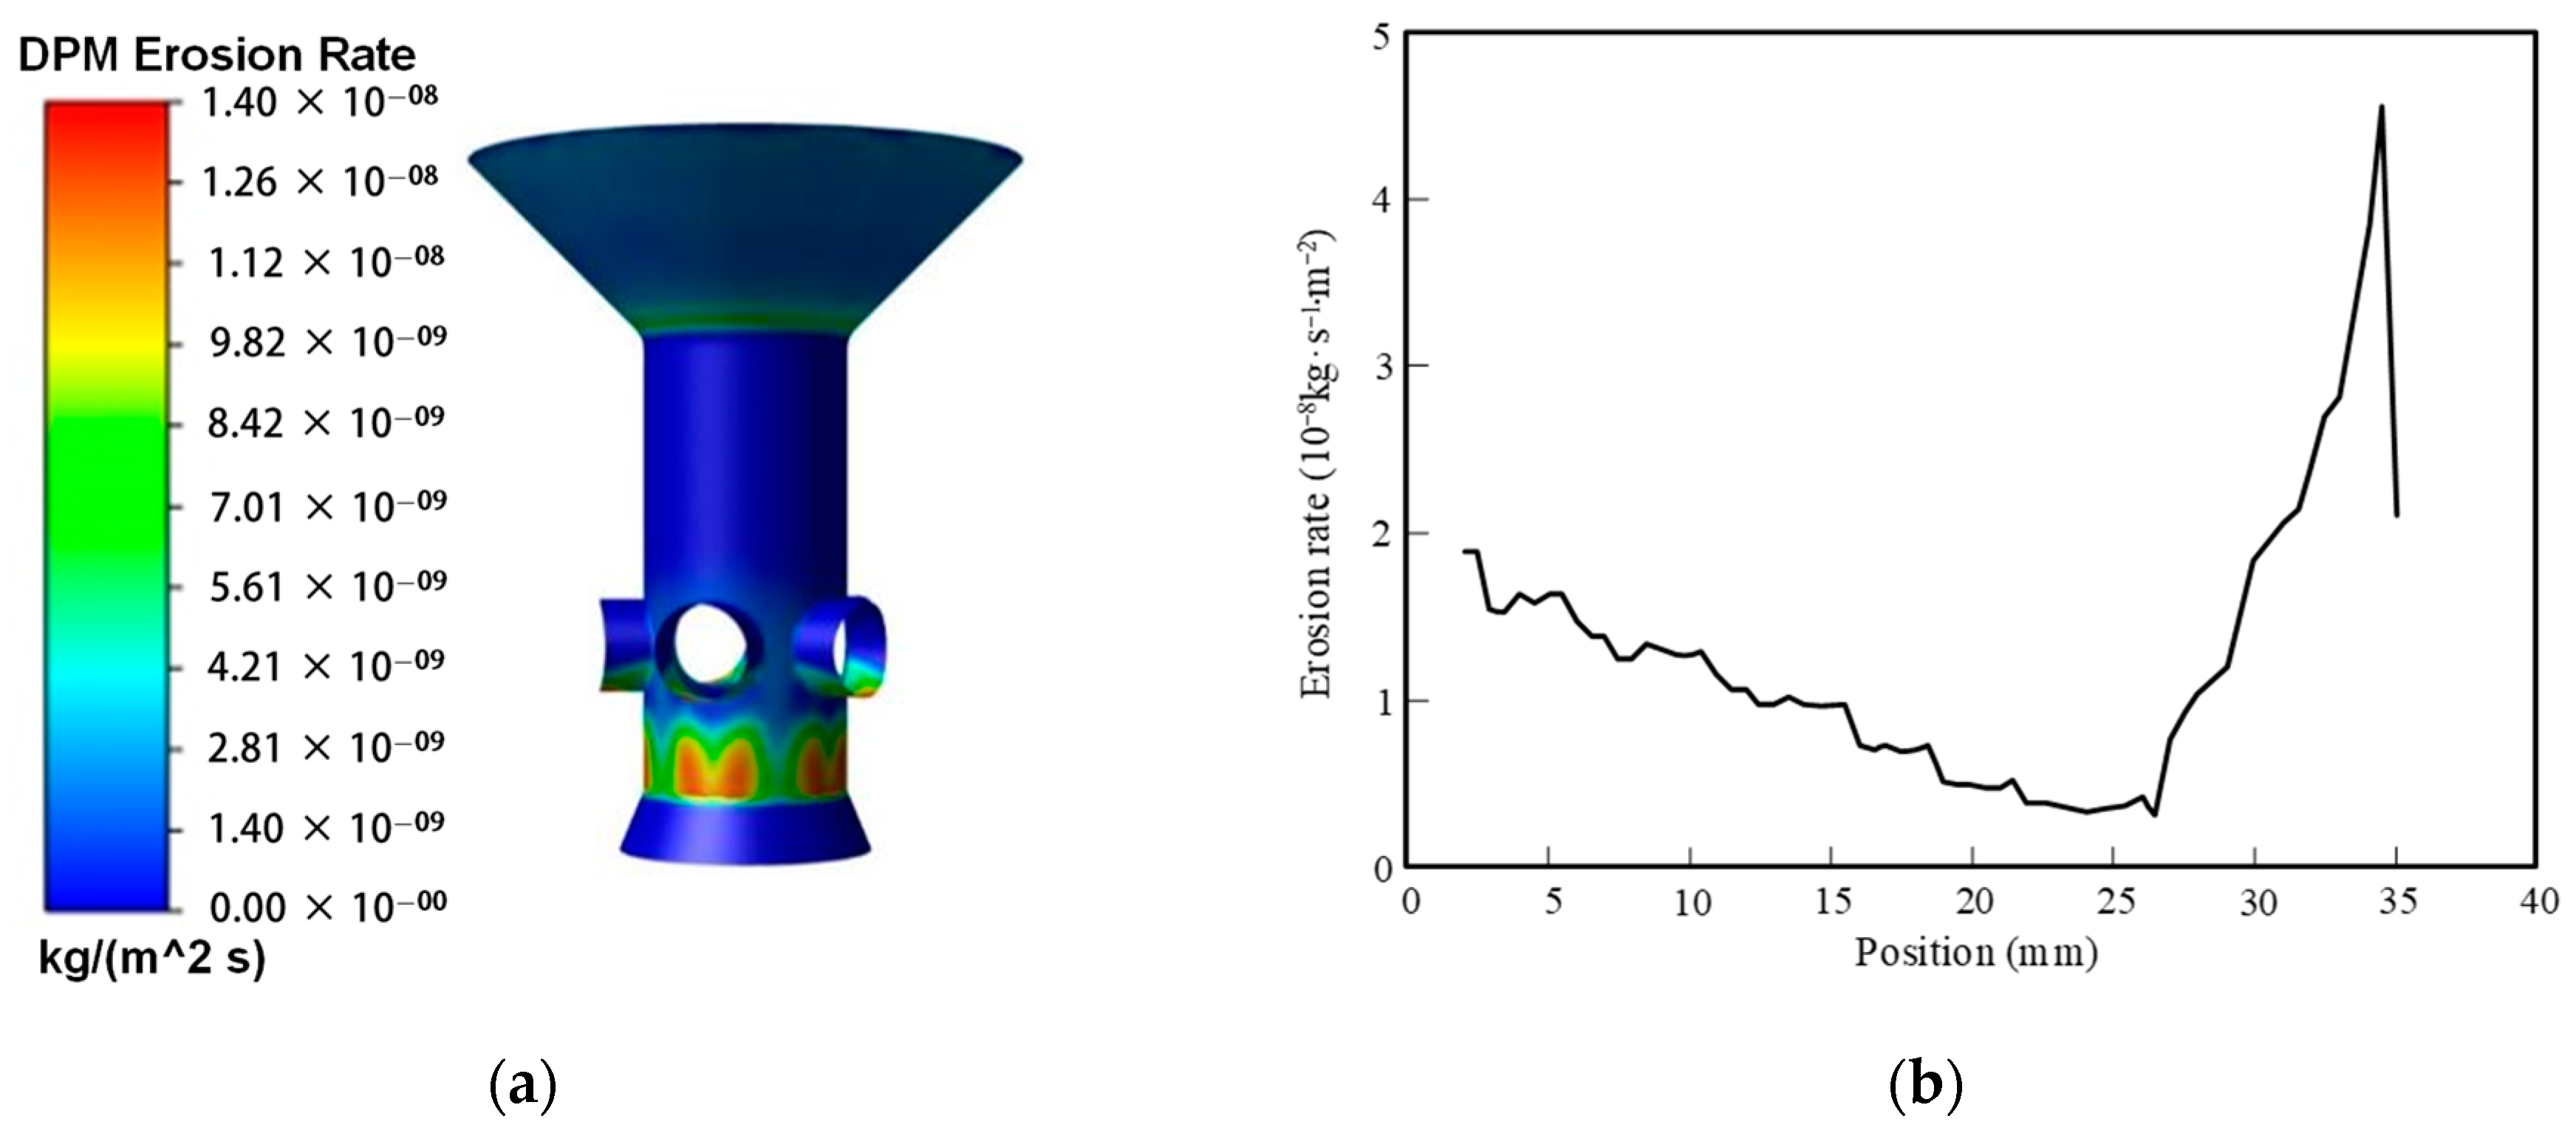
5. Valve Core Structure Optimization

5.1. Reduce the Number of Holes

Through the analysis of the particle motion curve and volume distribution in the spool in the previous section, it can be seen that the existence of the side hole of the spool will affect the trajectory of the particles, resulting in the movement disorder of the solid particles at the lower end of the side hole. Therefore, without changing the flow capacity of the side hole of the bypass valve, reducing the number of side holes may reduce the degree of disorder of the particles, thereby reducing wear. Therefore, the number of side holes is reduced from five to four, and the spool is simulated; the results are shown in Figure 7. It can be seen that the erosion wear area is mainly concentrated in the variable diameter of the valve core. The erosion of the cylindrical wall under the side hole is not obvious, but the erosion wear on the overall wall of the valve core appears uniform distribution. The overall change trend of the erosion wear rate curve is roughly the same as that of the valve core erosion curve of the conventional five bypass side holes, but the erosion wear rate is reduced to a certain extent, and the maximum erosion wear rate is reduced from 5.89 × 10⁻⁸ kg·S−1·m−2 to 1.51 × 10⁻⁸ kg·S−1·m−2. The reason for the relief of erosion is preliminarily speculated to be that after the number of bypass side holes decreases and the diameter of the side holes increases, the solid particles are less affected by the fluid flow at the side hole position, and the impact of the fluid on the wall surface during the movement slows down, thereby reducing the wear rate.

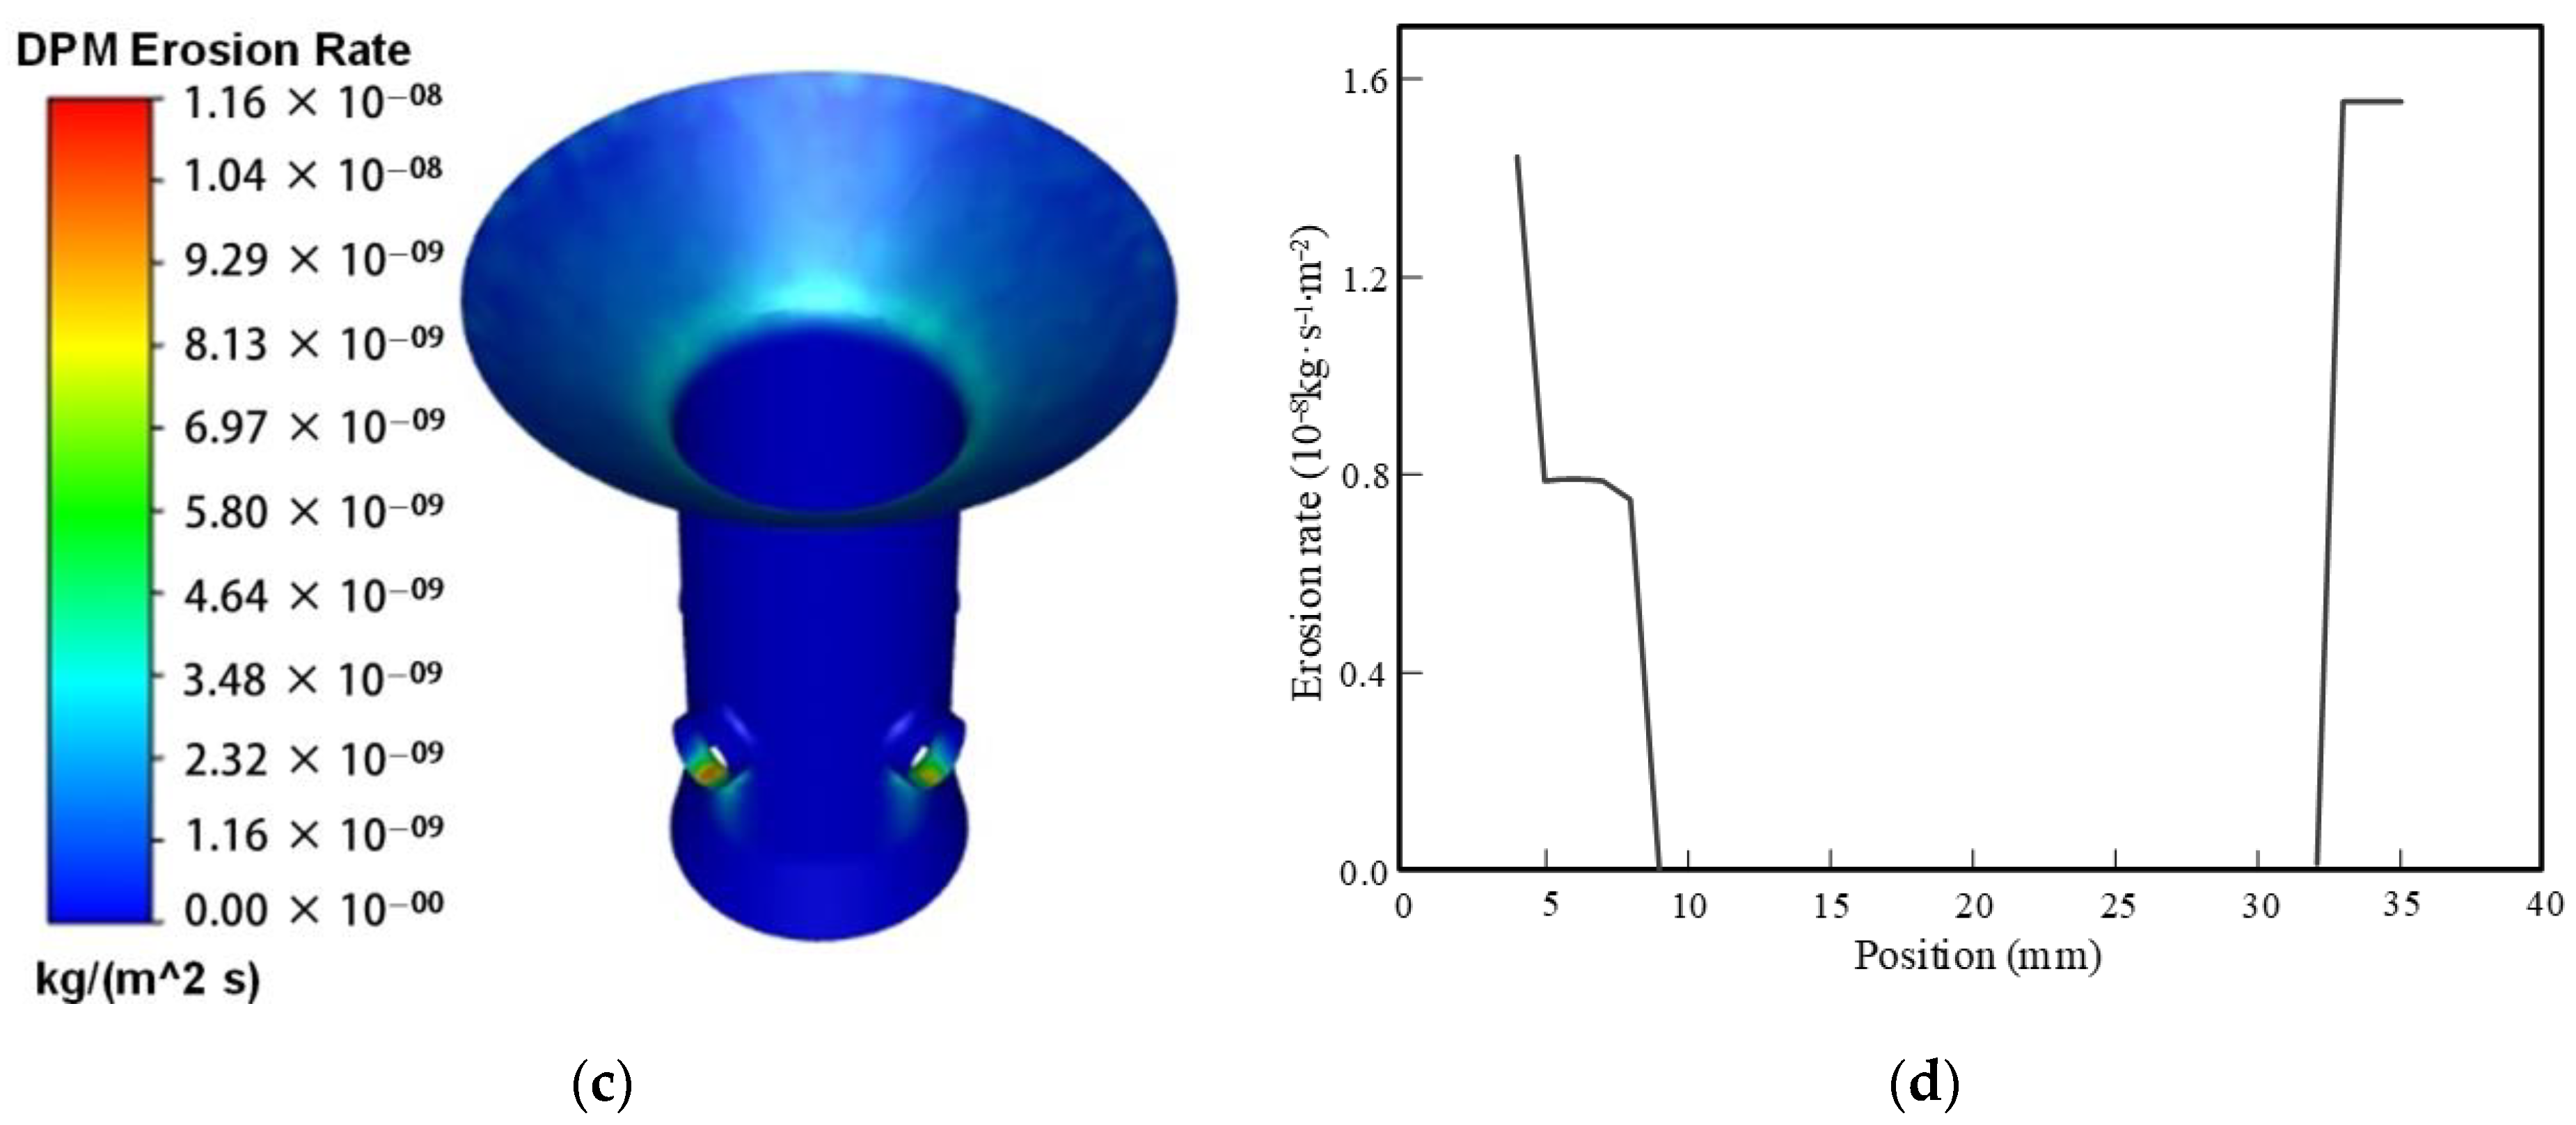
5.2. Valve Core Flow Channel Optimization

By analyzing the velocity and pressure gradient sections inside the valve core in the previous section, it can be concluded that another reason for the occurrence of turbulence at the lower end of the valve core is the abrupt changes in velocity and pressure on the upper and lower surfaces of the valve core. If the vertically ejected outlet channel is replaced with a tapered inclined surface, the abrupt trajectory of particles during motion can be effectively reduced, thereby reducing erosion. The simulation results are shown in Figure 8.
Figure 8a,b show the simulation results of changing the flow channel to a tapered one when the valve core has five holes; it can be seen that erosion still occurs in the main erosion area analyzed earlier. The erosion on the vertical wall at the lower end of the side hole shows a decreasing trend, while the overall erosion rate increases in the tapered surface. However, the erosion rates in both parts are lower than the erosion rate in the fully vertical case, and the maximum erosion wear rate decreases from 5.89 × 10⁻⁸ kg·S−1·m−2 to 1.40 × 10⁻⁸ kg·S−1·m−2. A preliminary analysis suggests that the reason for the reduction in erosion is that the modified inclined wall increases the area of particle motion, resulting in a larger particle flow region and a smaller probability of cutting material when impacting the wall.
The simulation results for the valve core flow channel, which was further optimized to have four holes and a 35° taper, are shown in Figure 8c,d. From the figures, it can be observed that opening below the holes increases the particle’s motion area, resulting in a more pronounced reduction in erosion. Similar to the original structure, the erosion areas at the varying diameter and valve core side holes remain unchanged, but the erosion rates have decreased. The most significant change is the substantial alleviation of erosion at the lower end of the valve core side holes, with only a small portion of the area being affected. Apart from changes in the erosion areas, the maximum erosion wear rate has decreased from 5.89 × 10⁻⁸ kg·S−1·m−2 to 1.16 × 10⁻⁸ kg·S−1·m−2. This solution exhibits the most significant reduction in erosion compared to other alternatives. Therefore, the number of bypass side holes has been improved to 4, and an angled opening has been added at the lower end of the flow channel.
Further simulations were conducted on the erosion rate of different opening angles in the flow channel, and the results are shown in Figure 9. From Figure 9, it can be observed that when the lower opening angle is around 45°, the erosion rate is relatively small, and the erosion phenomenon is mitigated. It can also be noticed that the erosion rate decreases when the opening angle exceeds 50°. However, based on the analysis of actual operating conditions, it can be inferred that if the lower opening angle of the flow channel is too large, the amount of drilling fluid flowing out through the side holes, which is originally intended to pass through the bypass valve, will be reduced. This would affect the communication between the interior and exterior channels of the drill string. Therefore, selecting an opening angle of 45° not only meets the operational requirements but also helps alleviate erosion.

6. Optimization Effect Evaluation

This research adopts a back propagation (BP) neural network to establish a prediction model for valve core life. It predicts and compares the life spans of the original and optimized valve cores, aiming to evaluate the effectiveness of the optimization. During the model establishment process, erosion impact parameters should be selected first. Then, a life prediction model should be built based on these parameters to evaluate the optimization effect of the valve core. The specific steps are as follows.

6.1. Factors Affecting Erosion Impact Selection

This research discusses the factors influencing erosion simulation. The main factors considered include fluid velocity, fluid viscosity, particle diameter, and sand concentration. The simulation results for different erosion factors are shown in Figure 10. As shown in Figure 10a, with an increase in the inlet fluid velocity, the erosion rate gradually increases. This is because as the fluid velocity increases, the kinetic energy of the particles impacting the wall surface also increases, leading to an increase in shear stress on the wall surface. Consequently, the cutting amount on the wall surface increases, resulting in more severe erosion. As shown in Figure 10b, as the fluid viscosity increases, the erosion rate gradually decreases. This is because when the fluid viscosity increases, solid particles experience greater flow resistance while moving with the fluid. This leads to larger forces between the fluid and solid phases. Consequently, the probability of solid particles impacting the inner wall of the valve core decreases, resulting in a smaller erosion rate. As shown in Figure 10c, with an increase in particle diameter, the erosion rate gradually increases. This is because when the diameter of solid particles increases, the likelihood of these particles separating from the liquid phase increases. These particles directly impact the wall surface of the valve core, causing an increase in the maximum erosion rate of the valve core. As shown in Figure 10d, with an increase in sand concentration, the erosion rate gradually increases. This is because an increase in sand concentration means an increase in the number of solid particles within the same unit volume of fluid. Consequently, the frequency of solid particle impacts on the wall surface of the valve core increases, leading to an increase in the maximum erosion rate of the valve core.

6.2. Valve Core Life Prediction Model

A BP neural network is a machine learning model that processes information by simulating human brain neuron connections. As shown in Figure 11, the basic method includes: First, a multi-layer network structure is established, which consists of an input layer, a hidden layer, and an output layer. Then, the input data is transmitted to the network, the weighted sum between the layers is calculated, and the output is generated by the activation function. Then, using the error between the actual output and the expected output, the weights of each layer are adjusted by the back propagation algorithm to minimize the loss function. This process continues to iterate until the model converges and finally achieves effective prediction of new data. In this way, a BP neural network can learn complex nonlinear relationships and is widely used in classification, regression, and prediction tasks. In this paper, the process of constructing the erosion life prediction model of the valve core can be regarded as a function process of fitting multiple independent variables to solve the single dependent variable. Using the simulation data as a sample, combined with the mathematical formula of the working life of the valve core derived below, the erosion life prediction model of the valve core is established. On this basis, the error analysis of the established model is further carried out.
During the construction of a valve core erosion life prediction model, the erosion rate at each location on the main erosion surface of the valve core changes over time. However, the wall thickness of the erosion damage continues to thin but does not reach the failure thickness. Therefore, a correction factor K is introduced, resulting in Equation (8).
E = K E R ,
where K is the correction coefficient with a value of 0.1, and E represents the erosion rate.
Equation (9) can be obtained by converting the erosion rate E, obtained from the simulation calculation results, into the mass loss rate MR at the lower end of the valve core.
M R = E S = K E R S ,
where S is the area of the main erosion zone at the bottom of the valve core, ER is the maximum erosion rate, and MR is the mass loss rate.
Equation (10) is obtained by converting the calculated mass loss rate to the volume loss rate VR.
V R = M R ρ ,
Substituting Equation (9) into Equation (10) yields Equation (11).
V R = K E R S ρ ,
where VR represents the volume loss rate.
Equation (12) for converting the volume loss rate VR into the unit time erosion depth LR is as follows.
L R = V R S ,
where LR is the time erosion depth.
Substituting Equation (11) into Equation (12) yields Equation (13).
L R = K E R ρ ,
The numerical value of LR is related to the wall material. This is because when a wall material with a higher density is chosen, the valve core structure becomes more compact, resulting in a stronger ability to withstand particle impacts. Consequently, under the same test conditions, the solid particles cause less erosion depth on the wall material after impact.
Assuming the final allowable erosion depth is LR, and the erosion depth per unit time is lR, the valve core’s service life T can be obtained under the corresponding maximum erosion rate.
T = L R l R
where T represents the service life of the valve core.
To make the constructed neural network model better fit the fitting curve and achieve more accurate results, careful selection of the weights, thresholds, and structure of the BP neural network is necessary. The erosion life prediction model for valve spools established in this research involves influencing factors such as fluid velocity, fluid viscosity, particle diameter, and sand concentration. Therefore, the number of nodes in the input layer is determined to be 4. The number of nodes in the output layer corresponds to the service life of the valve spool, so the number of output nodes is 1. When the thresholds, weights, and algorithms are the same, the relationship between the prediction error percentage and mean square deviation of the BP neural network and the output layer function is shown in Table 1.
From Table 1, it can be observed that the choice of hidden layer and output layer functions has an impact on the prediction capability of the BP neural network model. After comparing the mean squared error and error percentage under different combinations in Table 1, it is determined to use the tansig function as the activation function for the hidden layer and the purelin function as the activation function for the output layer. To improve the accuracy of the model, when setting the learning accuracy of the model, it cannot be set too high; otherwise, the calculation will not converge. Moreover, the learning accuracy of the model cannot be set too low either; otherwise, the model will not meet the prediction requirements.
The learning rate of a neural network is typically selected between 0 and 1. A higher learning rate can expedite the training process of the neural network. However, if the chosen learning rate is too large, it will significantly cause fluctuations in the constructed network model during the learning and training process, preventing convergence. Conversely, if the chosen learning rate is too small, it may lead to an excessively long learning and training time for the network, and the weights will not be able to stabilize. Based on the above analysis, this study selects a learning rate of 0.05 and sets the number of training steps to 2000.
In practical applications, this research uses 45 sets of training samples, 25 sets of orthogonal experimental tables, and 20 sets of single-factor analysis for the four influencing factors of fluid velocity, fluid viscosity, particle diameter, and sand concentration. There are 42 sets of samples used as learning samples, and the remaining 3 sets are used as prediction samples. Based on the above sample classification setting, the constructed BP network is trained and learned using the samples.
The line graph in Figure 12a compares three sets of predicted data with the expected data. It can be observed that the trends of the three sets of predicted output lines are roughly similar to the expected output line. Additionally, the three data points on the predicted output lines are all located below the corresponding data points on the expected output line, indicating a close similarity in values. Figure 12b shows a line graph of the prediction sample errors for the three sets. It is evident that the absolute prediction errors of the neural network for the three sets of samples are 7.5%, 12.5%, and 15%, respectively, with an average of 11.67%, which is less than 15%. Therefore, the predictive model constructed using the BP neural network can accurately predict the erosion life of the valve core.
Using the established erosion life prediction model, the predicted service life of the original valve core under different flow rates is calculated, as shown in Figure 13a. It can be seen that the service life of the valve core gradually decreases with increasing flow rate, with a maximum flow rate of 17.5 L/s and a maximum service life of approximately 130 h. In the initial stage of flow rate increase, from 8 L/s to 12 L/s, the predicted service life of the valve core shows an apparent decreasing trend. This is because when the flow rate changes within the initial range, the predicted life is highly sensitive to changes in flow rate parameters. However, after the flow rate exceeds 12 L/s, the influence of the flow rate on the bypass valve decreases. This is because when the flow rate reaches values outside the reasonable range, the bypass function of the bypass valve no longer exists, and erosion will cause the valve core to fail. The relationship between the flow rate and the predicted service life shown in the graph corresponds well to the actual performance of the bypass valve.
Further prediction of the optimized valve core life yields the results shown in Figure 13b. The optimized valve core can accommodate a flow rate of up to 28 L/s, with a maximum service life of approximately 228 h. The upper limit of the applicable flow rate and the maximum service life are increased by approximately 60% and 75.4%, respectively, compared to the original valve core. In the process of increasing the flow rate from 4 L/s to 23 L/s, the decreasing trend of the predicted service life of the valve core is apparent for the optimized valve core. However, after the flow rate exceeds 23 L/s, the influence of the flow rate on the bypass valve decreases, and the decreasing trend of the predicted service life becomes more moderate. This is because the optimized valve core has a wider range of applicable flow rates, allowing for adjustment and diversion even when the flow rate exceeds the optimal range, thereby avoiding sudden changes. The curve depicted in the graph reflects the actual situation of the bypass valve quite well.

7. Conclusions and Discussion

This research focused on the erosion damage of bypass valves in positive displacement motors and achieved the following three results through in-depth research. Firstly, an erosion damage simulation model of the bypass valve was established, and the internal flow field of the valve core was simulated using Ansys Fluent software. The flow characteristics of the drilling fluid in the valve core were obtained, and it was identified that the side holes and flow path structure of the valve core were the main causes of erosion. Secondly, two optimization schemes were proposed: reducing the number of bypass side holes and optimizing the flow path structure. Specifically, the number of bypass side holes was reduced to 4, and the flow path cone angle was optimized to 45°. Simulation results showed that the erosion wear rate of the optimized valve core was significantly reduced, and its service life was effectively improved. Thirdly, a valve core life prediction model was established. A BP neural network was used to establish the valve core life prediction model, and the optimization effect was evaluated. The results showed that the applicable flow range and maximum service life of the optimized valve core increased by about 60% and 75.4%, respectively, verifying the effectiveness of the optimization scheme. The research is of great significance to reduce the erosion damage of the bypass valve, prolong the service life of the drilling tool in the well, reduce the number of trips, and reduce the drilling cost; it can also effectively improve the service life of the whole set of volumetric downhole power drilling tools.
However, the research results still have room for further study. First, the model of the inner flow field of the valve core established in this paper is fixed, but the erosion wear of the fluid and solid particles on the valve core wall is essentially a dynamic process. In future erosion research, the law of erosion wear of the wall surface with time can be added to explore the influence of different times on the error of the final predicted life result, so as to modify the prediction model. Second, the erosion wear phenomenon is a complex result affected by multiple factors. This research only considers the influence of four main factors on erosion wear, but due to the limitations of the experimental conditions, it is impossible to simulate and verify some non-main factors such as particle shape and particle impact angle in the research process, so future research can continue to supplement this. Thirdly, due to the limitations of experimental conditions and funding, in this research, only laboratory tests were carried out, and no drilling field tests were carried out. Therefore, in the future, if there is an actual drilling environment, field tests can be carried out with the help of this actual drilling environment, and the field test results can be compared with the simulation results to verify and further modify the model.

Author Contributions

Methodology, Y.Z.; software, L.Z.; validation, P.S. and Y.G.; formal analysis, L.K.; resources, Y.W.; data curation, Y.Z.; writing—original draft preparation, Y.Z.; writing—review and editing, L.Z.; visualization, L.Z.; supervision, P.S.; project administration, L.Z. All authors have read and agreed to the published version of the manuscript.

Funding

This research was funded by the enterprise-level scientific and technological research project ‘Research on drilling equipment and technology of small radius and high build-up rate’, grant number GSKJ-24-127.

Data Availability Statement

The data presented in this study is available on request from the corresponding authors, and the dataset was jointly completed by the team, so the data is not publicly available.

Acknowledgments

The authors also thank former researchers for their excellent work. Their results were fundamental for the presented academic study.

Conflicts of Interest

Authors Yanbo Zhang and Lei Zhang were employed by Shenhua Geological Exploration Co., Ltd. The remaining authors declare that the research was conducted in the absence of any commercial or financial relationships that could be construed as a potential conflict of interest.

References

  1. Mazurek, M.; Gimmi, T.; Zwahlen, C.; Aschwanden, L.; Gaucher, E.; Kiczka, M.; Rufer, D.; Wersin, P.; Fernandes, M.M.; Glaus, M.; et al. Swiss deep drilling campaign 2019–2022: Geological overview and rock properties with focus on porosity and pore-space architecture. Appl. Geochem. 2023, 159, 105839. [Google Scholar] [CrossRef]
  2. Zhao, H.; Wu, H.; Shen, L.; Zhu, Z.; Shan, Y. Research on slim-hole drilling technology for shale gas geological survey in China. Pet. Res. 2024, in press. [Google Scholar] [CrossRef]
  3. Adumene, S.; Khan, F.; Adedigba, S.; Mamudu, A.; Rosli, M.I. Offshore oil and gas development in remote harsh environments: Engineering challenges and research opportunities. Saf. Extrem. Environ. 2023, 5, 17–33. [Google Scholar] [CrossRef]
  4. Du, K.; Xi, W.; Huang, S.; Zhou, J. Deep-sea Mineral Resource Mining: A Historical Review, Developmental Progress, and Insights. Min. Metall. Explor. 2024, 41, 173–192. [Google Scholar] [CrossRef]
  5. Fernando IP, S.; Jayawardena, T.U.; Wu, J. Marine proteins and peptides: Production, biological activities, and potential applications. Food Innov. Adv. 2023, 2, 69–84. [Google Scholar] [CrossRef]
  6. Wubben, E.; Veenstra, T.; Witkowski, J.; Raffi, I.; Hilgen, F.; Bos, R.; van Dijk, J.; Lathouwers, Y.; Spiering, B.; Vennema, L.; et al. Astrochronology of the Miocene Climatic Optimum record from Ocean Drilling Program Site 959 in the eastern equatorial Atlantic. Newsl. Stratigr. 2023, 56, 457–484. [Google Scholar] [CrossRef]
  7. Li, X.; Xiong, L.; Xie, W.; Gao, K.; Shao, Y.; Chen, Y.; Yu, Y.; Kou, B.; Lu, Q.; Zeng, J.; et al. Design and experimental study of core bit for hard rock drilling in deep-sea. J. Mar. Sci. Eng. 2023, 11, 306. [Google Scholar] [CrossRef]
  8. Johnston, N.; Dumnov, D.; Melling, J. Modelling of Pumps and Motors As Source Flow Ripple and Source Impedance. In Fluid Power Systems Technology; American Society of Mechanical Engineers: New York, NY, USA, 2023; Volume 87431, p. V001T01A008. [Google Scholar]
  9. Lu, J.X.; Kong, L.R.; Wang, Y.; Feng, C.; Gao, Y.L. Optimized parameters of downhole all-metal PDM based on genetic algorithm. Pet. Sci. 2024, 21, 2663–2676. [Google Scholar] [CrossRef]
  10. Ba, S.; Pushkarev, M.; Kolyshkin, A.; Song, L.; Yin, L.L. Positive displacement motor modeling: Skyrocketing the way we design, select, and operate mud motors. In Proceedings of the Abu Dhabi International Petroleum Exhibition and Conference, Abu Dhabi, United Arab Emirates, 7–10 November 2016; SPE: Kuala Lumpur, Malaysia, 2016; p. D021S053R005. [Google Scholar]
  11. Nguyen, T.C.; Al-Safran, E.; Nguyen, V. Theoretical modeling of positive displacement motors performance. J. Pet. Sci. Eng. 2018, 166, 188–197. [Google Scholar] [CrossRef]
  12. Cui, G.; Xu, J.; Zhang, L.; Jin, N.; Zhao, J.; Wang, Y. Increasing Drilling Speed in Hard-to-Drill Formations with Various Types of Tools. Chem. Technol. Fuels Oils 2023, 59, 841–849. [Google Scholar] [CrossRef]
  13. Soares, M.M.; dos Passos, A.G.L.G.; De Lima, F.M.; De Souza, M.F.A.; de Souza Moreira, J.; Martins, A.F.V.; Pioli, R.M.; Spredemann, R.; Buzza, J.E.H.; Fernandes, F.B. ROP Optimization and Improved Wellbore Quality with New BHA and Drill Bits Modeling in Soft Shallow Formations. In Proceedings of the Offshore Technology Conference Brasil, Rio de Janeiro, Brazil, 24–26 October 2023; OTC: Tucson, AZ, USA, 2023; p. D011S006R001. [Google Scholar]
  14. Alattar, A.; Mustafa, M.M.; Nobre, D.; Applegate, R.; Pushkarev, M.; Dashti, S.; Saleh, K.; Saffar, A.H.; Harbi, A.A.; Anas, M. New Positive Displacement Motor Technology Significantly Improves the Drilling Performance through Challenging and Abrasive Strata in Northern Kuwait. In Proceedings of the Abu Dhabi International Petroleum Exhibition and Conference, Abu Dhabi, United Arab Emirates, 13–16 November 2017; SPE: Kuala Lumpur, Malaysia, 2017; p. D011S008R003. [Google Scholar]
  15. Tikhonov, V.S.; Baldenko, F.D.; Bukashkina, O.S.; Liapidevskii, V.Y. Effect of hydrodynamics on axial and torsional oscillations of a drillstring with using a positive displacement motor. J. Pet. Sci. Eng. 2019, 183, 106423. [Google Scholar] [CrossRef]
  16. Liu, H.; Ma, T.; Chen, P.; Wang, X.; Wang, X. Mechanical behaviors of bottom hole assembly with bent-housing positive displacement motor under rotary drilling. Arab. J. Sci. Eng. 2019, 44, 6029–6043. [Google Scholar] [CrossRef]
  17. Shi, X.; Jiao, Y.; Yang, X.; Liu, J.; Zhuo, Y. Establishment of Drill-String System Dynamic Model with PDM and Influence of PDM Parameters on Stick–Slip Vibration. Arab. J. Sci. Eng. 2024, 49, 8727–8739. [Google Scholar] [CrossRef]
  18. Liagov, I.; Liagov, A.; Liagova, A. Optimization of the Configuration of the Power Sections of Special Small-Sized Positive Displacement Motors for Deep-Penetrating Perforation Using the Technical System “Perfobore”. Appl. Sci. 2021, 11, 4977. [Google Scholar] [CrossRef]
  19. Guanghui, Z.; Guipeng, L. Elastic-plastic Fracture Analysis of External Thread of Drive Shaft Shell of a Positive Displacement Motor. Mechanics 2020, 26, 375–382. [Google Scholar]
  20. Liu, Y.; Lian, Z.; Xia, C.; Qian, L.; Liu, S. Fracture failure analysis and research on drive shaft of positive displacement motor. Eng. Fail. Anal. 2019, 106, 104145. [Google Scholar] [CrossRef]
  21. Liu, Y.; Lian, Z.; Zou, J.; Deng, C.; He, Y. Fracture failure analysis and research on thread joint of drive shaft shell of positive displacement motor. Eng. Fail. Anal. 2020, 118, 104805. [Google Scholar] [CrossRef]
  22. Zhu, X.; Lin, D.; Li, J. Failure analysis and structure optimization of the connecting thread of driving shaft in positive displacement motor. Adv. Mech. Eng. 2016, 8, 1687814016652313. [Google Scholar] [CrossRef]
  23. Zhang, H.L.; Zang, Y.H.; Mi, K.F.; Guo, T.M.; Guo, C.; Gao, Y. Study on the Coupling Law of the Stator and Rotor of Positive Displacement Motor with the Application of Highly Filled Rubber. In Proceedings of the International Field Exploration and Development Conference, Xi’an, China, 16–18 November 2022; Springer Nature: Singapore, 2022; pp. 2434–2450. [Google Scholar]
  24. Alvarez, A.A.; Boscan, J. Predicting rotor-stator fit in positive displacement motors PDMs. In Proceedings of the SPE/IADC Drilling Conference and Exhibition, The Hague, The Netherlands, 14–16 March 2017; SPE: Kuala Lumpur, Malaysia, 2017; p. D031S015R005. [Google Scholar]
  25. Yang, S. A New Design of Vibration Damping Structure for Positive Displacement Motor. Acad. J. Sci. Technol. 2024, 9, 146–152. [Google Scholar] [CrossRef]
  26. Li, Y.F.; Lin, Z.L.; Li, M.; Zou, Y.; Huang, P.P.; Hao, W.W.; Wang, H. Discussion on Mechanical and Drilling Performance of the Positive Displacement Motors of Wall Thickness Rubber. In Proceedings of the International Field Exploration and Development Conference, Wuhan, China, 20–22 September 2023; Springer Nature: Singapore, 2023; pp. 958–971. [Google Scholar]
  27. Zhang, J.; Liu, Y.; Zhang, H. Design and Mechanics Analysis of the Deep Cavity Tapered Roller Thrust Bearing Used in a Positive Displacement Motor. Trans. FAMENA 2019, 43, 53–64. [Google Scholar] [CrossRef]
  28. Huang, X.; Chen, Y.; Zhuo, H.; He, X. Research on the wear failur mechanism of high speed positive displacement motor bearings. Int. J. Mechatron. Appl. Mech. 2024, 127. [Google Scholar] [CrossRef]
  29. Zhang, J.; Han, C.; Liang, Z. Physics of failure analysis of power section assembly for positive displacement motor. J. Loss Prev. Process Ind. 2016, 44, 414–423. [Google Scholar] [CrossRef]
  30. Chen, X.; Gao, D.; Guo, B.; Feng, Y. Real-time optimization of drilling parameters based on mechanical specific energy for rotating drilling with positive displacement motor in the hard formation. J. Nat. Gas Sci. Eng. 2016, 35, 686–694. [Google Scholar] [CrossRef]
  31. El-Sayed, I.; Hopkins, Z.; Dupriest, F.; Noynaert, S.F. Theoretical Vs. Actual Mud Motor Performance in Unconventional Formations and Strategies to Extend Motor Life. In Proceedings of the SPE/IADC Drilling Conference and Exhibition, Galveston, TX, USA, 3–5 March 2020; SPE: Kuala Lumpur, Malaysia, 2020; p. D091S010R002. [Google Scholar]
  32. Kong, L.; Wang, Y.; Wu, C.; Yang, S. Self-Powered Multifunctional Sensor of Positive Displacement Motor Based on Triboelectric Nanogenerator. IEEE Sens. J. 2021, 21, 18593–18600. [Google Scholar] [CrossRef]
  33. Koulidis, A.; Ahmed, S. Positive Displacement Motor Condition and Performance Prediction Using Surface and Downhole Sensor Data; IntechOpen: London, UK, 2024. [Google Scholar]
  34. Galo Fernandes, R.A.; Silva Rocha Rizol, P.M.; Nascimento, A.; Matelli, J.A. A Fuzzy Inference System for Detection of Positive Displacement Motor (PDM) Stalls during Coiled Tubing Operations. Appl. Sci. 2022, 12, 9883. [Google Scholar] [CrossRef]
  35. Hou, L.; Wu, J. Mechanism analysis and preventive measures of drill string leakage caused by corrosion. Oil Drill. Technol. 2006, 26–28. [Google Scholar] [CrossRef]
Figure 1. Schematic diagram of bypass valve structure and working steps. (a) Schematic diagram of positive displacement motor and bypass valve structure; (b) photo of bypass valve; (c) schematic diagram of bypass valve working steps.
Processes 12 01953 g001aProcesses 12 01953 g001b
Figure 2. Flow field simulation results. (a) Velocity and pressure contour plots of the liquid phase flow in the YOZ section; (b) velocity contour plot of a typical cross-section.
Processes 12 01953 g002
Figure 3. Particle motion simulation results. (a) Velocity contour plot at y = 80 mm cross-section. (b) Velocity profile along the monitoring line.
Processes 12 01953 g003
Figure 4. Histogram of particle volume fraction distribution.
Processes 12 01953 g004
Figure 5. The comparison between the simulated erosion area and the physical map. (a) Valve core erosion physical diagram. (b) Valve core erosion simulation cloud map.
Processes 12 01953 g005
Figure 6. Measured erosion depth.
Processes 12 01953 g006
Figure 7. Simulation results figure. (a) Erosion simulation cloud; (b) Erosion wear rate curve diagram.
Processes 12 01953 g007
Figure 8. Simulation results of valve core flow channel optimization. (a) Erosion simulation cloud map of 5-hole tapered flow channel; (b) erosion rate curve of 5-hole tapered flow channel erosion; (c) erosion simulation cloud map of 4-hole tapered flow channel; (d) erosion rate curve of 4-hole tapered flow channel.
Processes 12 01953 g008aProcesses 12 01953 g008b
Figure 9. Erosion rates at different opening angles.
Processes 12 01953 g009
Figure 10. Simulation results of erosion impact factors. (a) Erosion rate under different flow velocities; (b) erosion rate under different fluid viscosities; (c) erosion rate under different particle diameters; (d) erosion rate under different sand concentrations.
Processes 12 01953 g010
Figure 11. BP neural network topology diagram.
Processes 12 01953 g011
Figure 12. Accuracy evaluation of the BP neural network prediction. (a) Comparison of three sets of predicted data and expected data; (b) error of three sets of predicted data.
Processes 12 01953 g012
Figure 13. Valve core life prediction results. (a) Original valve core life prediction results; (b) optimized valve core life prediction results.
Processes 12 01953 g013
Table 1. Prediction errors corresponding to different activation functions.
Hidden Layer FunctionOutput Layer FunctionError Percentage (%)Mean Squared Error
LogsigTansig40.630.9025
LogsigPurelin0.080.0001
LogsigLogsig352.65181.2511
TansigTansig31.91.1733
TansigLogsig340.9162.9598
TansigPurelin1.70.0107
PurelinLogsig343.36143.7633
PurelinTansig120.08113.0281
PurelinPurelin196.4999.0121
Disclaimer/Publisher’s Note: The statements, opinions and data contained in all publications are solely those of the individual author(s) and contributor(s) and not of MDPI and/or the editor(s). MDPI and/or the editor(s) disclaim responsibility for any injury to people or property resulting from any ideas, methods, instructions or products referred to in the content.

