Article

Advancements in Supercritical Carbon Dioxide Brayton Cycle for Marine Propulsion and Waste Heat Recovery

by
Bashar Alzuwayer
1,
Abdulwahab Alhashem
2,
Mohammad Albannaq
2 and
Khaled Alawadhi
1,*
1
Department of Automotive and Marine Engineering Technology, College of Technological Studies, P.A.A.E.T., Kuwait City 70654, Kuwait
2
Department of Mechanical Power and Refrigeration Technology, College of Technological Studies, P.A.A.E.T., Kuwait City 70654, Kuwait
*
Author to whom correspondence should be addressed.
Processes 2024, 12(9), 1956; https://doi.org/10.3390/pr12091956
Submission received: 30 July 2024 / Revised: 8 September 2024 / Accepted: 9 September 2024 / Published: 12 September 2024
(This article belongs to the Section Sustainable Processes)

Abstract

:
The Supercritical Carbon Dioxide Brayton Cycle (sCO2-BC) is a highly efficient and eco-friendly alternative for marine propulsion. The adoption of sCO2-BC aligns with the industry’s focus on sustainability and can help meet emission regulations. In this context, the current study introduces a cascade system that harnesses the exhaust gases from a marine Gas Turbine Propulsion System to serve as a heat source for a bottoming Supercritical Carbon Dioxide Brayton Cycle (sCO2-BC), which facilitates an onboard heat recovery system. The investigation primarily focuses on the recompression cycle layouts of the sCO2-BC. To assess the performance of the bottoming cycle layouts and the overall cascade system, various parameters of the recompression sCO2-BC are analyzed. These parameters include the mass flow rate of CO2 in the bottoming cycle and the effectiveness of both the low-temperature recuperator (LTR) and the high-temperature recuperator (HTR). For conducting the cycle simulations, two codes are built and integrated; this first code models the thermodynamic cycle, while the second code models the recuperators. The research shows that incorporating the sCO2 Brayton Cycle as a bottoming cycle has the potential to greatly improve the efficiency of the entire system, increasing it from 54% to 59%. Therefore, it provides a useful framework for advancing energy-efficient gas turbine systems and future research.

1. Introduction

The Supercritical Carbon Dioxide Brayton Cycle (sCO2-BC) is an advanced thermodynamic cycle that is notable by its compact design and high thermal efficiency. The cycle effectively converts thermal energy into mechanical work by utilizing supercritical CO2 as the working fluid, which benefits from the fluid’s high density and superior heat transmission properties [1]. sCO2-BC operates at higher pressures and temperatures than traditional thermodynamic cycles such as the Rankine cycle, which leads to improved overall performance. Integrating heat recuperation techniques further enhances its efficiency by capturing and reusing waste heat, thereby minimizing energy losses and maximizing power output [2]. This cycle is highly efficient and has been implemented in a diverse array of industries. In industrial contexts, it is employed for waste heat recovery, which involves the conversion of excess heat from processes such as gas turbines or diesel engines into mechanical work. This not only enhances energy efficiency but also decreases operational expenses [3]. This cycle is also being progressively implemented in the power generation sector, with a particular emphasis on solar, geothermal, and nuclear plants [4]. It is a preferable choice for power generation from concentrated solar power systems or advanced nuclear reactors, where space, efficiency, and safety are of paramount importance, due to its capacity to operate at elevated temperatures. The sCO2 Brayton Cycle is notably well suited for marine ships, despite its diverse range of applications. The compact nature of the sCO2 system is an ideal fit for marine vessels, which confront stringent requirements for space and weight [5]. The high density of supercritical CO2 enables the development of smaller and lighter components, thereby conserving valuable space on ships while ensuring a sufficient power output. Furthermore, the sCO2 cycle’s capacity to sustain high efficiency during fluctuating power demands is a significant factor in its suitability for marine propulsion systems, as marine ships frequently operate under varying load conditions. Further, its efficient waste heat recovery capabilities reduce fuel consumption, thereby increasing the ship’s range and reducing operational costs. In addition, the sCO2 Brayton Cycle provides a more environmentally favorable and cleaner solution for marine power generation, as the shipping industry is under increasing regulatory pressure to reduce emissions.
The literature features a comprehensive exploration of various configurations of the sCO2 Brayton Cycle (sCO2-BC) aimed at augmenting its efficiency [4,6,7,8,9,10]. Among these configurations, the foundational design is the recuperated/regenerative cycle, consisting of three key heat exchangers (regenerative, intermediate, and pre-cooler), an expander, and a compressor, as originally proposed by Feher [4]. The regenerative design has further evolved to encompass variants such as the reheated compression cycle, integrating an extra heat exchanger between turbine stages, and the intercooled compression cycle, which incorporates an intercooler between compressor stages [7,11].
To mitigate the pinch-point challenges inherent in the regenerative layout, the single-recuperator configuration has evolved into the recompression cycle, where two smaller recuperators are arranged in series. This advanced layout, involving both a main compressor and a recompressor, has garnered recognition for its superior efficiency within the spectrum of supercritical cycles [12,13,14].
The optimization of boundary conditions for the sCO2-BC has garnered significant attention in previous research. Sarkar and Bhattacharyya [15] introduced optimization by integrating a reheater between turbine stages, investigating variables such as the pressure ratio (Pr), compressor inlet temperature, high-temperature recuperator effectiveness (ϵ_HTR), and low-temperature recuperator effectiveness (ϵ_LTR). The implementation of reheating technology demonstrated substantial enhancements in cycle efficiency. Similarly, Reyes et al. [12] and Sharma et al. [16] pursued the optimization of the recompression cycle, utilizing central receiver solar plants as heat sources and applying their findings to marine gas turbine systems. Sarkar et al. [17] delved into the influence of heat exchange effectiveness and pressure losses on sCO2-BC performance.
Mean line design models were employed by Saeed et al. [9] to assess the recompression cycle, while investigating different channel geometries of printed circuit heat exchangers (PCHEs) [18,19]. Salim et al. [20] delved into an exergy destruction analysis, studying the effects of varying ambient and water temperatures on sCO2-BC performance. Furthermore, Saeed and Kim [10,21,22] embarked on an optimization study focusing on the sCO2-BC’s expander system. These comprehensive investigations collectively contribute to the body of knowledge surrounding the sCO2-BC, shedding light on diverse strategies to enhance its efficiency and performance across a range of applications.
The literature suggests that the Supercritical Carbon Dioxide Brayton Cycle (sCO2-BC) is a highly efficient and eco-friendly method for waste heat recovery. It offers superior thermodynamic efficiency, operational flexibility, and low environmental impact. The focus on sustainability and regulations surrounding environmental impact make sCO2-BC a promising alternative for marine propulsion.
The objective of this research is to examine the performance of a supercritical CO2 Brayton Cycle (sCO2-BC) in conjunction with a marine propulsion system, with an emphasis on the effect of varying mass flow rates and the effectiveness of its recuperator. This study explicitly investigates the efficiency of both the low-temperature recuperator (LTR) and high-temperature recuperator (HTR) and the impact of varying CO2 mass flow rates in the bottoming cycle. The Cycle Simulation and Analysis Code (CSAC) is employed to simulate the cycle, while the PCHE Design and Analysis Code (PCHE-DAC) is used to model the performance of the recuperators.

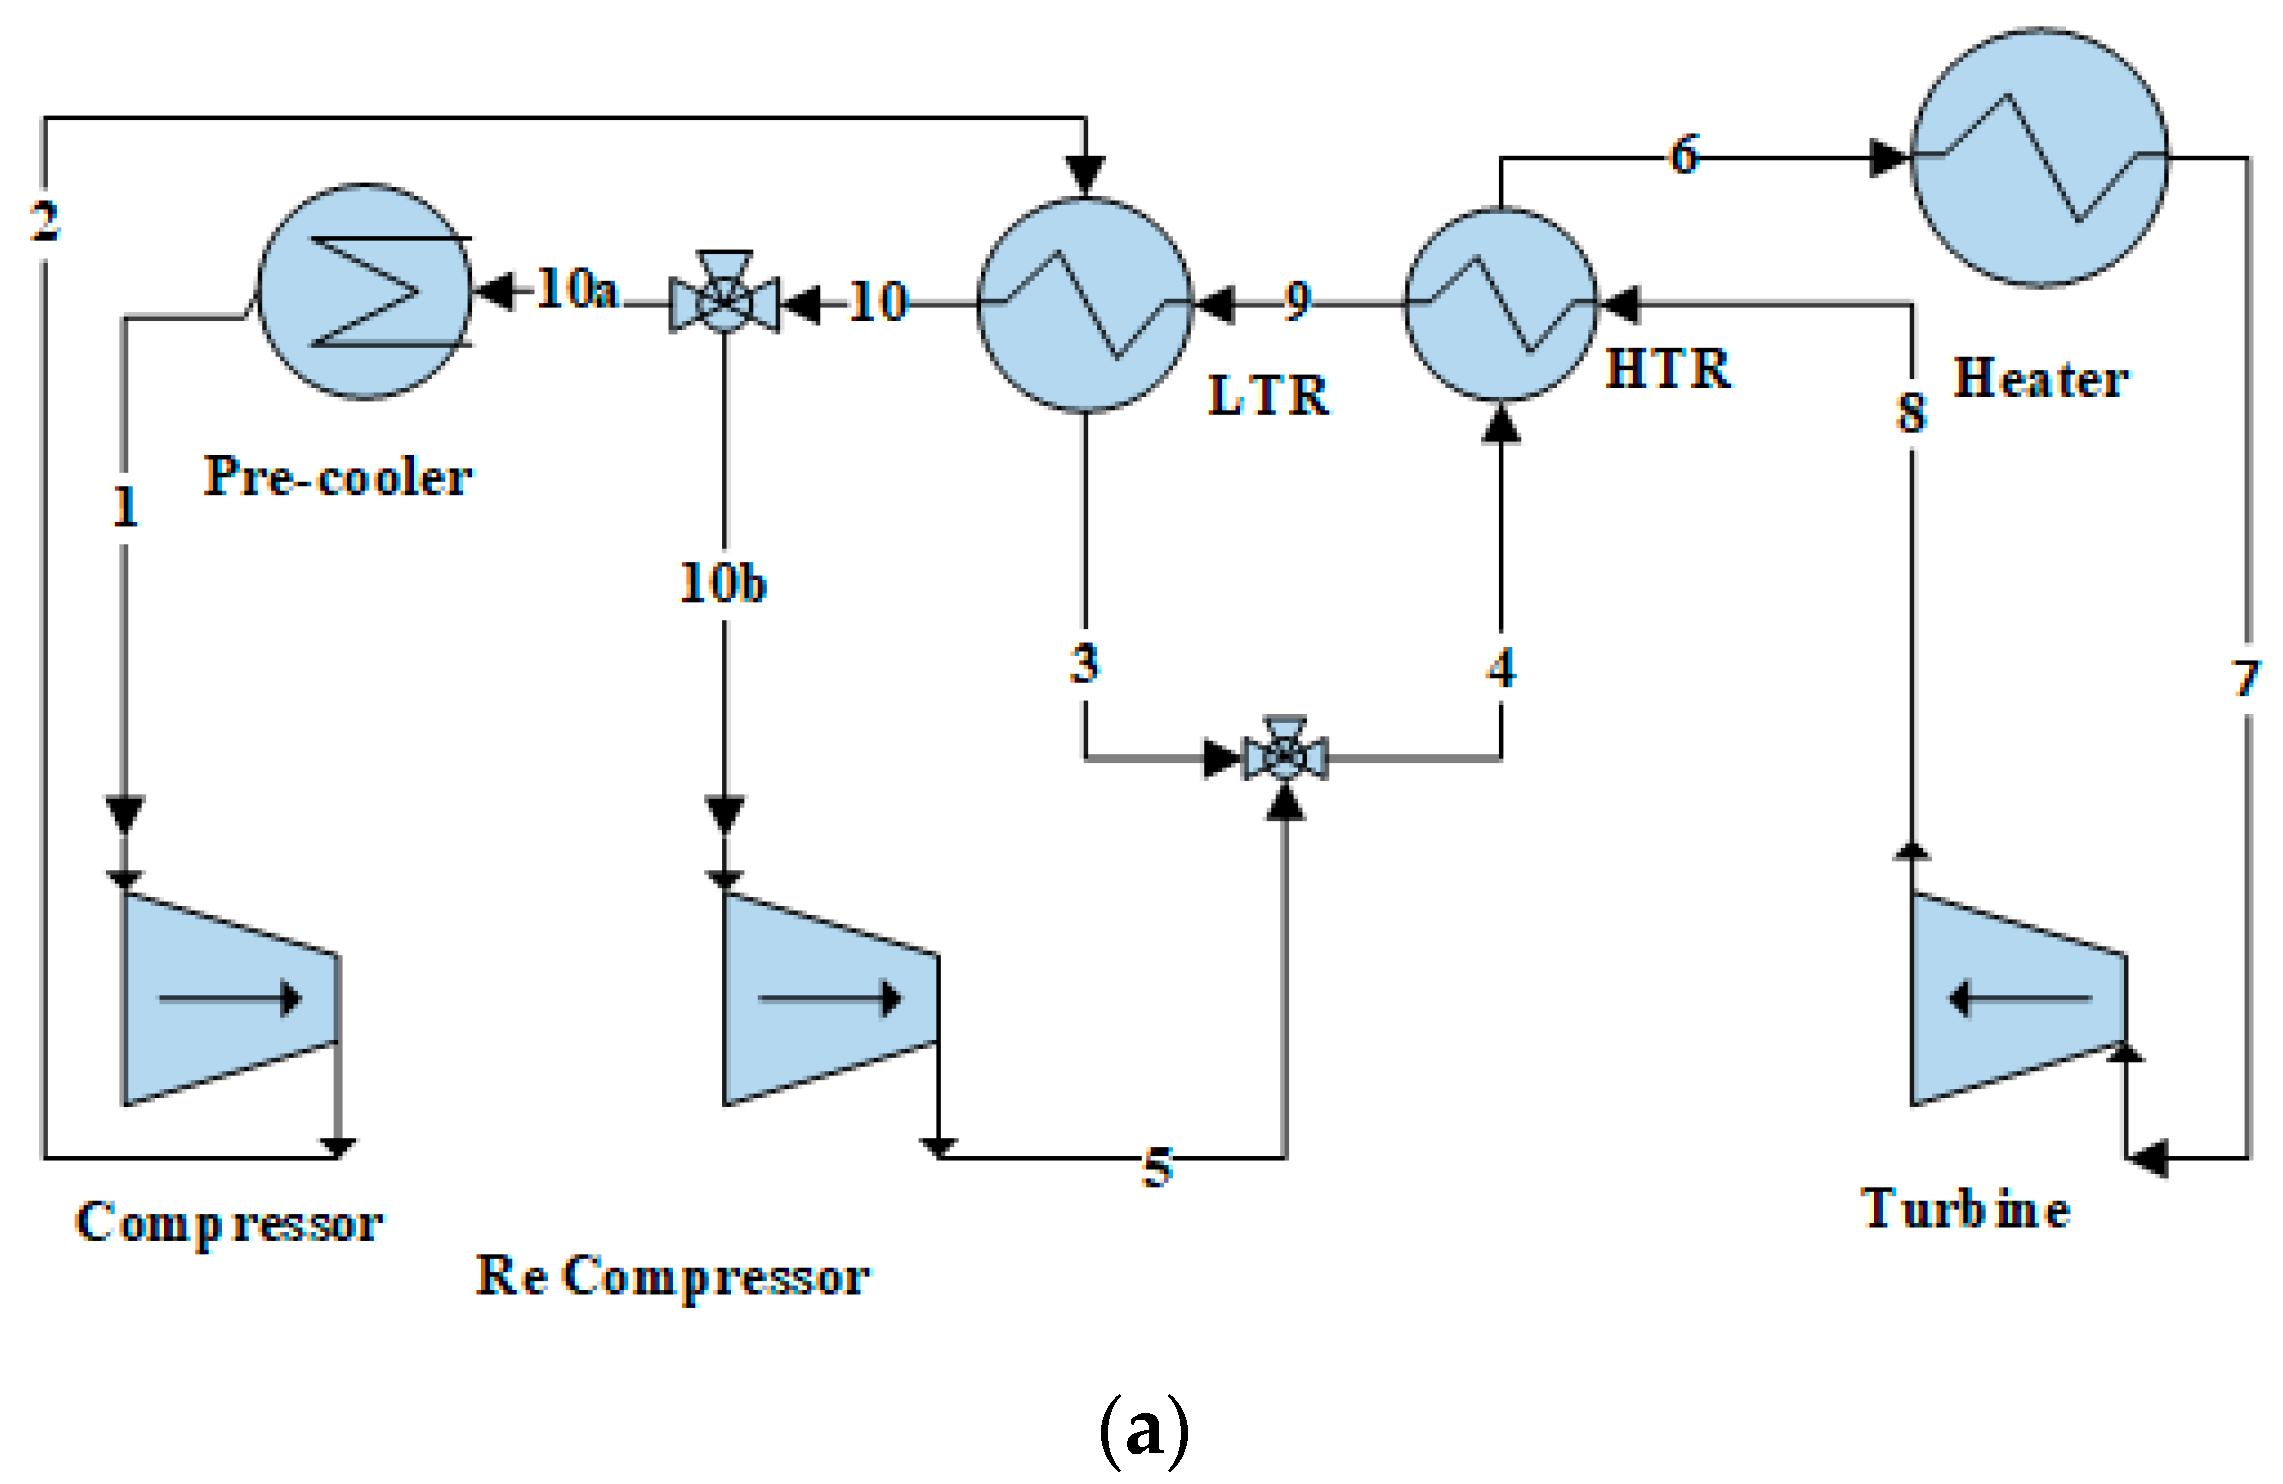
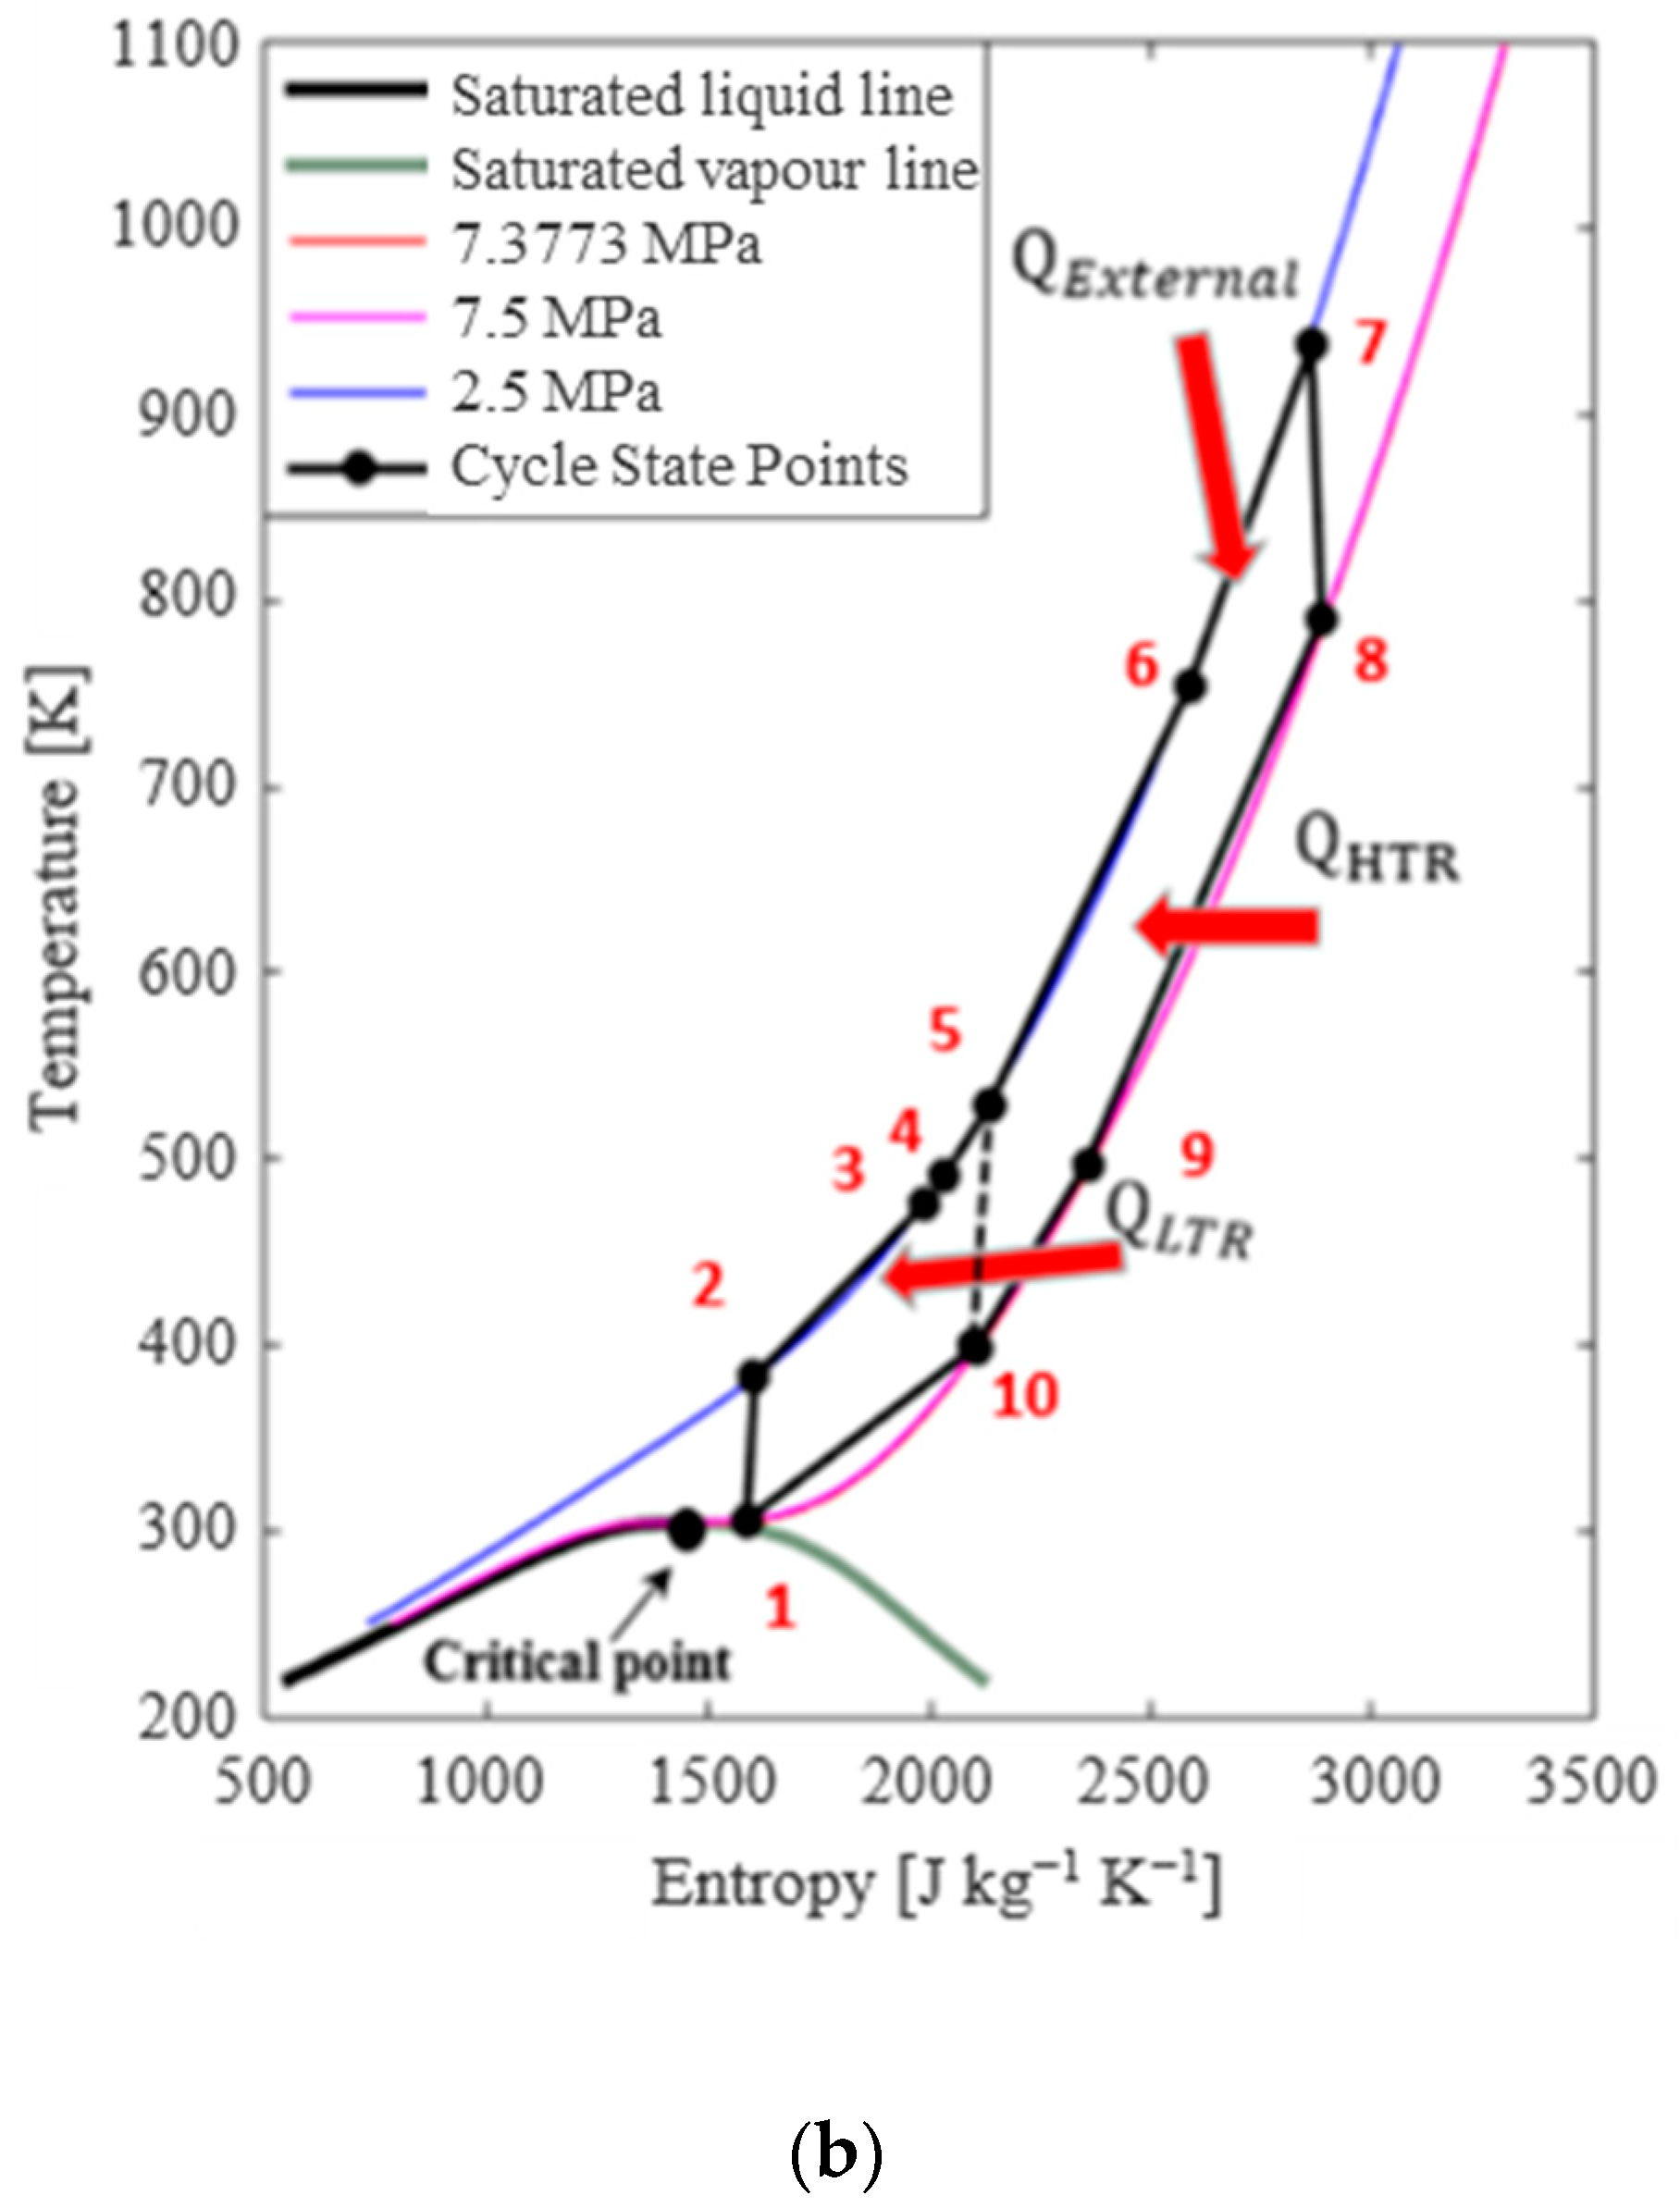
2. Recompression sCO2-BC

The sCO2-BC is available in many variant configurations to improve efficiency. For example, the recuperative cycle configuration employs heat exchangers for the purpose of recovering waste heat. Another configuration is the intercooled cycle; intercoolers are used between compression stages to maximize work efficiency. Furthermore, the partial cooling cycle configuration utilizes partial cooling to optimize the performance of the compressor. Ultimately, the recompression cycle configuration divides the flow into two separate streams, therefore maximizing the recuperation of heat when using several recuperators [4]. This study focuses on the recompression cycle configuration because of its exceptional efficiency.
In this case of recompression (sCO2-BC), depicted in Figure 1, the cycle includes a main compressor, a recompression compressor, a turbine, two recuperators (the low-temperature recuperator (LTR) and high-temperature recuperator (HTR)), a pre-cooler, and a heater. The process begins with the compression phase, where the CO2 is split into two streams (state 10 to state 10a and 10b). The main stream (state 10a) flows through a pre-cooler before entering the main compressor (state 1), while the secondary stream (state 10b) is directed to the recompression compressor. By diverting part of the flow to the recompression compressor (state 10 to 10b), the main compressor’s workload is reduced, increasing the overall cycle efficiency.
After compression, the primary CO2 stream flows through the LTR (state 2 to state 3) and is then mixed with the secondary stream (states 3 and 5 to state 4). This combined flow is preheated using the waste heat from the turbine’s exhaust via the HTR (state 4 to state 6). Following this preheating phase, the CO2 enters the main heater (state 6), where it absorbs heat from an external energy source (gas turbine or diesel engine exhaust), raising its temperature and pressure. Finally, the heated CO2 is expanded in the turbine, converting its thermal energy into mechanical work.

3. Mathematical Modeling and Simulation

In this section, the mathematical modeling and simulation approach are introduced. As presented earlier, the cycle performance is strongly related to the recuperators and the pre-cooler, highlighting the need to model these heat exchangers within acceptable accuracy in order to solve for the turbomachinery relation required to assess the overall cycle performance under varying CO2 mass flow rates and different recuperator effectiveness. Therefore, two distinct codes were developed [23,24] and integrated, namely the PCHE Design and Analysis Code (PCHE-DAC) and the Cycle Simulation and Analysis Code (CSAC). These routines were implemented in the MATLAB©(2022b version) environment, allowing them to be easily coupled with NIST REFPROP to return the thermodynamic properties to the main codes.

3.1. Mathematical Model for PCHE Design and Analysis Code (PCHE-DAC)
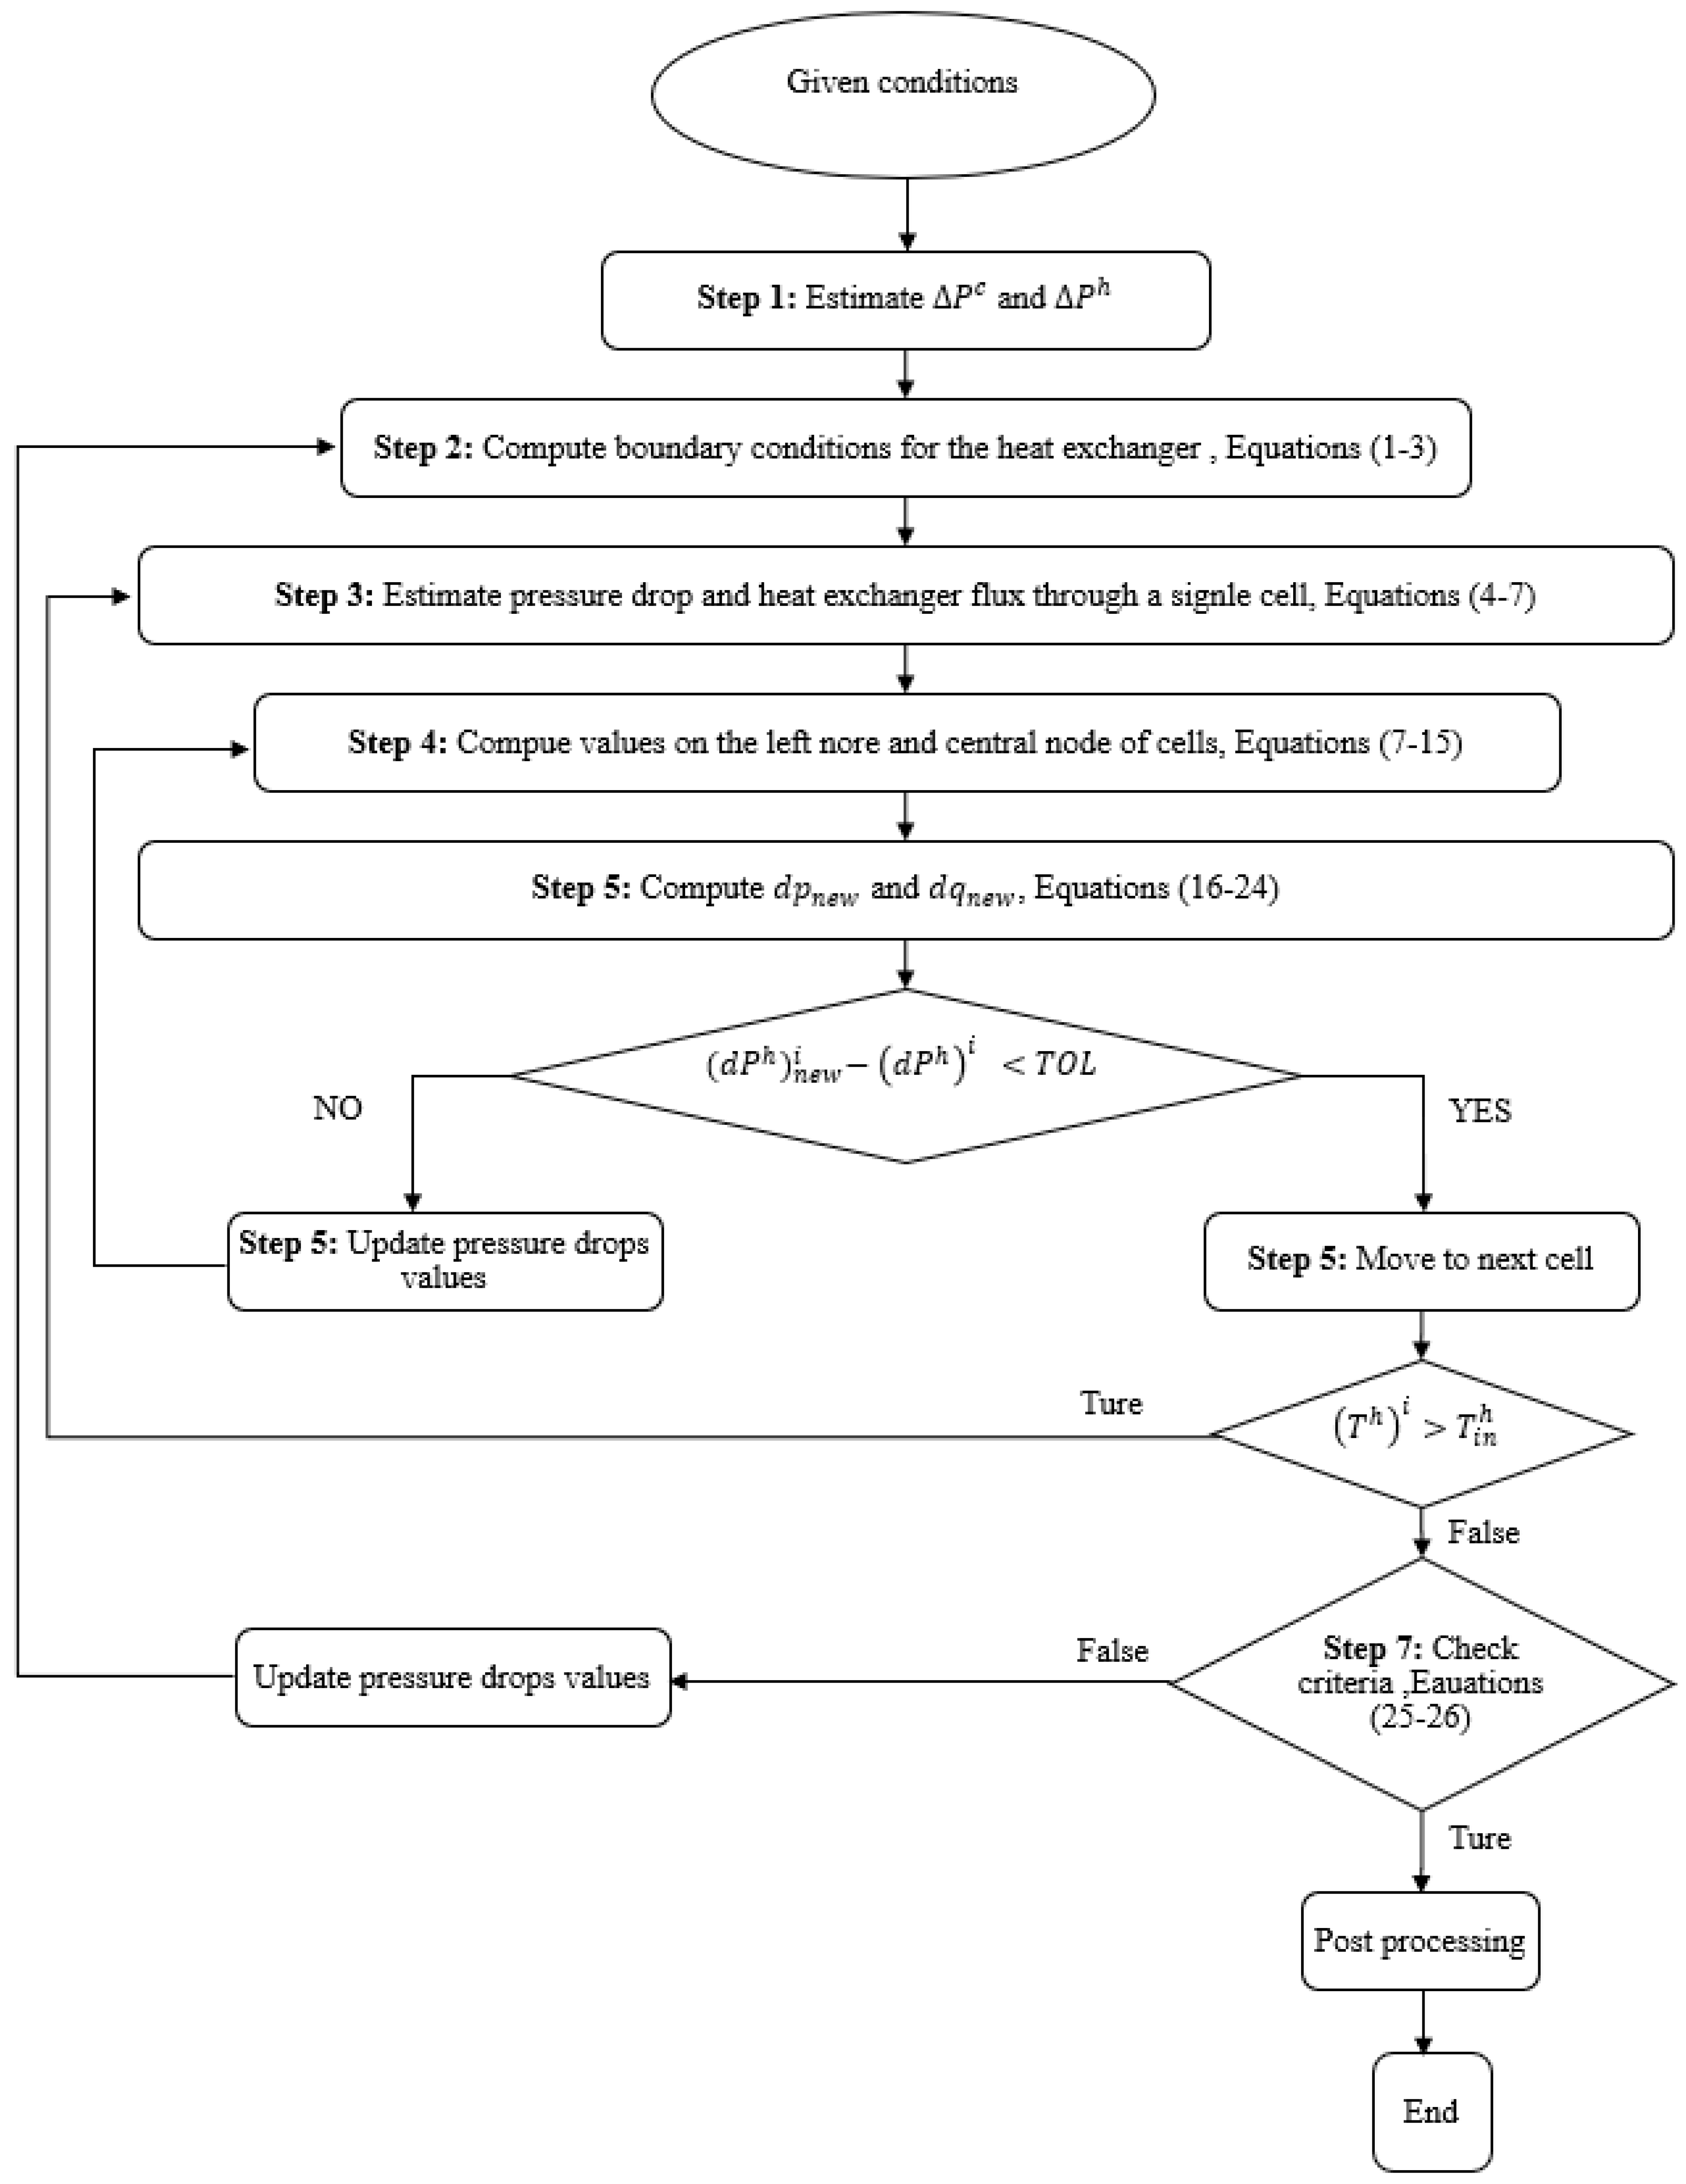
A mathematical model, PCHE-DAC, was used in this study to solve a printed circuit heat exchanger. In the mathematical formulation, it is presumed that the heat exchanger’s header uniformly distributes flow across all channels, and that heat losses to the environment are negligible. Furthermore, it is presumed that the flow and heat transfer characteristics of a unit that consists of a single channel from the hot and cold sides are indicative of the entire heat exchanger’s behavior, as illustrated in Figure 2. The cold and hot sides of the heat exchanger are represented by blue and red colors, respectively, as depicted in Figure 2. In their respective channels, the hot and cold fluids travel in a counterclockwise direction. Since the exit states are unknown (shown in red), whereas the entry states (shown in green) and PCHE design parameters are specified, the calculation process in the PCHE-DAC is conducted iteratively. The procedure employed for these calculations is given in the following steps and depicted in Figure 3.
  • Given:  h i c o l d , P i c o l d , h i h o t , P i h o t , m ˙ c o l d , m ˙ h o t , ϵ , N n o d e s
Step 1. 
Estimate initial values for Δ P c o l d and Δ P h o t
Step 2. 
The iterative procedure commences with an initial estimation of Δ P c o l d and Δ P h o t . With the outlet pressures at both points now determined, the corresponding exit temperatures are calculated based on the definition of effectiveness ( ϵ ).
ϵ = h i h o t h e h o t h i h o t h ( P o h o t , T i h o t ) = h e c o l d h i c o l d h i h o t h ( P e h o t , T i h o t )
h e c o l d h i c o l d = h i h o t h o c o l d
P o c o l d = P i c o l d Δ P c o l d
Step 3. 
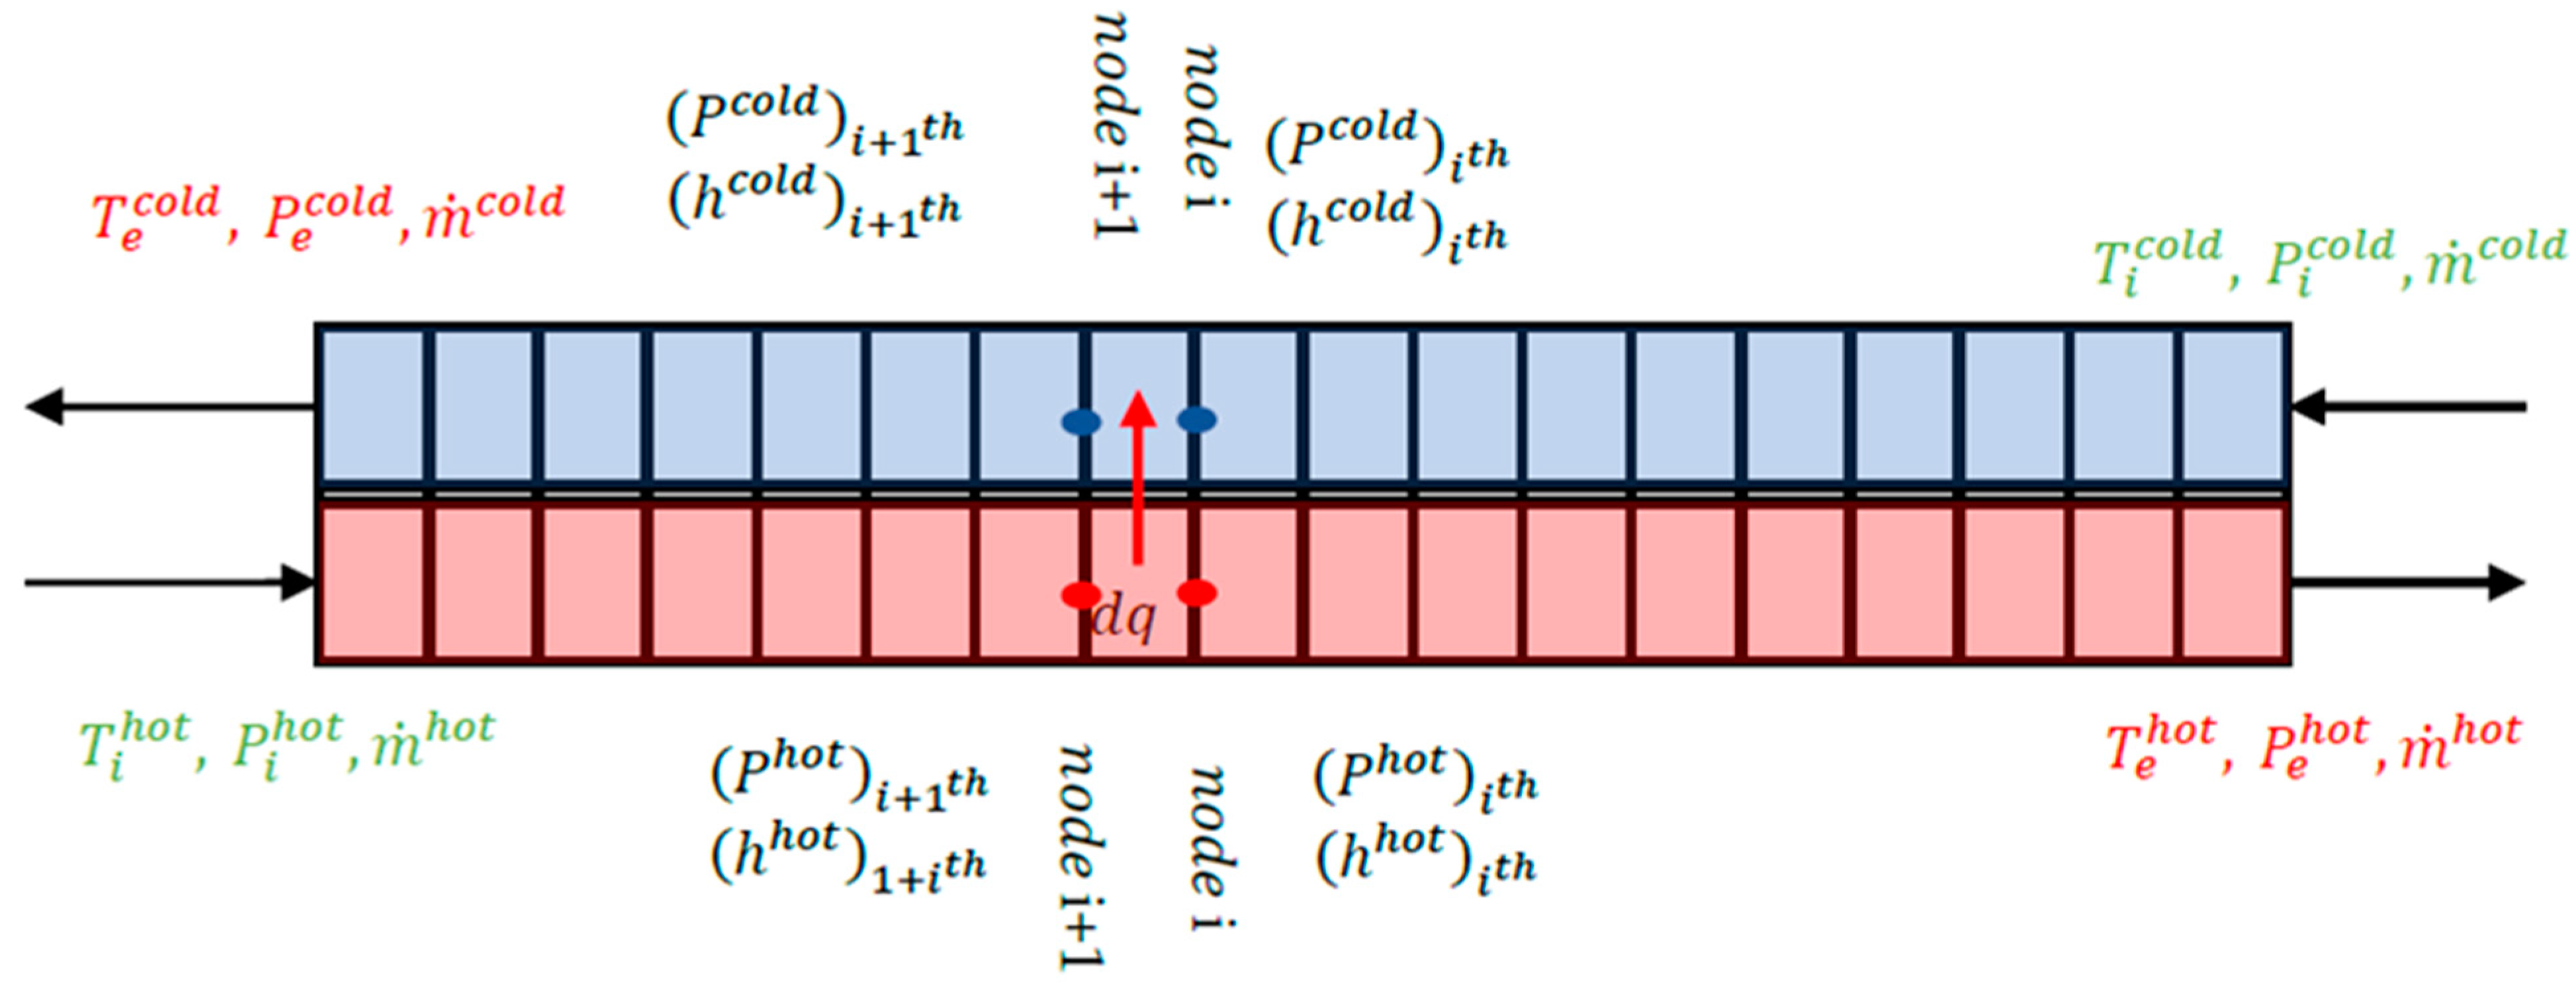
The discretized domain, as depicted in Figure 2, can be initialized by considering a linear variation in a specific enthalpy and pressure drop throughout the length of the pre-cooler.
d P c o l d i t h = Δ P c o l d / n
d P h o t i t h = Δ P h o t / n
d q c o l d i t h = ( h i c o l d h e c o l d ) / n
d q h o t i t h = d q c o l d i t h
Step 4. 
The state variables at the i t h and i + 1 t h nodes can be determined using the calculated gradient, assuming a linear variation in pressure and enthalpy along the length of the heat exchanger.
h c o l d i + 1 t h = h c o l d i t h + d q c o l d i t h m c o l d
P c o l d i + 1 t h = P i t h d p c o l d i t h
h h o t i + 1 t h = h h o t i t h d q c o l d i t h m h o t
P h o t i + 1 t h = P i t h + d p h o t i t h
h m e a n c o l d i + 1 t h = h c o l d i t h + 0.5 d q c o l d i t h m c o l d
P m e a n c o l d i + 1 t h = P i t h 0.5 d p c o l d i t h
h m e a n h o t i + 1 t h = h h o t i t h 0.5 d q c o l d i t h m h o t
h m e a n h o t i + 1 t h = h h o t i t h d q c o l d i t h m h o t
Step 5. 
In this step, the working fluid properties were derived from the cell-centered pressure and enthalpy values, enabling the calculation of the friction factor and overall heat transfer coefficient. These were then used to determine the revised pressure drop and heat transfer, as outlined in the equations below. It is worth mentioning that the friction factor and heat transfer coefficient were calculated using the correlations provided in Table 1.
( ρ m e a n c o l d , μ m e a n c o l d , C p m e a n c o l d ,   P r m e a n c o l d ,   T m e a n c o l d ) i t h = f h m e a n c o l d ,   P m e a n c o l d
ρ m e a n h o t , μ m e a n h o t , C p m e a n h o t ,   P r m e a n h o t ,   T m e a n h o t i + 1 t h = f h m e a n h o t ,   P m e a n h o t
f c o l d i t h = f   R e m e a n c o l d i t h   using   correlations   in   Table   1
f h o t i t h = f   R e m e a n h o t i t h   using   correlations   in   Table   1
h c o l d i t h = f   R e m e a n c o l d , P r m e a n c o l d i t h   using   correlations   in   Table   1
h h o t i t h = f   R e m e a n h o t , P r m e a n h o t i t h   using   correlations   in   Table   1
U A i t h = 1 1 h c o l d i t h + k t + 1 h h o t i t h
d p n e w c o l d i t h = f c o l d i t h   m c 2   2 D h y d c ρ c o l d i t h A x c 2 d x
i = i + 1 d p n e w c o l d i t h = d P c o l d i t h , d P c o l d i t h = d P c o l d i 1 t h d q n e w c o l d i t h = d q c o l d i t h , d q c o l d i t h = d q c o l d i 1 t h  
Step 6. 
The next step controls the convergence of the solution of Equation (24) until all cells are computed.
Step 7. 
The outer loop controls the convergence of boundary conditions, as given in the following equation.
h h o t n t h h o u t h o t < T o l h c o l d n t h h o u t c o l d < T o l
Δ P h o t = h h o t n t h h h o t 1 s t Δ P c o l d = h c o l d n t h h c o l d 1 s t

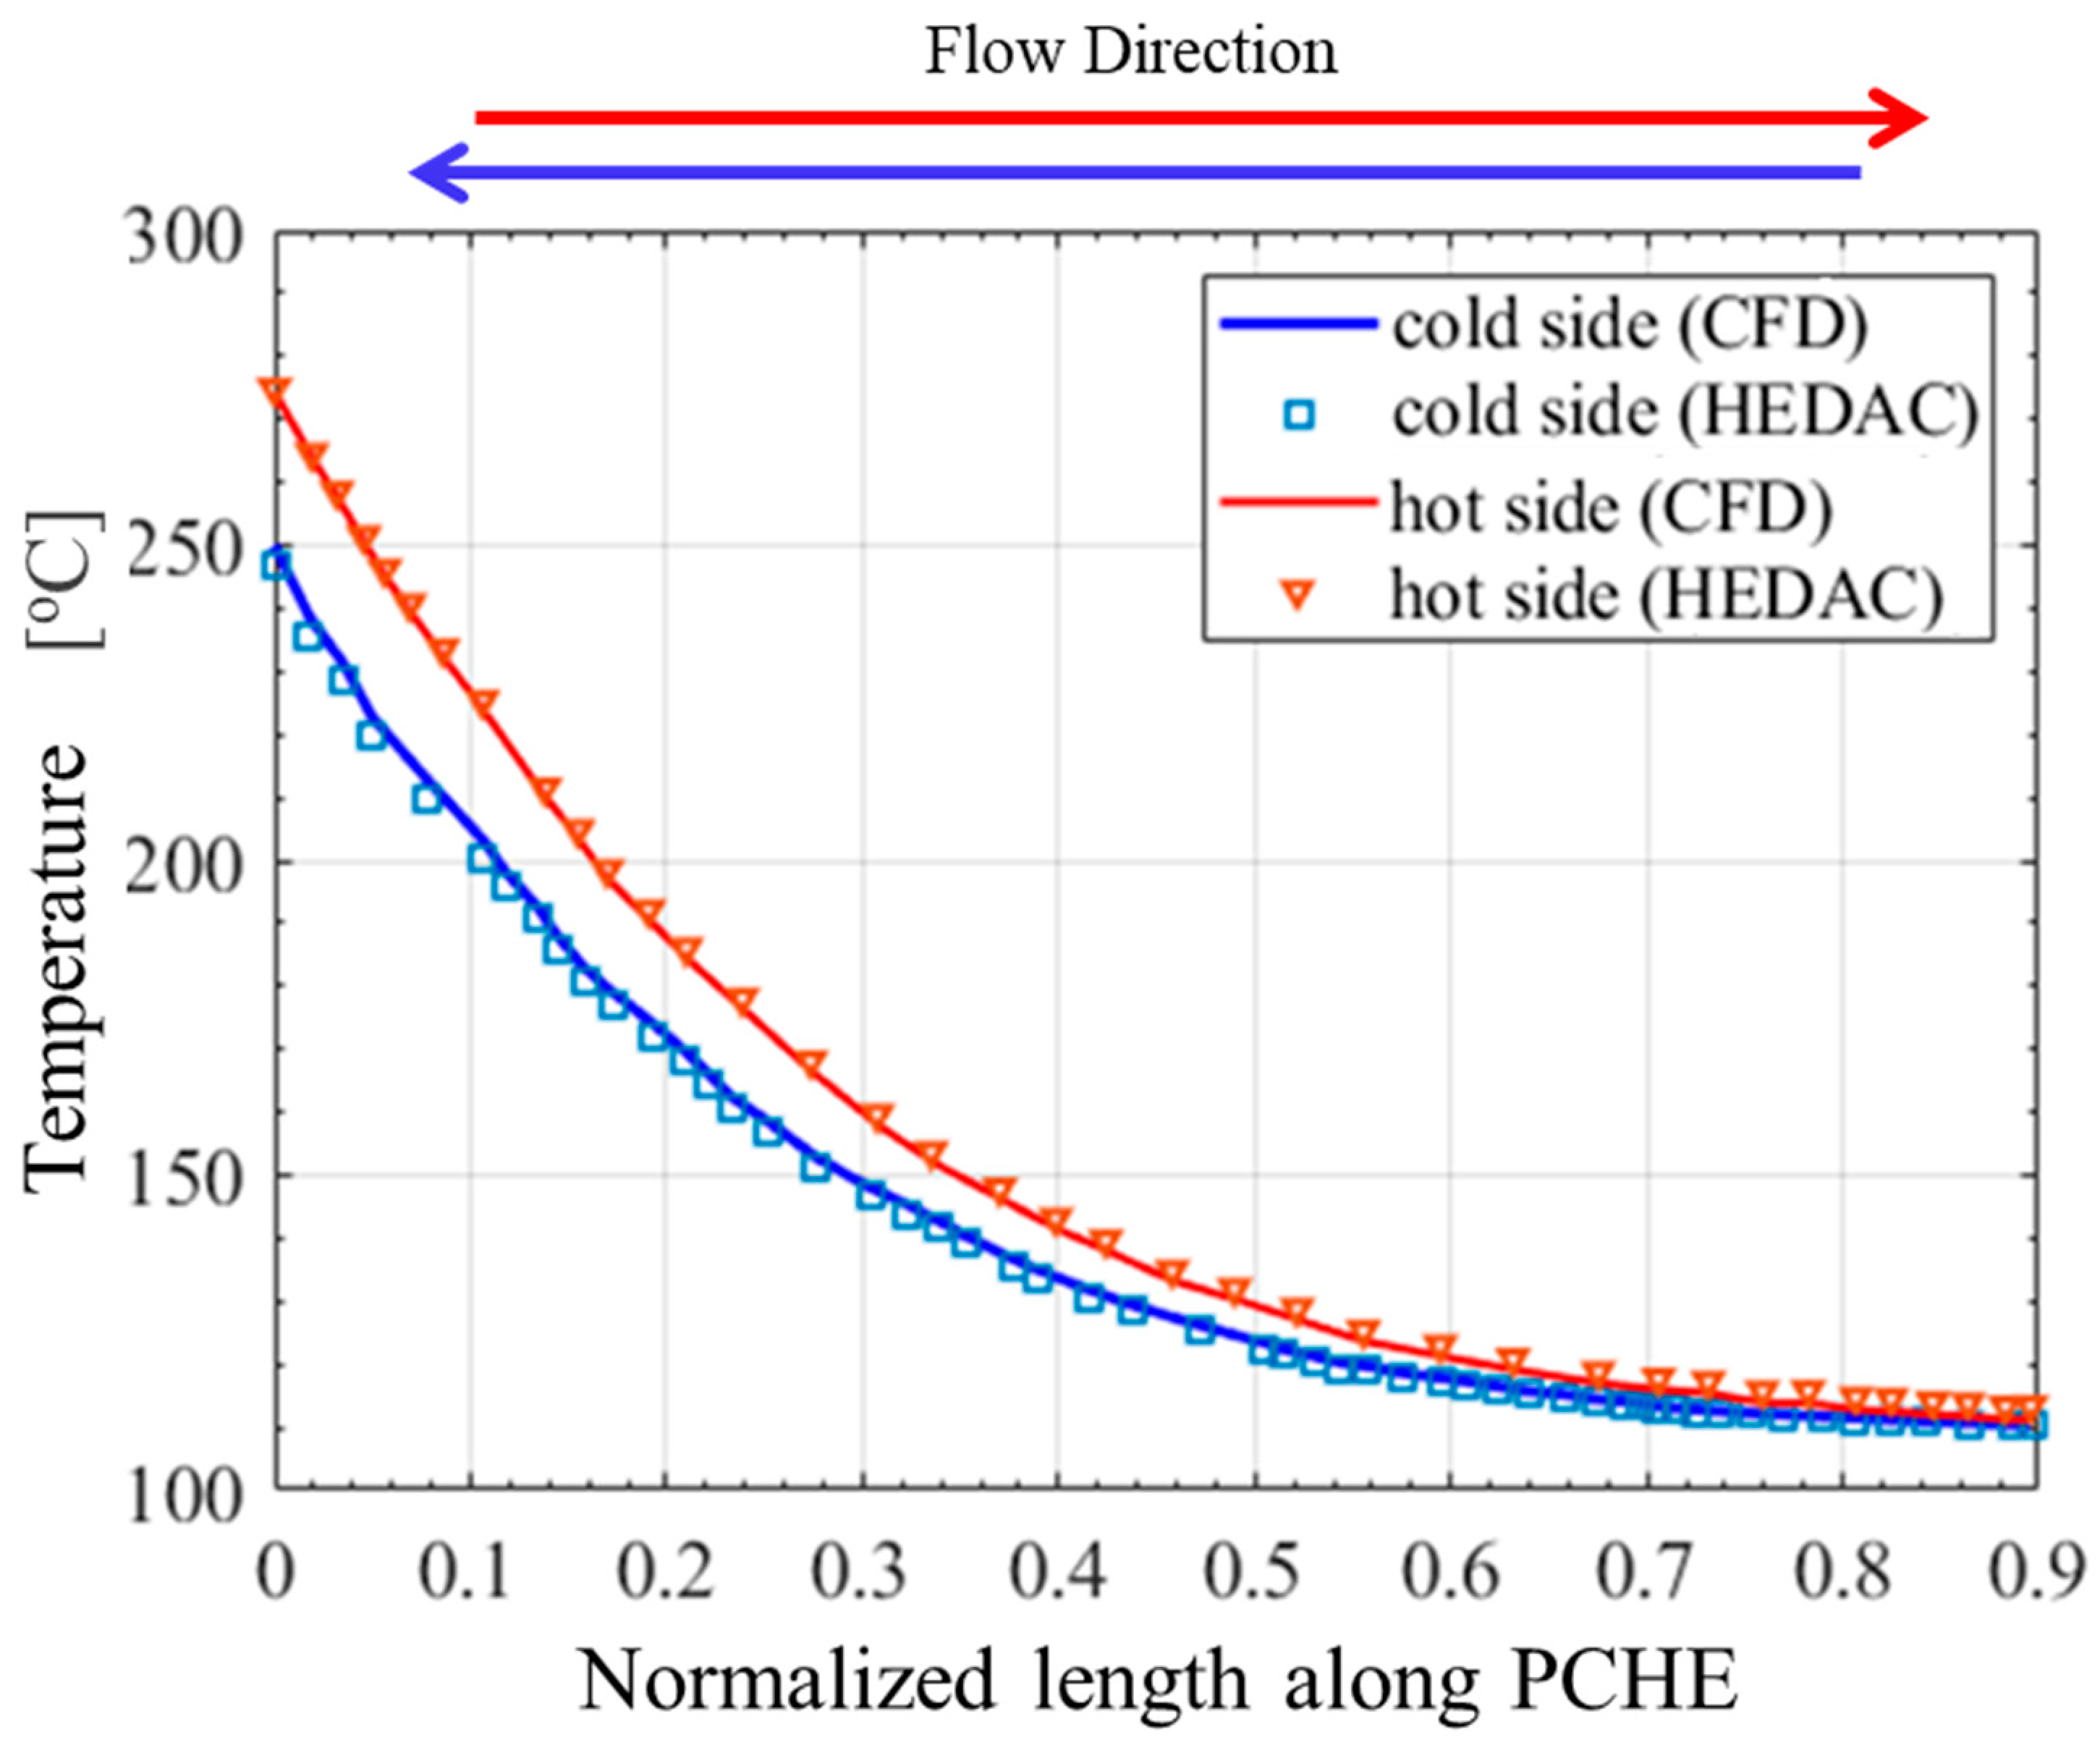
Validation for the PCHE Design and Analysis Code (PDAC)

The PCHE Design and Analysis Code (PCHE-DAC) underwent a two-phase validation process. First, the boundary conditions were validated by comparing the code’s outputs to experimental data given by Ishizuka et al. [26]. Second, the nodal point data along the PCHE length were validated by matching the temperature profiles from the code with those produced from prior CFD simulations. The numerical results for validation were derived from the CFD model [27], which had been previously tested against experimental data. Table 2 outlines the boundary conditions utilized for this validation, while Table 3 gives a comparison between the PCHE-DAC results and experimental data. The analysis shows that the largest discrepancy between the code and experimental findings is roughly 5%. Similarly, the nodal data comparison, depicted in Figure 4, indicates that the code-generated profiles closely match those from the CFD model.

3.2. Model for Cycle Simulation and Analysis Code (CSAC)

In this section, the Cycle Simulation and Analysis Code (CSAC) models the performance of the thermal cycle under various operating conditions. A key feature of the CSAC is its ability to integrate outputs from the PCHE Design and Analysis Code (PCHE-DAC), which models the influence of recuperator effectiveness on heat exchanger performance. By utilizing these outputs, the CSAC enables a comprehensive analysis of the impact of recuperator effectiveness on critical parameters, including compressor power, turbine power, overall cycle efficiency, and specific work output. Additionally, the CSAC allows for the investigation of the effects of varying CO2 mass flow rates on the thermal cycle’s performance, providing a comprehensive tool for optimizing the system’s efficiency and operation under different conditions.

3.2.1. Turbomachinery Models

Turbomachinery modeling involves using equations and data on isentropic efficiencies and pressure ratios. Isentropic efficiencies can be estimated with the Balje chart. Non-isentropic compression and expansion are also considered in the process.
Turbomachinery modeling relies on single-equation relationships for turbines and compressors, utilizing data on isentropic efficiencies and pressure ratios [29]. In this study, isentropic efficiencies (as shown in Table 4) are determined using the Balje chart [30], while the compression and expansion processes are modeled as non-isentropic, employing the following equations.
h 2 = h 2 s h 1 η c + h 1
h 5 = h 5 s h 10 η r c + h 10
h 8 = h 7 η T ( h 7 h 8 s )

3.2.2. Recuperator Models

The heat exchanger models explained earlier are recuperator models. Assuming that both PCHEs are fully shielded for heat losses to surroundings, the energy conservation equation for the LTR and HTR is given by Equations (30) and (31).
h 9 = h 8 h 6 h 4
h 10 = h 9 x   h 3 h 2
where the x split mass fraction can be calculated utilizing the following equation under the assumptions of ideal mixing and splitting at corresponding values.
x = m ˙ c m ˙ where   m ˙ = m ˙ c + m ˙ r c
The mixing value is modeled using Equation (33) by considering an ideal mixing.
h 4 = x   h 3 + 1 x h 5  
Pressure losses across all heat exchangers are modeled using the following relation, and cycle efficiency is given by Equation (35).
p o u t = p i n ( 1 f )
η c y c = w T   η m w C + w R C / η m q i n
Definitions of w t ,   w c ,   a n d   w r c are given by the following equations.
w T = ( h 7 h 8 )
w C = x ( h 2 h 1 )
w R C = 1 x ( h 5 h 10 )
The power cycle’s selected boundary conditions are based on the literature review of boundaries for the recompression Brayton Cycle [12] and are listed in Table 4. Cycle calculations under given conditions (Table 4) were simulated using a CSAC for a fixed split fraction value, “x”. Thermodynamics state properties were obtained by coupling the MATLAB code with the REFPROP.

4. Results

The correlation between the power consumption of the main compressor and the mass flow rate of CO2 is illustrated in Figure 5. The compressor’s load increases as the CO2 flow rate increases, which is an expected performance due to the increased compression load. At the compressor’s lowest power point, the recuperator effectiveness is 0.85, and the CO2 flow rate is 132 kg/s; the compressor is consuming a power of 4.5 MW. On the other hand, it consumes 5.5 MW, with a discharge rate of 165 kg/s and a 0.99 recuperator effectiveness. This demonstrates the significance of regulating the discharge rate of CO2 to optimize efficiency. It is intriguing that modifications to the effectiveness of heat exchangers have only a minor effect on power consumption. Conversely, the optimization of the CO2 flow rate has a greater potential to reduce compressor energy consumption.
Figure 6 presents compelling evidence of the relationship between the CO2 mass flow rate and the recompressor work in the bottoming cycle. Increasing the mass flow rate of CO2 leads to higher recompressor work across all heat exchanger effectiveness values. Conversely, enhancing the effectiveness of both recuperators results in a decrease in the recompression work. At the minimum power point, the recompressor requires 3.55 MW of power, corresponding to a CO2 mass flow rate of 132 kg/s and a recuperator effectiveness of 0.85. In contrast, the maximum power point, which corresponds to 4.5 MW, occurs at a CO2 mass flow rate of 165 kg/s and a recuperator effectiveness of 0.99. These findings underscore the critical influence of the CO2 mass flow rate and recuperator effectiveness on the recompressor’s power consumption. By optimizing the CO2 mass flow rate and fine-tuning the recuperator effectiveness, it is possible to achieve a more energy-efficient operation of the bottoming cycle, leading to potential cost savings and improved system performance.
The combined power consumption of the main and recompressor power, as a function of the CO2 mass flow rate and recuperator effectiveness, is represented in Figure 7. The compressors are subjected to an increased load as the CO2 mass flow rate increases, as evidenced by the moderate increase in power consumption depicted in the figure. This trend indicates that it is essential to optimize CO2 flow rates in order to decrease the system’s overall energy consumption. Furthermore, the figure illustrates that the recuperators’ effectiveness has a significant effect on the combined power consumption. The total compressor power consumption increases in tandem with the effectiveness of the recuperator. This result implies that, although the effectiveness of recuperators can be improved to improve heat recovery, it may not directly reduce compressor power consumption. With a recuperator effectiveness of 0.85 and a CO2 mass flow rate of 132 kg/s, the lowest power consumption is observed at 8.2 MW. Conversely, the recuperator effectiveness of 0.99 and a mass flow rate of 165 kg/s result in the maximum power consumption of 9.1 MW. These findings demonstrate the significance of achieving a balance between the effectiveness of the recuperator and the mass flow rate of CO2 in order to reduce compressor power consumption and enhance the overall energy efficiency of the sCO2-BC system.
The turbine power output is depicted in Figure 8. As the mass flow rate of CO2 increases, the turbine power encounters a moderate decline. This behavior can be attributed to the negative impact on turbine performance caused by the decrease in turbine inlet temperatures as the mass flow rate increases. The turbine operates at lower temperatures, resulting in a reduced power output, despite the increased flow rate. This observation underscores the significance of regulating CO2 flow rates to enhance the efficacy of the overall cycle and the performance of the turbine. On the other hand, turbine power output experiences a considerable increase as recuperator effectiveness increases. This implies that turbine performance is more susceptible to fluctuations in heat exchanger efficiency than to fluctuations in CO2 mass flow rates. The thermal efficiency of the cycle is enhanced, which leads to an increase in turbine power, as a consequence of the enhanced effectiveness of the heat exchanger. At a CO2 mass flow rate of 152 kg/s and a recuperator effectiveness of 0.99, the maximum turbine power output observed is 23.5 MW. Conversely, the lowest turbine power of 9.1 MW is observed at a flow rate of 165 kg/s and a recuperator effectiveness of 0.85. These results emphasize the importance of optimizing the performance of both the heat exchanger and the CO2 mass flow rate to optimize the overall cycle output and turbine efficiency.
The net cycle power output is illustrated in Figure 9. The figure illustrates a distinct trend in which the net cycle power increases as the recuperator’s effectiveness improves, while it generally decreases as the CO2 mass flow rates increase. This indicates that the compressors are subjected to a greater load at higher mass flow rates, resulting in a reduced net cycle power, despite the increased turbine power. In contrast, an increase in net cycle power is the consequence of improved heat recovery, which is facilitated by a more effective recuperator. The cycle’s maximal net power output is 14.5 MW, which is achieved at a CO2 mass flow rate of 152 kg/s and a recuperator effectiveness of 0.99. In contrast, the recuperator effectiveness of 0.85 results in the lowest net power of 11.5 MW at the same CO2 mass flow rate. This implies that the overall cycle performance can be substantially influenced by optimizing the heat exchanger’s effectiveness, whereas the mass flow rate must be meticulously managed to minimize the increase in compressor power consumption and maximize net output.
The heat exchanger volume is depicted in Figure 10 as a function of the effectiveness of the recuperator and the mass flow rates of CO2. The graph demonstrates that the heat exchanger volume is marginally affected by the CO2 mass flow rate, but the volume is considerably increased by an increase in the recuperator’s effectiveness. This increase in heat exchanger volume can be a limiting factor in marine applications, where dimensions, space, and weight are critical. At a recuperator effectiveness of 0.99, the largest volume, 0.6 m3, is observed, while the smallest volume, 0.15 m3, matches an effectiveness of 0.85. These results stress the significance of balancing the effectiveness of recuperators with the size of heat exchangers, as an improvement in heat recovery is accompanied by an increase in weight and space. In marine systems, where compactness and efficiency are of significance, this trade-off must be carefully managed in order to assure optimal system performance without compromising the vessel’s design constraints.
Figure 11 and Figure 12 provide valuable insights into the dynamic behavior of the sCO2 cycle efficiency and the overall system efficiency, encompassing the collaborative performance of both the gas turbine and the bottoming cycle. These efficiency metrics respond sensitively to changes in the mass flow rates of CO2 and the effectiveness of the recuperators. Regardless of the effectiveness value of the heat exchanger, an increase in the mass flow rate of CO2 within the bottoming cycle corresponds to a decrease in both the bottoming cycle’s efficiency and the overall system efficiency. This inverse relationship emphasizes the accurate balance that must be maintained between the flow rate of CO2 and the efficiency of the cycle to achieve optimal performance. Conversely, as the effectiveness value of the heat exchanger increases, both the bottoming cycle’s efficiency and the overall system efficiency exhibit a notable improvement. This positive correlation emphasizes the critical role played by the heat exchanger’s effectiveness in enhancing the system’s overall energy conversion efficiency. The peak of the observed efficiencies presents an intriguing point of reference. The system’s overall efficiency reaches an impressive level of nearly 59%. This optimal efficiency is achieved at a CO2 mass flow rate of 152 kg/s, in tandem with a high recuperator effectiveness of 0.99. Conversely, the system’s lowest overall efficiency is recorded at 54%, occurring under conditions of a maximum CO2 flow rate of 152 kg/s and a recuperator effectiveness of 0.85.
Comparing these efficiency values with the standalone gas turbine system, characterized by an efficiency of 35%, showcases the profound impact of integrating the sCO2 Brayton Cycle (sCO2-BC) as a bottoming cycle. The addition of the sCO2-BC substantially elevates the overall system efficiency from 54% to an impressive 59%, signifying a remarkable improvement in energy utilization and conversion.
These findings underscore the potential of the sCO2-BC as an effective means to significantly enhance the overall energy efficiency of the system. Moreover, the sensitivity of system efficiency to varying parameters highlights the importance of meticulous control and optimization to achieve optimal performance. This study stresses the viability of the sCO2-BC configuration as a transformative approach to augmenting the energy efficiency of gas turbine systems and provides valuable insights for engineering applications and further research endeavors.

5. Conclusions

In this study, the performance of a supercritical CO2 Brayton Cycle (sCO2-BC) was analyzed in conjunction with a marine propulsion system. The investigation focused on the impact of varying CO2 mass flow rates and recuperator effectiveness on key performance parameters such as compressor power, turbine power, and overall system efficiency. Two simulation codes were utilized to model the thermodynamic cycle and heat exchanger, providing detailed insights into the system’s energy performance. From this research, the following is concluded:
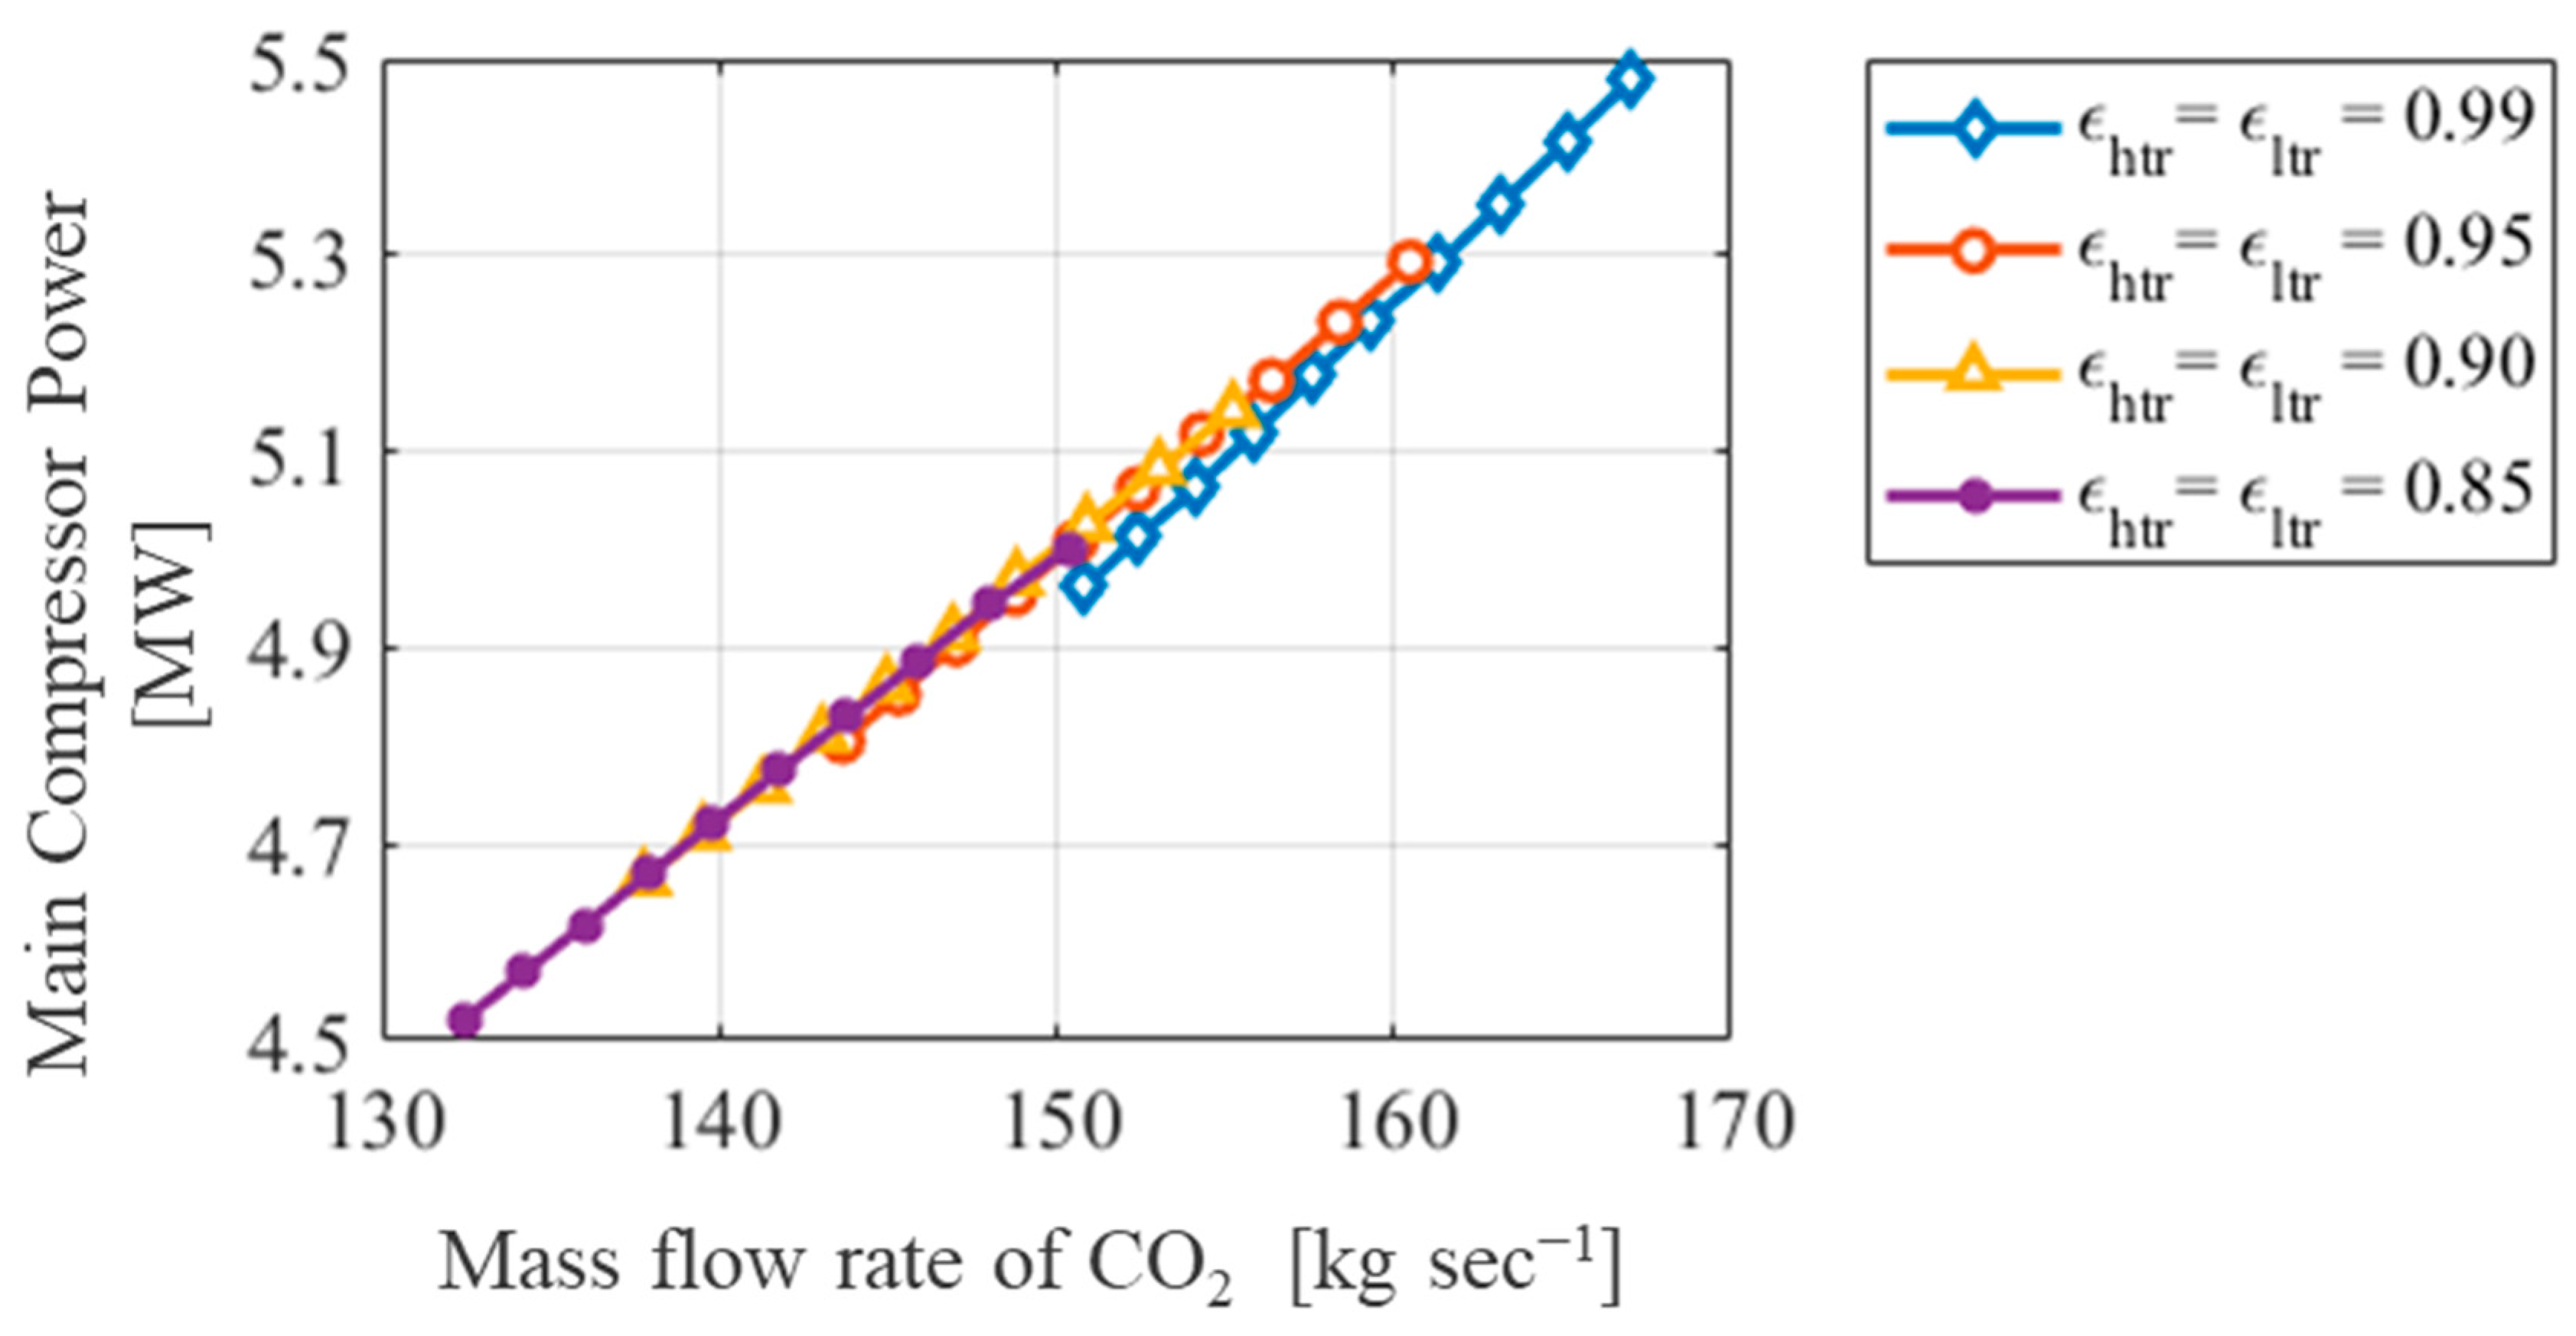
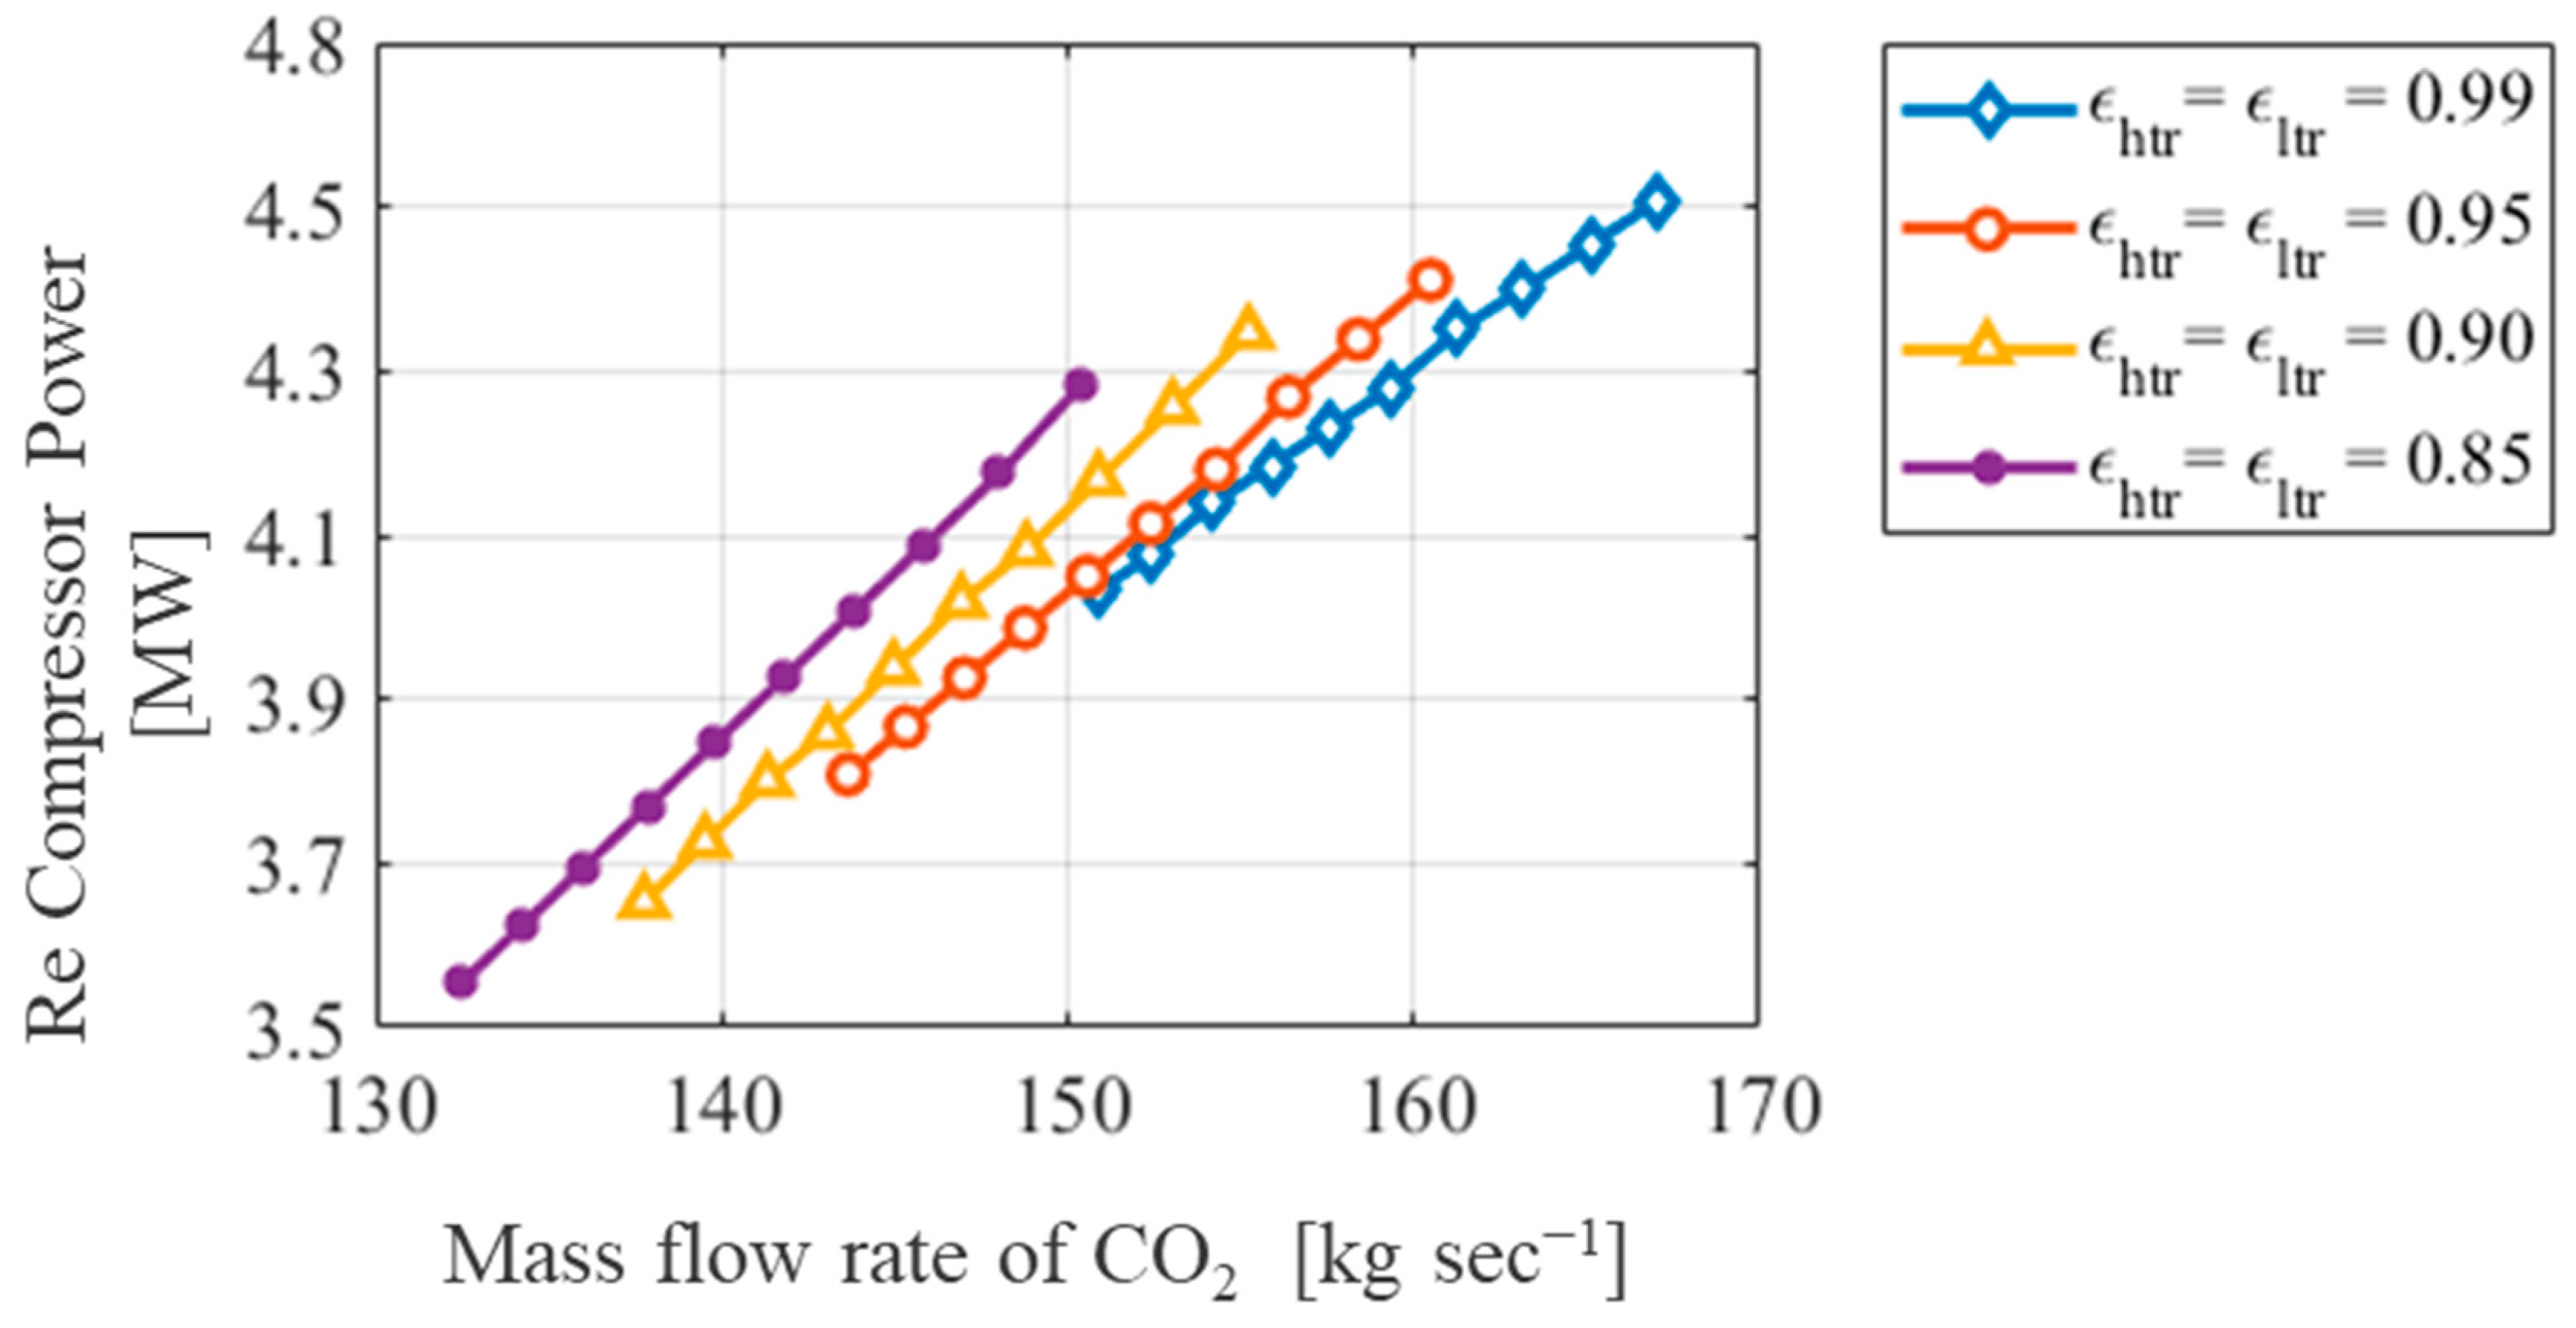
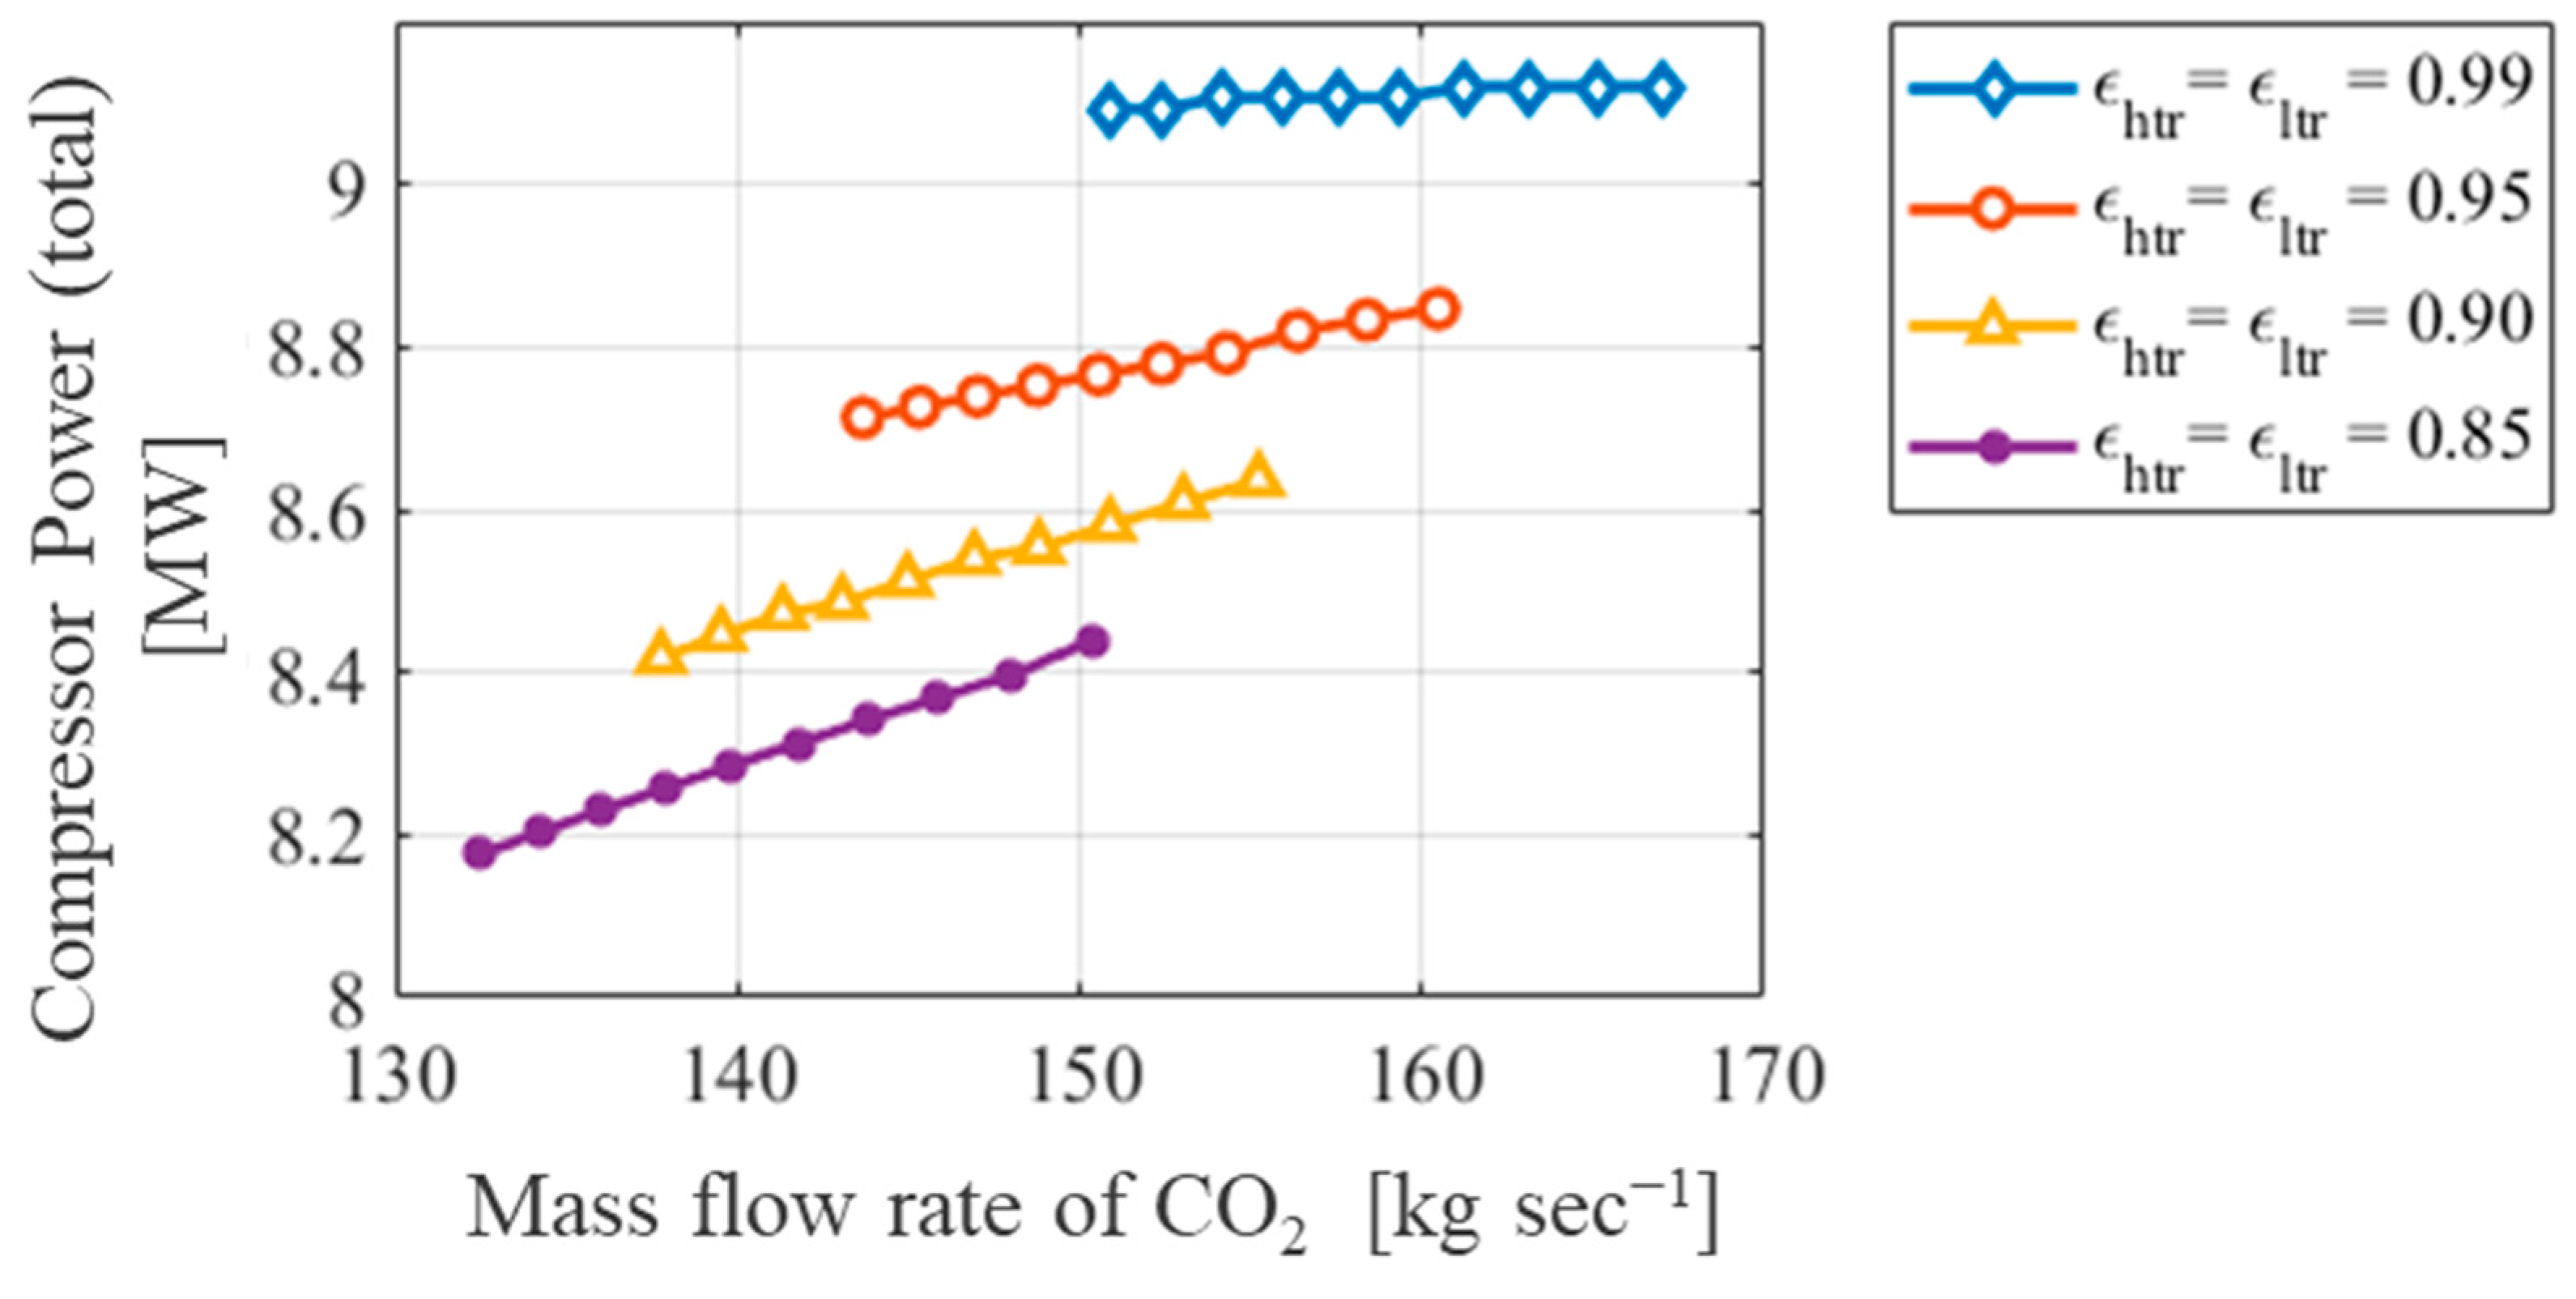
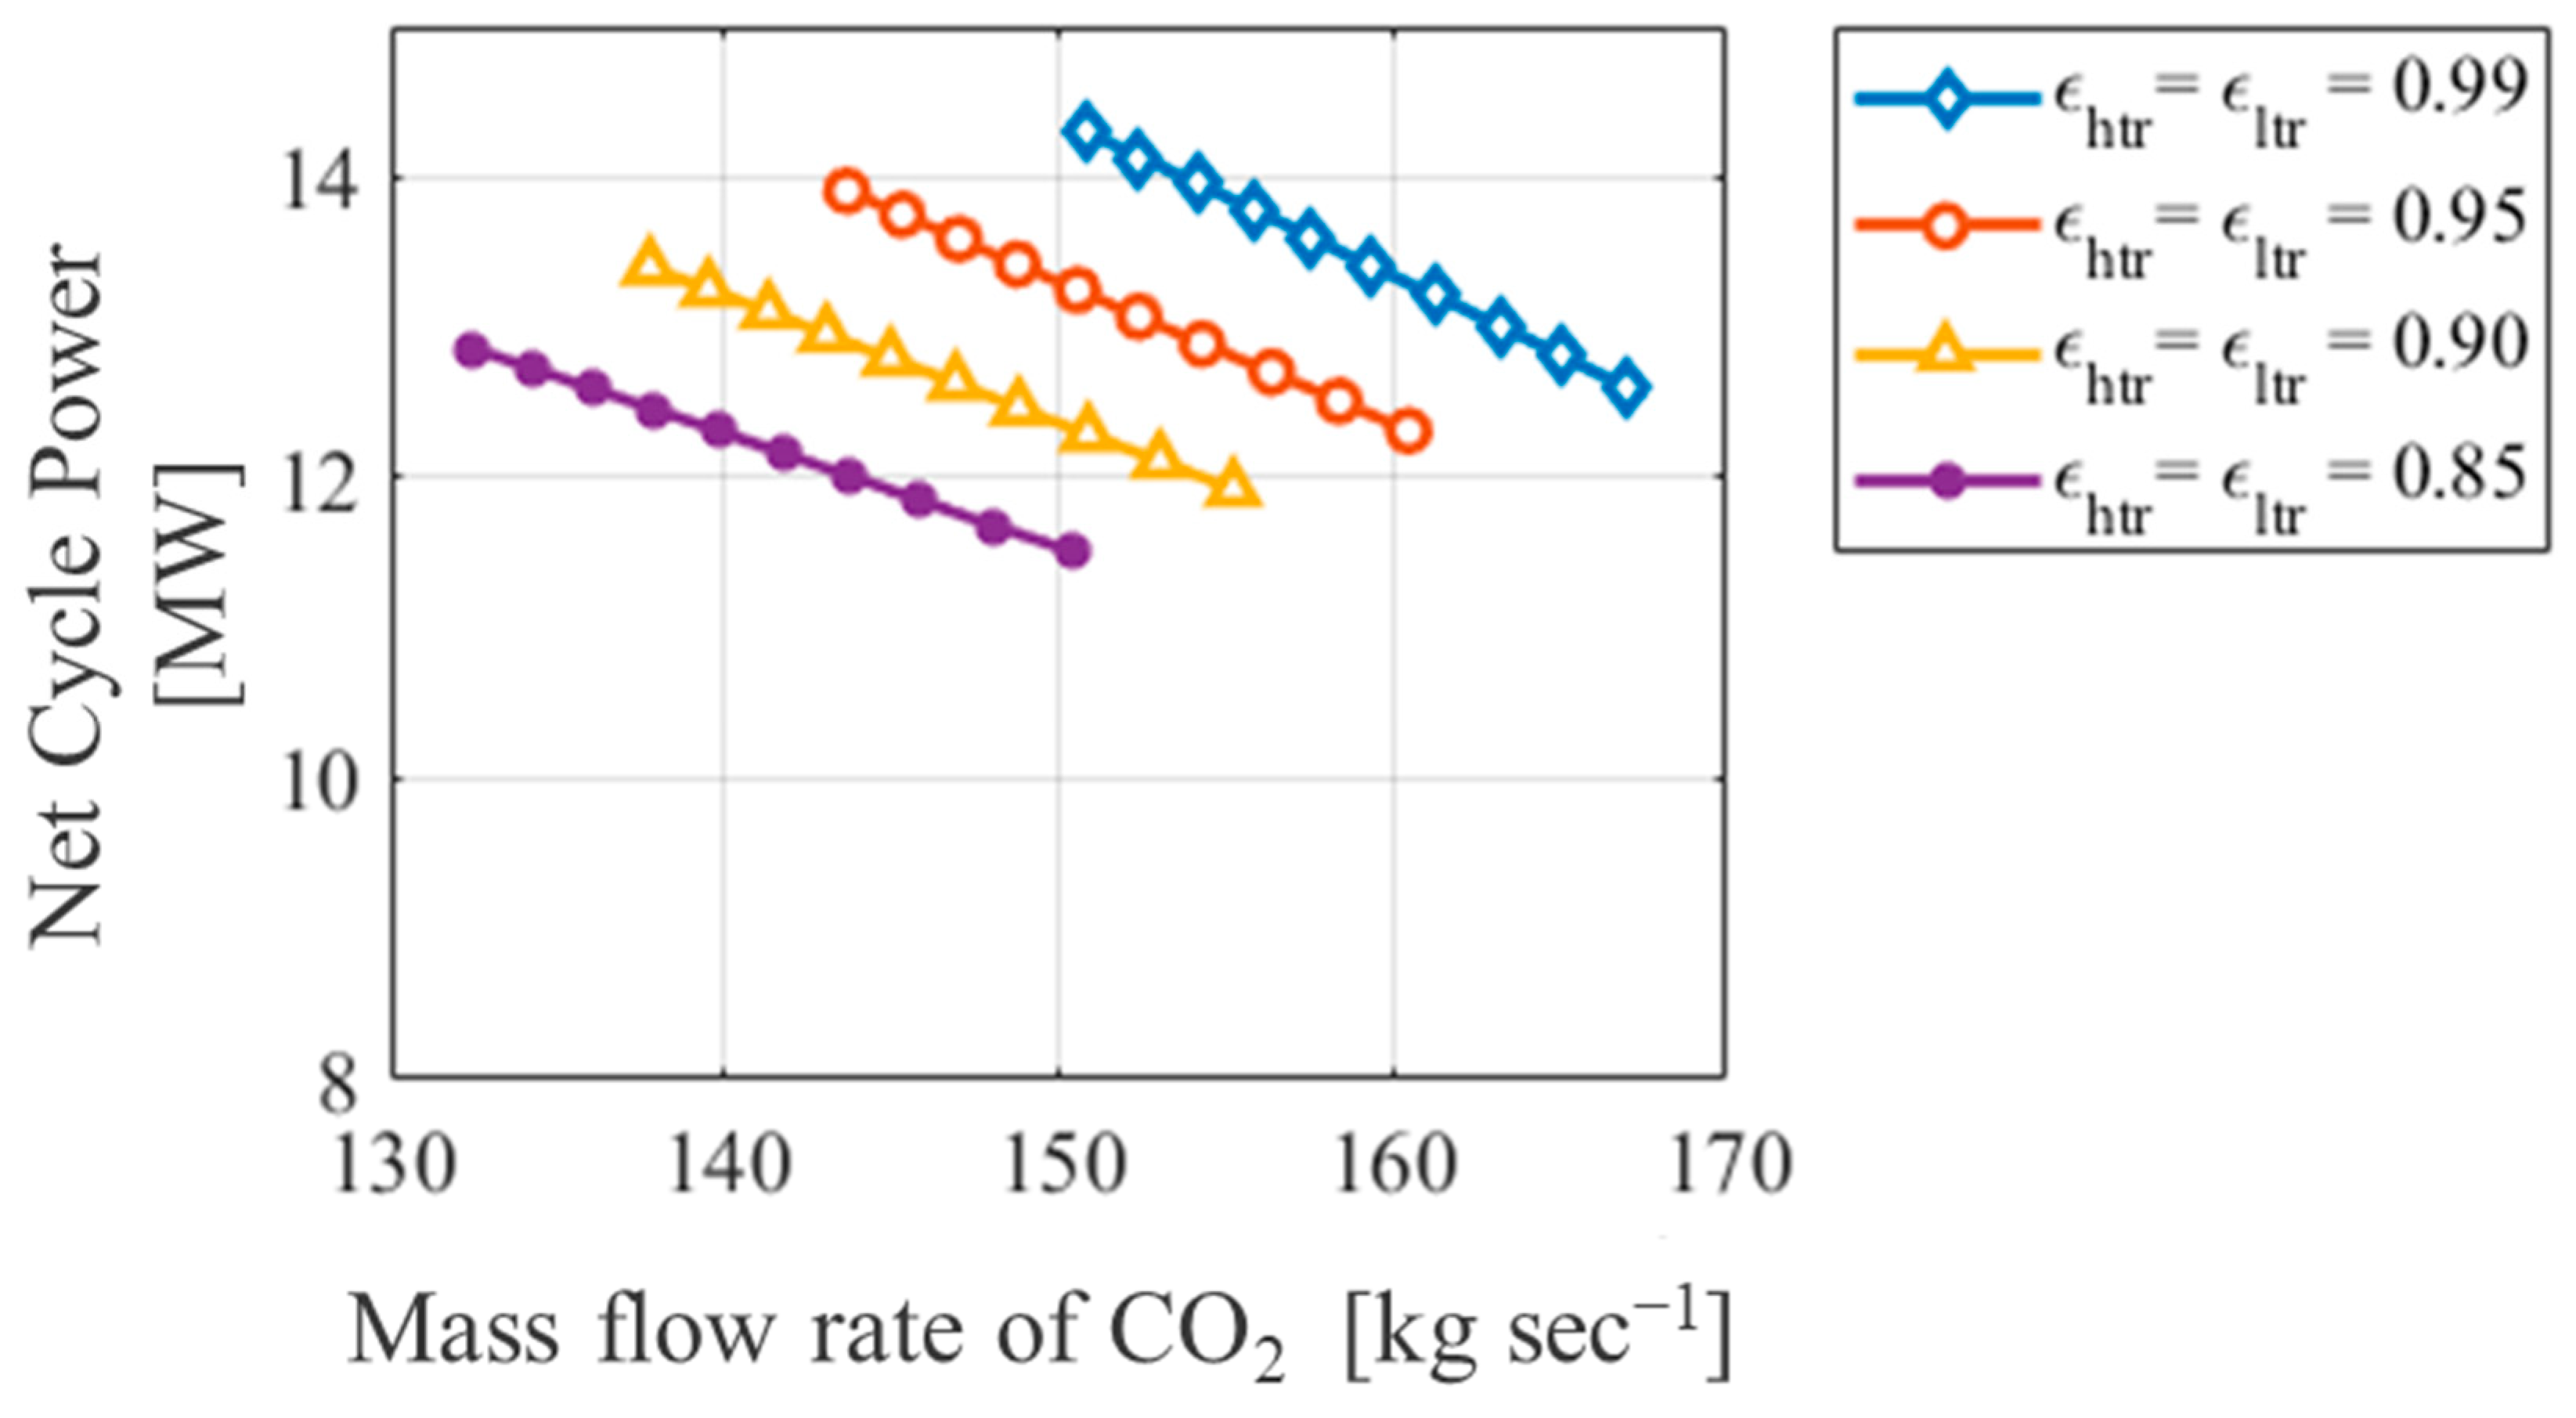
  • Optimizing CO2 Mass Flow Rate and Recuperator Effectiveness: The performance of the sCO2 Brayton Cycle is highly dependent on the precise control of the CO2 mass flow rate and the effectiveness of the recuperators. Balancing these parameters is crucial for enhancing system efficiency, particularly in reducing compressor power consumption.
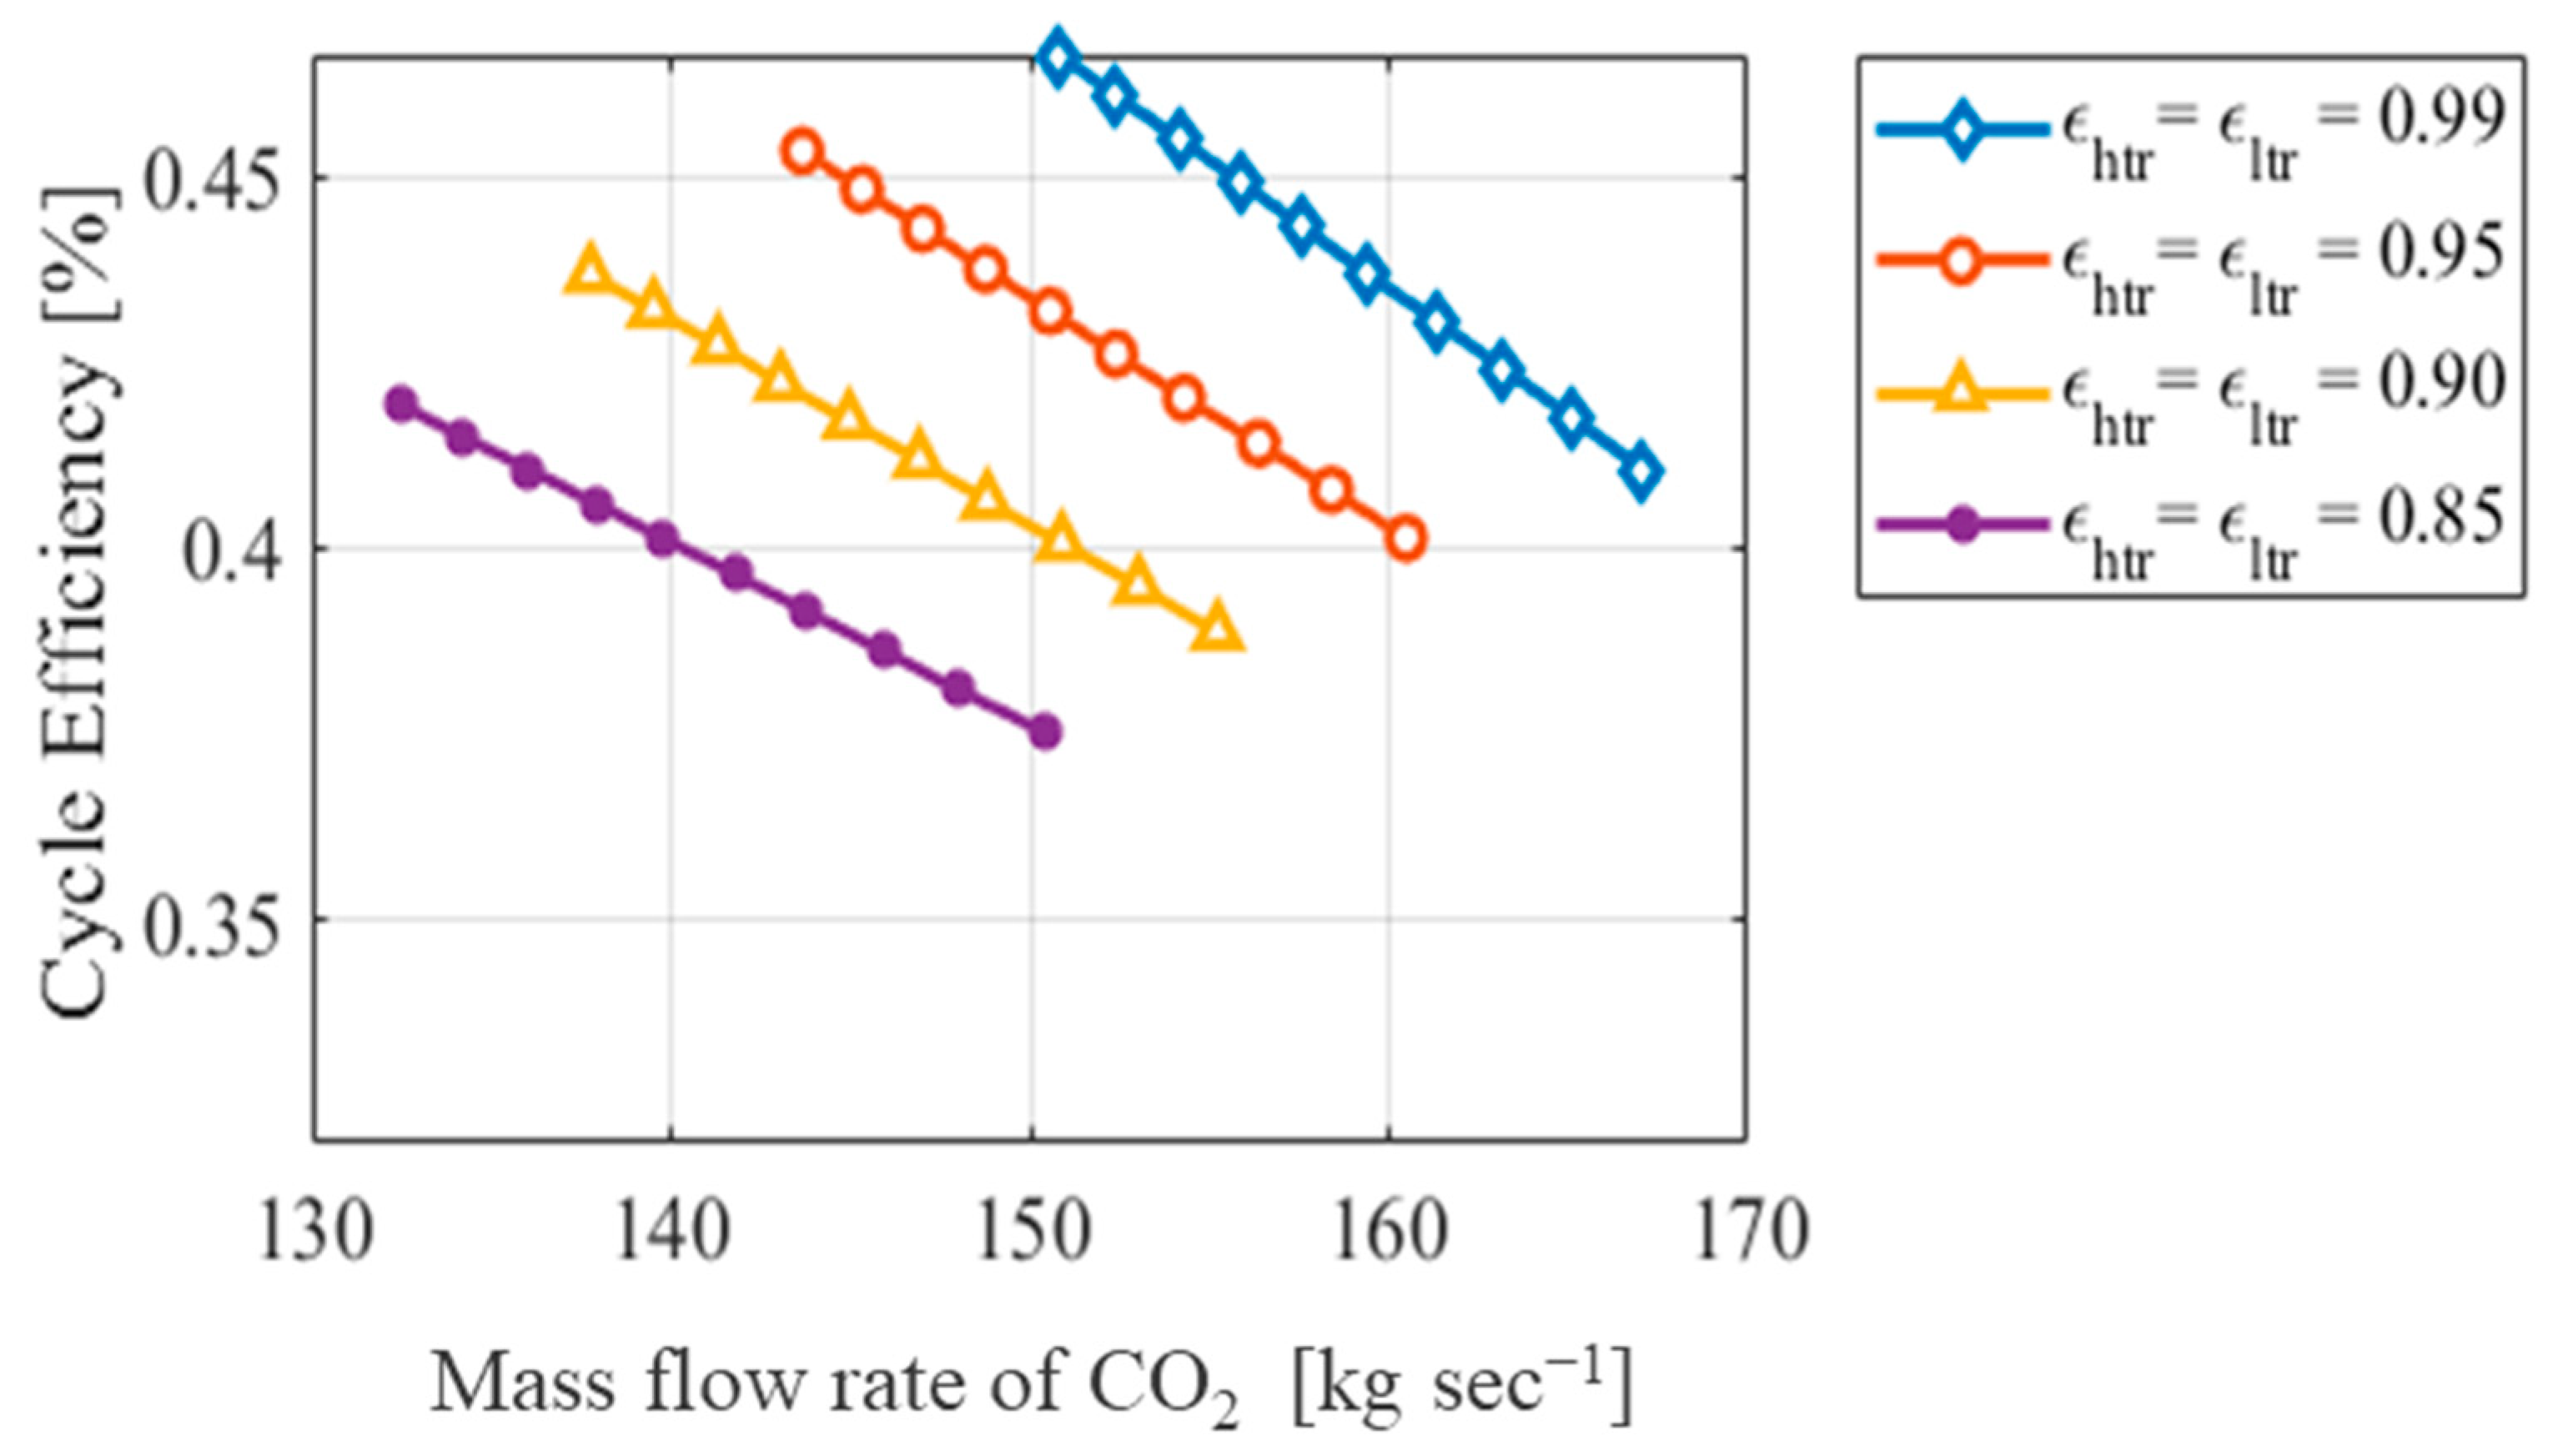
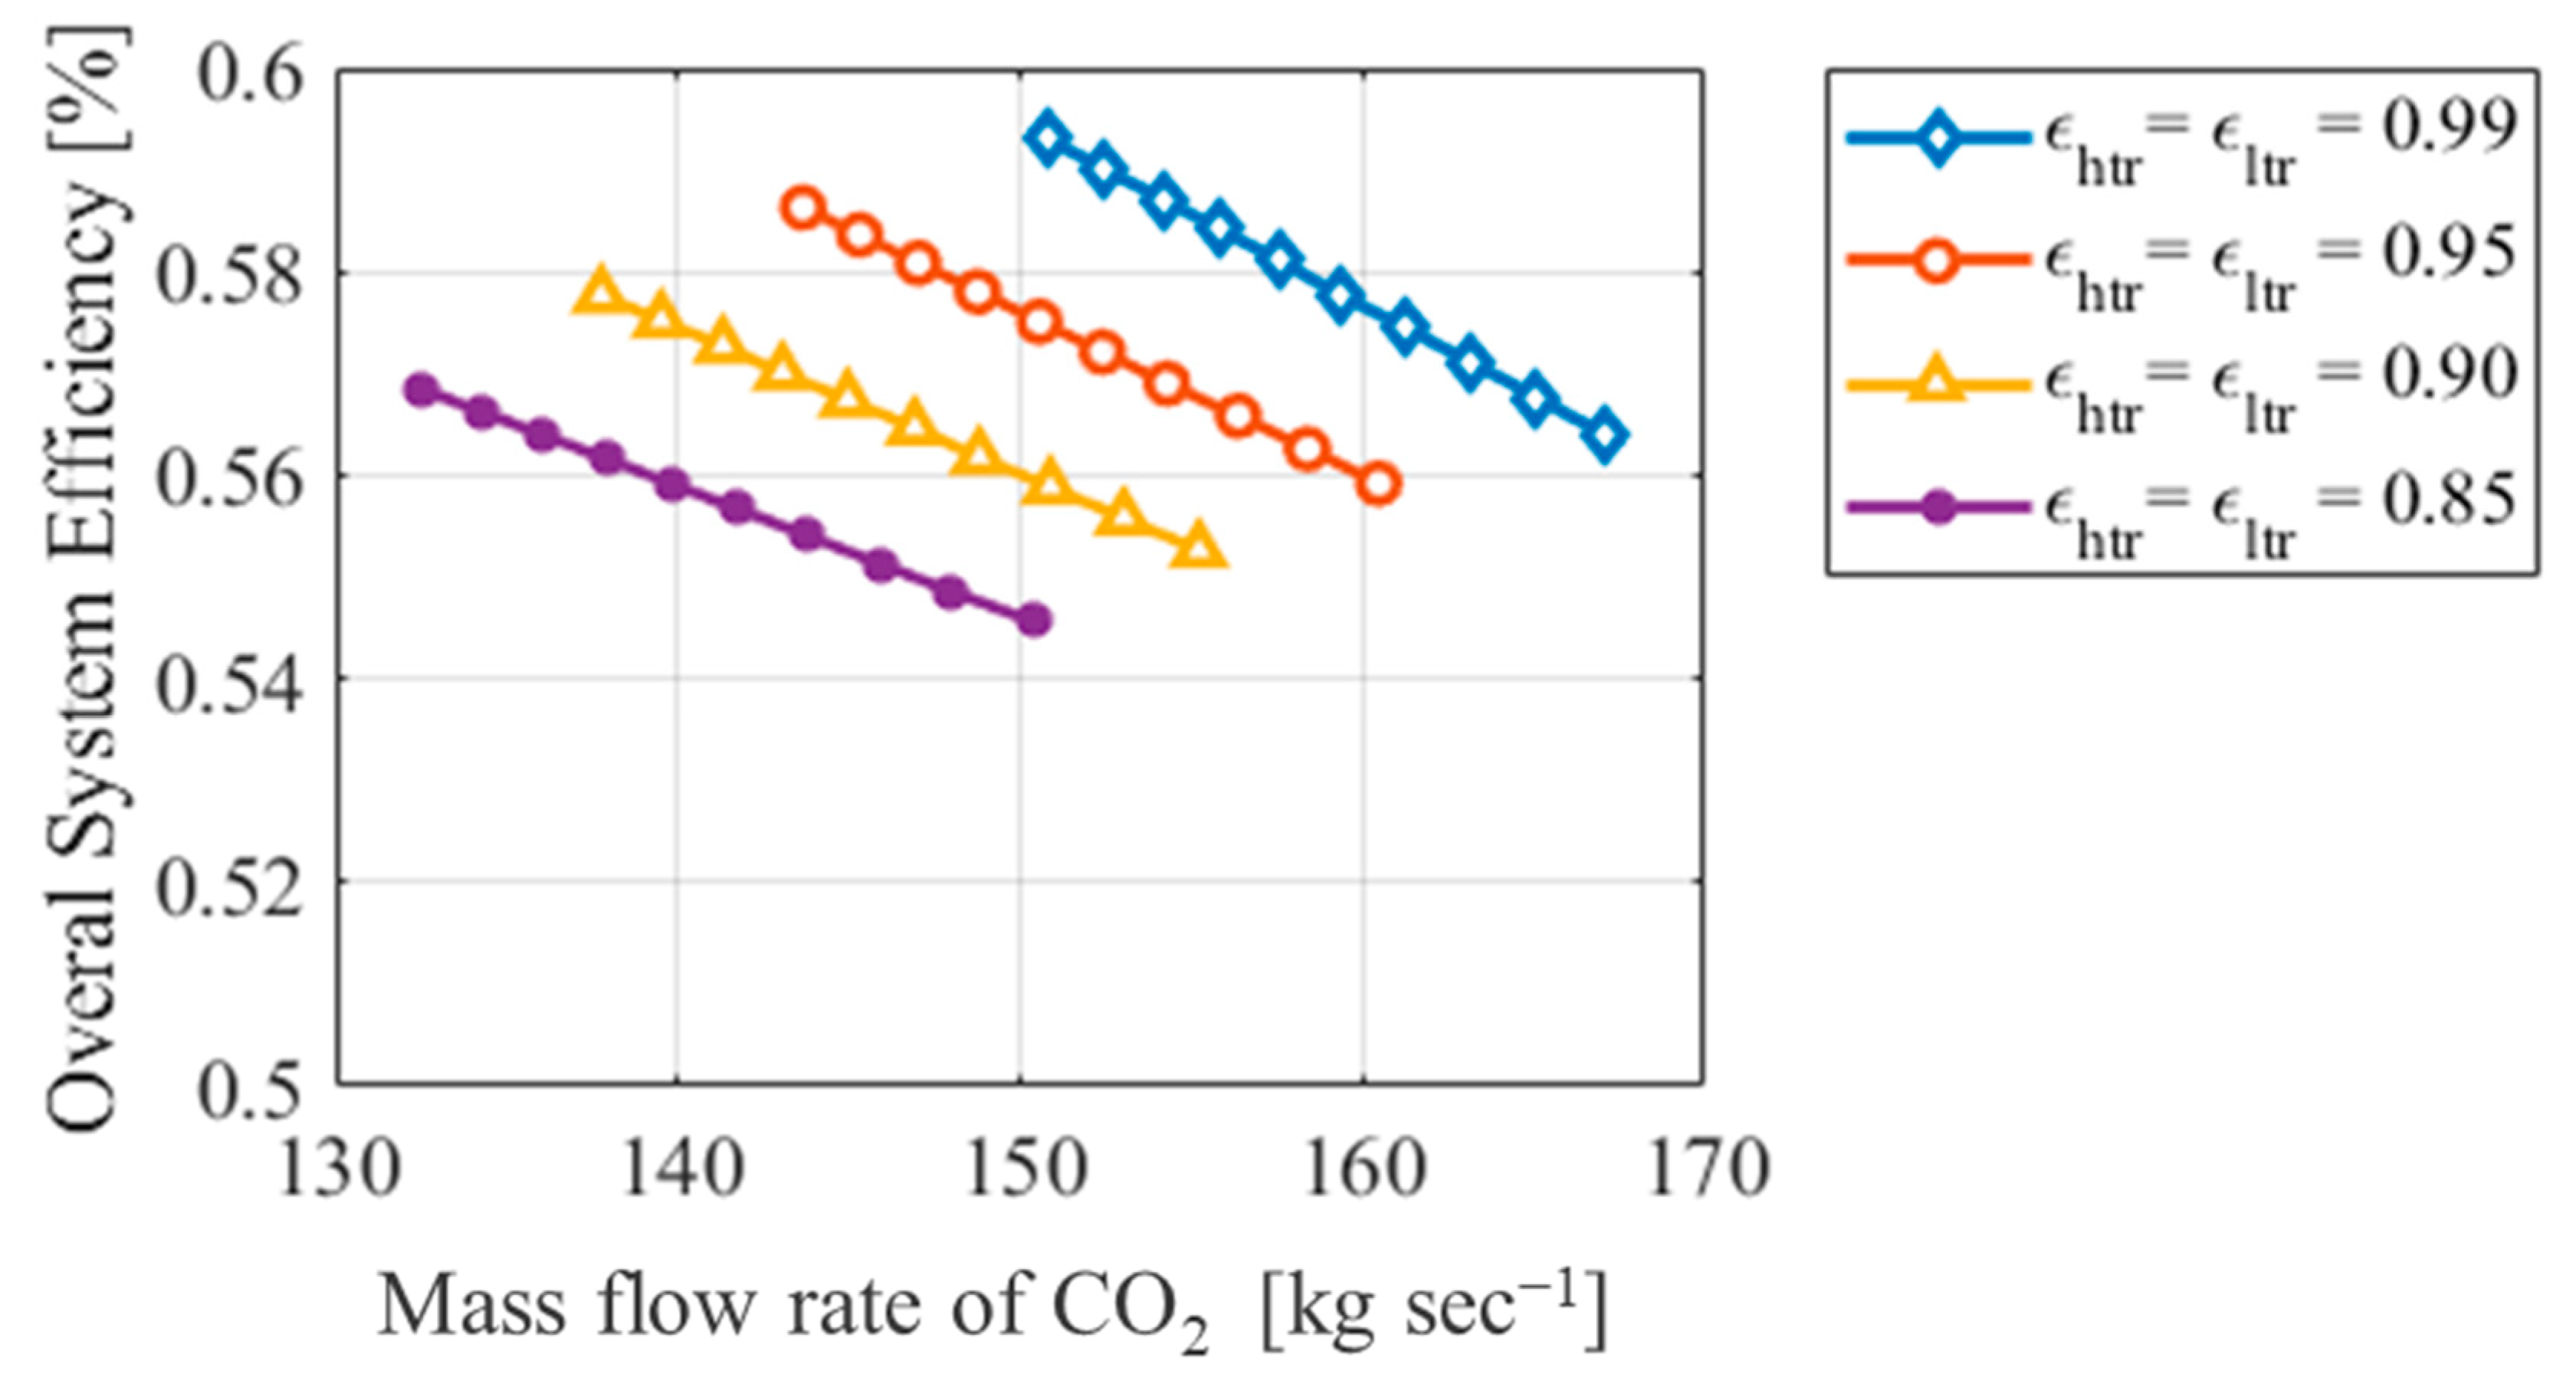
  • Impact of Recuperator Effectiveness on System Efficiency: Increasing recuperator effectiveness significantly boosts both the sCO2 cycle and overall system efficiency by improving heat recovery, resulting in better energy conversion.
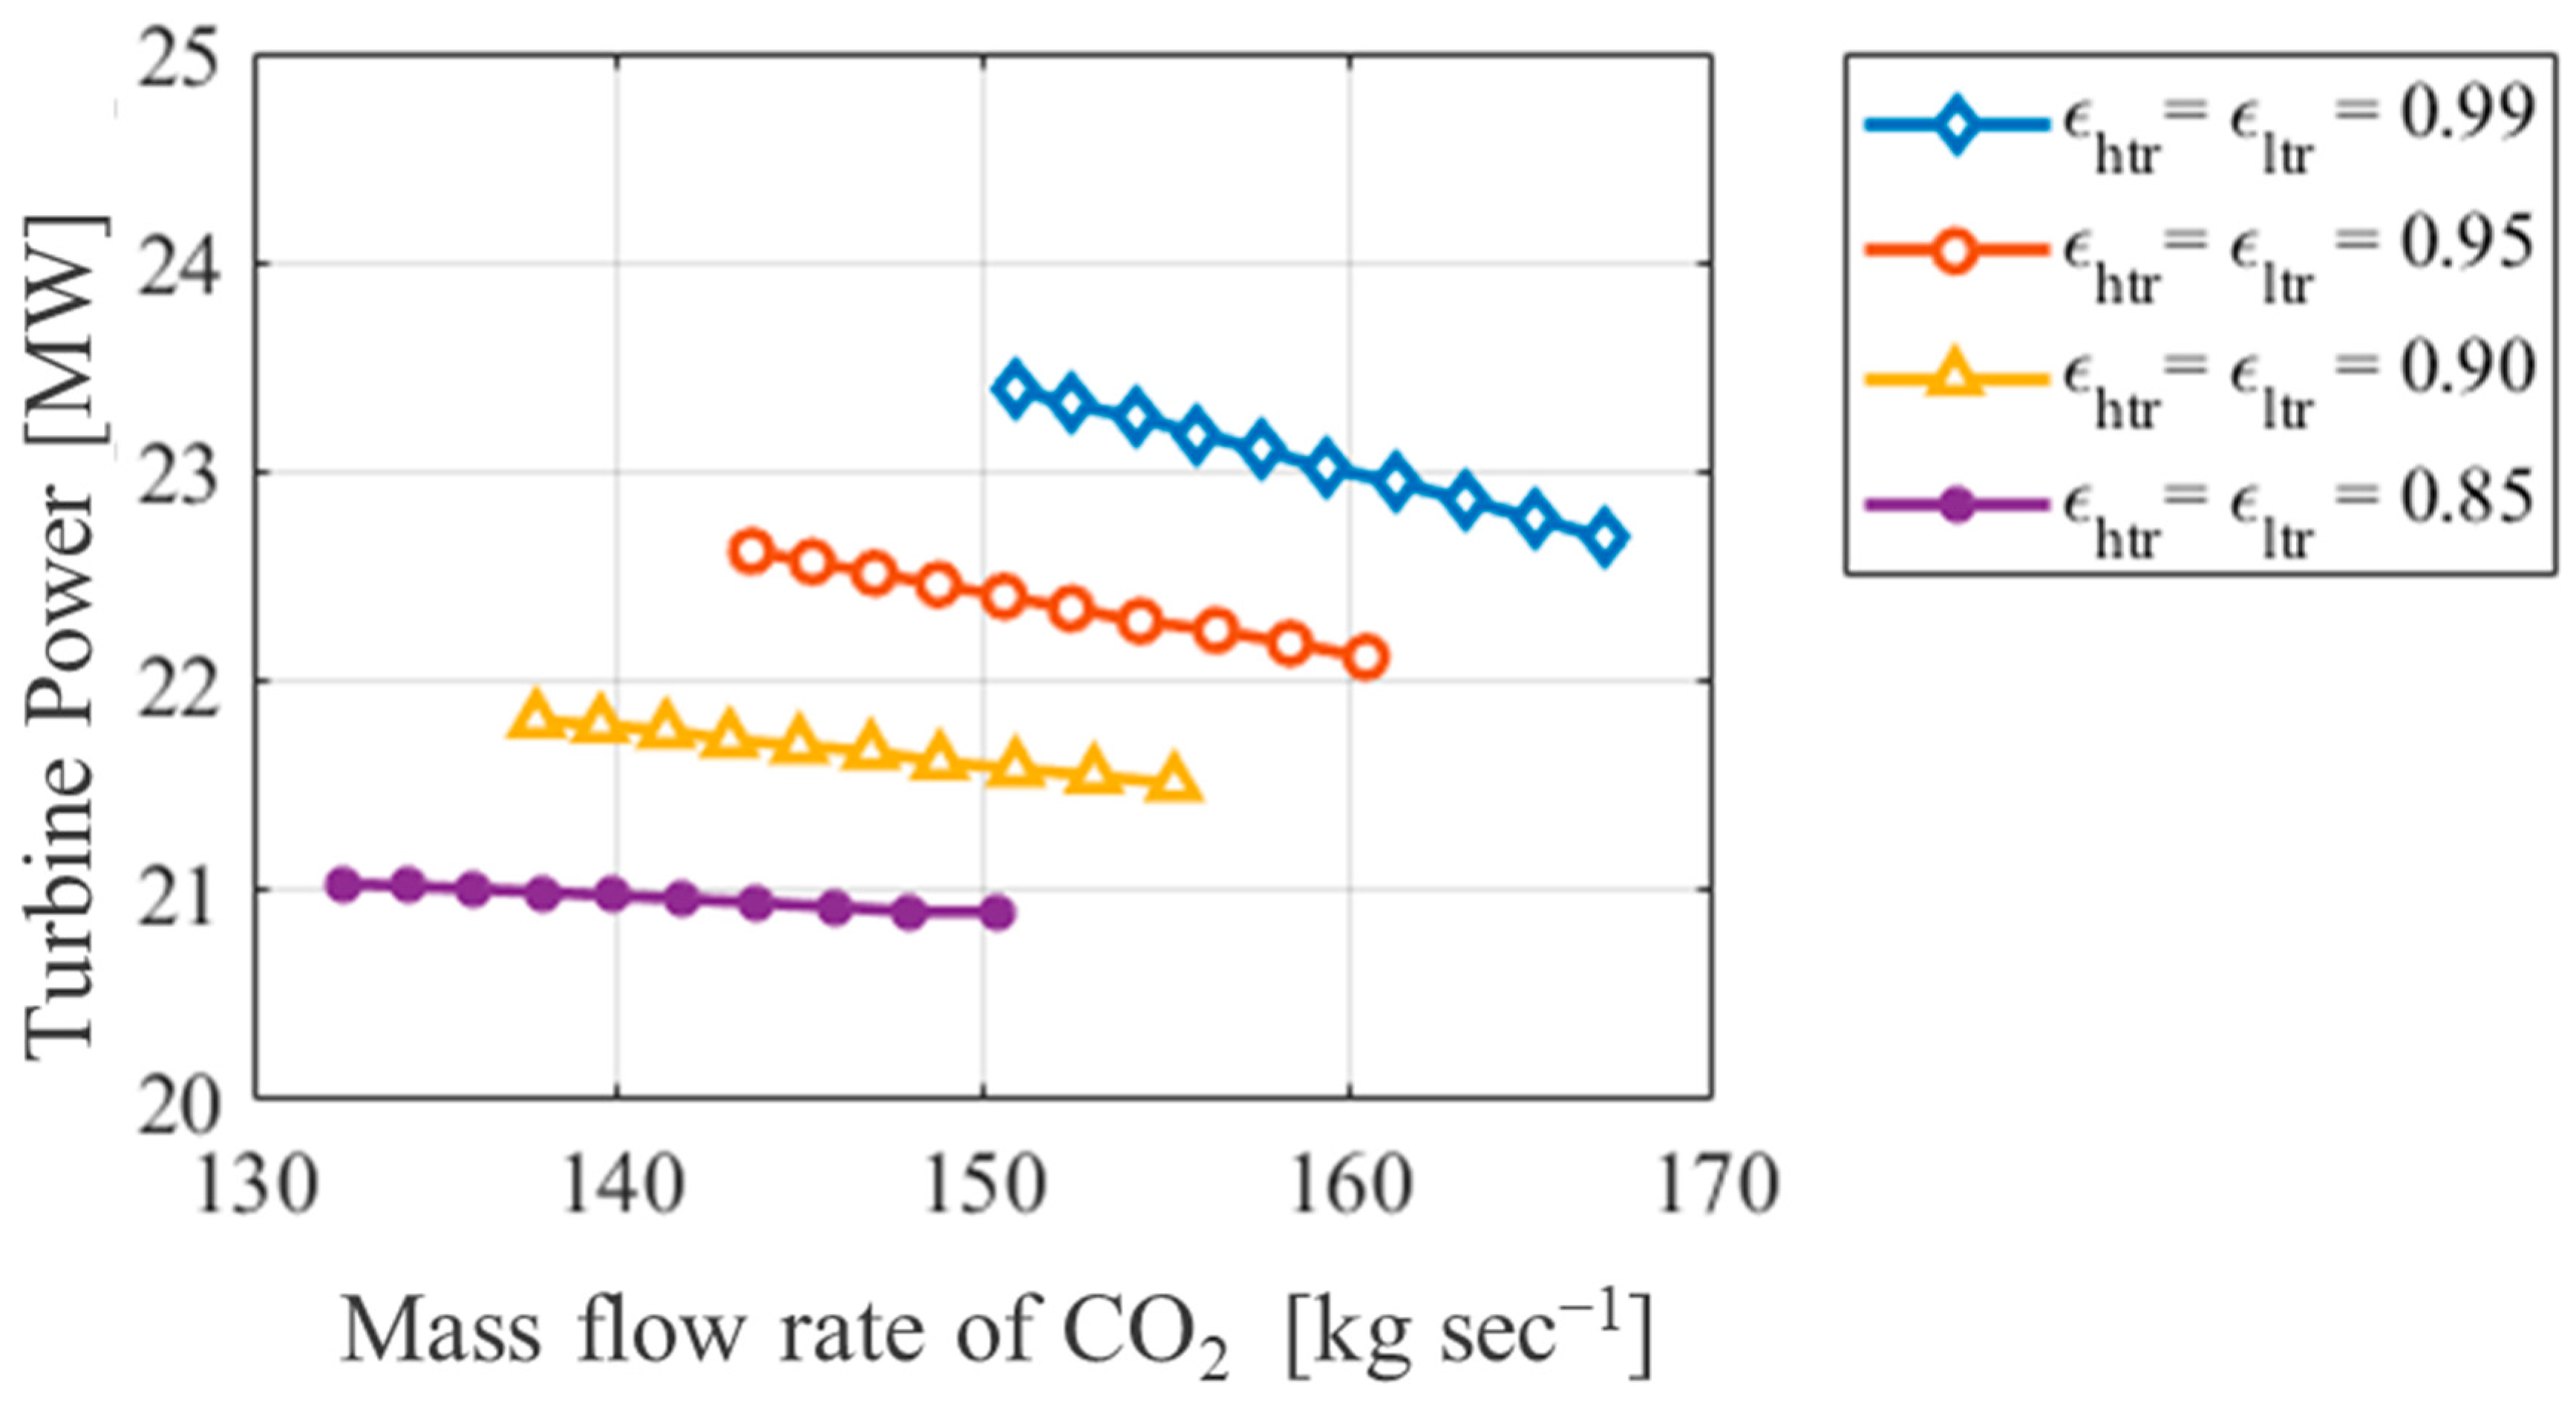
  • Sensitivity of Turbine Power to Heat Exchanger Effectiveness: While higher CO2 mass flow rates cause moderate reductions in turbine power due to lower inlet temperatures, increasing the recuperator effectiveness leads to significant improvements in turbine performance.
  • Overall System Efficiency: Incorporating the sCO2 Brayton Cycle as a bottoming cycle improves overall system efficiency, with the potential to raise it from 54% to nearly 59%, highlighting its value for energy-efficient marine propulsion systems.
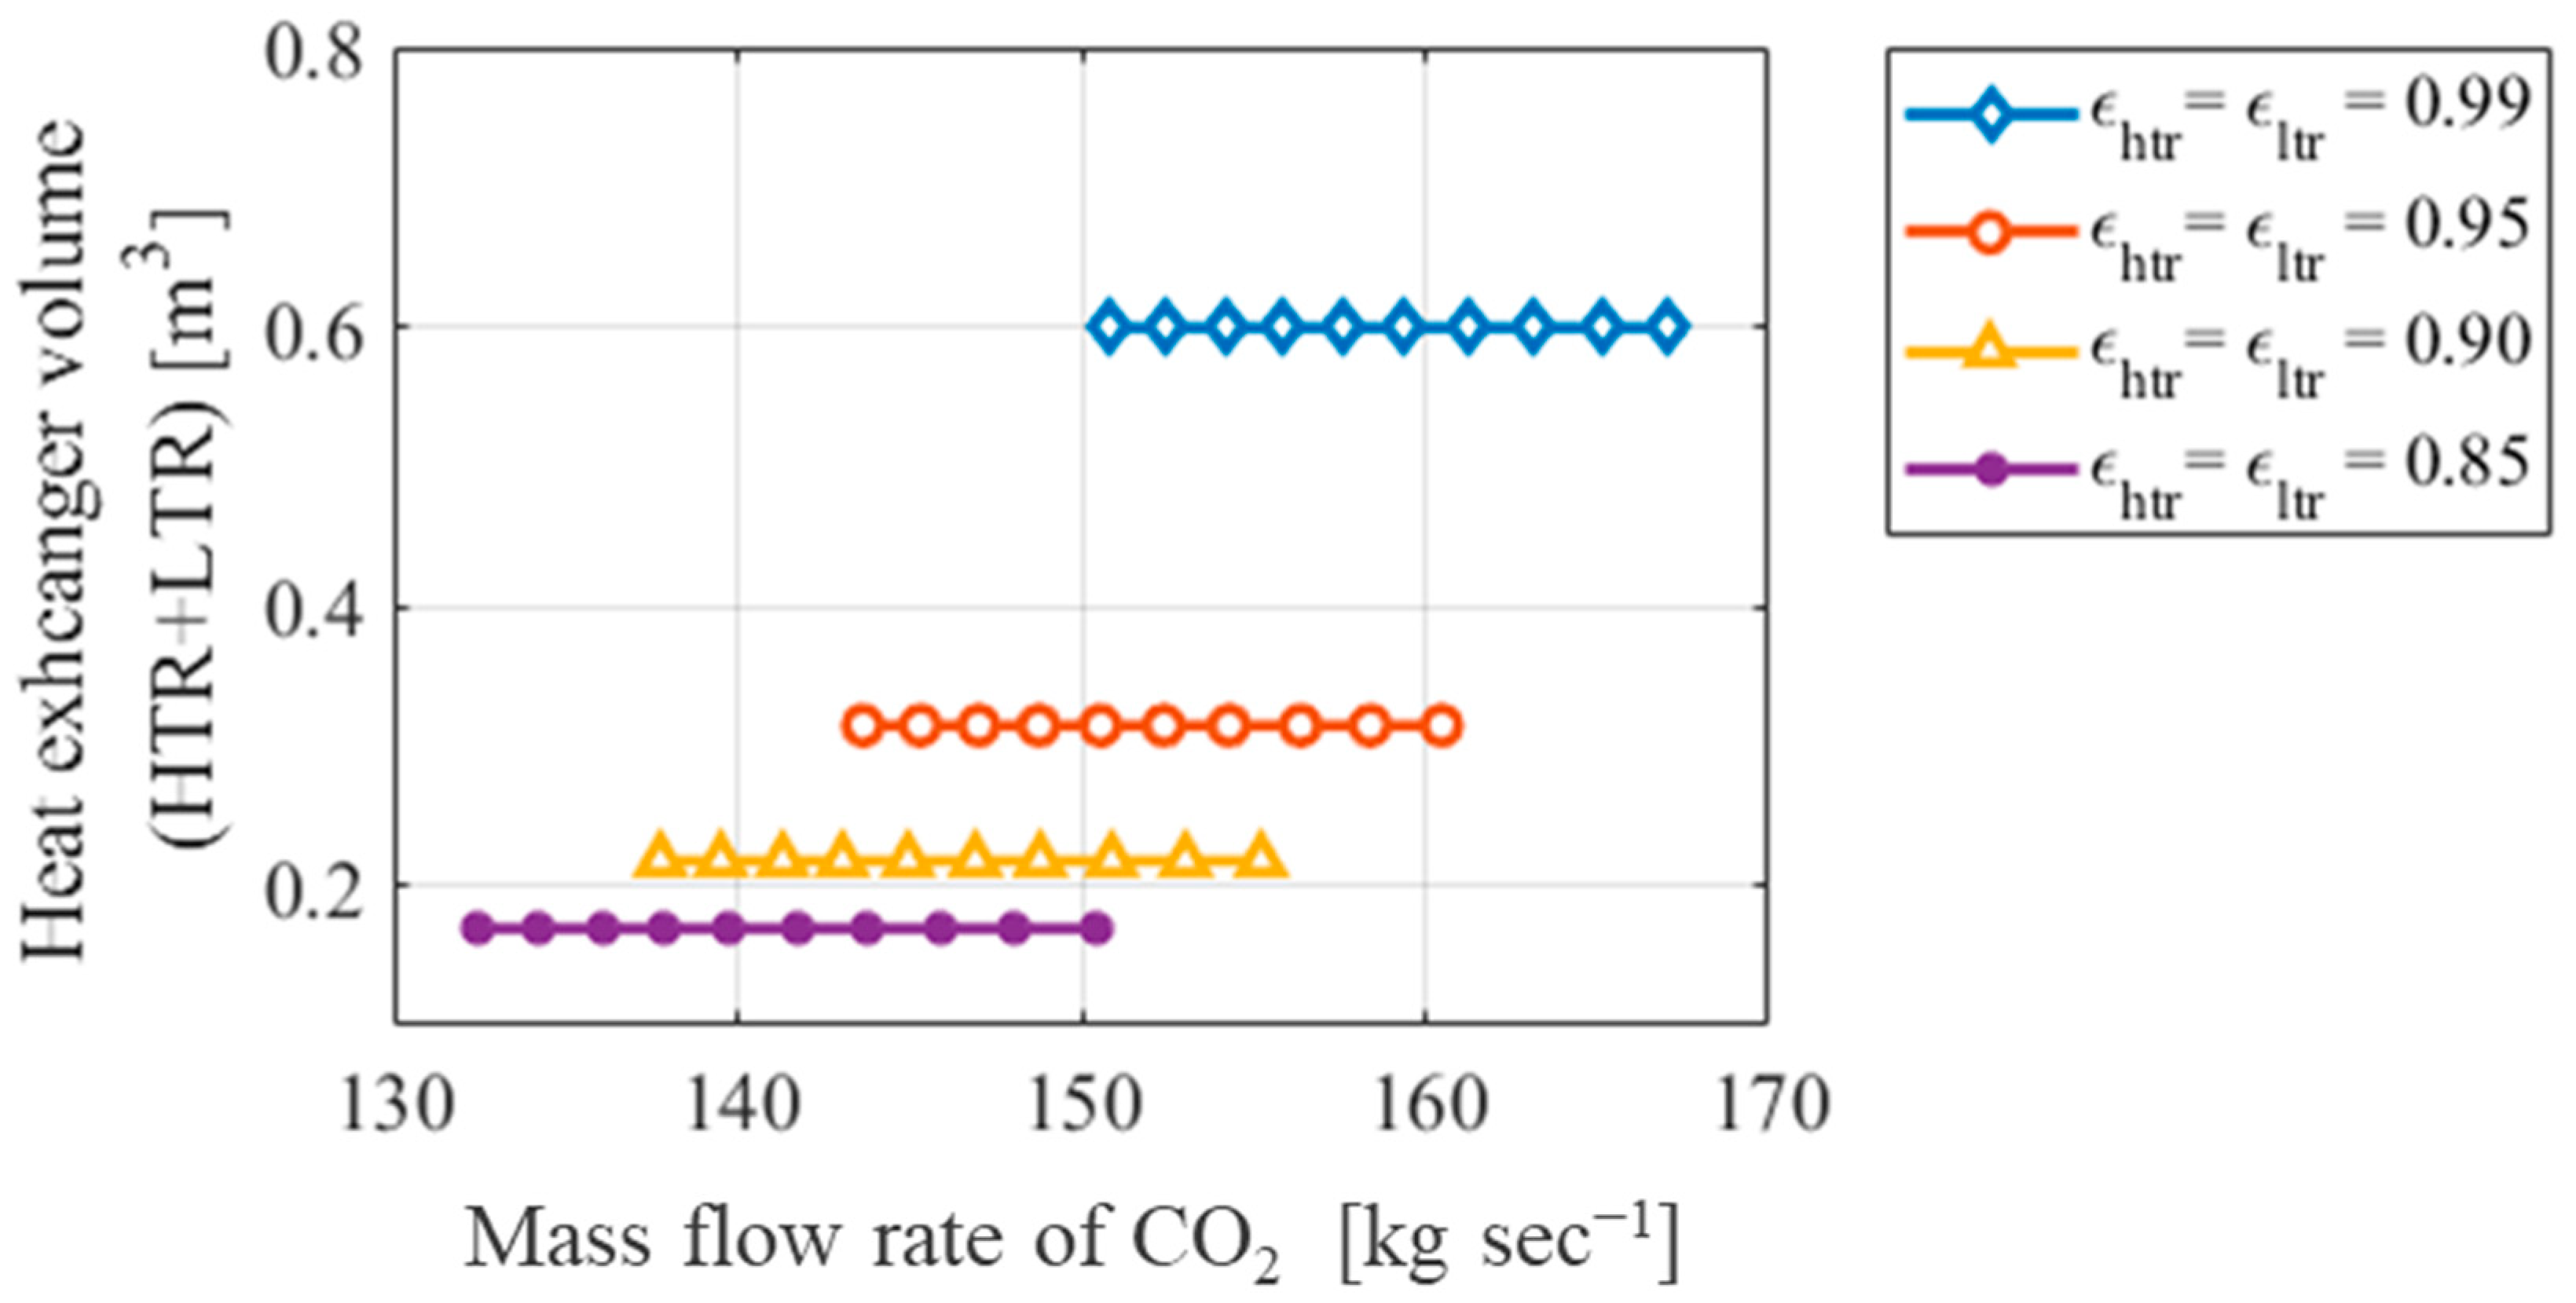
  • Trade-off Between Heat Exchanger Volume and Efficiency in Marine Applications: Higher recuperator effectiveness improves system efficiency but increases heat exchanger volume, which must be managed carefully in marine systems where space and weight are constrained.
These findings provide valuable insights for optimizing the sCO2-BC for marine applications and advancing energy-efficient propulsion technologies.

Author Contributions

Conceptualization, K.A.; methodology, K.A and B.A.; software, B.A. and A.A.; validation, K.A.; formal analysis, K.A.; resources, M.A.; writing—original draft preparation, B.A.; writing—review and editing, B.A., A.A. and M.A.; supervision, K.A. All authors have read and agreed to the published version of the manuscript.

Funding

This research received no external funding.

Data Availability Statement

The original contributions presented in the study are included in the article.

Conflicts of Interest

The authors declare no conflict of interest.

Nomenclature

f Relative pressure loss
h Specific enthalpy [ J k g 1 ]
m ˙ Mass flow rate [ k g s 1 ]
q Heat transfer [ k W ]
Q Total heat transferred [ k W ]
T Temperature [ K o r C o ]
w Specific work [ J k g 1 ]
W Power [ W ]
P Pressure [ k P a ]
R e Reynolds number
n Number of cells
x Split mass fraction
ϵ Effectiveness
η Efficiency
ρ Density [ k g m 3 ]
Sub- and Superscripts
0, 1, −10State
c y c Cycle
c o l d Cold side
h o t Hot side
i n Inlet
o u t Outlet
i i t h cell
t Turbine
c Compressor
r c Recompressor

References

  1. Persichilli, M.; Kacludis, A.; Zdankiewicz, E.; Held, T. Supercritical CO2 Power Cycle Developments and Commercialization: Why SCO2 Can Displace Steam Ste Am. In Proceedings of the Power-Gen India & Central Asia; (Conference Paper, India); 2012; pp. 19–21. Available online: https://www.echogen.com/documents/why-sCO2-can-displace-steam.pdf (accessed on 29 July 2024).
  2. Marchionni, M.; Bianchi, G.; Tassou, S.A. Review of Supercritical Carbon Dioxide (SCO2) Technologies for High-Grade Waste Heat to Power Conversion. SN Appl. Sci. 2020, 2, 611. [Google Scholar] [CrossRef]
  3. Wright, S.A.; Davidson, C.S.; Scammell, W.O. Thermo-Economic Analysis of Four SCO2 Waste Heat Recovery Power Systems. In Proceedings of the Fifth International SCO2 Symposium, San Antonio, TX, USA, 28–31 March 2016. [Google Scholar]
  4. Feher, E.G. The Supercritical Thermodynamic Power Cycle. Energy Convers. 1968, 8, 85–90. [Google Scholar] [CrossRef]
  5. Reale, F.; Calabria, R.; Massoli, P. Performance Analysis of WHR Systems for Marine Applications Based on SCO2 Gas Turbine and ORC. Energies 2023, 16, 4320. [Google Scholar] [CrossRef]
  6. Dostal, V.; Driscoll, M.J.; Hejzlar, P. A Supercritical Carbon Dioxide Cycle for Next Generation Nuclear Reactors, MIT-ANP-TR-100, Advanced Nuclear Power Technology Program Report; Research Project Report; MIT: Cambridge, MA, USA, 2004; Available online: https://web.mit.edu/22.33/www/dostal.pdf (accessed on 29 July 2024).
  7. Pham, H.S.; Alpy, N.; Ferrasse, J.H.; Boutin, O.; Quenaut, J.; Tothill, M.; Haubensack, D.; Saez, M. Mapping of the Thermodynamic Performance of the Supercritical CO2 Cycle and Optimisation for a Small Modular Reactor and a Sodium-Cooled Fast Reactor. Energy 2015, 87, 412–424. [Google Scholar] [CrossRef]
  8. Angelino, G. Carbon Dioxide Condensation Cycles For Power Production. J. Eng. Power 1968, 90, 287–295. [Google Scholar] [CrossRef]
  9. Saeed, M.; Khatoon, S.; Kim, M.H. Design Optimization and Performance Analysis of a Supercritical Carbon Dioxide Recompression Brayton Cycle Based on the Detailed Models of the Cycle Components. Energy Convers. Manag. 2019, 196, 242–260. [Google Scholar] [CrossRef]
  10. Saeed, M.; Kim, M.H. Analysis of a Recompression Supercritical Carbon Dioxide Power Cycle with an Integrated Turbine Design/Optimization Algorithm. Energy 2018, 165, 93–111. [Google Scholar] [CrossRef]
  11. Turchi, C.S.; Ma, Z.; Neises, T.W.; Wagner, M.J. Thermodynamic Study of Advanced Supercritical Carbon Dioxide Power Cycles for Concentrating Solar Power Systems. J. Sol. Energy Eng. 2013, 135, 041007. [Google Scholar] [CrossRef]
  12. Reyes-Belmonte, M.A.; Sebastián, A.; Romero, M.; González-Aguilar, J. Optimization of a Recompression Supercritical Carbon Dioxide Cycle for an Innovative Central Receiver Solar Power Plant. Energy 2016, 112, 17–27. [Google Scholar] [CrossRef]
  13. Al-Sulaiman, F.A.; Atif, M. Performance Comparison of Different Supercritical Carbon Dioxide Brayton Cycles Integrated with a Solar Power Tower. Energy 2015, 82, 61–71. [Google Scholar] [CrossRef]
  14. Brun, K.; Friedman, P.; Dennis, R. Fundamentals and Applications of Supercritical Carbon Dioxide (SCO2) Based Power Cycles; Woodhead Publishing: Cambridge, UK, 2017; ISBN 978-0-08-100804-1. [Google Scholar]
  15. Sarkar, J.; Bhattacharyya, S. Optimization of Recompression S-CO2 Power Cycle with Reheating. Energy Convers. Manag. 2009, 50, 1939–1945. [Google Scholar] [CrossRef]
  16. Sharma, O.P.; Kaushik, S.C.; Manjunath, K. Thermodynamic Analysis and Optimization of a Supercritical CO2 Regenerative Recompression Brayton Cycle Coupled with a Marine Gas Turbine for Shipboard Waste Heat Recovery. Therm. Sci. Eng. Prog. 2017, 3, 62–74. [Google Scholar] [CrossRef]
  17. Sarkar, J. Second Law Analysis of Supercritical CO2 Recompression Brayton Cycle. Energy 2009, 34, 1172–1178. [Google Scholar] [CrossRef]
  18. Saeed, M.; Berrouk, A.S.; Salman Siddiqui, M.; Ali Awais, A. Effect of Printed Circuit Heat Exchanger’s Different Designs on the Performance of Supercritical Carbon Dioxide Brayton Cycle. Appl. Therm. Eng. 2020, 179, 115758. [Google Scholar] [CrossRef]
  19. Saeed, M.; Alawadi, K.; Kim, S.C. Performance of Supercritical CO2 Power Cycle and Its Turbomachinery with the Printed Circuit Heat Exchanger with Straight and Zigzag Channels. Energies 2020, 14, 62. [Google Scholar] [CrossRef]
  20. Salim, M.S.; Saeed, M.; Kim, M.H. Performance Analysis of the Supercritical Carbon Dioxide Re-Compression Brayton Cycle. Appl. Sci. 2020, 10, 1129. [Google Scholar] [CrossRef]
  21. Saeed, M.; Kim, M.H. Thermal and Hydraulic Performance of SCO2 PCHE with Different Fin Configurations. Appl. Therm. Eng. 2017, 127, 975–985. [Google Scholar] [CrossRef]
  22. Saeed, M.; Kim, M.H. Thermal-Hydraulic Analysis of Sinusoidal Fin-Based Printed Circuit Heat Exchangers for Supercritical CO2 Brayton Cycle. Energy Convers. Manag. 2019, 193, 124–139. [Google Scholar] [CrossRef]
  23. Saeed, M.; Radaideh, M.I.; Berrouk, A.S.; Alawadhi, K. Machine Learning-Based Efficient Multi-Layered Precooler Design Approach for Supercritical CO2 Cycle. Energy Convers. Manag. X 2021, 11, 100104. [Google Scholar] [CrossRef]
  24. Saeed, M.; Berrouk, A.S.; Singh, M.P.; Alawadhi, K.; Siddiqui, M.S. Analysis of Supercritical CO2 Cycle Using Zigzag Channel Pre-Cooler: A Design Optimization Study Based on Deep Neural Network. Energies 2021, 14, 6227. [Google Scholar] [CrossRef]
  25. Gnielinski, V. New Equations for Heat and Mass Transfer in Turbulent Pipe and Channel Flow. Int. Chem. Eng. 1976, 16, 359–367. [Google Scholar]
  26. Ishizuka, T. Thermal-Hydraulic Characteristics of a Printed Circuit Heat Exchanger in a Supercritical CO2 Loop. In Proceedings of the 11th International Topical Meeting on Nuclear Reactor Thermal-Hydraulics, Avignon, France, 9–13 October 2005. [Google Scholar]
  27. Kim, S.G.; Lee, Y.; Ahn, Y.; Lee, J.I. CFD Aided Approach to Design Printed Circuit Heat Exchangers for Supercritical CO2 Brayton Cycle Application. Ann. Nucl. Energy 2016, 92, 175–185. [Google Scholar] [CrossRef]
  28. Kim, D.E.; Kim, M.H.; Cha, J.E.; Kim, S.O. Numerical Investigation on Thermal-Hydraulic Performance of New Printed Circuit Heat Exchanger Model. Nucl. Eng. Des. 2008, 238, 3269–3276. [Google Scholar] [CrossRef]
  29. Crespi, F.; Sánchez, D.; Rodríguez, J.M.; Gavagnin, G. Fundamental Thermo-Economic Approach to Selecting SCO2 Power Cycles for CSP Applications. Energy Procedia 2017, 129, 963–970. [Google Scholar] [CrossRef]
  30. Lee, J.; Lee, J.I.; Ahn, Y.; Yoon, H. Design Methodology of Supercritical CO2 Brayton Cycle Turbomachineries. Proc. ASME Turbo Expo 2013, 5, 975–983. [Google Scholar] [CrossRef]
Figure 1. (a) Layout of cycle. (b) TS diagram of cycle s C O 2 B C .
Processes 12 01956 g001aProcesses 12 01956 g001b
Figure 2. Discretized model of printed circuit heat exchanger.
Processes 12 01956 g002
Figure 3. Iterative loop flow diagram for PCHE-DAC routine.
Processes 12 01956 g003
Figure 4. The comparison of the temperature profiles computed using PCHE-DAC with the extracted temperature data from the CFD [21,28].
Processes 12 01956 g004
Figure 5. Main compressor power of sCO2-BC cycle with varying flow rates of mass flow rate of CO2 and effectiveness of recuperators.
Processes 12 01956 g005
Figure 6. Recompressor power of sCO2-BC cycle with varying flow rates of mass flow rate of CO2 and effectiveness of recuperators.
Processes 12 01956 g006
Figure 7. Combined cycle power of sCO2-BC cycle with varying flow rates of mass flow rate of CO2 and effectiveness of recuperators.
Processes 12 01956 g007
Figure 8. Turbine power of sCO2-BC cycle with varying flow rates of mass flow rate of CO2 and effectiveness of recuperators.
Processes 12 01956 g008
Figure 9. Net cycle work of sCO2-BC cycle with varying flow rates of mass flow rate of CO2 and effectiveness of recuperators.
Processes 12 01956 g009
Figure 10. Heat exchanger volume of sCO2-BC cycle with varying flow rates of mass flow rate of CO2 and effectiveness of recuperators.
Processes 12 01956 g010
Figure 11. sCO2-BC cycle efficiency with varying flow rates of mass flow rate of CO2 and effectiveness of recuperators.
Processes 12 01956 g011
Figure 12. Overall system (combined cycle) efficiency with varying flow rates of mass flow rate of CO2 and effectiveness of recuperators.
Processes 12 01956 g012
Table 1. Pressure drop and heat transfer correlations for the PCHEs.
ConfigurationCorrelations Channel Geometry
Genelisi [25] N u   =   ( f / 8 ) ( R e 1000 ) P r 1 + 12.7 f 8 0.5 × P r 2 3 1
f   = 1 1.8 l o g 10 R e 1.5 2
3000 R e 60,000
0.7 P r 1.2
Processes 12 01956 i001
Ishizuka et al. [26] h = 0.210 R e + 44.16
f = 2 × 10 6 R e + 0.1023
5000 R e 13,000
( θ = 40 0 )
Processes 12 01956 i002
Kim et al. [27] N u = 0.0292 R e 0.8742 , f = 0.2515 R e 0.2031 ; ( θ = 32 0 )
N u = 0.0188 R e 0.8742 , f = 0.2881 R e 0.1322 ; ( θ = 40 0 )
2000 R e 58,000
0.7 P r 1.0
Saeed and Kim [22] N u = 0.041 R e 0.83 P r 0.95 , f = 0.115 R e 0.13 ; ( θ = 40 0 )
3000 R e 60,000 ,   0.7 P r 1.2
Table 2. Details of the boundary conditions used for the validation study [26].
H o t S i d e C o l d S i d e
P i n h [ k P a ] T i n h [ ° C ] m h [ k g s 1 ] P i n c [ k P a ] T i n c [ ° C ] m c [ k g s 1 ]
2520 279.9 0.0001445 8353.22 107.9 0.0003152
Table 3. Assessment of the HEADAC and experimental data.
PCHE-DACExperimental
Results [26]
% Difference
Δ T h [ ° C ]   169.20161.54.5%
Δ T c [ ° C ]   142.90141.15.18%
Table 4. Components’ parameters used for the cycle simulation.
ParametersValues
Compressor inlet temperature ( T 1 ) [ K ] 308
Compressor inlet pressure ( P 1 ) [kPa] 7500
Cycle pressure ratio ( P r ) 3.2
Turbine inlet temperature T 7 [ K ]
CO2 mass flow rate ( m ˙ )   [kg s−1]
Split mass fraction
C o n t r o l e d b y m a s s f l o w r a t e o f t h e C O 2
Varied from 132 to 165
0.75
Effectiveness of the LTR Varied from 0.8 to 0.99
Effectiveness of the HTR
Turbine efficiency
Compressor efficiency
Varied from 0.8 to 0.99
90%
85%
Disclaimer/Publisher’s Note: The statements, opinions and data contained in all publications are solely those of the individual author(s) and contributor(s) and not of MDPI and/or the editor(s). MDPI and/or the editor(s) disclaim responsibility for any injury to people or property resulting from any ideas, methods, instructions or products referred to in the content.

