Article

Data-Based Modeling, Multi-Objective Optimization, and Multi-Criterion Decision-Making to Maximize the Electro-Oxidation of Metoprolol over Boron-Doped Diamond Electrodes in a Flow-By Reactor

by
Alejandro Regalado-Méndez
1,*,
Diego Vizarretea-Vásquez
1,
Edson E. Robles-Gómez
1,
Reyna Natividad
2,
Carlos J. Escudero
3 and
Ever Peralta-Reyes
1
1
Research Laboratories, Universidad del Mar-Campus Puerto Ángel, Puerto Ángel 70902, Oaxaca, Mexico
2
Chemical Engineering Laboratory, Centro Conjunto de Investigación en Química Sustentable, UAEM-UNAM, Universidad Autónoma del Estado de México, Toluca 50200, Estado de México, Mexico
3
Departament of Biotechnology and Environmental, Universidad Autónoma de Guadalajara, Av. Patria 1201, Zapopan 45129, Jalisco, Mexico
*
Author to whom correspondence should be addressed.
Processes 2024, 12(9), 1958; https://doi.org/10.3390/pr12091958
Submission received: 20 August 2024 / Revised: 6 September 2024 / Accepted: 8 September 2024 / Published: 12 September 2024

Abstract

:
Metoprolol is a cardioselective beta-blocker drug often used to treat hypertension, but it is considered as a hazardous organic persistent contaminant in wastewater. In this study, a 2.5 L solution of metoprolol (50 mg/L) underwent electro-oxidation in a flow-by reactor using boron-doped diamond electrodes in the batch recirculation mode. The study used multi-objective optimization and multi-criterion decision-making to determine the optimal operating parameters. The response surface methodology and a central composite rotatable design were used with three factors (pH0: 5–8, I: 2.5–4 A, and Q: 0.8–1.7 L/min) to model the chemical oxygen demand’s (COD’s) removal efficiency and the total organic carbon’s (TOC’s) removal efficiency. The experimental responses were modeled by reduced third- and second-order polynomials with determination coefficients (R2) of 0.9816 and 0.9430. The optimal operating parameters were found to be pH0 5, an I value of 3.84 A, and a Q value of 0.8 L/min with an electrolysis time of 7.5 h, resulting in a maximum COD removal efficiency of 60.8% and a TOC removal efficiency of 90.1%. The specific energy consumption was calculated as 9.61 kWh/mg of TOC, with a total operating cost of 0.77 USD/L. In conclusion, this study showed that the electrochemical process is efficient and reliable for treating wastewater containing metoprolol.

Graphical Abstract

1. Introduction

Because of the scarcity of water on Earth, caused by global warming, and increased contamination of water sources because of global industrialization in recent years, the United Nations’ member states have declared the decontamination and sanitation of wastewater as priority tasks through Agenda 2030, which is the basis for objective 6 (clean water and sanitation) of the sustainable development goals [1]. Regarding contamination by anthropogenic activities, the emerging contaminant (EC) molecules in oceans, rivers, lakes, and soils from sources such as farming, cattle raising, and highways can provoke human health and environmental harm [2]. ECs include dyes, personal care products, endocrine disruptors, and drugs (e.g., antibiotics and beta-blockers among others), which are usually discarded in water bodies [3,4,5]. These pollutants are persistent, transported over long-range distances, bioaccumulate, and are highly toxic because they produce allergic reactions, immune system damage, endocrine disruption, and liver and kidney damage; increase cancer risk; cause neuronal damage; possess mutagenicity; and impact children’s development [6]. Metoprolol (MET) is the beta-blocker most used worldwide as a treatment for hypertension, tachycardia, cardiac insufficiency, heart failure, and myocardial infarction [7]. Approximately 1.28 billion people are suffering from arterial hypertension [8] worldwide, and in Mexico, around 30 million Mexicans are affected by arterial hypertension [9]. Between 3 and 10% of the medication dosage is excreted without undergoing any transformation and is released through urine [10]. Also, MET has been detected in treated wastewater from conventional treatment plants in Asia, America, and Europe, at concentrations of 0.268, 0.212, and 5.762 µg/L, respectively [11,12]. Therefore, it is crucial to remove this medication because of its health risks for both humans and aquatic organisms.
Numerous technologies have been developed to eliminate ECs (e.g., metoprolol) from wastewater, including physical, chemical, and biological. However, physical treatments are unable to completely degrade ECs; chemical methods produce secondary pollutants and are costly, and biological methods struggle to treat high-concentration pollutants, require long treatment times, and are sensitive to the environment [13]. In this sense, electrolysis, an advanced oxidation process, has emerged as an efficient and green technology for removing ECs, such as MET. It offers high efficiency, environmental compatibility, flexibility for automation, easy maintenance, and the possibility of the mineralization of recalcitrant pollutants and does not need additional chemicals to conduct the process [6,14,15,16].
In the process of electrolysis, electrodes play a crucial role. Various types of electrodes (e.g., Pt, PbO2, SnO2, Ta2O5-IrO2, and Nb2O5-IrO2) have been developed, including carbon-based materials (e.g., graphite, graphene, carbon nanotubes, and boron-doped diamond (BDD) electrodes). BDD electrodes are especially preferred for electrolysis because of their chemical, electrochemical, and mechanical stabilities [17]. They are also known for their ability to produce a large amount of hydroxyl radicals (OH, with an oxidation potential of 2.8 V) [18,19,20] and other oxidized species, depending on the electrolyte medium used. For example, in Na2SO4 media, persulfate, peroxydisulfate, and sulfate radicals are formed [21,22,23,24,25,26].
The removal of MET has been studied primarily using ozonation [27,28], UV/H2O2 [29], photo-oxidation [30], Fenton [31], photo-Fenton [7], heterogeneous photocatalyst [32], and photo-Fenton-like [7] methods, with a batch reactor being the most used configuration. Only a few studies on electro-oxidation for MET removal were found [33,34,35,36], with a batch lab reactor also being the commonly used configuration in these studies. The flow-by reactor is the best reactor configuration for electro-oxidizing recalcitrant pollutants because of its high mass transport coefficients and homogeneous current distribution on the electrodes [37]. It is important to note that no studies have reported optimizing the removal of MET (see Table 1).
Regarding the optimization of the electro-oxidation process for ECs carried out in a flow-by reactor setup, the most common method for performing the optimization is the response-surface-methodology-driven DoE [38,39,40]. Also, the central composite rotatable design (CCRD) is widely utilized [41] because it offers sufficient data for testing the lack of the fit.
Table 1 summarizes the literature results related to the removal of MET using different treatment technologies. It can be observed that the related literature reveals the high removal efficiency of MET; however, it is worth pointing out that the treated volume used in many cases is very low, on the order of fractions of liters.
Table 1. Removal of MET using different non-optimized technologies.
Process TypeReaction ConditionsResultsRef.
MET
Removal (%)
TOC
Removal (%)
UV[MET]0 = 50 mg/L; H2O2 = Stoich.; pH0 5.6; λ = 254 nm; Vtreated = 0.1 L; Catalyst: Cu-TiO2; t = 100 min9225[7]
Ozonation (O3)[MET]0 = 200 µg/L; [O3] = 380 mg/L h; Vtreated = 0.8 L; pH0 11; t = 120 min63.4---[27]
Adsorption and Photocatalysis[MET]0 = 50 mg/L; pH0 9; λ = 250–400 nm; Vtreated = 0.025 L; 100 pm; Catalyst: TiO2; t = 300 min10063[42]
Thermal plasma and UV/H2O2[MET]0 = 5 µg/L; Plasma 150 W; 1 MHz; t = 120 min; Vtreated = 0.1 L; T = 35 °C64.7---[29]
Fenton[MET]0 = 148.5 mg/L; Vtreated = 0.1 L; T = 35 °C; pH0 3; [Fe3+]0 = 0.5 mM; t = 360 min---80[43]
The focus of this study was to maximize the degradation of MET in terms of the COD and TOC removal efficiencies. This was achieved through electro-oxidation in a flow-by reactor using two Nb/BDD electrodes operating in the batch recirculation mode. The multi-objective optimization was carried out using RSM driven by CCRD, with three operating parameters, namely, the current intensity (I), initial pH (pH0), and volumetric flow rate (Q). In addition to the optimization process, this study also involved model validation, determination of the total operating cost, kinetic rate models for the degradation of MET, COD removal, TOC removal, and phytotoxicity testing.

2. Materials and Methods

2.1. Reagents and Aqueous MET Solution

Sulfuric acid (H2SO4), sodium hydroxide (NaOH), and metoprolol tartrate salt (MET), with purities of 95, 97, and 99.9%, respectively, were purchased from the Sigma-Aldrich Company (Ciudad de México, Mexico). Additionally, sodium sulfate (Na2SO4), with a purity of 99%, was supplied by the Karal Group (Ciudad de México, Mexico, a Mexican Company).
Before each experiment, a synthetic aqueous solution containing 50 mg/L of MET in 2.5 L with 0.1 M Na2SO4 was freshly prepared. This MET solution was added to the reservoir tank of the electrochemical plant (as shown in Figure 1) and homogenized by recirculating for 15 min. Distillate water was used for preparing all the aqueous solutions containing 50 mg/L of MET. Table 2 shows the physicochemical properties of the MET compound.
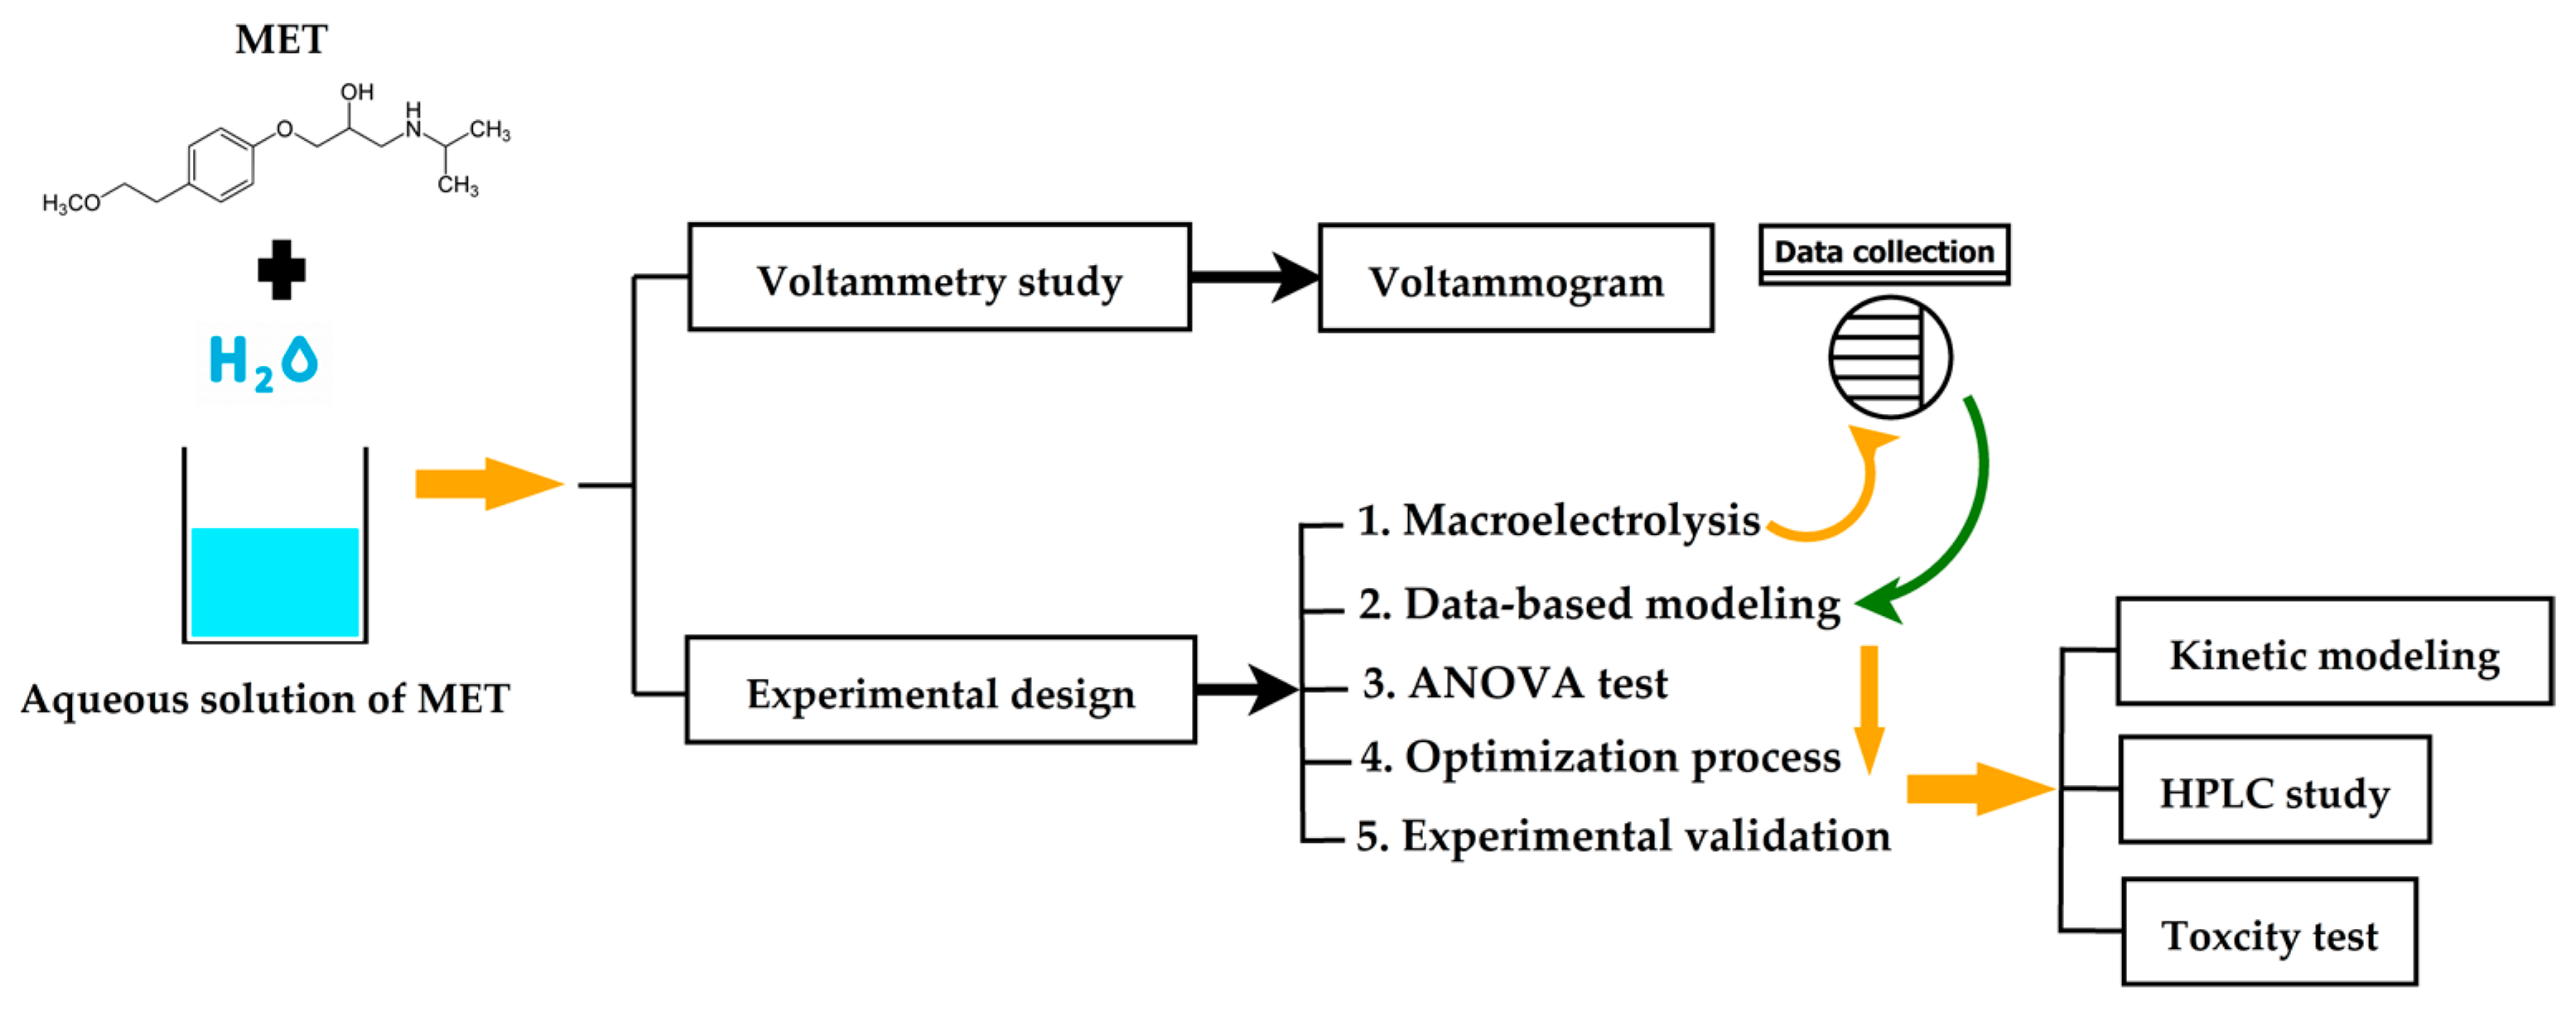
Scheme 1 depicts the flowchart diagram of the methodology employed in this research. Also, this scheme shows the stages followed to conduct the data-based modeling, multi-objective optimization, and multi-criterion decision-making to maximize the electro-oxidation of the metoprolol over boron-doped diamond electrodes in a flow-by reactor. Additionally, each step is thoroughly described in detail in the following subsections.

2.2. Voltametric Experiment

A micro-electrolysis test was performed using an Autolab potentiostat/galvanostat® 30 controlled using the GPE software V.4.3. The test used a three-electrode cell (100 mL) with Ag/AgCl, a graphite bar, and a BDD electrode (with an electroactive area of 1 cm2) serving as reference, auxiliary, and working electrodes, respectively. Cyclic voltammetry was conducted in a voltage range from 0 to 2 V, at a scan rate of 100 mV/s, at atmospheric pressure, and at a temperature of 25 °C. Also, the aqueous solution containing 50 mg/L of MET was stirred for 1 min to attain a homogeneous mixture.

2.3. Electrochemical Plant

The electro-oxidation of metoprolol took place at an electrochemical plant (see Figure 1) consisting of an electrochemical flow-by reactor (FBR) with a width of 4.5 cm, a channel thickness of 0.5 cm, an electroactive length of 20 cm; two BDD electrodes (20 cm) that function as an anode and a cathode; a 3.5 L polycarbonate reservoir; a heat exchanger to maintain a constant room temperature; a magnetic pump operating at 300 rpm; a glass flowmeter for the liquid flow rate control; a power supply for electrode energization; and PVC pipelines, connectors, and valves. Additional information about the electrochemical FBR can be found in the authors’ previous work [46].

2.4. Experimental Design

A 2.5 L aqueous solution containing 50 mg/L of MET was added to the electrochemical plant reservoir (refer to Figure 1). The studied operating parameters included the initial pH (pH0), current intensity (I), and volumetric flow rate (Q), as outlined in Table 3.
In Table 3, the lower, central, highest, and axial (±α) levels of each operating parameter are encoded as −α, −1, 0, +1, and +α, following the Equation (1):
l = x l , i x l , 0 Δ x l l = A ,   B ,   a n d C i : α ,   1 ,   0 ,   + 1 ,   + α
A central composite rotatable design (CCRD) with three operating parameters was adopted as an experimental design comprising 2K factorial trials, 2K axial trials, and K central trials, giving 17 trials (see Section 3) The experimental design, data-based modeling, ANOVA test, and optimization were conducted using Design Expert® V.10 software (license number 9839-2917-5744-6919 from State-Ease, Inc., Minneapolis, MN, USA). Additionally, the Q range was chosen according to the authors’ previous work, where ibuprofen was electrochemically oxidized in the same FBR [40].

2.5. Chemical Analysis

Samples of the MET solution for each trial were taken directly from the reservoir of the electrochemical plant to determine the chemical oxygen demand (COD) and total organic carbon (TOC) of MET solutions before and after the electro-oxidation treatment. The COD determination was gauged using the standard method (5220B) given in [47]. The TOC determination was measured using a 6001 TOC analyzer (ShimadFzu, Kyoto, Japan). The pH was measured with an HI2210 Hanna potentiometer.

2.6. Calculations

The COD removal efficiency of the MET (ηCOD) was computed based on the change in the COD (mg/L) quantity between the initial sample and the treated sample, according to Equation (2):
η C O D = [ C O D ] 0 [ C O D ] t [ C O D ] 0 × 100
where [ C O D ] 0 and [ C O D ] t are the COD of the MET solution before and after the electro-oxidation treatment.
The TOC removal efficiency of the MET (ηTOC) was computed based on the change in the TOC (mg/L) quantity between the initial sample and the treated sample, according to Equation (3):
η T O C = [ T O C ] 0 [ T O C ] t [ T O C ] 0 × 100
where [ T O C ] 0 and [ T O C ] t are the TOC of the MET solution before and after the electro-oxidation treatment.
The total electricity energy consumed (E (kWh)), including the energy consumed by the electrodes ( E e l e c t r o d e s ), energy consumed by the recirculation pump ( E p u m p ,   f l o w ), and energy consumed by the heat exchanger pump ( E p u m p ,   h e a t   e x c h a n g e r ), was calculated using the set of Equations (4)–(7):
E e l e c t r o d e = Ψ × I × t 1 , 000
E p u m p ,   f l o w = P n × t
E p u m p ,   h e a t   e x c h a n g e r = P m × t
E = E e l e c t r o d e s + E p u m p ,   f l o w + E p u m p ,   h e a t   e x c h a n g e r
where E is the total electricity consumed (kWh), Ψ is the average cell potential (23.75 V), I is the applied current intensity (A), t is the total electro-oxidation time (7.5 h), Pn is the supplier catalog’s nominal power (0.198 kW) for the recirculating pump, and Pm is the supplied catalog’s nominal power (0.123 kW) for the heat exchanger pump.
The total operating cost was determined as a function of the electricity and electrolyte prices according to Equation (8):
cost = pelectricity E + pelectrolyte melectrolyte
where pelectricity is the electricity price (0.058 USD/kWh, based on 1 USD/MXN = 18.36) for commercial use in Mexico, pelectrolyte is the price of the electrolyte (0.81 USD/kg), and melectrolyte is the consumed electrolyte’s mass (0.36 kg).

2.7. Data-Based Modeling and Optimization Procedure

Experimental data responses (ηCOD and ηTOC) were modeled using surrogate models, according to Equation (9), in terms of encoded variables:
η j = β 0 + β 1 A + β 2 B + β 3 C + β 4 A B + β 5 A C + β 6 B C + β 7 A 2 + β 8 B 2 + β 9 C 2 + β 10 A B C + β 11 A 2 B + β 12 A 2 C + β 13 A B 2 + β 14 A C 2 + β 15 B 2 C + β 16 B C 2 + β 17 A 3 + β 18 B 3 + β 19 C 3 j = C O D   a n d   T O C
where η j is the surrogate model for the responses of the COD and TOC removal efficiencies; the β-values are the coefficients of the third-order polynomial function (see Equation (9)); and A, B, and C are the encoded operating parameters according to Equation (1). The β-values were calculated using the stepwise regression method in the Design Expert® V.10 software package.
It is essential to prioritize accuracy when building models. In this study, the accuracy of the adjusted surrogate models was evaluated using the determination coefficient (R2), mean absolute error (MAE), and root-mean-square error (RMSE). The performance indexes, R2, MAE, and RMSE, are represented by Equations (10) [48], (11) [49], and (12) [50], respectively. Also, a high-quality model has a high R2 value and low values of MAE and RMSE.
R 2 = q n ( η E x p ,   q η ¯ E x p ,   q ) q n ( η M o d e l ,   q η ¯ M o d e l ,   q ) q n ( η E x p ,   q η ¯ E x p ,   q ) 2 q n ( η M o d e l ,   q η ¯ M o d e l ,   q ) 2
M A E = 1 n q n | η E x p ,   q η M o d e l ,   q |
R M S E = 1 n q n ( η E x p ,   q η M o d e l ,   q ) 2
where n is the total of number of trials, η E x p is the experimental response, η M o d e l is the modeled response, and η ¯ E x p and η ¯ M o d e l are the average values of the experimental and modeled values, respectively.
The multi-objective optimization and multi-criterion decision-making for the determination of the optimal operating parameters were assessed using Design Expert® V.10 software to attain the maximum COD and TOC removal efficiencies of the MET solution by applying a surrogate model of the responses (ηCOD and ηTOC) represented by Equation (9). For this purpose, the Design Expert software package performs multi-objective optimization and multi-criterion decision-making using the steepest ascent method. It is necessary to input additional information into the software to achieve the multi-objective optimization in this study, as shown in Table 4. The two objectives for the selected responses (ηCOD and ηTOC) need to be maximized. Also, the importances of each objective and the operating parameters (A, B, and C) were set as +++ (the default importance). Also, the desirability function was used to indicate the degree to which all the objectives were to be reached. Values close to 1 indicate that all the objectives were met [51].

2.8. Phytotoxicity Test

After determining the best operating conditions for the electro-oxidation of a MET aqueous solution, a phytotoxicity test was conducted before and after the electrochemical wastewater treatment containing MET, using mung bean seeds (Vigna radiata) because their fast-duration crop is suitable for various soil types [52]. For this purpose, 30 mung bean seeds were planted in four 250 mL glasses. Over ten days, each set of seeds was irrigated with 10 mL of distilled water, tap water, and MET aqueous solution before and after the electrochemical treatment. After ten days, the germination percentage and lengths of the shoot and root were measured. Also, the germination percentage was computed utilizing Equation (13) [53]:
G P ( % ) = N S G N S S × 100
where GP is the germination percentage, NSG is the number of seeds germinated, and NSS is the number of seeds sown.

2.9. HPLC and Mass Spectrometry

The MET electro-degradation progress was conducted using reverse-phase high-performance liquid chromatography (RP-HPLC) equipped with a photodiode detector (Agilent 6410) in the range 200–600 nm. The column used was a Hypersil GOLD, 5 μm, 150 × 4.6 mm, and the mobile phase was methanol (grade HPLC) and an aqueous solution of 0.1% formic acid. Isocratic separation was performed at 90/10 (v/v) at a flow rate of 0.5 mL/min. The sample was concentrated for a Sep-Pak® C18 cartridge (water–acetonitrile), the injection volume was 15 μL, and a temperature of 30 °C was used. To identify the MET electro-degradation species, triple Quad LC/MS and an electrospray ionization (ESI) source were used. Mass spectrometry (MS) was carried out in the positive ion mode at a capillary voltage of 3000 V and a nitrogen gas flow rate of 10 L/min, and the gas temperature was 380 °C.

3. Results and Discussion

3.1. Voltammetry Study

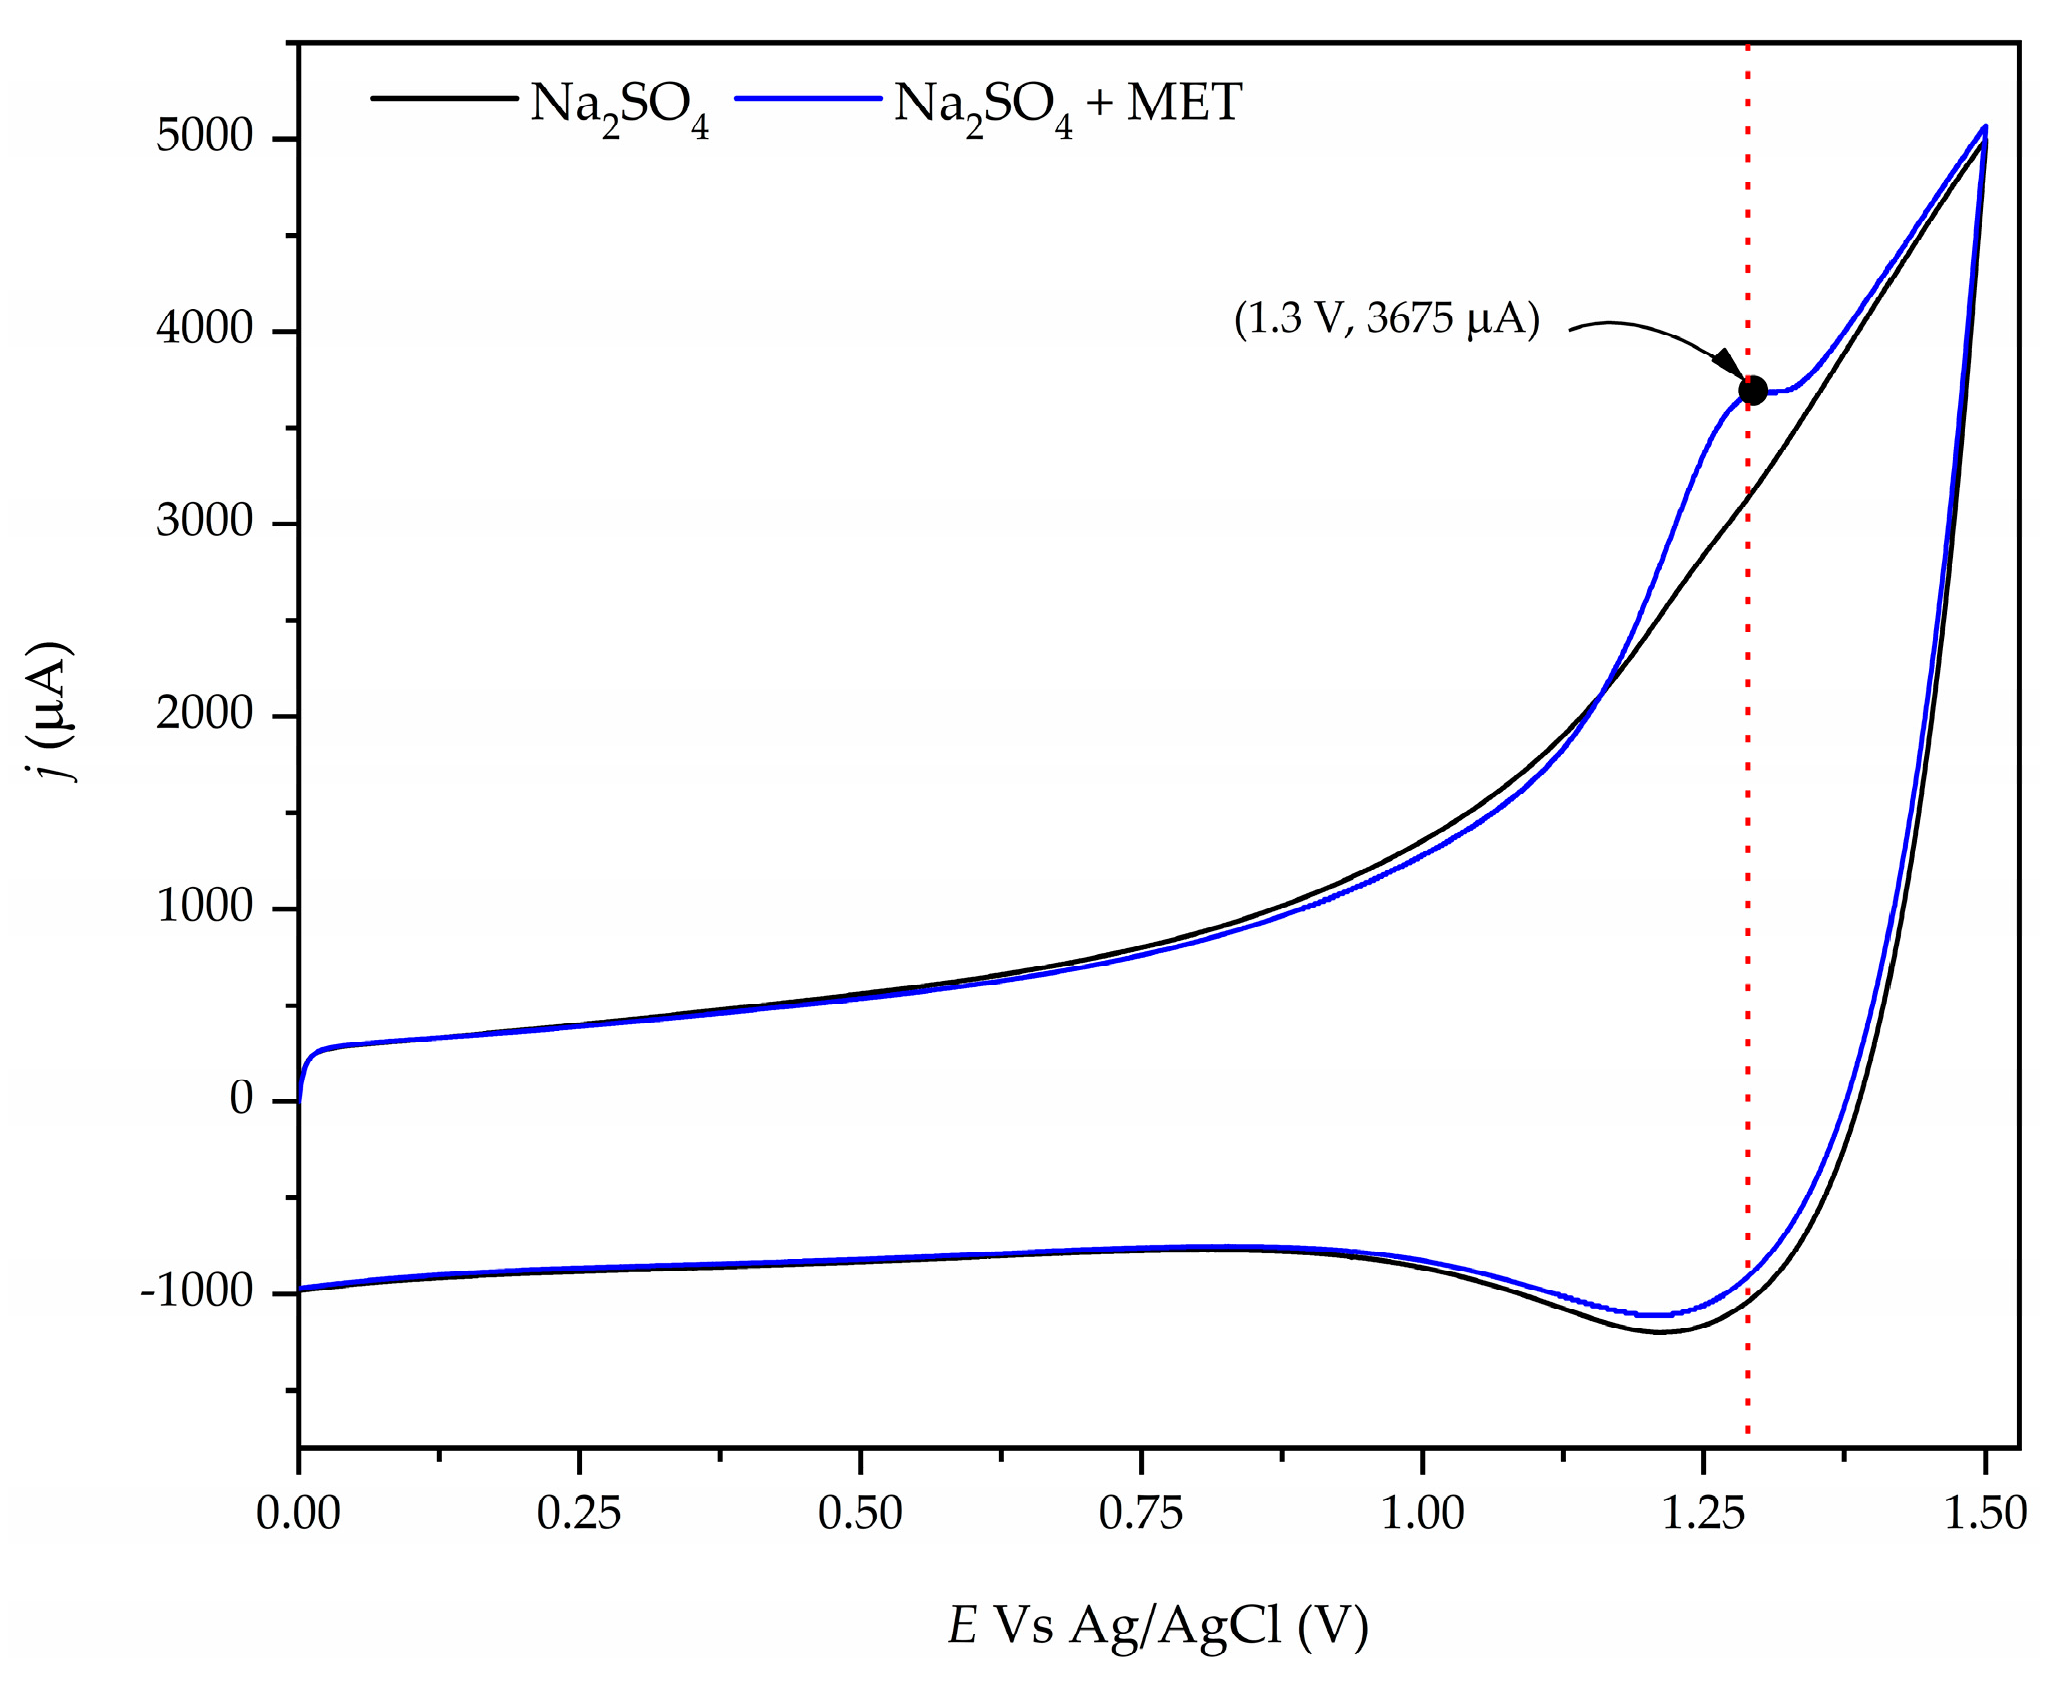
The electrochemical behavior of the aqueous solution containing 50 mg/L of MET on the Nb/BBD anode was studied using cyclic voltammetry measurements. Figure 2 illustrates the cyclic voltammetry of the Na2SO4 (black line) and Na2SO4 + MET (blue line) with the Nb/BDD anode at a potential scan rate of 100 mV/s. This figure exhibits the typical hysteresis behavior of a non-reversible system when wastewater contains MET, with a well-delineated peak at around +1.3 V, indicating that MET is directly oxidized on the Nb/BDD anode’s surface. Also, when the potential is increasing, a smoothed current signal is seen after the peak at +1.3 V, indicating a signal of the oxidation byproducts from MET. Furthermore, these intermediates could be directly oxidized by the free heterogeneous radicals (OH) on the Nb/BDD anode’s surface [54,55] and other oxidants (e.g., sulfate radicals and persulfate ions) present in the aqueous medium because Na2SO4 was utilized as the electrolyte support [56,57,58], which could contribute to the fast degradation/mineralization of organic pollutants, such as MET, in synthetic wastewater. The formation of sulfate radicals ( S O 4 ) and the persulfate ions ( S 2 O 4 2 ) formed on the Nb/BDD anode follow the reaction mechanisms given by Equations (14)–(17) [23,26,59,60]:
B D D + H 2 O B D D ( O H ) + H + + e
S O 4 + B D D ( H O ) S O 4 + H 2 O
S O 4 + S O 4 S 2 O 8 2
2 S O 4 2 S 2 O 8 2 + 2 e

3.2. Data-Based Model Fitting

Table 5 records the 17 trials in the experimental design for the electro-oxidation of MET, as proposed in Section 2.4. The reported experimental values of the COD and TOC removal efficiencies of the MET are in the ranges 37.50–62.50% and 54.50–91.24%, respectively. Given the experimental responses of η C O D and η T O C , reduced cubic and quadratic polynomials were fitted for η C O D and η T O C , respectively. Table 6 shows the coefficients ( β values) of the data-based polynomials fitted.
The data-based models’ fit statistics, shown in Table 6, indicate that the fitted models are in excellent agreement with the experimental values because the determination coefficients (R2) for responses η C O D and η T O C (0.9816 and 0.9430, respectively) are close to 1 [61], as confirmed by the parity graphics’ shape in Figure 3. Also, the Modeled_R2 values (0.7826 and 0.7036) for η C O D and η T O C are in reasonable agreement with the Adjusted_R2 values (0.9632 and 0.8698) for η C O D and η T O C because the differences are less than 0.2. Additionally, the adequate precision measures (24.28 and 14.36 for η C O D and η T O C , respectively) are greater than 4, indicating that the fitted data-based models can be used to navigate the design space [62]. In addition, the obtained values of the coefficient of variance (C.V., 2.69 and 4.556% for η C O D and η T O C , respectively) showed the great accuracy of the performed test because the C.V.s were under 10%, indicating that the adjusted data-based models ( η C O D and η T O C ) have a high degree of reproducibility [63]. Furthermore, the performance indexes, MAE (0.79 and 1.80 for η C O D and η T O C , respectively) and RMSE (0.93 and 2.21 for η C O D and η T O C , respectively), for η C O D and η T O C indicate that the reduced cubic and quadratic polynomial models are appropriate for modeling the responses ( η C O D and η T O C ) because the values of MAE and RMSE are less than the standard deviations (1.36 and 3.45 for η C O D and η T O C , respectively), and the ratios of RSME/(Std. Desv.) are 0.68 and 0.64 for η C O D and η T O C , respectively, indicating satisfactory data-based model simulations for both responses ( η C O D and η T O C ) because the RSME/(Std. Desv.) values are less than or equal to 0.70 [64].
The β 0 values (51.75 and 75.71 for η C O D and η T O C , respectively) represent the averages of all the runs for both responses ( η C O D and η T O C ). An analysis of the variance inflation factors (VIFs) for the reduced cubic data-based model ( η C O D ) reveals that the VIF values of the terms B, AB, AC, and C2 are 1, indicating that these terms are orthogonal. Also, the VIF values of the terms A, C, A2C, and AB2 are 2.42, suggesting that these terms are multicollinear because all the VIF values are greater than 1. A similar analysis of the VIF values for the quadratic data-based model ( η T O C ) reveals that the VIF values of the terms A, B, C, AB, AC, and BC are 1, suggesting that these terms are orthogonal. Additionally, the VIF values of the terms A2, B2, and C2 are 1.16, indicating that these terms are multicollinear because all the VIF values are greater than 1. Moreover, a higher value than 1 indicates a hard correlation factor. As a general rule of thumb, VIF values lower than 10 are acceptable [65].
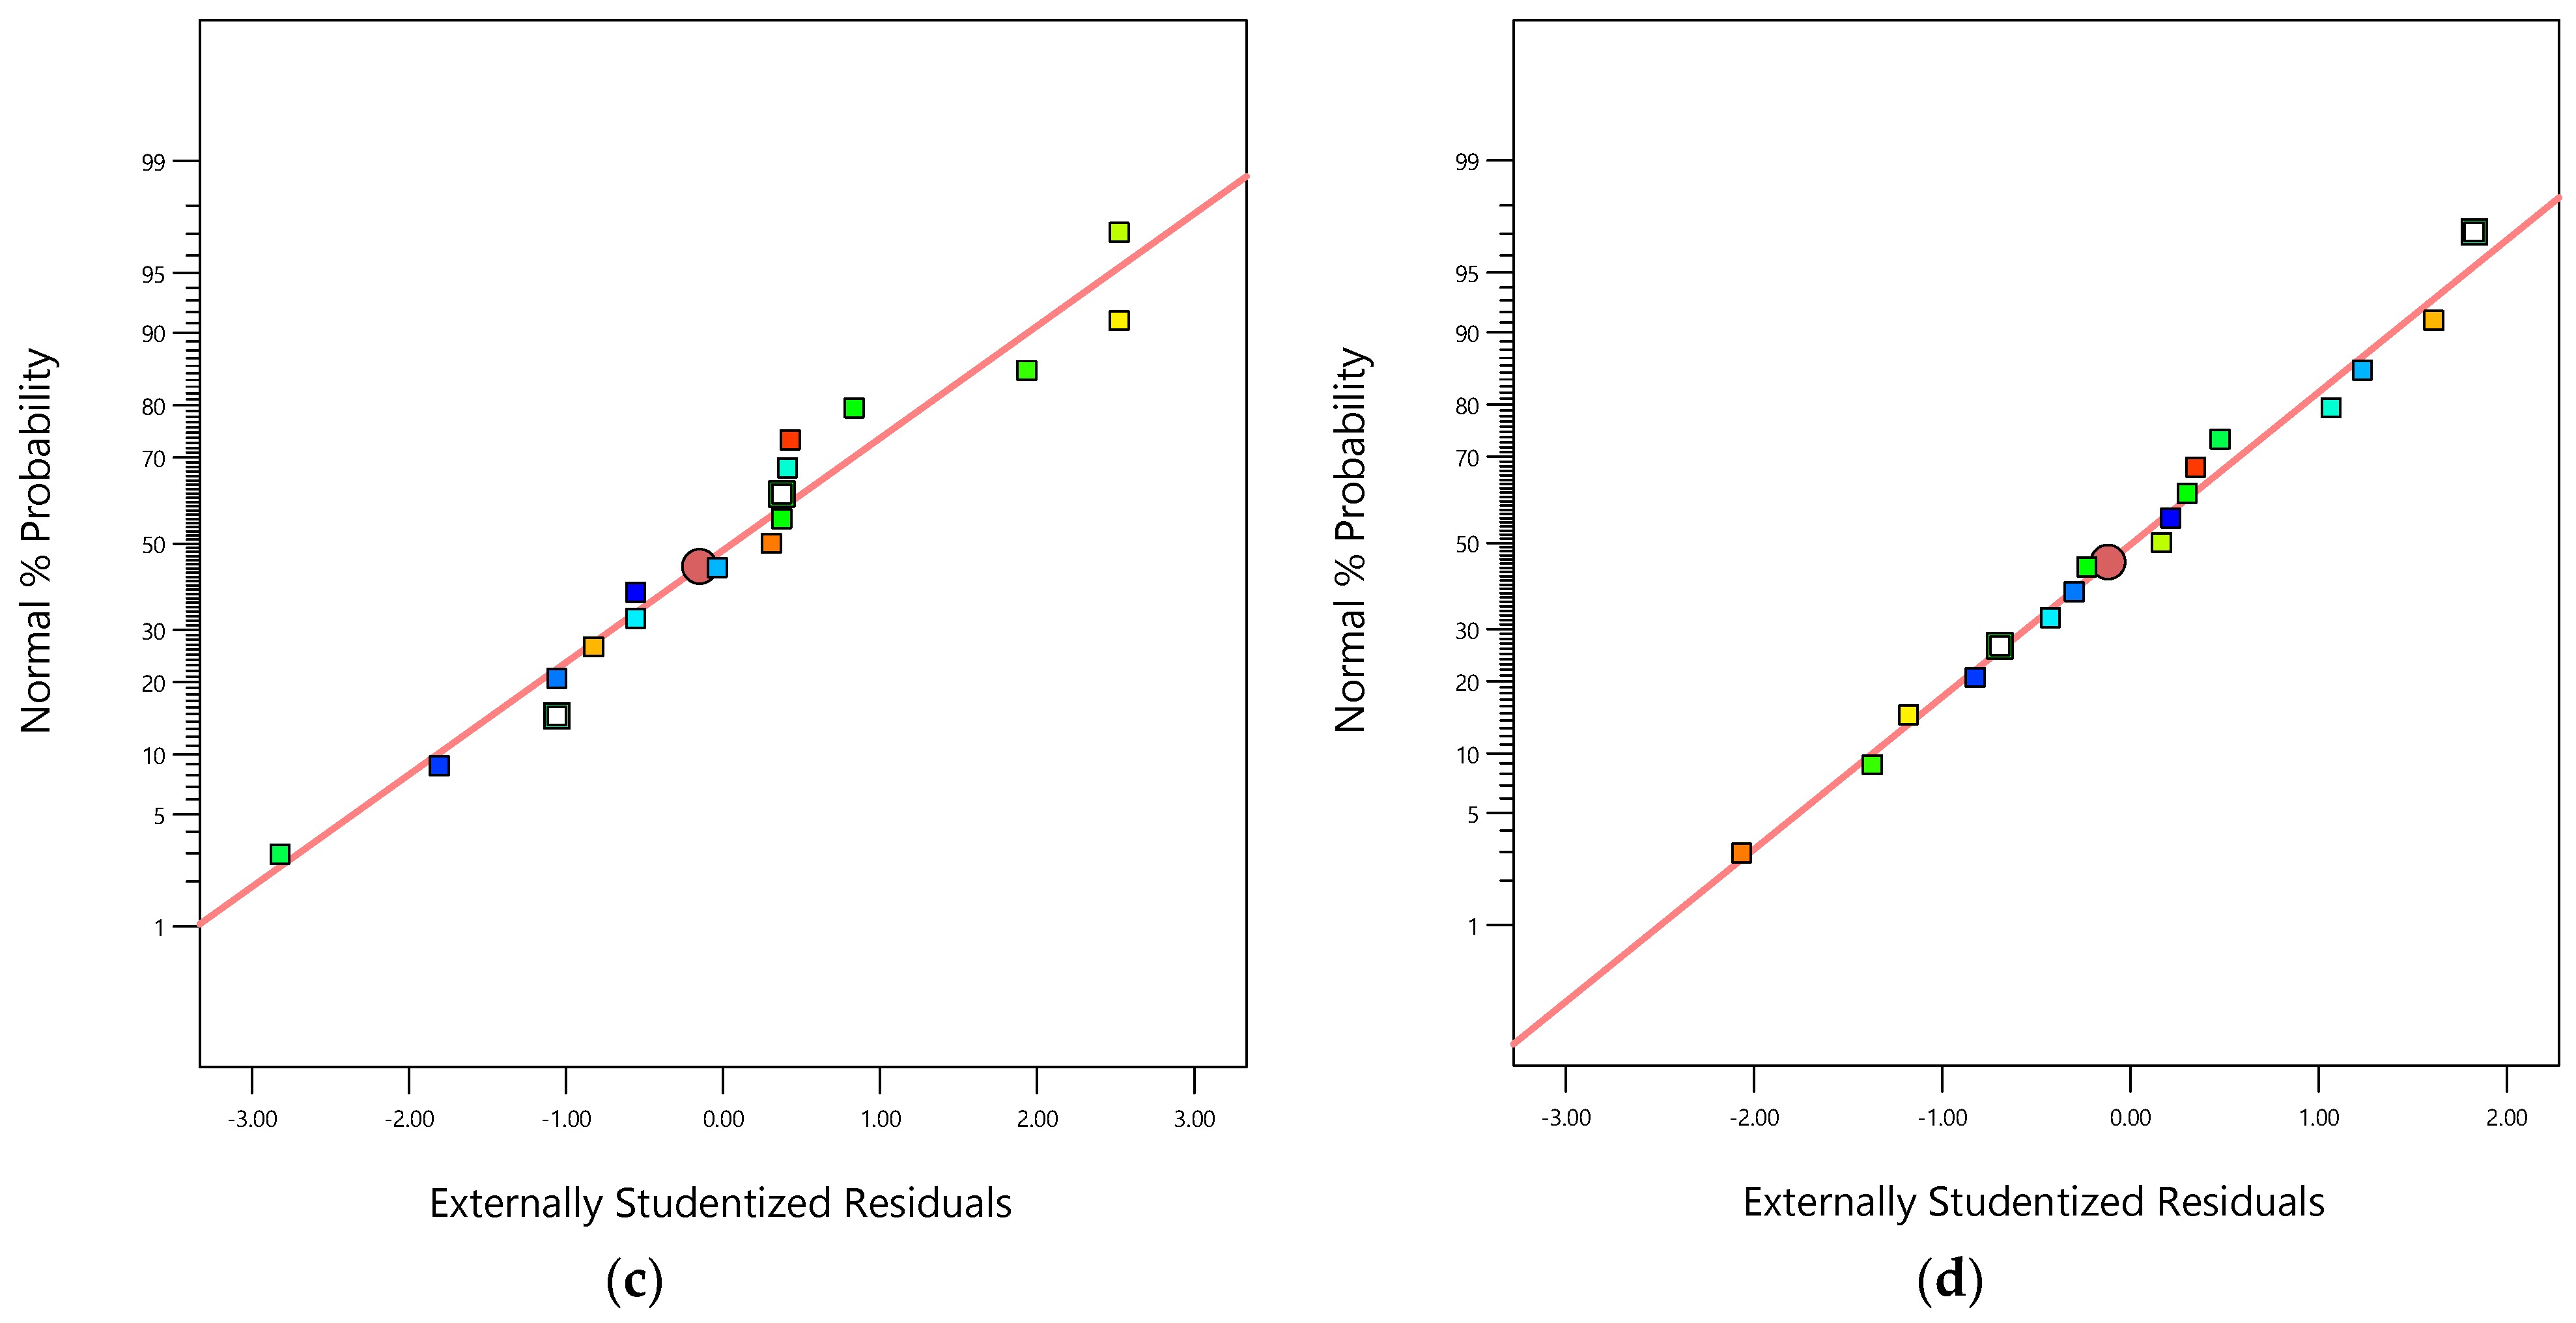
The parity graphic (see Figure 3a,b) and the normal percentage probability residual versus the studentized residual plot (see Figure 3c,d) demonstrate the model’s adequacy to predict both responses ( η C O D and η T O C ). Figure 3a,b reveal high-quality correlations between the experimental values of both responses ( η C O D and η T O C ) and both modeled responses ( η C O D and η T O C ). Figure 3c,d show normal distributions because the plotted points align closely to a straight line at a 45-degree angle. This suggests that the experimental responses follow a normal distribution. Additionally, the outlier values fall within the ranges ±1.05 and ±0.99 for η C O D and η T O C , respectively, indicating that the data-based models used to fit the responses were reasonably accurate, with minimal data register errors and high degrees of reproducibility.

3.3. ANOVA Test

Table 7 displays the results of the ANOVA test for the data-based models fitted. The test results indicate that the adjusted model for the COD removal efficiency is statistically suitable for modeling the electro-oxidation of MET within the studied operational parameter range. The model’s F-value of 54.38 for η C O D suggests that the adjusted polynomial data-based model is significant because the F-value is higher than the p-value (0.0001). Additionally, the lack of fit is not significant for the pure error, as the F-value of 2.6 is higher than the p-value (0.3034). Furthermore, the terms A, B, C, AB, AC, C2, A2C, and AB2 are significant because their p-values (0.0001, 0.0024, 0.0001, 0.0001, 0.0001, 0.0041, 0.0001, and 0.0001) are less than 0.05. Similarly, the model’s F-value of 1379.37 for η T O C suggests that the adjusted polynomial data-based model is significant because the F-value is higher than the p-value (0.0014). Moreover, the lack of fit is not significant for the pure error, as the F-value of 42.31 is higher than the p-value (0.8162). Moreover, the terms B, AB, A2, and B2 are significant because their p-values (0.0001, 0.0300, 0.0439, and 0.0281) are less than 0.05.

3.4. Influences of the Operational Parameters

From the previous analysis, the models are summarized in Table 6. The negative signs of the β-values of the terms A, AB, C2, and A2C display negative effects on η C O D compared to the positive signs of the β-values of the terms B, C, AC, and AB2. Similarly, the negative signs of the β-values of the terms C, AB, BC, and B2 exhibit negative effects on η T O C compared to the positive signs of the β-values of the terms A, B, AC, A2, and C2 [66].
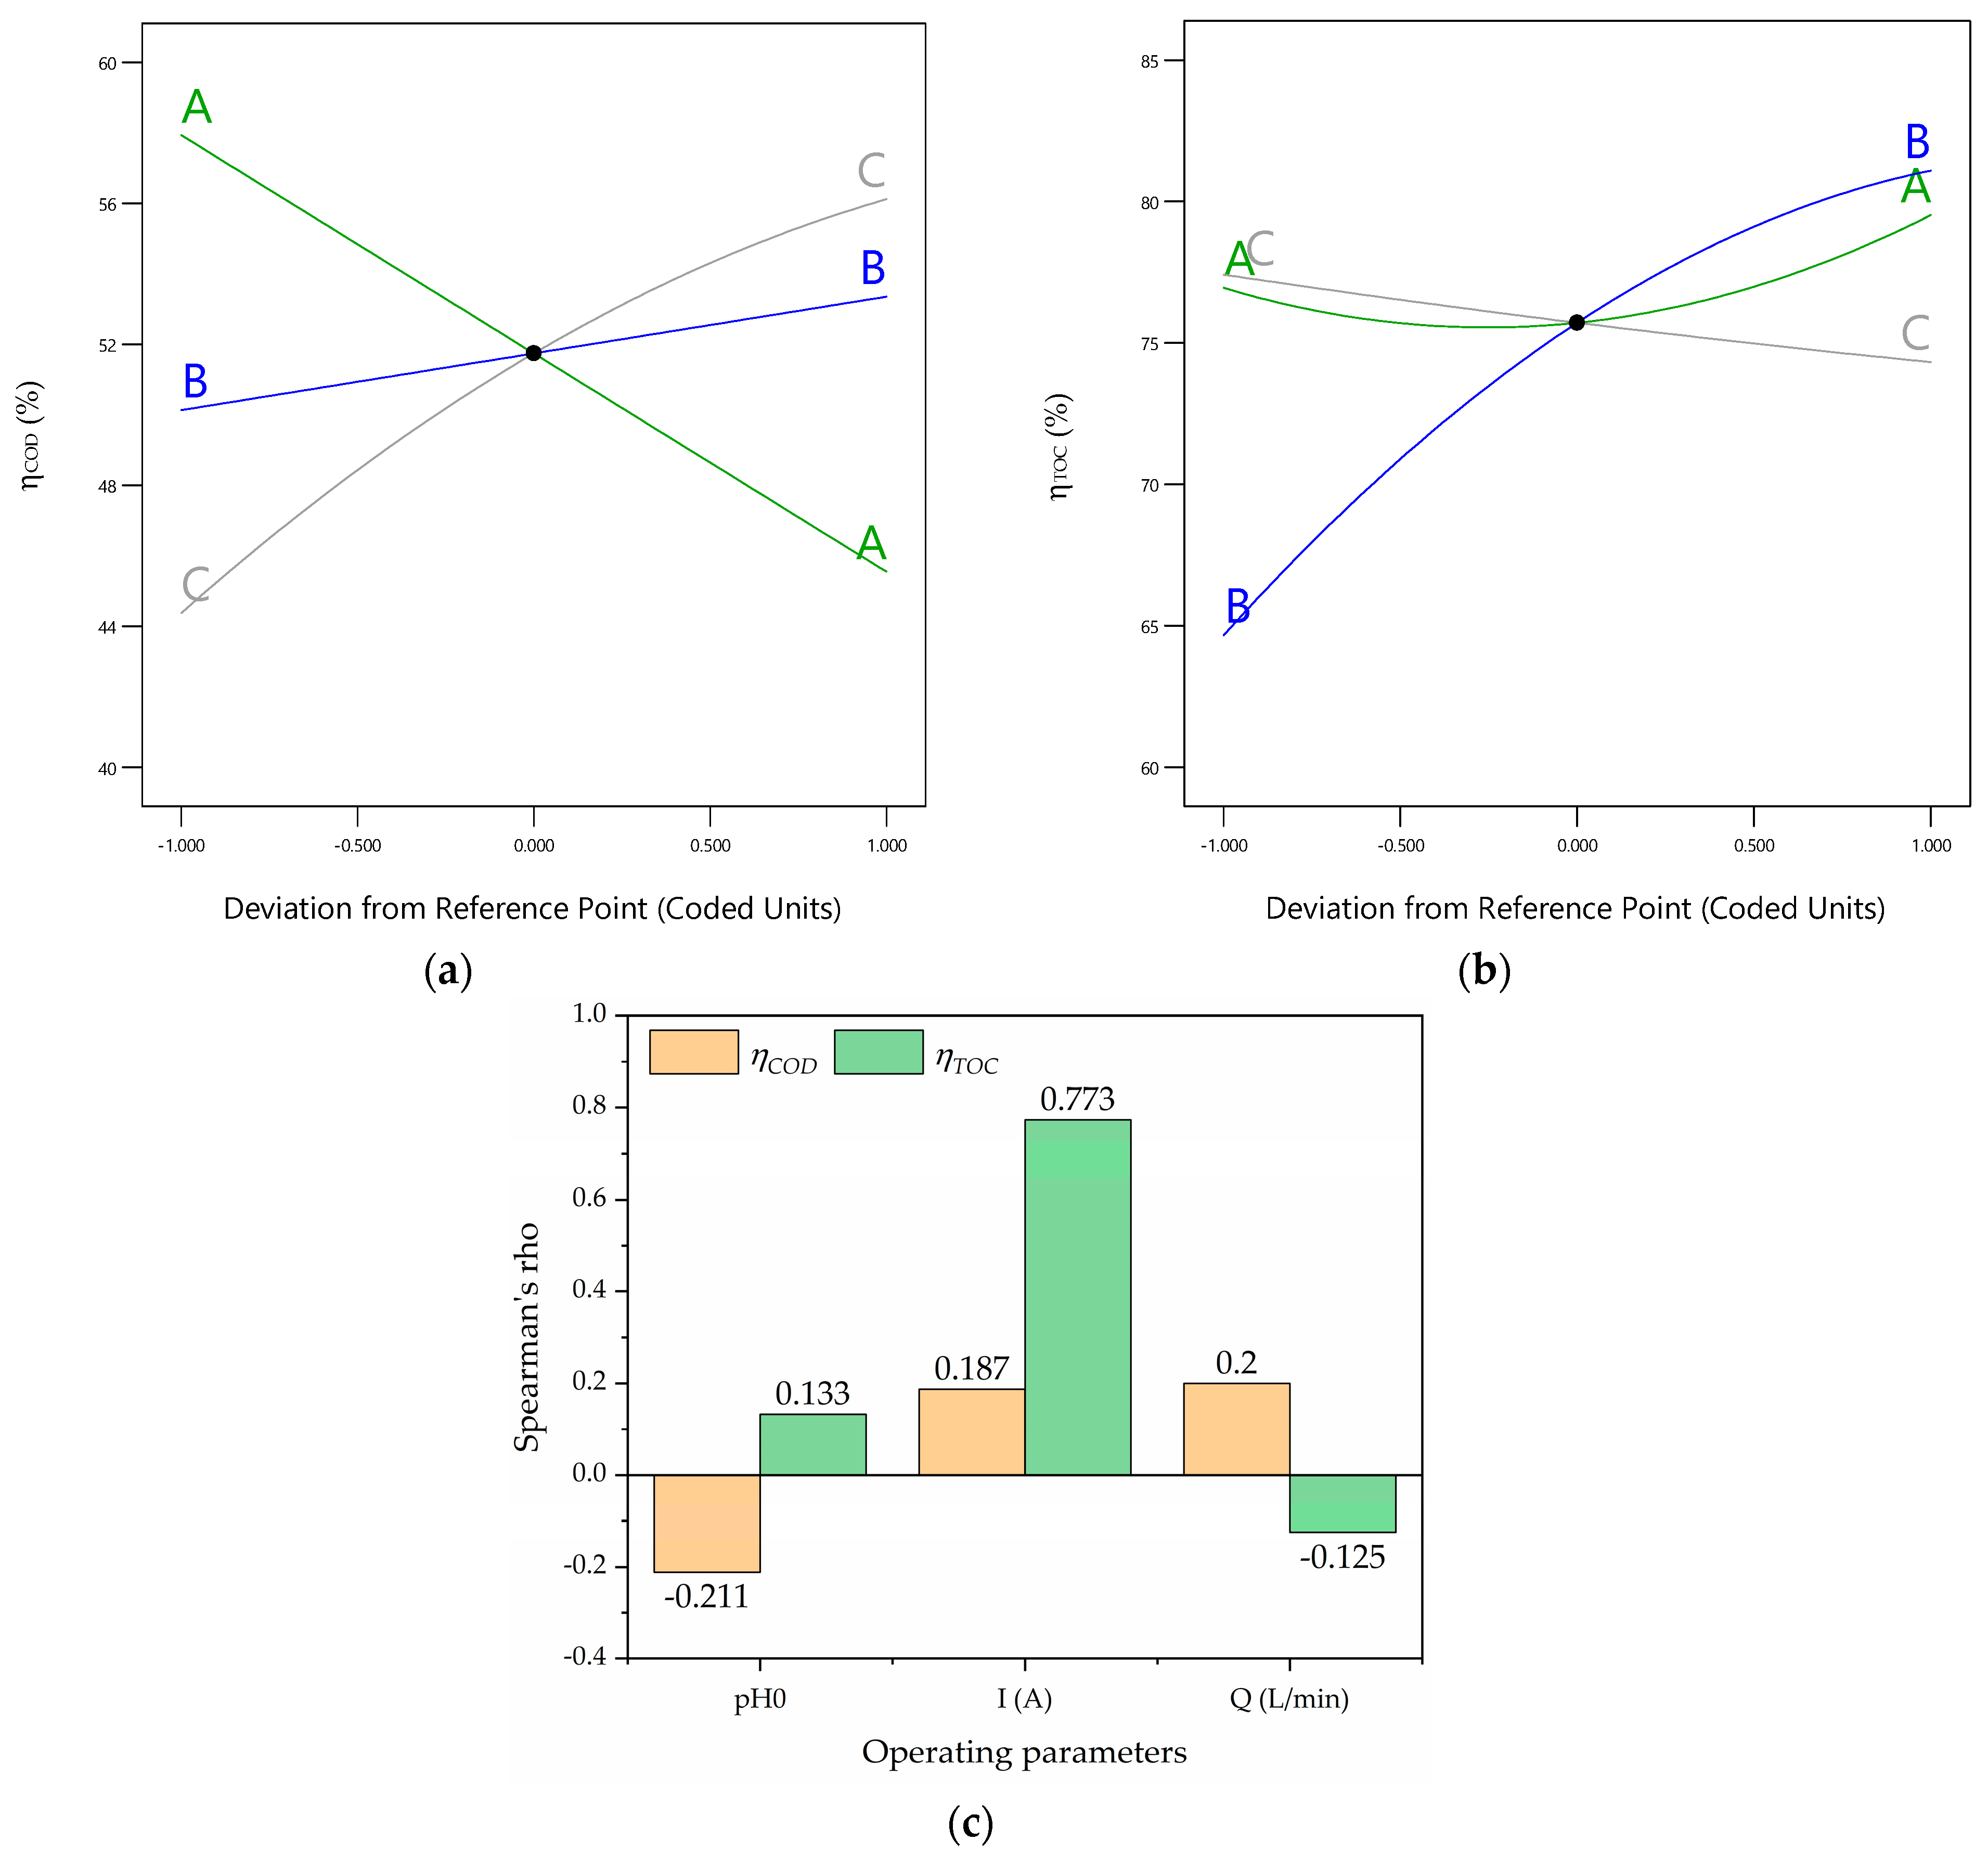
The perturbation graphics (Figure 4a,b) reveal that all the operating parameters (A, B, and C; i.e., the initial pH, current intensity, and volumetric flow rate, respectively) are important because of their distinguished slopes. However, the importances of the operating parameters for the response of the η C O D follow the order of the initial pH (A), current intensity (B), and volumetric flow rate (C) because of their slopes. Additionally, the importances of the operating parameters for the response of the η T O C follow the order of the initial pH (A), volumetric flow rate (C), and current intensity (B). Additionally, the Spearman rank values are shown in Figure 4c. Figure 4c reveals that the current intensity (B) is the most significant variable for η T O C because the Spearman rank value is 0.773. Meanwhile, the volumetric flow rate (C) is the most significant variable for η C O D because the Spearman rank value is 0.20. Also, pH0 exerts a negative effect on η C O D because of its negative Spearman rank value (−0.211), and Q displays a similar effect on η T O C because of its negative Spearman rank value (−0.125).
The Pareto test was performed utilizing Equation (18) to assess the impacts of the terms on the responses ( η C O D and η T O C ).
P i = ( β i β i ) × 100
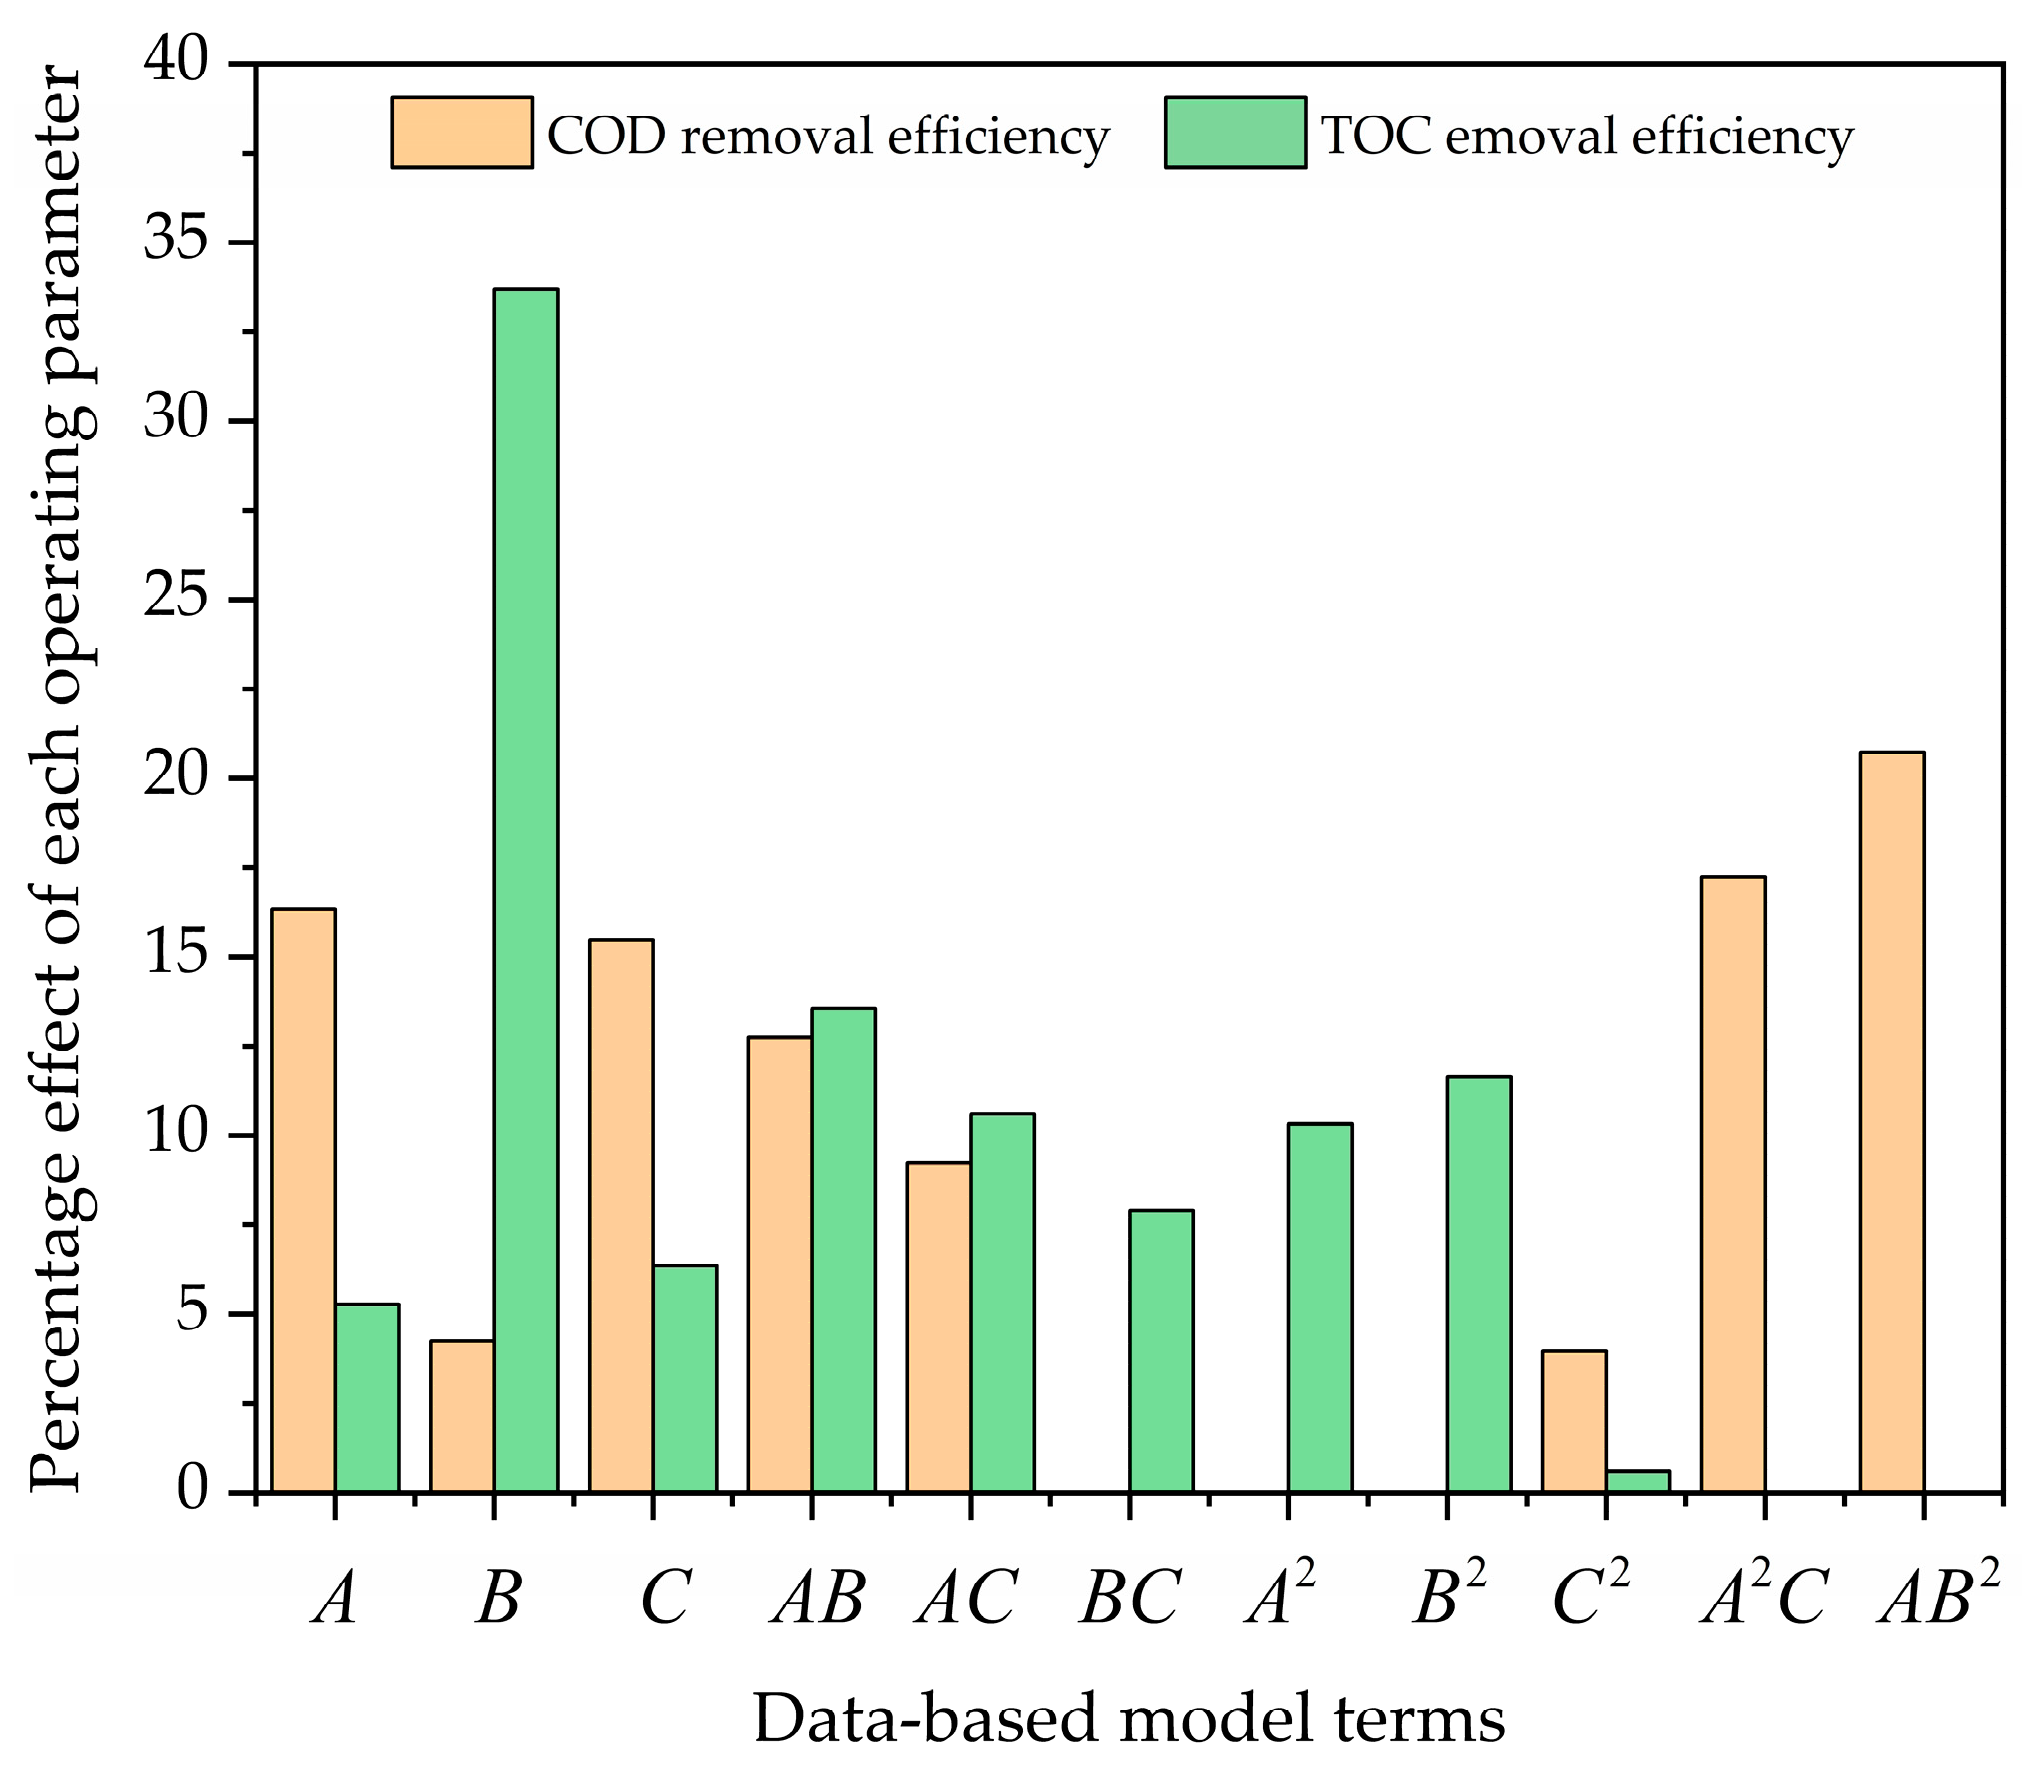
Figure 5 shows the Pareto graphic analysis. This figure suggests that the interaction terms A2C and AB2 have large effects (17.26 and 20.74%) on η C O D , respectively. Meanwhile, A, C, and AB have moderate effects (16.33, 15.49, and 12.74%) on η C O D , respectively. Also, the rest of the terms (B, AC, and C2) have the least effects (4.25, 9.23, and 3.96%) on η C O D , respectively. Similarly, the term B has a higher effect (33.69%) on η T O C . Also, the terms AB, AC, A2, and B2 have moderate effects (13.57, 10.61, 10.33, and 11.64%) on η T O C , respectively. In addition, the rest of the terms (A, C, BC, and C2) have the least effects (5.29, 6.35, 9.9, and 0.61%) on η T O C .

3.5. Optimization of the Electro-Oxidation of MET

A maximum COD removal efficiency ( η C O D ) of 60.81% and a TOC removal efficiency ( η T O C ) of 90.07% were achieved at pH0 5.0, an I value of 3.84 A, and a Q value of 0.8 L/min within 7.5 h of the total operating time. The overall desirability was 0.9502 (see Figure 6g), indicating that both objective functions ( max ( η C O D ( A ,   B ,   C ) ) and max ( η T O C ( A ,   B ,   C ) ) ) were fully met because the desirability attained is classified as fully acceptable [67]. Additionally, both objective functions (responses η C O D and η T O C ) were simultaneously optimized. These functions were fitted through data-based modeling using Equation (9).
The 3D surface plots (Figure 6a–f) show the interaction effects among the three operating parameters (A, B, and C) studied herein. All the 3D surface plots form saddle areas because the contour plots are hyperboles, indicating that all the interactions between the chosen operating parameters are significant. Figure 6a–f show increases in η C O D and η T O C when pH0 (A) increases because there is a large amount of hydroxyl radicals (OH) produced on the Nb/BDD electrode’s surface. Also, Figure 6a,b,d reveal increases in η C O D and η T O C when the current intensity (B) increases, indicating a large amount of OH produced on the Nb/BDD anode’s surface and that the main reactions are taking place on the BDD’s surface. Similarly, Figure 6d–f display increases in η C O D and η T O C when the volumetric flow rate (C) increases because the high mass transport of the pollutant from the bulk to the Nb/BDD anode electrode is achieved. Meanwhile, Figure 6c shows an increase in η C O D when the volumetric flow rate (C) decreases because of the low mass transport of the pollutant from the bulk to the Nb/BDD anode’s surface. In addition, Figure 6a,b demonstrate that the interaction between the A and B operating parameters exerts negative effects on both responses ( η C O D and η T O C ) because the production of OH at low A and B values is insufficient to remove the MET. Figure 6c,d reveal that the interaction between the A and C operating parameters produces positive effects on both responses ( η C O D and η T O C ) because the amount of OH is sufficient to remove the MET, and the contact time of the MET with the OH is enough to react effectively when the electrochemical treatment operates at low A and C values. As well, Figure 6e,f show that the interaction between the B and C operating parameters has negative effects on η C O D and η T O C because of the low amount of OH produced and the low mass transport of the MET from the bulk to the Nb/BDD anode’s surface.
Figure 6h depicts the overlaid graphic, shaped according to the constraint criteria described in Table 4 and both objective functions ( η C O D and η T O C ). The black lines in the overlaid graphic are assembled based on the constraint criteria; the area between the constraints is in blue, and the region that is not convened based on the constraints is in gray. Also, the feasible region is enclosed by pH0 (2–11), and I = (2–5 A) at Q = 0.8 L/min within 7.5 h of the total operating time.

3.6. Data-Based Model Validation

Three complementary trials were conducted using the optimal operating parameters to validate the data-based models ( η C O D and η T O C ). The modeled and experimental data for both responses ( η C O D and η T O C ) are recorded in Table 8. The results in Table 8 indicate the high degree of effectiveness of the multi-objective optimization process employed in this study because the deviation between the modeled and experimental data is less than 10% for both responses (0.49 and 8.37% for η C O D and η T O C , respectively). Hence, the maximum experimental COD and TOC removal efficiencies were 61.11 and 83.12%, respectively, when the electrochemical plant operates at an initial pH of 5, a current intensity of 3.84 A, and a volumetric flow rate of 0.8 L/min within 7.5 h of the total operating time. Additionally, the high mineralization percentages of the MET achieved indicate the excellent performance of the Nb/BDD electrodes in the degradation of organic pollutants, such as MET [68].

3.7. The Total Operating Cost of the Electro-Oxidation of MET

The total operating cost of the electrochemical treatment of MET was calculated based on the electricity consumed and the spent mass of the electrolyte support (NaSO4), using Equations (4)–(8). Hence, the total energy consumed was 3.09 kWh, with a total operating cost of 0.19 USD/L when the electrochemical plant operates under the optimal operating conditions (pH0 5.0, I = 3.84 A, and Q = 0.8 L/min) within 7.5 h of the electrochemical treatment. It is worth noting that this work includes the cost of the electricity consumed by the pump flow and heat exchanger and the costs of the used mass of the electrolyte support, unlike other studies in the literature.

3.8. Kinetic Models

The electro-oxidation of MET conducted in this work is mainly assumed to be driven by OH on the Nb/BDD anode’s surface [69]. The pseudo first-, pseudo second-, and pseudo first-order kinetic models used to fit the MET, COD, and TOC abatements, respectively, were set to fit the experimental data according to Equations (20) and (21) for the MET, COD, and TOC abatements:
d [ M E T ] d t = k [ O H ] k a p p , M E T [ M E T ] = k a p p [ M E T ]
d [ C O D ] d t = k [ O H ] k a p p ,   C O D 2 [ C O D ] 2 = k a p p [ C O D ] 2
d [ T O C ] d t = k [ O H ] k a p p , T O C [ T O C ] = k a p p [ T O C ]
Figure 7a illustrates the MET’s depletion over time because of the treatment, reaching a 95.19% degradation efficiency of the MET after 5 h of the treatment (see Figure S1 in the Supplementary Materials). This behavior suggests that the electro-oxidation of MET forms other simple organic compounds (e.g., carboxylic acid and aromatic molecules) because OH attacks the chemical structure of the MET. Additionally, Figure 7b–d show that pseudo first-, pseudo second-, and pseudo first-order kinetic models effectively describe the decays of the MET, COD, and TOC, with determination coefficients (R2) of 0.9999, 0.9977, and 0.9945, respectively. These high R2 values indicate good model fits because the R2 values are close to 1 [61], and the low RMSEs (0.16, 1.49, and 1.00 for MET, COD, and TOC decays, respectively) further support this conclusion (in line with Table 9). Also, Figure 7b–d suggest the constant production of HO on the Nb/BDD anode’s surface. Furthermore, the high correlation between the experimental and modeled MET depletions suggests a large amount of OH generated on the Nb/BDD anode’s surface (see Figure S1), as stated in [70].
The kinetic constants of the pseudo first-, pseudo second-, and pseudo first-order fitted models for the MET, COD, and TOC abatements are summarized in Table 9. Also, the pseudo first-order models for the MET and TOC abatements agree with references [35,36,71]. Additionally, the kinetic constants for the decays of the COD and TOC (kapp, COD and kapp, TOC, respectively) can be considered as global because the electro-oxidation of the byproducts was not discriminated against for their calculations.
To understand whether the electro-oxidation of MET is controlled by the mass transport or current, the limit current intensity (Ilim) can be estimated using Equations (22)–(24) [72]:
L n ( [ T O C ] t [ T O C ] 0 ) = A A V t r e a t e d k m s l o p e t
I lim = N e A A F k m [ M E T ] 0
C 34 H 56 N 2 O 12 + 56 H 2 O 34 C O 2 + 2 N H 4 + + 160 H + + 162 N e e
where AA (0.0032 m2) is the anode’s surface area, Ne is the number of electrons, Vtreated (0.0025 m3) is the treated volume, F (96,487 C/mol) is the Faraday constant, km (m/s) is the mass transfer coefficient, Ilim (mA) is the current intensity, t (s) is the time, [MET]0 (0.073 mol/m3) is the initial concentration of the MET, and [TOC]t and [TOC]0 are the final and initial TOC concentrations (mg/L), respectively.
After performing the linear regression analysis of the TOC data and using Equation (22), the mass transfer coefficient was calculated at 5.16 × 10⁻⁵ m/s. This value is similar to those calculated for the electro-oxidations of ciprofloxacin [39] and 2-chlorophenol [73] using the same flow-by reactor. The electro-oxidation of MET is primarily controlled by the mass transfer because the applied current intensity (Iapp = 3.84 A) is greater than the limiting current intensity (Ilim = 0.189 A), which is in line with what was reported in reference [68].

3.9. Byproduct Identification and Reaction Pathway

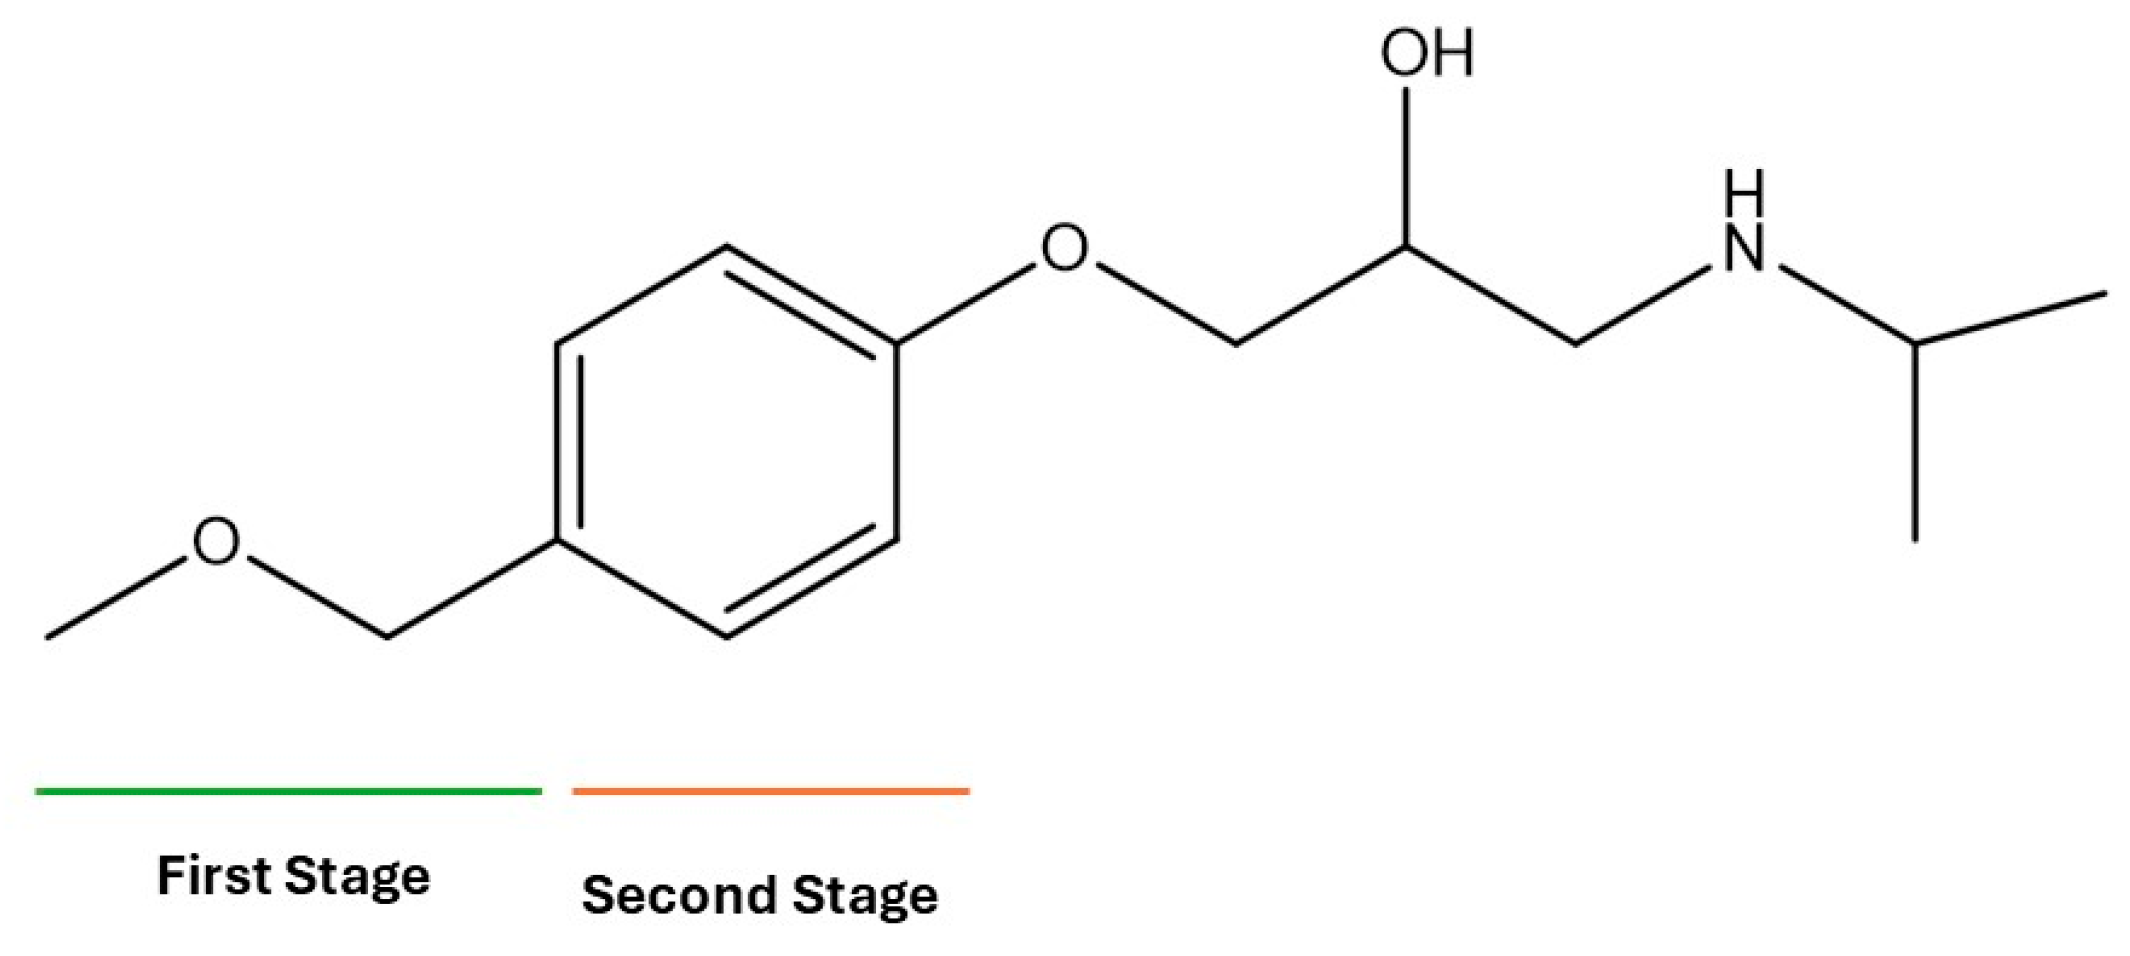
During the electro-oxidation of MET with two Nb/BDD electrodes under the optimal operating conditions (pH0 5, I = 3.84 A, and Q = 0.8 L/min within a 7.5 h reaction time), an LC/MS analysis was conducted to identify the byproducts. The LC/MS analysis revealed 11 intermediates (refer to Table 10). The electro-degradation of MET was observed to occur in three phases. In the first phase (indicated by the green line), the branched aromatic ring with an ether functional group in the MET was oxidized by OH (see Figure 8 and Table 10). The second phase (marked by the orange line) involved the attack of the OH on the aromatic ring, leading to the complete degradation of the compound, including the breakage of the aromatic ring and the degradation of the branch with the amine group (see Figure 8). These stages illustrate how MET is progressively broken down into simpler compounds through advanced oxidation processes. This observation aligns with reference [74]. It is important to note that because of the low abundance and complexity of the sample, there are additional unidentified intermediates, resulting in peak overlap and a lack of reference information.
The low susceptibility of the MET to degradation in the part containing the alcohol group is because of the stability of the C-O bonds, the absence of conjugated systems that facilitate electron delocalization, and the general resistance of secondary alcohols to oxidation [74,75,76]. The amino group, with a pH below 9.7, becomes protonated ( N H 3 + ), causing the lone pair of electrons on the nitrogen atom to bond with the additional proton, making the nitrogen less available to react with electrophilic species; this reduces the availability of the lone pair of electrons, decreasing the capacity of the OH to participate in chemical reactions [77].
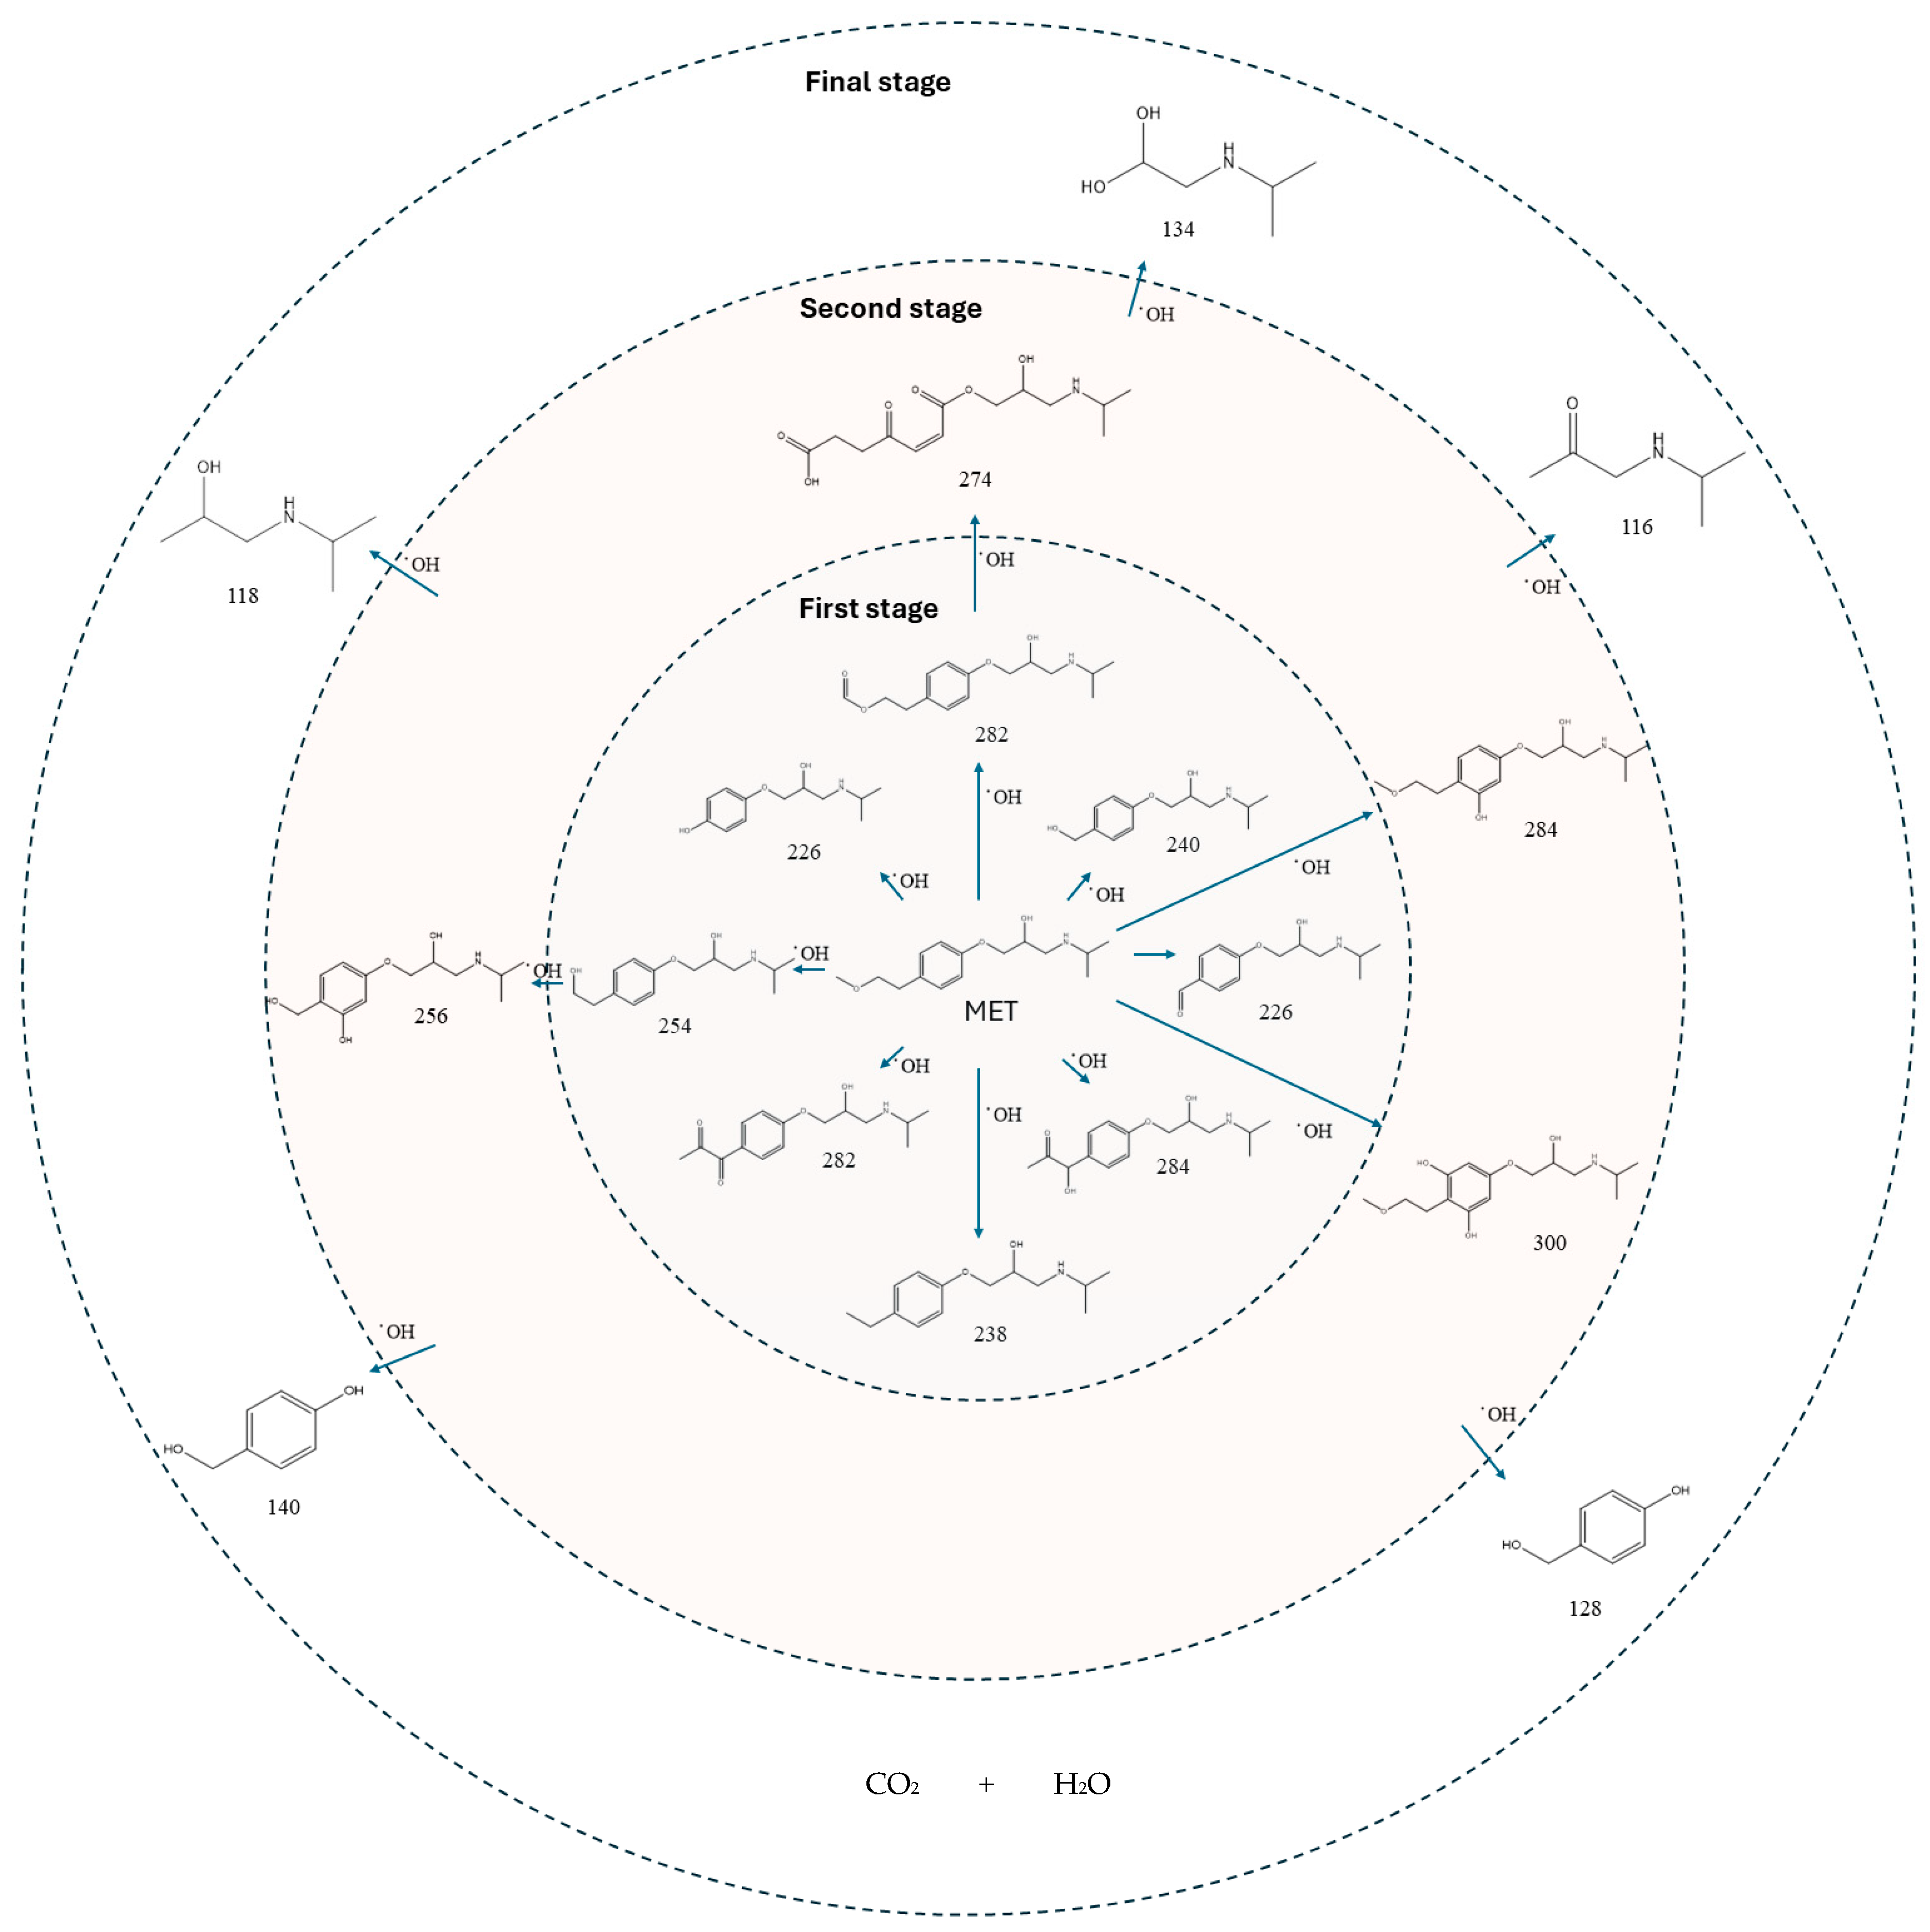
The proposed reaction pathway for the electro-degradation of MET consists of three main stages of transformation, as shown in Figure 9. In the first stage, metoprolol decomposes into several intermediate products: one with a molecular weight of 226 m/z, resulting from the loss of the isopropylamine group; another intermediate with a weight of 240 m/z, formed by the oxidation of the secondary alcohol group to a ketone; and a third product with a weight of 282 m/z, indicating the formation of an oxidized dimer. In the second stage, these intermediates undergo further decomposition: The 226 m/z compound transforms to another with a weight of 238 m/z, suggesting the oxidative cleavage of the branch with the ether group and the aliphatic chain of the aromatic ring of the metoprolol; the 254 m/z intermediate transforms to a 256 m/z compound through the additional oxidation of the aromatic ring and degradation of the aliphatic chain, and the 282 m/z product decomposes into a compound with a weight of 274 m/z, indicating the breakage of the aromatic ring. Finally, in the final stage, the products from the second stage decompose into even simpler compounds: one product with a weight of 140 m/z, another with a weight of 118 m/z, and a compound with a weight of 116 m/z, reflecting the complete breakage of the aliphatic bonds and oxidation of the functional groups.

3.10. Comparison of Results with Those in the Literature

The results obtained in this study were compared with those found in the literature (refer to Table 11). This work is the only one reporting the associated operating cost, using two Nb/BDD electrodes, and carrying out the optimized electro-oxidation of MET. Although previous studies have reported that MET was degraded and mineralized to 100% [34,36], it is essential to consider that the treated volume in those studies was less (0.6 L and 1.0 L, respectively) compared to the volume used in this work (2.5 L). Additionally, the active areas reported in the literature [34,36] are 2.44 and 3.13 times larger (78 and 100 cm2, respectively) than the area used in this work (32 cm2). Reference [34] and this work are unique studies that used a flow-by reactor for the electro-degradation of MET. However, the literature typically reports that four cells were used to achieve the 100% degradation and mineralization of MET. Also, reference [35] achieves a TOC removal efficiency (97%) higher than that in this study for a treated volume four times higher (10 L) than the volume used in this study (2.5 L). Nevertheless, this study uses five times the initial MET concentration (50 mg/L) than the initial MET concentration (10 mg/L) reported in the literature [35]. Based on the results presented in this study, the electrochemical method employed for the wastewater treatment effectively removes MET.

3.11. Toxicity Test

To complement the information about the hazardousness of the aqueous solution of MET at the beginning of and after the electro-oxidation treatment, a phytotoxicity test was conducted using mung bean seeds (Vigna radiata) according to Section 2.8.
Table 12 indicates that the germination percentage of Vigna radiata irrigated with the treated effluent (93.33%) equals those of Vigna radiata irrigated with the distilled water and electrolyte controls. However, the germination percentage of Vigna radiata drops to 73.33% for the solution containing 50 mg/L of MET, which is lower than the germination percentage of Vigna radiata (93.33%) irrigated with the treated effluent. Additionally, the germination percentage of Vigna radiata irrigated with tap water was 100%, with a shorter average root length (5.1 cm) compared to those of Vigna radiata irrigated with the distilled water, electrolyte support, and wastewater at the beginning and the end of the electro-oxidation process. Furthermore, the average shoot lengths of Vigna radiata (24.0 and 20.7 cm for irrigation with distilled water and tap water, respectively) are longer than those of Vigna radiata irrigated with the electrolyte support and wastewater, at the beginning and the end of the electro-oxidation process, when irrigated with distilled water and tap water. Finally, the germination percentages of Vigna radiata irrigated with the electrolyte solution and treated solution of the MET are equal (93.33%), and the average shoot length of Vigna radiata treated with the solution of the MET (6.8 cm) is longer than those of Vigna radiata treated with the solution of the MET and without treatment (5.6 cm), which demonstrates the removal and degradation of the MET from the wastewater through the application of the electrochemical process using BDD electrodes as the cathode and anode, as assessed in this work.
Figure 10 shows the growth of Vigna radiata when irrigated with different water types. It demonstrates that treated effluent (see Figure 10e) is less toxic than the solution without the electrochemical treatment (see Figure 10d).

4. Conclusions

The electro-oxidation of MET was successfully driven by OH in a flow-by reactor equipped with two Nb/BDD electrodes and running in the batch recirculation mode.
The electrochemical treatment employed in this study effectively removed the MET (95.19%) from the wastewater when the flow-by electrochemical reactor operated under the optimal operating conditions (pH0 5, I = 3.84 A, and Q = 0.8 L/min within a 7.5 h reaction time).
The maximum COD and TOC removals were 60.8 and 90.1%, respectively, with an associated operating cost of 0.19 USD/L.
The polynomial equations adjusted to the experimental data (COD and TOC removal efficiencies) as functions of pH0, I, and Q (A, B, and C, respectively) are as follows:
( η C O D = 51.75 6.19 A + 1.61 B + 5.87 C 4.83 A B + 3.5 A C 1.5 C 2 6.54 A 2 C + 7.86 A B 2 η T O C = 75.71 + 1.29 A + 8.22 B 1.55 C 3.31 A B + 2.59 A C 1.93 B C + 2.52 A 2 2.84 B 2 + 0.15 C 2 )
The electro-oxidation of MET, COD removal, and TOC removal follow pseudo first-order, pseudo second-order, and pseudo first-order kinetic models, respectively, when the flow-by electrochemical reactor operates under the optimal operating conditions.
The LC/MS analysis of the byproducts from the electro-degradation of the MET molecule revealed 11 intermediates. It was also confirmed that the process occurs in three phases, which is consistent with previous reports.
The phytotoxicity test indicates that the proposed electrochemical wastewater led to a diminution in the phytotoxicity of the effluent produced because of an increase in the percentage germination of Vigna radiata.

Supplementary Materials

The following supporting information can be downloaded at https://www.mdpi.com/article/10.3390/pr12091958/s1, Figure S1: Decay of MET over time during the oxidation treatment under the optimal operating conditions. Operating parameters: [Na2SO4] = 0.1 M; [MET]0 = 50 mg/L; I = 3.84 A; pH0 5; Q = 0.8 L/min; T = 25 °C.

Author Contributions

Conceptualization, A.R.-M., R.N. and C.J.E.; methodology, A.R.-M. and D.V.-V.; software, A.R.-M.; validation, D.V.-V., E.P.-R. and A.R.-M.; formal analysis, A.R.-M. and E.E.R.-G.; investigation, D.V.-V., A.R.-M. and E.P.-R.; resources, A.R.-M., E.P.-R. and E.E.R.-G.; data curation, R.N., C.J.E. and A.R.-M.; writing—original draft preparation, A.R.-M.; writing—review and editing, R.N., A.R.-M., E.E.R.-G., C.J.E. and E.P.-R.; visualization, A.R.-M., C.J.E. and E.P.-R.; supervision, A.R.-M.; project administration, A.R.-M.; funding acquisition, A.R.-M., E.P.-R. and E.E.R.-G. All authors have read and agreed to the published version of the manuscript.

Funding

This research received no external funding.

Data Availability Statement

All the data can be found in this manuscript.

Acknowledgments

The authors (A.R.-M., E.P.-R., E.E.R.-G. and R.N.) are grateful to the Mexican Council of Science and Technology (CONAHCyT) for financial support through the Investigators National System program (SNII). Similarly, D.V.-V. thanks CONAHCyT–Mexico for providing scholarship No. 1253162 to conduct master’s studies. Also, the authors would like to thank the staff of the environmental and investigation laboratories for dedicating their time and effort to facilitate the materials used to conduct this research.

Conflicts of Interest

The authors declare no conflicts of interest.

References

  1. United Nations Sustainable Development Goals (SDG 6)|United Nations Western Europe. Available online: https://unric.org/en/sdg-6/ (accessed on 22 January 2024).
  2. Ojo, B.O.; Arotiba, O.A.; Mabuba, N. Evaluation of FTO-BaTiO3/NiTiO3 Electrode towards Sonoelectrochemical Degradation of Emerging Pharmaceutical Contaminants in Water. Colloids Surf. A Physicochem. Eng. Asp. 2022, 647, 129201. [Google Scholar] [CrossRef]
  3. Arman, N.Z.; Salmiati, S.; Aris, A.; Salim, M.R.; Nazifa, T.H.; Muhamad, M.S.; Marpongahtun, M.; Ayed, L.B.; Golomazou, E.; Karanis, P.; et al. A Review on Emerging Pollutants in the Water Environment: Existences, Health Effects and Treatment Processes. Water 2021, 13, 3258. [Google Scholar] [CrossRef]
  4. Goswami, R.K.; Agrawal, K.; Verma, P. An Exploration of Natural Synergy Using Microalgae for the Remediation of Pharmaceuticals and Xenobiotics in Wastewater. Algal Res. 2022, 64, 102703. [Google Scholar] [CrossRef]
  5. Roslan, N.N.; Lau, H.L.H.; Suhaimi, N.A.A.; Shahri, N.N.M.; Verinda, S.B.; Nur, M.; Lim, J.-W.; Usman, A. Recent Advances in Advanced Oxidation Processes for Degrading Pharmaceuticals in Wastewater—A Review. Catalysts 2024, 14, 189. [Google Scholar] [CrossRef]
  6. Brião, G.d.V.; da Costa, T.B.; Antonelli, R.; Costa, J.M. Electrochemical Processes for the Treatment of Contaminant-Rich Wastewater: A Comprehensive Review. Chemosphere 2024, 355, 141884. [Google Scholar] [CrossRef]
  7. Avilés-García, O.; Espino-Valencia, J.; Mendoza-Zepeda, A.; Donkor, K.; Brewer, S.; Romero, R.; Natividad, R. Removal of Metoprolol by Means of Photo-Oxidation Processes. Catal. Today 2022, 397–399, 562–573. [Google Scholar] [CrossRef]
  8. World Health Organization. Global Report on Hypertension: The Race against a Silent Killer Download; World Health Organization: Geneva, Switzerland, 2023; ISBN 978-92-4-008106-2. [Google Scholar]
  9. Secretaria de Salud de México Comunicado de La Secretaria de Salud. Available online: https://www.gob.mx/salud/articulos/en-mexico-mas-de-30-millones-de-personas-padecen-hipertension-arterial-secretaria-de-salud#:~:text=Datos%20del%20Instituto%20Nacional%20de,cerca%20de%2050%20mil%20fallecimientos (accessed on 5 August 2024).
  10. Vieno, N.M.; Tuhkanen, T.; Kronberg, L. Analysis of Neutral and Basic Pharmaceuticals in Sewage Treatment Plants and in Recipient Rivers Using Solid Phase Extraction and Liquid Chromatography–Tandem Mass Spectrometry Detection. J. Chromatogr. A 2006, 1134, 101–111. [Google Scholar] [CrossRef]
  11. Tran, N.H.; Reinhard, M.; Gin, K.Y.-H. Occurrence and Fate of Emerging Contaminants in Municipal Wastewater Treatment Plants from Different Geographical Regions—A Review. Water Res. 2018, 133, 182–207. [Google Scholar] [CrossRef]
  12. Vieno, N.; Tuhkanen, T.; Kronberg, L. Elimination of Pharmaceuticals in Sewage Treatment Plants in Finland. Water Res. 2007, 41, 1001–1012. [Google Scholar] [CrossRef]
  13. Zhou, X.; Yang, J.; Guo, J.; Xiong, W.; Leung, M.K.H. Advances and Prospects in Electrocatalytic Processes for Wastewater Treatment. Processes 2024, 12, 1615. [Google Scholar] [CrossRef]
  14. Lu, J.; Zhang, P.; Li, J. Electrocoagulation Technology for Water Purification: An Update Review on Reactor Design and Some Newly Concerned Pollutants Removal. J. Environ. Manag. 2021, 296, 113259. [Google Scholar] [CrossRef] [PubMed]
  15. Jiang, L.; Li, Y.; Chen, Y.; Yao, B.; Chen, X.; Yu, Y.; Yang, J.; Zhou, Y. Pharmaceuticals and Personal Care Products (PPCPs) in the Aquatic Environment: Biotoxicity, Determination and Electrochemical Treatment. J. Clean. Prod. 2023, 388, 135923. [Google Scholar] [CrossRef]
  16. Martínez-Huitle, C.A.; Rodrigo, M.A.; Sirés, I.; Scialdone, O. A Critical Review on Latest Innovations and Future Challenges of Electrochemical Technology for the Abatement of Organics in Water. Appl. Catal. B 2023, 328, 122430. [Google Scholar] [CrossRef]
  17. Lips, S.; Waldvogel, S.R. Use of Boron-Doped Diamond Electrodes in Electro-Organic Synthesis. ChemElectroChem 2019, 6, 1649–1660. [Google Scholar] [CrossRef]
  18. Espinoza-Montero, P.J.; Alulema-Pullupaxi, P.; Frontana-Uribe, B.A.; Barrera-Diaz, C.E. Electrochemical Production of Hydrogen Peroxide on Boron-Doped Diamond (BDD) Electrode. Curr. Opin. Solid. State Mater. Sci. 2022, 26, 100988. [Google Scholar] [CrossRef]
  19. Legrini, O.; Oliveros, E.; Braun, A.M. Photochemical Processes for Water Treatment. Chem. Rev. 1993, 93, 671–698. [Google Scholar] [CrossRef]
  20. Nidheesh, P.V.; Divyapriya, G.; Oturan, N.; Trellu, C.; Oturan, M.A. Environmental Applications of Boron-Doped Diamond Electrodes: 1. Applications in Water and Wastewater Treatment. ChemElectroChem 2019, 6, 2124–2142. [Google Scholar] [CrossRef]
  21. Queiroz, J.; Moura, D.; Santos, E.; Frontana-Uribe, B.; Martínez-Huitle, C. Electrochemical Incineration of Short-Chain Carboxylic Acids with Nb-Supported Boron Doped Diamond Anode: Supporting Electrolyte into the Electrogenerated Oxidant Species (Hydroxyl Radicals, Hydrogen Peroxide and Persulfate). Quim. Nova 2020, 43, 253–260. [Google Scholar] [CrossRef]
  22. Rodríguez-Peña, M.; Natividad, R.; Barrera-Díaz, C.E.; Balderas Hernández, P.; Alanis Ramírez, C.I.; Roa-Morales, G. Current Perspective of Advanced Electrochemical Oxidation Processes in Wastewater Treatment and Life Cycle Analysis. Int. J. Electrochem. Sci. 2024, 19, 100589. [Google Scholar] [CrossRef]
  23. Shin, Y.U.; Yoo, H.Y.; Ahn, Y.Y.; Kim, M.S.; Lee, K.; Yu, S.; Lee, C.; Cho, K.; Kim, H.; Lee, J. Electrochemical Oxidation of Organics in Sulfate Solutions on Boron-Doped Diamond Electrode: Multiple Pathways for Sulfate Radical Generation. Appl. Catal. B 2019, 254, 156–165. [Google Scholar] [CrossRef]
  24. Kovács, K.; Tóth, T.; Wojnárovits, L. Evaluation of Advanced Oxidation Processes for β -Blockers Degradation: A Review. Water Sci. Technol. 2022, 85, 685–705. [Google Scholar] [CrossRef] [PubMed]
  25. Singh, S.; Patidar, R.; Srivastava, V.C.; Lo, S.L.; Nidheesh, P.V. A Critical Review on the Degradation Mechanism of Textile Effluent during Electrocatalytic Oxidation: Removal Optimization and Degradation Pathways. J. Environ. Chem. Eng. 2023, 11, 111277. [Google Scholar] [CrossRef]
  26. de Jesus, J.M.S.; Argolo, A.d.S.; Tominaga, F.K.; Bila, D.M.; Borrely, S.I.; Teixeira, A.C.S.C. BDD-Persulfate-Based Anodic Oxidation Process for Progestin Degradation: Optimization of Conditions, Eco-Compatibility Tests, and Cost Evaluation. J. Environ. Chem. Eng. 2024, 12, 113095. [Google Scholar] [CrossRef]
  27. Wilde, M.L.; Montipó, S.; Martins, A.F. Degradation of β-Blockers in Hospital Wastewater by Means of Ozonation and Fe2+/Ozonation. Water Res. 2014, 48, 280–295. [Google Scholar] [CrossRef] [PubMed]
  28. Benner, J.; Ternes, T.A. Ozonation of Metoprolol: Elucidation of Oxidation Pathways and Major Oxidation Products. Environ. Sci. Technol. 2009, 43, 5472–5480. [Google Scholar] [CrossRef]
  29. Graumans, M.H.F.; Hoeben, W.F.L.M.; van Dael, M.F.P.; Anzion, R.B.M.; Russel, F.G.M.; Scheepers, P.T.J. Thermal Plasma Activation and UV/H2O2 Oxidative Degradation of Pharmaceutical Residues. Environ. Res. 2021, 195, 110884. [Google Scholar] [CrossRef]
  30. Zhan, L.; Li, W.; Liu, L.; Han, T.; Li, M.; Qiang, Z. Degradation of Micropolluants in Flow-through VUV/UV/H2O2 Reactors: Effects of H2O2 Dosage and Reactor Internal Diameter. J. Environ. Sci. 2021, 110, 28–37. [Google Scholar] [CrossRef]
  31. Yang, X.; Zou, R.; Tang, K.; Andersen, H.R.; Angelidaki, I.; Zhang, Y. Degradation of Metoprolol from Wastewater in a Bio-Electro-Fenton System. Sci. Total Environ. 2021, 771, 145385. [Google Scholar] [CrossRef]
  32. Leyva, E.; Moctezuma, E.; López, M.; Baines, K.M.; Zermeño, B. Photocatalytic Degradation of β-Blockers in TiO2 with Metoprolol as Model Compound. Intermediates and Total Reaction Mechanism. Catal. Today 2019, 323, 14–25. [Google Scholar] [CrossRef]
  33. Al-Qaim, F.F.; Mussa, Z.H.; Yuzir, A.; Shameli, K. Electrochemical Degradation of Metoprolol Using Graphite-PVC Composite as Anode: Elucidation and Characterization of New by-Products Using LC-TOF/MS. J. Mex. Chem. Soc. 2020, 64, 165–180. [Google Scholar] [CrossRef]
  34. de Vidales, M.J.M.; Sáez, C.; Pérez, J.F.; Cotillas, S.; Llanos, J.; Cañizares, P.; Rodrigo, M.A. Irradiation-Assisted Electrochemical Processes for the Removal of Persistent Organic Pollutants from Wastewater. J. Appl. Electrochem. 2015, 45, 799–808. [Google Scholar] [CrossRef]
  35. Isarain-Chávez, E.; Rodríguez, R.M.; Cabot, P.L.; Centellas, F.; Arias, C.; Garrido, J.A.; Brillas, E. Degradation of Pharmaceutical Beta-Blockers by Electrochemical Advanced Oxidation Processes Using a Flow Plant with a Solar Compound Parabolic Collector. Water Res. 2011, 45, 4119–4130. [Google Scholar] [CrossRef]
  36. Martín de Vidales, M.J.; Sáez, C.; Cañizares, P.; Rodrigo, M.A. Metoprolol Abatement from Wastewaters by Electrochemical Oxidation with Boron Doped Diamond Anodes. J. Chem. Technol. Biotechnol. 2012, 87, 225–231. [Google Scholar] [CrossRef]
  37. Cornejo, O.M.; Murrieta, M.F.; Aguilar, Z.G.; Rodríguez, J.F.; Márquez, A.A.; León, M.I.; Nava, J.L. Recent Advances in Electrochemical Flow Reactors Used in Advanced Oxidation Processes: A Critical Review. Chem. Eng. J. 2024, 496, 153935. [Google Scholar] [CrossRef]
  38. Regalado-Méndez, A.; Zavaleta-Avendaño, J.; Peralta-Reyes, E.; Natividad, R. Convex Optimization for Maximizing the Degradation Efficiency of Chloroquine in a Flow-by Electrochemical Reactor. J. Solid. State Electrochem. 2023, 27, 3163–3176. [Google Scholar] [CrossRef] [PubMed]
  39. Peralta-Reyes, E.; Regalado-Méndez, A.; Chimeo-Sánchez, A.A.; Robles-Gómez, E.E.; Natividad, R. Electrochemical Degradation of Ciprofloxacin through a DoE-Driven Optimization in a Filter-Press Type Reactor under Batch Recirculation Mode. Water Sci. Technol. 2023, 88, 1294–1316. [Google Scholar] [CrossRef]
  40. Regalado-Méndez, A.; Ruiz, M.; Hernández-Servín, J.A.; Natividad, R.; Romero, R.; Cordero, M.E.; Estrada-Vázquez, C.; Peralta-Reyes, E. Electrochemical Mineralization of Ibuprofen on BDD Electrodes in an Electrochemical Flow Reactor: Numerical Optimization Approach. Processes 2020, 8, 1666. [Google Scholar] [CrossRef]
  41. Shamseali, F.; Mohammadi, F.; Pourzamani, H.; Janati, M. Electrochemical Denitrification of Synthetic Aqueous Solution and Actual Contaminated Well Water: RSM Modeling, Kinetic Study, Monte Carlo Optimization, and Sensitivity Analysis. Int. J. Chem. Eng. 2022, 2022, 1374993. [Google Scholar] [CrossRef]
  42. Romero, V.; Marco, P.; Giménez, J.; Esplugas, S. Adsorption and Photocatalytic Decomposition of the β-Blocker Metoprolol in Aqueous Titanium Dioxide Suspensions: Kinetics, Intermediates, and Degradation Pathways. Int. J. Photoenergy 2013, 2013, 138918. [Google Scholar] [CrossRef]
  43. Isarain-Chávez, E.; Garrido, J.A.; Rodríguez, R.M.; Centellas, F.; Arias, C.; Cabot, P.L.; Brillas, E. Mineralization of Metoprolol by Electro-Fenton and Photoelectro-Fenton Processes. J. Phys. Chem. A 2011, 115, 1234–1242. [Google Scholar] [CrossRef]
  44. Sigma Aldrich, Inc. Safety Data Sheet of Metoprolol Tartrate Salt. Available online: https://www.sigmaaldrich.com/deepweb/assets/sigmaaldrich/product/documents/384/996/m5391pis.pdf (accessed on 17 June 2024).
  45. Gruetter, C.A. Metoprolol. In xPharm: The Comprehensive Pharmacology Reference; Enna, S.J., Bylund, D.B., Eds.; Elsevier: New York, NY, USA, 2007; pp. 1–7. ISBN 978-0-08-055232-3. [Google Scholar]
  46. Regalado-Méndez, A.; Mentado-Morales, J.; Vázquez, C.E.; Martínez-Villa, G.; Cordero, M.E.; Zárate, L.G.; Skogestad, S.; Peralta-Reyes, E. Modeling and Hydraulic Characterization of a Filter-Press-Type Electrochemical Reactor by Using Residence Time Distribution Analysis and Hydraulic Indices. Int. J. Chem. React. Eng. 2018, 16, 20170210. [Google Scholar] [CrossRef]
  47. Baird, R.W.; Eaton, A.D.; Rice, E.W. Standard Methods for the Examination of Water and Wastewater, 23rd ed.; American Public Health Association: Washington, DC, USA, 2017; ISBN 9780875532875. [Google Scholar]
  48. Mechati, S.; Zamouche, M.; Tahraoui, H.; Filali, O.; Mazouz, S.; Nour, I.; Bouledjemer, E.; Toumi, S.; Triki, Z.; Amrane, A.; et al. Modeling and Optimization of Hybrid Fenton and Ultrasound Process for Crystal Violet Degradation Using AI Techniques. Water 2023, 15, 4274. [Google Scholar] [CrossRef]
  49. Karunasingha, D.S.K. Root Mean Square Error or Mean Absolute Error? Use Their Ratio as Well. Inf. Sci. 2022, 585, 609–629. [Google Scholar] [CrossRef]
  50. Viana, D.F.; Salazar-Banda, G.R.; Leite, M.S. Electrochemical Degradation of Reactive Black 5 with Surface Response and Artificial Neural Networks Optimization Models. Sep. Sci. Technol. 2018, 53, 2647–2661. [Google Scholar] [CrossRef]
  51. Amdoun, R.; Khelifi, L.; Khelifi-Slaoui, M.; Amroune, S.; Asch, M.; Assaf-Ducrocq, C.; Gontier, E. The Desirability Optimization Methodology; a Tool to Predict Two Antagonist Responses in Biotechnological Systems: Case of Biomass Growth and Hyoscyamine Content in Elicited Datura Starmonium Hairy Roots. Iran. J. Biotechnol. 2018, 16, e1339. [Google Scholar] [CrossRef]
  52. Ganesan, K.; Xu, B. A Critical Review on Phytochemical Profile and Health Promoting Effects of Mung Bean (Vigna Radiata). Food Sci. Human Wellness 2018, 7, 11–33. [Google Scholar] [CrossRef]
  53. Asath Murphy, M.S.; Jovitha Jane, D.; Sahaya Leenus, S.; Robin, R.S.; Palanichamy, J.; Kalivel, P. Electrochemical Treatment of Textile Wastewater Using Copper Electrodes. J. Environ. Sci. Health Part A 2023, 58, 971–980. [Google Scholar] [CrossRef]
  54. Ganiyu, S.O.; Martínez-Huitle, C.A. Nature, Mechanisms and Reactivity of Electrogenerated Reactive Species at Thin-Film Boron-Doped Diamond (BDD) Electrodes During Electrochemical Wastewater Treatment. ChemElectroChem 2019, 6, 2379–2392. [Google Scholar] [CrossRef]
  55. Mora, A.S.; McBeath, S.T.; Cid, C.A.; Hoffmann, M.R.; Graham, N.J.D. Diamond Electrode Facilitated Electrosynthesis of Water and Wastewater Treatment Oxidants. Curr. Opin. Electrochem. 2022, 32, 100899. [Google Scholar] [CrossRef]
  56. Farhat, A.; Keller, J.; Tait, S.; Radjenovic, J. Removal of Persistent Organic Contaminants by Electrochemically Activated Sulfate. Environ. Sci. Technol. 2015, 49, 14326–14333. [Google Scholar] [CrossRef]
  57. Araújo, K.C.; dos Santos, E.V.; Nidheesh, P.V.; Martínez-Huitle, C.A. Fundamentals and Advances on the Mechanisms of Electrochemical Generation of Persulfate and Sulfate Radicals in Aqueous Medium. Curr. Opin. Chem. Eng. 2022, 38, 100870. [Google Scholar] [CrossRef]
  58. Divyapriya, G.; Nidheesh, P.V. Electrochemically Generated Sulfate Radicals by Boron Doped Diamond and Its Environmental Applications. Curr. Opin. Solid. State Mater. Sci. 2021, 25, 100921. [Google Scholar] [CrossRef]
  59. Ganiyu, S.O.; Martínez-Huitle, C.A.; Oturan, M.A. Electrochemical Advanced Oxidation Processes for Wastewater Treatment: Advances in Formation and Detection of Reactive Species and Mechanisms. Curr. Opin. Electrochem. 2021, 27, 100678. [Google Scholar] [CrossRef]
  60. Clematis, D.; Panizza, M. Application of Boron-Doped Diamond Electrodes for Electrochemical Oxidation of Real Wastewaters. Curr. Opin. Electrochem. 2021, 30, 100844. [Google Scholar] [CrossRef]
  61. Montgomery, D.C. Design and Analysis of Experiments, 10th ed.; Wiley: New York, NY, USA, 2019; ISBN 978-1-119-49244-3. [Google Scholar]
  62. Estrada-Vázquez, C.; Salinas-Pacheco, A.; Peralta-Reyes, E.; Poggi-Varaldo, H.M.; Regalado-Méndez, A. Parametric Optimization of Domestic Wastewater Treatment in an Activated Sludge Sequencing Batch Reactor Using Response Surface Methodology. J. Environ. Sci. Health Part A 2019, 54, 1197–1205. [Google Scholar] [CrossRef]
  63. Mason, R.L.; Gunst, R.F.; Hess, J.L. Statistical Design and Analysis of Experiments with Applications to Engineering and Science, 2nd ed.; John Wiley & Sons Inc.: Hoboken, NJ, USA, 2023; ISBN 0-471-37216-1. [Google Scholar]
  64. Moriasi, D.N.; Arnold, J.G.; Van Liew, M.W.; Bingner, R.L.; Harmel, R.D.; Veith, T.L. Veith Model Evaluation Guidelines for Systematic Quantification of Accuracy in Watershed Simulations. Trans. ASABE 2007, 50, 885–900. [Google Scholar] [CrossRef]
  65. Salmerón, R.; García, J.; García, C.B.; Martín, M.M.L. A Note about the Corrected VIF. Stat. Pap. 2017, 58, 929–945. [Google Scholar] [CrossRef]
  66. Zhou, R.; Zhang, M.; Li, J.; Zhao, W. Optimization of Preparation Conditions for Biochar Derived from Water Hyacinth by Using Response Surface Methodology (RSM) and Its Application in Pb2+ Removal. J. Environ. Chem. Eng. 2020, 8, 104198. [Google Scholar] [CrossRef]
  67. Marinković, V. Some Applications of a Novel Desirability Function in Simultaneous Optimization of Multiple Responses. FME Trans. 2021, 49, 534–548. [Google Scholar] [CrossRef]
  68. Kapałka, A.; Fóti, G.; Comninellis, C. Kinetic Modelling of the Electrochemical Mineralization of Organic Pollutants for Wastewater Treatment. J. Appl. Electrochem. 2007, 38, 7–16. [Google Scholar] [CrossRef]
  69. Liu, G.; Zhang, C.; Zhou, Y.; Yan, Q. Insight into the Overpotential and Thermodynamic Mechanism of Hydroxyl Radical Formation on Diamond Anode. Appl. Surf. Sci. 2021, 565, 150559. [Google Scholar] [CrossRef]
  70. Sirés, I.; Brillas, E.; Cerisola, G.; Panizza, M. Comparative Depollution of Mecoprop Aqueous Solutions by Electrochemical Incineration Using BDD and PbO2 as High Oxidation Power Anodes. J. Electroanal. Chem. 2008, 613, 151–159. [Google Scholar] [CrossRef]
  71. Sirés, I.; Oturan, N.; Oturan, M.A. Electrochemical Degradation of β-Blockers. Studies on Single and Multicomponent Synthetic Aqueous Solutions. Water Res. 2010, 44, 3109–3120. [Google Scholar] [CrossRef] [PubMed]
  72. Chang, C.-F.; Chen, T.-Y.; Chin, C.-J.M.; Kuo, Y.-T. Enhanced Electrochemical Degradation of Ibuprofen in Aqueous Solution by PtRu Alloy Catalyst. Chemosphere 2017, 175, 76–84. [Google Scholar] [CrossRef] [PubMed]
  73. Peralta-Reyes, E.; Natividad, R.; Castellanos, M.; Mentado-Morales, J.; Cordero, M.E.; Amado-Piña, D.; Regalado-Méndez, A. Electro-Oxidation of 2-Chlorophenol with BDD Electrodes in a Continuous Flow Electrochemical Reactor. J. Flow Chem. 2020, 10, 437–447. [Google Scholar] [CrossRef]
  74. Nouri-Nigjeh, E.; Permentier, H.P.; Bischoff, R.; Bruins, A.P. Lidocaine Oxidation by Electrogenerated Reactive Oxygen Species in the Light of Oxidative Drug Metabolism. Anal. Chem. 2010, 82, 7625–7633. [Google Scholar] [CrossRef]
  75. Garedew, M.; Lam, C.H.; Petitjean, L.; Huang, S.; Song, B.; Lin, F.; Jackson, J.E.; Saffron, C.M.; Anastas, P.T. Electrochemical Upgrading of Depolymerized Lignin: A Review of Model Compound Studies. Green Chem. 2021, 23, 2868–2899. [Google Scholar] [CrossRef]
  76. Rafiee, M.; Alherech, M.; Karlen, S.D.; Stahl, S.S. Electrochemical Aminoxyl-Mediated Oxidation of Primary Alcohols in Lignin to Carboxylic Acids: Polymer Modification and Depolymerization. J. Am. Chem. Soc. 2019, 141, 15266–15276. [Google Scholar] [CrossRef]
  77. Radjenovic, J.; Escher, B.I.; Rabaey, K. Electrochemical Degradation of the β-Blocker Metoprolol by Ti/Ru0.7Ir0.3O2 and Ti/SnO2-Sb Electrodes. Water Res. 2011, 45, 3205–3214. [Google Scholar] [CrossRef]
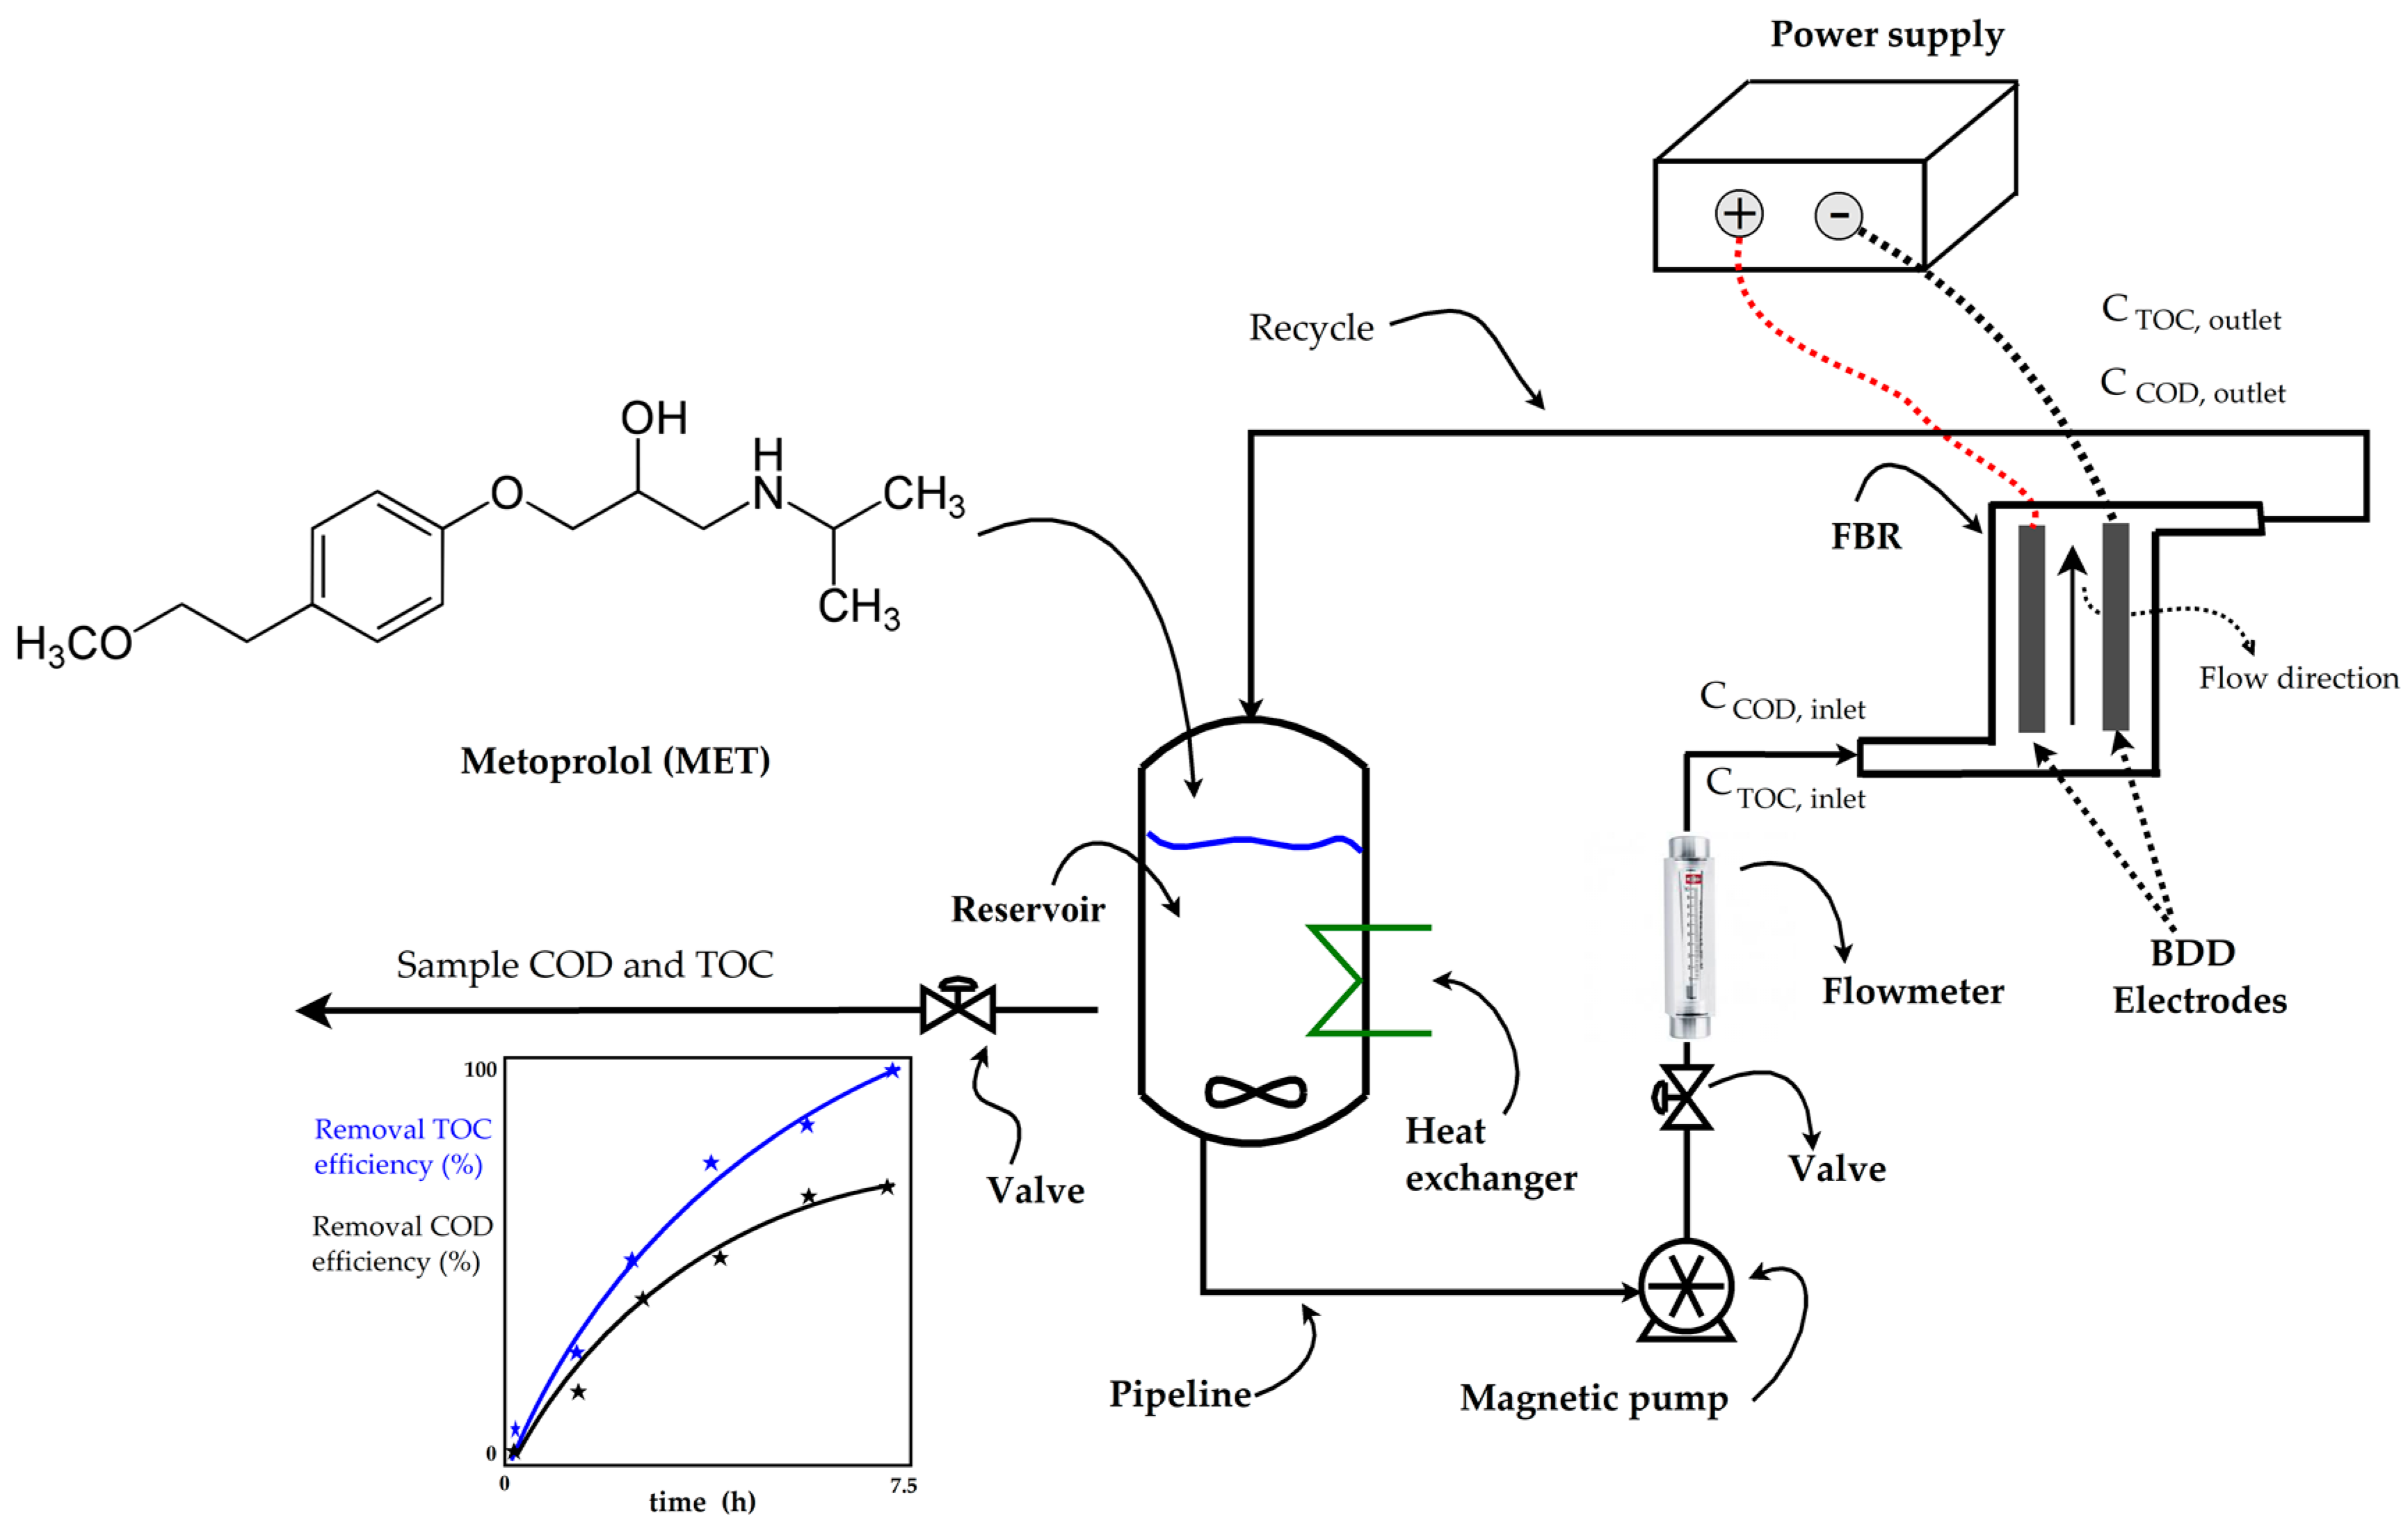
Figure 1. Flowchart of the electrochemical plant.
Processes 12 01958 g001
Scheme 1. Flowchart diagram of the methodology.
Processes 12 01958 sch001
Figure 2. Cyclic voltammogram for a solution containing 50 mg/L of MET in a 0.1 M Na2SO4 solution at the Nb/BDD anode. The potential scan was at 100 mV/s.
Processes 12 01958 g002
Figure 3. (a) Parity graphic for COD removal efficiency; (b) parity graphic for TOC removal efficiency; (c) normal percentage probability residual versus externally studentized residual for COD removal efficiency; (d) normal percentage probability residual versus externally studentized residual for TOC removal efficiency.
Processes 12 01958 g003aProcesses 12 01958 g003b
Figure 4. (a) Perturbation graphic for η C O D ; (b) perturbation graphic for η T O C ; (c) Spearman’s rho plot.
Processes 12 01958 g004
Figure 5. Pareto graphic for both responses ( η C O D and η T O C ).
Processes 12 01958 g005
Figure 6. (a) The 3D plot of η C O D as a function of B and A; (b) the 3D plot of η T O C as a function of B and A; (c) the 3D plot of η C O D as a function of C and A; (d) the 3D plot of η T O C as a function of C and A; (e) the 3D plot of η C O D as a function of C and B; (f) the 3D plot of η T O C as a function of C and B; (g) desirability bar plot; (h) overlaid contour plot for three design operating parameters (pH0, I, and Q) and two response constraints ( η C O D and η T O C ) with the volumetric flow rate at the optimal level (C = 0.8 L/min).
Processes 12 01958 g006aProcesses 12 01958 g006b
Figure 7. (a) Abatement of the concentrations of MET as functions of time, as determined using HPLC; (b) kinetic analysis for the pseudo first-order model for the MET decay; (c) kinetic analysis for the pseudo second-order model for the COD decay; (d) kinetic analysis for the pseudo first-order model for the TOC decay, performed under the optimal operating conditions: T = 25 °C, pH0 5, I = 3.84 A, and Q = 0.8 L/min within a 7.5 h reaction time.
Processes 12 01958 g007
Figure 8. Electro-degradation reaction pathway of MET stages, performed under the optimal operating conditions: T = 25 °C, pH0 5, I = 3.84 A, and Q = 0.8 L/min within a 7.5 h reaction time.
Processes 12 01958 g008
Figure 9. Reaction pathway of MET, performed under the optimal operating conditions: T = 25 °C, pH0 5, I = 3.84 A, and Q = 0.8 L/min within a 7.5 h reaction time.
Processes 12 01958 g009
Figure 10. Growth of Vigna radiata in (a) tap water, (b) distilled water, (c) electrolyte support (Na2SO4 at 0.1 M), (d) solution of MET at 50 mg/L, and (e) wastewater treated using electro-oxidation. The electro-oxidation of the solution of the MET was carried out under the optimal operating conditions: T = 25 °C, pH0 5, I = 3.84 A, and Q = 0.8 L/min within a 7.5 h reaction time.
Processes 12 01958 g010
Table 2. Aqueous solution characteristics and physicochemical properties.
Chemical Structure of METAqueous Solution Characteristics
CMET (mg/L)pHConductivity (µS/cm)TOC (mg/L)COD (mg/L)
Theo.Exp.Theo.Exp.
Processes 12 01958 i00150714,18029.8131.53 a98.1396.00 a
Physicochemical properties
PropertyValue
Molar weight (g/mol)684.81
Melting point (°C)120 [44]
Boling point (°C)695.37 [44]
Water solubility (mg/mL) at 25 °C>1000 [44]
pKa9.7 [45]
λ (nm)223 [42]
Chemical formula:
(C15H25NO3)2●C4H6O6
CAS No.: 56392-17-7
a The average value of all the trials; Theo.: theoretical value; Exp.: experimental value.
Table 3. Levels and studied operating parameters.
K Design ParametersDesign Parameter Levels
−α−10+1
x A : Initial pH3.985.006.508.009.02
x B : Current intensity (A)1.992.503.254.004.51
x C : Volumetric flow rate (L/min)0.490.801.251.702.00
Table 4. Multi-objective optimization and multi-criterion decision-making of the electrochemical process.
ResponseObjectiveLimitsUnitImportance
Min.Max.
pH0Is in range58Dimensionless+++
IIs in range2.54.0A+++
QIs in range0.801.7L/min+++
ηCODMaximize37.562.5%+++
ηTOCMaximize54.5891.24%+++
Table 5. Design matrix (CCRD) and experimental results of the electro-oxidation of MET.
Std.RunDesign SpaceActual ParametersEncoded ParametersResponses
pH0I (A)Q (L/min)ABC η C O D η T O C
11Factorial5.002.500.80−1−1−145.83 ± 0.6765.41 ± 0.83
92Axial3.983.251.250062.50 ± 0.7080.15 ± 0.57
103Axial9.023.251.250041.67 ± 0.5783.46 ± 0.68
124Axial6.504.511.250056.33 ± 0.3578.72 ± 0.55
35Factorial5.004.000.80−1+1−158.33 ± 0.6791.24 ± 0.64
166Central6.503.251.2500052.17 ± 0.7670.91 ± 0.56
87Factorial8.004.001.70+1+1+149.83 ± 0.6481.87 ± 0.85
48Factorial8.004.000.80+1+1−145.83 ± 0.7284.99 ± 0.80
139Axial6.503.250.490038.58 ± 0.5079.15 ± 0.75
510Factorial5.002.501.70−1−1+137.50 ± 0.5359.64 ± 0.74
711Factoria5.004.001.70−1+1+150.00 ± 0.8082.86 ± 0.25
1112Axial6.501.991.250049.99 ± 0.5054.58 ± 0.55
213Factorial8.002.500.80+1−1−151.00 ± 0.6267.29 ± 0.61
614Factorial8.002.501.70+1−1+158.30 ± 0.9577.02 ± 0.87
1415Axial6.503.252.000058.33 ± 0.4671.08 ± 0.35
1716Central6.503.251.2500052.33 ± 0.5976.77 ± 0.97
1517Central6.503.251.2500050.67 ± 0.7479.82 ± 0.53
Table 6. Beta values of the data-based models in encoded terms.
Response/
β-Values
Terms of Data-Based Polynomial Models
InterceptABCABACBCA2B2C2A2CAB2
η C O D / β i 51.75−6.191.615.87−4.833.50---------−1.50−6.547.86
R2 = 0.9816; Adj_R2 = 0.9632; Model_R2 = 0.7826; C.V. = 2.69%; Std. Dev. = 1.36; Adeq_Precision = 24.80
η T O C / β i 75.711.298.22−1.55−3.312.59−1.932.52−2.840.15------
R2 = 0.9430; Adj_R2 = 0.8698; Model_R2 = 0.7036; C.V. = 4.56%; Std. Dev. = 3.45; Adeq_Precision = 14.36
Table 7. ANOVA test results for the data-based models ( η C O D and η T O C ).
SourceSum of SquaresDegrees of FreedomMean SquaredF-Valuep-ValueRemark
COD   removal   efficiency   ( η C O D )
Model78.15898.3953.28<0.0001Significant
A216.941216.94117.48<0.0001
B35.36135.3619.150.0024
C195.031195.03105.62<0.0001
AB186.921186.92101.23<0.0001
AC97.93197.9353.03<0.0001
C229.20129.2015.810.0041
A2C141.641141.6476.71<0.0001
AB2204.671204.67110.84<0.0001
Residual14.7781.85
Lack of fit13.1062.182.600.3034Not significant
Pure error1.6820.8385
Cor total801.9216
TOC   removal   efficiency   ( η T O C )
Model1379.379153.2612.880.0014Significant
A22.65122.651.900.2102
B921.771921.7777.44<0.0001
C32.64132.642.740.1417
AB87.78187.787.370.0300
AC53.87153.874.530.0709
BC29.88129.882.510.1571
A271.76171.766.020.0439
B290.73190.737.620.0281
C20.273910.27390.0300.8837
Residual83.32711.90
Lack of fit42.3158.460.41270.8162Not significant
Pure error41.01220.51
Cor total1462.6916
Table 8. Modeled and experimental responses for the optimal operating parameters.
Operating ParameterResponseValues (%)Error (%)
ModeledExperimental
pH0 5.0
I = 3.84 A
Q = 0.8 L/min
η C O D 60.8161.11 ± 1.600.49
η T O C 90.0783.12 ± 1.568.37
Table 9. Estimated kinetic coefficients, goodness-of-fit values, and determination coefficients.
VariableOrder (n)kappR2RMSE
[MET]10.6072 1/h0.99990.16
[COD]20.0019 L/mg h0.99731.49
[TOC]10.2380 1/h0.99451.00
Table 10. Byproducts identified after the electro-oxidation treatment of MET.
StageRetention Time (min)[M + H]+
m/z
Experimental
Proposed StructureDifference
(%)
MET34.59268Processes 12 01958 i0020.05
I2.56206Processes 12 01958 i0030.02
II4.78226Processes 12 01958 i0040.04
III5.68240Processes 12 01958 i0050.03
IV6.45274Processes 12 01958 i0060.02
V8.56282Processes 12 01958 i0070.02
VI9.35284Processes 12 01958 i0080.03
VII16.21282Processes 12 01958 i0090.02
VIII17.25238Processes 12 01958 i0100.02
IX19.54254Processes 12 01958 i0110.02
X20.47226Processes 12 01958 i0120.02
XI11.68300Processes 12 01958 i0130.04
XII14.26284Processes 12 01958 i0140.05
XIII18.08256Processes 12 01958 i0150.02
XIV5.26134Processes 12 01958 i0160.03
XV8.46116Processes 12 01958 i0170.02
XVI10.92118Processes 12 01958 i0180.02
XVII12.23128Processes 12 01958 i0190.01
XVIII18.43140Processes 12 01958 i0200.01
Table 11. Comparison of various electro-oxidations of MET.
ProcessReaction ConditionsElectrodesVtreated (L)Main ResultsRef.
Ca.An.COD
Removal (%)
TOC
Removal (%)
MET
Removal (%)
Cost (USD/L)
EOFlow-by reactor, AA = 32 cm2, [MET]0 = 50 mg/L, pH0 5.0, I = 3.84 A, [Na2SO4] = 0.1 M, Q = 0.8 L/min, T = 25 °C, and t = 7.5 hBDDBDD2.560.8190.0795.190.19This work
ENOBatch cell, AA = 4 cm2, [MET]0 = 2 mg/L, 5 V, [NaCl] = 5000 mg/L, and t = 1.33 hPtGraphite–PVC0.1------>95.00---[33]
US/UV-ENOBatch cell, AA = 78 cm2, Ultrasound at 200 W, UV at 250 nm, I = 2.34 A, [Na2SO4] = 0.035 M, [MET]0 = 100 mg/L, and t = 10 hSSBDD1.0---100.00100.00---[34]
SPEFNOFlow reactor, four cells, AA = 100 cm2, pH0 3.0, I = 3 A, [Fe2+] = 0.5 mM, [Na2SO4] = 0.1 M, [TOC]0 = 10 mg/L, T = 35 °C, Q = 4.17 L/min, and t = 6 hADEBDD10.0---97.00------[35]
ENOBatch cell, AA = 78 cm2, I = 1.2 A, [Na2SO4] = 5000 mg/L, [MET]0 = 10 mg/L, and t = 10 hSSBDD0.6---100.00100.00---[36]
Ca.: cathode; An.: anode; O: optimized; NO: not optimized; Vtreated: volume treated; Ref.: reference; E: electro-oxidation; U-UV-E: ultrasonic/UV-assisted electro-oxidation; SS: stainless steel; SPEF: solar photo-electro Fenton; ADE: air-diffusion electrode.
Table 12. Variables assessed in phytotoxicity test.
VariableControlsWastewater Containing MET
Tap WaterDistilled WaterElectrolyteInitialFinal
Germination (%)10093.3393.3373.3393.33
Average shoot length (cm)20.724.05.75.66.8
Average root length (cm)5.111.210.810.410.3
Disclaimer/Publisher’s Note: The statements, opinions and data contained in all publications are solely those of the individual author(s) and contributor(s) and not of MDPI and/or the editor(s). MDPI and/or the editor(s) disclaim responsibility for any injury to people or property resulting from any ideas, methods, instructions or products referred to in the content.