Article

Key Components Degradation in Proton Exchange Membrane Fuel Cells: Unraveling Mechanisms through Accelerated Durability Testing

1
China Huadian Engineering Co., Ltd., Beijing 100160, China
2
General Hydrogen Corp., Ltd., Shenzhen 518122, China
3
College of New Energy, China University of Petroleum (East China), Qingdao 266580, China
4
Department of Mechanical and Energy Engineering, Southern University of Science and Technology, Shenzhen 518500, China
*
Authors to whom correspondence should be addressed.
These authors contributed equally to this work.
Processes 2024, 12(9), 1983; https://doi.org/10.3390/pr12091983
Submission received: 20 August 2024 / Revised: 11 September 2024 / Accepted: 12 September 2024 / Published: 14 September 2024

Abstract

:
In the process of promoting the commercialization of proton exchange membrane fuel cells, the long-term durability of the fuel cell has become a key consideration. While existing durability tests are critical for assessing cell performance, they are often time-consuming and do not quickly reflect the impact of actual operating conditions on the cell. In this study, improved testing protocols were utilized to solve this problem, which is designed to shorten the testing cycle and evaluate the degradation of the cell performance under real operating conditions more efficiently. Accelerated durability analysis for evaluating the MEA lifetime and performance decay process was carried out through two testing protocols—open circuit voltage (OCV)-based accelerated durability testing (ADT) and relative humidity (RH) cycling-based ADT. OCV-based ADT revealed that degradation owes to a combined mechanical and chemical process. RH cycling-based ADT shows that degradation comes from a mainly mechanical process. In situ fluoride release rate technology was employed to elucidate the degradation of the proton exchange membrane during the ADT. It was found that the proton exchange membrane suffered more serious damage under OCV-based ADT. The loss of F after the durability test was up to 3.50 × 10⁻⁴ mol/L, which was 4.3 times that of the RH cycling-based ADT. In addition, the RH cycling-based ADT had a significant effect on the catalyst layer, and the electrochemically active surface area decreased by 48.6% at the end of the ADT. Moreover, it was observed that the agglomeration of the catalysts was more obvious than that of OCV-based ADT by transmission electron microscopy. It is worth noting that both testing protocols have no obvious influence on the gas diffusion layer, and the contact angle of gas diffusion layers does not change significantly. These findings contribute to understanding the degradation behavior of proton exchange membrane fuel cells under different working conditions, and also provide a scientific basis for developing more effective testing protocols.

1. Introduction

Hydrogen energy has attracted wide attention due to its high energy density and environmental friendliness [1]. With the growing demand for sustainable energy, the efficient utilization of hydrogen energy has become a global research focus. Proton Exchange Membrane Fuel Cells (PEMFCs), as advanced energy conversion devices, have the advantages of high efficiency, cleanliness and long driving range, which have been widely used in various fields [2]. The membrane electrode assembly (MEA) is the key component of PEMFCs and its service life directly affects the application of fuel cells [3]. The durability analysis of the MEA is essential for the development of long-life PEMFCs.
The proton exchange membrane (PEM) plays a crucial role in conducting protons and isolating H2 and O2 in the MEA [4]. Under operation conditions, the generated ·OH and ·OOH free radicals attack the chemical structure of the PEM, leading to chemical degradation [5]. It reduces the thickness of the PEM and even forms pinholes in the membrane, thereby increasing the hydrogen crossover [6,7]. As the relative humidity of the operation environment changes, the PEM is affected by mechanical stress due to swelling issues, which can even lead to cracks in the membrane. The above degradations can accelerate the MEA’s failure [8,9]. In addition, catalyst layer (CL) shedding, catalyst particle agglomeration, carbon support’s corrosion and carbon corrosion of the gas diffusion layer (GDL) occur concurrently during the operation of PEMFCs. The degradation of these materials also affects the durability of PEMFC [10,11].
At present, many researchers have analyzed the durability of MEA components. Yang et al. [12] tested the durability of a 1 kW fuel cell stack for 350 h and analyzed the decay mechanism of the cathode GDL. It was found that after the cold start cycle, the surface hydrophobicity of the GDL decreases, resulting in the degradation of the electrochemical performance. Wan et al. [13] used the open-circuit voltage (OCV) testing method to evaluate the durability of MEAs, and the results indicated that the degradation of PTFE in the GDL substrate caused a decline in PEMFC performance. Fan [14] et al. investigated the impact of start/stop cycles on durability through voltage step cycling tests and found that catalyst durability depends on the average particle size and dispersion state of Pt particles. Chen et al. [15] studied the effect of PEM thickness on MEA degradation by using the accelerated test method. The study showed that the thinner the PEM thickness, the greater the initial hydrogen crossover, leading to a faster MEA degradation rate. Yang et al. [16] studied the effect of multilayer composite structures on the chemical durability of Nafion membranes. It found that the voltage decay rate of the MEA was 3.15 mV/h, and the hydrogen crossover of the membrane increased from 1.57 mA/cm² to 6.05 mA/cm² after 26 h of OCV loading. The above research simply studies the mechanism of durability degradation of a single component. In addition, due to the insufficient durability test time, the degradation mechanism has not been deeply revealed. Therefore, it is still challenging to understand the degradation mechanism of PEMFC’s different components after long-term durability tests.
In addition to the diverse components of MEA analyzed, the service durability of PEMFC has always been the topic of fuel cell research. With the continuous progress of the MEA production process, both performance and stability have been enhanced. As the stability of the MEA assessed, a longer operation time is necessary, which undoubtedly significantly increases the time cost [17]. Therefore, some extreme test conditions are required to accelerate the aging of the MEA, enabling the MEA to reach the state in the later stage of the test within a relatively short period. This better identification of the PEM attenuation law in a short time is referred to accelerated durability testing (ADT), as the adoption [18].
In the realm of fuel cell technology, ensuring long-term durability is a critical challenge that researchers are actively addressing. To combat the rapid degradation of PEMFCs, various strategies have been proposed and implemented. Liu et al. [19] proposed a cathode recirculation control to control the oxygen partial pressure from long-time high potential. Eskin et al. [20] proposed an anode bleeding method via ultra-low flow rate to avoid severe voltage transients and a detrimental platinum-active surface area, where a super-high hydrogen utilization rate of 99.88% could be realized. Li et al. [21] put forward the attempt from the perspective of system device control, such as with respect to an air compressor. Apart from active control, many researchers implemented the durability improvement from the perspective of material design. Lapicque et al. [22] provided some ways of promoting the durability of the micro porous layer and the gas diffusion layer, such as the deposition of the porous titanium design, adding antimony-doped tin oxide to conventional Vulcan XC-72 and the silicon carbide based micro porous layer, etc. Sun et al. [23] synthesized a Nafion-stabilized platinum nanoparticle colloidal solution through ethylene glycol reduction to enhance durability.
In this study, improved test protocols are designed to shorten the test cycle and assess the cell performance degradation under real operating conditions more efficiently. Particular attention is paid to the differences between OCV-based ADT and RH cycling-based ADT on the degradation of key components of MEAs. In situ F detection technology was employed to investigate the decay of PEM during operation. The MEA electrochemical performance is analyzed by polarization curves, cyclic voltammetry etc. The structures of key components before and after the durability test were analyzed by Scanning Electron Microscopy (SEM) and Transmission Electron Microscopy (TEM) to understand their degradation mechanism thoroughly.

2. Experimental Section

2.1. MEA Fabrication

For this work, the PEMs and GDLs were independently fabricated by Shenzhen General Hydrogen Technology Co., Ltd., from Shenzhen China, as mature commercial products, with models of PEM-12 (thickness: ~12 μm) and GH-D-24 (thickness: ~240 μm, featuring a PTFE microporous layer on the top).
Catalyst-coated membranes (CCMs) were prepared by Shenzhen Nanke Fuel Cell Co., Ltd. from Shenzhen China, through the thermal decal transfer method. The effective area of the CCM was 25 cm2. The Pt loading of the anode and cathode catalyst layer was 0.1 mgPt/cm2 and 0.4 mgPt/cm2, respectively. GDLs were placed on both sides of the CCM and compressed to 70% of their original thickness by using Teflon gaskets. The MEA was then assembled into a single fuel cell hardware. The single fuel cell assembly had a tightening torque of 8 N·m.

2.2. Electrochemical Measurements

Single cell tests were conducted using a fuel cell test station (Yuke Innovation, 500 W, from Dalian China). N2 was first fed to both electrodes while heating the cell to 75 °C. The anode gas was then switched to H2, and then the cathode gas was switched to air while monitoring the OCV until stable. After a break in procedure [24], polarization curves, hydrogen crossover linear sweep voltammetry (LSV) and cyclic voltammetry curves (CV) were recorded by a potentiostat (Gamry, Interface 5000E, from Warminster, PA, USA).
For the polarization curves, the gas flow was H2/air (1200/2500 sccm) for the anode and cathode, respectively. The back pressure and relative humidity (RH) for the anode and cathode were held at 150/150 kPa and 100/100% RH, respectively. The cell was kept at 75 °C. Data were collected controlling the current and starting from a total cell current density of 2.0 A/cm2 using the following subsequent steps: 2.0, 1.75, 1.5, 1.25, 1.0, 0.75, 0.5 and 0.25 A/cm2, followed by an OCV hold for 10 s. LSV was measured using a potentiostat at a scan rate of 2 mV/s. For the hydrogen crossover measurements, the gas flow was H2/N2 (200/200 sccm) for the anode and cathode, respectively. The cell temperature was 75 °C and operated at ambient pressure. CV was conducted with a scan rate of 50 mV/s flowing H2/N2 (200/200 sccm) at 150/150 kPa and 100/100% RH for the anode and cathode, respectively. The cell was controlled to a temperature of 75 °C. The CV measurements were used to estimate the ECSA.
This study included two accelerated durability tests: OCV-based ADT and RH cycling-based ADT.
OCV-based ADT: H2/Air (100/4000 sccm) was fed into the anode and cathode at 200/200 kPa and 30/30% RH, respectively. The cell was held at OCV with a temperature of 75 °C. Electrochemical performance was performed per 100 h until the cell failed (the H2 crossover limiting current density > 15 mA/cm2).
RH cycling-based ADT: N2 was fed to the both electrodes at a flow rate of 4000 sccm, and the RH was alternately changed between the dry status (0% RH for 2 min) and wet status (100% RH for 2 min). The cell was held at OCV with a temperature of 80 °C. Electrochemical performance was performed per 4000 cycles until the cell failed (the H2 crossover limiting current density > 15 mA/cm2).

2.3. Structural Characterization

The morphology structure of the CL in the MEA was examined via Transmission Electron Microscopy (TEM, Talos F200, from Waltham, MA, USA) and Scanning Electron Microscopy (SEM, Zeiss EVO10, from Oberkochen, Germany). The Pt loading was calculated and reported by the instrument software (Thermo Scientific™ UniQuant™) offered by the supplier. The TEM images characterized the plane of the CL layer at 50 nm. First, the GDL was removed to ensure that the CL on the surface of the MEA was completely removed from the GDL. CCM of 0.5 × 0.5 cm were cut into the glass tube. The ethanol was added to ultrasound for 3–5 min until the liquid surface no longer changes. Then the supernatant was selected and dropped onto a clean copper net to dry and then tested. The SEM images were utilized for characterizing the cross-sectional structure and morphology of the MEA, with the operation conducted at an accelerating voltage of 10 kV and a working distance of 17.6 mm. The cross-section of the MEA was fabricated by immersing a piece of MEA in liquid nitrogen for approximately 20 s and subsequently cutting the frozen MEA on a glass slide using a brand-new double-edge feather razor blade. The cross-section was placed on a double-sided carbon tape and adhered to the cross-sectional specimen holder for imaging. The Fluoride Release Rate (FRR) in PEM was studied using an ion counter (LeiCi PXSJ-216F, from Shanghai China) The contact angle of GDLs was determined by an automatic contact angle measurement instrument (XG-CAMD3). A 2 × 4 cm2 cathode GDL was cut and placed on the sample table to be tested. A total of 3 µL drops of water were placed on the MPL surface for the contact angle test. The average value of three times of data was selected as the final data.

3. Results and Discussion

3.1. Electrochemical Performance Analysis

Two durability testing protocols were designed to evaluate the MEA lifetime and to analyze the MEA performance decay process. Figure 1a shows the inlet pressure of the electrode for the OCV-based ADT conditions. The H2 and air flow rate was 100 and 4000 sccm, respectively. The cell was held at OCV (~0.978 V at the beginning) for about 362 h, this high voltage condition accelerated the generation of -OOH free radicals and simulated the chemical degradation process of PEM [25]. In addition, the over-flowed air was fed into the cell, as consequence, the excessive air flow at the cathode can cause excessive moisture evaporation, affecting the wetting state and local temperature of the membrane and causing partial mechanical damage. Moreover, overly rapid air flow will accelerate the decomposition of the cathode catalyst layer and influence the catalytic reaction efficiency [26]. Thus, the OCV-based ADT condition is a combined mechanical and chemical degradation process. Figure 1b illustrates the protocol of RH cycling-based ADT condition. By periodically changing the RH, the PEM swells and shrinks accordingly, which accelerated the cracking of the PEM due to mechanical tension, simulating the unreversible mechanical degradation process of PEM [27]. Compared with the OCV-based ADT condition, the RH cycling-based ADT condition is a mechanical degradation process. These two ADT protocols will cause different degradation behavior of the key component of MEAs.
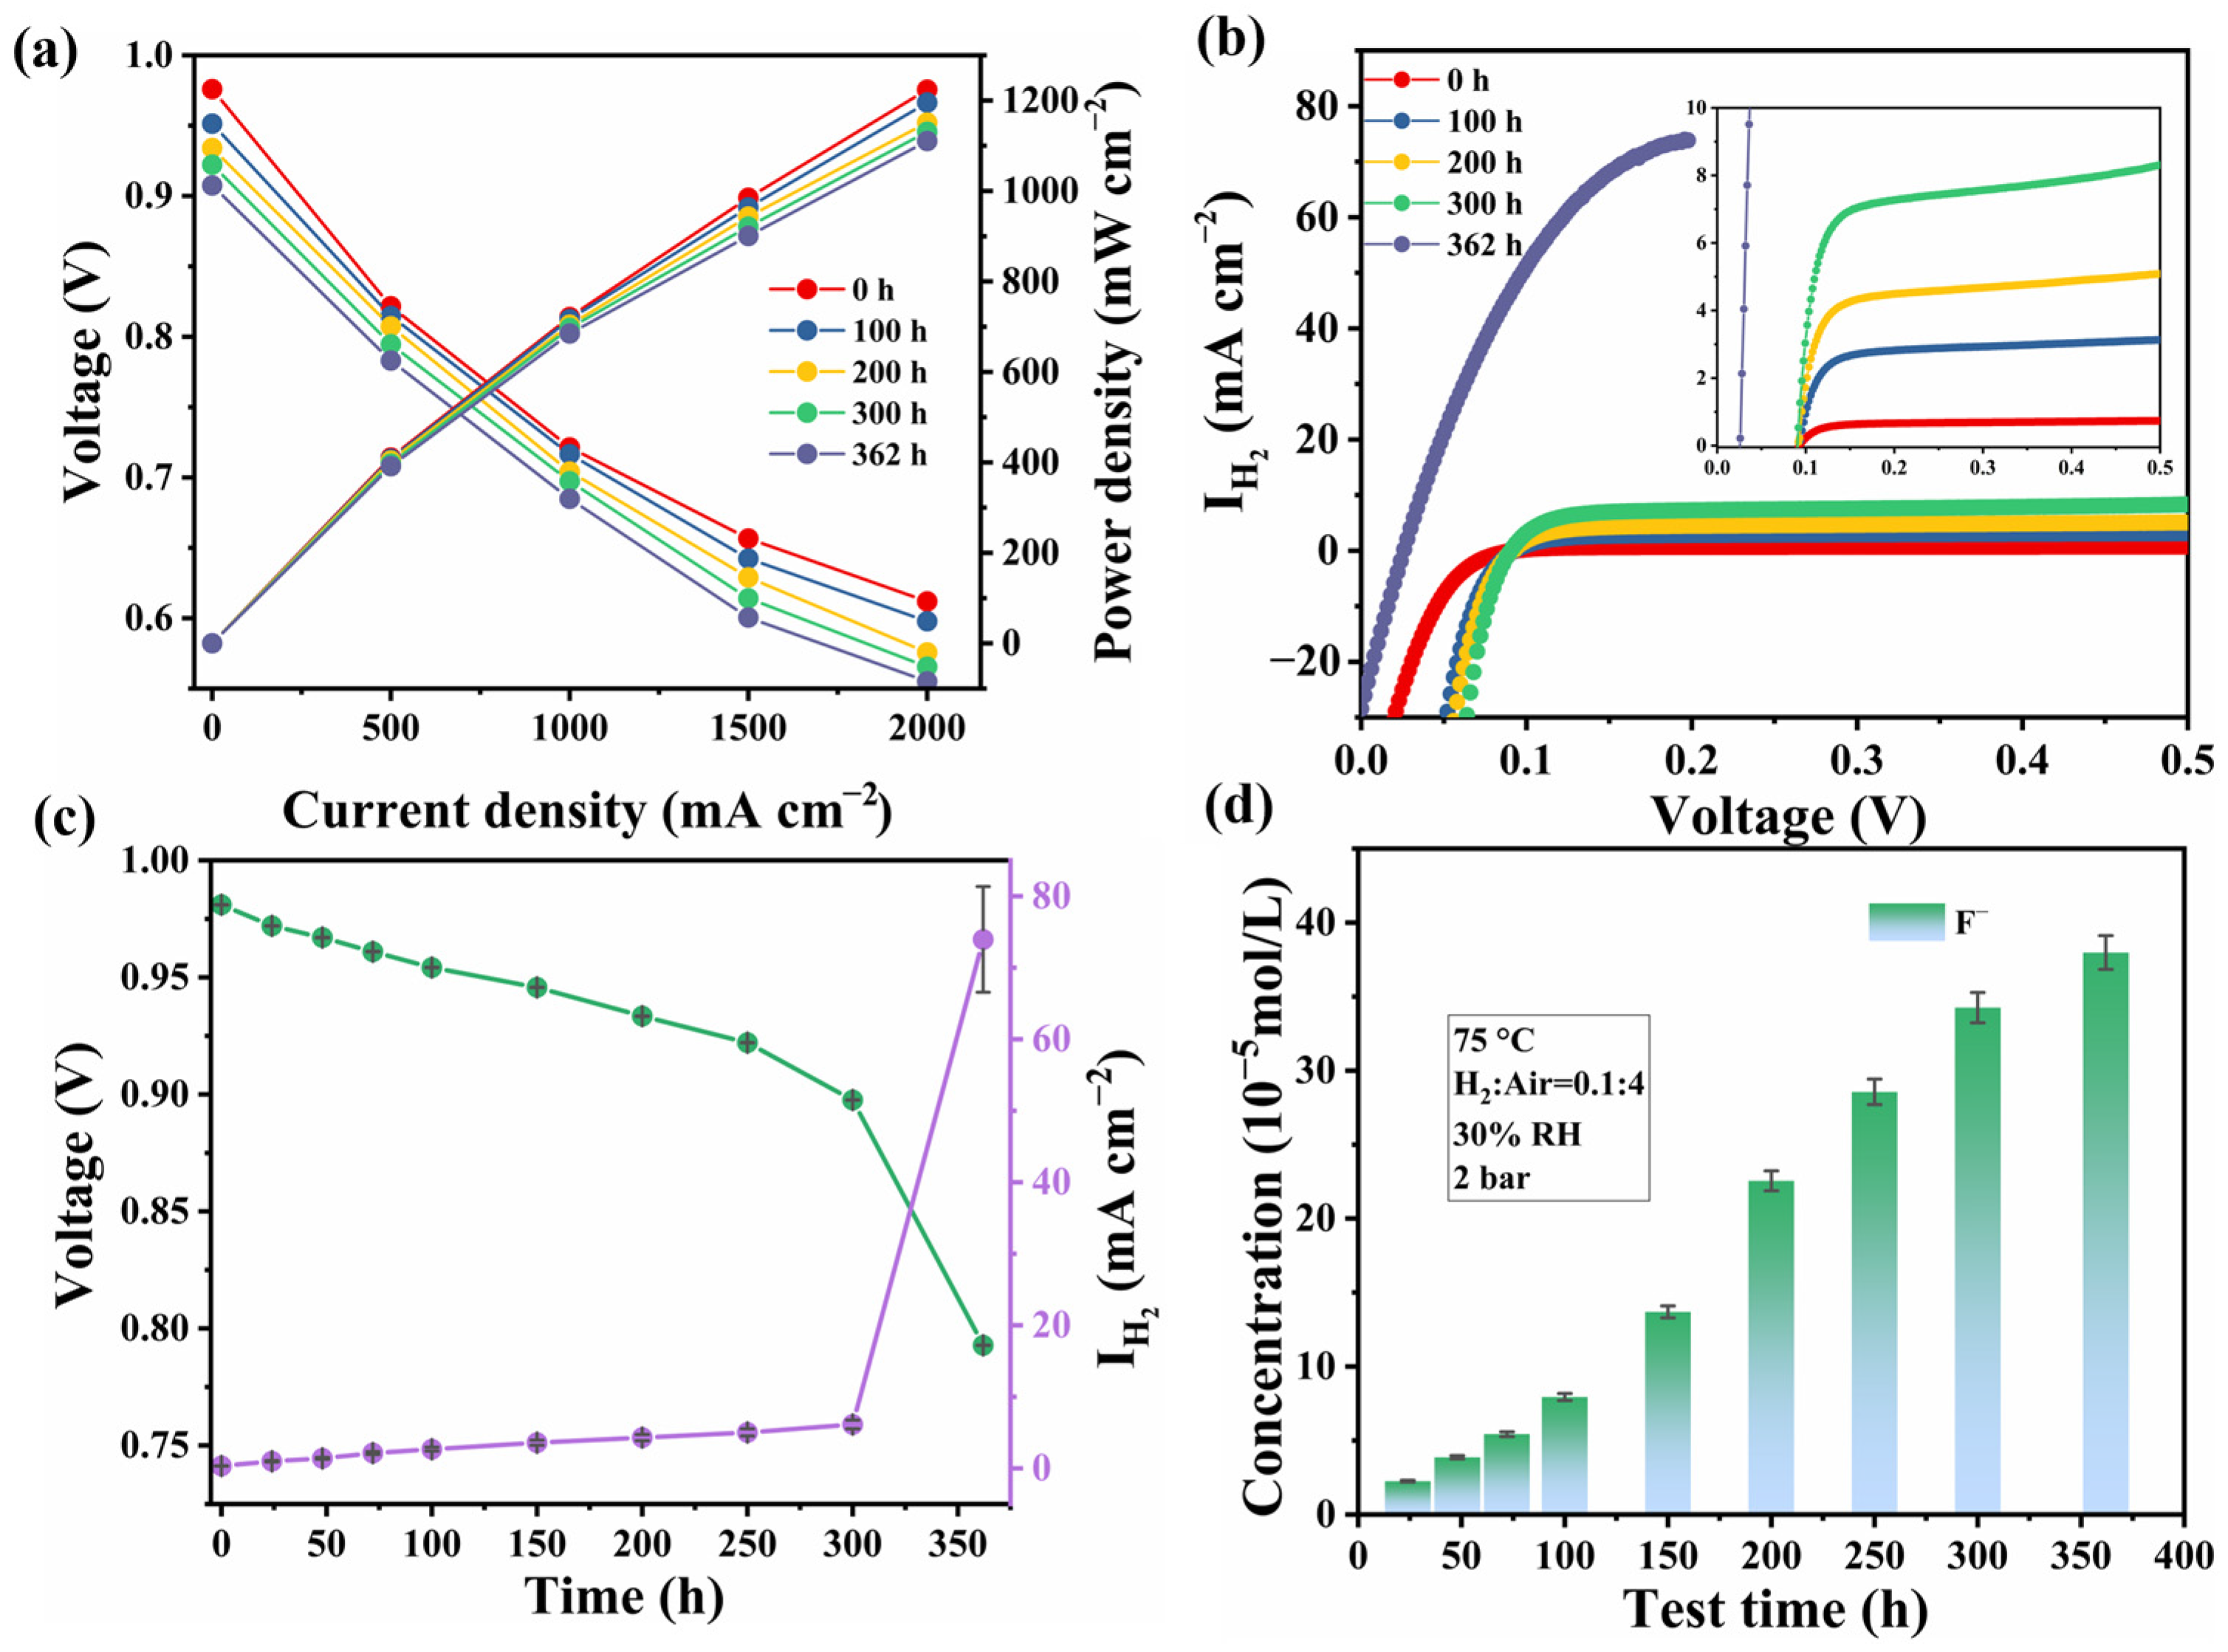
During the OCV-based ADT, polarization curves were investigated every 100 h, as shown in Figure 2a. The OCV before the ADT was about 0.978 V, and a high voltage can cause chemical degradation [16]. The OCV decreased ~20 mV in the first 100 h, and the voltage decay rate reached 2.51%. The OCV was monitored every 100 h during the OCV-based ADT, the OCV at 200 h, 300 h and 362 h was 0.934 V, 0.922 V and 0.908 V, respectively, the voltage decay rate reached 4.19%, 5.41% and 6.92%. In addition, the degree of hydrogen penetration through the PEM (hydrogen permeation current density) [28] was recorded concurrently at the same time interval. As shown in Figure 2b, the growth trend of hydrogen crossover LSVs within the initial 300 h was the same as the downward trend of OCV. After 362 h of the OCV-based ADT, the hydrogen crossover limiting current density increased sharply over 73.94 mA/cm2, and at this point, the PEM fuel cell was considered failed [29].
The correlation between the hydrogen crossover limiting current density and OCV over time is shown in Figure 2c. It was observed that in the first 300 h, OCV maintained above 0.92 V and the hydrogen crossover current density was less than 8 mA/cm2, indicating that the PEM was not completely ineffective [27,29]. Subsequently, the OCV dropped to 0.908 V and the decay rate reached 6.92%. The hydrogen crossover current rapidly increases, which is greater than 15 mA/cm2 of the failure line [30]. At this point, the OCV-based ADT was stopped.
Through in situ F detection, the state of the PEM was successfully monitored in real-time, as shown in Figure 2d. It showed that during the initial stage of testing (0–100 h), the FRR detected in the product remained almost unchanged, indicating that there were no significant fractures in the main chains and side chains of the PEM structure during this period [31]. After 150 h, there was a sharp increase in FRR detected in the product, indicating significant changes in the PEM structure and the -CF3 bond in the side chain might break [32]. As the testing time continued to increase, the FRR continued to rise, indicating more frequent and severe PEM structural damage. This indicated that the free radicals generated by the oxidation reaction are one of the main causes of PEM degradation. The resultant radicals react with the hydrophilic sulphonic acid side chains of the PTFE hydrophobic backbone, causing the molecular alteration of the main backbone and side chain terminals. It causes cracks, pinholes and thinning of the proton exchange membrane, while releasing fluorine ions and reducing the MEA lifetime.
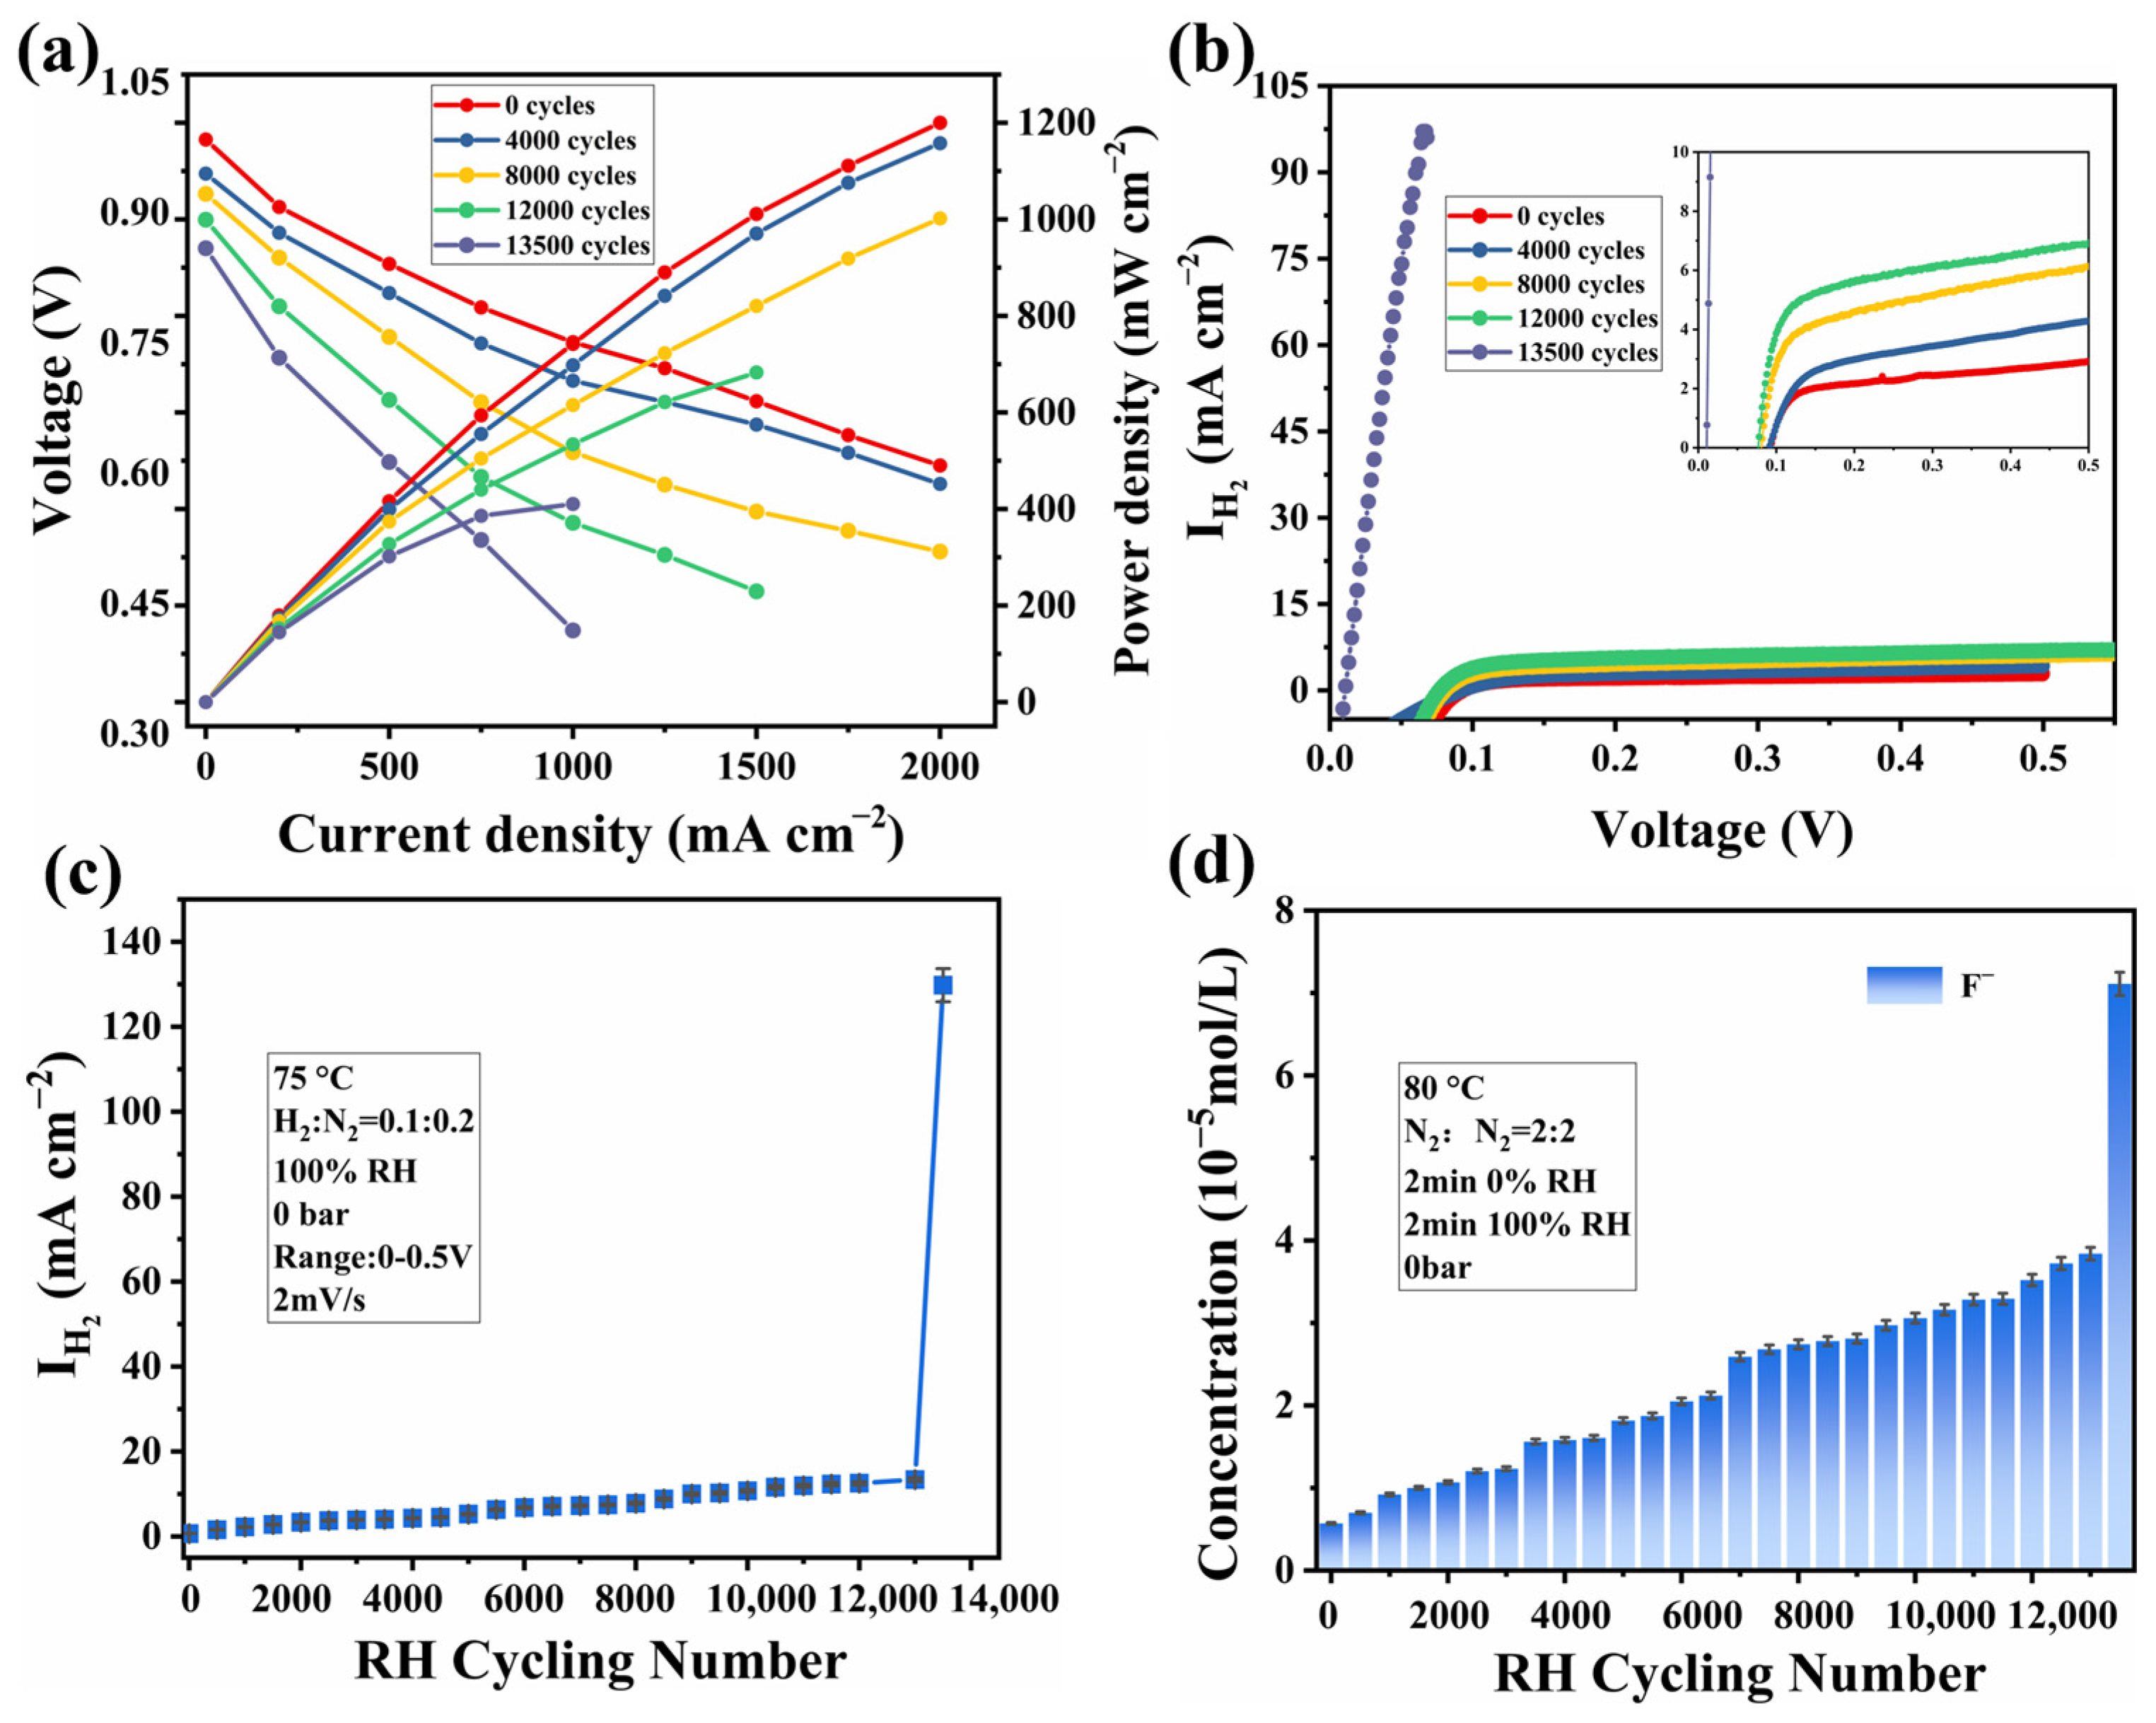
The RH cycling-based ADT was utilized to evaluate the PEMFC performance decay under frequent swelling and contraction of PEM [33]. Figure 3a shows the polarization curves obtained during the RH cycling-based ADT. During 0 to 8000 cycles, an obvious degradation trend was shown at the high current density region, with peak power density dropping from 1020 mW/cm² to 800 mW/cm². This degradation might be due to the abnormal water management of MEA during the RH cycling-based ADT, resulting in an increasement of mass transfer resistance. The overall decline in the polarization curve was more significant during 8000 to 13,500 cycles. After 13,500 cycles, the peak power density dropped to an unmeasurable level. The hydrogen crossover limiting current density was 0.67 mA/cm² before the RH cycling-based ADT. In the first 5000 cycles, the hydrogen crossover current density was maintained below 5.25 mA/cm² and it fluctuated between 6.30 and 13.36 mA/cm² during 5500 to 13,000 cycles. It rose sharply to 129.79 mA/cm² after 13,500 cycles (Figure 3b,c). At this point, the MEA has failed. As seen in Figure 3d, the FRR increased with the number of cycles, showing the same trend as the H2 crossover in Figure 3c. In particular, the FRR increased sharply after the 13,500 cycles, indicating that there is serious damage to the PEM.
These protocols are designed to shorten the test cycle and more effectively evaluate the attenuation of fuel cell performance under real operating conditions, which differs from the EU FCH JU, Japan NEDO and US DOE protocol [34]. Specifically, in the OCV-based ADT, higher voltages and different gas flow ratios were employed to accelerate the chemical degradation process. In RH cycling-based ADT, the humidity change frequency and duration are different from existing protocols, which is to better simulate environmental changes in actual operation.

3.2. Degradation Behavior Analysis

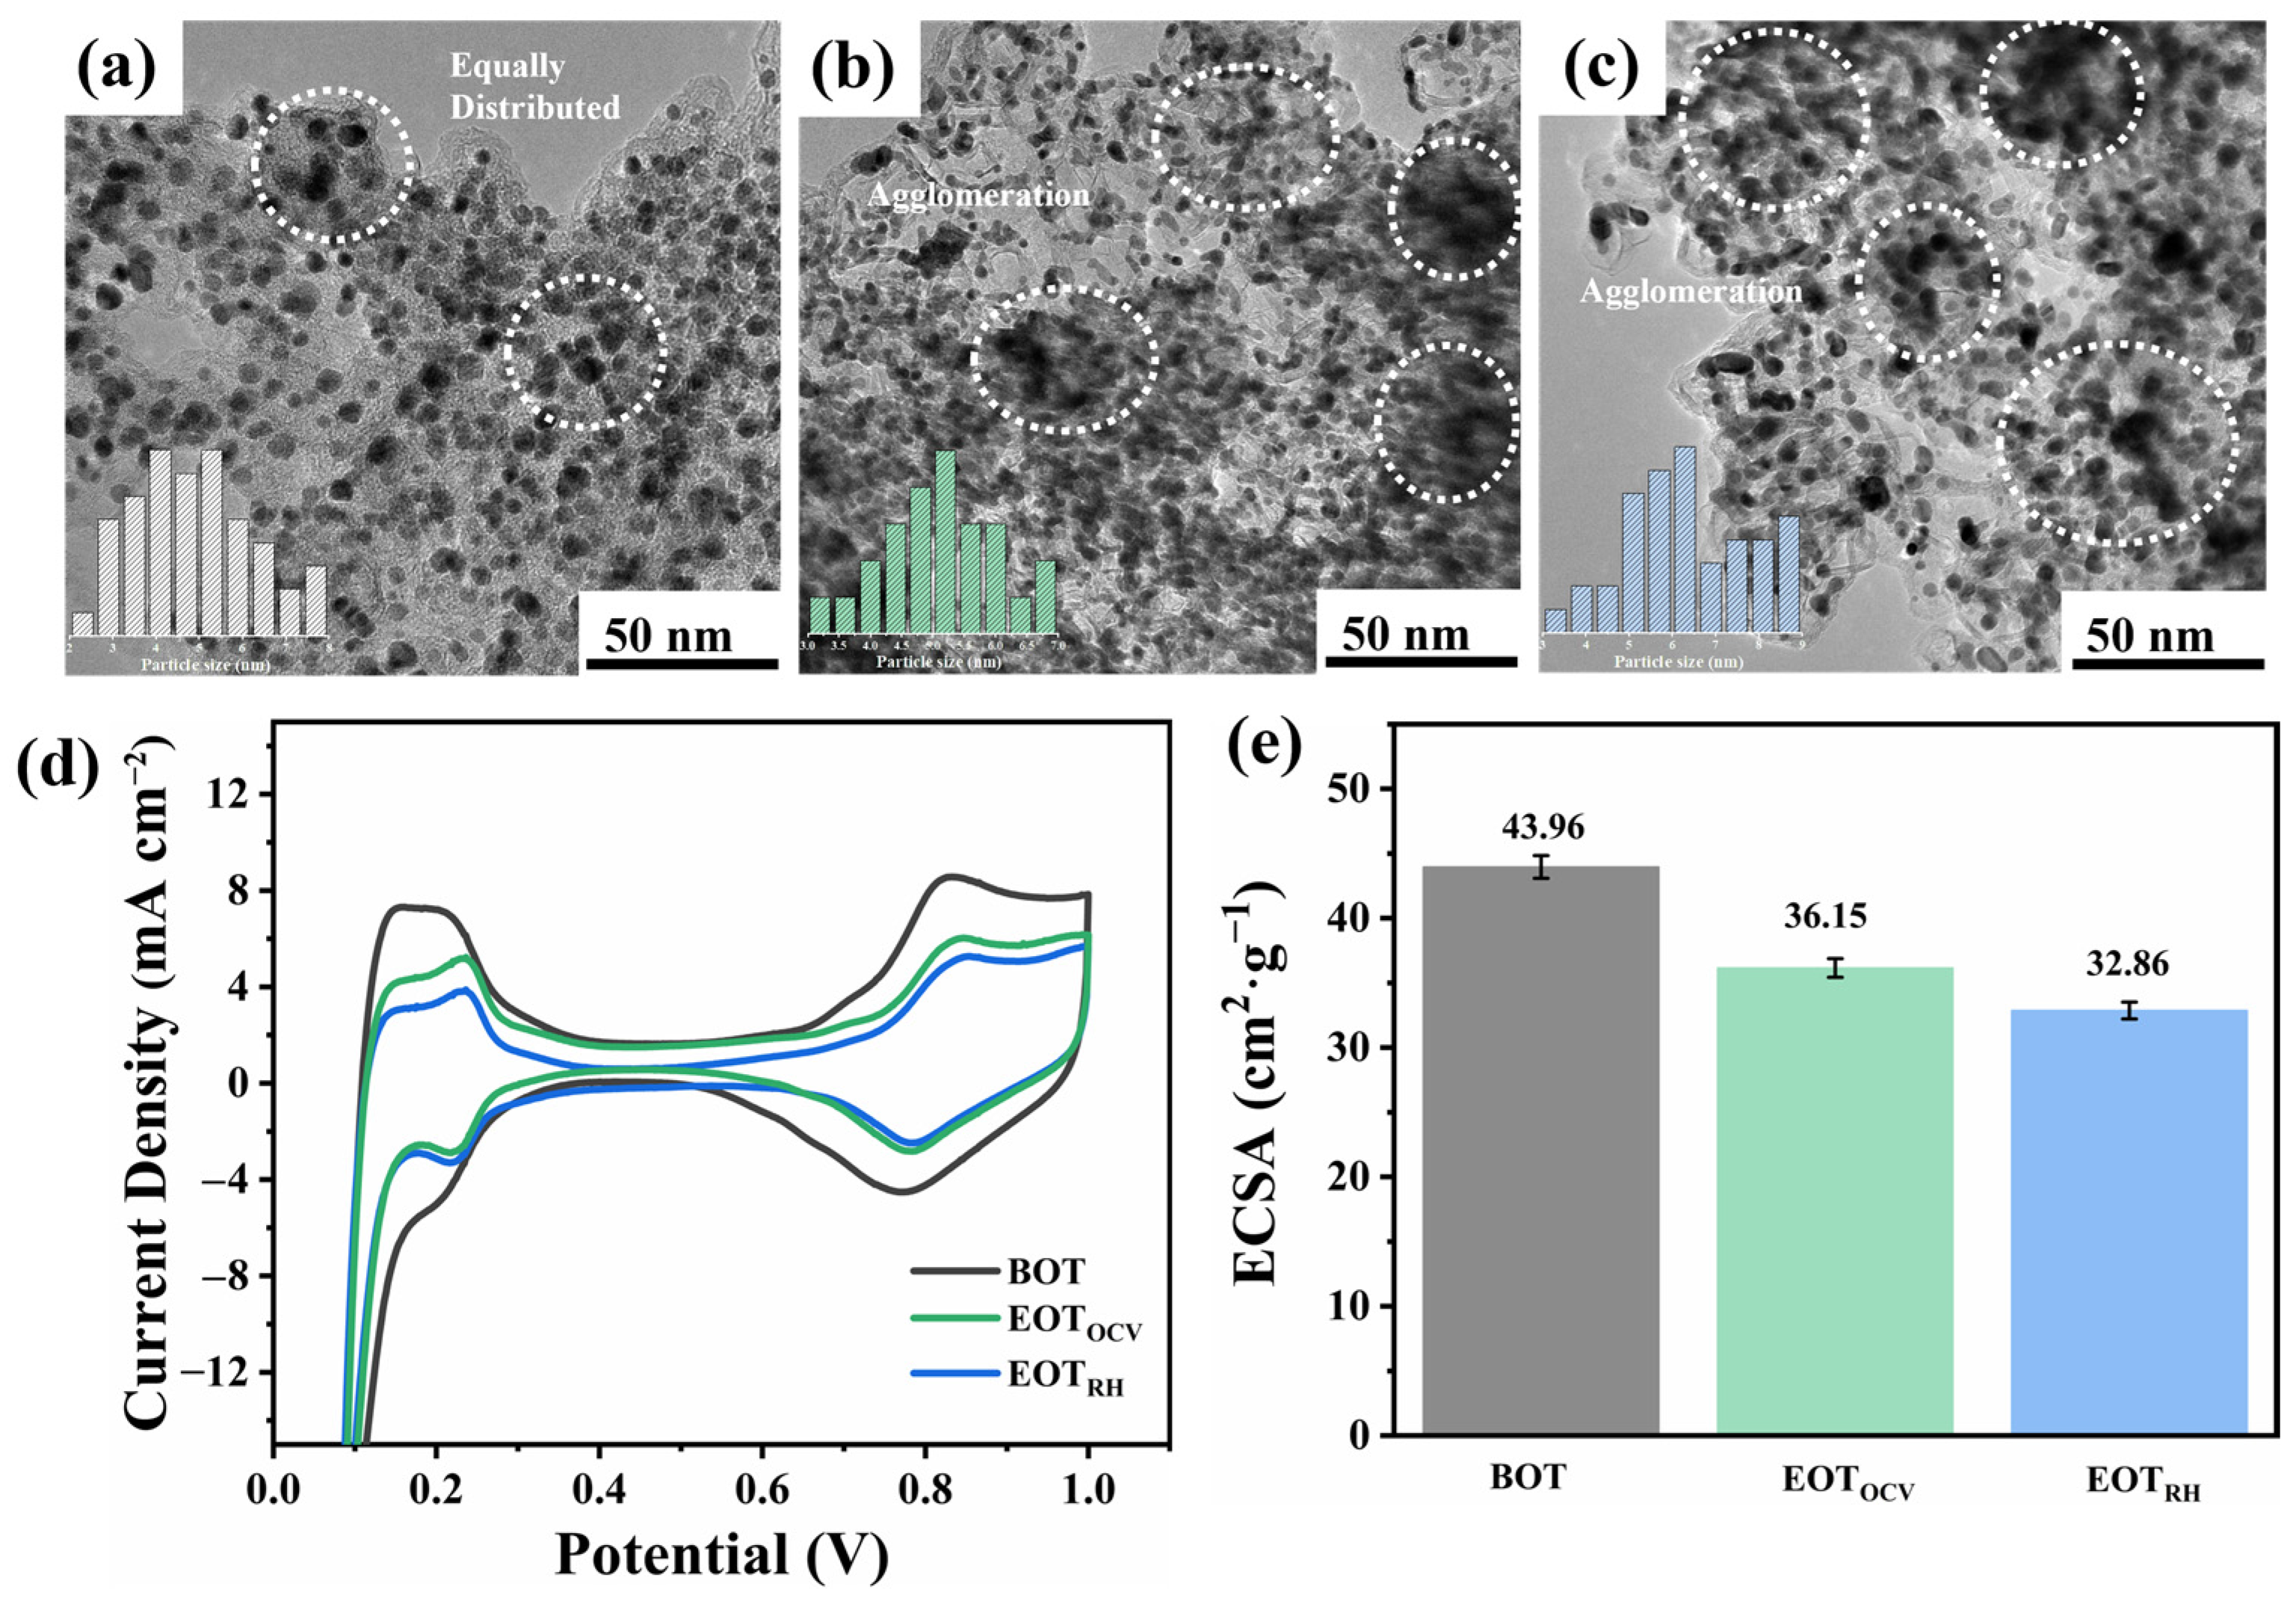
TEM was performed to study the effect of OCV-based ADT and RH cycling-based ADT on the microstructure of the cathode catalyst (Figure 4a–c). The Pt particles were uniformly distributed without significant aggregation at the beginning of test (BOT). The average particle size was 4.67 nm. At the end of OCV-based ADT (noted as EOTOCV), the Pt particles in the cathode showed noticeable aggregation. The distribution of Pt particle size was not uniform, and the particle size became larger (Figure 4b), which reduces active sites and leads to a decrease in the electrochemically active surface area (ECSA). Figure 4c showed that after RH cycling-based ADT (EOTRH), the Pt particles in the cathode also exhibited larger aggregation and particle size compared to OCV-based ADT.
The CV of the MEA was measured to study the change in the ECSA (Figure 4d,e). A significant reduction in the ECSA was observed at the end of tests. Specifically, the ECSA after the RH cycling-based ADT was 32.86 m2/mgPt, exhibiting a 33.78% decrease. This was closely related to the dissolution and agglomeration of Pt particles during the ADT [35,36]. In addition, the ECSA after the OCV-based ADT was 36.15 m2/mgPt, which was smaller than the degradation caused by the RH cycling-based ADT.
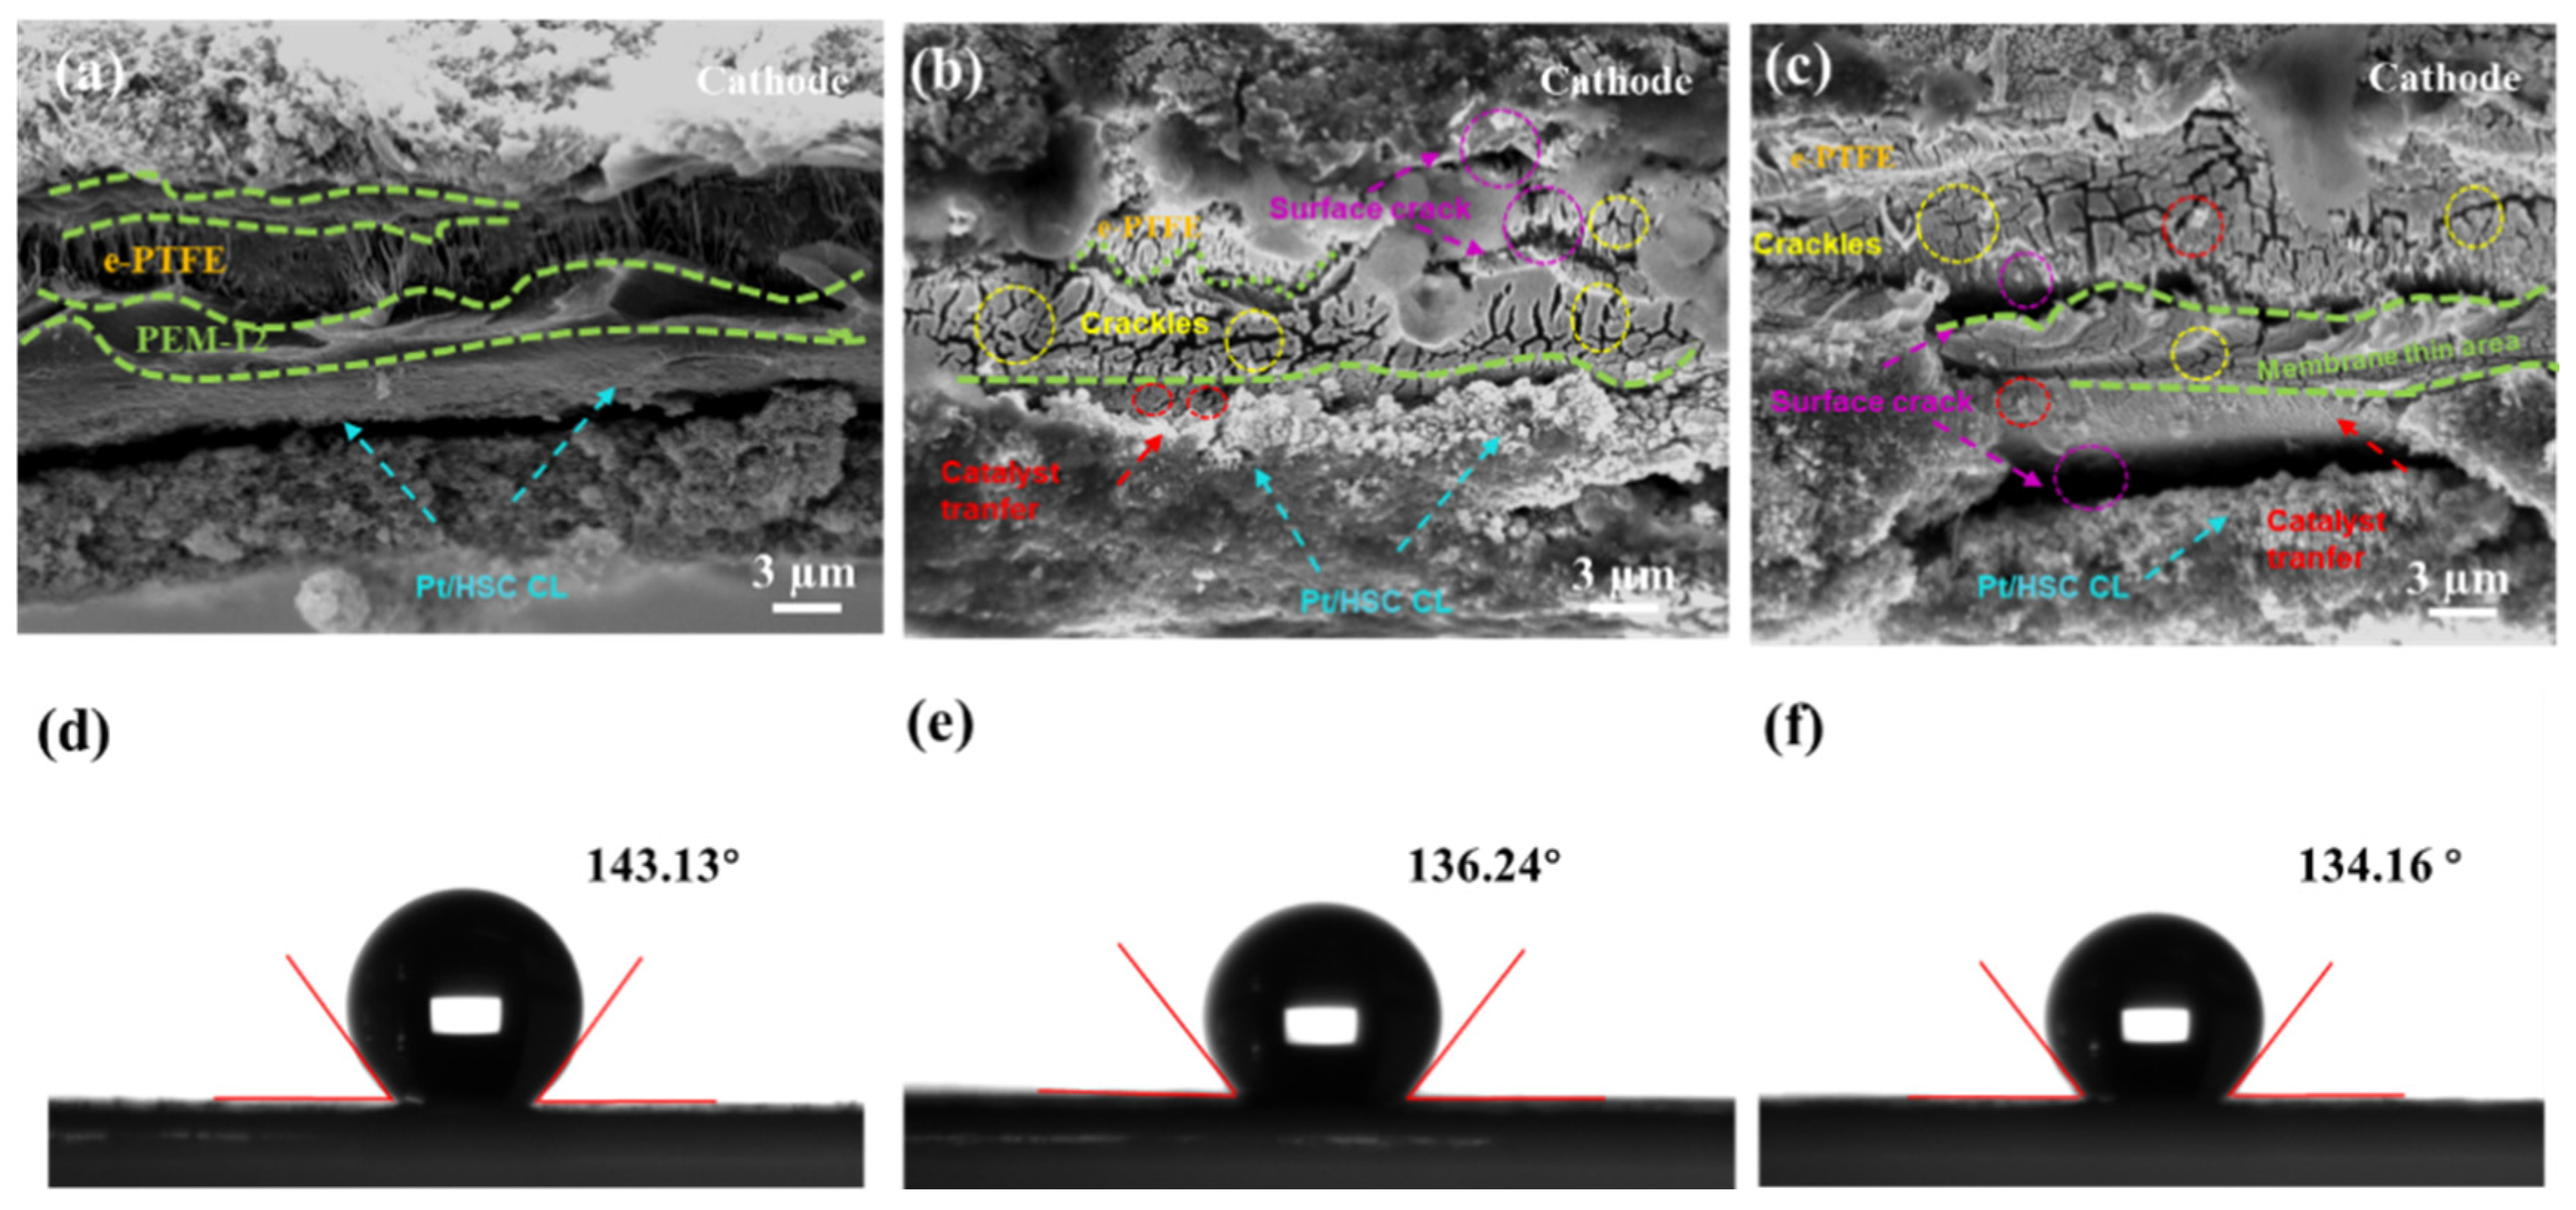
The cross-sectional SEMs of MEA were further investigated (Figure 5a). At the BOT, the PEM cross-section did not exhibit visible cracks and there was good contact between the PEM and CLs. After the OCV-based ADT, numerous fine cracks were evident on the cross-section as seen in Figure 5b. This was attributed to the attack of radical -OOH on the membrane surface during OCV-based ADT, accelerating the formation of surface cracks [37]. After the RH cycling-based ADT, there were a large number of cracks in PEM and significant PEM/CL delamination was observed on the surface, as seen in Figure 5b. In order to assess whether the ADT leads to degradation of GDLs, the hydrophilicity of GDLs before and after the ADT were analyzed through water contact angle tests. In Figure 5d, the initial contact angle of the GDL is 143.13°. The contact angle of GDL at the end of OCV-based ADT and RH cycling-based ADT was 136.24° and 134.16° (Figure 5e,f), respectively. The decrease of contact angle after the ADT indicated the loss of hydrophobic PTFE, which has a minor impact on mass transfer within the MEA.

4. Conclusions

The durability of PEMFC is analyzed in detail, with special attention to the degradation of the MEA under two different accelerated durability test conditions. Through the OCV-based ADT and RH cycling-based ADT, the key degradation mechanism of PEMFC under real operating conditions is revealed. First, the PEM showed more serious damage under OCV-based ADT, and the FRR is 4.3 times that of the RH cycling-based ADT. It is mainly attributed to the attack of -OOH free radicals generated at high potential on the PEM, which caused substantial harm to the PEM structure. Moreover, the excessive air flow at the cathode not only affects the wetting state of the membrane but also accelerates the decomposition of the cathode catalyst layer, causing partial mechanical degradation to the MEA. This combined mechanical and chemical degradation not only reduces the thickness of the PEM, but also form cracks in the PEM, thereby increasing the hydrogen crossover and lowering the OCV of the fuel cell. Second, the RH cycling-based ADT has a more significant effect on CL, resulting in a significant decrease in ECSA by as much as 48.6%. This is further confirmed by the aggregation of catalyst particles observed by TEM. In addition, the two test conditions have relatively little effect on GDLs and contact angle shows a slight decrease after the ADTs. This study not only provides a new perspective for understanding the durability of PEMFC under different working conditions, but also provides an important scientific basis for improving MEA design, developing new anti-aging materials and optimizing PEMFC operation strategies.

Author Contributions

Conceptualization, K.Y.; investigation, K.Y., L.W., H.Z., Z.L., Y.L. and G.P.; data curation, L.W.; writing—original draft preparation, K.Y. and L.W.; visualization, X.X. and H.Z.; project administration, H.W.; Writing—review & editing, G.P. and M.W.; Software Programming, Investigation, X.W.; Formal analysis, Validation, S.L. All authors have read and agreed to the published version of the manuscript.

Funding

This research was funded by Qingdao New Energy Shandong Laboratory Open Project (No. QNESL OP 202303) and Shandong Provincial Natural Science Foundation (No. ZR2023LFG005).

Data Availability Statement

No new data were created or analyzed in this study. Data sharing is not applicable to this article.

Conflicts of Interest

The authors declare no conflict of interest.

References

  1. Stariha, S.; Macauley, N.; Sneed, B.T.; Langlois, D.; More, K.L.; Mukundan, R.; Borup, R.L. Recent Advances in Catalyst Accelerated Stress Tests for Polymer Electrolyte Membrane Fuel Cells. J. Electrochem. Soc. 2018, 165, 492–501. [Google Scholar] [CrossRef]
  2. Choi, S.R.; Lim, M.; Kim, D.Y.; An, W.Y.; Lee, S.W.; Choi, S.; Bae, S.J.; Yim, S.-D.; Park, J.-Y. Life prediction of membrane electrode assembly through load and potential cycling accelerated degradation testing in polymer electrolyte membrane fuel cells. Int. J. Hydrogen Energy 2022, 47, 17379–17392. [Google Scholar] [CrossRef]
  3. Qu, E.; Hao, X.; Xiao, M.; Han, D.; Huang, S.; Huang, Z.; Wang, S.; Meng, Y. Proton exchange membranes for high temperature proton exchange membrane fuel cells: Challenges and perspectives. J. Power Sources 2022, 533, 231386. [Google Scholar] [CrossRef]
  4. Qiu, D.; Peng, L.; Liang, P.; Yi, P.; Lai, X. Mechanical degradation of proton exchange membrane along the MEA frame in proton exchange membrane fuel cells. Energy 2018, 165, 210–222. [Google Scholar] [CrossRef]
  5. Huang, X.; Russo, C.; Zou, Y.; Solasi, R.; Reifsnider, K.; Condit, D. Degradation and Failure Mechanisms of PEMFC Membrane Electrode Assembly under RH Cycling Conditions. ECS Meet. Abstr. 2007, 1, 402. [Google Scholar] [CrossRef]
  6. Ioroi, T.; Siroma, Z.; Yamazaki, S.; Yasuda, K. Yasuda Electrocatalysts for PEM Fuel Cells. Adv. Energy Mater. 2019, 9, 1801284. [Google Scholar] [CrossRef]
  7. Liu, S.; Rasinski, M.; Rahim, Y.; Zhang, S.; Wippermann, K.; Reimer, U.; Lehnert, W. Influence of operating conditions on the degradation mechanism in high-temperature polymer electrolyte fuel cells. J. Power Sources 2019, 439, 227090. [Google Scholar] [CrossRef]
  8. Pei, P.; Wu, Z.; Li, Y.; Jia, X.; Chen, D.; Huang, S. Improved methods to measure hydrogen crossover current in proton exchange membrane fuel cell. Appl. Energy 2018, 215, 338–347. [Google Scholar] [CrossRef]
  9. Zheng, W.; Xu, L.; Hu, Z.; Zhao, Y.; Li, J.; Ouyang, M. Dynamic modeling of chemical membrane degradation in polymer electrolyte membrane fuel cells: Effect of precipitated Pt particles. Int. J. Hydrogen Energy 2024, 56, 1111–1119. [Google Scholar] [CrossRef]
  10. Zheng, W.; Xu, L.; Hu, Z.; Zhao, Y.; Li, J.; Ouyang, M. Dynamic modeling of Pt degradation and mitigation strategies in polymer electrolyte membrane fuel cells. Int. J. Hydrogen Energy 2022, 12, 100171. [Google Scholar] [CrossRef]
  11. Wang, M.; Park, J.H.; Kabir, S.; Neyerlin, K.C.; Kariuki, N.N.; Lv, H.; Stamenkovic, V.R.; Myers, D.J.; Ulsh, M.; Mauger, S.A. Impact of Catalyst Ink Dispersing Methodology on Fuel Cell Performance Using in-Situ X-ray Scattering. ACS Appl. Energy Mater. 2019, 2, 6417–6427. [Google Scholar] [CrossRef]
  12. Yang, B.; Xiang, Z. Affiliation Nanostructure Engineering of Cathode Layers in Proton Exchange Membrane Fuel Cells: From Catalysts to Membrane Electrode Assembly. ACS Nano 2020, 5, 100075. [Google Scholar] [CrossRef]
  13. Wan, Z.; Liu, S.; Zhong, Q.; Jin, A.; Pan, M. Mechanism of improving oxygen transport resistance of polytetrafluoroethylene in catalyst layer for polymer electrolyte fuel cells. Int. J. Hydrogen Energy 2018, 43, 7456–7464. [Google Scholar] [CrossRef]
  14. Fan, L.; Zhao, J.; Luo, X.; Tu, Z. Comparison of the performance and degradation mechanism of PEMFC with Pt/C and Pt black catalyst. Int. J. Hydrogen Energy 2022, 47, 5418–5428. [Google Scholar] [CrossRef]
  15. Chen, Z.; Zuo, W.; Zhou, K.; Li, Q.; Huang, Y.; Jiaqiang, E. Multi-factor impact mechanism on the performance of high temperature proton exchange membrane fuel cell. Energy 2023, 278, 127982. [Google Scholar] [CrossRef]
  16. Yang, Y.; Zhou, X.; Tang, F.; Li, B.; Ming, P.; Zhang, C. Failure behavior of gas diffusion layer in proton exchange membrane fuel cells. J. Power Sources 2021, 515, 230655. [Google Scholar] [CrossRef]
  17. Colombo, E.; Baricci, A.; Mora, D.; Guetaz, L.; Casalegno, A. An innovative accelerated stress test representative of automotive PEMFC degradation mechanisms validated on 1000 hours real-world operation. J. Power Sources 2023, 580, 233376. [Google Scholar] [CrossRef]
  18. Choi, D. Three-Dimensional Modeling and Numerical Analysis for PEM Fuel Cells. ACS Sustain. Chem. Eng. 2023, 11, 063. [Google Scholar] [CrossRef]
  19. Liu, Z.; Xu, S.; Guo, S. High-Potential Control for Durability Improvement of the Vehicle Fuel Cell System Based on Oxygen Partial Pressure Regulation under Low-Load Conditions. Int. J. Hydrogen Energy 2022, 47, 32607–32627. [Google Scholar] [CrossRef]
  20. Eskin, M.G.; Yeşilyurt, S. Anode Bleeding Experiments to Improve the Performance and Durability of Proton Exchange Membrane Fuel Cells. Int. J. Hydrogen Energy 2019, 44, 11047–11056. [Google Scholar] [CrossRef]
  21. Li, Y.; Pei PMa, Z.; Ren, P.; Huang, H. Analysis of Air Compression, Progress of Compressor and Control for Optimal Energy Efficiency in Proton Exchange Membrane Fuel Cell. Renew. Sustain. Energy Rev. 2020, 133, 110304. [Google Scholar] [CrossRef]
  22. Lapicque, F.; Belhadj, M.; Bonnet, C.; Pauchet, J.; Thomas, Y. A Critical Review on Gas Diffusion Micro and Macroporous Layers Degradations for Improved Membrane Fuel Cell Durability. J. Power Sources 2016, 336, 40–53. [Google Scholar] [CrossRef]
  23. Sun, X.; Xu, H.; Zhu, Q.; Lu, L.; Zhao, H. Synthesis of Nafion®-Stabilized Pt Nanoparticles to Improve the Durability of Proton Exchange Membrane Fuel Cell. J. Energy Chem. 2015, 24, 359–365. [Google Scholar] [CrossRef]
  24. Wang, M.; Rome, G.; Medina, S.; Pfeilsticker, J.R.; Kang, Z.; Pylypenko, S.; Ulsh, M.; Bender, G. Impact of electrode thick spot irregularities on polymer electrolyte membrane fuel cell initial performance. J. Power Sources 2020, 466, 228344. [Google Scholar] [CrossRef]
  25. Xiao, Y.; Li, X.; Wang, Q.; Yang, Y.; Li, B.; Ming, P.; Zhang, C.; Dai, H. A Super Uniform Hydrophobic Gas Diffusion Layer for a Proton Exchange Membrane Fuel Cell. ACS Appl. Mater. 2023, 15, 38090–38099. [Google Scholar] [CrossRef]
  26. Xu, K.; Di, Q.; Sun, F.; Chen, M.; Wang, H. Degradation mechanism analysis of substrate and microporous layer of gas diffusion layer in proton exchange membrane fuel cell. Fuel 2024, 358, 130198. [Google Scholar] [CrossRef]
  27. Zhang, X.; Li, S.; Huang, P.; Meng, C.; Tian, J. Comparative study on carbon corrosion characteristics of gas diffusion layer in PEMFCs under two accelerated stress tests. Int. J. Electrochem. Sci. 2024, 19, 100581. [Google Scholar] [CrossRef]
  28. Sim, J.; Chun, H.; Chang, J.; Kim, J.; Kim, B.; Kim, Y.; Kang, S.; Min, K. Impacts of characteristics of carbon black comprising microporous layer on performance and durability of gas diffusion layer under newly developed accelerated stress tests. J. Power Sources 2024, 594, 233989. [Google Scholar] [CrossRef]
  29. Sim, J.; Kang, M.; Oh, H.; Lee, E.; Min, K. The effect of gas diffusion layer on electrochemical effective reaction area of catalyst layer and water discharge capability. Renew. Energy 2022, 197, 932–942. [Google Scholar] [CrossRef]
  30. Sim, J.; Kang, M.; Min, K.; Lee, E.; Young, J. Effects of microporous layer penetration ratio and substrate carbonization temperature on the performance of proton exchange membrane fuel cells. J. Mech. Sci. Technol. 2022, 36, 4825–4838. [Google Scholar] [CrossRef]
  31. Meyer, Q.; Pivac, I.; Barbir, F.; Zhao, C. Detection of oxygen starvation during carbon corrosion in proton exchange membrane fuel cells using low-frequency electrochemical impedance spectroscopy. J. Power Sources 2020, 470, 228285. [Google Scholar] [CrossRef]
  32. Yao, Z.; Zhou, F.; Tu, C.; Tan, J.; Pan, M. Decay behaviour of ultrathin reinforced membranes in PEMFCs subjected to the combination of mechanical/chemical accelerated stress testing. Int. J. Hydrogen Energy 2024, 50, 200–208. [Google Scholar] [CrossRef]
  33. Zheng, W.; Xu, L.; Hu, Z.; Ding, Y.; Li, J.; Ouyang, M. Dynamic modeling of chemical membrane degradation in polymer electrolyte fuel cells: Effect of pinhole formation. J. Power Sources 2021, 487, 229367. [Google Scholar] [CrossRef]
  34. Ham, K.; Chung, S.; Lee, J. A Comprehensive Review of PEMFC Durability Test Protocol of Pt Catalyst and MEA. Appl. Chem. Eng. 2019, 30, 659–666. [Google Scholar] [CrossRef]
  35. Prithi, J.; Vedarajan, R.; Rao, G.R.; Rajalakshmi, N. Functionalization of carbons for Pt electrocatalyst in PEMFC. Int. J. Hydrogen Energy 2021, 2, 186. [Google Scholar] [CrossRef]
  36. Liu, H.; Wang, X.; Lao, K.; Wen, L.; Huang, M.; Liu, J.; Hu, T.; Hu, B.; Xie, S.; Li, S.; et al. Optimizing Ionomer Distribution in Anode Catalyst Layer for Stable Proton Exchange Membrane Water Electrolysis. Adv. Mater. 2024, 36, 2402780. [Google Scholar] [CrossRef]
  37. Wang, M.; Medina, S.; Ochoa-Lozano, J.; Mauger, S.; Pylypenko, S.; Ulsh, M.; Bender, G. Visualization, understanding, and mitigation of process-induced-membrane irregularities in gas diffusion electrode-based polymer electrolyte membrane fuel cells. Int. J. Hydrogen Energy 2021, 46, 14699–14712. [Google Scholar] [CrossRef]
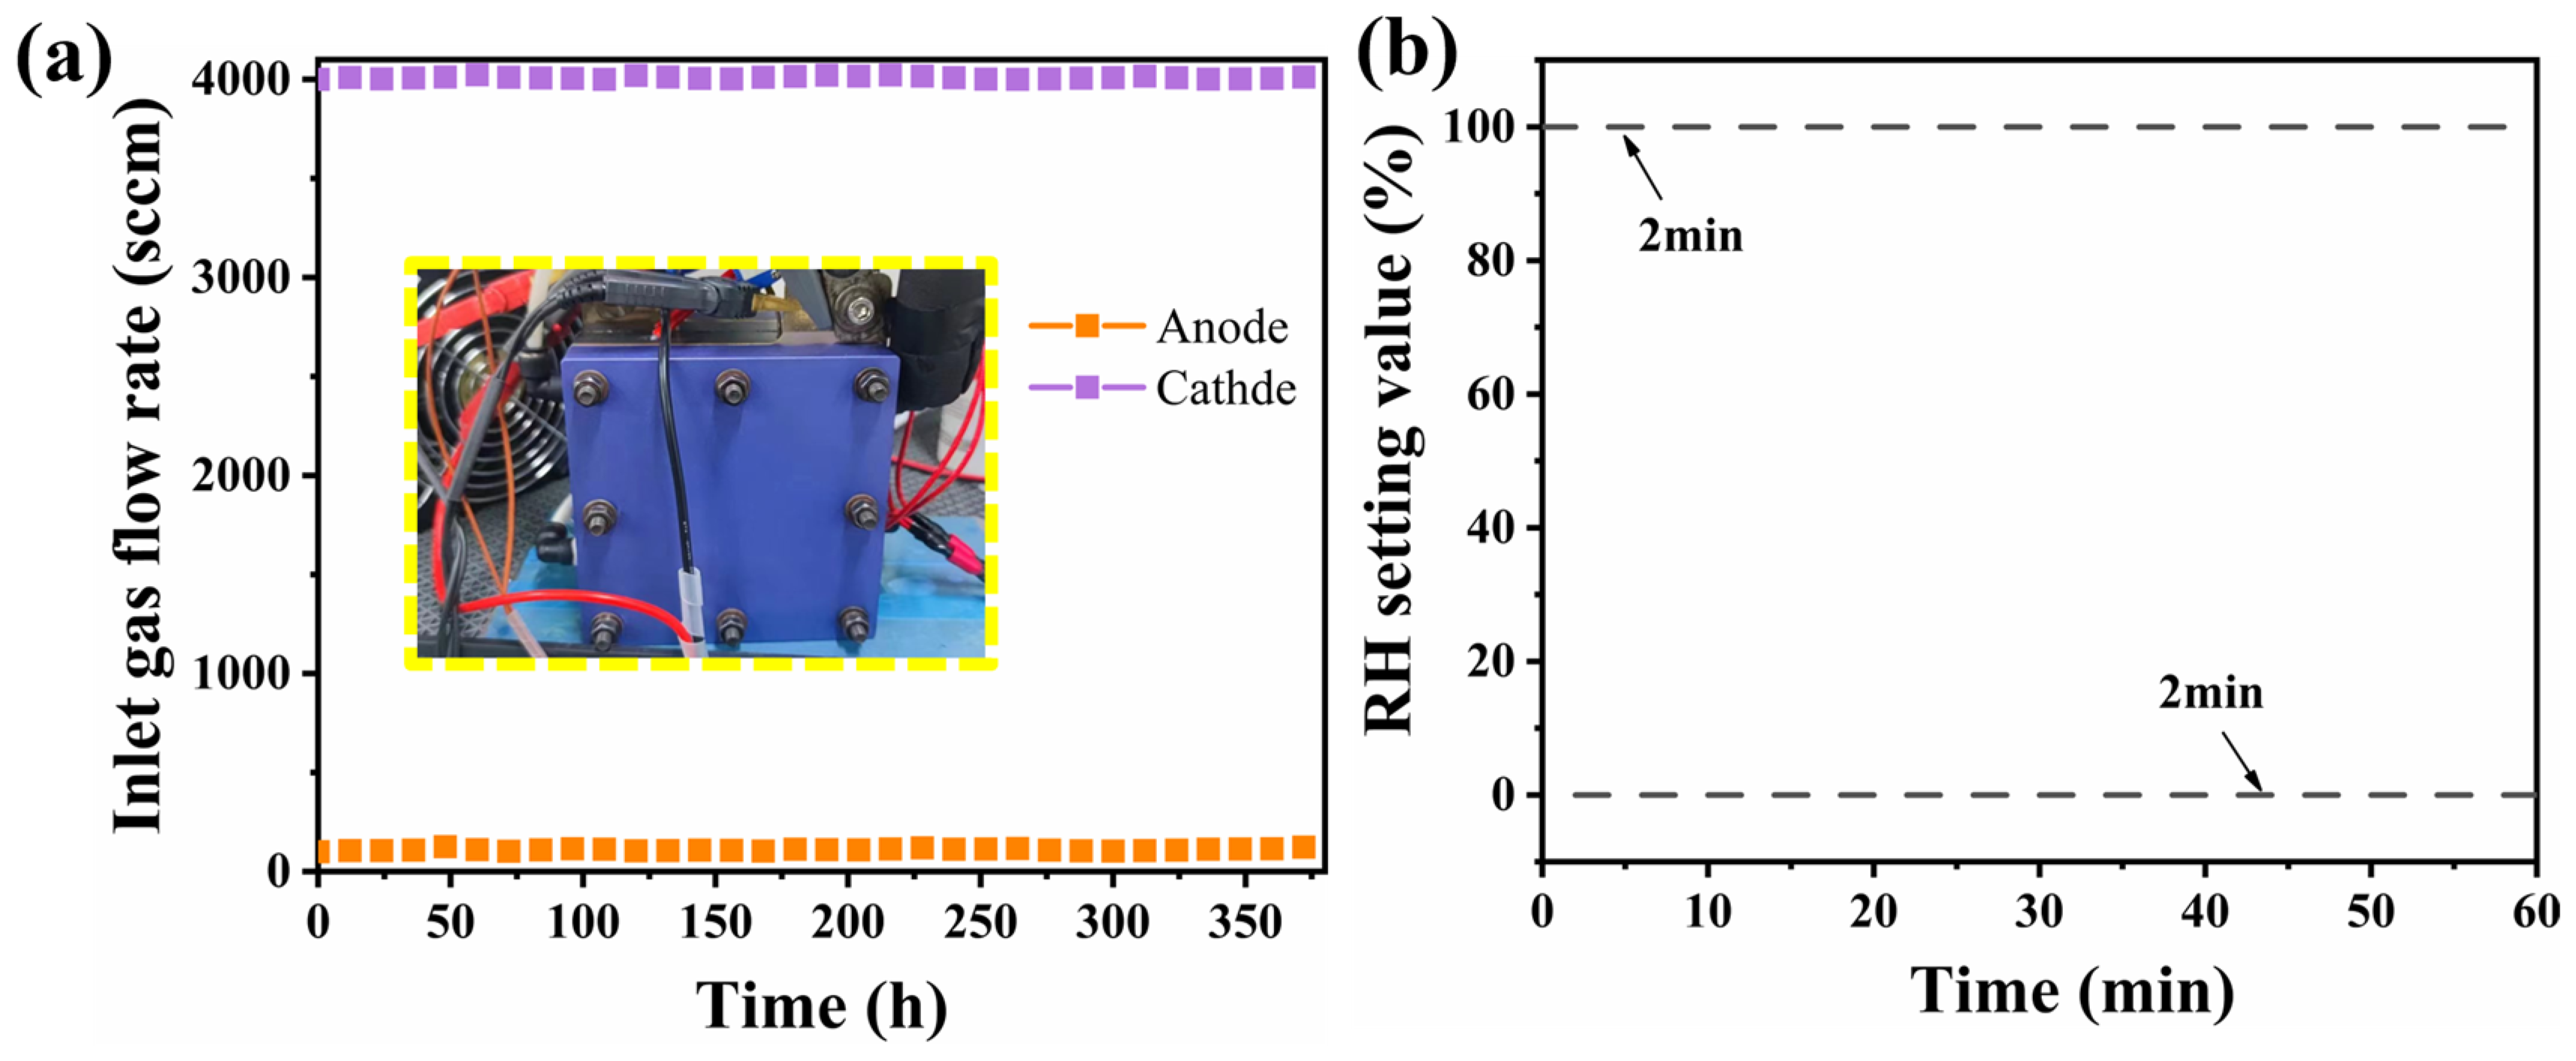
Figure 1. (a) Inlet gas flow rate of a single cell under OCV-based ADT condition (the inset was the image of the tested fuel cell); (b) humidity setting point for the RH cycling-based ADT condition.
Processes 12 01983 g001
Figure 2. Fuel cell performance over time during the OCV-based ADT condition: (a) polarization curves; (b) H2 crossover LSVs; (c) correlation between H2 crossover limiting current density and OCV; (d) variation of FRR during OCV-based ADT.
Processes 12 01983 g002
Figure 3. (a) Polarization curves of the PEMFC during RH cycling-based ADT; (b) H2 crossover LSVs during RH cycling-based ADT; (c) H2 crossover limiting current density during RH cycling-based ADT; (d) variation of FRR during RH cycling-based ADT.
Processes 12 01983 g003
Figure 4. The TEM images of cathode catalyst at the (a) BOT, (b) EOTOCV and (c) EOTRH; (d) CV curves of MEA before and after ADT; (e) ECSA of the MEA before and after ADT, calculated from CVs.
Processes 12 01983 g004
Figure 5. Cross-sectional SEM images of the MEA at the (a) BOT, (b) EOTOCV and (c) EOTRH; The contact angle of the cathode GDL at the (d) BOT, (e) EOTOCV and (f) EOTRH.
Processes 12 01983 g005
Disclaimer/Publisher’s Note: The statements, opinions and data contained in all publications are solely those of the individual author(s) and contributor(s) and not of MDPI and/or the editor(s). MDPI and/or the editor(s) disclaim responsibility for any injury to people or property resulting from any ideas, methods, instructions or products referred to in the content.