Article

Micro–Nano 3D CT Scanning to Assess the Impact of Microparameters of Volcanic Reservoirs on Gas Migration

College of Earth Sciences, Jilin University, Changchun 130061, China
*
Author to whom correspondence should be addressed.
Processes 2024, 12(9), 2000; https://doi.org/10.3390/pr12092000
Submission received: 3 August 2024 / Revised: 9 September 2024 / Accepted: 13 September 2024 / Published: 17 September 2024

Abstract

:
Volcanic rock reservoirs for oil and gas are known worldwide for their considerable heterogeneity. Micropores and fractures play vital roles in the storage and transportation of natural gas. Samples from volcanic reservoirs in Songliao Basin, CS1 and W21, belonging to the Changling fault depression and the Wangfu fault depression, respectively, have similar lithology. This study employs micro–nano CT scanning technology to systematically identify the key parameters and transport capacities of natural gas within volcanic reservoirs. Using Avizo 2020.1software, a 3D digital representation of rock core was reconstructed to model pore distribution, connectivity, pore–throat networks, and fractures. These models are then analyzed to evaluate pore/throat structures and fractures alongside microscopic parameters. The relationship between micropore–throat structure parameters and permeability was investigated by microscale gas flow simulations and Pearson correlation analyses. The results showed that the CS1 sample significantly exceeded the W21 sample in terms of pore connectivity and permeability, with connected pore volume, throat count, and specific surface area being more than double that of the W21 sample. Pore–throat parameters are decisive for natural gas storage and transport. Additionally, based on seepage simulation and the pore–throat model, the specific influence of pore–throat structure parameters on permeability in volcanic reservoirs was quantified. In areas with well–developed fractures, gas seepage pathways mainly follow fractures, significantly improving gas flow efficiency. In areas with fewer fractures, throat radius has the most significant impact on permeability, followed by pore radius and throat length.

1. Introduction

With the rapid development of hydrocarbon exploration on a global scale, volcanic eruptions have emerged as a significant category of unconventional oil and gas reservoirs with substantial potential for development [1,2,3,4,5]. The first volcanic hydrocarbon reservoir in the world was discovered in the San Joaquin Basin in California, USA, in 1887 [2]. Subsequently, in the 1920s, several Cretaceous and Palaeogene volcanic oil–gas reservoirs were discovered in Texas, United States, and Cerro Aquitlan, Argentina [6,7,8,9,10]. Since the mid–20th century, large–scale volcanic oil and gas reservoirs have been discovered in countries in the Pacific Rim region, including China, Japan, the United States, and Argentina [11,12,13,14]. Since 2002, researchers have studied the comprehensive explorations and deployment of volcanic hydrocarbons in eastern and western Chinese basins, including the Songliao Basin [15,16], Hailar Basin [17], Erlian Basin [18,19], Junggar Basin [20], and Santang Basin [21,22,23]. Volcanic hydrocarbon reservoirs have been discovered in 14 petroleum–bearing basins, including the Lake Basin [24]. As of 2019, the volcanic hydrocarbon reservoirs in China have been proven to have oil reserves of 600 million cubic meters and volcanic natural gas reserves of 580 billion cubic meters [25]. Volcanic oil and gas reservoirs have been discovered in over 300 basins across more than 50 countries [26]. More than 40 basins in more than 13 countries have large–scale reserves and industrial flows of hydrocarbons [27], and volcanic reservoirs are increasingly emerging as a prominent focus in the global exploration and development of hydrocarbons [28,29,30].
Volcanic reservoirs are comprehensively influenced by multiple geological processes, such as volcanic lithology, eruption patterns, hydrothermal activities, and weathering/leaching during diagenesis, resulting in strong heterogeneity in pore distribution, fracture morphology, and development patterns within the reservoir [4,31,32,33]. As such, there is an urgent need for extensive and detailed research on the pore/fracture structure of volcanic reservoirs at the micro–nano scale. Numerous irregular micropores and fractures are required for the formation of high–quality reservoirs [34,35]. The pore connectivity significantly influences the adsorption, desorption, diffusion, and seepage of natural gas molecules [36,37,38]. Fractures serve as effective storage spaces and vital channels for pore communication and exert strong control over reservoir storage and transportation [39,40]. Therefore, multiscale quantitative characterization of micropores/fractures within volcanic reservoirs, along with the identification of the development characteristics and seepage paths of the pore/fracture system within the core, are crucial for exploring the migration patterns of natural gas.
In recent years, the use of computed tomography (CT) in reservoir studies has yielded significant results and has shown its importance in the study of volcanic rock reservoirs [41,42,43]. CT scanning technology has been used to analyze changes in the porosity and fracture morphology of tight sandstone reservoirs affected by stress sensitivity [44,45]. The variability in the mineral content and longitudinal distribution within mud shale reservoirs has been investigated using CT scanning and SEM to elucidate the developmental characteristics of mud shale oil and gas reservoirs [46,47]. Moreover, the combined use of the mercury intrusion method, low–temperature N2 adsorption, and CT imaging enabled precise quantitative analysis and image–based identification of multilevel pore clusters within coal. [48,49]. In volcanic reservoir research, the use of CT scanning technology is expanding. Studies on the variations in the permeability and porosity of volcaniclastic rocks under conditions of confining pressure [50], diagenetic order of volcanic reservoir layers [51,52], potential for becoming favorable reservoirs within specific depth ranges [53], and the impact of weathering, leaching, and tectonic movements on reservoir properties [54,55] have also been conducted. These studies primarily concentrated on macroscopic qualitative aspects, such as petrophysical characteristics, diagenetic evolution, distribution patterns, and controlling factors. Despite advancements in reservoir characterization techniques, there remains a significant lack of in–depth, quantitative research on the microscopic development of micro–nano–scale pores and fractures in volcanic reservoirs, as well as how these pore–throat parameters impact gas transport.
The fluid clastic–crystalline ignimbrite samples from the CS1 well from the Changling fault depression and dacitic crystalline clastic tuff samples of well W21 from the Wangfu fault depression were selected as the control group. The two samples had similar lithology, and CT scanning technology in combination with Avizo software was used to reconstruct a 3D digital core at the micro–nano scale. Based on the 3D digital core, a total pore distribution model, connected pore segmentation model, pore–throat network model, and fracture body model were constructed to quantitatively depict the micropore/throat system inside the volcano and obtain a series of microscopic pore–throat parameters to reveal the distribution state and pattern of fractures in three–dimensional space. Micrometer–level full–pore–throat seepage simulations were employed to obtain information about the permeability and micro–seepage paths of natural gas within the volcanic reservoir. Additionally, the effects of various pore–throat parameters impacting permeability were quantitatively evaluated.

2. Geological Setting

The Songliao Basin extends through the provinces of Heilongjiang, Jilin, and Liaoning from north to south, spanning a length of 750 km and a width of 330–370 km, with an area of approximately 255,000 km2 (Figure 1a). The Songliao Basin has undergone three evolutionary stages, i.e., faulting, depression, and structural inversion [56]. It is a large continental hydrocarbon–bearing sedimentary basin in Northeast China, covering an area of 26 × 104 km2 [57]. According to the current structural framework (Figure 1b), the Songliao Basin is divided into six secondary structural units, i.e., central, southeast, southwest, northeast, northern, and western zones [58]. The basin includes the Lower Cretaceous Huoshiling Formation (K1h), Shahezi Formation (K1sh), Yingcheng Formation (K1yc), Dengluokuku Formation (K1d), and Quantou Formation (K1q), the Upper Cretaceous Qingshankou Formation (K2qn), Yaojia Formation (K2y), Nenjiang Formation (K2n), Sifangtai Formation (K2s), and Mingshui Formation (K2m), the Paleogene Yi’an Formation (Ny), Neogene Daan Formation (Nd), and Taikang Formation (Nt), and the Quaternary Plain (Q) group (Figure 2), with each layer being further subdividable into distinct sublayers. Cretaceous strata harbor numerous significant source and reservoir rocks, which can form different hydrocarbon assemblages in the vertical direction [59].
The southern Songliao Basin constitutes a rift basin group composed of 16 rift basins with a total area of approximately 5.36 × 10⁴ km2 [60]. It has undergone multiple large–scale movements characterized by strong tectonic action, dense faults, and numerous volcanic reservoirs. It boasts natural gas reserves of hundreds of billions of cubic [61,62] meters. The Changling fault depression, situated in the central depression of the Songliao Basin (Figure 1c), is a multi–structural system, multi–cycle evolution, and “volcanic–sedimentary” dual–fill fault basin [63]; it is also the largest and richest hydrocarbon resource in the southern part of the Songliao Basin [64]. The source rocks of the Yingcheng and Shahezi formations are the main sources of deep hydrocarbons in the Changling fault depression. The Wangfu fault depression, positioned in the northwestern part of the southeastern uplift area of the Songliao Basin, is a major deep natural gas exploration area. Source rock within the deep Yingcheng Formation has been identified as one of the main sources of hydrocarbons [65].
Figure 1. Schematic diagram of fault depression: (a) is the location of Songliao Basin in China; (b) is the main structural units in the Songliao Basin; (c) shows locations of the sampled wells in the Changling and Wangfu fault depressions. Modified after [66].
Processes 12 02000 g001
Figure 2. Stratigraphic column of the Songliao Basin, highlighting major source rocks and reservoirs. Modified after [67].
Processes 12 02000 g002

3. Material and Methods

3.1. Samples

The core from the CS1 well (Table 1) was identified as rhyolite–type crystal tuff (Figure 3a,b) with a tuff structure primarily composed of crystal debris, rock debris, and volcanic ash. Among these components, rock and crystal debris constituted approximately 80%, whereas volcanic ash accounted for approximately 20%. The crystal debris primarily consists of quartz and feldspar. Quartz crystal debris has a particle size ranging from 0.25 to 2.0 mm, is heterogeneous, and has a first–order yellow–and–white interference color. The alkaline feldspar is mostly subangular, the particle size is approximately 1 mm, and a few particles are kaolinized. Plagioclase, which is predominantly subangular, has grain sizes reaching up to 3 mm and exhibits sericitization in a few instances, alongside the development of ring bands and polymer twins. The rock debris mainly consisted of rhyolite with a particle sized approximately 1.0–2.5 mm, and the cementitious material was molten tuff. The fine quartz and volcanic ash were arranged in a streamlined shape, forming a pseudo–rhyolite structure.
The core from well W21 (Table 1) was crystalline tuff (Figure 3c,d), featuring a tuff structure primarily composed of crystal debris and volcanic ash. The debris content was approximately 30% and was mainly composed of plagioclase and quartz. Plagioclase is mostly angular, with the development of polymer twins, often melted or fragmented, with a particle size of approximately 0.25–2.5 mm, visible dissolution pores in the particle, and some particle sericite alteration. The quartz is granular, with grain sizes ranging from 0.25 to 2.5 mm. Volcanic ash cemented all types of crystalline debris, and its content was 70%.

3.2. Experimental Equipment

CT scanning is based on the fact that rock specimens with different densities of mineral composition have different internal structures, thus different absorption coefficients of X–rays when the intensity of the X–rays is attenuated. The information about the density of the internal structure of the rock to be scanned is picked up by the imaging system and converted into a digital image, and finally a CT image of the measured object is displayed [68]. CT scanning experiments were performed using the VG Studio max 3.3 software with an industrial CT scanning device, a phoenix v|tome|xm scanner, to process the raw data and export the CT scan slice images. The size of the micro–CT equipment was 2460 × 1250 × 1950 mm. Within the voltage range of 160 to 240 kV, sample sizes of up to 450 × 350 mm can be scanned, and spatial resolutions of up to 500 nm can be achieved. The detector used for image acquisition was a flat panel detector with an imaging area of 244 mm × 195 mm and a pixel size of 1920 × 1536. For micro–CT scanning, a cylindrical sample with a diameter of 2.5 cm was used and the scanning accuracy was 12 μm. For nano–CT scanning, a cylindrical sample with a diameter of 1 mm is used with a scanning accuracy of 500 nm. Finally, Sanying Testing (Tianjin, China) Company conducted a sample CT scanning experiment.

3.3. CT Image Processing and 3D Reconstruction of Models

The digital core contains all three–dimensional information of the physical core sample. Leveraging Avizo’s robust data processing capabilities, a 3D digital core was constructed by stacking 2D grayscale images obtained through CT scanning. Prior to this, pre–processing, filtering, and segmentation steps were necessary.
Noise in the original grayscale image was removed by filtering. All scanned slices were imported into Avizo image processing software, where the median filter algorithm was employed to denoise the fuzzy regions, thereby enhancing the image resolution. Following noise reduction, the image revealed a matrix, mineral particles (rock skeleton), and micro–nano scale pores. Avizo image segmentation technology in combination with the top cap method was used to fully segment the pores within the grayscale image and encircle the rock skeleton, thereby capturing all pores present in the slice images. Following processing, all 2D grayscale slices were integrated into a 3D micro–nano scale digital core model [69] (Figure 4). This process enabled the precise extraction of total pores within the volcanic reservoir core samples, serving as the foundational data model for the subsequent development of the total pore distribution model, connected pore segmentation model, pore–throat network model, fracture model, and natural gas seepage simulation.
The total number of pores included both connected and isolated pores. A total pore distribution model was established to directly determine the proportion of connected pores in the volcanic reservoir core samples. The “Axis Connectivity” module in Avizo screens out connected pores from the total, identifying the remaining as isolated pores. Isolated pores were used as a reference to determine the distribution of all connected pores in the entire core pore space.
To further ascertain the spatial distribution pattern and connectivity of the connected pores, it is essential to establish a connected pore segmentation model. Multiple clusters of connected pores were obtained using the Watershed Algorithm to segment the selected connected pores, and the correlation states among the connected pores in the volcanic reservoir core samples were simulated.
Some connected pores were interconnected via throats, making the identification of individual pores challenging [70]. Establishing a pore–throat network model is essential for simplifying complex pore structures. The maximum sphere method was employed to delineate segmented connected pores [71]. Taking any pixel points A1 and B1 in the pore space as the center of the circle, the circle is continuously expanded to the surroundings until it is tangential to the adjacent rock skeleton boundary, and the maximum inner cutting ball is obtained. All the pixels within the pore space, except for A1 and B1, were processed using this method to obtain the corresponding maximum inscribed spheres. Spheres completely enclosed within other spheres during expansion were deemed redundant and removed; the remaining spheres formed the largest set, accurately characterizing the pore space. A clustering algorithm transforms the set of largest spheres into interconnected clusters (Figure 5a). Within each cluster, spheres with the largest radii represented pores [72], whereas a series of spheres (A2–B2) connecting these largest spheres represented throats, which constructed a pore–throat network model reflecting the connection characteristics of the actual rock core (Figure 5b).
Figure 5. Schematic diagram of the pore–throat–pore structure. (a) is a schematic diagram of the pores and throats of a clustered maximal sphere, blue is the rock skeleton, and pink represents the pore space, modified after [73]; (b) is a schematic diagram of the pore–throat–pore structure captured in the pore–throat network model, with the pore in red and the throat in yellow.
Processes 12 02000 g005
Fracture modelling is necessary to investigate the spatial extension of fractures within volcanic reservoir core samples. Fractures in the connecting pores were extracted based on the Ferret aspect ratio (the ratio of the longest diameter to the shortest diameter of a single pore). Using Avizo’s “Auto Skeleton” module, the distribution of interconnected pores within the fractures is visualized, allowing for a detailed examination of the spreading characteristics of these fractures.
Finally, Avizo’s Absolute Permeability Experiment Simulation module was applied to simulate the permeability of the extracted pores. Based on Darcy’s law, the permeability was calculated. By analyzing the fluid flow path, the influence of pore structure and fractures on natural gas migration was revealed, and the reservoir permeability characteristics were comprehensively evaluated.

4. Results and Analysis

4.1. 3D Total Pores Distribution Model

In the total pore distribution model, the blue areas represent isolated pores and the red areas represent connected pores. Quantitative micro–CT scanning revealed that the total pore volume of the CS1 sample is 165.65 μm3, with the connected pore volume at 112.02 μm3 (constituting 67.6%) (Figure 6a). For the W21 sample, the total pore volume was recorded at 76.55 μm3, with the connected pore volume at 52.43 μm3, and the volume proportion of connected pores was 68.5% (Figure 6b). Nano–CT scanning demonstrated that the total and connected pore volumes for the CS1 sample were 0.0134 μm3 and 0.0096 μm3, respectively, with the volume proportion of connected pores at 71.6% (Figure 6c). For W21 sample, a total pore volume was 0.01272 μm3 and connected pore volume was 0.0070 μm3 (constituting 55.0%) (Figure 6d). At the micro–nano scale, the connected pore volume of the CS1 sample exceeded that of the W21 sample by 2.1 times and 1.3 times, respectively, signifying the superior gas storage capacity and enhanced pore connectivity of CS1 sample, facilitating more efficient natural gas transport within the reservoir.

4.2. 3D Connected Pore Segmentation Model

Following additional statistical analysis and screening, the counts of connected pores for the CS1 and W21 samples at the micron scale were 546 and 417, respectively, with maximum connected pore volumes being 2.64 μm3 and 1.39 μm3, and the maximum connected pore surface areas being 169.30 μm2 and 143.71 μm2 (Figure 7a,b). At the nanoscale, the CS1 and W21 samples exhibited connected pore counts of 125 and 100, respectively, with the maximum connected pore volumes being 0.0021 μm3 and 0.0006 μm3, and the maximum connected pore surface areas totalling 3.31692 μm2 and 1.08395 μm2 (Figure 7c,d). Quantitative analysis indicated that the CS1 sample offers more advantageous conditions for natural gas migration and superior migration performance at the micro–nano scale.

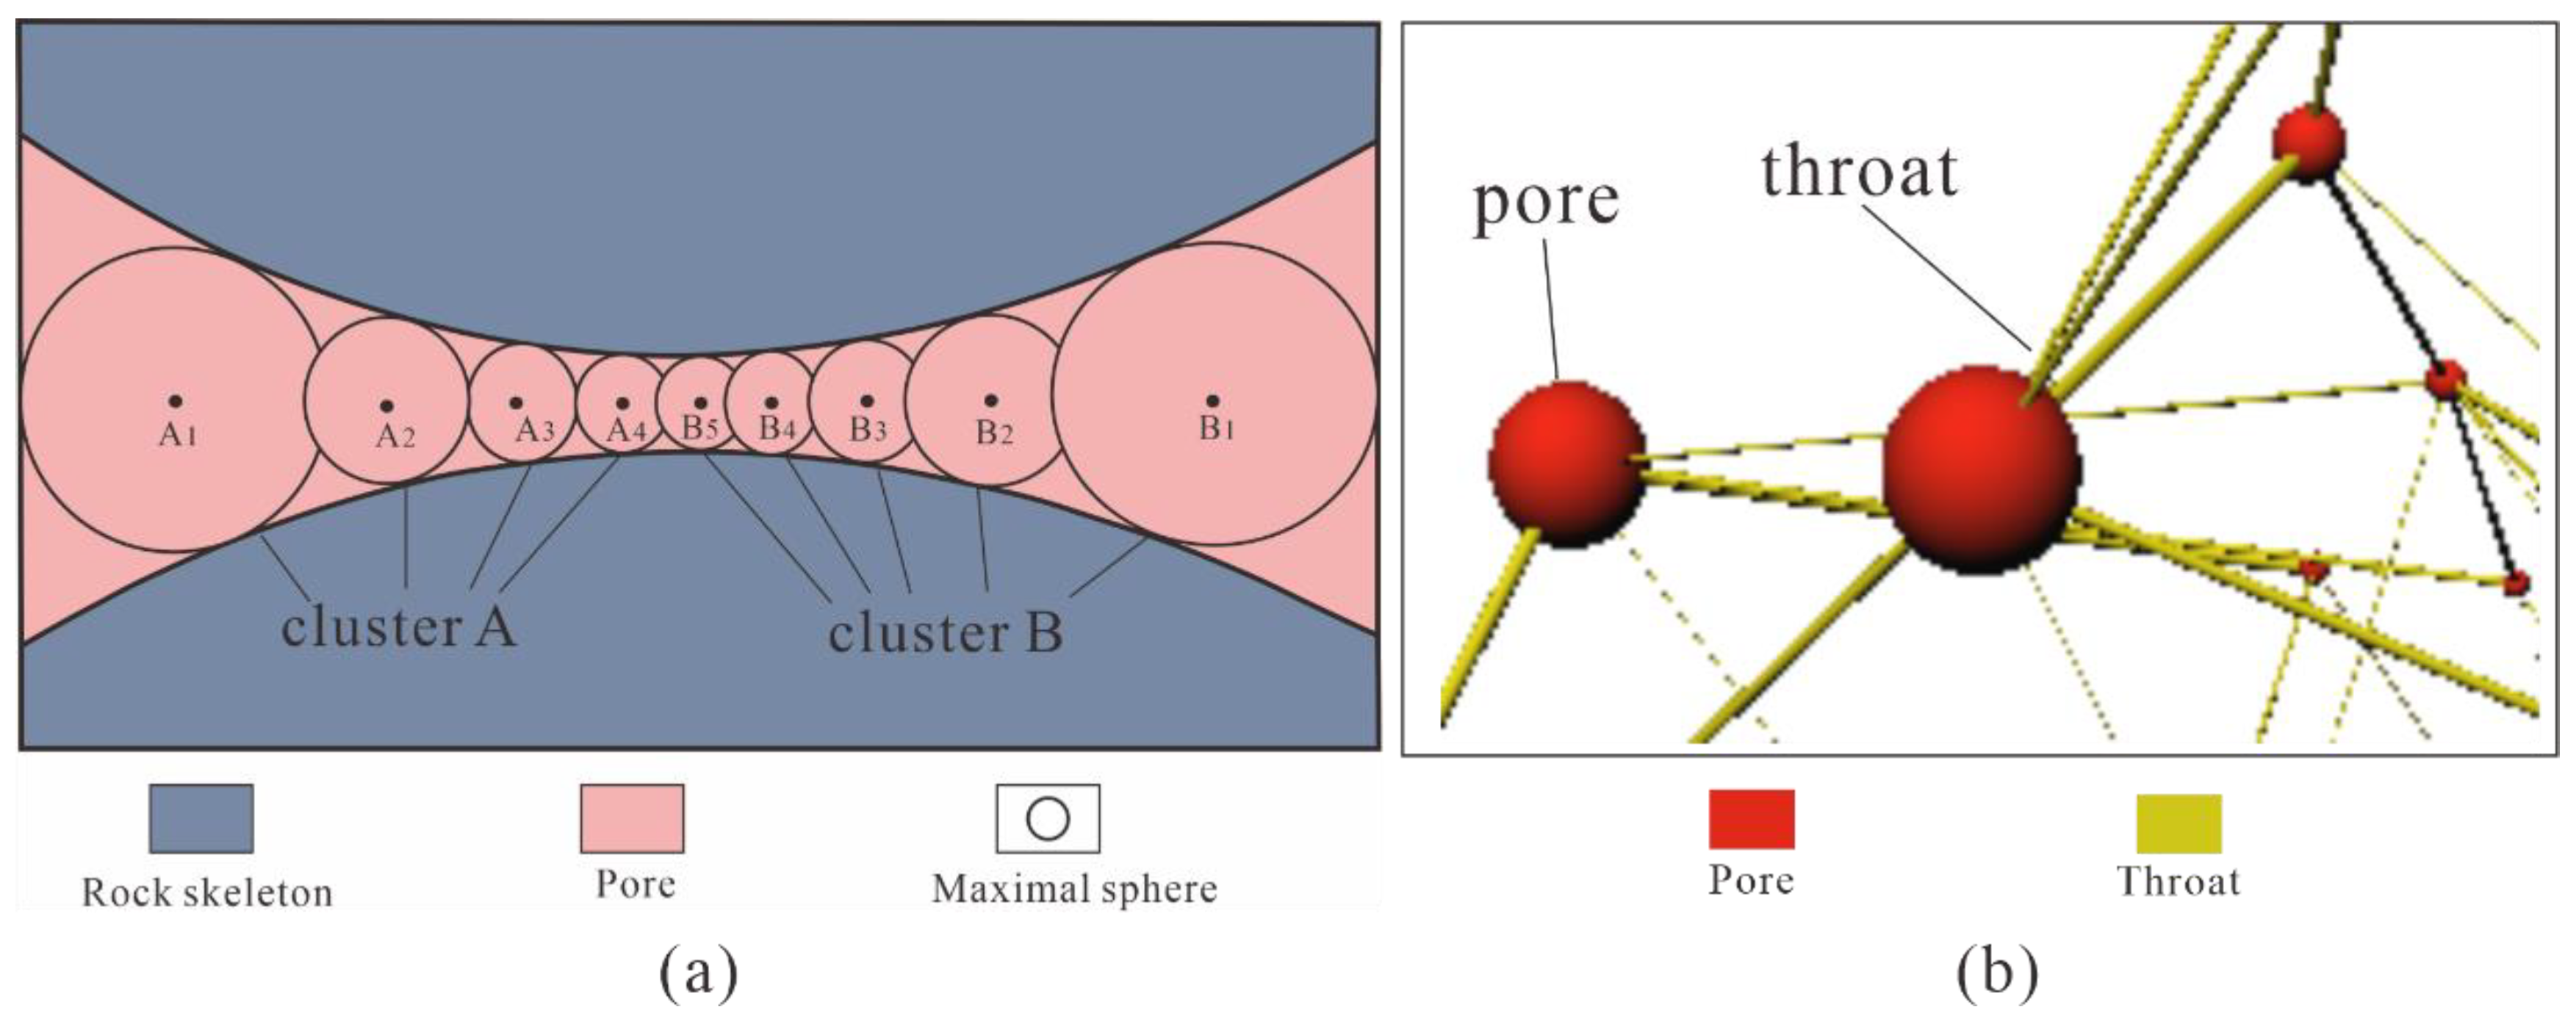
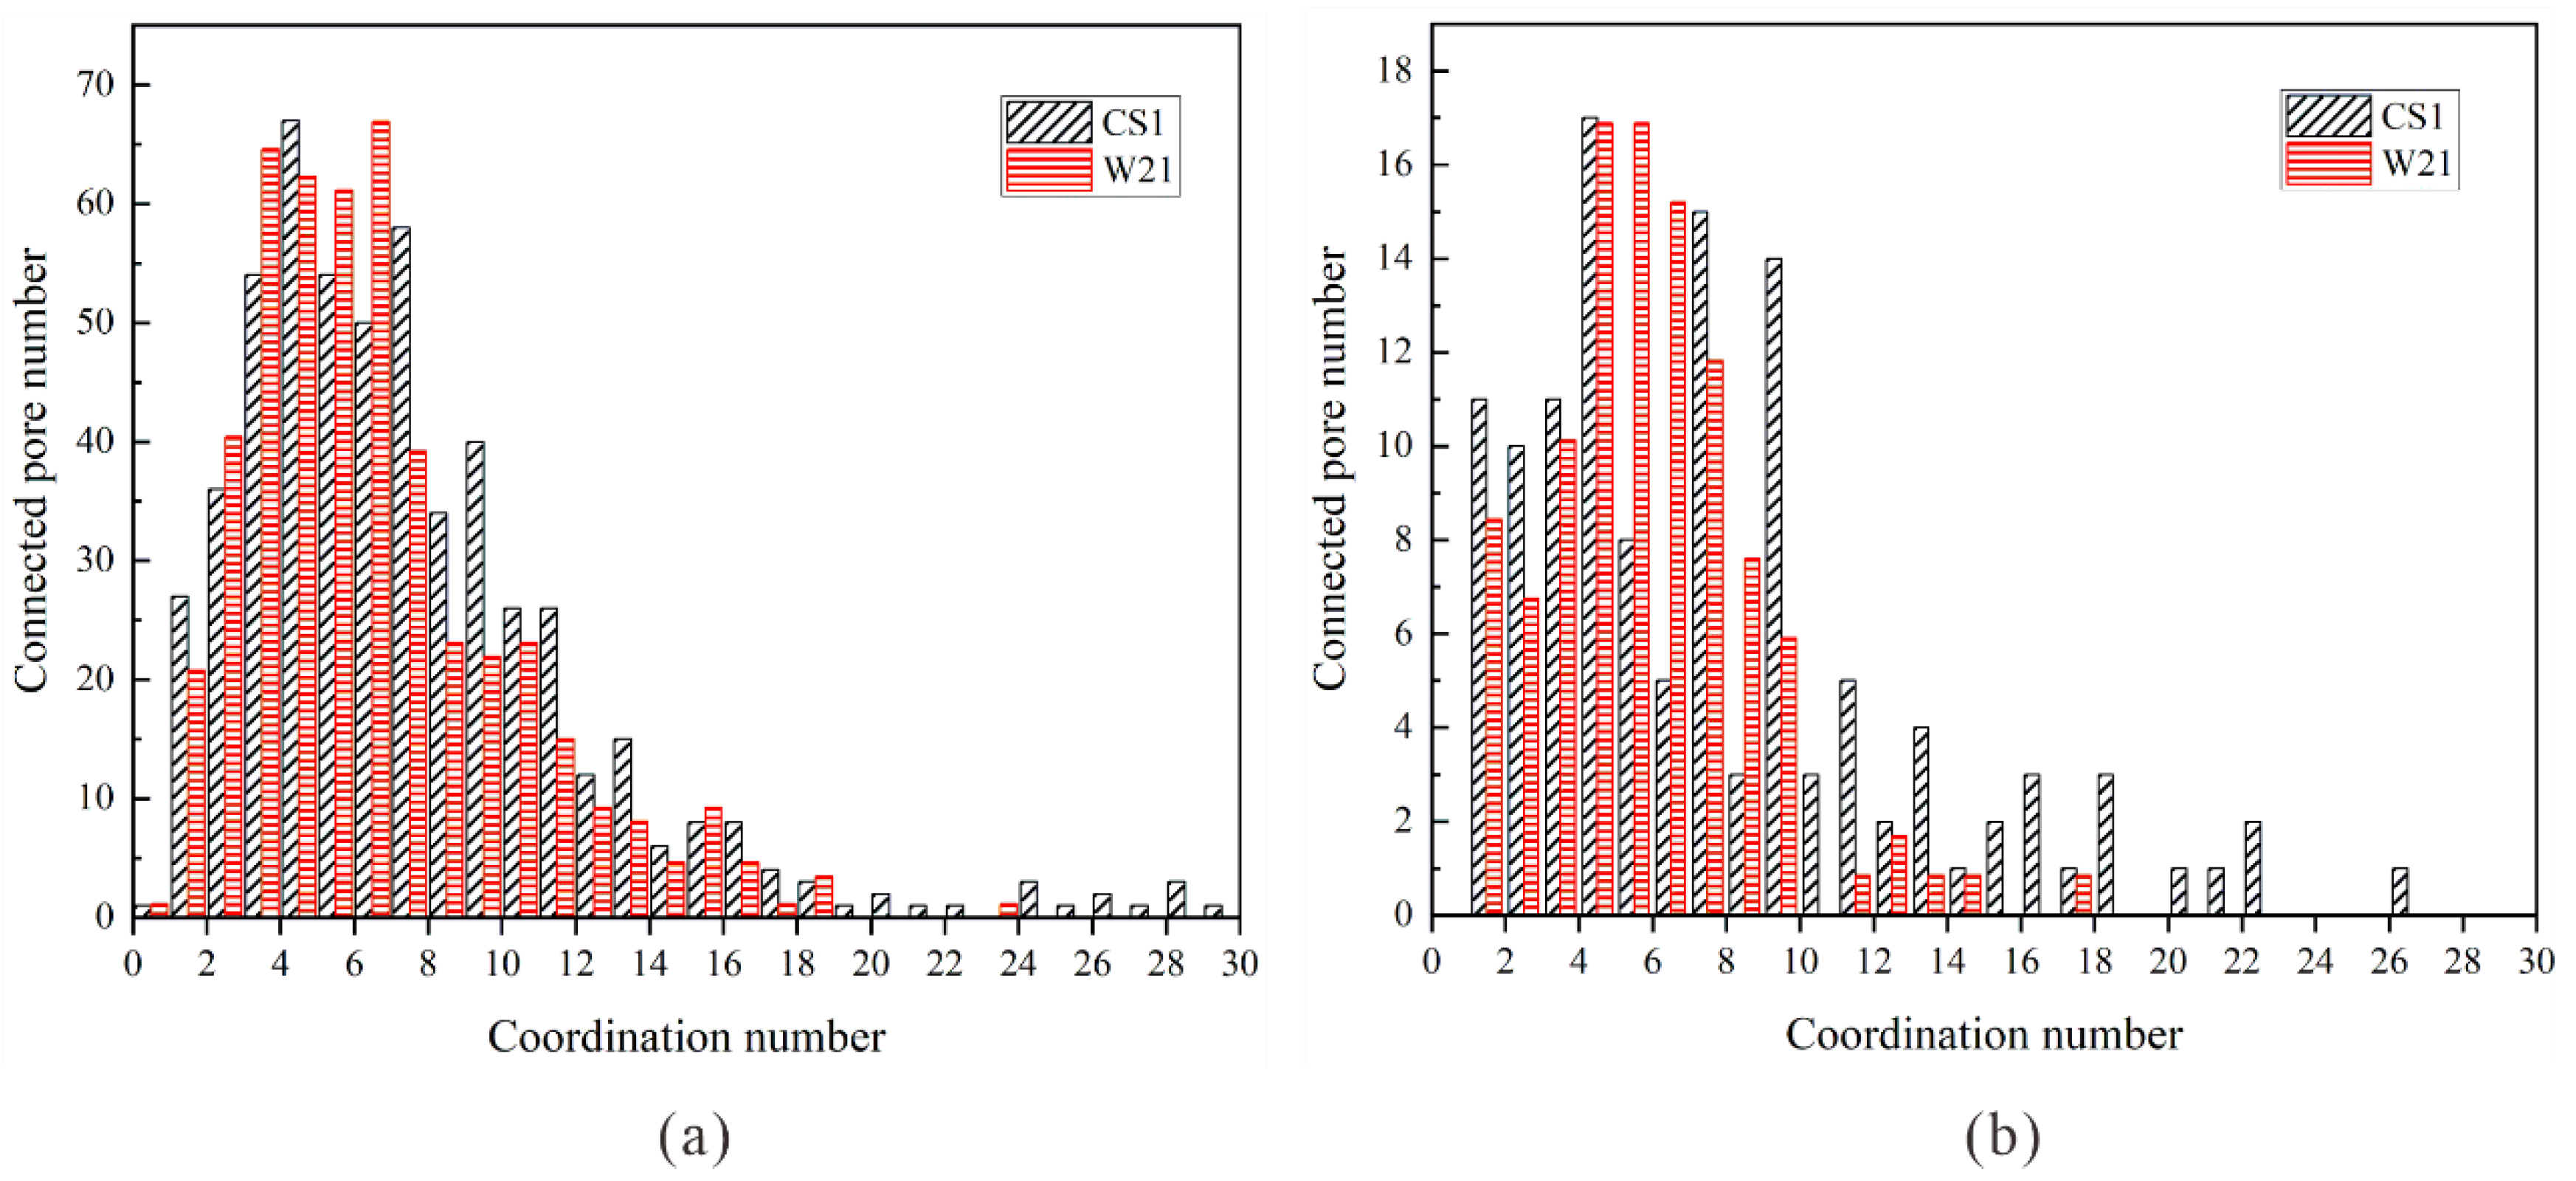
4.3. Pore–Throat Network Model

The pore–throat network model illustrates the 3D distribution and connectivity of pore throats, where larger red spheres symbolize pores and interconnected yellow pipes denote throats. At the micron scale, the pore–throat network of the CS1 sample exhibited a relatively dense configuration, characterized by a substantial number of developed pores and wide throats (Figure 8a), whereas the pore–throat distribution in the W21 sample appeared more dispersed, with narrower throats (Figure 8c). At the nanoscale, although the CS1 sample possesses fewer pores than the W21 sample, it maintained wider throats (Figure 8b,d).
At the micron level, the throat count of the CS1 sample was 1.55 times that of the W21 sample (Table 2). The average length and radius of the throats in the CS1 sample were slightly superior, and the disparity in the average throat surface area between the CS1 and W21 samples was notably significant, with the average surface area of CS1 being 2.5 times that of W21. The results showed that the throat of the CS1 sample was thicker and longer at the micron scale, offering enhanced connectivity. In nano scale CT scans, owing to the significantly improved scanning accuracy for pore–throat parameters, the average throat radius and surface area of the CS1 sample were found to be 3.3 and 12 times greater, respectively, than those of the W21 sample, with even the throat length showing a slight superiority. This further confirms the development of a pore–throat network structure in CS1 with enhanced micro–connectivity. Quantitative statistical analysis at the micro–nano scale revealed that the CS1 sample surpassed the W21 sample in terms of throat count, size, and surface area, indicating a more pronounced potential for gas migration and improved reservoir connectivity in the CS1 sample.
The pore–throat coordination number serves as an important microscopic parameter of the reservoir’s physical property, indicating the degree of pore connectivity [74]. Its value closely reflects the connectivity of pores, and a higher coordination number correlates with improved connectivity. At the micron scale, the CS1 sample showed a maximum coordination number of 39, with an average of 7.21, whereas the W21 sample showed a maximum of 23, with an average of 6.03. For the CS1 and W21 samples, 56.2% and 47.9% of their pore–throat coordination numbers exceeded or equaled 6, respectively (Figure 9a). At the nano scale, the maximum coordination number of the CS1 samples was 30, with an average of 7.61, while that of the W21 samples was 17, with an average of 5.34. The coordination numbers of the CS1 and W21 samples are 54.4% and 43.5% greater than or equal to 6, respectively (Figure 9b). Quantitative analysis at the micro–nano scale revealed that CS1 features a higher coordination number and a more intricate pore–throat network, enhancing the multidirectional spreading and transport of natural gas, and thereby improving the permeability and transport efficiency of volcanic reservoirs compared to that of the W21 sample.
The pore diameters of samples at the micron scale predominantly ranged between 0.15 and 0.45 μm (Figure 10a), with the average pore radii of CS1 and W21 samples being 0.307 μm and 0.253 μm, respectively. At the nanoscale, pore radii were mainly concentrated between 0.015 and 0.03 μm (Figure 10b), with the average pore radii of CS1 and W21 samples being 0.026 μm and 0.024 μm, respectively. Throats are the principal channels for natural gas migration. At the micron scale, the total throat length of the CS1 sample measured 2222.96 μm (Figure 11a), and the average throat radius measured 0.098 μm (Figure 12a); for the W21 sample, the total throat length and average throat radius were 1366.98 μm (Figure 11a) and 0.071 μm, respectively (Figure 12a). At the nanoscale, the total throat length of the CS1 sample was 54.79 μm (Figure 11b), with an average throat radius of 0.0097 μm (Figure 12b); the total throat length of the W21 sample was 30.09 μm (Figure 11b), with an average throat radius of 0.0029 μm (Figure 12b). Quantitative statistical results at the micro–nano scale indicated that CS1 samples exhibit significant advantages with respect to pore/throat radius and throat length, further reducing resistance during natural gas flow and thus enhancing the efficiency of dynamic storage and migration of natural gas. The above results are consistent with the actual physical parameters of the samples, further demonstrating the accuracy of the 3D modeling.

4.4. 3D Fracture Body Model

Fractures serve as critical spaces within reservoirs and are the primary pathways for the migration of oil and gas [75], thus controlling the formation and distribution of high–quality reservoirs [76]. The degree of fracture development has an important effect on reservoir permeability [77]. In the 3D fracture model at the micron scale, the CS1 sample shows that the main fracture cuts vertically and runs through the two corners of the cube (Figure 11aI,bI,cI), with numerous micro fractures adhering to the surface of the main fracture in a direction that is nearly parallel (Figure 11aII,bII). Quantitative statistics indicate that the fracture volume and surface area of CS1 sample were 10.5584 μm3 and 592.687 μm2, respectively. The main fractures of the W21 sample span diagonally across the sample interior (Figure 11dI,eI,fI), yet significant disconnections were observed within these fractures, with only a few fractures intersecting the main fractures at perpendicular angles (Figure 11dII,eII,fII). The measured fracture volume and surface area of the W21 sample were 5.0946 μm3 and 387.563 μm2, respectively. The two fractures that were nearly orthogonal within the W21 sample impede the natural gas flow to some extent, thereby diminishing the effective permeability and connectivity of the reservoir. A quantitative comparison of the fracture volumes and surface areas of the two samples revealed that CS1 markedly surpassed W21. A combined qualitative and quantitative analysis indicated that the CS1 sample offers significant advantages with respect to facilitating natural gas migration.
A portion of the crack surface with a green background color was captured in order to zoom in and observe the internal blue dissolution channels (Figure 12). Although the dissolution paths in the CS1 sample were narrow, the channels were longer, forming a dense and developed 3D dissolution network, which can enhance reservoir connectivity and promote the dynamic transmission of natural gas. The intersection points of the dissolution channels were dissolution pores, which significantly increased the gas storage space, thereby further enabling gas accumulation and flow (Figure 12a). While the W21 sample exhibits broader dissolution channels, these are shorter, more dispersed, and lack continuity, leading to diminished efficiency in natural gas transmission and less pronounced development of dissolution pores (Figure 12b), indicating that the gas storage and permeability of the reservoir have limited ability. Therefore, when comparing the microscopic dissolution characteristics, the CS1 sample demonstrates considerable structural benefits with respect to enhancing natural gas migration efficiency and reservoir connectivity.

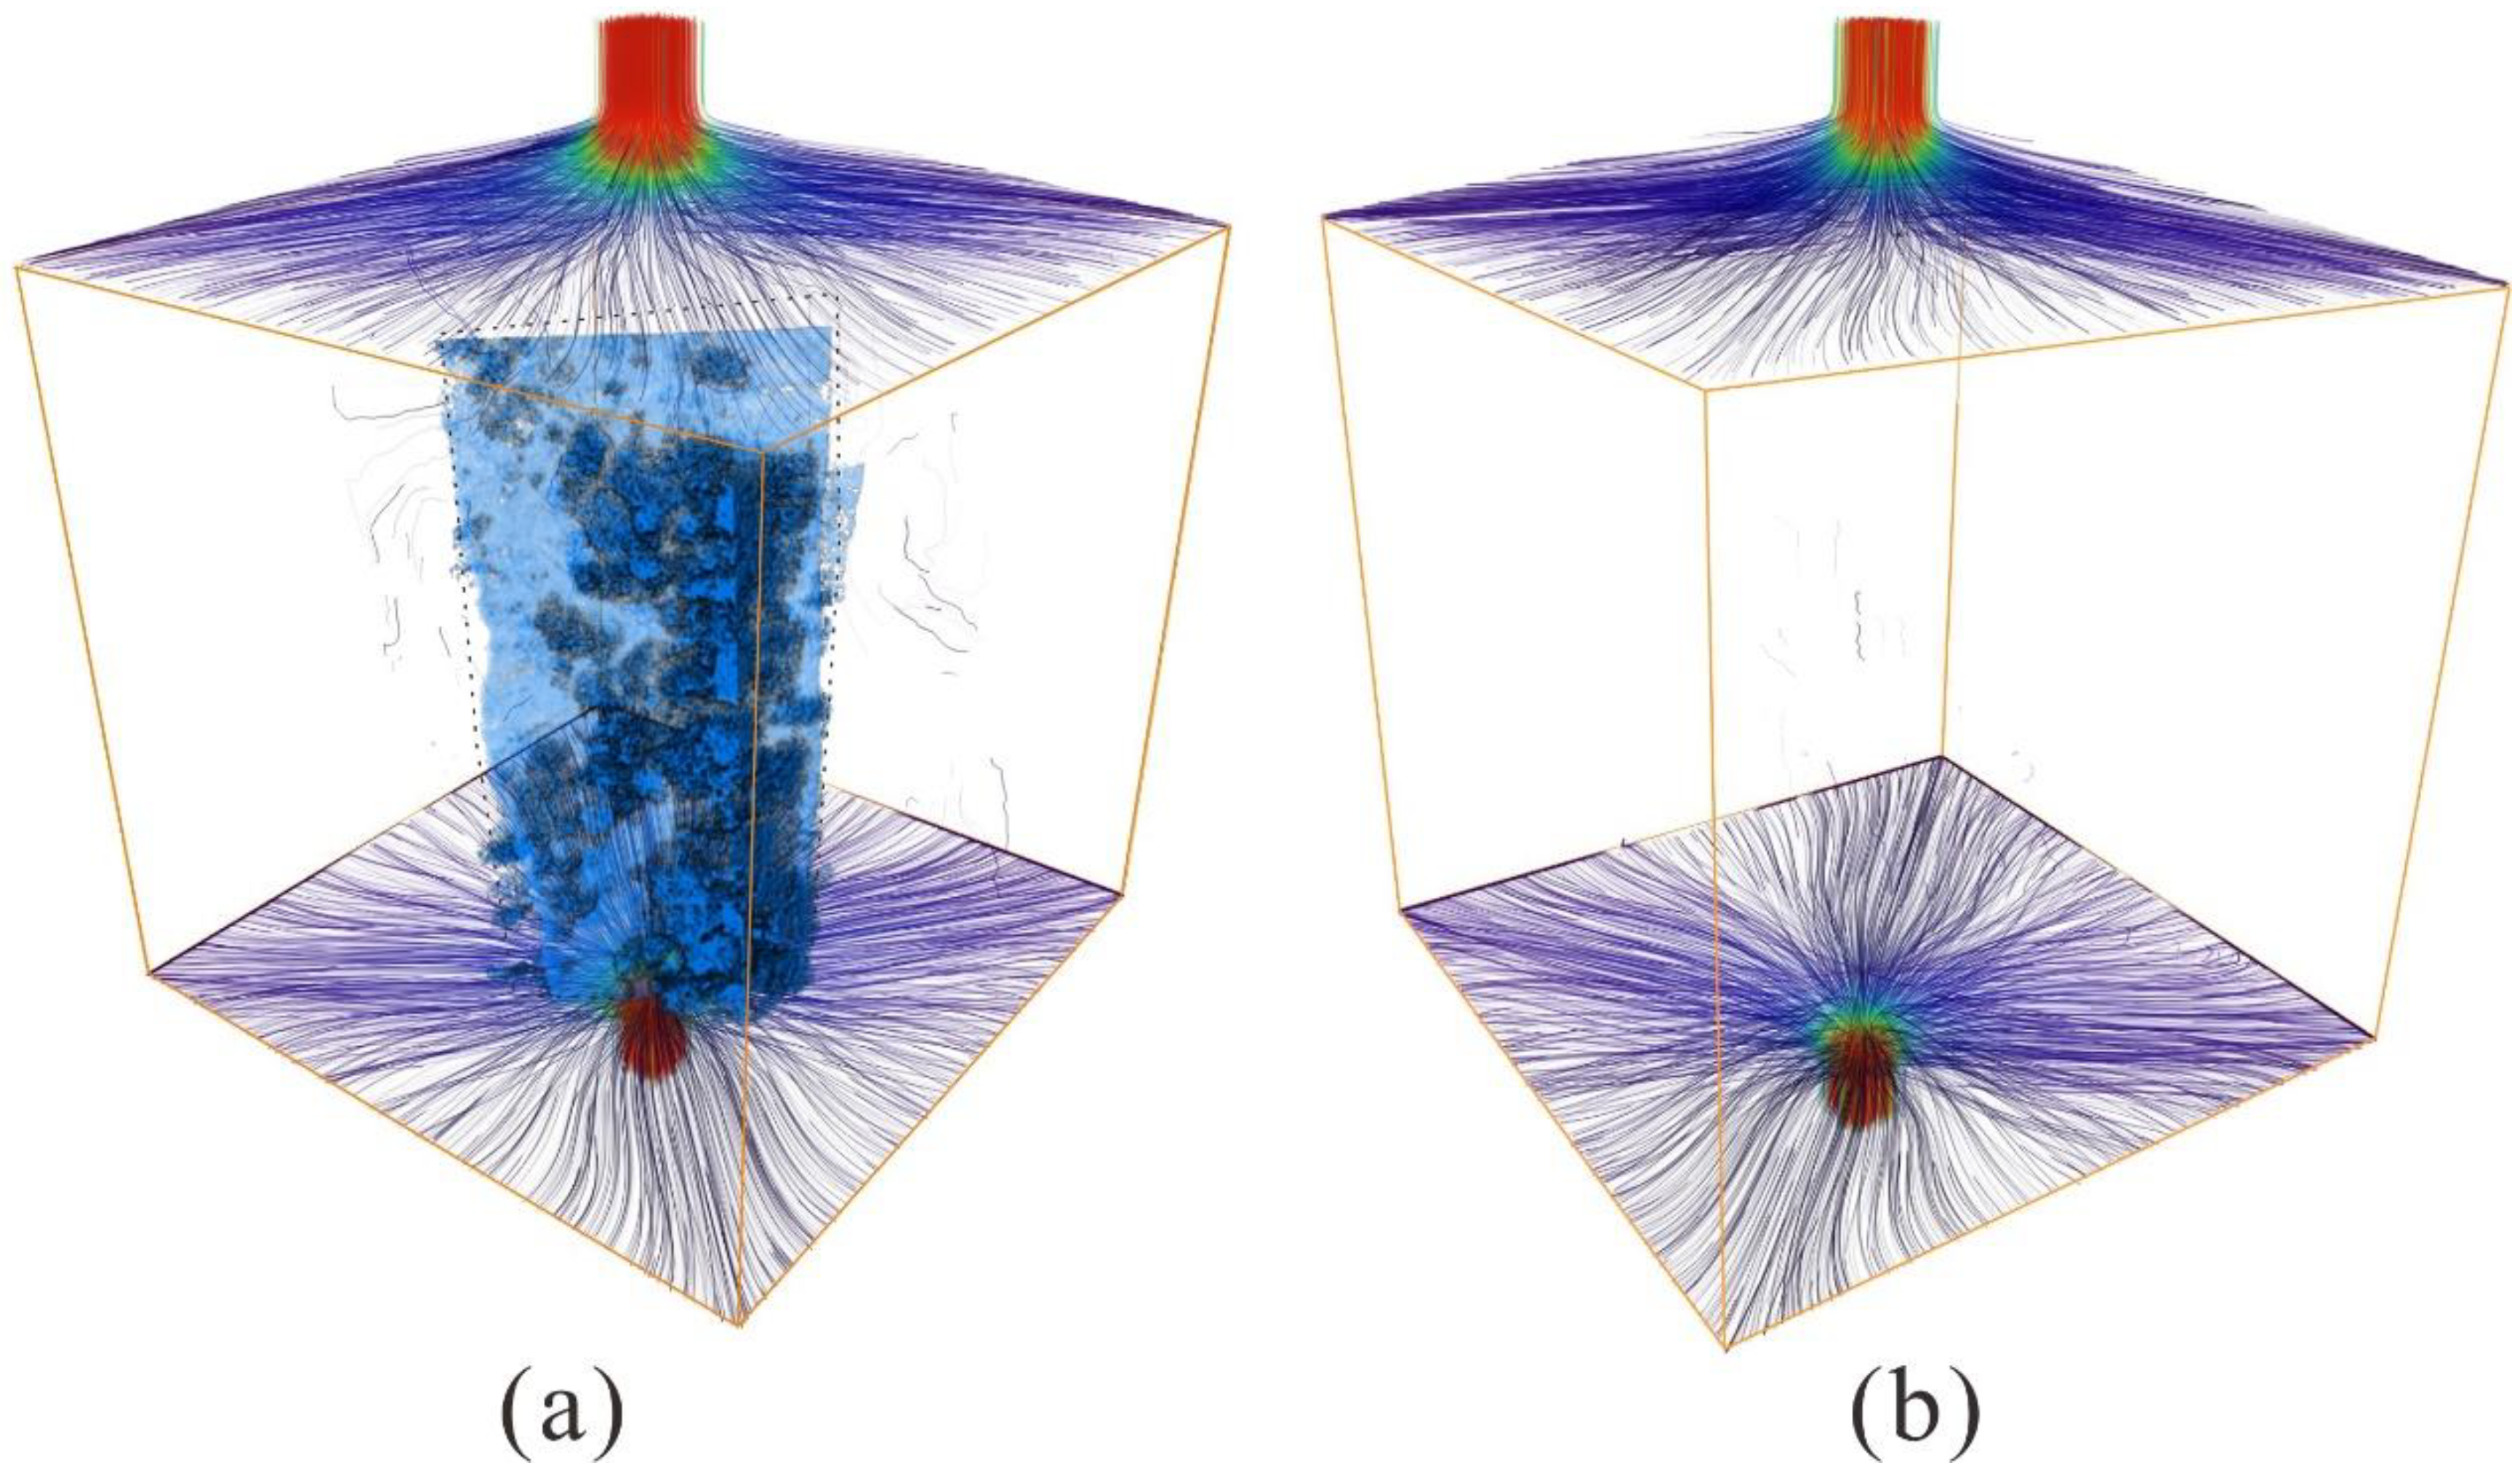
4.5. Natural GasSeepage Simulation

A natural gas seepage simulation was conducted based on a pore–throat network model. The upper end is the entrance and the lower end is the exit. The length, width, and streamline count were employed to characterize the trajectory of natural gas seepage within a volcanic reservoir. In the microscale CS1 sample, a higher concentration of streamlines was readily observed in the central area, which was notably thicker and longer than those in other areas, indicating superior permeability conditions (Figure 13a). However, the W21 sample exhibited a reduced total number of streamlines, with the majority being thin, short, and challenging to detect (Figure 13b). The seepage yielded flow rates for the CS1 and W21 samples of 3.19 × 10⁻⁶ cm2/s and 0.77 × 10⁻⁶ cm2/s, respectively, with corresponding permeabilities of 0.129 md and 0.030 md.
The flow rate is the volume or mass of fluid passing through a certain cross–section per unit time, and permeability is the number of porous media that the fluid passes through per unit area under a specific pressure difference per unit time. The formula used is as follows:
Q = kA μ P L
Q represents the volumetric flow of fluid through the medium. k denotes the medium permeability value, A denotes the cross–sectional area of fluid flow, μ denotes the dynamic viscosity of the fluid, ΔP denotes the pressure drops, and L denotes the length over which the pressure drop occurs. From the data, it can be seen that the flow rate of the CS1 sample is 5 times that of the W21 sample, and the permeability is 4.3 times higher than that of the W21 sample, indicating a significant enhancement over the W21 sample. Based on the above qualitative and quantitative analyses, the seepage pathways within the CS1 sample were markedly more complex and varied, facilitating enhanced, swifter, and more efficient natural gas migration within the reservoir.
The pore–throat is one of the main factors affecting permeability [78]. To investigate the impact of microscopic pore–throat parameters on permeability, eight equal–volume sub–samples (voxel: 150 × 150 × 150) were selected from each sample to represent the Representative Elementary Volume (REV) with varying pore–throat characteristics, average throat radius, throat length, pore radius, and coordination number. The corresponding permeability simulation values of each sub–sample were obtained to conduct a “Pearson correlation coefficient (R)” analysis and quantitatively assess the impact of pore–throat parameters on permeability. The formula used is as follows:
R = i = 1 n ( X i     X ¯   ) ( Y i     Y ¯ ) i = 1 n ( X i     X ¯ ) 2 i = 1 n ( Y i     Y ¯ ) 2
In this study, X denotes any of the above four pore–throat parameters, Y denotes the corresponding permeability, X ¯ and Y ¯ are the average values, and n = 10. The strength of the correlation between two variables is decided by the magnitude of the correlation coefficient R, categorized as follows: 0.8 to 1.0 indicates extremely strong correlation; 0.6 to 0.8 indicates strong correlation; 0.4 to 0.6 indicates medium correlation; 0.2 to 0.4 indicates weak correlation; and 0 to 0.2 indicates extremely weak correlation or uncorrelated [79]. The findings revealed that the average throat radius exhibited a strong correlation, the average pore radius and average throat length demonstrated a moderate correlation, and the average coordination number showed a weak correlation. Between the two samples, the average throat radius exhibited the strongest correlation (Table 3).

5. Discussion

5.1. Influence of Microscopic Basic Physical Properties of Volcanic Reservoir on Gas Migration

Basic physical property parameters determine the initial storage and transport capabilities of natural gas, which encompass the pore/throat structure, permeability, degree of fracture development, porosity, rock strength, and mineral composition. Through qualitative and quantitative analysis of pore models of the CS1 and W21 samples, it is found that CS1 samples perform well in pore throat size, spatial distribution, and connectivity, providing more favorable conditions for natural gas migration and higher migration efficiency. In addition, fracture model analysis shows that the fracture development degree, distribution uniformity, and preservation integrity of CS1 sample are better than that of W21 sample, which is conducive to natural gas migration. In the gas seepage simulation, the CS1 sample shows a more significant seepage phenomenon and higher permeability, further confirming the importance of basic physical parameters on the gas migration capacity of volcanic reservoirs.
Rock and mineral identification showed that approximately 80% of the crystals and rock debris in the CS1 samples indicate a complex internal structure of the rock, leading to a diversified pore–fracture system, thus enhancing the migration capacity of natural gas. The corrosion of local quartz crystal debris forms small channels and pores in the rocks, providing additional migration channels for natural gas. In contrast, the W21 sample had a low crystal debris content, resulting in a relatively simple pore–fracture system that is not conducive to natural gas migration. The crystal debris in the sample is mainly plagioclase and quartz, which are conducive to pore formation; however, the high proportion of volcanic ash makes the rock denser, reduces the overall porosity and permeability, and limits the migration of natural gas. The analysis of the rock samples again shows that the CS1 samples provide better gas migration conditions and proves the reliability of the above micro–nano model.

5.2. Influence of Fractures on Reservoir Connectivity and Permeability

The fracture of volcanic reservoir is strongly controlled by the rock’s mechanical properties and tectonic stress [80]. Owing to the notable heterogeneity of volcanic rocks, they are prone to the generation of a large number of fractures. Sample analysis indicated that the presence of quartz and feldspar contributed to rock brittleness. The high proportion of rock and crystal debris, along with the volcanic ash content, leads to a tight internal structure of the rock and strengthened intercrystallite bonds, further increasing the brittleness and predisposition to fracture formation. The Songliao Basin was influenced by deep–seated basement faults in the Late Jurassic to Early Cretaceous, which led to frequent tectonic movements and the development of numerous fractures [81].Wider, longer, and higher–density fractures provide larger flow channels [82], thus enhancing connectivity within reservoirs and facilitating the movement and accumulation of hydrocarbons [83].
There are two main types of fractures: primary fractures and secondary fractures. Primary fractures are generally filled with secondary minerals during the early burial stage due to magmatic–hydrothermal alteration, carbonate cementation, and clay mineral cementation, all of which reduce the effectiveness of the fractures [84]. Secondary fractures are formed by processes such as increased burial depth, folding, and faulting, which increases communication among primary pores and significantly enhances connectivity among pores generally [85] and introduce acidic materials such as organic acids and CO2 into the reservoir; the latter promotes secondary dissolution, creating numerous secondary dissolution pores and enhancing connectivity in volcanic reservoirs.
Dissolution is the main diagenetic process that increases the storage space in volcanic rocks. Microscopic CT results demonstrated that dissolution pores were densely distributed around the dissolution channels (Figure 14), which enhanced the reservoir connectivity near the fracture development zone and significantly improved the migration capacity of the volcanic reservoirs. The degree of fracture development is the most direct factor affecting the physical properties and oil–bearing capacities of reservoirs. The combination of fractures and solution pores increases reservoir porosity and permeability, facilitating highly efficient natural gas migration [86]. However, owing to the limited range of external effects, such as stress, grain corrosion, and burial depth, the randomness of the development state of fractures is pronounced, which can restrict the migration of natural gas. In cases of uneven reservoir development, fractures typically have a significant influence on the physical properties of the reservoir within a limited local range.

5.3. The Influence of Integrated Pore–Throat/Fracture Analysis on Permeability

Changes in permeability are primarily controlled by pore–throat characteristics and fracture development [87]. The pore–throat size directly determines the flowability of natural gas in rock [88]. Larger pores/throats enable more gas to flow through, enhancing permeability, whereas smaller pores/throats restrict gas flow, resulting in lower permeability. The shape and surface roughness of the pores/throats also affect natural gas flow; regular and smooth pores/throats typically facilitate fluid flow, whereas irregular or rough pores/throats increase resistance to fluid flow.
The presence of fractures markedly improves rock permeability [89]. Well–developed fractures can facilitate high–efficiency gas migration even in rocks with low porosity. The impact of fractures on permeability was greater than that of the pore–throat structure, particularly because the effect of the throat radius on permeability exceeded that of the pore radius. In the full–pore natural gas seepage simulation involving the CS1 and W21 samples, the seepage paths exhibited significant differences in number, length, and thickness. Further observation of the seepage paths revealed that the seepage path of the CS1 sample was highly consistent with the shape of the main fracture (Figure 14a), indicating that when the fractures were developed, natural gas mainly migrated along the fractures. Conversely, the seepage streamlines of sample W21 are sparse and lack a continuous plane (Figure 14b), indicating that the seepage primarily depends on the pore/throat structure in the absence of well–developed fractures.
Using the correlation analysis method, which was previously applied in the literature for measuring soil and sandstone [90,91], this study explored the influence of pore–throat parameters on the permeability of volcanic rocks. The experimental results showed that average throat radius had the highest correlation with reservoir permeability, followed by average pore radius. The analysis results offer vital insights for the comprehensive study and quantitative assessment of volcanic reservoirs and improve the understanding of the mechanisms by which pore throats and fractures play a role in seepage processes.

6. Conclusions

The qualitative and quantitative results from the 3D visualization model indicate that the CS1 volcanic sample exhibits a more developed pore–throat network and fracture system at the micro–nano scale. This research confirms that the fundamental parameters of the pore–throat–fracture system are decisive for the storage and transport efficiency of natural gas in volcanic reservoirs, which has not been fully addressed in previous studies. Furthermore, by comparing the physical parameters of the samples, the accuracy of the micro–nano CT scanning and 3D modeling methods employed in this study is validated.
In addition, the analysis results of fracture body model indicate that the development of fractures and the formation of secondary pores through later dissolution greatly increase the reservoir space within the volcanic rocks, significantly improving permeability. However, the inhomogeneity of the volcanic reservoir leads to the randomness of fracture development, so the fracture can enhance the connectivity and permeability of the reservoir only in a local limited range.
The results of natural gas seepage simulation are highly consistent with the analyses of the pore and fracture models, further confirming the significant advantages of the CS1 sample in terms of natural gas storage and transport efficiency. The study shows that in areas with well–developed fractures, gas seepage primarily occurs along fracture paths, with a pronounced seepage effect. In areas with fewer fractures, Pearson correlation coefficient analysis reveals that throat radius has the highest correlation with permeability, followed by pore radius and throat length. This study is the first to quantitatively reveal the specific influence of pore–throat parameters on permeability in volcanic reservoirs. Through 3D modeling and seepage simulation, it provides a more accurate evaluation method.
Although this study provides important insights, there are still some limitations. First, the resolution of CT scans may not be sufficient to detect ultrafine pore structures, leading to an underestimation of total porosity and connectivity. Second, the randomness and locality of crack development are significant, and external factors such as stress, grain corrosion, and burial depth limit the migration of natural gas. Future research should combine broader geological conditions and adopt multiple methods to validate and expand these results.

Author Contributions

Conceptualization, X.G. and Y.Y.; methodology, X.G.; software, X.G. and Y.L.; investigation, X.G.; writing—original draft preparation, X.G.; writing—review and editing, X.G. and Y.Y.; visualization, X.G.; supervision, Y.L.; funding acquisition, Z.X. All authors have read and agreed to the published version of the manuscript.

Funding

This research was funded by the National Natural Science Foundation of China (No. 41472101).

Data Availability Statement

The data that support the findings of this study are available from the Xiangwei Gao.

Acknowledgments

We thank Sanying Precision Instruments Co., Ltd. for the technical support and equipment provided for this research. We appreciate the assistance of the Exploration and Development Research Institute of Jilin Oilfield Branch, China National Petroleum Corporation (CNPC), for sample preparation., and are grateful for their support.

Conflicts of Interest

All authors have no conflicts of interest in the research, writing, and submission of this article. Any research funding, sponsorship, or other situations that could lead to conflicts of interest have been explicitly declared in the article. We promise that any potential conflicts of interest have been fully disclosed to all authors and contributors involved in this article.

References

  1. Yao, W.J.; Chen, Z.H.; Dong, X.M.; Hu, T.T.; Liang, Z.L.; Jia, C.M.; Pan, T.; Yu, H.T.; Dang, Y.F. Storage space, pore–throat structure of igneous rocks and the significance to petroleum accumulation: An example from Junggar Basin, western China. Mar. Pet. Geol. 2021, 133, 105270. [Google Scholar] [CrossRef]
  2. Lewis, J.W. Occurrence of Oil in Igneous Rocks of Cuba. AAPG Bull. 1932, 16, 809–818. [Google Scholar] [CrossRef]
  3. Kroeger, K.F.; Bischoff, A.; Nicol, A. Petroleum systems in a buried stratovolcano: Maturation, migration and leakage. Mar. Pet. Geol. 2022, 141, 105682. [Google Scholar] [CrossRef]
  4. Liu, S.X.; Zhang, Y.Y.; Wu, Q.L.; Ayers, W.B.; Wang, Y.Q.; Ott, W.K.; Yan, Y.G.; Shi, W.Y.; Wang, Y. Crucial Development Technologies for Volcanic Hydrocarbon Reservoirs: Lessons Learned from Asian Operations. Processes 2023, 11, 3052. [Google Scholar] [CrossRef]
  5. Weydt, L.M.; Lucci, F.; Lacinska, A.; Scheuvens, D.; Carrasco–Núñez, G.; Giordano, G.; Rochelle, C.A.; Schmidt, S.; Bär, K.; Sass, I. The impact of hydrothermal alteration on the physiochemical characteristics of reservoir rocks: The case of the Los Humeros geothermal field (Mexico). Geotherm. Energy 2022, 10, 20. [Google Scholar] [CrossRef]
  6. Sidney, P. Notes on Minor Occurrences of Oil, Gas, and Bitumen with Igneous and Metamorphic Rocks. AAPG Bull. 1932, 16, 837–858. [Google Scholar] [CrossRef]
  7. Othman, R.; Arouri, K.R.; Ward, C.R.; McKirdy, D.M. Oil generation by igneous intrusions in the northern Gunnedah Basin, Australia. Org. Geochem. 2001, 32, 1219–1232. [Google Scholar] [CrossRef]
  8. Zhang, K.L.; Wang, Z.L.; Jiang, Y.Q.; Wang, A.G.; Xiang, B.L.; Zhou, N.; Wang, Y. Effects of weathering and fracturing on the physical properties of different types of volcanic rock: Implications for oil reservoirs of the Zhongguai relief, Junggar Basin, NW China. J. Pet. Sci. Eng. 2020, 193, 107351. [Google Scholar] [CrossRef]
  9. Lenhardt, N.; Götz, A.E. Volcanic settings and their reservoir potential: An outcrop analog study on the Miocene Tepoztlan Formation, Central Mexico. J. Volcanol. Geotherm. Res. 2011, 204, 66–75. [Google Scholar] [CrossRef]
  10. Hennings, P.; Allwardt, P.; Paul, P.; Zahm, C.; Reid, R.; Alley, H.; Kirschner, R.; Lee, B.; Hough, E. Relationship between fractures, fault zones, stress, and reservoir productivity in the Suban gas field, Sumatra, Indonesia. AAPG Bull. 2012, 96, 753–772. [Google Scholar] [CrossRef]
  11. Wang, P.J.; Chen, S.M. Cretaceous volcanic reservoirs and their exploration in the Songliao Basin, northeast China. AAPG Bull. 2015, 99, 499–523. [Google Scholar] [CrossRef]
  12. Chen, Z.H.; Wang, X.Y.; Wang, X.L.; Zhang, Y.G.; Yang, D.S.; Tang, Y. Characteristics and petroleum origin of the Carboniferous volcanic rock reservoirs in the Shixi Bulge of Junggar Basin, western China. Mar. Pet. Geol. 2017, 80, 517–537. [Google Scholar] [CrossRef]
  13. Li, R.; Xiong, Z.; Wang, Z.; Xie, W.; Li, W.; Hu, J. Lithofacies Characteristics and Pore Controlling Factors of New Type of Permian Unconventional Reservoir in Sichuan Basin. Processes 2023, 11, 625. [Google Scholar] [CrossRef]
  14. Marins, G.M.; Parizek–Silva, Y.; Millett, J.M.; Jerram, D.A.; Rossetti, L.M.M.; Souza, A.D.E.; Planke, S.; Bevilaqua, L.A.; Carmo, I.D. Characterization of volcanic reservoirs; insights from the Badejo and Linguado oil field, Campos Basin, Brazil. Mar. Pet. Geol. 2022, 146, 105950. [Google Scholar] [CrossRef]
  15. Feng, Z.Q. Volcanic rocks as prolific gas reservoir: A case study from the Qingshen gas field in the Songliao Basin, NE China. Mar. Pet. Geol. 2008, 25, 416–432. [Google Scholar] [CrossRef]
  16. Shan, X.L.; Mu, H.S.; Liu, Y.H.; Li, R.L.; Zhu, J.F.; Shi, Y.Q.; Leng, Q.L.; Yi, J. Subaqueous volcanic eruptive facies, facies model and its reservoir significance in a continental lacustrine basin: A case from the Cretaceous in Chaganhua area of southern Songliao Basin, NE China. Pet. Explor. Dev. 2023, 50, 826–839. [Google Scholar] [CrossRef]
  17. Zheng, H.; Sun, X.M.; Zhu, D.F.; Tian, J.X.; Wang, P.J.; Zhang, X.Q. Characteristics and factors controlling reservoir space in the Cretaceous volcanic rocks of the Hailar Basin, NE China. Mar. Pet. Geol. 2018, 91, 749–763. [Google Scholar] [CrossRef]
  18. Li, J.; Chen, G.P.; Zhang, B.; Hong, L.; Han, Q.F. Structure and fracture–cavity identification of epimetamorphic volcanic–sedimentary rock basement reservoir: A case study from central Hailar Basin, China. Arab. J. Geosci. 2019, 12, 64. [Google Scholar] [CrossRef]
  19. Wei, W.; Zhu, X.M.; Chen, D.Z.; Zhu, S.F.; He, M.W.; Sun, S.Y. Pore Fluid and Diagenetic Evolution of Carbonate Cements in Lacustrine Carbonate–Siliciclastic Rocks: A Case from the Lower Cretaceous of the Erennaoer Sag, Erlian Basin, Ne China. J. Sediment. Res. 2019, 89, 459–477. [Google Scholar] [CrossRef]
  20. Bian, B.; Iming, A.; Gao, T.; Liu, H.; Jiang, W.; Wang, X.; Ding, X. Petroleum Geology and Exploration of Deep–Seated Volcanic Condensate Gas Reservoir around the Penyijingxi Sag in the Junggar Basin. Processes 2022, 10, 2430. [Google Scholar] [CrossRef]
  21. Ma, J.; Huang, Z.L.; Liang, S.J.; Liu, Z.Z.; Liang, H. Geochemical and tight reservoir characteristics of sedimentary organic–matter–bearing tuff from the Permian Tiaohu Formation in the Santanghu Basin, Northwest China. Mar. Pet. Geol. 2016, 73, 405–418. [Google Scholar] [CrossRef]
  22. Ma, J.; Huang, Z.L.; Zhong, D.K.; Liang, S.J.; Liang, H.; Xue, D.Q.; Chen, X.; Fan, T.G. Formation and distribution of tuffaceous tight reservoirs in the Permian Tiaohu Formation in the Malang sag, Santanghu Basin, NW China. Pet. Explor. Dev. 2016, 43, 778–786. [Google Scholar] [CrossRef]
  23. Xie, Q.B.; Han, D.X.; Zhu, X.M.; Zhu, Y.X. Reservoir space feature and evolution of the volcanic rocks in the Santanghu basin. Pet. Explor. Dev. 2002, 29, 84–86+111. [Google Scholar]
  24. Liu, Z.; Wu, H.; Zhang, S.; Zhao, X. Study on the Reservoir Heterogeneity of Different Volcanic Facies Based on Electrical Imaging Log in the Liaohe Eastern Sag. Processes 2023, 11, 2427. [Google Scholar] [CrossRef]
  25. Xie, J.R.; Li, Y.; Yang, Y.M.; Zhang, B.J.; Liu, R.; He, Q.L.; Wang, W.; Wang, Y.F. Main controlling factors and natural gas exploration potential of Permian scale volcanoclastic reservoirs in the western Sichuan Basin. Nat. Gas Ind. 2021, 41, 48–57. [Google Scholar]
  26. Rabbel, O.; Palma, O.; Mair, K.; Galland, O.; Spacapan, J.B.; Senger, K. Fracture networks in shale–hosted igneous intrusions: Processes, distribution and implications for igneous petroleum systems. J. Struct. Geol. 2021, 150, 104403. [Google Scholar] [CrossRef]
  27. Tang, H.F.; Tian, Z.W.; Gao, Y.F.; Dai, X.J. Review of volcanic reservoir geology in China. Earth–Sci. Rev. 2022, 232, 104158. [Google Scholar] [CrossRef]
  28. Zeng, F.C.; Liu, B.; Zhang, C.M.; Zhang, G.Y.; Gao, J.; Liu, J.J.; Ostadhassan, M. Accumulation and Distribution of Natural Gas Reservoir in Volcanic Active Area: A Case Study of the Cretaceous Yingcheng Formation in the Dehui Fault Depression, Songliao Basin, NE China. Geofluids 2021, 2021, 2900224. [Google Scholar] [CrossRef]
  29. Gong, D.Y.; Song, Y.; Peng, M.; Liu, C.W.; Wang, R.J.; Wu, W.A. The Hydrocarbon Potential of Carboniferous Reservoirs in the Jimsar Sag, Northwest China: Implications for a Giant Volcanic–Petroleum Reserves. Front. Earth Sci. 2022, 10, 879712. [Google Scholar] [CrossRef]
  30. Guo, Z.; Li, Y.; Liu, C.; Zhang, D.; Li, A. Characterization of a Volcanic Gas Reservoir Using Seismic Dispersion and Fluid Mobility Attributes. Lithosphere 2021, 2021, 9520064. [Google Scholar] [CrossRef]
  31. Fu, L.; Qin, Z.J.; Xie, A.; Chen, L.; Li, J.F.; Wang, N.; Qin, Q.R.; Mao, K.L. The relation of the “four properties” and fluid identification of the carboniferous weathering crust volcanic reservoir in the Shixi Oilfield, Junggar Basin, China. Front. Earth Sci. 2022, 10, 983572. [Google Scholar] [CrossRef]
  32. Wang, W.F.; Wang, Z.Z.; Leung, J.Y.; Kong, C.X.; Jiang, Q.P. Petrophysical rock typing based on deep learning network and hierarchical clustering for volcanic reservoirs. J. Pet. Sci. Eng. 2022, 210, 110017. [Google Scholar] [CrossRef]
  33. Chen, J.K.; Deng, X.L.; Shan, X.; Feng, Z.Y.; Zhao, L.; Zong, X.H.; Feng, C. Intelligent Classification of Volcanic Rocks Based on Honey Badger Optimization Algorithm Enhanced Extreme Gradient Boosting Tree Model: A Case Study of Hongche Fault Zone in Junggar Basin. Processes 2024, 12, 285. [Google Scholar] [CrossRef]
  34. Zhao, D.D.; Hou, J.G.; Sarma, H.; Guo, W.J.; Liu, Y.M.; Xie, P.F.; Dou, L.X.; Chen, R.X.; Zhang, Z.Y. Pore throat heterogeneity of different lithofacies and diagenetic effects in gravelly braided river deposits: Implications for understanding the formation process of high–quality reservoirs. Geoenergy Sci. Eng. 2023, 221, 111309. [Google Scholar] [CrossRef]
  35. Du, M.; Yang, Z.M.; Jiang, E.Y.; Lv, J.R.; Yang, T.J.; Wang, W.M.; Wang, J.X.; Zhang, Y.P.; Li, H.B.; Xu, Y. Using digital cores and nuclear magnetic resonance to study pore–fracture structure and fluid mobility in tight volcanic rock reservoirs. J. Asian Earth Sci. 2024, 259, 105890. [Google Scholar] [CrossRef]
  36. Zhang, K.; Jiang, S.; Zhao, R.; Wang, P.F.; Jia, C.Z.; Song, Y. Connectivity of organic matter pores in the Lower Silurian Longmaxi Formation shale, Sichuan Basin, Southern China: Analyses from helium ion microscope and focused ion beam scanning electron microscope. Geol. J. 2022, 57, 1912–1924. [Google Scholar] [CrossRef]
  37. Hu, C.; Deng, Q.J.; Lin, L.; Hu, M.Y.; Hou, X.Y.; Zong, L.M.; Song, P.; Kane, O.I.; Cai, Q.S.; Hu, Z.G. Lower Cretaceous volcanic–sedimentary successions of the continental rift basin in the Songliao Basin, northeast China: Implication in high–quality reservoir prediction and hydrocarbon potential. Mar. Pet. Geol. 2023, 158, 106540. [Google Scholar] [CrossRef]
  38. Ji, P.F.; Lin, H.F.; Kong, X.G.; Li, S.G.; Hu, B.; Wang, P.; He, D.; Yang, S.R. Pore structure of low–permeability coal and its deformation characteristics during the adsorption–desorption of CH4/N2. Int. J. Coal Sci. Technol. 2023, 10, 51. [Google Scholar] [CrossRef]
  39. Yu, R.; Wang, Z.T.; Liu, C.; Zhang, W.L.; Zhu, Y.X.; Tang, M.M.; Che, Q.J. Microstructure and heterogeneity of coal–bearing organic shale in the southeast Ordos Basin, China: Implications for shale gas storage. Front. Earth Sci. 2022, 10, 978982. [Google Scholar] [CrossRef]
  40. Zhou, X.H.; Xu, G.S.; Cui, H.Y.; Zhang, W. Fracture development and hydrocarbon accumulation in tight sandstone reservoirs of the Paleogene Huagang Formation in the central reversal tectonic belt of the Xihu Sag, East China Sea. Pet. Explor. Dev. 2020, 47, 499–512. [Google Scholar] [CrossRef]
  41. Yoshida, N.; Shimoda, K.; Yamamura, K.; Fuse, K.; Kaminoyama, H.; Ishigami, Y.; Mhiri, A.; Niu, L.; Ramondenc, P.; Luo, Y.; et al. Unlocking the Potential of Acid Stimulation in Volcanic Rocks: A Successful Case with Integrated Analysis in Minami–Nagaoka Gas Field, Japan. Spe Prod. Oper. 2023, 38, 162–176. [Google Scholar]
  42. Yamamura, K.; Yoshida, N.; Shimoda, K.; Shimada, S.; Matsui, R.; Ziauddin, M. The Use of Formic Acid and Organic Mud Acid for Stimulation of Volcanic Rocks in Minami–Nagaoka Gas Field, Japan. Spe Prod. Oper. 2022, 37, 397–413. [Google Scholar] [CrossRef]
  43. Vieira, L.D.; Moreira, A.C.; Mantovani, I.F.; Honorato, A.R.; Prado, O.F.; Becker, M.; Fernandes, C.P.; Waichel, B.L. The influence of secondary processes on the porosity of volcanic rocks: A multiscale analysis using 3D X–ray microtomography. Appl. Radiat. Isot. 2021, 172, 109657. [Google Scholar] [CrossRef] [PubMed]
  44. Qin, Z.; Pang, W.L.; Mao, W.Z.; Han, J.H.; Li, Z.W.; Yao, Y.J. Study on seepage characteristics and stress sensitivity of sandstone under cyclic water intrusion based on CT scanning technique. Bull. Eng. Geol. Environ. 2023, 82, 271. [Google Scholar] [CrossRef]
  45. Ma, J.; Querci, L.; Hattendorf, B.; Saar, M.O.; Kong, X.Z. The Effect of Mineral Dissolution on the Effective Stress Law for Permeability in a Tight Sandstone. Geophys. Res. Lett. 2020, 47, e2020GL088346. [Google Scholar] [CrossRef]
  46. Chen, X.; Qi, M.H.; Deng, X.; Cao, Q. Mineral Composition Characteristics and Its Controlling Factors in Shale of Chang 7 Member of Yanchang Formation in the South of Ordos Basin. Sci. Technol. Eng. 2023, 23, 9460–9469. [Google Scholar] [CrossRef]
  47. Fu, J.; Li, h.; Niu, X.; Deng, X.; Zhou, X. Geological characteristics and exploration of shale oil in Chang 7 Member of Triassic Yanchang Formation, Ordos Basin, NW China. Pet. Explor. Dev. 2020, 47, 870–883. [Google Scholar] [CrossRef]
  48. Fan, N.; Wang, J.R.; Deng, C.B.; Fan, Y.P.; Wang, T.T.; Guo, X.Y. Quantitative characterization of coal microstructure and visualization seepage of macropores using CT–based 3D reconstruction. J. Nat. Gas Sci. Eng. 2020, 81, 103384. [Google Scholar] [CrossRef]
  49. Liu, W.Z.; Niu, S.W.; Tang, H.B. Structural characteristics of pores and fractures during lignite pyrolysis obtained from X–ray computed tomography. J. Pet. Sci. Eng. 2023, 220, 111150. [Google Scholar] [CrossRef]
  50. Heap, M.J.; Reuschlé, T.; Farquharson, J.I.; Baud, P. Permeability of volcanic rocks to gas and water. J. Volcanol. Geotherm. Res. 2018, 354, 29–38. [Google Scholar] [CrossRef]
  51. Lu, F.F.; Tan, X.C.; Xiao, D.; Shi, K.B.; Li, M.L.; Zhang, Y.; Zheng, H.F.; Dong, Y.X. Sedimentary control on diagenetic paths of dolomite reservoirs in a volcanic setting: A case study of the Permian Chihsia Formation in the Sichuan Basin, China. Sediment. Geol. 2023, 454, 106451. [Google Scholar] [CrossRef]
  52. Mao, Z.G.; Zhu, R.K.; Wang, J.H.; Luo, J.L.; Su, L. Characteristics of Diagenesis and Pore Evolution of Volcanic Reservoir: A Case Study of Junggar Basin, Northwest China. J. Earth Sci. 2021, 32, 960–971. [Google Scholar] [CrossRef]
  53. Wang, X.C.; Chen, W.T.; He, Y.; Liu, H.Q.; Wang, W.Y. Control of Paleocene volcanic edifice on favorable reservoirs: A case study of the southwestern Huizhou Sag, Pearl River Mouth Basin. Pet. Geol. Exp. 2022, 44, 466–475. [Google Scholar] [CrossRef]
  54. Tie, S.W.; Shan, L.Y.; Regis, K.L.A.; Hui, L.Z.; Liang, Z.; Mei, W.H. Classification and Evaluation of Volcanic Rock Reservoirs Based on the Constraints of Energy Storage Coefficient. Front. Earth Sci. 2022, 10. [Google Scholar] [CrossRef]
  55. Hu, S.Y.; Wang, X.J.; Cao, Z.L.; Li, J.Z.; Gong, D.Y.; Xu, Y. Formation conditions and exploration direction of large and medium gas reservoirs in the Junggar Basin, NW China. Pet. Explor. Dev. 2020, 47, 266–279. [Google Scholar] [CrossRef]
  56. Wang, J.M.; Yang, B.J.; Li, Z.L.; Yu, C.L.; Jiang, C.J.; Li, P.; Cao, L.S.; Chen, Z. Crustal structure between the eastern margin of the Songliao Basin and its geological implication: Deep seismic reflection. Chin. J. Geophys. 2020, 63, 3478–3490. [Google Scholar] [CrossRef]
  57. Liu, Z.H.; Song, J.; Liu, X.W.; Wu, X.M.; Gao, X. Discovery of the Cretaceous–Paleogene compressional structure and basin properties of the southern Songliao Basin. Acta Pet. Sin. 2020, 36, 2383–2393. [Google Scholar] [CrossRef]
  58. Zhang, J.F.; Xu, X.Y.; Bai, J.; Liu, W.B.; Chen, S.; Liu, C.; Li, Y.H. Enrichment and exploration of deep lacustrine shale oil in the first member of Cretaceous Qingshankou Formation, southern Songliao Basin, NE China. Pet. Explor. Dev. 2020, 47, 683–698. [Google Scholar]
  59. Liu, C.; Nicotra, E.; Shan, X.; Yi, J.; Ventura, G. The Cretaceous volcanism of the Songliao Basin: Mantle sources, magma evolution processes and implications for the NE China geodynamics—A review. Earth–Sci. Rev. 2023, 237, 104294. [Google Scholar] [CrossRef]
  60. Yang, X.B.; Wang, H.Y.; Li, Z.Y.; Guan, C.; Wang, X. Tectonic–sedimentary evolution of a continental rift basin: A case study of the Early Cretaceous Changling and Lishu fault depressions, southern Songliao Basin, China. Mar. Pet. Geol. 2021, 128, 105068. [Google Scholar] [CrossRef]
  61. Zhang, H.; Wang, X.J.; Jia, C.Z.; Li, J.H.; Meng, Q.A.; Jiang, L.; Wang, Y.Z.; Bai, X.F.; Zheng, Q. Whole petroleum system and hydrocarbon accumulation model in shallow and medium strata in northern Songliao Basin, NE China. Pet. Explor. Dev. 2023, 50, 784–797. [Google Scholar] [CrossRef]
  62. Xu, Z.J.; Jiang, S.; Liu, L.F.; Wu, K.J.; Li, R.; Liu, Z.Y.; Shao, M.L.; Jia, K.X.; Feng, Y.J. Natural gas accumulation processes of tight sandstone reservoirs in deep formations of Songliao Basin, NE China. J. Nat. Gas Sci. Eng. 2020, 83, 103610. [Google Scholar] [CrossRef]
  63. Yang, X.B.; Wang, H.Y.; Zhang, Z.H.; Wang, J.; Shi, N.; Zhang, H.Y.; Liu, A. Evolutionary characteristics and key controlling factors of the volcanic rocks in the Lower Cretaceous Changling fault depression, Songliao Basin, China. Mar. Pet. Geol. 2023, 153, 106263. [Google Scholar] [CrossRef]
  64. Mu, H.S.; Li, R.L.; Zhu, J.F.; Xu, W.; Qu, X.Y. Spatial Characteristics and Genesis of Tight Clastic Reservoirs in Yingcheng Formation of Changling Fault Depression in the Southern Songliao Basin. Geofluids 2022, 2022, 5852119. [Google Scholar] [CrossRef]
  65. Wang, Y.X.; Zhang, W.M.; Cong, Y.M.; Zhou, J.H.; Ding, Y.; Wang, Z.J. The fault characteristics of the Wangfu fault depression and its controlling effects on deep–seated volcanic gas reservoir. Acta Pet. Sin. 2018, 34, 2189–2199. [Google Scholar]
  66. Wang, T.T.; Wang, C.S.; Ramezani, J.; Wan, X.Q.; Yu, Z.Q.; Gao, Y.F.; He, H.Y.; Wu, H.C. High–precision geochronology of the Early Cretaceous Yingcheng Formation and its stratigraphic implications for Songliao Basin, China. Geosci. Front. 2022, 13, 101386. [Google Scholar] [CrossRef]
  67. Xi, K.; Cao, Y.; Jahren, J.; Zhu, R.; Bjorlykke, K.; Zhang, X.; Cai, L.; Hellevang, H. Quartz cement and its origin in tight sandstone reservoirs of the Cretaceous Quantou formation in the southern Songliao basin, China. Mar. Pet. Geol. 2015, 66, 748–763. [Google Scholar] [CrossRef]
  68. Withers, P.J.; Bouman, C.; Carmignato, S.; Cnudde, V.; Grimaldi, D.; Hagen, C.K.; Maire, E.; Manley, M.; Du Plessis, A.; Stock, S.R. X–ray computed tomography. Nat. Rev. Methods Primers 2021, 1, 18. [Google Scholar] [CrossRef]
  69. Iraji, S.; Soltanmohammadi, R.; Munoz, E.R.; Basso, M.; Vidal, A.C. Core scale investigation of fluid flow in the heterogeneous porous media based on X–ray computed tomography images: Upscaling and history matching approaches. Geoenergy Sci. Eng. 2023, 225, 211716. [Google Scholar] [CrossRef]
  70. Iraji, S.; De Almeida, T.R.; Munoz, E.R.; Basso, M.; Vidal, A.C. The impact of heterogeneity and pore network characteristics on single and multi–phase fluid propagation in complex porous media: An X–ray computed tomography study. Pet. Sci. 2024, 21, 1719–1738. [Google Scholar] [CrossRef]
  71. Tan, K.J.; Zhao, J.G.; Teng, T.Y.; Liu, X.Z.; Yan, B.H. Research on effectiveness of effective pore aspect ratio based on pore–throat characteristics of digital core. Chin. J. Geophys. 2022, 65, 4433–4447. [Google Scholar] [CrossRef]
  72. Xie, C.Y.; Zhang, W.; Yao, D.F.; Wang, J.; Zhu, Y.C. Quantitative Characterization of Spatial Pore Network of Soils Based on Maximal–Balls Algorithm. J. Eng. Geol. 2019, 28, 60–68. [Google Scholar]
  73. Luo, Y.; Wang, Y.; Wang, R.; Yuan, W. Construction and analysis of pore–fracture network model of carbonate rock. Xinjiang Pet. Geol. 2021, 42, 107–112. [Google Scholar]
  74. Xiao, D.A.S.; Gao, Y.; Peng, S.C.; Wang, M.; Wang, M.; Lu, S.F. Classification and control factors of pore–throat systems in hybrid sedimentary rocks of Jimusar Sag, Junggar Basin, NW China. Pet. Explor. Dev. 2021, 48, 835–849. [Google Scholar] [CrossRef]
  75. Guo, Z.; Zhang, X.; Liu, C.; Liu, X.; Liu, Y. Hydrocarbon Identification and Bedding Fracture Detection in Shale Gas Reservoirs Based on a Novel Seismic Dispersion Attribute Inversion Method. Surv. Geophys. 2022, 43, 1793–1816. [Google Scholar] [CrossRef]
  76. Xu, J.L.; Wang, R.T.; Zan, L.; Wang, X.G.; Huo, J.Q. Geomechanical log responses and identification of fractures in tight sandstone, West Sichuan Xinchang Gas Field. Sci. Rep. 2022, 12, 15543. [Google Scholar] [CrossRef]
  77. Zhao, L. Development characteristics of microfractures in tight sandstone reservoir and its influence on physical properties: A case study of Shiligiahan zone in Hangjinqi. Pet. Reserv. Eval. Dev. 2022, 12, 285–291+312. [Google Scholar]
  78. Wang, Y.S.; Gao, Y.; Fang, Z.W. Pore throat structure and classification of Paleogene tight reservoirs in Jiyang depression, Bohai Bay Basin, China. Pet. Explor. Dev. 2021, 48, 308–322. [Google Scholar] [CrossRef]
  79. Dong, L.P.; Nie, Q.H.; Sun, X.K.; Cao, W.F.; Kou, D.T.; Bai, Z.Q.; Yang, S.N. Analysis of Impact of Shield Tunneling Parameters on Ground Settlement Based on Pearson Correlation Coefficient Method. Constr. Technol. 2024, 53, 116–123. [Google Scholar]
  80. Li, L.; Shi, G.Y.; Zhang, Y.X.; Liu, X.W. Relationship between the heterogeneity of low–permeability reservoirs and the dynamic evolution of fractures under uniaxial compression conditions by CT scanning: A case study in the jiyang depression of Bohai Bay Basin, China. Front. Earth Sci. 2023, 10, 1018561. [Google Scholar] [CrossRef]
  81. Zhong, G.M.; Shi, L.; Zhao, X.Y.; Mao, Y.Q.; Li, Y.G.; Guo, Y.H.; Wu, L.; Zheng, T.L. Quality evaluation of altered volcaniclastic rock reservoirs in the Changling fault depression of the southern Songliao Basin. Nat. Gas Ind. 2023, 43, 25–36. [Google Scholar]
  82. Guo, Z.; Zhang, X.; Liu, C. An Improved Scheme of Azimuthally Anisotropic Seismic Inversion for Fracture Prediction in Volcanic Gas Reservoirs. IEEE Trans. Geosci. Remote Sens. 2022, 60, 5917312. [Google Scholar] [CrossRef]
  83. Luo, Q.; Tang, H.F.; Liu, Q.M.; Yin, Y.S.; Wang, L.X.; Shang, H.J. Multi–scale fracture modeling method and its application: A case study of tight sandstone reservoir in Keshen 2 gas field. Nat. Gas Geosci. 2023, 35, 1000–1013. [Google Scholar]
  84. Zhang, Y.B.; Xu, Y.D.; Liu, X.X.; Yao, X.L.; Wang, S.; Liang, P.; Sun, L.; Tian, B.Z. Quantitative characterization and mesoscopic study of propagation and evolution of three–dimensional rock fractures based on CT. Rock. Soil. Mech. 2021, 42, 2659–2671. [Google Scholar]
  85. Fang, H.H.; Sang, S.X.; Du, Y.; Liu, H.H.; Xu, H.J. Visualization characterization of minerals touched by interconnected pores and fractures and its demineralization effect on coal permeability during CO2–ECBM process based on X–ray CT data. J. Nat. Gas Sci. Eng. 2021, 95, 104213. [Google Scholar] [CrossRef]
  86. Qi, C.Y.; Liu, Y.; Dong, F.J.; Liu, X.X.; Yang, X.; Shen, Y.; Huang, H. Study on Heterogeneity of Pore Throats at Different Scales and Its Influence on Seepage Capacity in Different Types of Tight Carbonate Reservoirs. Geofluids 2020, 2020, 6657660. [Google Scholar] [CrossRef]
  87. Qu, Y.Q.; Sun, W.; Wu, H.N.; Huang, S.J.; Li, T.; Ren, D.Z.; Chen, B. Impacts of pore–throat spaces on movable fluid: Implications for understanding the tight oil exploitation process. Mar. Pet. Geol. 2022, 137, 105509. [Google Scholar] [CrossRef]
  88. Wu, Y.P.; Liu, C.L.; Ouyang, S.Q.; Luo, B.; Zhao, D.D.; Sun, W.; Awan, R.S.; Lu, Z.D.; Li, G.X.; Zang, Q.B. Investigation of pore–throat structure and fractal characteristics of tight sandstones using HPMI, CRMI, and NMR methods: A case study of the lower Shihezi Formation in the Sulige area, Ordos Basin. J. Pet. Sci. Eng. 2022, 210, 110053. [Google Scholar] [CrossRef]
  89. Chen, G.W.; Song, L.; Zhang, W.L. Numerical study on the effects of fracture parameters on permeability in fractured rock with extremely low matrix permeability. Acta Geod. Geophys. 2021, 56, 373–386. [Google Scholar] [CrossRef]
  90. Lu, X.F.; Dong, F.J.; Wei, X.L.; Wang, P.T.; Liu, N.; Ren, D.Z. Analysis of Microscopic Main Controlling Factors for Occurrence of Movable Fluid in Tight Sandstone Gas Reservoirs Based on Improved Grey Correlation Theory. Math. Probl. Eng. 2021, 2021, 3158504. [Google Scholar] [CrossRef]
  91. Wasim, M.; Mahmoodian, M.; Robert, D.; Li, C.Q. Correlation Model for the Corrosion Rates of Buried Cast Iron Pipes. J. Mater. Civ. Eng. 2020, 32, 04020353. [Google Scholar] [CrossRef]
Figure 3. Microscopic photograph of the samples. (a,b) is a rhyolite–type crystal tuff from well CS1 that mainly composed of plagioclase, quartz, and a small amount of volcanic ash, with locally pronounced erosion; (c,d) is crystalline tuff W21, mainly composed of plagioclase, quartz, and a large amount of volcanic ash, with significant dissolution pores and sericite alteration in the grains.
Processes 12 02000 g003
Figure 4. Three–dimensional core. All scanned 2D grayscale slices are stacked in parallel to form a 3D digital core.
Processes 12 02000 g004
Figure 6. 3D reconstruction of connected and isolated pores. It shows the distribution and connectivity of pores in volcanic reservoir samples, which displays the spatial distribution and proportion of connected pores and isolated pores (micro–CT: (a)—CS1, (b)—W21; nano–CT: (c)—CS1, (d)—W21).
Processes 12 02000 g006
Figure 7. Connected pore segmentation model, extracted by Avizo software. Different colors represent distinct pores and the same colors indicate interconnected pores (micro–CT: (a)—CS1, (b)—W21; nano–CT: (c)—CS1, (d)—W21).
Processes 12 02000 g007
Figure 8. Pore–throat network. The red ball represents pores and yellow tubes represent throats. It shows a contrast in pore–throat configurations between the CS1 and W21 samples (micro–CT: (a)—CS1, (b)—W21; nano–CT: (c)—CS1, (d)—W21).
Processes 12 02000 g008
Figure 9. Coordination frequency distribution of samples showing the connectivity between the pores of CS1 and W21 (micro–CT: (a); nano–CT: (b)).
Processes 12 02000 g009
Figure 10. The frequency distribution histogram shows pore radius, throat length, and throat radius in CS1 and W21 samples (micro–CT: (a,c,e); nano–CT: (b,d,f)).
Processes 12 02000 g010
Figure 11. 3D fracture body model shows the extension shape of the fractures from different angles. I and II are the main fractures of CS1 and W21, respectively (micro–CT: (ac)—CS1; (df)—W21).
Processes 12 02000 g011
Figure 12. Internal fractures propagation. The green background represents the fractures, the blue represents the internal dissolution paths, and the intersection of the paths is the dissolution pores, displaying the distribution of pores in the 3D dissolution network of the fractures (micro–CT: (a)—CS1; (b)—W21).
Processes 12 02000 g012
Figure 13. Natural gas seepage simulation. The streamline represents the seepage path of CH4 in cores of the CS1 and W21 samples (micro–CT: (a)—CS1; (b)—W21).
Processes 12 02000 g013
Figure 14. Natural gas seepage simulation through fracture. The streamline in CS1 can approximately form a fracture surface, indicating that seepage is occurring along the fracture; the seepage streamline of W21 cannot form a complete fracture surface; the blue area in the middle represents fracture (micro–CT: (a)—CS1; (b)—W21).
Processes 12 02000 g014
Table 1. Physical properties of CS1 and W21 samples.
WellDepth (m)LithologyDimensions
(cm)
Permeability (mD)Porosity (%)CH4 Diffusion Coefficient (cm2/s)
CS13754.15Rhyolite type crystal tuff2.50.1112.67.66 × 10–6
W211399.00Crystalline tuff0.10.025.41.51 × 10–6
Table 2. Pore–throat structure parameter in CS1 and W21.
CT TypeSampleTotal ThroatMean Length (μm)Mean Radius (μm)Mean Area
(μm2)
Micro–CTCS119531.140.090.05
W2112591.080.070.02
Nano–CTCS14760.129.6 × 10−34.8 × 10⁻⁴
W213310.092.9 × 10−34.0 × 10⁻⁵
Table 3. Results of correlation analysis between parameters and simulated permeability coefficient.
ParameterRelevance (CS1)Relevance (W21)Order
Average throat radius0.710.771
Average throat length0.440.483
Average coordination number0.350.314
Average pore radius0.630.592
Disclaimer/Publisher’s Note: The statements, opinions and data contained in all publications are solely those of the individual author(s) and contributor(s) and not of MDPI and/or the editor(s). MDPI and/or the editor(s) disclaim responsibility for any injury to people or property resulting from any ideas, methods, instructions or products referred to in the content.

