Abstract
This study offers an innovative solution to address performance issues in the manufacturing process of garlic salt within a condiment-producing SME. A hybrid Lean/Six Sigma model utilizing a Surface Tension Neural Network (STNN) was implemented to control temperature and relative humidity in real-time. The model follows the Define, Measure, Analyze, Improve, Control (DMAIC) methodology to identify root causes and correlate them with waste. By integrating statistical tools, artificial intelligence, and engineering design principles, alternative solutions were evaluated to minimize waste. This document contributes to existing knowledge by demonstrating the integration of an STNN with the Lean/Six Sigma framework in condiment production, an area with limited empirical research. It underscores the benefits of advanced AI technologies in enhancing traditional process optimization methods. The STNN model achieved 97.31% accuracy for temperature classification and 97.37% for humidity, outperforming a Naive Bayes model, which attained 90% accuracy for both. The results showed a 3.15% increase in yield, saving 39.7 kg of waste per batch. Additionally, a 2.13-point improvement at the Six Sigma level was achieved, reducing defects per million opportunities by 551.722. These improvements resulted in significant cost savings, with a reduction in waste-related losses amounting to USD 1585 per batch. The study demonstrates that incorporating artificial intelligence into the Lean/Six Sigma methodology effectively addresses the limitations of traditional statistical methods. Significant improvements in yield and waste reduction highlight the potential of this approach, enhancing operational efficiency and profitability, and fostering sustainable manufacturing practices critical for SMEs’ competitiveness and sustainability in the global market.
1. Introduction
Process optimization is essential for SMEs to remain competitive. By adopting methodologies like Lean and Six Sigma, and leveraging advanced technologies such as artificial intelligence, SMEs can reduce waste, improve quality, and respond more swiftly to market demands [1]. While the smart factory, tailored for SMEs, offers a promising solution by integrating digital technologies and automation to enhance production efficiency and flexibility, its implementation can pose significant challenges. Substantial investments and specialized technical knowledge are often required, which may be a barrier for smaller businesses [2]. Artificial intelligence enables real-time analysis, helping SMEs identify patterns and make data-driven decisions. Implementing elements like sensors and data processing systems allows SMEs to gradually build a competitive advantage. For Badghish and Soomro [3] optimized processes not only increase profitability but also contribute to sustainable practices and a reduced environmental impact. As key players in the manufacturing sector, SMEs’ ability to optimize their processes is vital for economic and technological growth.
Seasonings play an essential role in food and cooking, enhancing flavor and aroma. Comprising spices and herbs, they are added to various dishes. The seasoning industry presents a dynamic and promising market, offering opportunities for producers, distributors, and consumers worldwide. The global condiments and spices market is currently expanding, estimated at USD 19.89 billion in 2024, and is projected to grow at a compound annual growth rate of 5.18% by 2029 [4]. India leads as the top producer and exporter globally, followed by China, the Netherlands, Spain, and Turkey [5].
According to Zhou and Xiangning [6], companies in this sector encounter numerous challenges in their production processes despite their considerable industrial potential. Many organizations focus on continuously improving their operations, aiming to optimize each stage of their processes. To achieve this, most companies utilize methodological approaches such as Lean and Six Sigma [7,8].
Lean methodology, originating from the Toyota Production System (TPS), emphasizes continuous improvement inspired by the Kaizen concept [9]. TPS centers on two core principles: jidoka (automation with human intervention) [10] and just-in-time (demand-driven production) [11]. TPS identifies seven types of waste that should generally be eliminated or minimized: overproduction, inventory, transportation, waiting time, over-processing, defects, and unnecessary movement [12]. This approach focuses on ongoing enhancements to help industrial organizations optimize processes, reduce costs, and eliminate waste sources and non-value-added activities, fostering continuous process flow. One of Lean’s fundamentals is maximizing profits with minimal capital and investment [13].
In the quest for ever-improving business performance, Six Sigma (SS) is a quality-control methodology that businesses use to significantly reduce defects and improve processes. Developed by Motorola in the United States, it is regarded as an evolution of classical quality theories and continuous improvement practices, such as statistical process control and total quality management [14]. SS incorporates elements from its predecessor theories, structuring them systematically to focus on customer satisfaction and value [15]. Within SS, the parts per million (PPM) metric quantifies process or product quality, indicating the expected number of defective units per million produced or processed. Additionally, statistical metrics like process yield (), index and Z.Bench, provide insights into process capability from different angles [16].
According to Escobar et al. [17], SS is supported by the DMAIC methodology. This methodology aims to increase process capability to a very low defect rate, of 3.4 defects per million opportunities (DPMO), making errors practically imperceptible to customers. Statistical methods are employed in each DMAIC phase to aid in generating ideas or solutions to problems [18].
Both continuous improvement strategies, with their shared rationale and objectives, are crucial for achieving customer satisfaction [19]. They are utilized across industrial and service sectors because they facilitate the implementation of the integrated Lean-Six Sigma (LSS) approach. Integration in LSS is essential, unlike Lean, which lacks a data-driven approach, SS incorporates data to improve process and performance [20]. LSS eliminates waste, reduces variability, and enhances efficiency in business processes [21].
Currently, small and medium-sized enterprises (SMEs) in the Chinese seasoning industry are leading users of the LSS methodology to improve process efficiency. Many of these companies are suppliers to large food companies, particularly in the United States [22]. However, as production volumes increase, operational challenges often arise. To address these challenges, researchers have adapted the LSS model for condiment production lines, leading to significant improvements [23].
For food SMEs, integrating Industry 4.0 technologies powered by artificial intelligence, alongside sustainable models, is essential [24]. By incorporating these innovations, businesses can enhance efficiency, lower costs, and reduce their environmental impact, thereby establishing a foundation for long-term competitiveness and sustainability in a progressively competitive market. Artificial intelligence drives and is part of significant and promising methodological advances in the food industry [25]. Artificial neural networks (ANNs) are the primary artificial intelligence methods that significantly influence the development of intelligent systems. Their ability to learn, generalize, and make decisions based on complex data allows them to contribute to various fields. LSS methodology has been significantly enhanced by incorporating ANNs. Their ability to learn from data, generalize patterns, and make decisions based on complex information has contributed to various fields [26]. These powerful models in LSS can identify root causes of problems [27], predict and prevent defects [28], optimize process parameters [29], automate repetitive tasks [30], and recognize patterns in data [31]. This integration boosts LSS’s ability to continuously improve efficiency and quality. It marks a significant milestone in the processing of big data generated by supply chain management in food companies [32]. The use of artificial intelligence in LSS provides an opportunity to optimize operations management, increase throughput, and minimize supply chain costs [33].
The importance of process optimization lies in its direct impact on a company’s profitability and competitiveness. In the food sector, this practice is crucial for reducing costs, enhancing product quality, and increasing customer satisfaction [34]. By implementing methodologies like LSS and artificial intelligence technologies, companies can identify and eliminate waste, shorten cycle times, and improve energy efficiency [35].
These enhancements not only yield positive economic results but also contribute to environmental sustainability. Process optimization can significantly reduce water and energy consumption, minimize waste generation, and lower the carbon footprint of operations [36]. In addition to its economic and environmental benefits, process optimization allows companies to be more flexible and respond more quickly to market demands [37].
Addressing this problem has far-reaching implications for both the company and the environment. Economically viable, this solution reduces costs and increases profitability through waste reduction and process optimization. Environmentally responsible, it decreases the carbon footprint and waste generation. Moreover, it positions SMEs as industry leaders by promoting sustainability and innovation, aligning with the growing demand for environmentally conscious products from consumers.
The SME in the case study has been implementing the DMAIC methodology across its processes. Consequently, it proposes applying this methodology to pinpoint the root causes of inefficiencies within the garlic salt production process. It is anticipated that accurately identifying these causes will facilitate the development of targeted and effective solutions.
The hypothesis proposes that utilizing an STNN will significantly improve process control accuracy, resulting in more precise regulation of temperature and humidity. This is expected to lead to at least a 5% reduction in defects, as measured by the DPMO metric, an increase in production yield, and a 10 kg reduction in waste per batch produced. Specifically, the implementation of an STNN is anticipated to reduce the variability of these critical parameters, thereby decreasing the rate of out-of-specification products from 8% to 3%. This enhanced process control will enable the company not only to increase the quantity of compliant products but also to optimize operational efficiency and reduce costs associated with waste generation.
The main objective of this article is the implementation of an improved Lean Six Sigma (LSS) DMAIC model integrated with an STNN to reduce the defect rate and increase the productivity rate in the garlic salt production process in an SME. The general objective will be achieved through the following three specific objectives: (i) achieve a reduction of at least 5% in the DPMO, in order to optimize the overall quality and consistency in the production of garlic salt; (ii) increase production yield, increasing the quantity of conforming products from 850 to 925 units per batch to increase the efficiency and effectiveness of the production process; and (iii) reduce losses by achieving a reduction in the waste generated during the production process by 10 kg per batch to contribute to cost savings and promote more sustainable manufacturing practices.
The methodology proposes a design solution utilizing an STNN to classify whether the mill process temperature and product relative humidity are within specified parameters. Surface tension refers to the property of a liquid that allows it to resist an external force. This force creates a thin film on the surface, allowing objects to float on top. An STNN is a type of artificial neural network characterized by its accuracy, robustness, and scalability. To optimize the convergence of solutions in classification processes, the neuron’s output is calculated by a surface tension function [38]. STNNs have demonstrated effectiveness in various tasks like image recognition, anomaly detection, and control systems.
1.1. Contributions and Limitations of the Study
This study proposes a hybrid model that leverages statistical tools, artificial intelligence, and engineering design principles to improve the performance of the garlic salt manufacturing process in an SME condiment producer. This model will allow for identifying the root causes of problems in the production process and optimize efficiency by reducing losses associated with these problems. The study offers four main contributions:
- Updating technological requirements and identifying the shortcomings of each machine involved in the process.
- Use of artificial intelligence to monitor temperature and humidity losses in this process.
- Providing a practical guide to increase productivity in the seasoning industry, with economic benefits.
- Identifying the barriers faced by SMEs in the condiment industry for the adoption of technologies.
Data quality is a critical factor in any artificial intelligence model, including the neural network employed in this study. Low-quality data, such as data with noise, measurement errors, or biases, can lead to overfitting or underfitting of the model, compromising its ability to make accurate and reliable predictions. In this specific case, while the model proved effective for garlic salt manufacturing, its results may not be as robust when applied in environments with different data quality or characteristics.
Furthermore, the use of small production batches limits the amount of data available to train and validate the model. This can result in a model that is highly optimized for the specific conditions of the study but may not generalize well to larger-scale production or different industries. The inherent variability in manufacturing processes in larger batches might not have been adequately captured, potentially leading to an overestimation of the model’s effectiveness when faced with more diverse conditions or greater variability in input data.
On the other hand, relying on data from a specific and controlled environment, as in this study, limits the model’s applicability to a broader range of industrial contexts. The lack of data diversity may also hinder the model’s ability to handle different types of variability encountered in other industries, such as variations in materials, machinery, or environmental conditions.
1.2. Related Literature
Different authors have proposed methods for improving supply chain efficiency using LSS/ANN methodologies. For instance, Ramakrishnan [39] proposes a method to evaluate automotive supply performance. This method combines ANNs for predicting demand uncertainty with LSS for evaluating quality factors. The author uses an ANN to forecast future demand by analyzing historical data and identifying complex patterns. Furthermore, he employs the Levenberg–Marquardt Tabu Search optimization algorithm to achieve optimal solutions. The primary finding of this study is that the integration of ANN and LSS can substantially enhance demand forecasting precision and risk mitigation within the automotive supply chain, resulting in increased operational efficiency and elevated product quality. However, the research revealed a knowledge gap concerning the lack of extensive empirical validation of this model across other industrial sectors. While the approach has demonstrated effectiveness in the automotive domain, its applicability and generalizability in diverse industrial contexts remain relatively unexplored. To ascertain its versatility and efficacy in environments with varying supply chain dynamics and challenges, it would be imperative to test and refine the model in various industries.
Perera et al. [34] present an innovative methodology that utilizes machine learning techniques to identify and classify the critical success factors (CSFs) of the LSS approach. This methodology employs a deep neural network model to categorize CSFs into four dimensions: Leadership engagement, LSS culture, LSS project initiation, and LSS execution. The model, trained and validated using natural language processing techniques, achieved a 95.95% accuracy in classifying CSFs. The main contribution of this study lies in the creation of a conceptual model that organizes and prioritizes CSFs in a systematic manner. This detailed classification facilitates the understanding and application of LSS by enabling organizations to identify and prioritize the most relevant factors for the success of their projects. However, further empirical validation of the model is required. Although the preliminary results are promising, it is necessary to assess its performance in different organizational contexts and project types. Future research could explore the influence of contextual variables, such as company size, industry, and the maturity of LSS implementation, on the relationship between CSFs and project success.
Vijayakumar and Suresh [40] propose a methodology to curtail cycle time within the manufacturing sector by synergizing Lean principles and deep neural networks optimized with the Black Widow algorithm. The methodology commences by mapping the organization’s current state through value stream mapping, thereby identifying and eliminating superfluous activities within the production process. Subsequently, a deep belief network optimized with the Black Widow algorithm is utilized to forecast and minimize cycle time. Simulations conducted demonstrate that the proposed model achieves a 98% accuracy rate and a substantial reduction in cycle time, leading to maximum profits. The primary conclusion is that this integrated approach not only enhances production efficiency but also furnishes a potent tool for decision-making within the manufacturing industry, ensuring effective waste elimination and process optimization. However, a knowledge gap is identified in the necessity for more extensive empirical testing across diverse industrial sectors to evaluate the generalizability and adaptability of the proposed model. While the study validates the approach’s effectiveness in the specific context of manufacturing, the absence of practical validation in a variety of industrial settings restricts the model’s applicability to other sectors with distinct production dynamics and challenges.
Abed et al. [41] propose a methodology that combines deep Lean principles with neural networks and the Internet of Things to enhance process reliability in bathtub manufacturing. The methodology adheres to the DMAIC approach, commencing with the identification of the underlying causes of defects associated with uneven coating thickness stemming from bubbles in the bathtub painting process. A neural network model is employed to forecast and regulate the movement of these bubbles, leveraging real-time data furnished by IoT sensors. The outcomes demonstrate a substantial reduction in defects and losses, resulting in greater workflow stability and an overall improvement in process reliability. The primary conclusion is that the integration of advanced technologies such as the Internet of Things and neural networks within a deep Lean framework enables more effective and predictive control of manufacturing processes, optimizing both product quality and operational efficiency. However, although the study focuses on a specific case of bathtub manufacturing, its applicability in other sectors or industrial processes with different production dynamics is not evaluated. Furthermore, the study primarily relies on simulations and controlled experiments, raising the question of how the model would perform in large-scale production scenarios, where variabilities are more intricate and less predictable. Additional research conducted in diverse industrial environments would be essential to validate the efficacy and adaptability of the proposed model across a broader spectrum of applications, leveraging real-time data furnished by IoT sensors. The outcomes demonstrate a substantial reduction in defects and losses, resulting in greater workflow stability and an overall improvement in process reliability. The primary conclusion is that the integration of advanced technologies such as the Internet of Things and neural networks within a deep Lean framework enables more effective and predictive control of manufacturing processes, optimizing both product quality and operational efficiency.
Uluskan [42] employs ANNs as a quality loss function within SS projects. The methodology entails comparing four distinct quality loss function models: Taguchi’s parabolic loss function, the maximum likelihood cost function, logistic regression, and ANNs. An industrial dataset was utilized, comprising energy consumption rates of refrigerators and thermal camera readings surrounding their compressors. The research applied Monte Carlo cross-validation to generate precision-recall curves, enabling the evaluation and comparison of each model’s effectiveness. The main finding reveals that ANN outperforms the other three methods in terms of precision and the capability to identify refrigerators that do not adhere to energy specifications. The main conclusion is that ANNs provide a potent and adaptable tool that could substantially enhance the Six Sigma toolkit by more accurately addressing the nonlinear and complex relationships characteristic of industrial data. Nevertheless, while ANNs demonstrate significant promise in this specific instance, additional research is required to assess their applicability and efficacy in other industrial sectors and Six Sigma projects characterized by diverse data quality and complexity requirements.
Su et al. [43] propose the DAMIC method to prevent defects in the conventional design of portable computers that exhibit structural durability issues within the optical disk drive. The methodology incorporated optimization techniques such as response surface methodology and computational intelligence methods, including ANN and genetic algorithms, to identify and optimize the critical factors influencing the compression strength of the module. The primary outcome of the study was a substantial enhancement in compression strength and a reduction in product weight, resulting in an increase in product performance from 84.27% to 100% and a decrease in material costs. It was demonstrated that the synergy of ANN and genetic algorithms surpassed traditional statistical methods, such as response surface methodology, in terms of precision and efficiency in optimizing design parameters. However, the generalizability of the results to other product designs or electronic components remains unexplored, restricting the potential for widespread adoption of this approach within the technology industry.
Maged et al. [44] demonstrated the potential of ANNs when used throughout the DMAIC phases. These authors, using recurrent ANNs and genetic algorithms, enhanced the quality of electronic component manufacturing by optimizing complex processes. This innovation surpassed the limitations of SS, enabling deeper and more dynamic data analysis. The results included improved board thickness and uniformity, and reduced costs. The authors suggest that ANN could replace traditional statistical analysis due to their ability to handle large datasets more effectively. Furthermore, they assert that integrating machine learning into SS not only accelerates decision-making and improves accuracy but also transforms the process into a self-regulating system, which is crucial in the Industry 4.0 era. Although the proposed approach is innovative, more empirical research in other contexts is needed to fully validate it.
Mishra and Rane [45] propose an approach based on SS and data analysis to predict and improve the quality of cast iron parts. The methodology follows the DMAIC approach and relies on logistic regression models to identify the root causes of defects in foundries. The authors conducted a Delphi study to assess the need for a prediction model and collected data from 26 production batches to build and validate their model. The study resulted in a 99% reduction in casting defects, a significant improvement in on-time delivery, and substantial cost savings. The integration of SS with analytical models can lead to significant improvements in the quality and efficiency of production in the iron casting industry.
The predictive model was validated primarily in a controlled environment and with a limited number of batches (11 products in 7 organizations). Although the results are promising, additional studies with a larger number of batches are needed to confirm the generalizability of the model and its applicability to other manufacturing processes. The research could be enhanced by incorporating simulation models, such as Monte Carlo, to improve the accuracy of predictions and explore the impact of process parameter variations.
Studies demonstrate the potential of LSS/ANN in manufacturing, but its specific application in the food industry, particularly among SMEs producing condiments, remains limited. Given the critical role of SMEs in the economy of developing countries, closing these gaps is essential. Implementing technologies such as STNNs in condiments production can significantly enhance standardization, reduce waste, and improve quality, thereby bolstering SME competitiveness and fostering more sustainable and efficient production.
The reviewed articles emphasize the need for broader validation of ANN integration with LSS-based models in various industrial sectors. While artificial intelligence has garnered interest in other sectors, the lack of large-scale empirical studies in diverse production environments restricts the generalizability of these approaches. To overcome these limitations, it is recommended to broaden the application of these models to different industrial contexts and conduct comparative studies to assess their effectiveness and adaptability. This will ensure their applicability across a wider range of manufacturing processes.
The originality of this study lies in its innovative combination of STNNs and LSS to develop a hybrid model for real-time process optimization. Unlike previous research, which focused on predicting success factors or theoretical approaches, this work offers a practical solution for reducing defects and waste in dynamic industrial settings. The application of the model in a food industry SME provides a relevant case study, showcasing its potential to transform process management across various sectors.
The remainder of this document is organized as follows: Section 2 presents the methodology used in this study, which was employed for waste reduction in the condiment production area. Section 3 presents the results of the case study, obtained from processing the data collected during a pilot period. Section 4 discusses the results. Finally, Section 5 presents the conclusions of the study and describes some future research topics.
2. Materials and Methods
While LSS is a robust framework for continuous improvement, its effectiveness can be limited in environments with variable and challenging real-time operating conditions, such as garlic salt production where temperature and humidity are critical to process stability. These fluctuations can adversely affect product quality, and traditional LSS methodologies may not be sufficiently responsive or precise to adapt to such dynamic changes.
Integrating an STNN into the LSS framework addresses the need for enhanced adaptability and precision. Unlike conventional LSS statistical tools that necessitate historical data analysis prior to implementing improvements, STNNs enable real-time prediction and parameter adjustment. Additionally, STNNs analyze data in real-time to detect complex patterns and anticipate how process fluctuations will affect production, automatically adjusting to minimize defects.
In accordance with Colombian data protection law 1581 of 2012 [46], the data used, particularly those related to the company’s operations, are handled with strict confidentiality. All sensitive information is securely stored and used exclusively for process optimization purposes. Regarding artificial intelligence, transparency and understanding of the model’s functioning are crucial for management. The proposed model integrates ethics approved by administrative management, focusing on mitigating biases during training to ensure reliable results. Given its exclusive use of operational data and the absence of human or animal subjects, ethical approval is not required. This guarantees the model’s adherence to AI ethical standards, preserving the integrity of industrial data.
Google Cloud IoT was selected as the data storage and analysis platform. Its capacity to efficiently handle large datasets makes it well-suited for real-time data processing and future scalability.
A data collection system was built using an ESP8266 Wi-Fi module compatible with Arduino and a DHT-11 sensor to collect temperature and humidity data. Electronic guides were used to connect the hardware to Google IoT. The project is divided into two main files: GARLIC8266_GC, which defines the pins and logic for sending data to the cloud, and secrets.h, which stores the credentials needed for the connection, such as the project ID and service key. The data is sent to Google Cloud through the MQTT topic espGARLIC8266_GC/pub, which indicates that the messages come from the ESP8266 device named GARLIC8266_GC and are of type “pub”. The messages are monitored through an MQTT test client configured to receive messages on this topic.
For unstructured data storage, DynamoDB was selected due to its flexibility in handling data without a predefined schema. This setup enabled seamless integration from data collection to real-time analysis, which is essential for continuous monitoring of the manufacturing process.
The STNN programming was implemented following the methodological approach proposed by [38]. Temperature and humidity data collected by the DHT-11 sensor were fed into the pre-trained STNN. The neural network generated surface tension predictions based on the input values, allowing for model validation and providing the potential to use this information to more precisely control the temperature and relative humidity of the garlic salt product in real-time.
It is important to note that the company under study was already implementing the DMAIC methodology in its processes and decided to continue using this approach based on the direct recommendation of the management. Therefore, this study utilizes the DMAIC methodology, as outlined in [43], which has been adapted for waste reduction in the garlic salt production process. This adaptation connects the objectives, activities, and tools of each DMAIC stage to identify factors impacting process performance. Consequently, improvement actions can be proposed to optimize the process. Table 1 summarizes the adaptation of the DMAIC methodology.

Table 1.
Summary of DMAIC methodology.
2.1. Surface Tension Neural Network for Classification
At stage 4, an STNN was implemented as a Poka-Yoke to ensure the temperature of the mill, and the relative humidity of the garlic salt product remain within established control limits. The STNN continuously receives process data from a computer equipped with an Intel® Core™ Ultra 5 Processor 125H, 512GB SSD, and 16 GB RAM.
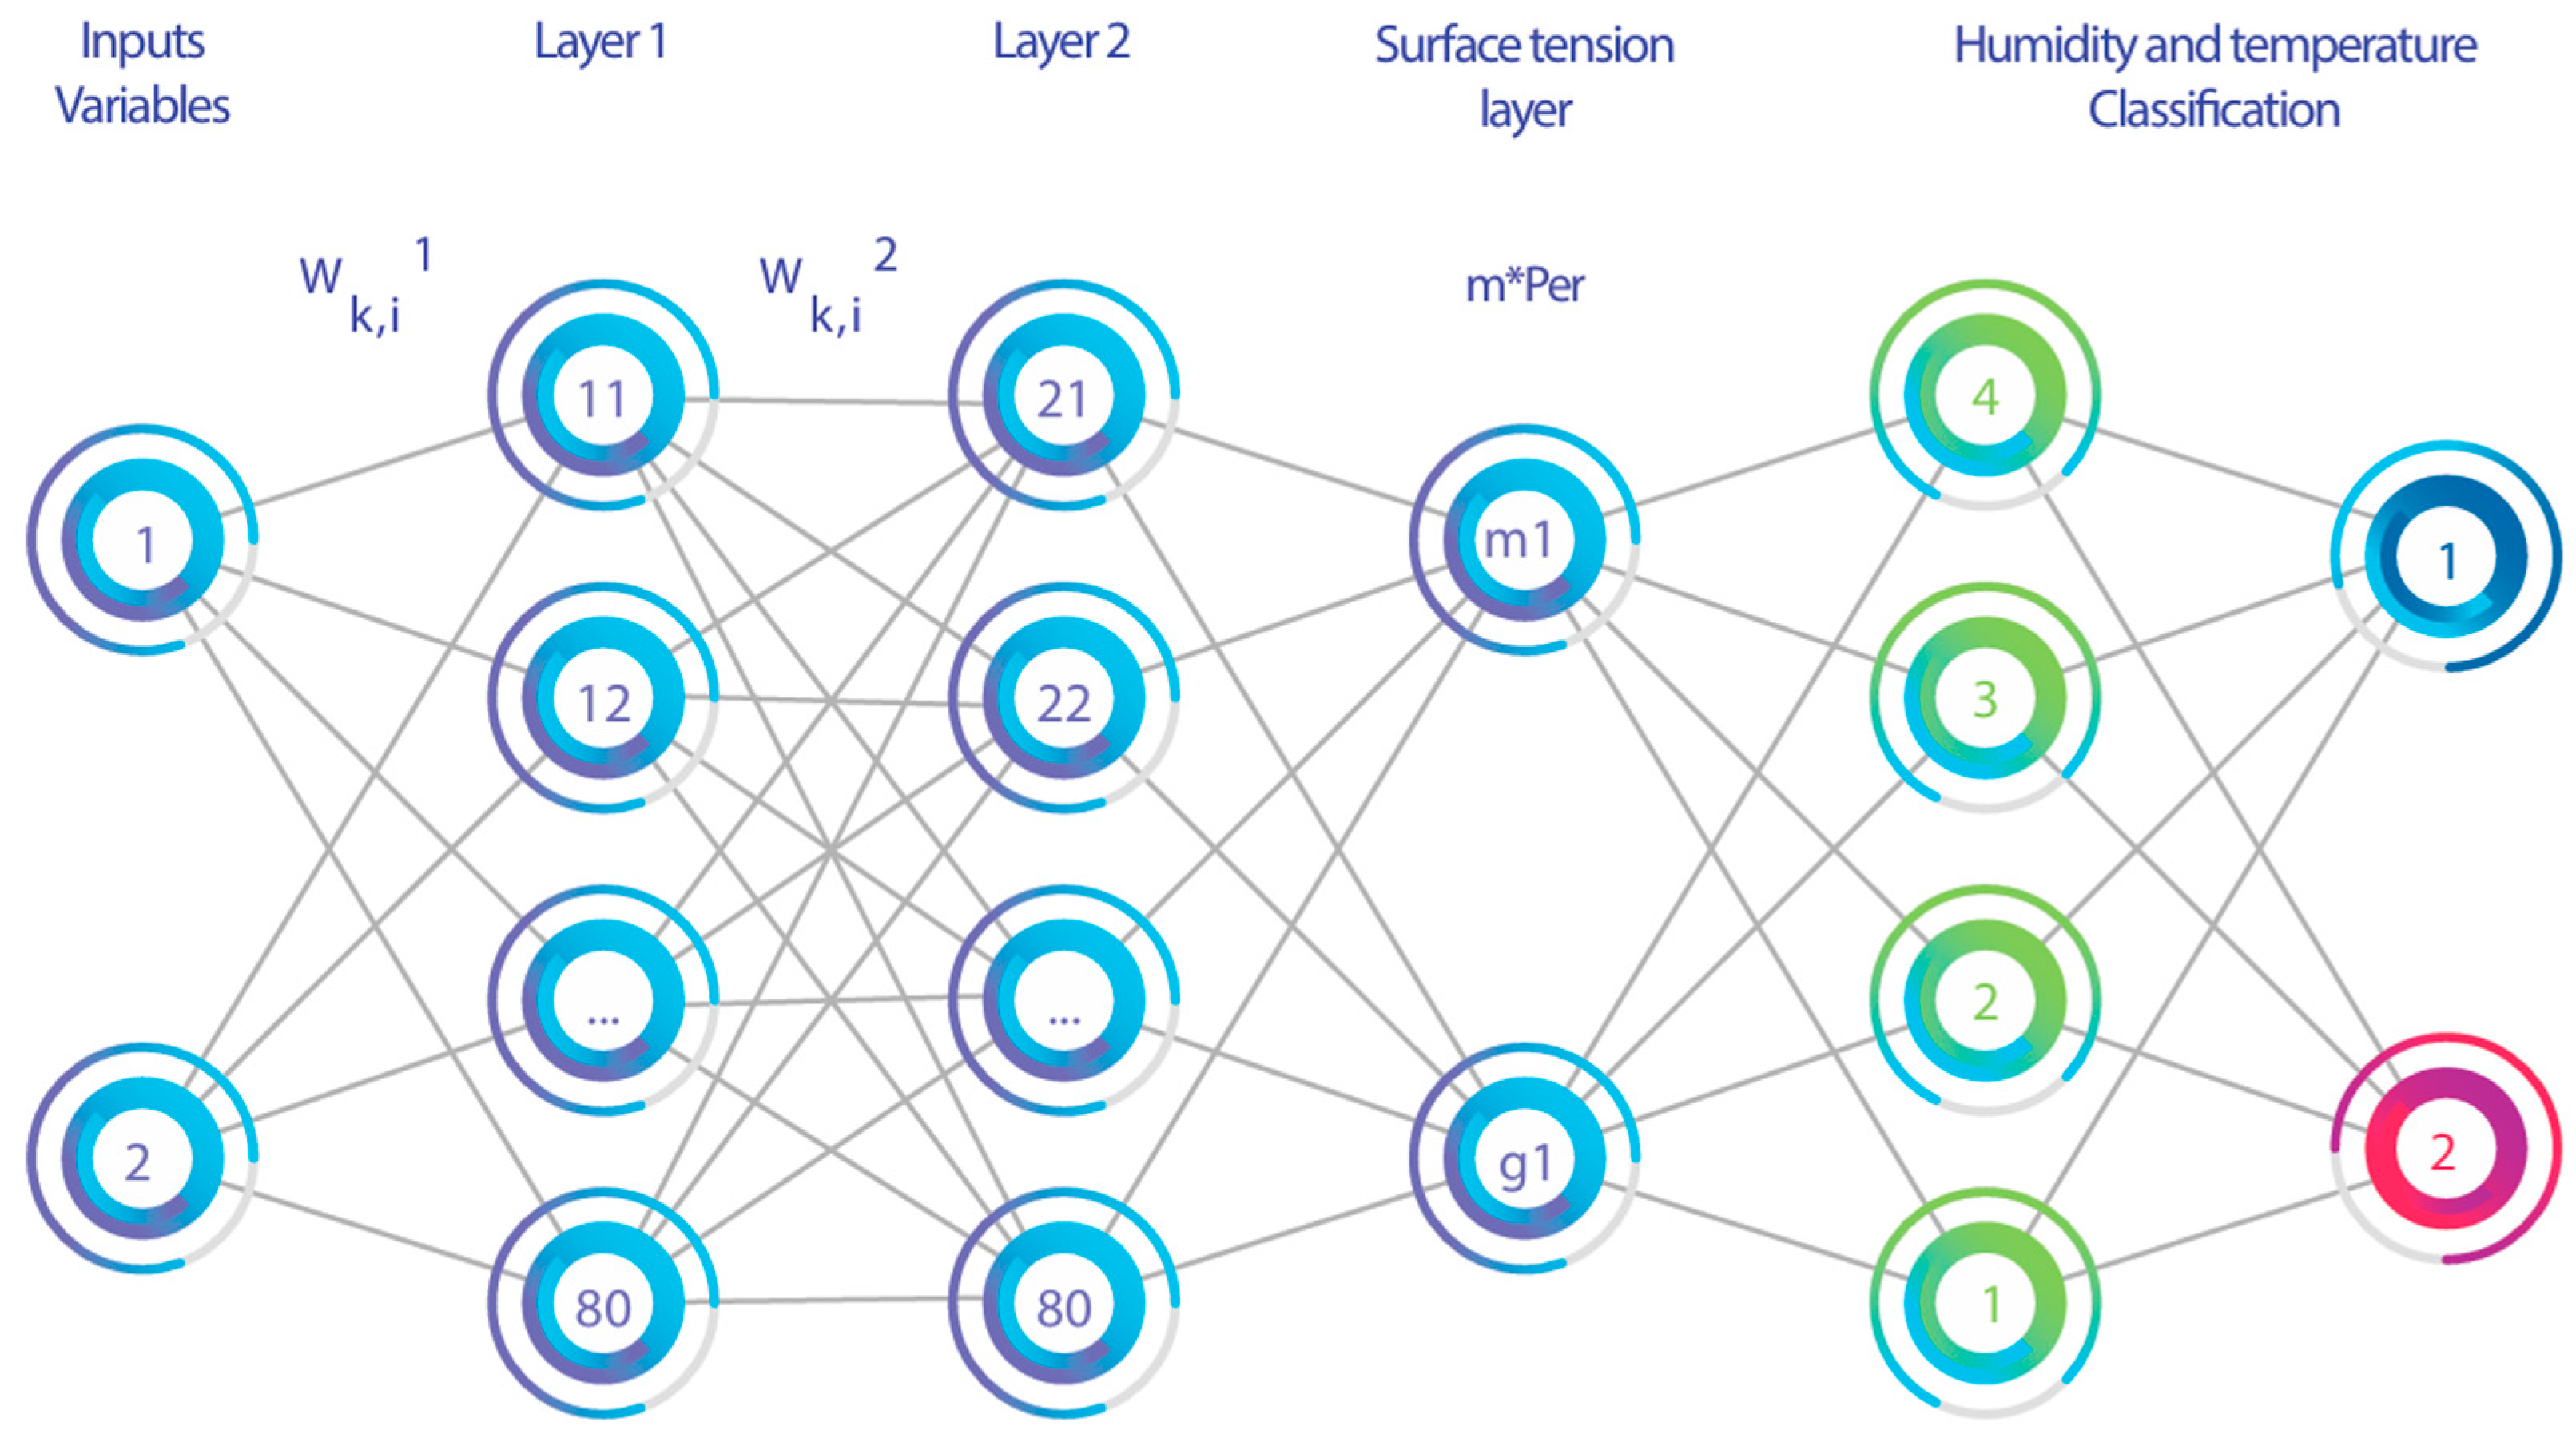
At the start of the process, the neural network receives two inputs: temperature and humidity. After processing this data, the network classifies whether the product has reached the correct temperature and the required humidity (output) (Figure 1).

Figure 1.
STNN adapted to the grinding process [38].
STNNs draw inspiration from the concept of physical surface tension [47], described in equation 1, to improve the neural network classification process. Conceptually, surface tension refers to the energy required to expand a liquid’s surface area. This property arises from the cohesive forces between the liquid’s molecules, creating a tendency for the surface to contract and minimizing its area [48].
where represents surface tension, which measures force per unit length or energy per unit area. In the context of the model, γ represents the humidity and temperature rating, F is the force needed to prevent a side from slipping, L represents the length of the moving side, and the ratio of 1/2 is due to the film having two surfaces [49]. This model essentially calculates the force a liquid exerts on an object’s surface based on the object’s perimeter and the liquid’s surface tension. If an object’s weight surpasses this force, the object will sink.
This theory provides a key advantage by accounting for the non-linear nature of the input variable (IV) and the categorical nature of the dependent variable. The drying process is essential for transforming fresh garlic into powder. According to El-Mesery et al. [50], the optimal temperature for drying garlic is between 60 °C and 70 °C. Initially, the moisture content of fresh garlic is quite high, typically between 60% and 70%. The goal of the drying process is to reduce this moisture content to a level that ranges between 4% and 6% while maintaining the relative humidity of the environment between 30% and 50%. This combined approach leads to a deeper understanding of the relationship between the two variables, thus leading to a more accurate and effective classification process.
2.1.1. STNN Parameters
The Figure 1 parameters are initialized using a random initialization algorithm from Nguyen–Widrow [51]. This approach leads to a more efficient distribution of active neurons across network layers, facilitating faster training and lower learning error rates from the outset.
2.1.2. STNN Training
ANN training is performed in five stages.
- Calculation of the output of layers 1 and 2: During each training iteration, a pair of IVs from the training set, (represented by vector ) is fed into the network. This vector is processed through the first layer, which consists of 80 neurons. Each neuron in this layer has 20 associated parameters called weights. These weights are used to multiply each variable of the input vector . The result of each multiplication is then summed with a bias term , specific to each neuron. The sum of these multiplications and the bias represents the partial output of the neuron in layer 1.
Figure 1 architecture consists of three standard hidden layers, each containing 80 neurons. A fourth layer is then added (described by Equations (2) and (3)) to introduce the concept of surface tension into the network. This procedure can be described by Equations (4) and (5). is the result of each neuron .
where is the variable i of the temperature and humidity data entering the network; is the weight of neuron in the layers, which is multiplied by the variable i; and is the bias value in neuron in the layers, which is added to the total of each result. The 80 outcomes are represented in the vector , where corresponds to the hyperbolic tangent transfer function. This function is continuous in this process of moisture and temperature pattern recognition in mills. The exponential function is defined in Equation (4) and is the final output of layer 1 (Equation (5)). This layer, like the previous one, has 80 neurons, each with a single output. Layer 2, with the same number of neurons and processes, also employs the hyperbolic tangent transfer function.
- ii.
- Layer 3 output calculation: The 80 outputs from layer 2 are fed into layer 3, which contains two neurons.
The output variables of this model are mass and perimeter. These parameters, derived from the surface tension equation, are used instead of the neural network’s sigmoid function. This substitution leads to both reduced variability and dimensionality of the data, improving classification accuracy and reducing the final error. To ensure the response range remains consistent, a transfer function is not applied.
- iii.
- Surface tension layer output calculation: the variables mass (m) and perimeter (Per), obtained in layer 3 and defined in equation 10, are fed into the final layer, known as the surface tension layer. It has four neurons, each capturing the influence of humidity and temperature. The contribution of each neuron is combined in a power balance, as described by Equation (11). is the transfer function.
are the surface tension values for two liquids: ethanol 22.1 mN/m; and ethylene glycol 47.7 mN/m. These values are compared to the surface tension of water at 20 °C, which is 72.8 mN/m [47]. In this model, which analyzes the risk of surface tension breakdown, this reference value is linked to variables like temperature and humidity. Lower surface tension values, such as that of ethanol, indicate lower risk, while higher values, like ethylene glycol, correspond to higher risk levels.
In this context, if a variable like temperature or humidity becomes very high, the risk also rises. The parameters in the new surface tension neuron will be equivalent to having experienced both ethanol and ethylene glycol surface tensions. Theoretically, at this point, the liquid tension will be broken, and the risk classification will be outside the appropriate study parameters, representing a high risk and indicating a high-risk situation.
The transfer function was used due to its behavior, considering the following limits.
Thus, when the force exerted by the weight is greater than that exerted by the liquid, the surface tension breaks. When this occurs, tends to be one, and when it does not, the value of tends to be zero.
The correct outputs for the two types of risk related to temperature and humidity are expressed in (17).
Risk 4 breaks both surface tensions, while risk 1 only breaks the first surface tension.
- iv.
- Backpropagation error: The four outputs contained in are compared with the response, which the neural network should have given, thus calculating the root mean squared error (RMSE).
- v.
- Statistical measure for the classification test: The accuracy metric was used to evaluate the algorithm, which provides the total accuracy percentage of the neural network.
2.1.3. Comparison with Other Techniques
The performance of the neural network model, utilizing humidity and temperature data, was evaluated for risk level classification. We compared its effectiveness to the Naive Bayes (NB) algorithm. The NB algorithm, a probabilistic method, underwent a three-stage evaluation process to improve its performance: (1) data cleaning and preprocessing, (2) variable reduction using a genetic algorithm, and (3) attribute filtering. The NB algorithm estimates the probability that a data point falling outside the established control limit () for a specific process, given known humidity and temperature values (…, ).
where is the operator that selects the class c (temperature and humidity) that maximizes the expression; p(C = c) is the prior probability of class ; is the product of the conditional probabilities of observing each feature given that the class is c; and represents each feature of the temperature and humidity data being classified. is the i-th feature and is the observed value of that feature in a particular instance in the process, and is the probability that the temperature and humidity variables take the value given that the class is . This probability was estimated from the training data.
2.2. Case Study
This study analyzes the case of an SME that experienced a notable increase in demand for its product during 2020. Compared to 2019, demand rose by 49%. The company managed to optimize its production efficiency, achieving an average yield of 94.22%. The remaining 5.78%, corresponding to an average of 77.5 kg of waste per batch produced, represents a commercial loss of USD 325 per batch.
The case proposes the use of LSS, assisted by the neural network schematized in Figure 1, to optimize the manufacturing process of garlic salt seasoning. In the food industry, the production of seasonings like garlic salt is an important economic activity. Garlic salt, a popular and versatile condiment, is made by finely grinding dried garlic into a granulated powder and then mixing it with salt in specific ratios [52].
The company directly imports select Chinese garlic bulbs, which it then sells wholesale nationally in 50 kg packages. The garlic salt production process involves nine steps as follows: selection, separation, cleaning, peeling, crushing, dehydration, grinding, sieving, and packaging. The process can be described as follows: upon receipt of the raw materials, the garlic is received in accordance with established quality standards. The garlic then undergoes cleaning and disinfection to eliminate impurities, followed by the mechanical removal of peels. Next, the garlic is sliced to facilitate processing, and the slices are then dried to extend their shelf life. The crushed garlic is subsequently ground into a fine powder, which is mixed with salt in the desired proportion. Finally, the product is packaged in appropriate containers for storage and distribution.
3. Results
The results of the case study are summarized in the five stages of the DMAIC methodology.
3.1. Stage Define
The current yield of the garlic salt production process is 92%, which has been identified as a critical area for improvement. The project aims to increase this yield to 95%. To gain a deeper understanding of the existing process and identify customer needs, SIPOC and VOC tools were employed. Finally, the IPO method was used to map the relationships between the process inputs and outputs (Table 2).
Table 2.
Process inputs and outputs.
3.2. Stage Measure
To define the performance baseline, the work team used the information from Table 1 and a matrix of critical variables. Each team member then conducted an individual evaluation of each variable.
To establish the project baseline and focus on the problem, the team prioritized the variables using the Scoring method, a simple approach within multi-criteria decision theory [53]. Equation (22) demonstrates how the weighted sum function value was calculated.
where is the value of the weighted sum function for IV ; represents the weight or importance of output variable ; and is the value of output variable for IV .
To prioritize performance improvements for garlic salt, a rating scale of 1 to 10 was used to assess two types of variables, IV and process variable (PV). As summarized in Table 3, a score of 1 indicated no impact, 3 minimal impact, 5 moderate impact, 7 significant impact, and 10 total impact.
Table 3.
Critical variable evaluation matrix.
Analysis of Table 3 identifies relative humidity and process technology as the most impactful IVs on garlic salt product yield. Relative humidity directly influences the production process, while technology is crucial for optimization. Among PVs, husk weight, a residue from sieving, also significantly impacts yield. Excessive moisture, outdated technology, and high husk weight can all negatively affect final product quality.
To determine moisture content, each 10 kg sack of garlic salt underwent a loss-on-drying test. Ten batches of 10 kg were sampled to assess performance. The critical variables, detailed in Table 4, were assessed, and an average yield of 92% was observed, although the target yield was 95%.
Table 4.
Sieving process yield.
3.3. Analysis Stage
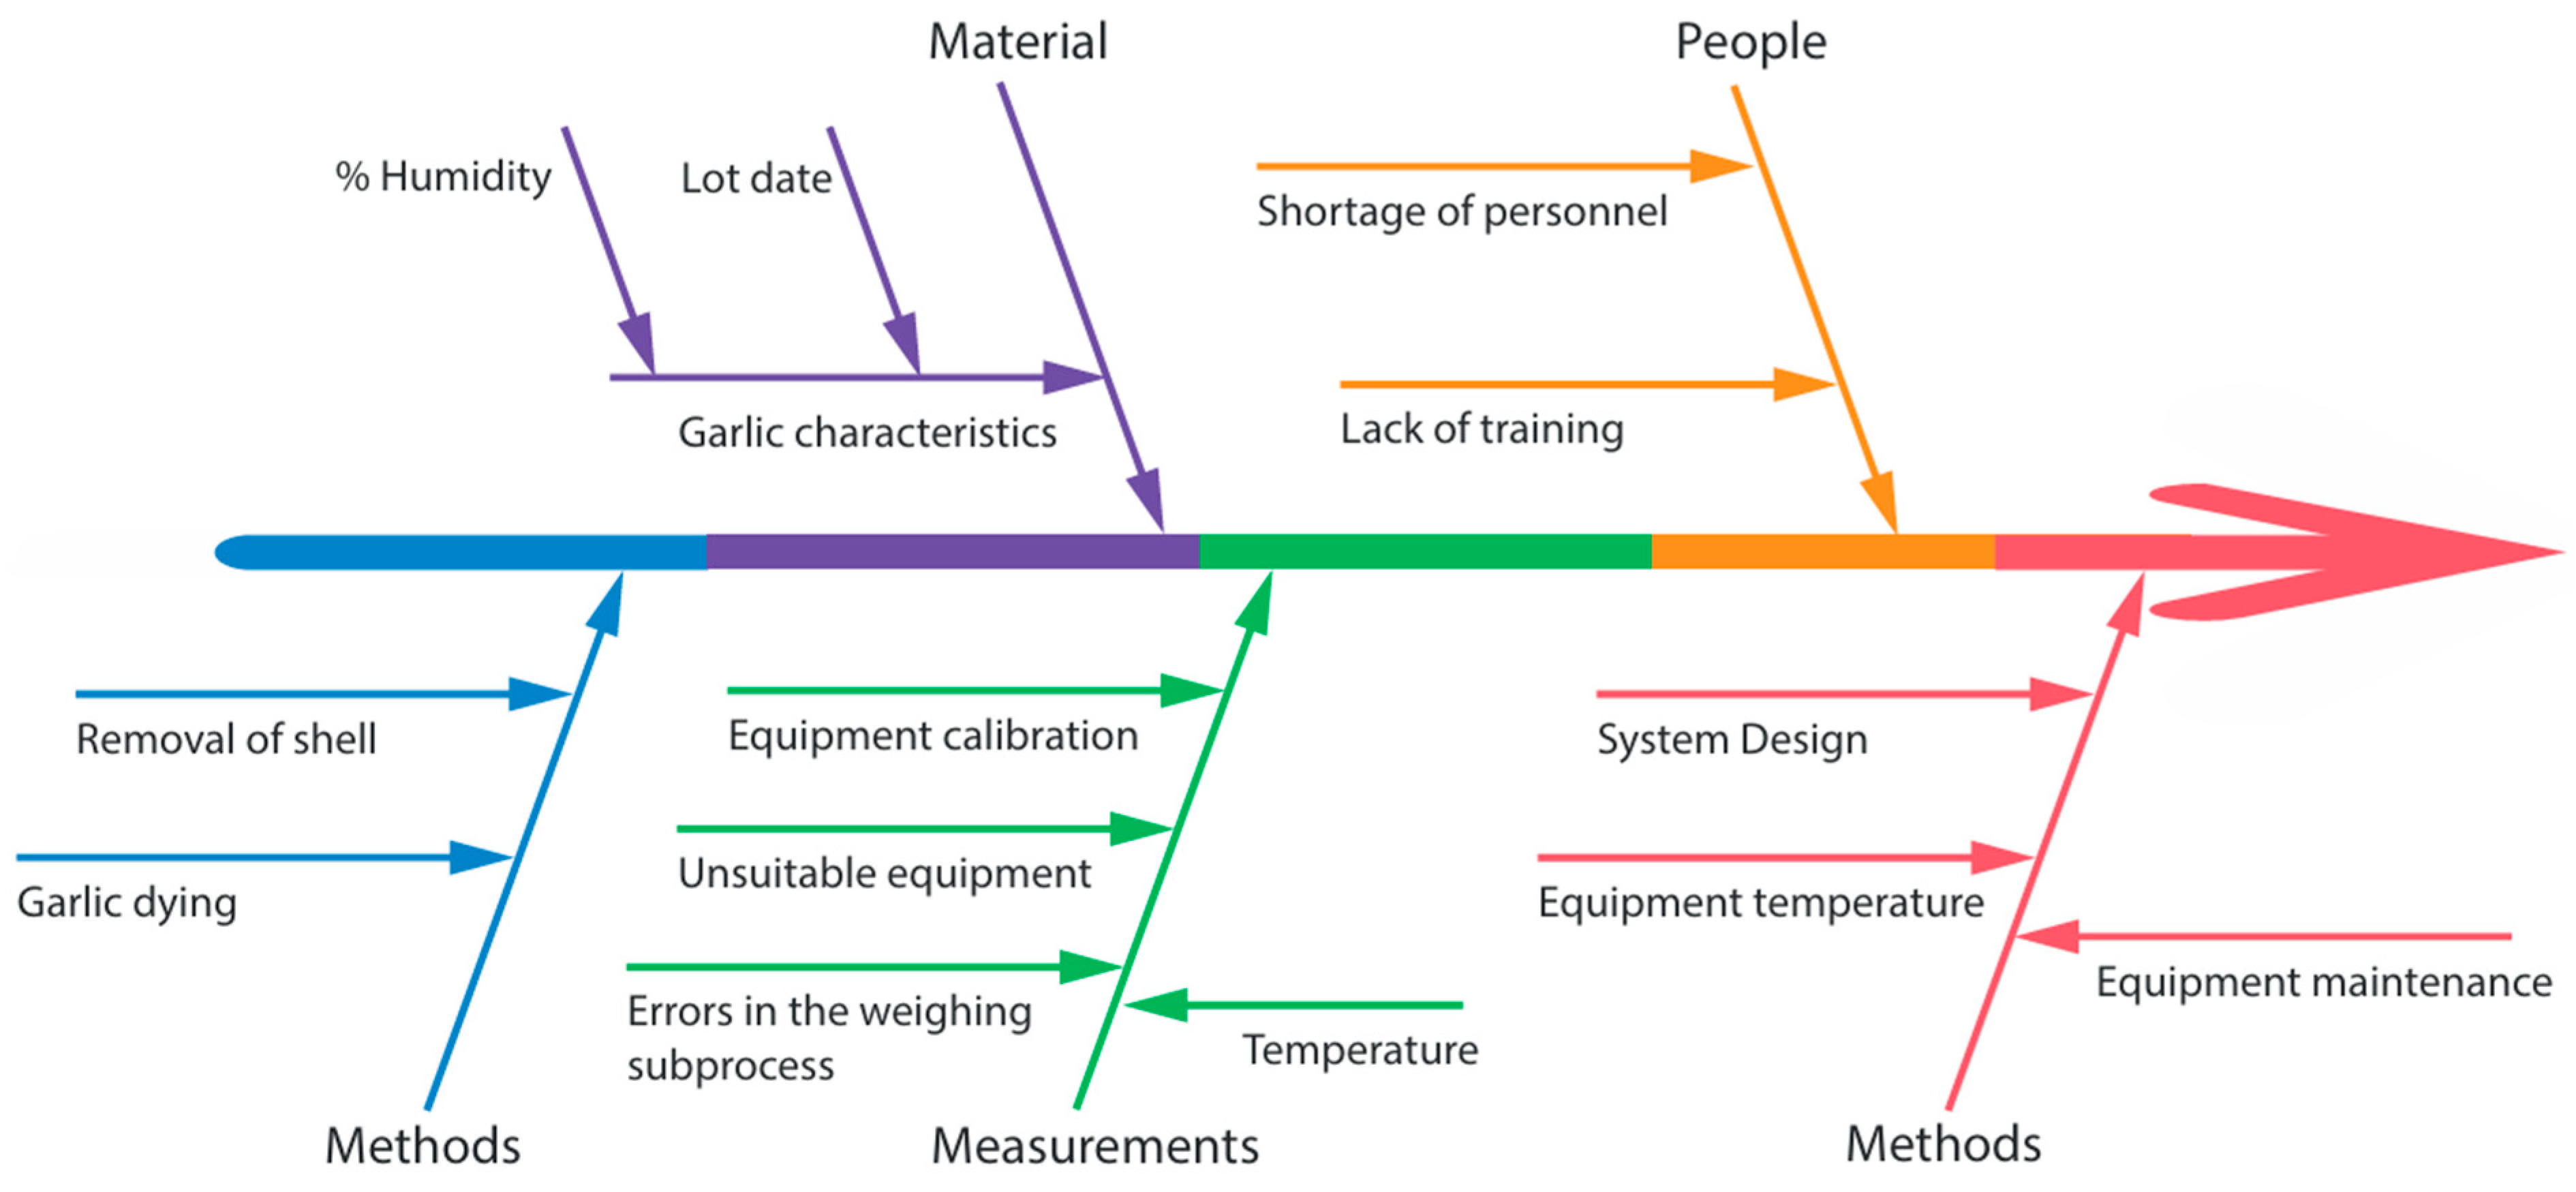
Brainstorming identified potential causes contributing to the problem under analysis. This information was used to develop the cause-and-effect diagram presented in Figure 2.
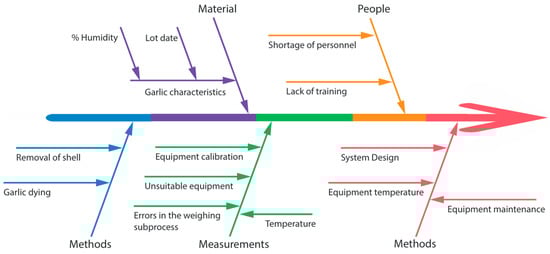
Figure 2.
Cause–effect diagram.
According to Table 5, the Machinery category presents the greatest source of variation. Within this category, the variables with the highest valuation were the equipment temperature and the milling system.
Table 5.
Variables/impacts matrix.
In accordance with customer requirements, the upper and lower specification limits were set at 1 and 0.95. Statistical tests, summarized in Table 6, were employed to evaluate data normality and determine the process’s current performance capability.
Table 6.
Characterization of the process.
Based on Table 6, the sigma level is −1.91, indicating a defect rate of 97.22%. This value estimates the percentage of parts from the process that fall outside the specification limits. Actual capability refers to what the customer truly experiences. The mean process yield was 91.8%, with a standard deviation of 0.16%.
3.4. Stage Improve
Proposed solutions were designed to address identified causes, taking into account project constraints, which include (1) demand fulfillment—it is essential that the proposed improvements do not impact the fulfillment of the demand for the Garlic Salt product, as its production is limited to one batch per month; (2) execution time—the time required to implement the improvements should not exceed the planned time for the production of the corresponding batch for the period, as there are other products waiting on the production line; (3) quantity to be produced in the lot—as in the measurement stage, 10 batches of 10 kg each will be produced to collect the necessary data for statistical analysis; and (4) human resources—there is only one operator available to carry out the improvement proposals.
The proposed solution alternatives focus on prioritizing the identified causes, detailed in Table 7.
Table 7.
Proposed solution alternatives.
The choice of the design and implementation alternative is based on an analysis of the criteria detailed in Table 8. These criteria were evaluated using a weighted sum method [53].
Table 8.
Evaluation of the design alternatives.
According to Table 8, in the evaluation of the prioritization criteria, improvement alternative 1 obtained a score of 5.1, surpassing improvement proposal 2.
3.4.1. STNN Model
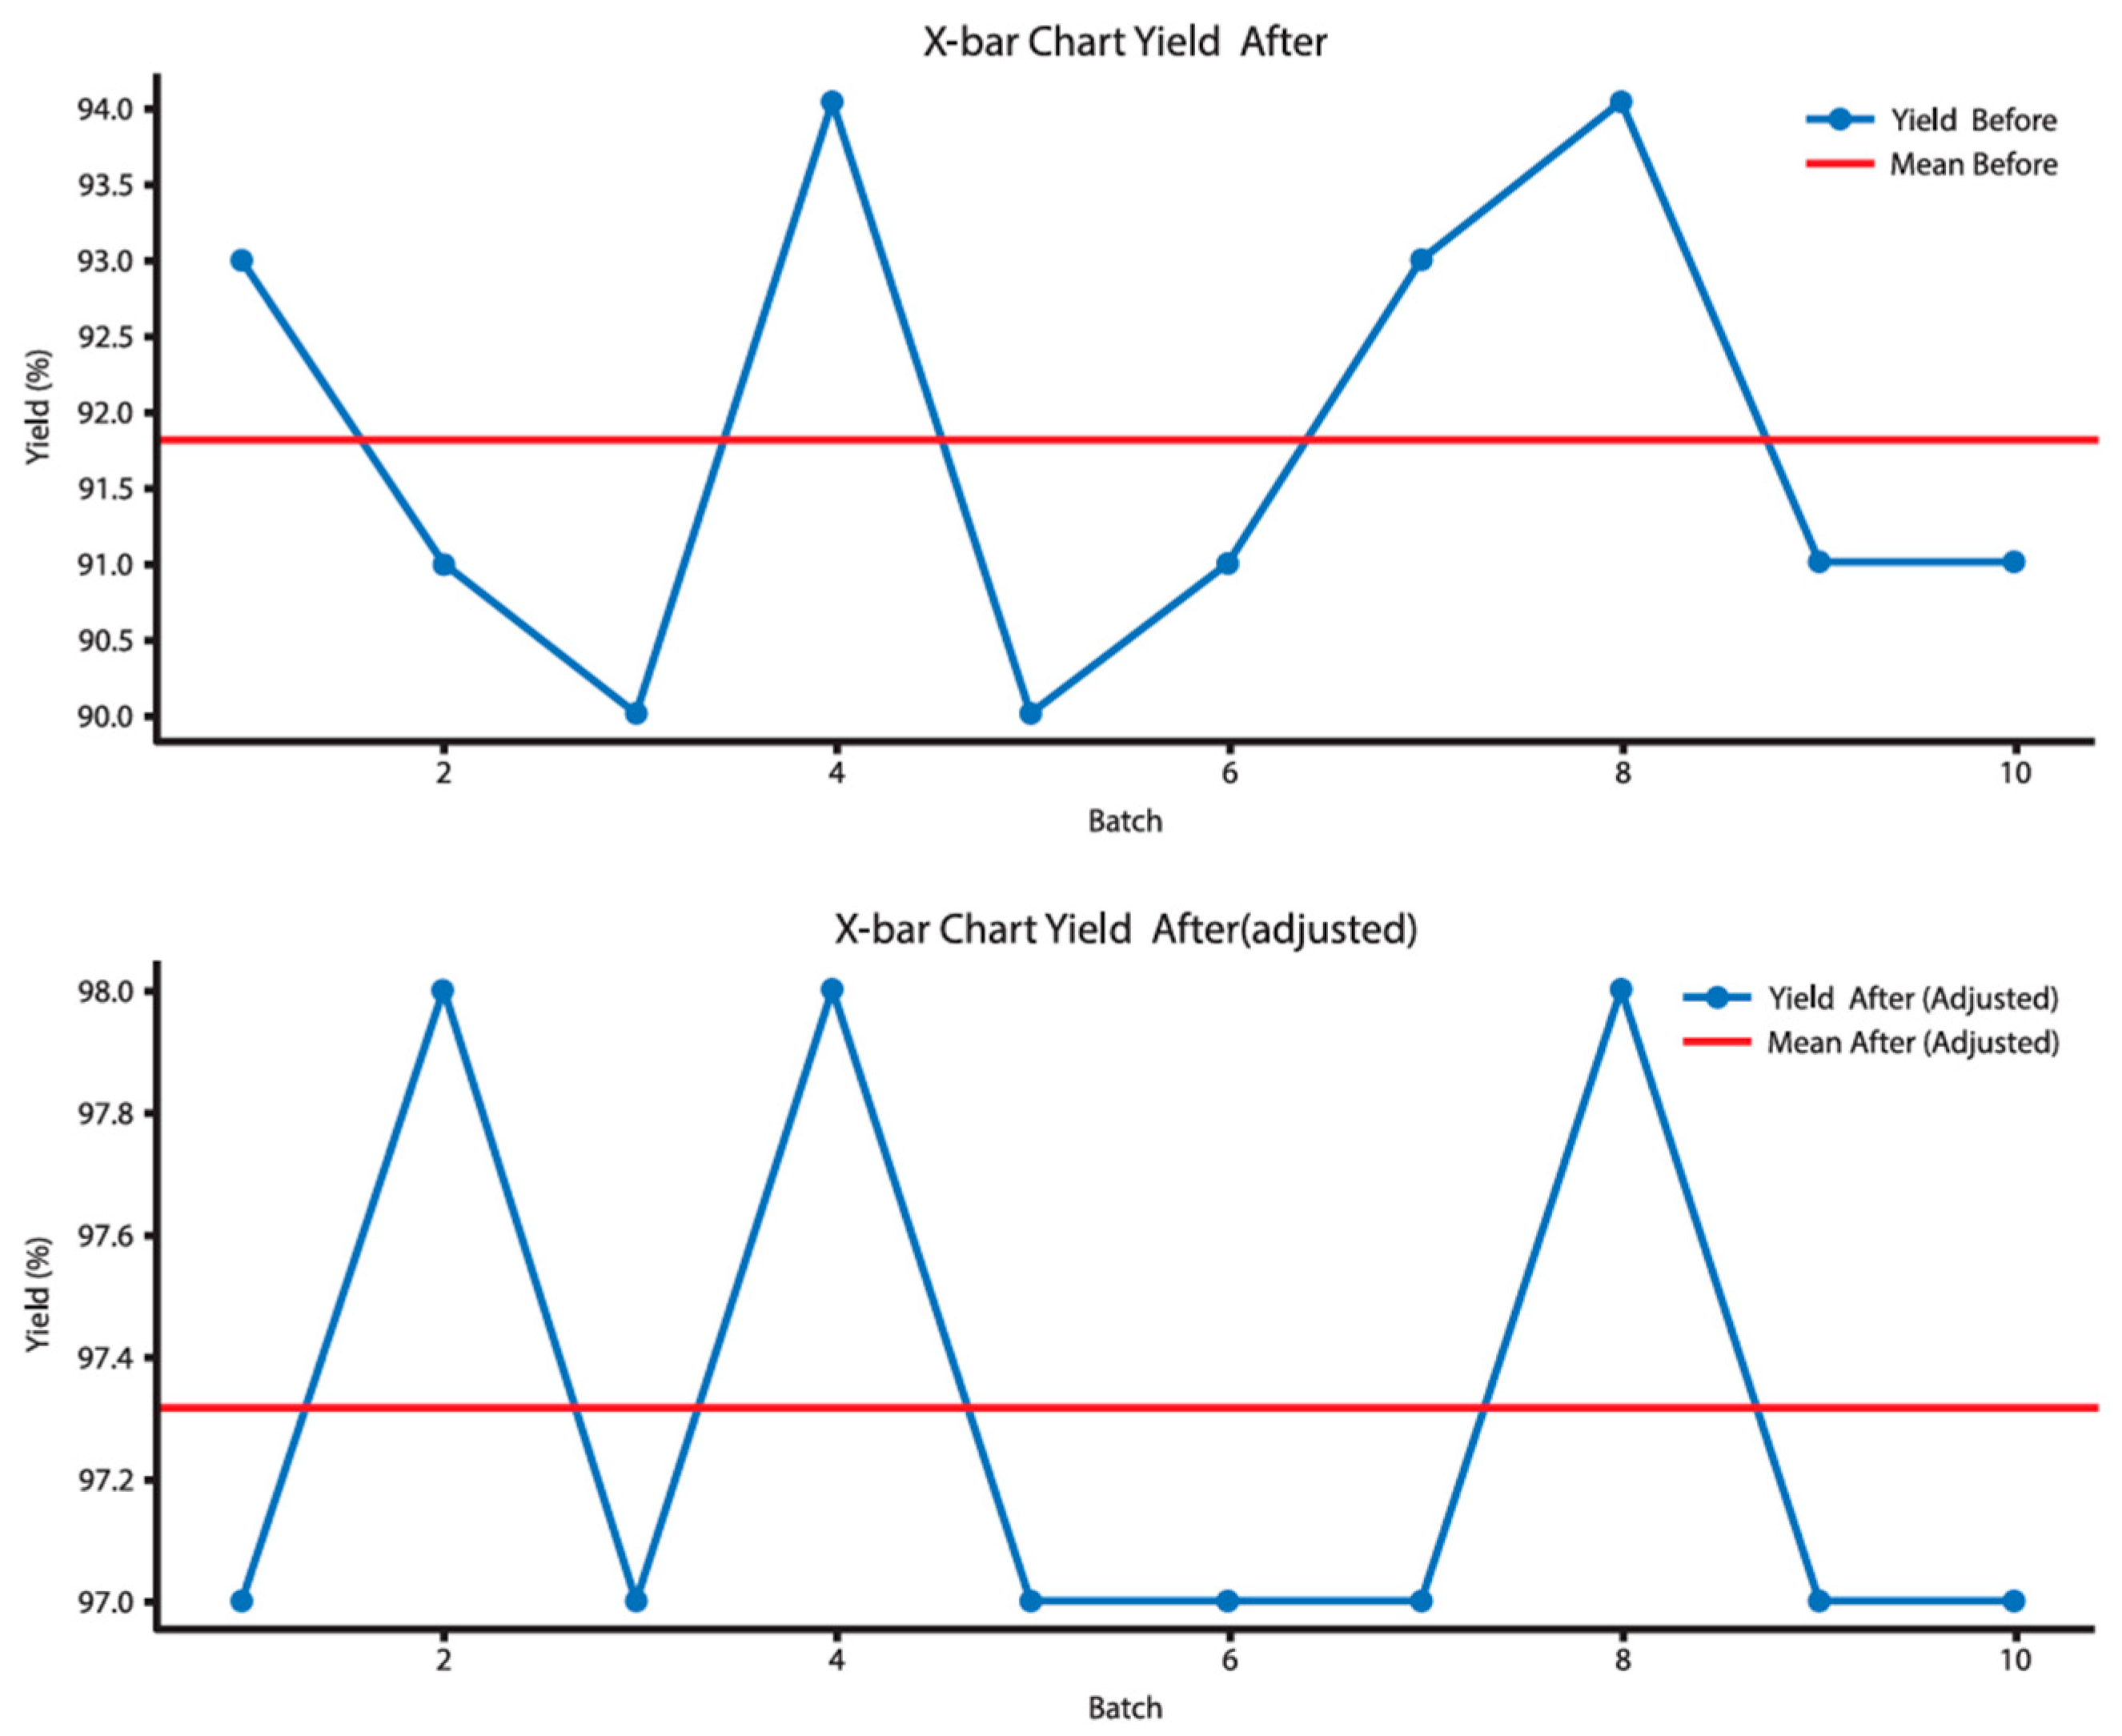
Figure 3 shows the comparison of garlic salt production performance before and after the implementation of the STNN.

Figure 3.
Impact of STNN implementation on garlic salt production performance.
Prior to implementing the STNN, the average yield of the garlic salt production process was approximately 91.8%. This finding aligns with previous assessments, indicating a generally consistent efficiency level of around 92%.
The data revealed a notable variation in yields across batches, fluctuating between 90% and 94%. This dispersion suggests that factors such as temperature, humidity, and other process variables exerted a significant influence on the final outcomes.
The range of yield variation before implementation was 4%. While this represents a moderate level of variability, it highlights the presence of substantial differences between production batches.
The average yield of the garlic salt production process experienced a significant increase after the implementation of the STNN (adjusted), reaching a value of approximately 97.36%. This 5.5% increase compared to the pre-implementation yield evidence of the system’s effectiveness in optimizing the process.
The data distribution is narrower and much more homogeneous, with yields ranging between 97% and 98%. The lower dispersion in the data translates into a substantial improvement in the quality of the final product.
Regarding the calculated range of variation, it decreased from 4% to 1%. This indicates that the STNN has successfully controlled the variables that previously caused fluctuations in production, resulting in greater consistency and stability in process control.
Table 9 shows the evaluation of the dataset using each of the specified metrics. The evaluation involved six separate runs, each of which uses different data partitions for training, validation, and testing. The objective is to determine which type of data partition allows the algorithm to best classify humidity and temperature in the process.
Table 9.
Test results for the data set.
The first run, using 18% for training, 2% for validation, and 80% for testing, achieved an accuracy of 94.88%. In contrast, the sixth run (72% training, 8% validation, 20% testing) achieved a higher accuracy of 97.38%, suggesting better performance for result classification.
3.4.2. Confusion Matrix for STNN
Table 10 shows the performance visualization of the training, validation, and test data for the STNN algorithm. The highest average result accuracy was 98.1% (risk 1) and the lowest was 82.7% (risk 2).
Table 10.
Statistical measures of the classification test (20%) for the four risk levels.
3.4.3. Comparison Algorithm
An analysis of the confusion matrix in the test data set reveals that the STNN classification accuracy surpasses that of the NB technique for both risk levels. The STNN achieves an accuracy of 98.1% for risk level 1 and 97.43% for risk level 4 (Table 11).
Table 11.
Prediction percentages for predictive results on humidity and temperature variables.
In the test set, the confusion matrix shows that the classification accuracy of the STNN, at 97.31%, is better than that of the NB algorithm.
An LED alert system using an STNN informs the operator about temperature and humidity levels critical for mill control. When triggered, the operator intervenes by cooling down the machine with a mechanical sprinkler until normal operating temperature is restored.
To effectively train the STNN and achieve adequate classification of humidity and temperature values, a pilot test was conducted for one week, gathering a sufficient data set. This allowed for the demonstration of the impact of the improvements, resulting in satisfactory outcomes related to the increased performance of the production process in the milling equipment.
3.5. Stage Control
To provide statistical support, a two-sample t-test was conducted to compare the process means before and after the intervention. Given Equation (23), the hypothesis test established the following as the null hypothesis.
H0:
The average performance before is equal to the average performance after.
H1:
The average performance before is lower than the average performance after.
The test was performed with a confidence level of 95% and an alpha of 0.05.
Consequently, the p-value fell below the predetermined significance level (alpha). This allows us to reject the null hypothesis () and support the alternative hypothesis () (Table 12).
Table 12.
Two-sample t-test. F performance before vs. F performance after.
The test resulted in a −0.03143 difference, indicating a 3.14-percentage point improvement in average performance compared to before. The 95% confidence interval for the difference ranges from −0.04229 to −0.02058.
3.6. Project Effectiveness Measurement and Economic Impact
Table 13 presents a new process capability analysis, comparing the results of the tests performed with the performance achieved before the improvement implementation. This analysis allows us to determine if the implemented improvement has increased the process sigma level.
Table 13.
Characterization of the process (comparative before/after).
The customer’s requirements define new upper and lower control limits of 0.97 and 0.95, respectively, with a target value of 0.96.
The implemented changes resulted in a significant improvement in several key areas. Production yield increased by 3.14%, directly contributing to the organization’s productivity and competitiveness. This translates to higher profitability due to the increased number of kilograms produced per batch.
Additionally, improved temperature control led to a reduction of 37.8 kg of finished product waste, representing an economic saving of USD 158.5 per batch. There was also a decrease in the percentage of out-of-specification products.
Furthermore, the standard deviation of the process decreased by 0.014059, indicating greater process stability. This improvement translated to a 2.13-point increase in the sigma level, resulting in a significant reduction of 551.722 in DPMO (Table 14).
Table 14.
Summary of the results obtained.
The results of this study demonstrate a substantial increase in process efficiency and a significant reduction in waste attributed to the implementation of the hybrid LLS model powered by an STNN. These findings align with existing research, underscoring the advantages of LLS methodologies in process optimization and continuous improvement.
The presented study demonstrates the feasibility of implementing LSS models with ANN for real-time control of critical variables in specific processes, such as garlic salt manufacturing. Unlike other studies [34,42] that focus on analyzing historical data to predict and classify key success factors and improve quality using machine learning, our approach enables a more rapid response to real-time fluctuations.
Another point of comparison lies in the industrial context. While this study focuses on a food process with critical variables, other research [39,40,43] utilizes artificial intelligence techniques to reduce cycle times in manufacturing or to optimize electronic components. This highlights that the choice of technique depends on the specific objectives of each study. While cycle time reduction is a priority in high-volume manufacturing, real-time quality control is more critical in food production.
In [45], data analysis and regression models are employed to predict and improve the quality of cast iron parts. Unlike STNNs, which focus on real-time control of operational parameters, this study relies on predictive analysis to enhance quality in a casting process, where production conditions are more controlled. The distinction lies in the need for immediate and continuous control in the food process, compared to post-process optimization in casting.
4. Discussion
The LSS/STNN methodology facilitated the identification of key variables and root causes impacting production performance. These factors were addressed using the methodology’s prescribed tools, enabling the design and implementation of a Poka-Yoke system. This system demonstrably enhanced process performance, productivity, and standardization [54].
The integration of an STNN as a Poka-Yoke mechanism facilitated continuous process control and ensured long-term performance improvements. The review of the literature revealed a paucity of scientific articles addressing the problem studied in SMEs in the food sector. The limited studies available primarily focused on quality control and legal frameworks [55]. This study highlights the significant advantages of employing the proposed hybrid model to bolster company productivity and profitability. Notably, the methodology yielded substantial reductions in operational costs, signifying its effectiveness in driving significant improvements in both process performance and product quality.
The analysis of results at each DMAIC stage, supported by statistical techniques and artificial intelligence tools, enabled process standardization. This approach facilitated the investigation and analysis of root causes pertaining to condiment production within the food industry.
An STNN-based classification model was developed and compared with the NB algorithm. In the domain of pattern recognition and risk prediction, the STNN exhibited superior performance due to its enhanced explanatory capabilities and adeptness at handling high-dimensional attributes with exceptional accuracy.
A fundamental aspect of this algorithm’s structure lies in the improvement achieved by adapting the physical surface tension concept to the neural network model and the garlic salt drying process. This adaptation leverages the strengths of artificial neural networks and elevates model accuracy through an innovative integration of the Six Sigma methodology, specifically by modifying the backpropagation neural network. This combination effectively eliminates inaccuracies inherent in linear models and fosters the development of a model that incorporates real-world variables with greater fidelity.
This article explores the transformation of supply chains within the food industry in the context of Industry 4.0 adoption. The case study analyzes production losses associated with garlic salt seasoning manufacturing and their detrimental economic impact. From this analysis, the technological requirements of the process are updated, and the deficiencies of each machine involved are identified.
The study’s proposed methodology presents a groundbreaking algorithm that addresses temperature and humidity fluctuations, common challenges encountered in condiment production. This robust algorithm has the potential to serve as a fundamental framework for the sector, enabling adaptation to the disruptive transformations of Industry 4.0 in the mid-term. The findings hold significant promise for the SME sector within the condiment food industry, offering a practical solution to optimize production and minimize losses.
This work proposes to promote the implementation of a triple helix model, fostering collaboration between industry, academia, and government to integrate artificial intelligence into the industrial design of novel processes or machinery within the food sector. This strategic collaboration will lead to optimized machinery performance, reduced operational costs, and a strengthened competitive position for the sector on the global stage.
The study’s findings underscore the relatively low investment in Industry 4.0 technologies by SMEs. To bridge this gap, the formulation of public policies that address investment costs is imperative.
5. Conclusions
This study successfully addresses performance issues in the garlic salt manufacturing process for an SME within the condiments industry. By using a hybrid methodology that combines LSS/STNN, and following the DMAIC approach, the study identified the main causes of waste and designed effective solutions to minimize its impact on the process. The results have been promising, showing a significant yield increase of 3.15%, equivalent to a saving of 39.7 kg of waste per batch produced.
By increasing process efficiency by 3.15%, the company has successfully produced more output using the same resources, directly translating to increased revenue. A reduction in waste by 39.7 kg per batch has generated significant savings in raw material costs. Moreover, this waste reduction is not only economically beneficial but also has a positive environmental impact. Less waste equates to fewer solid residues requiring management and disposal.
Process optimization through advanced technologies such as STNNs has led to more efficient energy consumption. More precise and controlled processes typically demand less energy, thereby reducing the production carbon footprint. These advancements have been made possible by implementing advanced technologies like STNNs and continuous improvement practices like LSS. These tools empower the company to optimize processes, curtail costs, and enhance overall efficiency.
Additionally, continuous improvement efforts have yielded positive outcomes, achieving a sigma level of 0.20, which represents a notable increase of 2.13 points compared to the previous sigma level. This achievement has led to a significant reduction in DPMO of 551.722. Furthermore, these findings contribute to the advancement of process optimization in the condiment sector and underscore the importance of applying interdisciplinary approaches to tackle complex challenges in food manufacturing.
The hybrid method of this study, supported by an STNN, achieved superior results in predicting humidity and temperature during garlic salt production compared to models like NB. The input parameters were chosen based on the expertise of professionals in the production process. However, the STNN method excelled at optimizing these parameters, allowing for the transformation and reduction of physical variables. This overcame limitations inherent to traditional artificial neural networks. The prediction results validate the applicability of the proposed model for identifying risk levels associated with temperature and humidity control during garlic salt production in food companies. The model’s high accuracy makes it a valuable tool for enhancing manufacturing processes within this industry.
The combination of Google IoT and Google Cloud Services provides a powerful solution for SMEs. By enabling real-time data collection, storage, and analysis, these businesses can make more informed decisions and significantly improve their processes.
The hybrid model implemented in this case has proven to be highly effective, adapting to environmental changes and making automatic adjustments in real-time. This is particularly valuable in industries where conditions can vary rapidly, ensuring product quality and consistency. The success of this model in an SME demonstrates that these technologies are not limited to large corporations. On the contrary, they can be implemented in a scalable and cost-effective manner in businesses of all sizes. This allows SMEs to enhance their competitiveness and long-term sustainability by optimizing their processes and making data-driven decisions.
In the food industry, beyond garlic salt production, the model could be applied to dairy product manufacturing, where temperature and humidity significantly impact safety and quality. In pharmaceutical manufacturing, the model could optimize the storage of temperature- and humidity-sensitive medications, ensuring their stability and efficacy. Similarly, in the textile industry, where environmental conditions influence fabric quality during dyeing and finishing, this approach could enhance color and texture consistency.
In the automotive sector, the model could optimize the vehicle painting process, where humidity and temperature affect adhesion and finish. Moreover, in the electronics industry, it could control manufacturing conditions for printed circuits, where precise temperature control is essential to prevent component defects.
This study establishes a foundation for future research, including the integration of advanced data analysis techniques such as deep learning algorithms. These algorithms can process large volumes of information in real-time, enabling the model to make more accurate predictions and adjust process conditions more efficiently. Additionally, artificial intelligence-controlled actuators could automate responses to process variations, optimizing temperature and humidity control based on data generated by the STNN.
To enhance competitiveness, especially for SMEs, it is essential to optimize the model for energy efficiency and operational costs. Developing lighter models that require fewer computational resources without sacrificing accuracy would be a significant step toward this goal.
Furthermore, improving the quality of the data used to train the model is crucial. Implementing advanced preprocessing techniques, using higher-precision sensors, and increasing the size of production batches would enable the development of more robust and generalizable models. This would facilitate their application across a wide range of industrial contexts, solidifying their value in optimizing processes and reducing production costs.
Finally, to enhance innovation and competitiveness among SMEs in developing countries, a thorough cost-benefit analysis of implementing advanced technologies like STNNs is crucial. This will pinpoint conditions for maximizing the profitability and sustainability of these investments.
Author Contributions
Conceptualization, M.V. and M.A.; methodology, R.M.; software, I.G.P.V.; validation, G.F., R.M. and M.V.; formal analysis, I.G.P.V.; investigation, R.M.; resources, M.A.; data curation, M.V.; writing—original draft preparation, G.F.; writing—review and editing, I.G.P.V.; visualization, G.F.; supervision, R.M.; project administration, G.F.; funding acquisition, M.A. All authors have read and agreed to the published version of the manuscript.
Funding
This research has been supported by the DICYT (Scientific and Technological Research Bureau) of the University of Santiago of Chile (USACH) and the Department of Industrial Engineering. DICYT project: Optimization of coverage and location of water reservoirs to extinction forest fires, code 062217AM.
Data Availability Statement
The data presented in this study are available on request from the corresponding author.
Conflicts of Interest
The authors declare no conflicts of interest.
References
- Moreira, T.d.C.R.; Nascimento, D.L.d.M.; Smirnova, Y.; dos Santos, A.C.d.S.G. Lean Six Sigma 4.0 Methodology for Optimizing Occupational Exams in Operations Management. Int. J. Lean Six Sigma 2024, 15, 93–119. [Google Scholar] [CrossRef]
- Peretz-Andersson, E.; Tabares, S.; Mikalef, P.; Parida, V. Artificial Intelligence Implementation in Manufacturing SMEs: A Resource Orchestration Approach. Int. J. Inf. Manag. 2024, 77, 102781. [Google Scholar] [CrossRef]
- Badghish, S.; Soomro, Y.A. Artificial Intelligence Adoption by SMEs to Achieve Sustainable Business Performance: Application of Technology–Organization–Environment Framework. Sustainability 2024, 16, 1864. [Google Scholar] [CrossRef]
- Mordor Intelligence Spices and Seasonings Market—Future Trends, Analysis & Revenue. Available online: https://www.mordorintelligence.com/industry-reports/seasoning-and-spices-market (accessed on 5 May 2024).
- Observatory of Economic Complexity Spices: Latest Trends, Historical Data, Product Complexity. Available online: https://oec.world/en/profile/hs/spices (accessed on 5 May 2024).
- Zhou, Y.; Xiangning, C. The Development Trend and Problems of Chinese Condiments. In Proceedings of the IOP Conference Series: Earth and Environmental Science, Changsha, China, 18–20 September 2020; IOP Publishing: Bristol, UK, 2020; Volume 615, p. 012088. [Google Scholar]
- Bhat, S.; Gijo, E.V.; Rego, A.M.; Bhat, V.S. Lean Six Sigma Competitiveness for Micro, Small and Medium Enterprises (MSME): An Action Research in the Indian Context. TQM J. 2021, 33, 379–406. [Google Scholar] [CrossRef]
- Gazoli de Oliveira, A.L.; da Rocha Junior, W.R. Productivity Improvement through the Implementation of Lean Manufacturing in a Medium-Sized Furniture Industry: A Case Study. S. Afr. J. Ind. Eng. 2019, 30, 172–188. [Google Scholar] [CrossRef]
- Farris, J.A.; Van Aken, E.M.; Doolen, T.L.; Worley, J. Critical Success Factors for Human Resource Outcomes in Kaizen Events: An Empirical Study. Int. J. Prod. Econ. 2009, 117, 42–65. [Google Scholar] [CrossRef]
- Romero, D.; Gaiardelli, P.; Powell, D.; Wuest, T.; Thürer, M. Rethinking Jidoka Systems under Automation & Learning Perspectives in the Digital Lean Manufacturing World. IFAC-Pap. 2019, 52, 899–903. [Google Scholar] [CrossRef]
- Alcaraz, J.L.G.; Macías, A.A.M.; Luevano, D.J.P.; Fernández, J.B.; López, A.d.J.G.; Macías, E.J. Main Benefits Obtained from a Successful JIT Implementation. Int. J. Adv. Manuf. Technol. 2016, 86, 2711–2722. [Google Scholar] [CrossRef]
- Ohno, T. Toyota Production System: Beyond Large-Scale Production; Productivity Press: Portland, OR, USA, 1988. [Google Scholar]
- García Alcaraz, J.L.; Morales García, A.S.; Díaz Reza, J.R.; Blanco Fernández, J.; Jiménez Macías, E.; Puig I Vidal, R. Machinery Lean Manufacturing Tools for Improved Sustainability: The Mexican Maquiladora Industry Experience. Mathematics 2022, 10, 1468. [Google Scholar] [CrossRef]
- Liu, H.C.; Liu, R.; Gu, X.; Yang, M. From Total Quality Management to Quality 4.0: A Systematic Literature Review and Future Research Agenda. Front. Eng. Manag. 2023, 10, 191–205. [Google Scholar] [CrossRef]
- Maia, D.d.R.P.; Lizarelli, F.L.; Gambi, L.D.N. Industry 4.0 and Six Sigma: A Systematic Review of the Literature and Research Agenda Proposal. Benchmarking Int. J. 2024, 31, 1009–1037. [Google Scholar] [CrossRef]
- Chakey, D. Closing Report. Lean Six Sigma Rev. 2020, 19, 18–27. [Google Scholar]
- Escobar, C.A.; Macias, D.; McGovern, M.; Hernandez-de-Menendez, M.; Morales-Menendez, R. Quality 4.0—An Evolution of Six Sigma DMAIC. Int. J. Lean Six Sigma 2022, 13, 1200–1238. [Google Scholar] [CrossRef]
- Tsarouhas, P.; Sidiropoulou, N. Application of Six Sigma Methodology Using DMAIC Approach for a Packaging Olives Production System: A Case Study. Int. J. Lean Six Sigma 2024, 15, 247–273. [Google Scholar] [CrossRef]
- Vicente, I.; Godina, R.; Teresa Gabriel, A. Applications and Future Perspectives of Integrating Lean Six Sigma and Ergonomics. Saf. Sci. 2024, 172, 106418. [Google Scholar] [CrossRef]
- Sunder, V.M.; Ganesh, L.S.; Marathe, R.R. A Morphological Analysis of Research Literature on Lean Six Sigma for Services. Int. J. Oper. Prod. Manag. 2018, 38, 149–182. [Google Scholar] [CrossRef]
- Sharma, A.; Bhanot, N.; Gupta, A.; Trehan, R. Application of Lean Six Sigma Framework for Improving Manufacturing Efficiency: A Case Study in Indian Context. Int. J. Product. Perform. Manag. 2022, 71, 1561–1589. [Google Scholar] [CrossRef]
- Smith, A.D.; Offodile, O.F. Green and Sustainability Corporate Initiatives: A Case Study of Goods and Services Design. Int. J. Process Manag. Benchmarking 2016, 6, 273–299. [Google Scholar] [CrossRef]
- Mesones-Guillén, A.; Palacios-Jesús, L.; Carvallo-Munar, E.; Salas-Castro, R.; Cardenas-Rengifo, L. Lean Manufacturing Model Adapted for Waste Reduction in Peruvian Condiment Production Agri-Businesses. In Proceedings of the Smart Innovation, Systems and Technologies, Campinas, Brazil, 22–24 October 2019; Springer: Sao Paulo, Brazil, 2021; Volume 201, pp. 381–389. [Google Scholar]
- Fuertes, G.; Zamorano, J.; Alfaro, M.; Vargas, M.; Sabattin, J.; Duran, C.; Ternero, R.; Rivera, R. Opportunities of the Technological Trends Linked to Industry 4.0 for Achieve Sustainable Manufacturing Objectives. Sustainability 2022, 14, 11118. [Google Scholar] [CrossRef]
- Serey, J.; Quezada, L.; Alfaro, M.; Fuertes, G.; Vargas, M.; Ternero, R.; Sabattin, J.; Duran, C.; Gutierrez, S. Artificial Intelligence Methodologies for Data Management. Symmetry 2021, 13, 2040. [Google Scholar] [CrossRef]
- Serey, J.; Alfaro, M.; Fuertes, G.; Vargas, M.; Ternero, R.; Duran, C.; Sabattin, J.; Gutierrez, S. Framework for the Strategic Adoption of Industry 4.0: A Focus on Intelligent Systems. Processes 2023, 11, 2973. [Google Scholar] [CrossRef]
- Qiu, S.; Cui, X.; Ping, Z.; Shan, N.; Li, Z.; Bao, X.; Xu, X. Deep Learning Techniques in Intelligent Fault Diagnosis and Prognosis for Industrial Systems: A Review. Sensors 2023, 23, 1305. [Google Scholar] [CrossRef] [PubMed]
- Zonta, T.; da Costa, C.A.; Zeiser, F.A.; de Oliveira Ramos, G.; Kunst, R.; da Rosa Righi, R. A Predictive Maintenance Model for Optimizing Production Schedule Using Deep Neural Networks. J. Manuf. Syst. 2022, 62, 450–462. [Google Scholar] [CrossRef]
- Abderazek, H.; Laouissi, A.; Nouioua, M.; Atanasovska, I. Optimization of Turning Process Parameters Using a New Hybrid Evolutionary Algorithm. J. Mech. Eng. Sci. 2023, 238, 758–768. [Google Scholar] [CrossRef]
- Patalas-maliszewska, J.; Halikowski, D.; Damaševičius, R. An Automated Recognition of Work Activity in Industrial Manufacturing Using Convolutional Neural Networks. Electronics 2021, 10, 2946. [Google Scholar] [CrossRef]
- Serey, J.; Alfaro, M.; Fuertes, G.; Vargas, M.; Durán, C.; Ternero, R.; Rivera, R.; Sabattin, J. Pattern Recognition and Deep Learning Technologies, Enablers of Industry 4.0, and Their Role in Engineering Research. Symmetry 2023, 15, 535. [Google Scholar] [CrossRef]
- Kumar, I.; Rawat, J.; Mohd, N.; Husain, S. Opportunities of Artificial Intelligence and Machine Learning in the Food Industry. J. Food Qual. 2021, 2021, 4535567. [Google Scholar] [CrossRef]
- El Bhilat, E.M.; El Jaouhari, A.; Hamidi, L.S. Assessing the Influence of Artificial Intelligence on Agri-Food Supply Chain Performance: The Mediating Effect of Distribution Network Efficiency. Technol. Forecast. Soc. Chang. 2024, 200, 123149. [Google Scholar] [CrossRef]
- Perera, A.D.; Jayamaha, N.P.; Grigg, N.P.; Tunnicliffe, M.; Singh, A. The Application of Machine Learning to Consolidate Critical Success Factors of Lean Six Sigma. IEEE Access 2021, 9, 112411–112424. [Google Scholar] [CrossRef]
- Endrigo Sordan, J.; Andersson, R.; Antony, J.; Lopes Pimenta, M.; Oprime, P.C. How Industry 4.0, Artificial Intelligence and Augmented Reality Can Boost Digital Lean Six Sigma. Total Qual. Manag. Bus. Excell. 2024, 1–25. [Google Scholar] [CrossRef]
- Yıldız, H.G.; Ayvaz, B.; Kuşakcı, A.O.; Deveci, M.; Garg, H. Sustainability Assessment of Biomass-Based Energy Supply Chain Using Multi-Objective Optimization Model. Environ. Dev. Sustain. 2023, 26, 15451–15493. [Google Scholar] [CrossRef]
- Niemann, J.; Reich, B.; Stöhr, C. Lean Six Sigma: Methods for Production Optimization; Springer: Düsseldorf, Germany, 2024; ISBN 9783662687444. [Google Scholar]
- Mosquera-Navarro, R.; Castrillón, O.D.; Osorio, L.P.; Oliveira, T.; Novais, P.; Valencia, J.F. Improving Classification Based on Physical Surface Tension-Neural Net for the Prediction of Psychosocial-Risk Level in Public School Teachers. PeerJ Comput. Sci. 2021, 7, e511. [Google Scholar] [CrossRef] [PubMed]
- Ramakrishnan, V.; Ramasamy, N.; Dev Anand, M.; Santhi, N. Supply Chain Management Efficiency Improvement in the Automobile Industry Using Lean Six Sigma and Artificial Neural Network. IEEE Trans. Eng. Manag. 2024, 71, 3278–3294. [Google Scholar] [CrossRef]
- Vijayakumar, S.R.; Suresh, P. Lean Based Cycle Time Reduction in Manufacturing Companies Using Black Widow Based Deep Belief Neural Network. Comput. Ind. Eng. 2022, 173, 108735. [Google Scholar] [CrossRef]
- Abed, A.M.; Elattar, S.; Gaafar, T.S.; Alrowais, F.M. The Neural Network Revamping the Process’s Reliability in Deep Lean via Internet of Things. Processes 2020, 8, 729. [Google Scholar] [CrossRef]
- Uluskan, M. Artificial Neural Networks as a Quality Loss Function for Six Sigma. Total Qual. Manag. Bus. Excell. 2020, 31, 1811–1828. [Google Scholar] [CrossRef]
- Su, C.T.; Su, F.M.; Chen, T.Y.; Chen, L.F. Enhancing the Structural Strength of an ODD Laptop via Six Sigma Approach. IEEE Trans. Compon. Packag. Manuf. Technol. 2019, 9, 2200–2209. [Google Scholar] [CrossRef]
- Maged, A.; Haridy, S.; Awad, M.; Shamsuzzaman, M. Machine Learning Aided Six Sigma: Perspective and Practical Implementation. IEEE Trans. Eng. Manag. 2024, 71, 1519–1530. [Google Scholar] [CrossRef]
- Mishra, N.; Rane, S.B. Prediction and Improvement of Iron Casting Quality through Analytics and Six Sigma Approach. Int. J. Lean Six Sigma 2019, 10, 189–210. [Google Scholar] [CrossRef]
- Gobierno de Colombia Ley de Protección de Datos 1581 de 2012. Available online: https://www.funcionpublica.gov.co/eva/gestornormativo/norma.php?i=49981 (accessed on 30 July 2024).
- Jasper, J.J. The Surface Tension of Pure Liquid Compounds. J. Phys. Chem. Ref. Data 1972, 1, 841–1010. [Google Scholar] [CrossRef]
- Adamson, A.W.; Gast, A.P. Physical Chemistry of Surfaces; Interscience Publishers: New York, NY, USA, 1967; ISBN 0470007931. [Google Scholar]
- Macleod, D.B. On a Relation between Surface Tension and Density. Trans. Faraday Soc. 1923, 19, 38–41. [Google Scholar] [CrossRef]
- El-Mesery, H.S.; Qenawy, M.; Li, J.; El-Sharkawy, M.; Du, D. Predictive Modeling of Garlic Quality in Hybrid Infrared-Convective Drying Using Artificial Neural Networks. Food Bioprod. Process. 2024, 145, 226–238. [Google Scholar] [CrossRef]
- Andayani, U.; Nababan, E.B.; Siregar, B.; Muchtar, M.A.; Nasution, T.H.; Siregar, I. Optimization Backpropagation Algorithm Based on Nguyen-Widrom Adaptive Weight and Adaptive Learning Rate. In Proceedings of the International Conference on Industrial Engineering and Applications, Nagoya, Japan, 21–23 April 2017; IEEE: Nagoya, Japan, 2017; pp. 363–367. [Google Scholar]
- Rodrigues, J.F.; Junqueira, G.; Gonçalves, C.S.; Carneiro, J.D.S.; Pinheiro, A.C.M.; Nunes, C.A. Elaboration of Garlic and Salt Spice with Reduced Sodium Intake. An. Acad. Bras. Ciências 2014, 86, 2065–2075. [Google Scholar] [CrossRef]
- Danişan, T.; Özcan, E.; Eren, T. Personnel Selection with Multi-Criteria Decision Making Methods in the Ready-to-Wear Sector. Teh. Vjesn. 2022, 29, 1339–1347. [Google Scholar] [CrossRef]
- Henao, R.; Sarache, W.; Gómez, I. Lean Manufacturing and Sustainable Performance: Trends and Future Challenges. J. Clean. Prod. 2019, 208, 99–116. [Google Scholar] [CrossRef]
- Cuggia-Jiménez, C.; Orozco-Acosta, E.; Mendoza-Galvis, D. Lean Manufacturing: A Systematic Review in the Food Industry. Inf. Tecnol. 2020, 31, 163–172. [Google Scholar] [CrossRef]
Disclaimer/Publisher’s Note: The statements, opinions and data contained in all publications are solely those of the individual author(s) and contributor(s) and not of MDPI and/or the editor(s). MDPI and/or the editor(s) disclaim responsibility for any injury to people or property resulting from any ideas, methods, instructions or products referred to in the content. |
© 2024 by the authors. Licensee MDPI, Basel, Switzerland. This article is an open access article distributed under the terms and conditions of the Creative Commons Attribution (CC BY) license (https://creativecommons.org/licenses/by/4.0/).