Abstract
Mining wire rope, a frequently used load-bearing element, suffers various forms of damage over extended periods of operation. Damage occurring within the wire rope, which is not visible to the naked eye and is difficult to detect accurately with current technology, is of particular concern. Consequently, the identification of internal damage assumes paramount importance in ensuring mine safety. This study proposes a wire rope internal damage noise reduction and identification method, first of all, through a three-dimensional magnetic dipole model to achieve the detection and analysis of the internal damage of the wire rope. Simultaneously, a sensor system capable of accurately detecting the internal damage of wire rope is developed and validated through experimentation. A novel approach is proposed to address the noise reduction issue in the design process. This approach utilizes a particle swarm optimization variational modal decomposition method to enhance the signal-to-noise ratio. Additionally, a dual-attention mode, which combines channel attention and spatial attention, is integrated into the CNN-GRU network model. This network model is specifically designed for the detection of internal damage in steel wire ropes. The proposed method successfully achieves quantitative identification of internal damage in steel wire ropes. The experimental findings demonstrate that this approach is capable of efficiently detecting internal damage in wire rope and possesses the capacity to quantitatively identify such damage, enabling adaptive identification of wire rope.
Keywords:
three-dimensional magnetic dipole detection model; signal noise reduction; quantitative identification; internal wire rope damage MSC:
94A12
1. Introduction
Wire rope, as one of the most important flexible components of mine hoists, consists of multiple carbon or alloy-containing fine steel wires twisted into rope strands and then multiple rope strands twisted in accordance with the spiral rule of flexible ropes [1,2], whose overall structure includes steel wires, rope strands, strand cores, and rope cores. Due to its special material and twisted structure, it has many advantages, such as good flexibility, good fatigue strength, high tensile strength, good impact resistance, etc. [3,4,5], and it is widely used in coal mines, harbors, transportation, high-rise buildings, ropeways, and other fields [6,7,8,9]. However, due to long-term load and poor working environments, various damages will occur during its use, which, if not detected in time, will seriously affect the normal use of wire ropes and even the safe operation of coal mines and other fields [10,11].
In order to detect the defects existing in a wire rope over time, many scholars have carried out active exploration and proposed a variety of wire rope non-destructive testing methods [12,13,14,15,16]. Shiwei L. et al. [17] used a combination of the Hall sensor and leakage magnetic detection method to detect surface defects on steel wire rope, conducted experiments, and evaluated its performance in terms of baseline drift and signal denoising, etc. Li-jun L et al. [18] proposed a multi-array weak magnetic detection method for Hall sensors that can achieve precise axial positioning and defect detection at different axial positions, effectively increasing the size of wire rope defect detection. Donglai Z et al. [19] proposed a small detector to detect wire rope surface defects and used a new method combining the Hilbert transform and wavelet analysis to eliminate the signal noise. Zhen S. et al. [20] proposed an adaptive moving average filtering method to assign optimal parameters to the wire rope surface defect signals to assign optimal parameters and improve the signal-to-noise ratio. Javad R et al. [21] used ultrasonic guided wave technology to monitor the cross-sectional area of the overall length of the wire rope from a single point and analyze the signals using a continuous wavelet transform. Wei G et al. [22] utilized a magnetostrictive longitudinal guided wave to detect the faulty condition of wire ropes. The excitation frequency was selected based on the intrinsic frequency detection outcomes in order to enhance the signal-to-noise ratio of the guided wave signal.
Regarding damage signal processing, wavelet noise-reduction algorithms have been extensively employed to reduce noise based on the distinct frequency characteristics of the damage signal. Many experts and scholars have successfully achieved effective signal noise reduction by enhancing traditional wavelet decomposition. However, a drawback of this approach is the requirement to determine the optimal number of wavelet decomposition layers to achieve optimal noise reduction [23]. Simultaneously, several novel algorithms have demonstrated benefits in reducing signal noise in wire rope damage. The effectiveness of different approaches in processing signals with noise, such as the complete integrated empirical modal decomposition [24] and the variational modal decomposition [25], can vary. However, the search for extreme points and envelope values primarily influences the performance of empirical modal decomposition, potentially leading to endpoint effects and modal aliasing. The variational modal decomposition automatically determines the center frequency and bandwidth by iteratively searching for the optimal solution. This method is highly efficient and adaptable, but it does suffer from the issue of artificially selecting parameters. This work decreases the noise of the wire rope damage signal after using the particle swarm method to tackle the issue of artificially choosing the variational modal decomposition’s parameters in order to further increase the accuracy of the noise reduction.
Regarding intelligent recognition, several researchers have conducted studies on wire rope damage recognition in recent years [26,27]. Shiliang et al. [28] employed the closest neighbor (NN) method to accurately detect wire rope damage and conducted experimental validation and analysis. Xi L., et al. [29] used kernel-limit learning machines to detect wire rope breaking damage. They used infrared information and picture segmentation approaches, as Juwei Z, et al. [30] utilized the GWO-SVM algorithm for the detection of wire rope damage. Additionally, they constructed a wire rope magnetic memory detection platform to empirically validate the proposed technique. In addition, Juwei Z, et al. [31] employed a back propagation network to accurately detect the wire rope and utilized principal component analysis to reduce the size of the damage characteristics. Qiang Y, et al. [32] used the BP-SVM method to detect internal damage to the wire rope and the HOG technique to extract the characteristics of the damage. Nevertheless, the majority of wire rope identification techniques rely on manually extracted features to detect damage. This approach is expensive and requires a certain degree of a priori knowledge of the intervention, making it susceptible to misjudgment. Consequently, there is a pressing need for an unsupervised adaptive method to identify wire rope damage.
Based on this background, this study designs a sensor system capable of accurately detecting internal damage in wire ropes and conducts an internal damage detection experiment. It also suggests a three-dimensional magnetic dipole theory model for internal damage of wire ropes based on two-dimensional magnetic dipole theory and dynamic simulation of the internal damage. The particle swarm optimization variational modal noise reduction method is used to reduce signal noise based on the experimental results. Additionally, we incorporate the double attention mechanism into the convolutional neural network and gated recurrent unit network phase to enable adaptive detection of internal damage in wire rope.
This document organizes its structure as follows: Section 2 outlines the theory of a wire rope’s internal damage detection model, the concept of a noise reduction algorithm, the principle of a recognition network model, and the algorithm’s overall process. Section 3 conducts a simulation study on the internal damage of wire ropes. Section 4 outlines the experimental setup for detecting internal damage in wire ropes using quantitative methods. Section 5 is on mitigating noise and analyzing the internal damage signal of wire rope, while Section 6 is dedicated to quantitatively identifying and analyzing the findings. The seventh section provides a conclusion and discusses prospects.
2. Principles
2.1. Two-Dimensional Magnetic Dipole Detection Model
We use the magnetic dipole model to model internal damage detection in wire ropes. This theory was first proposed by Zatsepin N. N. and Shcherbinin V. E. [33]. The model is similar to the electric dipole physical model, where a magnetic dipole is a pair of point charges with the same magnetic properties but opposite polarity. When an external magnetic field is applied to a wire rope, it forms a magnetic field inside. In the event that a wire rope defect occurs, it will generate two opposite magnetic poles on either side of the defect, which is roughly equivalent to two magnetic dipoles. Consequently, we can use the equivalent analysis to study the damage to the wire rope.
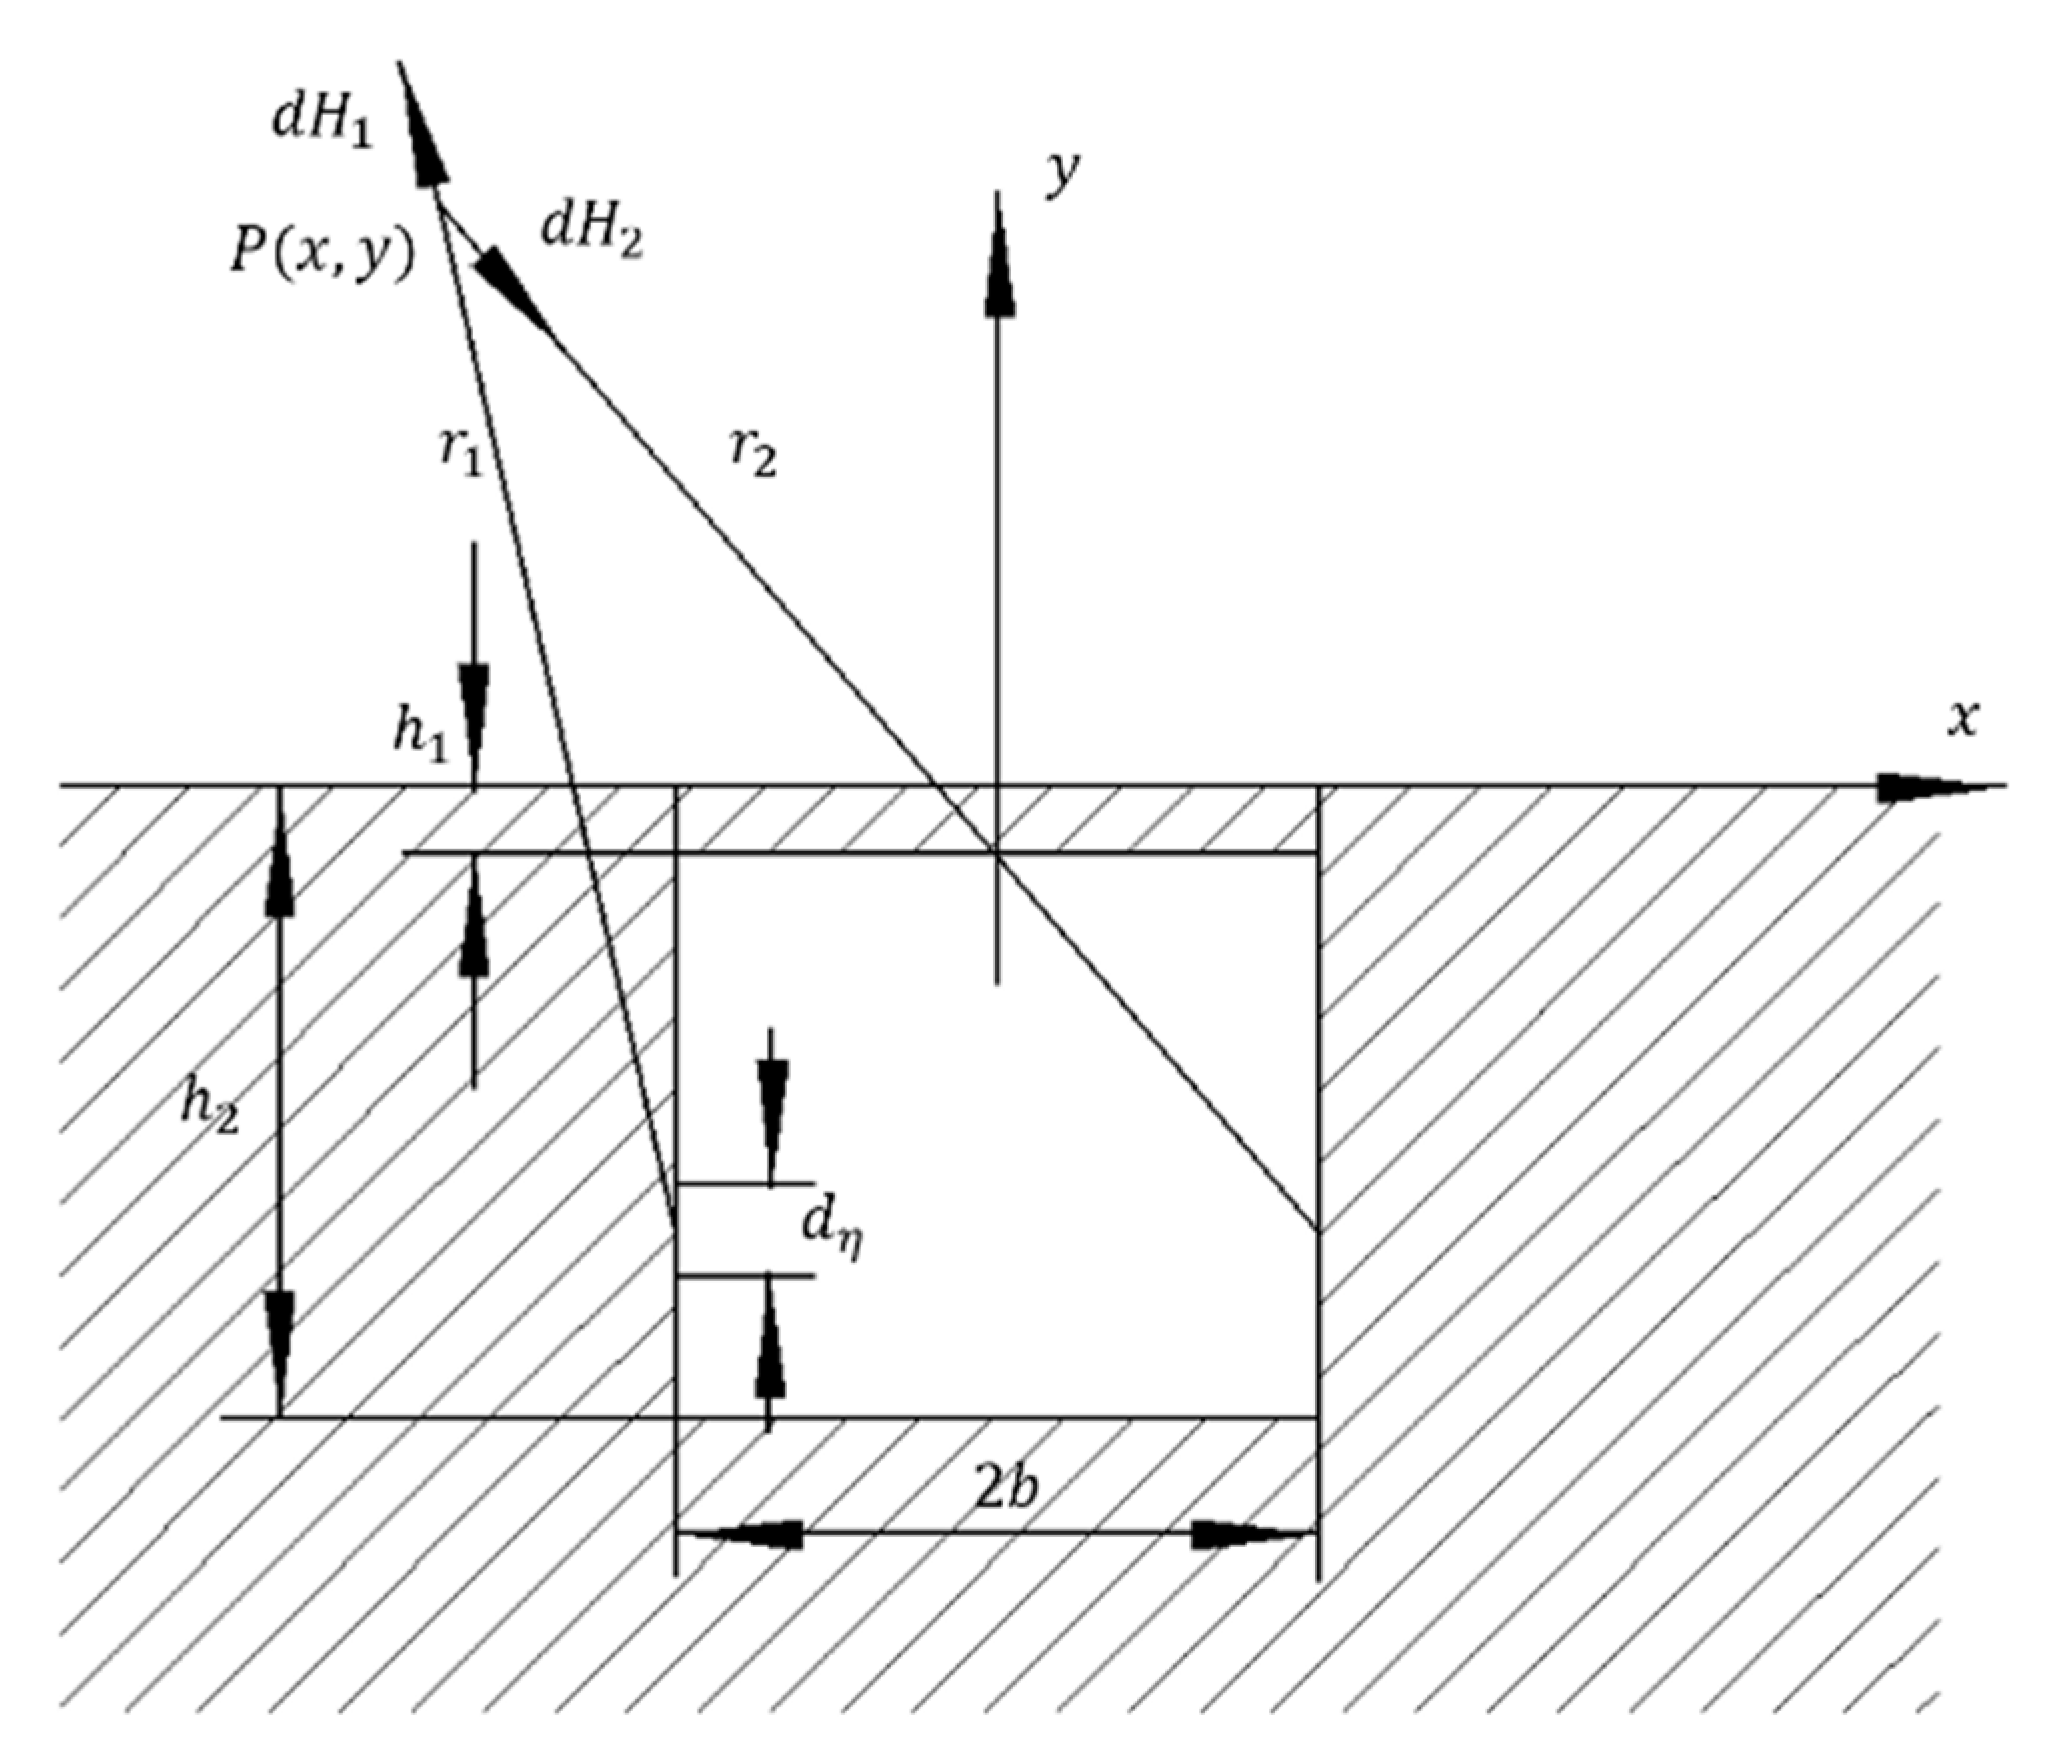
In order to get more accurate analytical findings, this study utilizes a magnetic dipole model to mimic the detection of internal damage in the wire rope. For this model, we make the assumption that there is a rectangular opening in the wire rope that is infinitely long and perpendicular to the external magnetic field. The wire rope’s internal damage is characterized by the homogeneous distribution of magnetically opposed magnetic charges on both sides. Using this model, we can accurately identify any damage present within the wire rope. Figure 1 illustrates the cross-section of the theoretical model for internal wire rope detection.

Figure 1.
Cross-section of the theoretical model for internal inspection of wire rope.
According to Figure 1, it can be seen that the length of the internal defect of the wire rope is . The difference in depth can be represented as . A planar coordinate system is developed in which the midpoint of the rectangular slot serves as the origin. The x-axis represents the direction of magnetization, while the y-axis represents the perpendicular direction. The dimensions of the magnetic charge surface on both sides are denoted as . The distances from the point to the magnetic charge surfaces on both sides are represented by and . The density of the load surface, denoted as , can be mathematically described as:
where is the applied magnetic field strength and is the relative magnetic permeability of the substance being measured.
If the distance between the given magnetic charge surface and the steel wire rope is η, then:
The magnetic field strength of the magnetic charge surfaces on both sides is:
where , are the x-component of the magnetic field strength generated by the magnetic charge surface at point and , are the y-component of the magnetic field strength generated by the magnetic charge surface at point .
Integrate the component along the slot wall direction and denote it as:
where is the magnetic field strength in the direction of the rectangular slot magnetization.
Integrating the y component along the direction of the slot wall is expressed as:
where is the strength of the magnetic field in the perpendicular direction y of the rectangular slot.
2.2. Three-Dimensional Magnetic Dipole Detection Model
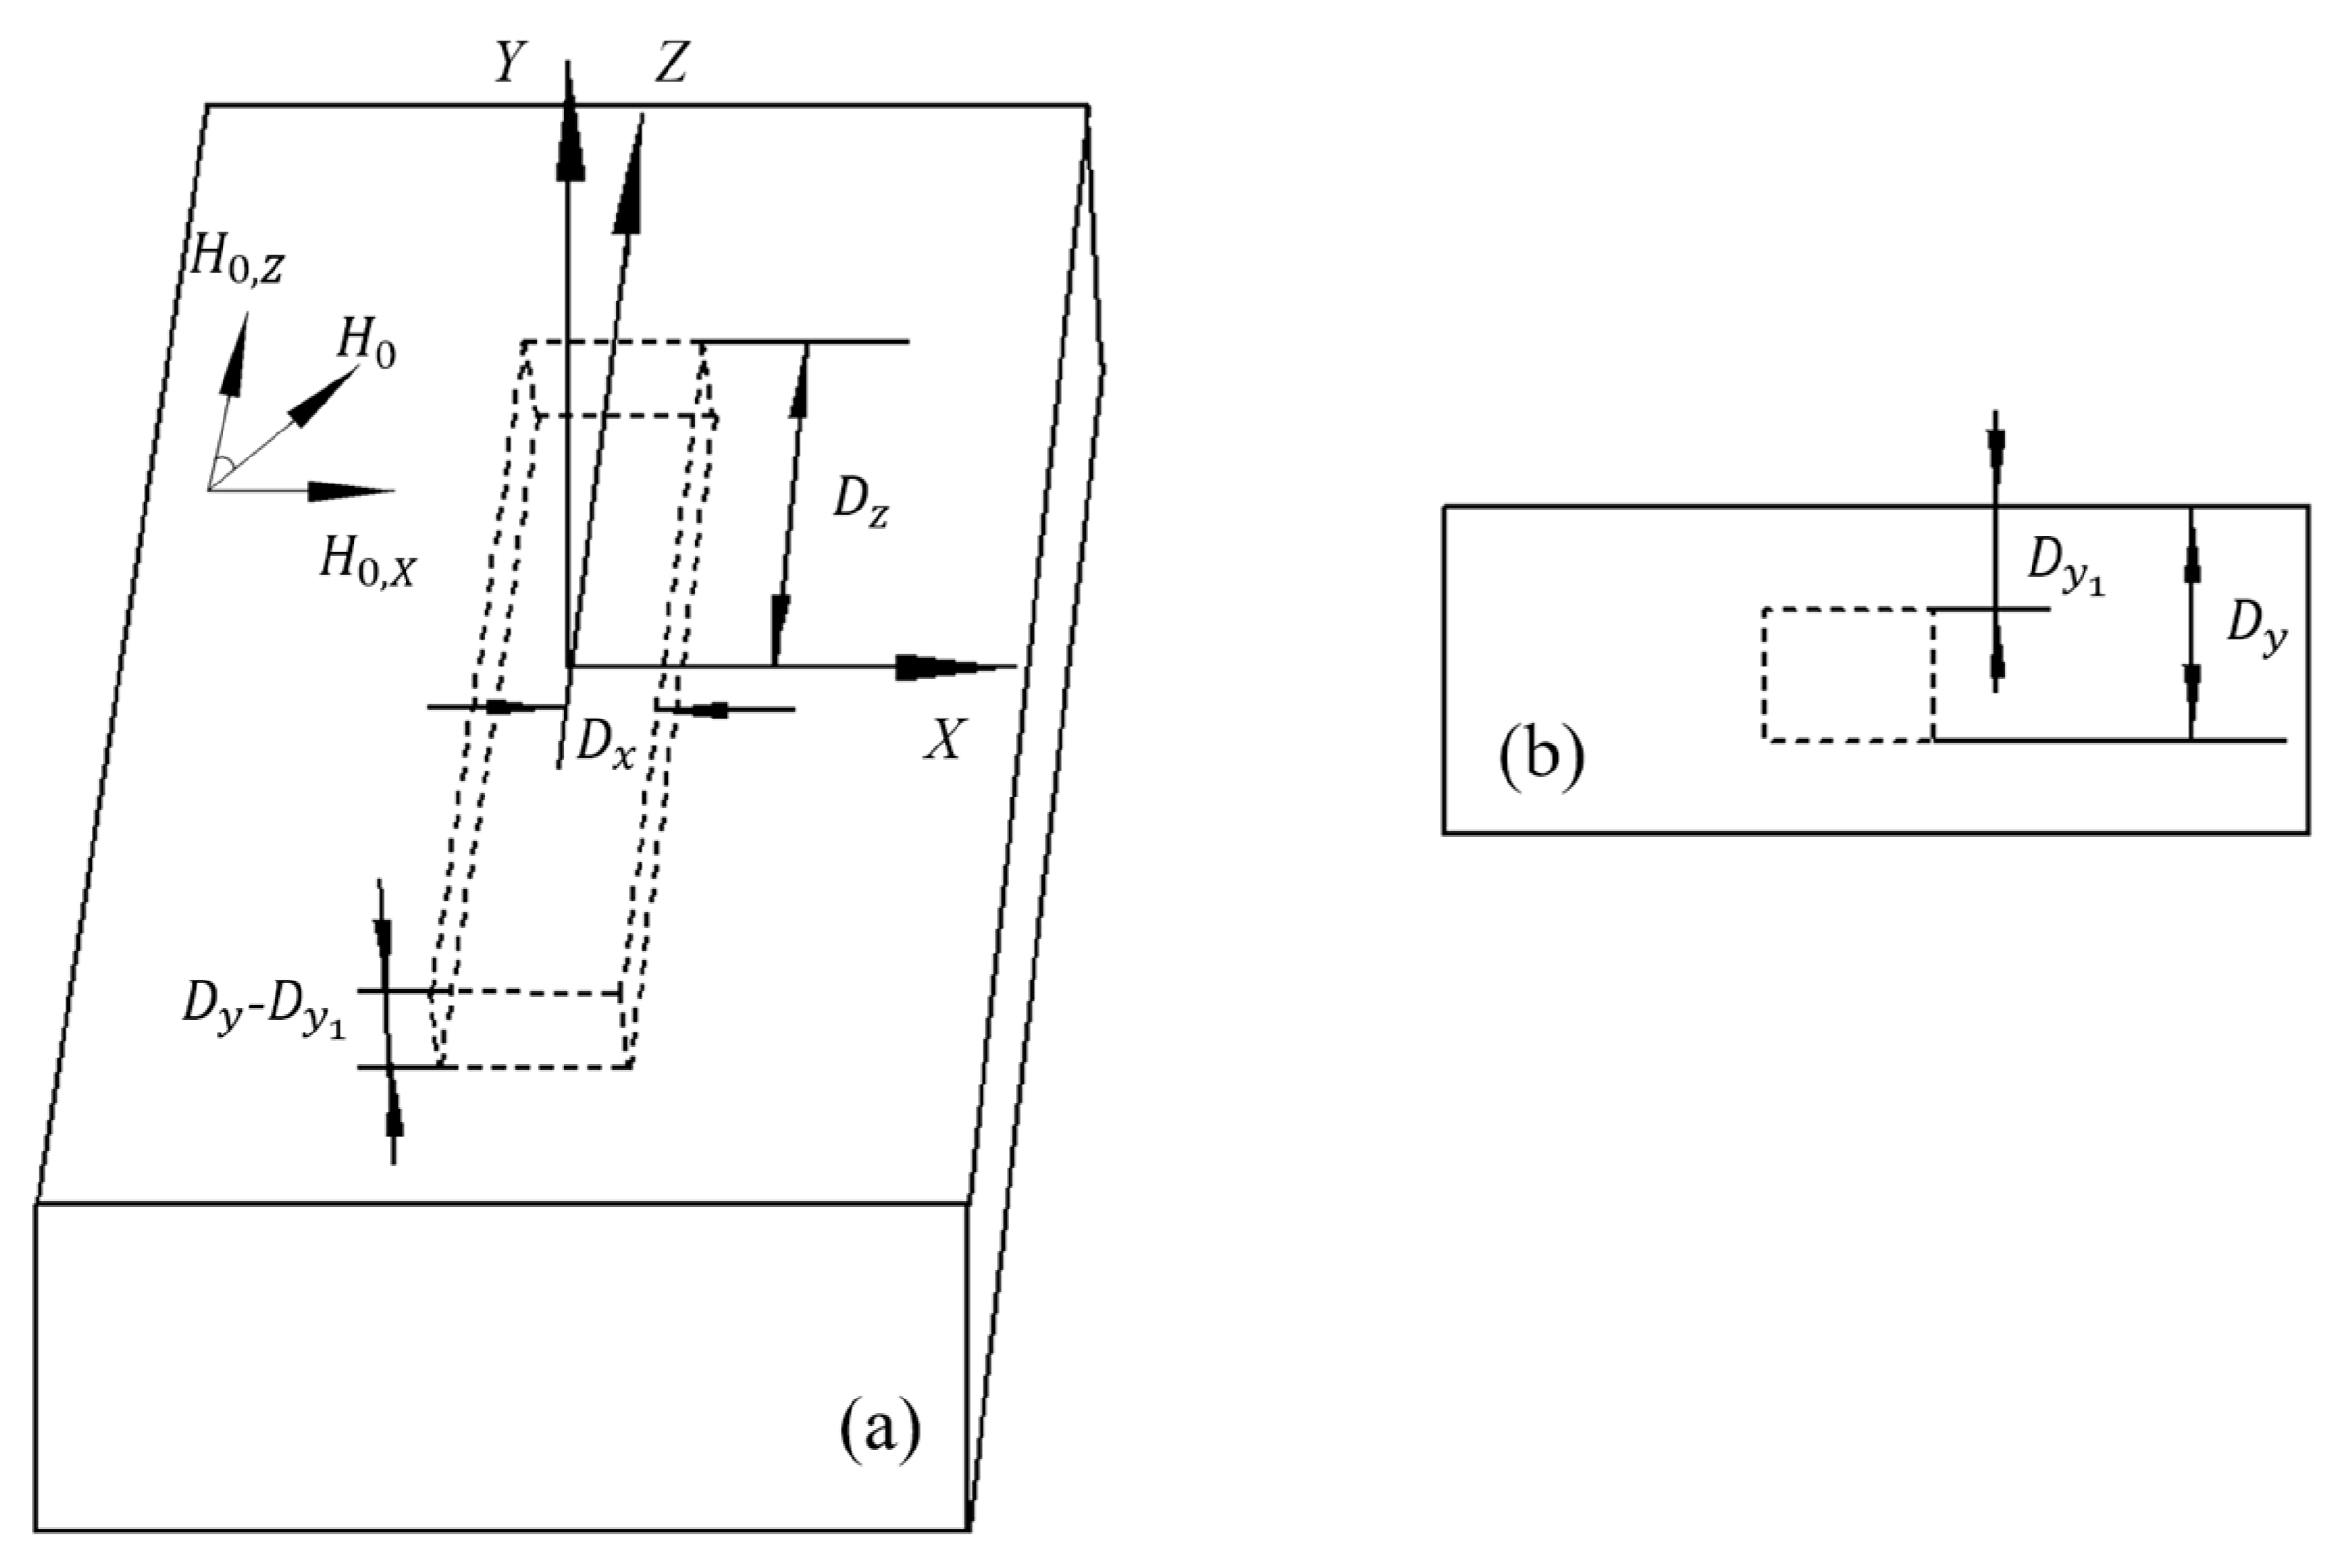
The aforementioned two-dimensional magnetic dipole analysis model for internal damage in steel wire rope is predicated on the assumptions of infinite length and perpendicular orientation to the magnetization direction. Consequently, the model can only serve as a qualitative point of reference for real defect analysis. In actual non-destructive testing (NDT) applications, the orientation of the defects is frequently uncertain, meaning that the angle θ between the defect and the direction of magnetization is arbitrary. The orientation of the defect in relation to the magnetizing field is a crucial aspect that influences the distribution of the magnetic field. Thus, in this work, we employ the fundamental concept of the magnetic dipole to construct a three-dimensional magnetic dipole model capable of representing defect orientation information. The model is formed by using the center of the defect inside the material as the origin, the outer normal direction of the material as the Y-axis, and the direction of the defect as the Z-axis. This creates a spatial Cartesian coordinate system, as seen in Figure 2.
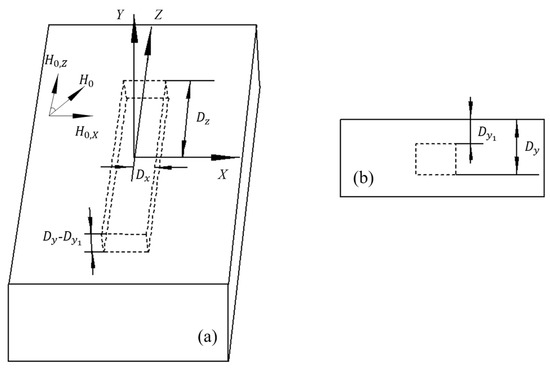
Figure 2.
Schematic diagram of internal damage in three-dimensional coordinates in which (a) shows the overall schematic diagram and (b) shows the longitudinal cross section.
As depicted in Figure 2a, the are established along the three orthogonal directions of the rectangular groove, their lengths are given as , and their widths are given as . As shown in Figure 2b, the depth of the internal damage is , is the external magnetic field, which is assumed to be parallel to the XOZ, and the angle of the defect direction is denoted as θ. The external magnetic field is vectorially decomposed into two vectors and , which are parallel and perpendicular to the defect direction, with the following expression:
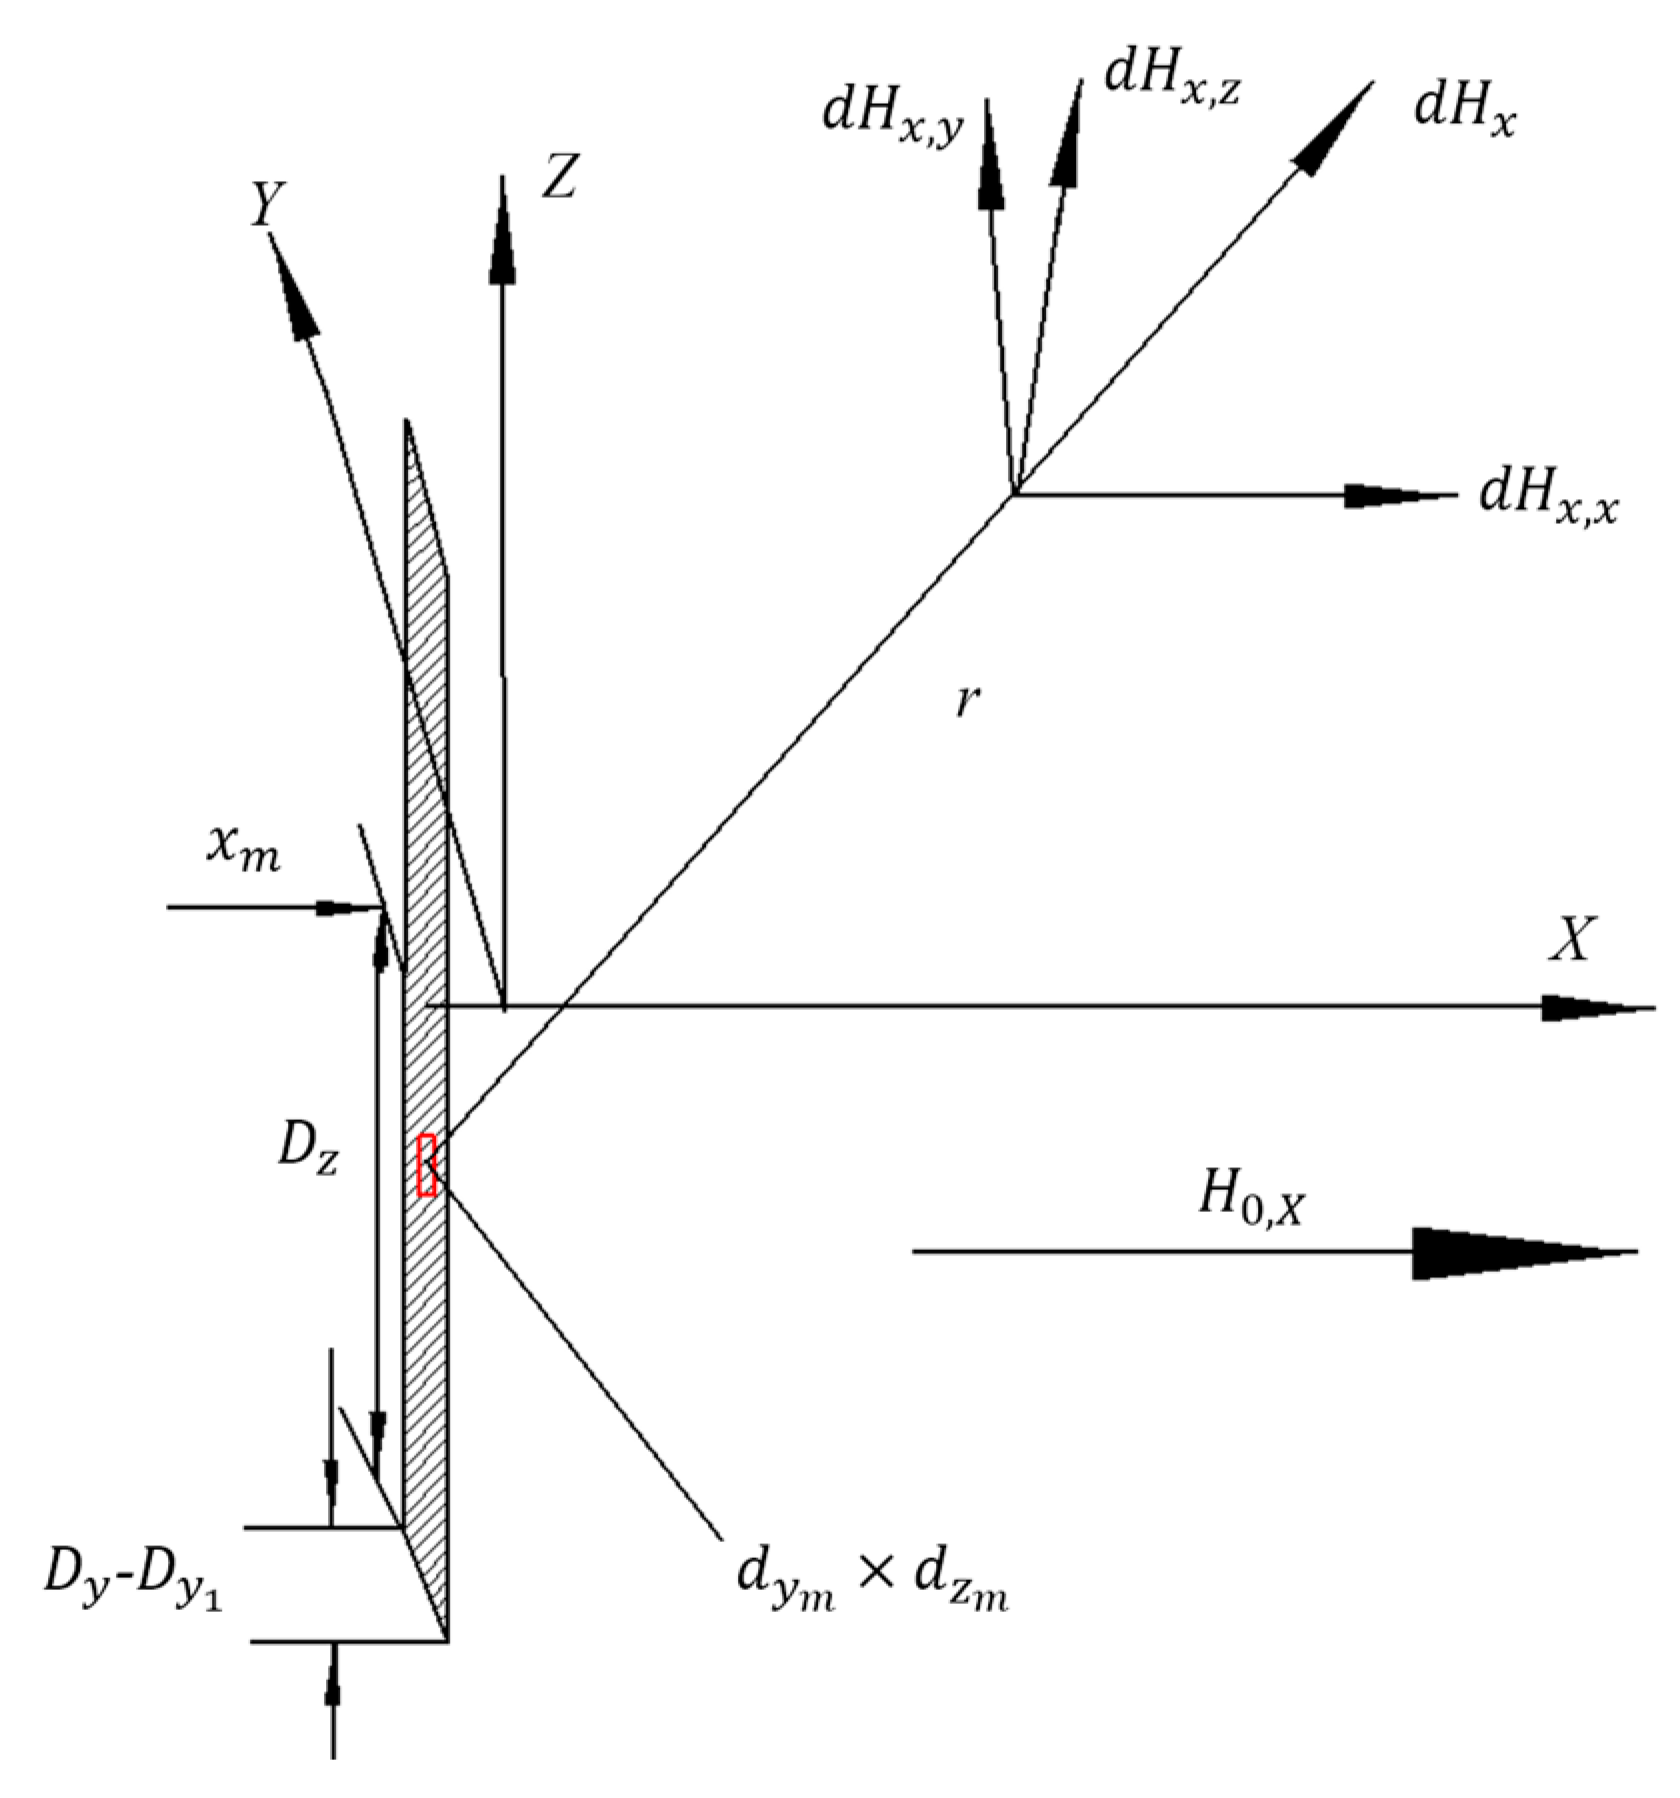
Thus, the external magnetic field may be seen as the combination of two perpendicular magnetizing fields and acting on the directed defect. The magnetic field aligned with the plane can be separated into magnetic field components aligned with the x-axis and z-axis for analysis. By applying the principle of superposition of magnetic fields, the two vector results are combined to determine the distribution of the leakage field caused by the defect. Firstly, vector analysis is used to examine the magnetization field , and Figure 3 displays the magnetic field distribution of the transverse magnetic pole microplate element.
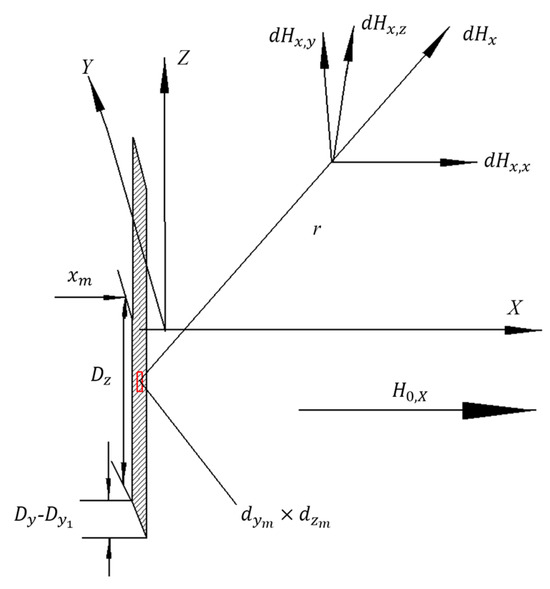
Figure 3.
Magnetic field distribution of transverse magnetic pole microfacet elements.
The magnetic charge density of the rectangular surface perpendicular to the direction of magnetic excitation is , which may be found by analogy with the two-dimensional magnetic dipole model, assuming that the wire rope has been magnetized to saturation:
where represents the density of magnetic charges, is the materials magnetic permeability, and is the separation between space and the magnetic charge surface.
At point , the components in the three coordinate directions are
The leakage field generated by the actual loaded magnetic field on the defect is actually the synthetic field of the left and right end faces, so the leakage vector generated at point is:
where: are the three basis vectors of the coordinate system, respectively.
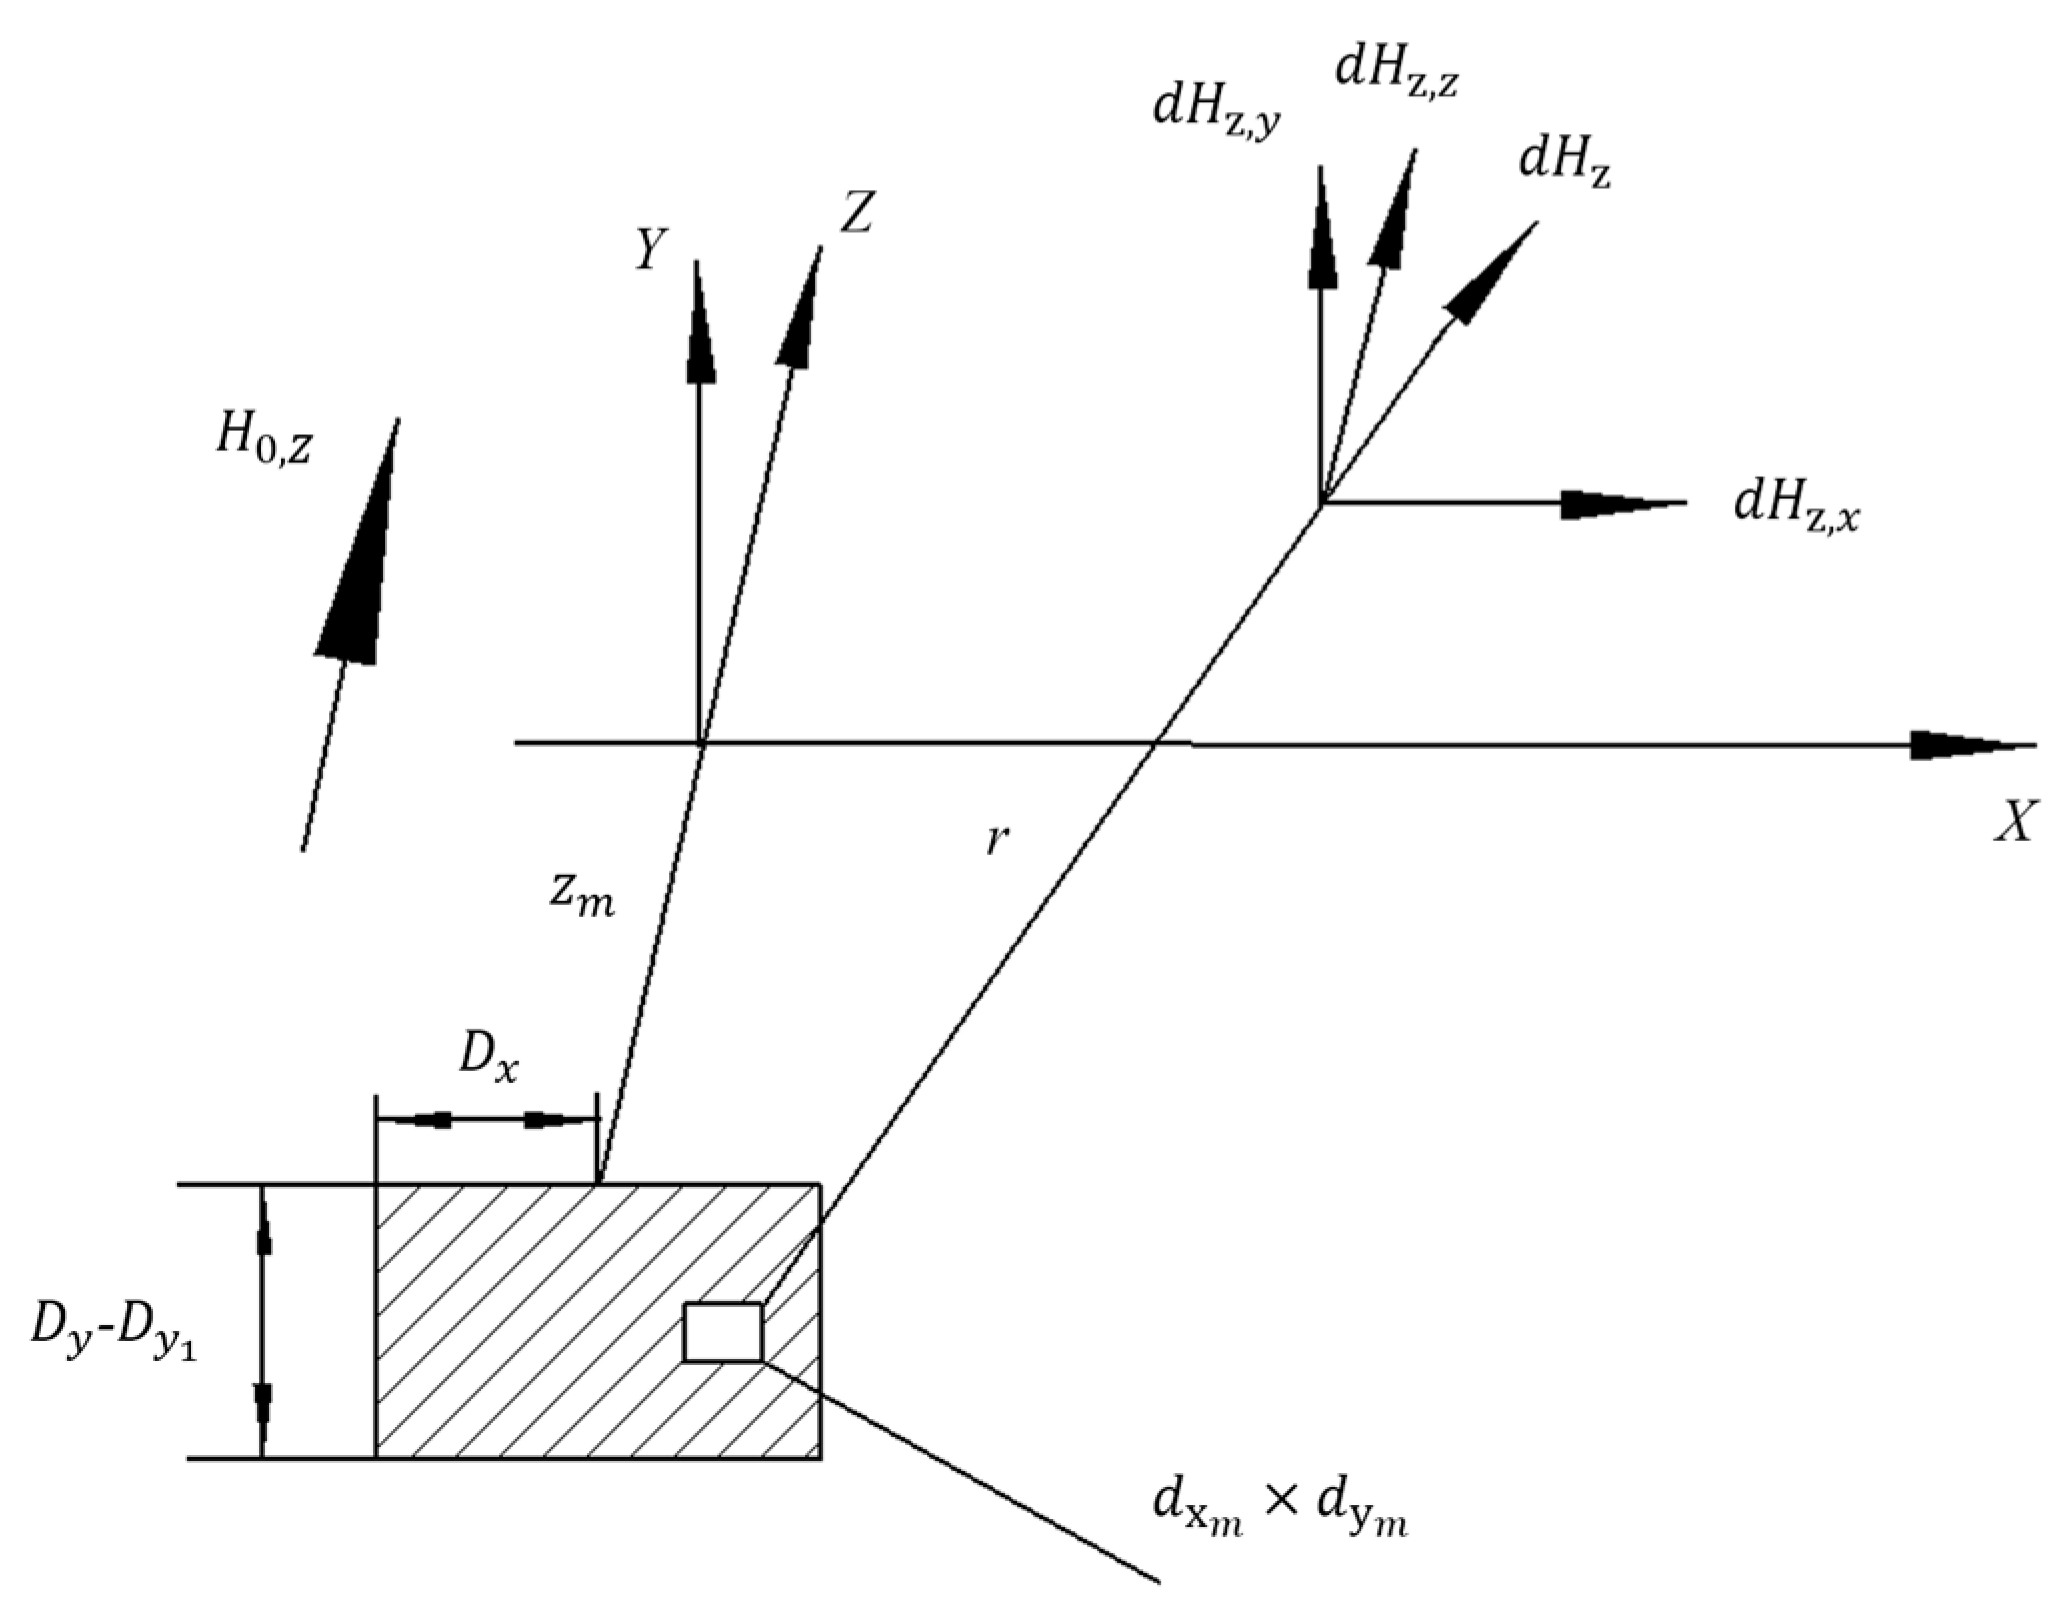
Similar to the calculation of the magnetization field , since the magnetic field is perpendicular to the two longitudinal slot walls of the defect, a magnetic charge surface can be formed on the longitudinal slot wall, and therefore, the magnetic field intensity distribution in space generated by the microelementary surface of the slot wall is shown in Figure 4.
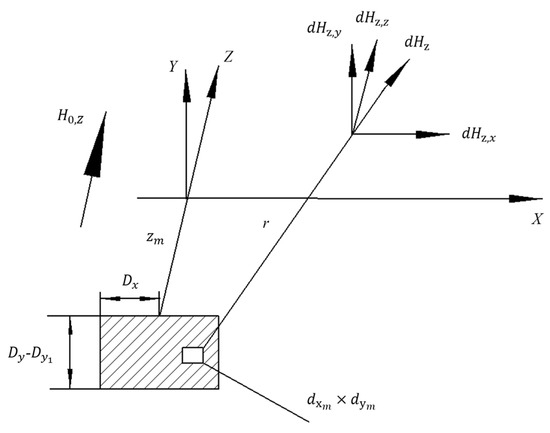
Figure 4.
Magnetic field distribution in the longitudinal magnetic pole microelement surface.
As can be seen from Figure 4, in the magnetic field H_, under the excitation of , the components in the three coordinate directions of point are:
Therefore, the leakage vectors of the upper and lower end surfaces at point are:
Consequently, the vector sum of the magnetic fields in the two directions can be used to get the total magnetic field at point :
The equation above allows for the orthogonal breakdown of any direction of internal damage in a finite-length wire rope, enabling the identification of such damage.
2.3. Variational Modal Decomposition Algorithm
The Variational Modal Decomposition (VMD) technique is a noise reduction approach that is specifically designed to analyze signals that are nonlinear and lack smoothness. It possesses the ability to successfully prevent modal aliasing and the excessive increase of decomposition layers during the noise reduction process, making it distinct from other methods. The fundamental concept behind the VMD method is to convert the problem of signal decomposition processing into the process of constructing and solving the variational decomposition problem. The VMD technique can effectively decompose a nonlinear signal into K signal components, known as intrinsic modal functions (IMF), ranging from low frequency to high frequency. The process involves iteratively optimizing the intrinsic modal function to accurately replicate the original signal. The VMD method progressively selects signal components from various frequency ranges in each iteration by improving the coupling connection between the components. The computing method of the variational modal decomposition technique is presented in the following manner.
Firstly, the Hilber transform is applied to the IMF component to obtain its resolved signal and one-sided spectrum.
Multiply by the exponential function to shift the center band of component to the fundamental band:
where is a vectorial description of the center frequency in the complex plane.
Calculate the square of the gradient parameter L2 of this modulated signal and solve for the bandwidth of each IMF.
The constraints model established to minimize the sum of the bandwidths of the components in the VMD algorithm is shown below:
To get the best possible solution for the constrained model, it is necessary to transform the constrained problem into an unconstrained issue. This may be accomplished by augmenting the problem with the aid of the Lagrange function:
where is the quadratic penalty factor; is the Lagrange multiplier; the alternating direction multiplier algorithm is used to continuously update the , , of each IMF; and the saddle point of the Lagrange expression is calculated.
At this point, the solution of the quadratic optimization problem to be solved is obtained as:
where is the number of iterations.
where ϵ is the discrimination accuracy.
2.4. PSO-VMD Algorithm
The fundamental parameters of VMD consist of the modal parameter K and the penalty factor α used in the initial signal decomposition. One issue is when the modal parameter is excessively large, which results in over-decomposition and loss of the original signal. Conversely, if the modal parameter is too small, it leads to under-decomposition, where the decomposition modes interact with each other and fail to reduce the signal complexity. Additionally, the penalty factor’s value is critical for ensuring the accuracy of modal decomposition when dealing with strong interference signals. Typically, the selection of K and α is based on specific circumstances, which are unpredictable. The PSO method has strong global convergence capability for optimizing the parameters of intricate systems. Because the internal damage signal of the wire rope is a small sample, which is a nonlinear and nonsmoothed problem, PSO has a better adaptability to the complex and dynamic environment, since it can deal with nonlinear and nonsmoothed problems. Compared to traditional optimization methods, PSO’s fast convergence speed enables it to identify the optimal solution in less time. Thus, this research utilizes Particle Swarm Optimization (PSO) to optimize the values of K and α. The optimization technique treats the parameters K and α of VMD as particles in PSO. The envelope entropy Ep determines the fitness value of the particles, as illustrated in the following equation:
where is the envelope signal of the original signal demodulated by the Hilbert transform and is the normalized expression of .
2.5. Dual-Attention Mechanism
This paper uses the Dual-Attention Module, which consists of both channel attention and spatial attention cascade, to enhance the recognition of internal damage in wire ropes. The module computes the importance of each damage feature in both the channel and spatial dimensions, allowing the network model to efficiently identify these features.
SE consists of two components: compression and excitation. The former compresses the global spatial information, while the latter performs feature learning in the channel dimension to determine the relative importance of each channel and, finally, assigns distinct weights to each channel.
The CA module’s structure, as seen in Figure 5, comprises global pooling, two convolutional layers, a ReLU activation function, and a sigmoid activation function. Global pooling utilizes average pooling to compress each feature from H × W × C to 1 × 1 × C, where H × W is reduced to 1 × 1 dimensions. Convolutional layers and the activation function assign varying weights to the features of various channels. The features set is provided as input. The feature set M is then compressed to , meaning that the spatial characteristics of each channel are compressed in the following manner:
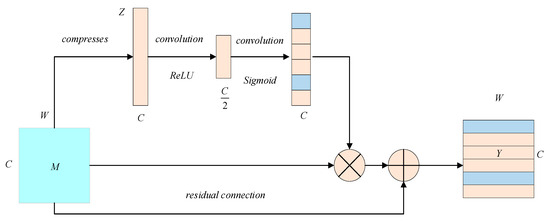
Figure 5.
Structure of channel attention.
The input feature set is compressed spatially into , which is then transformed into by two convolutional layers and an activation function calculated as follows:
where: is the sigmoid activation function; is the ReLU activation function; shows the convolution operation using the number of channels as 1 and the convolution kernel size as 1 × 1. is the value of the weight assigned to each channel; is finally multiplied by the set of input features M, and a new set of features is obtained, as shown in the formula below.
To maintain the original information, residual learning is employed to incorporate residual connections into the computation of channel attention, hence enhancing the potential for additional optimization. The formula is defined as:
where is the set of features enriched with weight information and raw information.
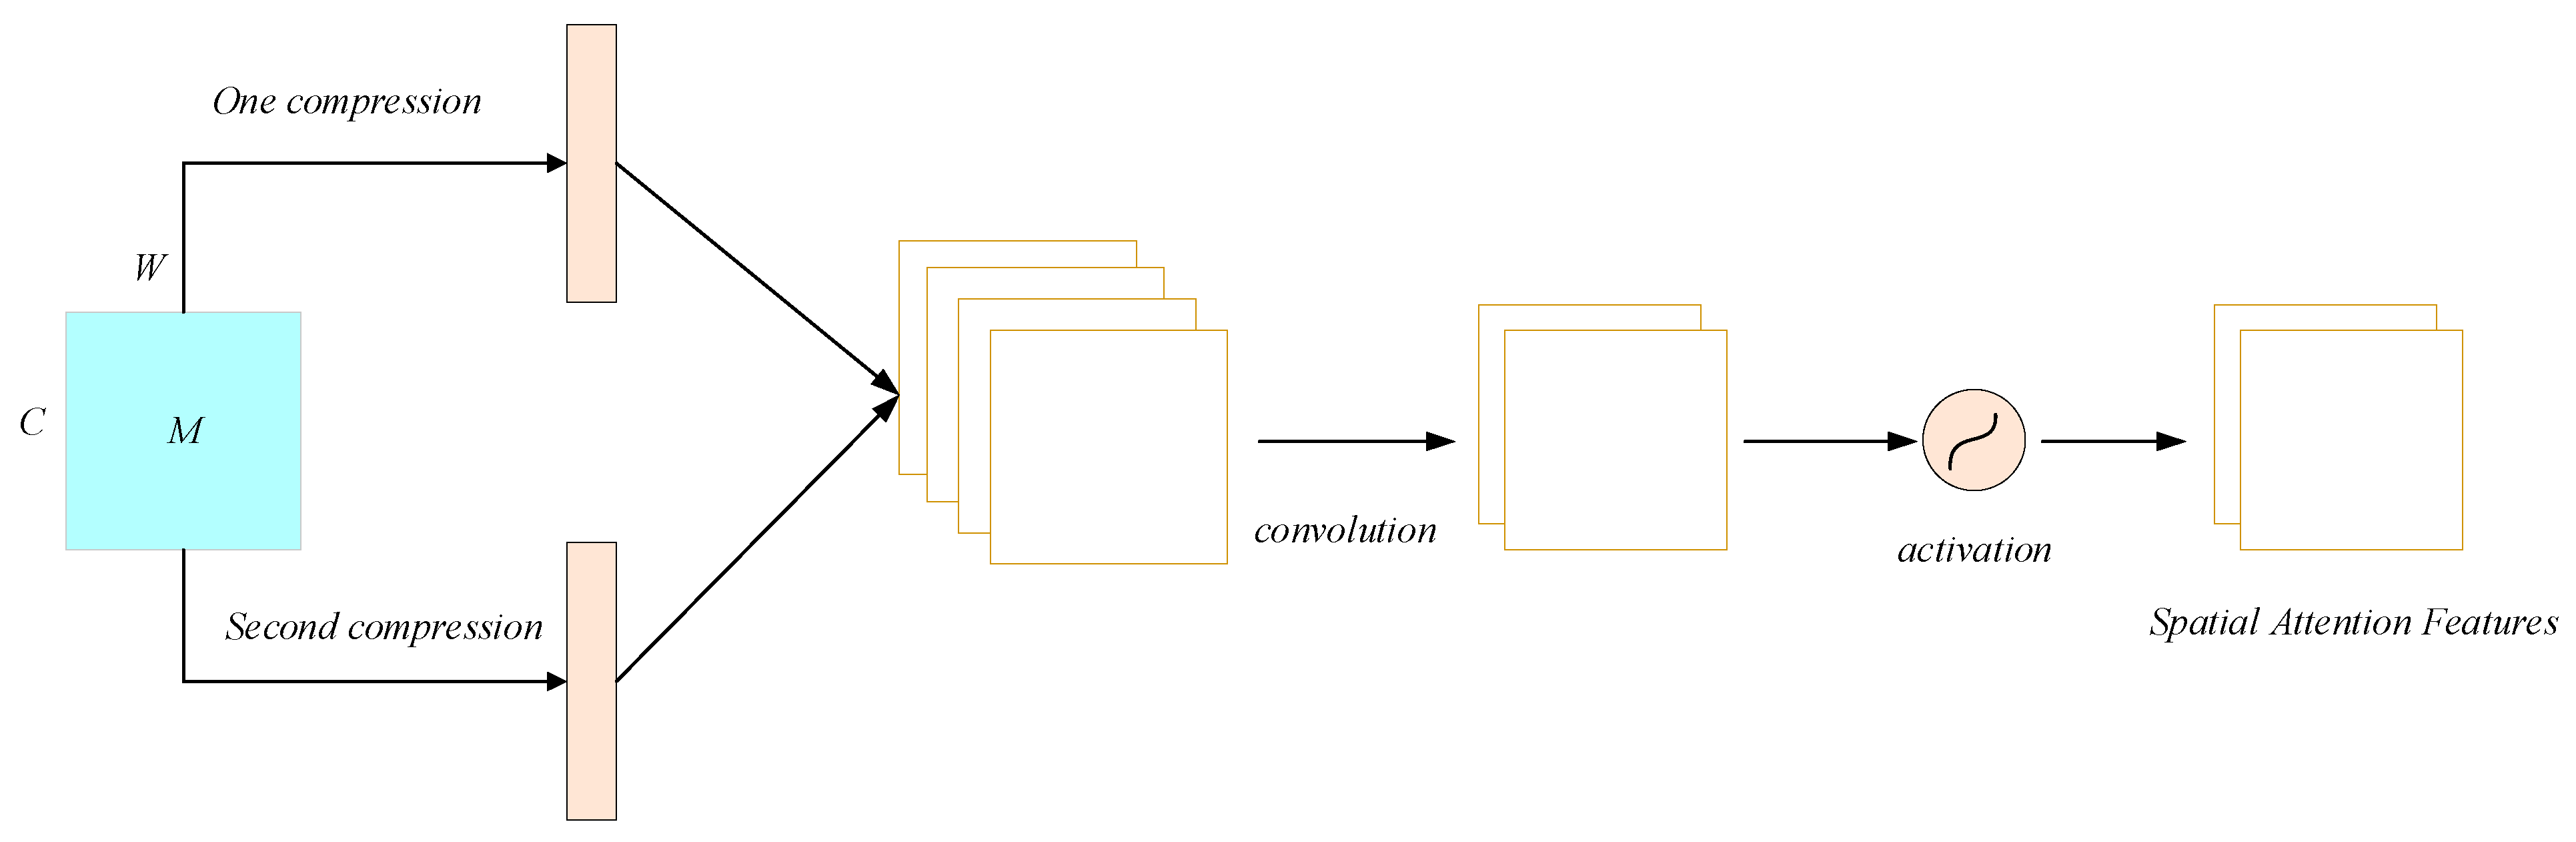
Spatial attention is based on the direction of the channel, focusing on the importance of regional information, which is complementary to channel attention, and its structure is shown in Figure 6.
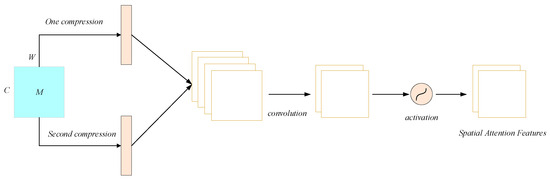
Figure 6.
Structure of spatial attention.
After the channel attention compression, the secondary compression based on the channel direction is carried out to obtain the feature with dimensions H × W × 2. It is calculated as follows:
where f is the convolution operation and σ is the ReLU activation function.
2.6. CNN-Attention Layer
The CNN-Attention layer first represents the wire rope damage features as a vector matrix, and then convolves the matrix using multiple convolution kernels of varying sizes. Next, we apply a maximum pooling operation to the convolved result, generating a new feature vector that the Attention mechanism uses as an input:
where is a higher level of expression than the feature vector, which is initialised at the beginning and updated as the model is trained, with larger score values indicating greater corresponding attention and greater importance of the feature. The feature vector score as a percentage of the overall is:
where . After first calculating the percentage corresponding to each feature vector, all feature vectors are then summed and re-averaged to obtain the final vector , calculated as:
2.7. GRU-Attention Layer
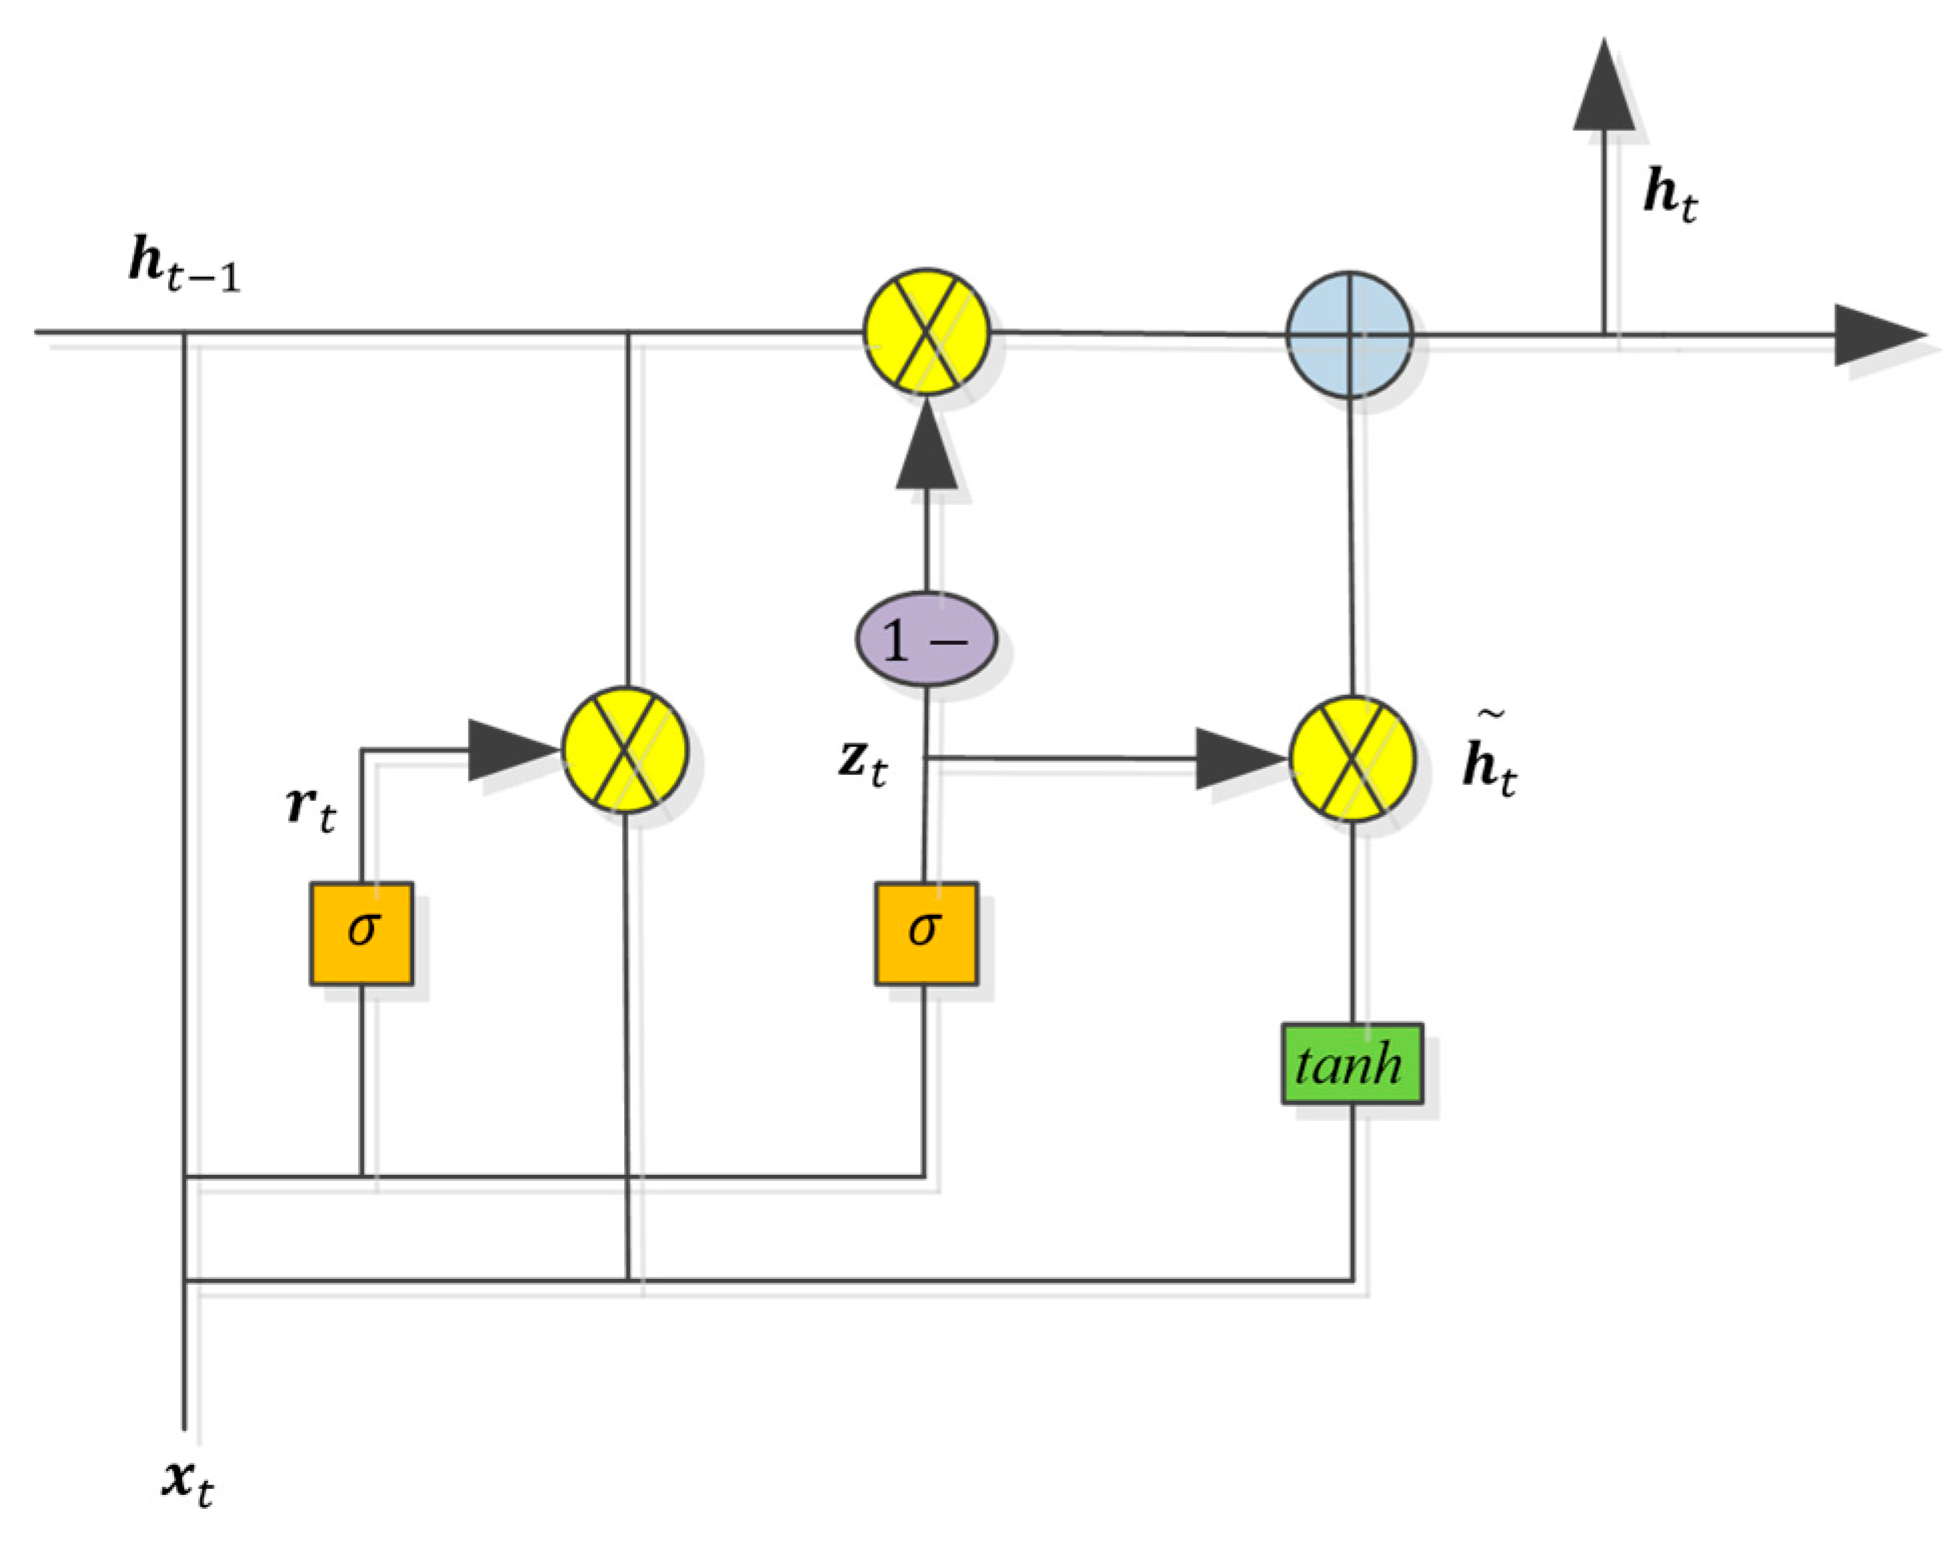
When working with long sequence data, the classic recurrent neural network (RNN) is vulnerable to the issue of gradient disappearance or explosion. Furthermore, the lengthy training cycle raises the cost of network training and increases the possibility of overfitting, which is detrimental to the precise identification of wire rope damage. In an effort to address the issue of gradient vanishing or exploding in typical recurrent neural networks (RNNs) when dealing with extended sequences, Cho et al. [34,35] introduced a novel RNN model known as the Gated Recurrent Unit (GRU) model. The network model is mainly composed of two gating units, the reset gate and the update gate, which have the advantages of a simple model, fewer parameters, and a shorter training period. Its single-neuron structure is shown in Figure 7, through which the GRU can be allowed to identify useful and useless information and use two gating units to regulate the flow and forgetting of data, with fewer parameters and faster training, which further solves the problems of gradient vanishing and gradient explosion of the traditional RNN while retaining its original function.

Figure 7.
GRU structure.
Not only that, but because the internal damage signal of the wire rope belongs to the small sample problem, the use of GRU can effectively solve the problem and at the same time shorten the detection time, so this paper adopts the GRU model as the key network for the recognition of the internal damage of the wire rope.
When the input vector , then the update formula of GRU is:
where: , , , , , is the weight matrix, is the activation function, is the multiplication symbol, is the update door, is the reset door, is a candidate hidden layer, and is the final output.
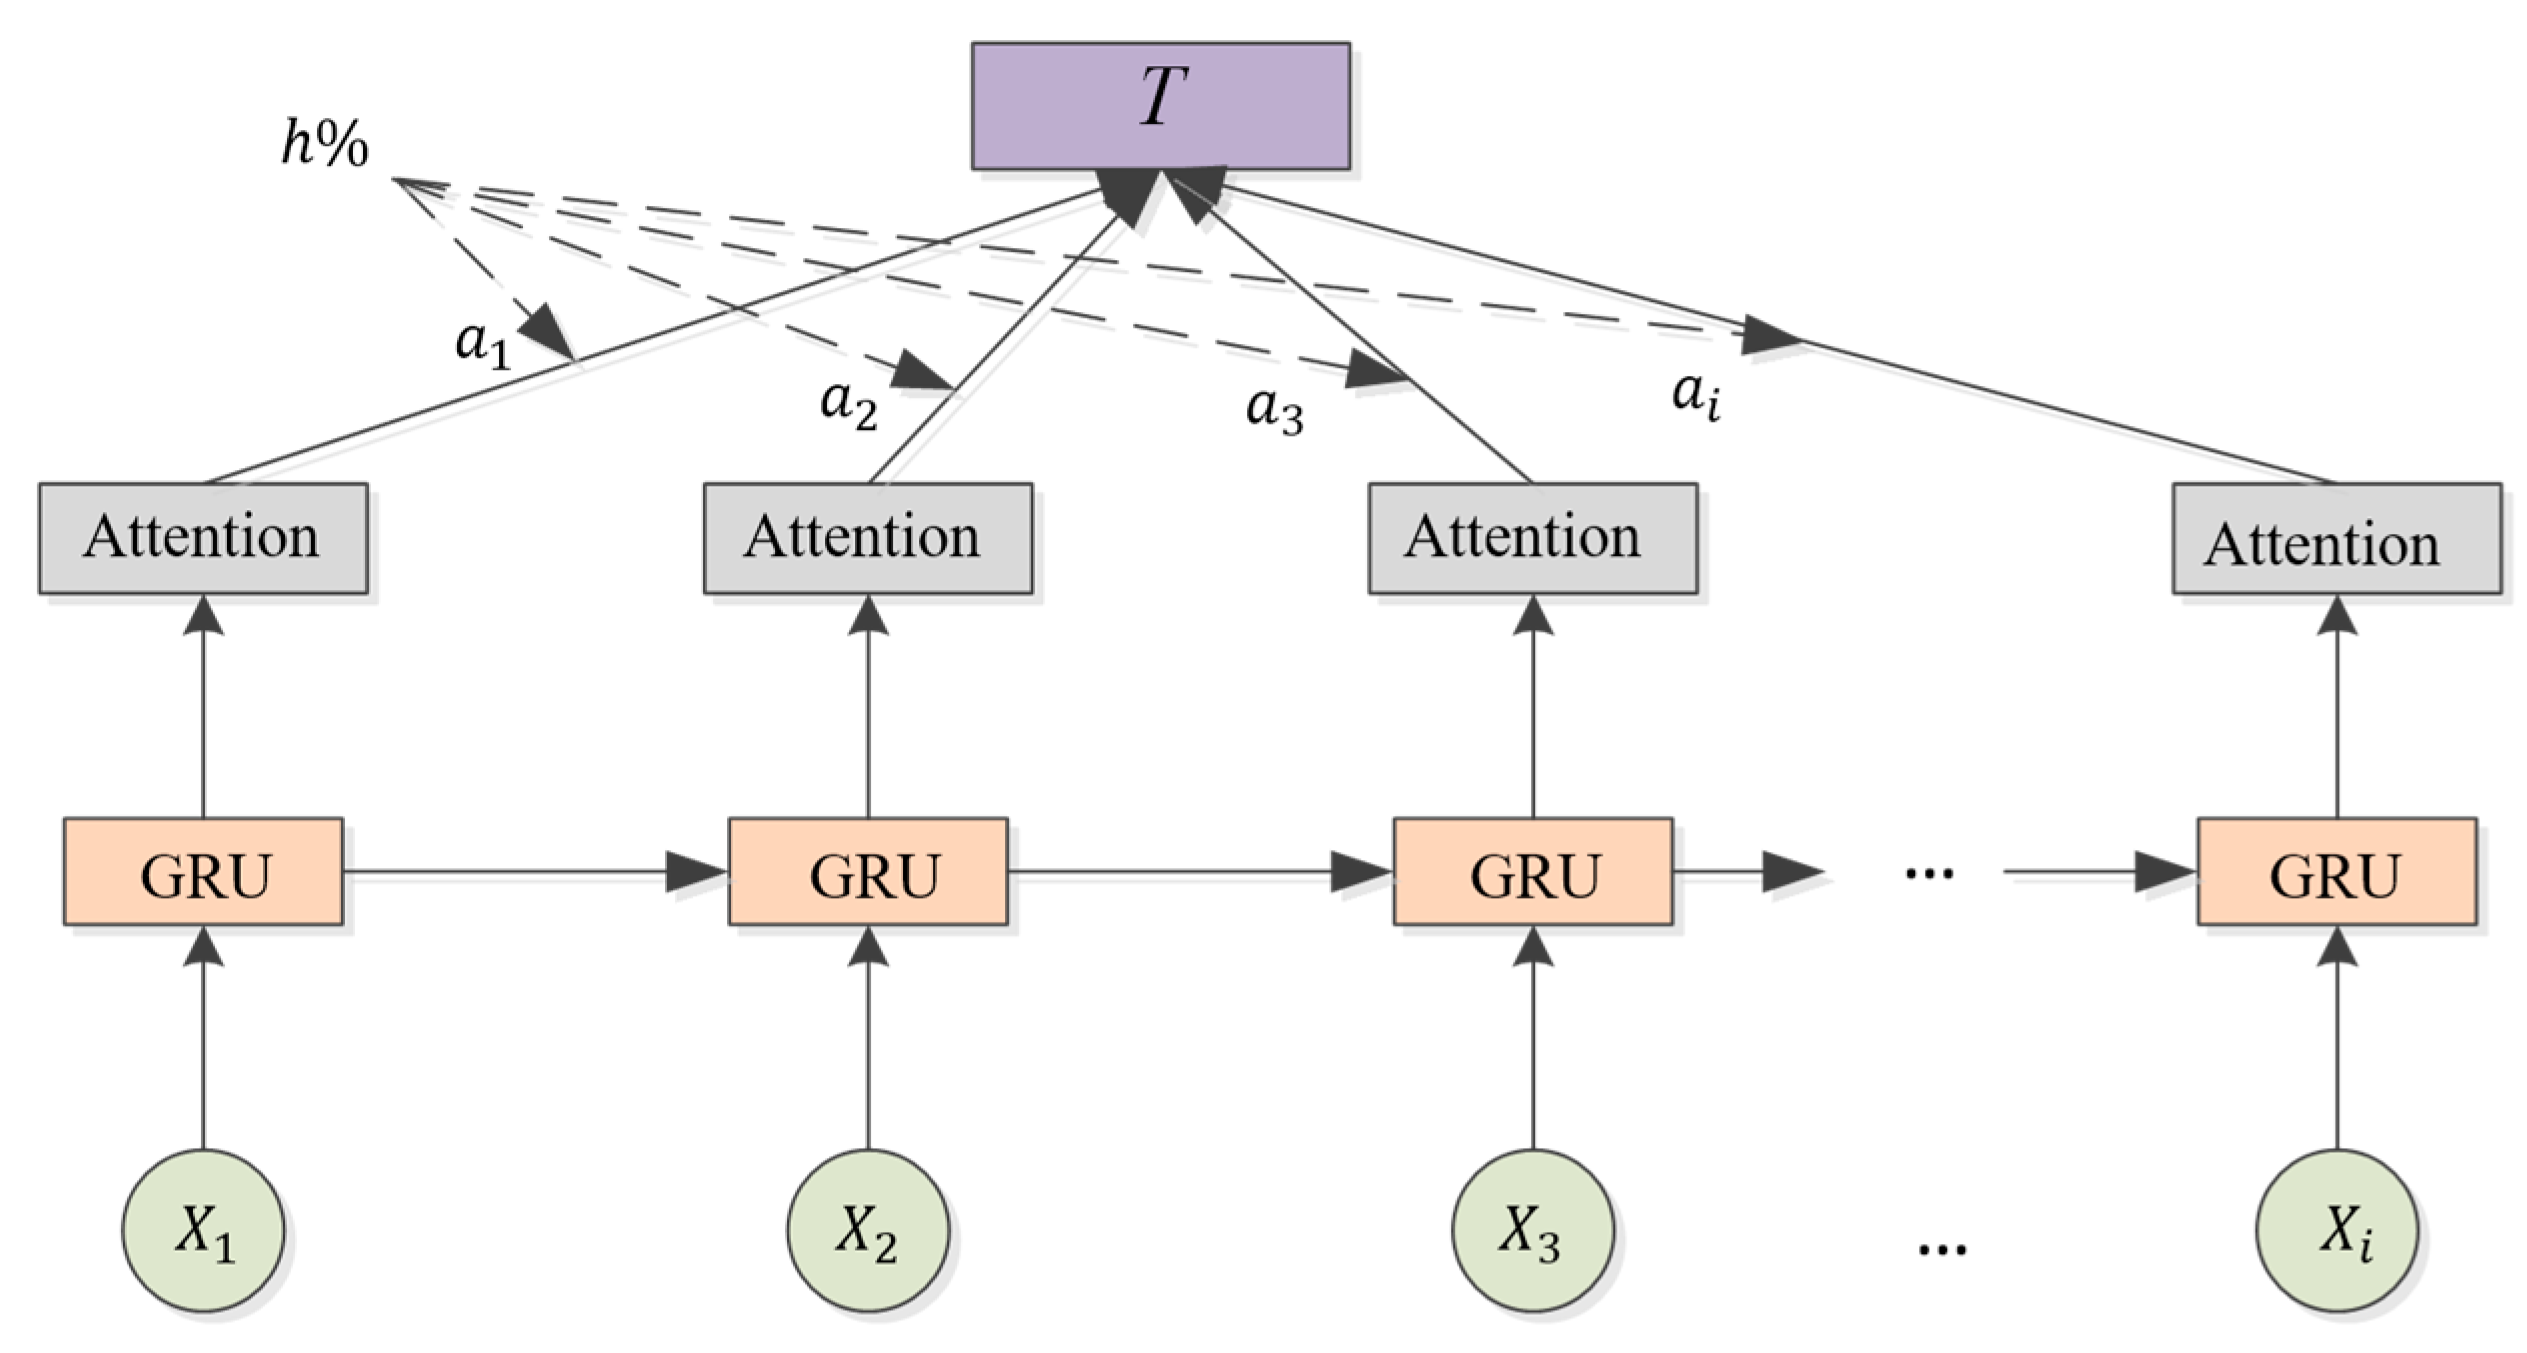
The output after the extraction of features by GRU is used as the input of attention, and the GRU-Attention structure is shown in Figure 8.
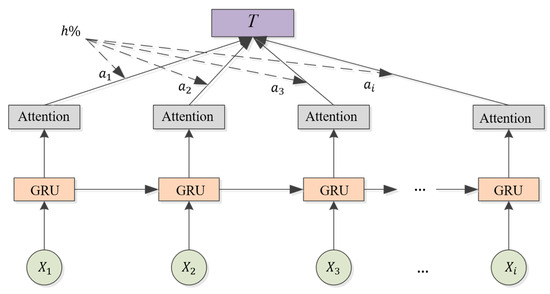
Figure 8.
GRU- Attention structure.
As shown in Figure 8, is input into the GRU model, and after calculation, the Attention mechanism is introduced to obtain the final vector T, which contains the wire rope damage features and focuses on the important features, which can effectively improve the recognition accuracy.
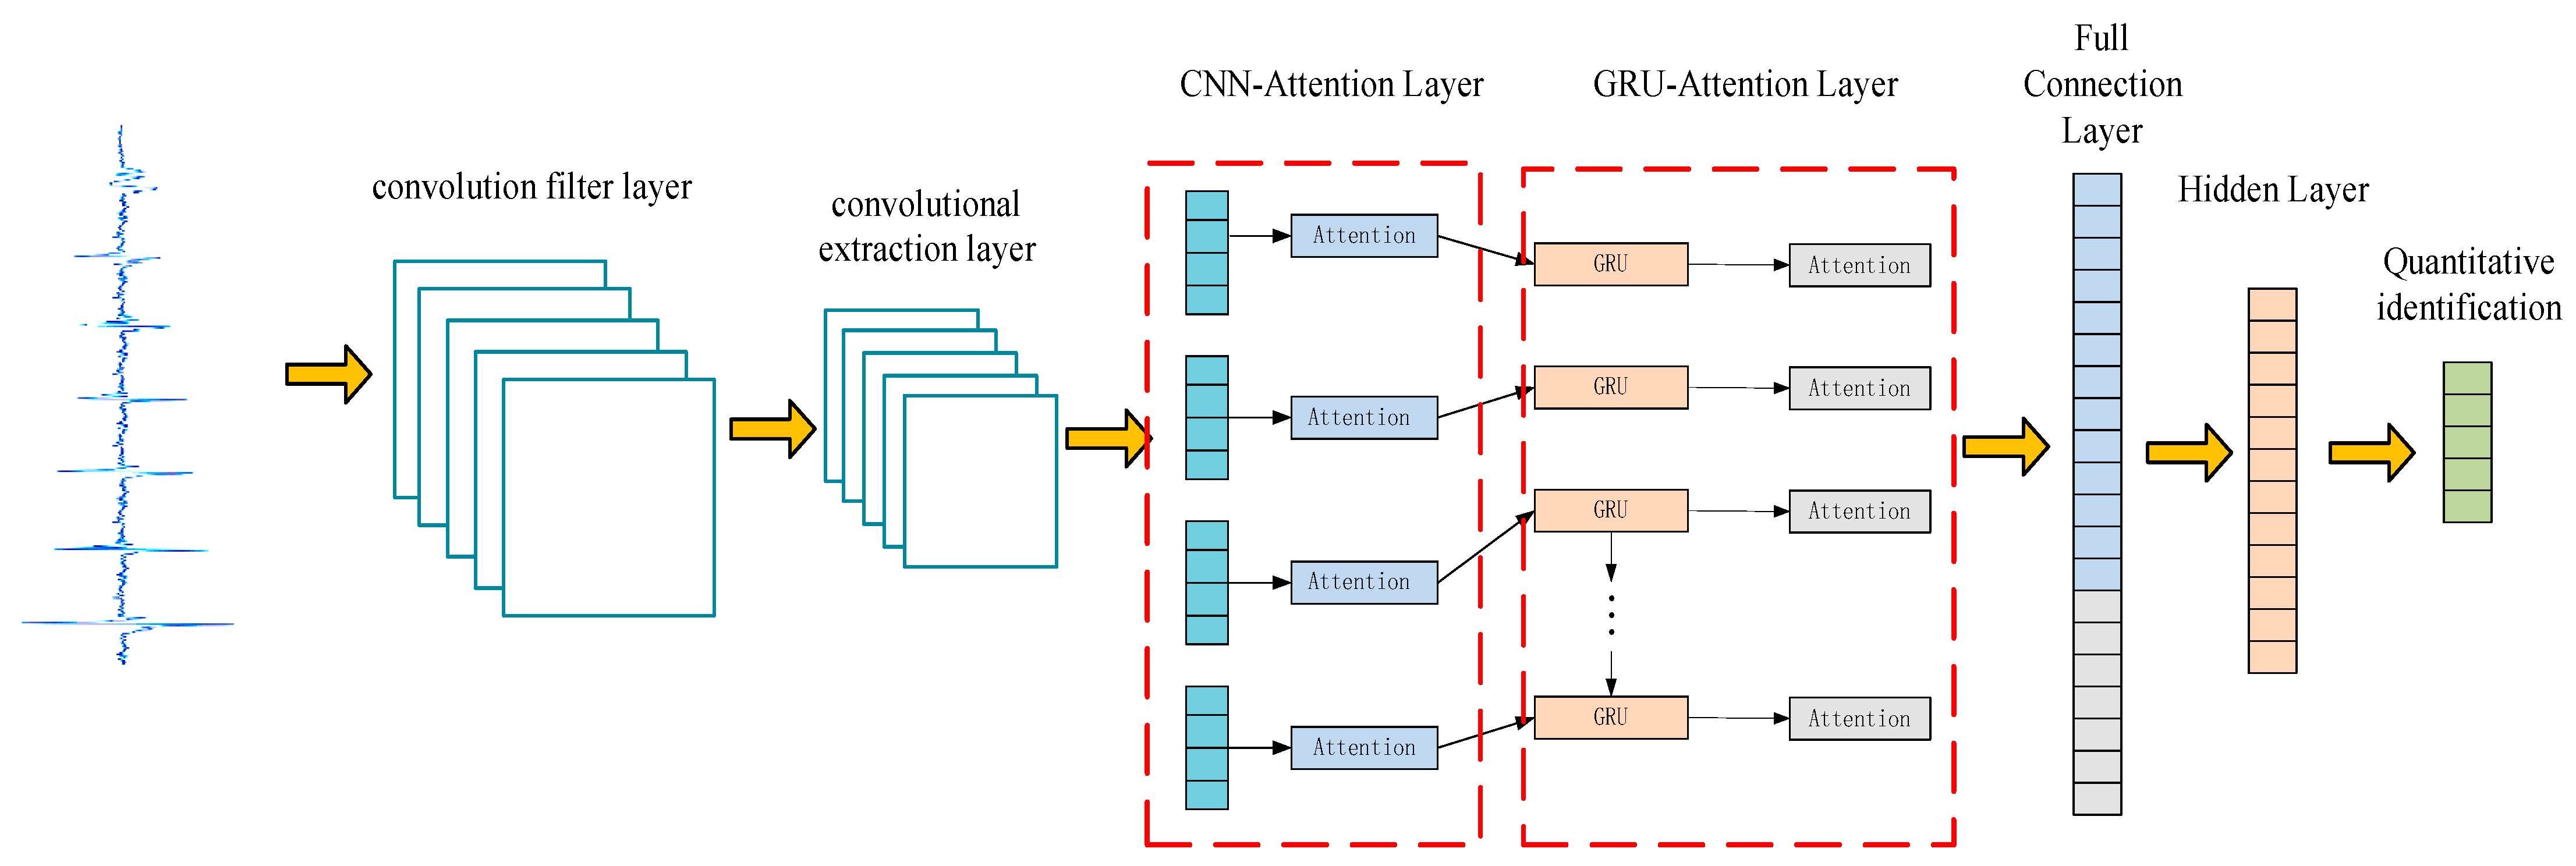
2.8. Identification Model Construction
The structure of the CNN-GRU network model based on the Attention mechanism proposed in this paper is shown in Figure 9, which mainly consists of a convolutional layer, a CNN-Attention layer, a GRU-Attention layer, a fully connected layer, an implicit layer, and an identification layer. The model can automatically extract the internal damage features of the wire rope and identify them quantitatively. Taking the wire rope damage data as input, the internal damage features of wire rope are extracted using a convolutional neural network CNN and a two-way gated recurrent unit (GRU), combining the advantages of the two neural networks, which can make use of the advantages of CNN in extracting local features as well as those of the two-way gated recurrent unit (GRU) in extracting global features. At the same time, it takes into account the effects of different damage signals on the recognition effect and the model Attention mechanism is added, which makes the model identify important features through the Attention mechanism and improves the quantitative accuracy.
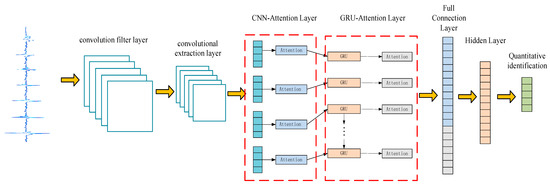
Figure 9.
General architecture of the CNN-GRU -Attention network model.
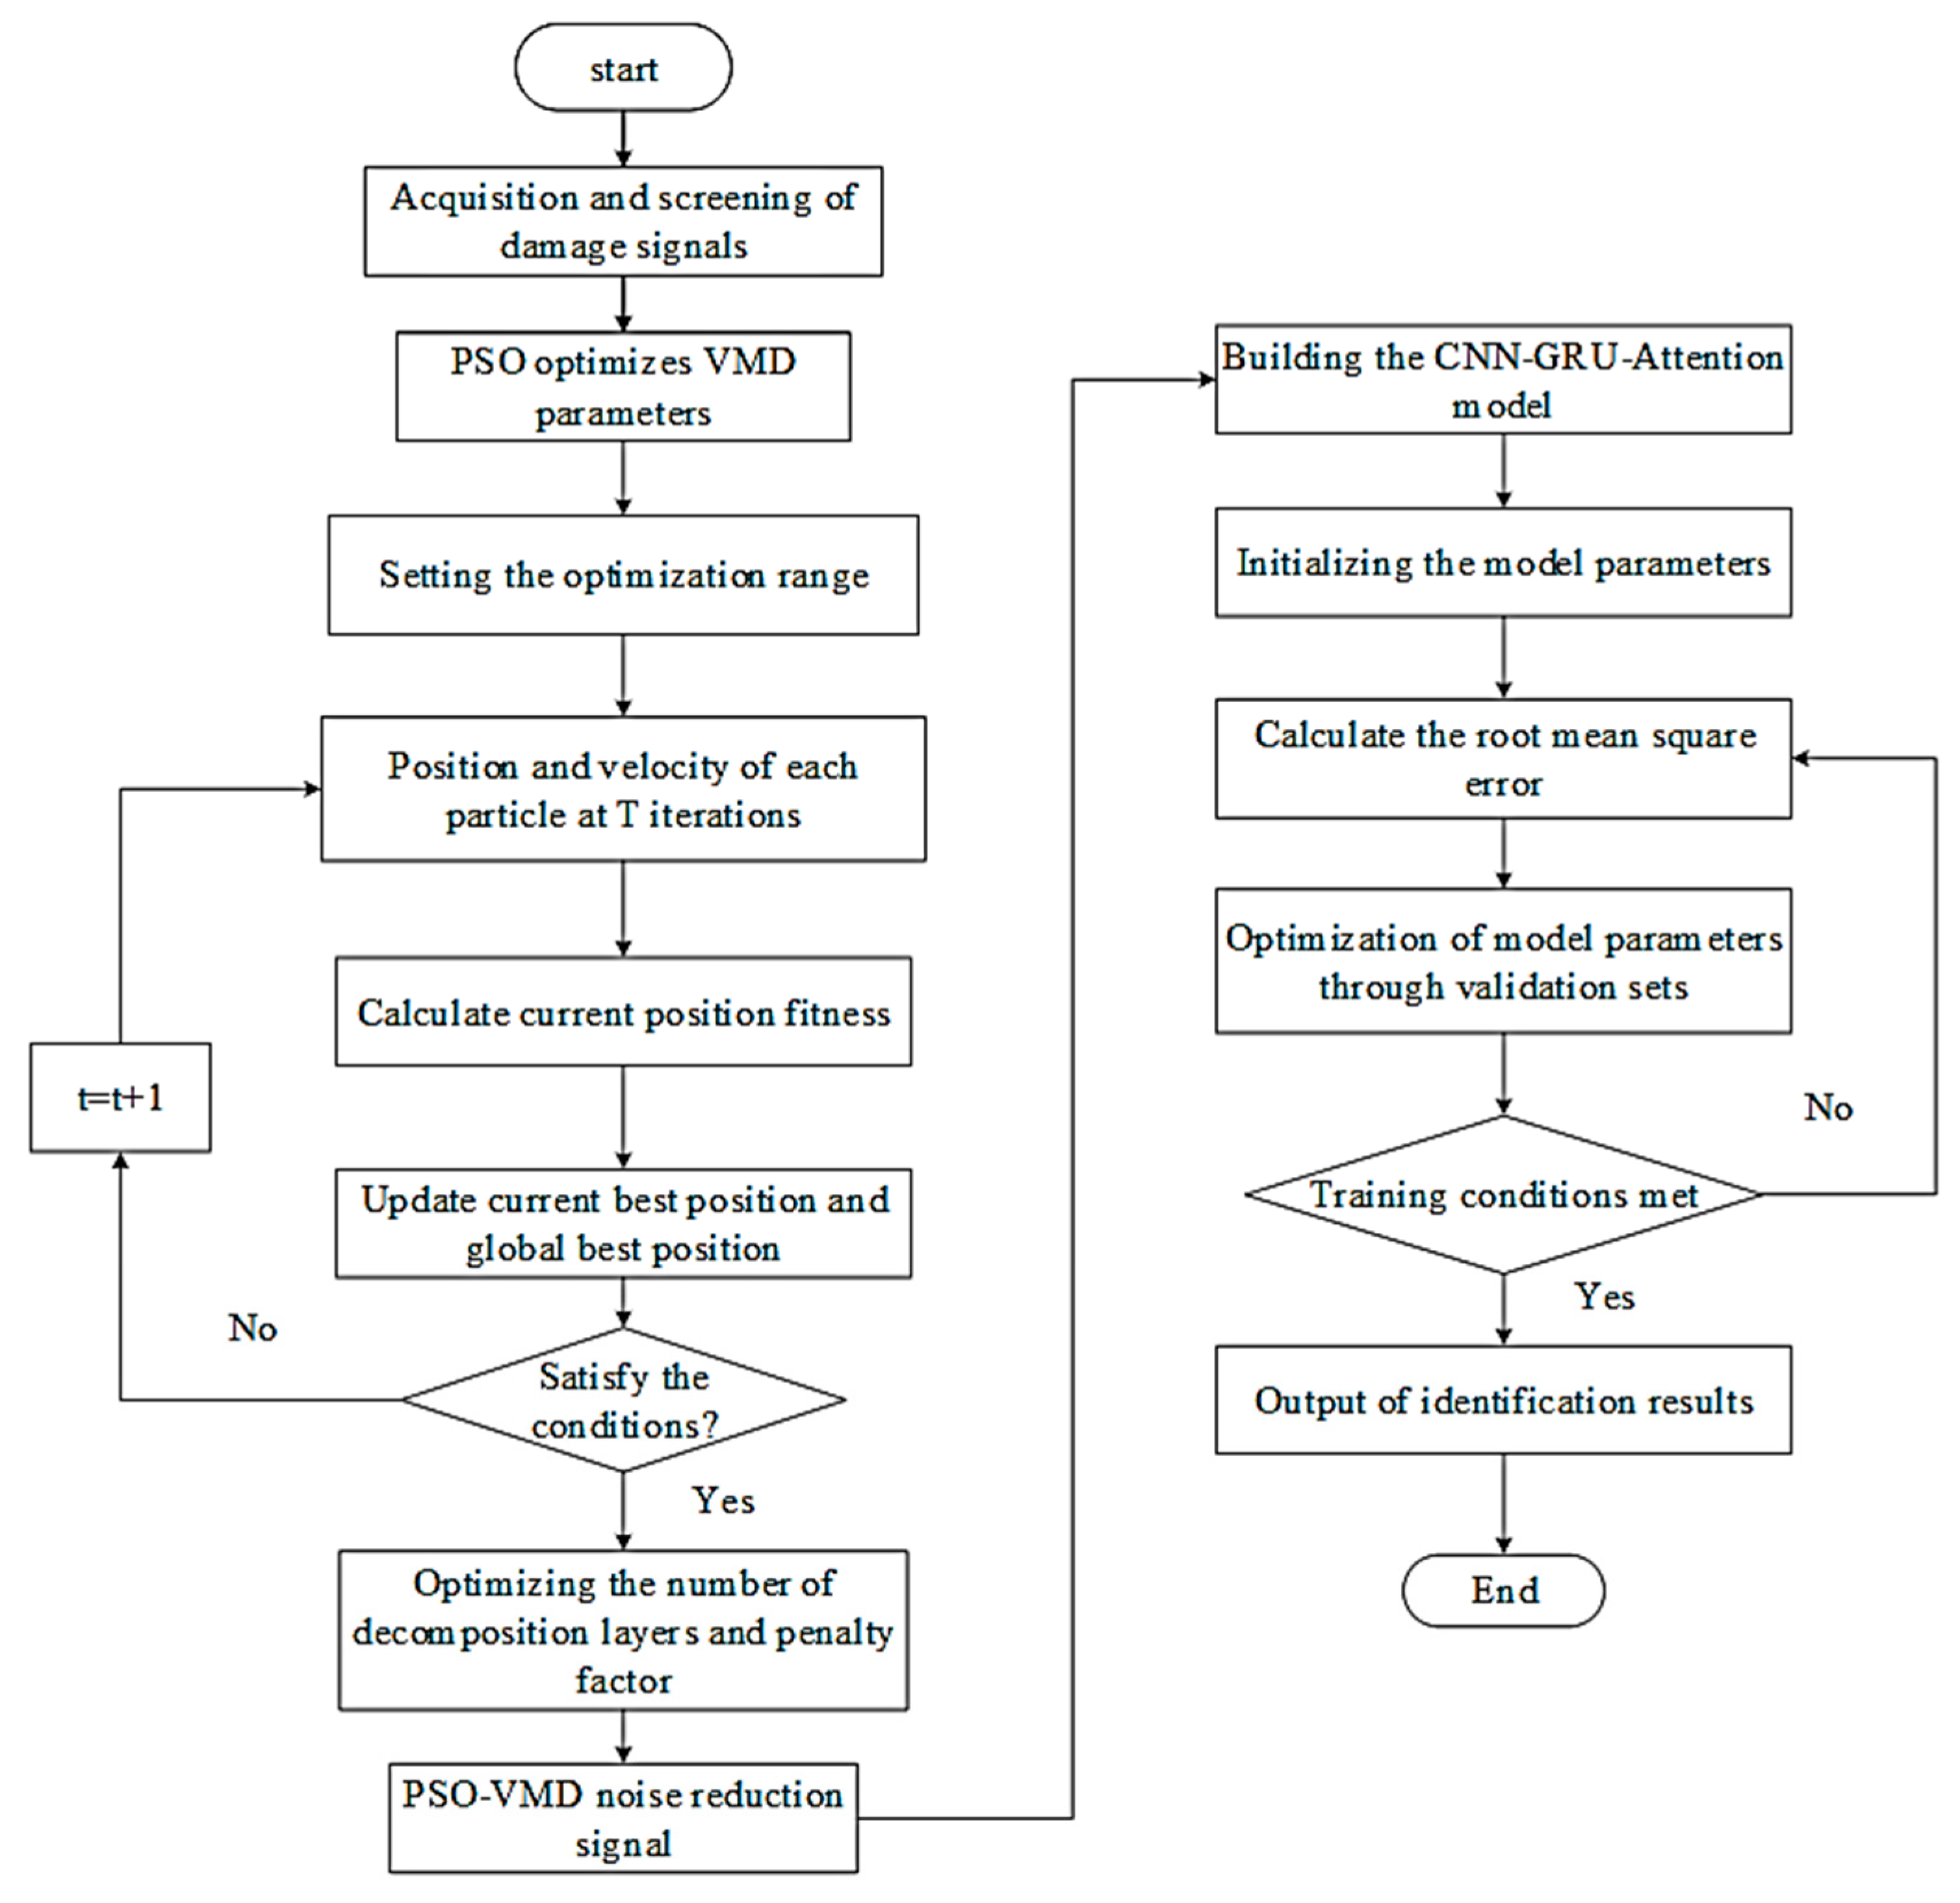
2.9. PSO-VMD-CNN-GRU Algorithm Flow
Figure 10 depicts the whole procedure for identifying internal damage in wire ropes.
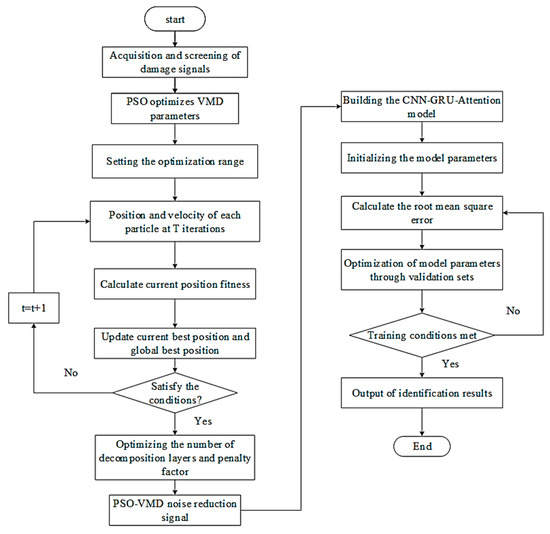
Figure 10.
Overall flow chart of PSO-VMD-CNN-GRU algorithm.
Step 1: Normalize the data.
Step 2: Initialize the particle population, compute the particles’ respective fitness values, and modify their velocity and location.
Step 3: If the continuous iteration of the particle population in the search space meets the algorithm termination requirements, output the optimal parameters; if not, continue with the iteration.
Step 4: Using the obtained optimal decomposition layers and penalty factor, build the PSO-VMD model and get the noise reduction results.
Step 5: Create the recognition model and specify the model parameters for the training setting.
Step 6: Compute the root mean square error and save the model weights after improving the model parameters using the validation set.
Step 7: If the training conditions are met, then output the recognition results; otherwise, continue to iterate.
3. Simulation and Analysis
In order to improve the traditional sensor, it is necessary to explore the relationship between internal and external damage, obtain accurate difference values, and provide a basis for the improvement of the sensor. Therefore, Maxwell magnetic field simulation software is used in this study to simulate the dynamic magnetic field of the wire rope detection model and theoretically determine the magnetic induction intensity required by the sensor to detect the internal damage of the wire rope.
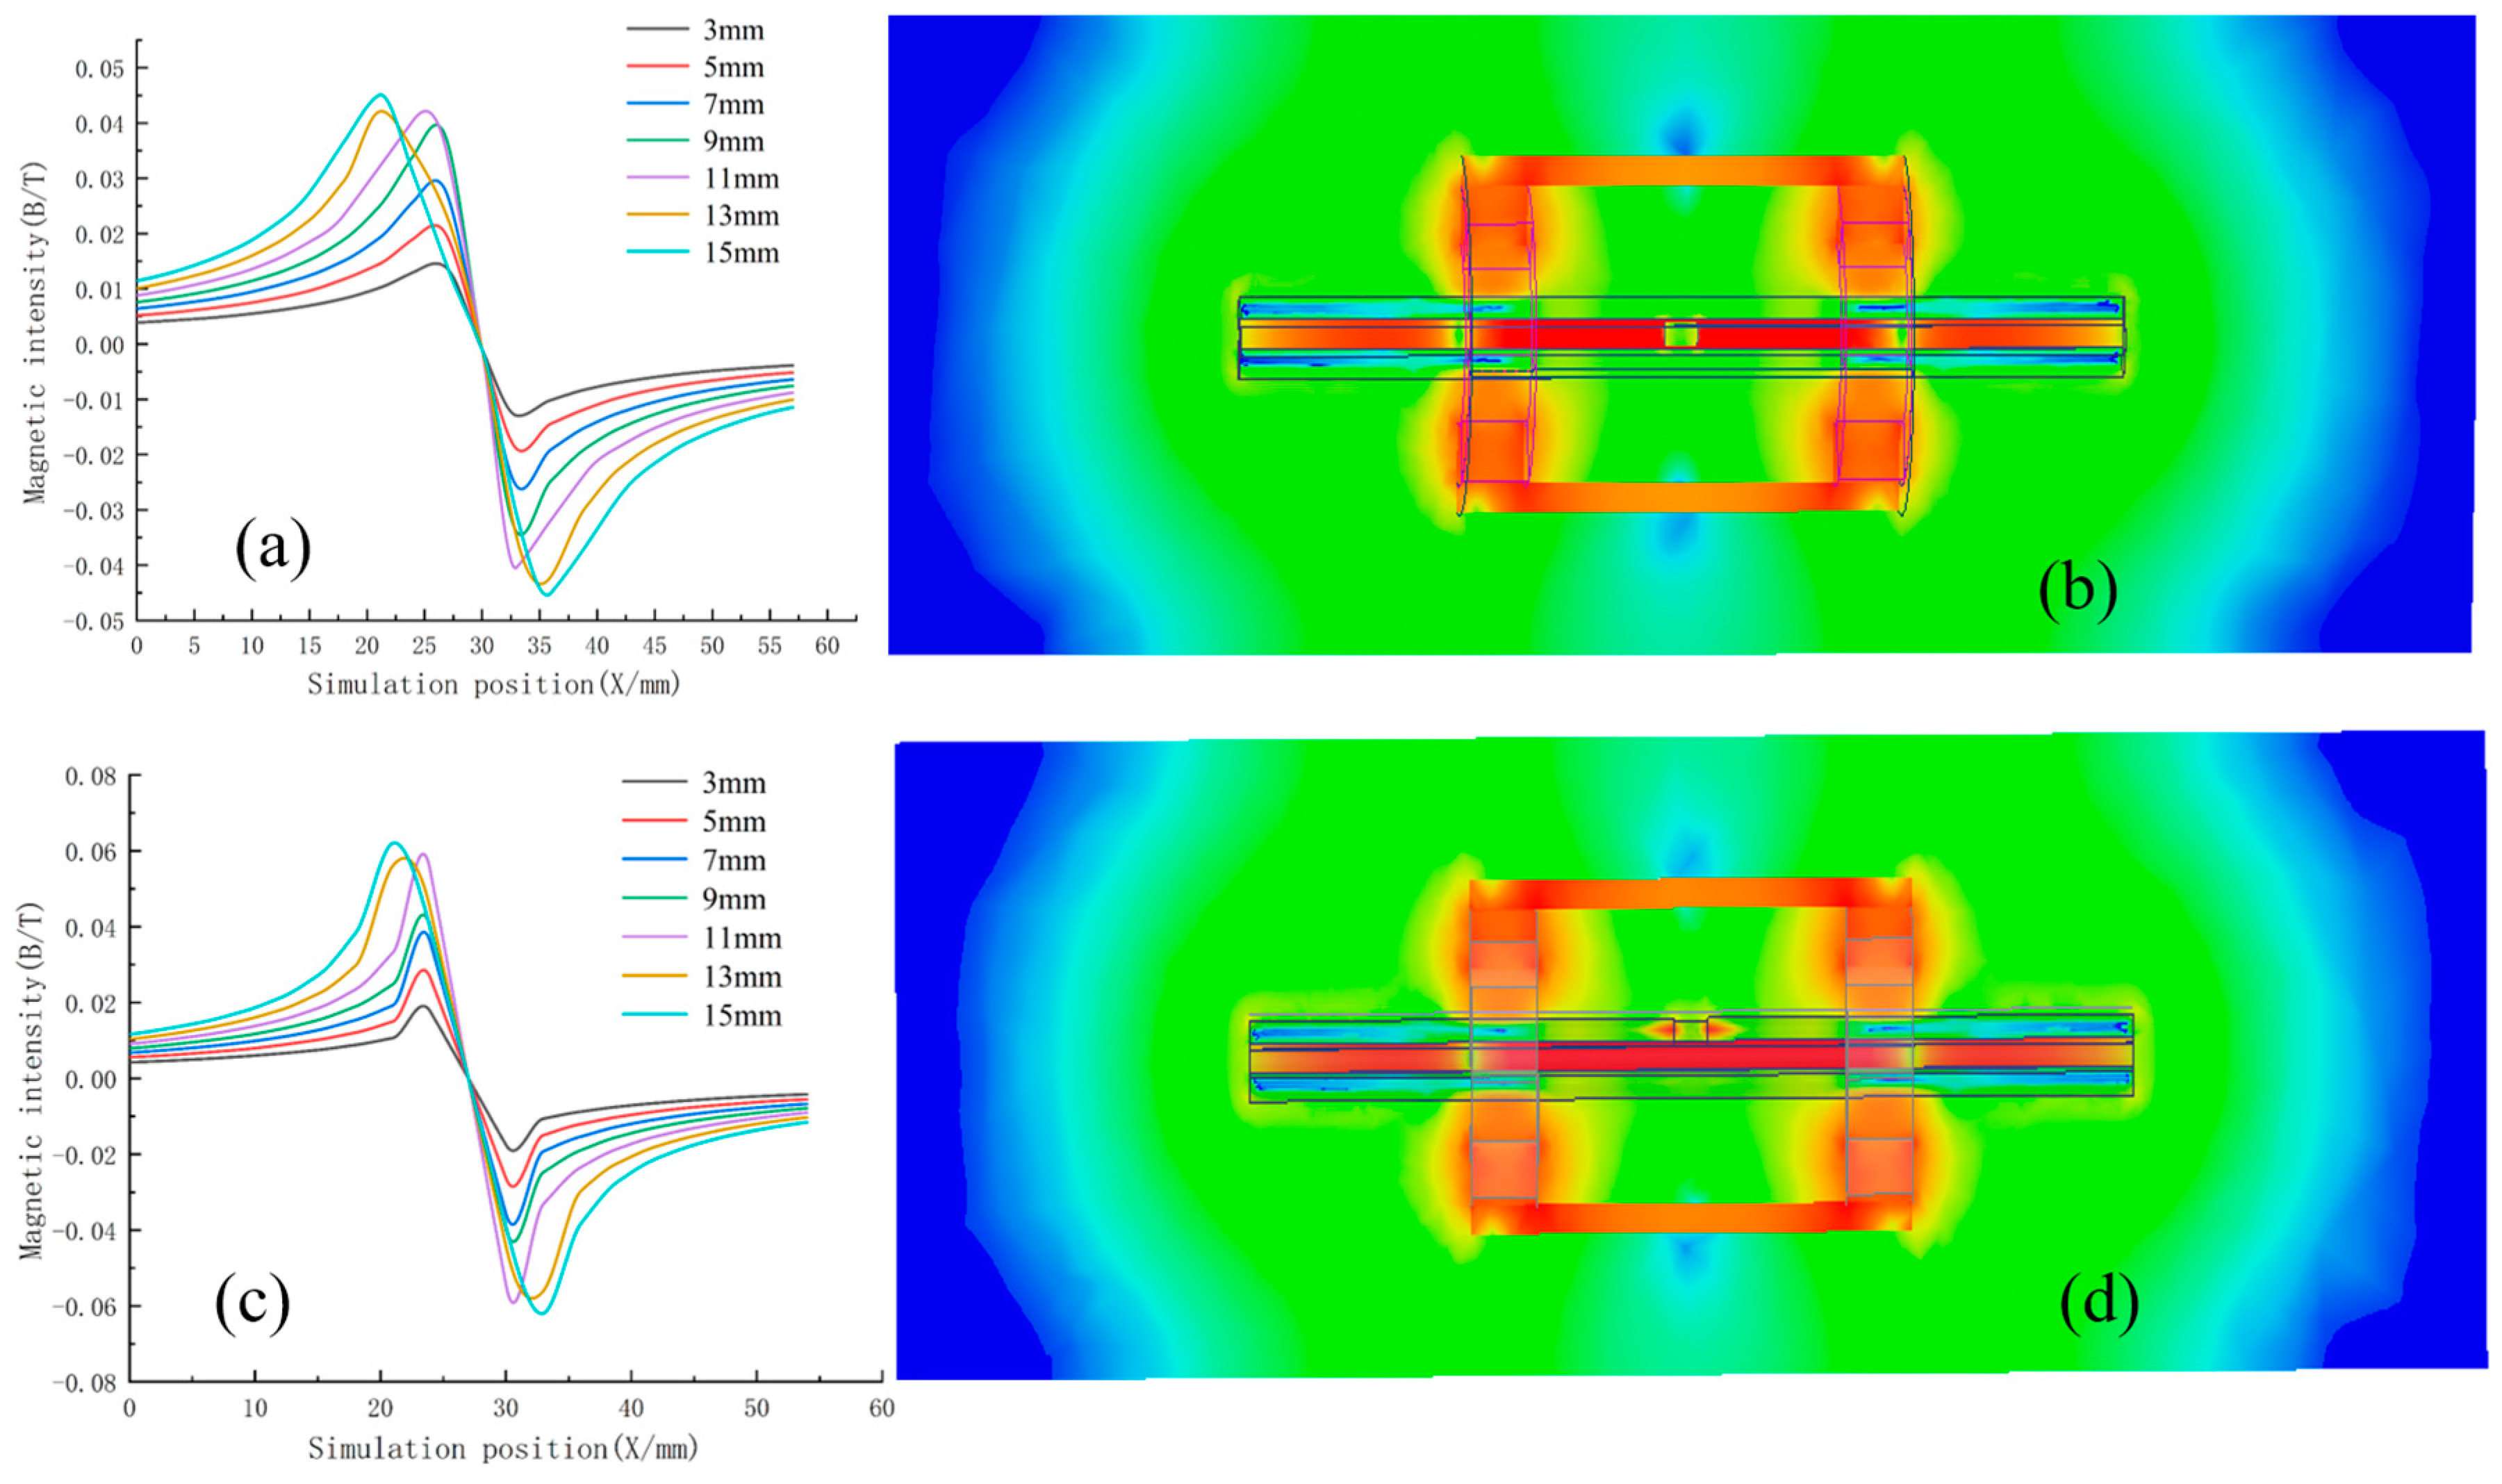
The simulated wire rope had a diameter of 30 mm and a length of 300 mm, with the damage located in the middle of the interior. The left and right sides are permanent magnets, the magnetic vector of the left magnet is outward divergent, the magnetic vector of the right magnet is inward contraction, and the wire rope forms a closed loop with the left and right magnets, with the moving direction of the wire rope being from left to right. The wire rope moves from y = −60 mm to y = 60 mm in the horizontal direction, and the step length is set to 0.01 mm. Simultaneously, in order to study the difference between the internal damage and external damage of the wire rope, the magnetic field simulation was carried out with wire rope damage of different lengths. The internal damage lengths were set as 3 mm, 5 mm, 7 mm, 9 mm, 11 mm, 13 mm, and 15 mm, and the damage depth was 4 mm. The simulation process of external damage is consistent with that of internal damage. The simulation model is shown in Figure 11b,d. After the finite element simulation, the change curve of magnetic induction B for different damages is shown in Figure 11a,c.
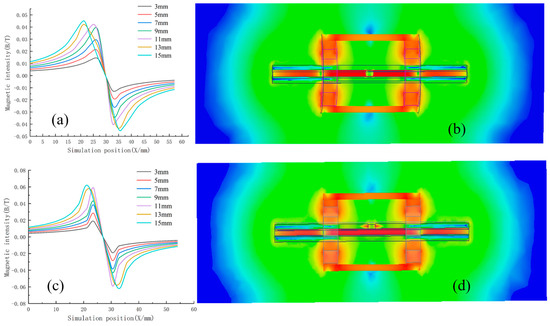
Figure 11.
Variation graphs for different damage lengths: (a) Variation of internal damage magnetic susceptibility; (b) Internal damage detection model graph; (c) Variation of internal damage magnetic susceptibility; (d) External damage detection model.
From Figure 11b,d, it can be clearly seen that the detection model proposed in this study can effectively detect wire rope damage. Simultaneously, it is evident from Figure 11a,c that an increase in the length of damage results in a corresponding rise in the magnetic induction value of the signal. When the length of the damage reaches a specific range, the magnetic induction value of the signal exhibits a tendency to stabilize.
Furthermore, it is evident from Figure 6 that there exists a certain degree of variety in the extent of damage observed both within and outside the wire rope. To facilitate the examination of the disparity between the two, the peak values of the simulation outcomes are extracted for the purpose of comparison, as depicted in Table 1.

Table 1.
Comparison of peak values.
In comprehensive comparison, the average value of the peak magnetic induction intensity of internal defects is 0.2237 T, and the average value of the peak magnetic induction intensity of external defects is 0.2912 T. It can be seen from the comparison between the two that the magnetic induction intensity of internal damage is about 23.17% lower than that of external damage. Consequently, enhancing the precision of the sensor is imperative to efficiently identify interior damage in wire ropes.
4. Quantitative Experiments on Internal Damage
4.1. Experimental System
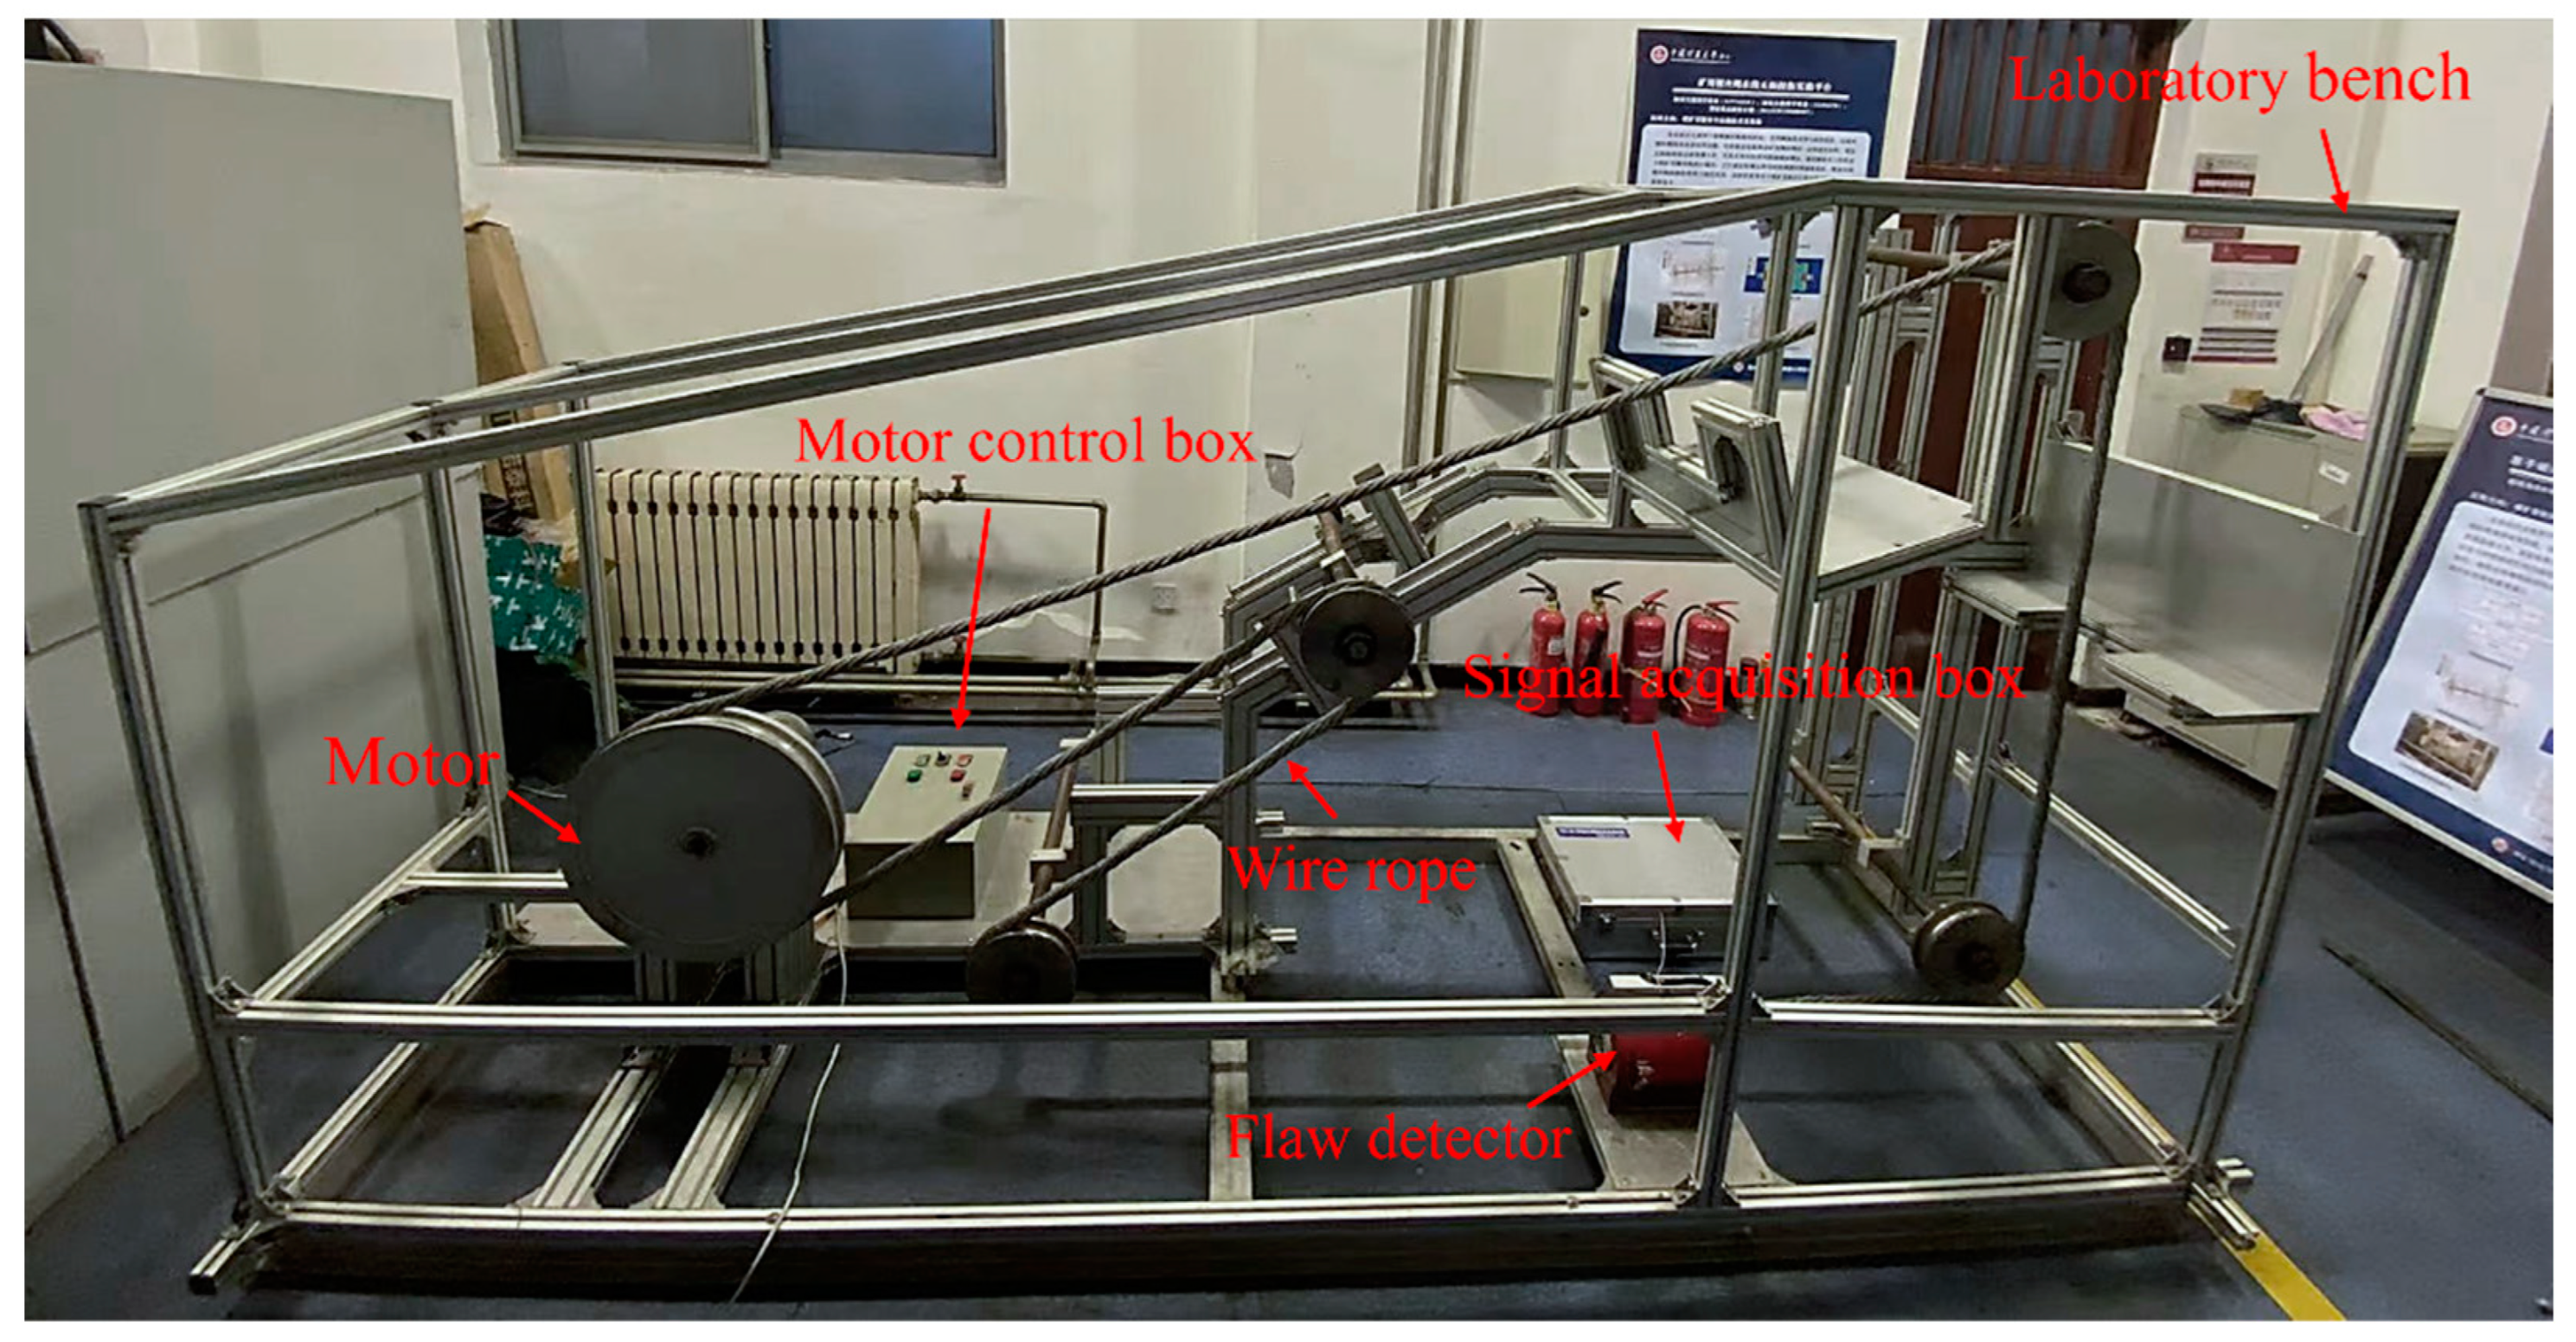
This work develops a comprehensive system for internally inspecting wire ropes, consisting of four key components: a detector, a detecting circuit, a data gathering module, and an overall experimental support. The diagram in Figure 12 illustrates the entire structure. For the experiment, the wire rope is set to move at a pace of 1 m/s and the temperature indoors is 25 °C. The flaw detector detects the wire rope and transmits the damage signal to the data acquisition module via the detection circuit. This allows for the collection of the damage signal and the completion of the internal damage detection of the wire rope.
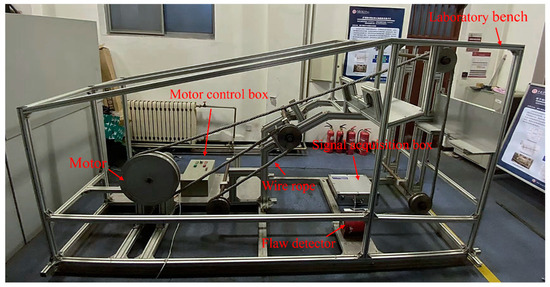
Figure 12.
Wire rope testing overall experimental system.
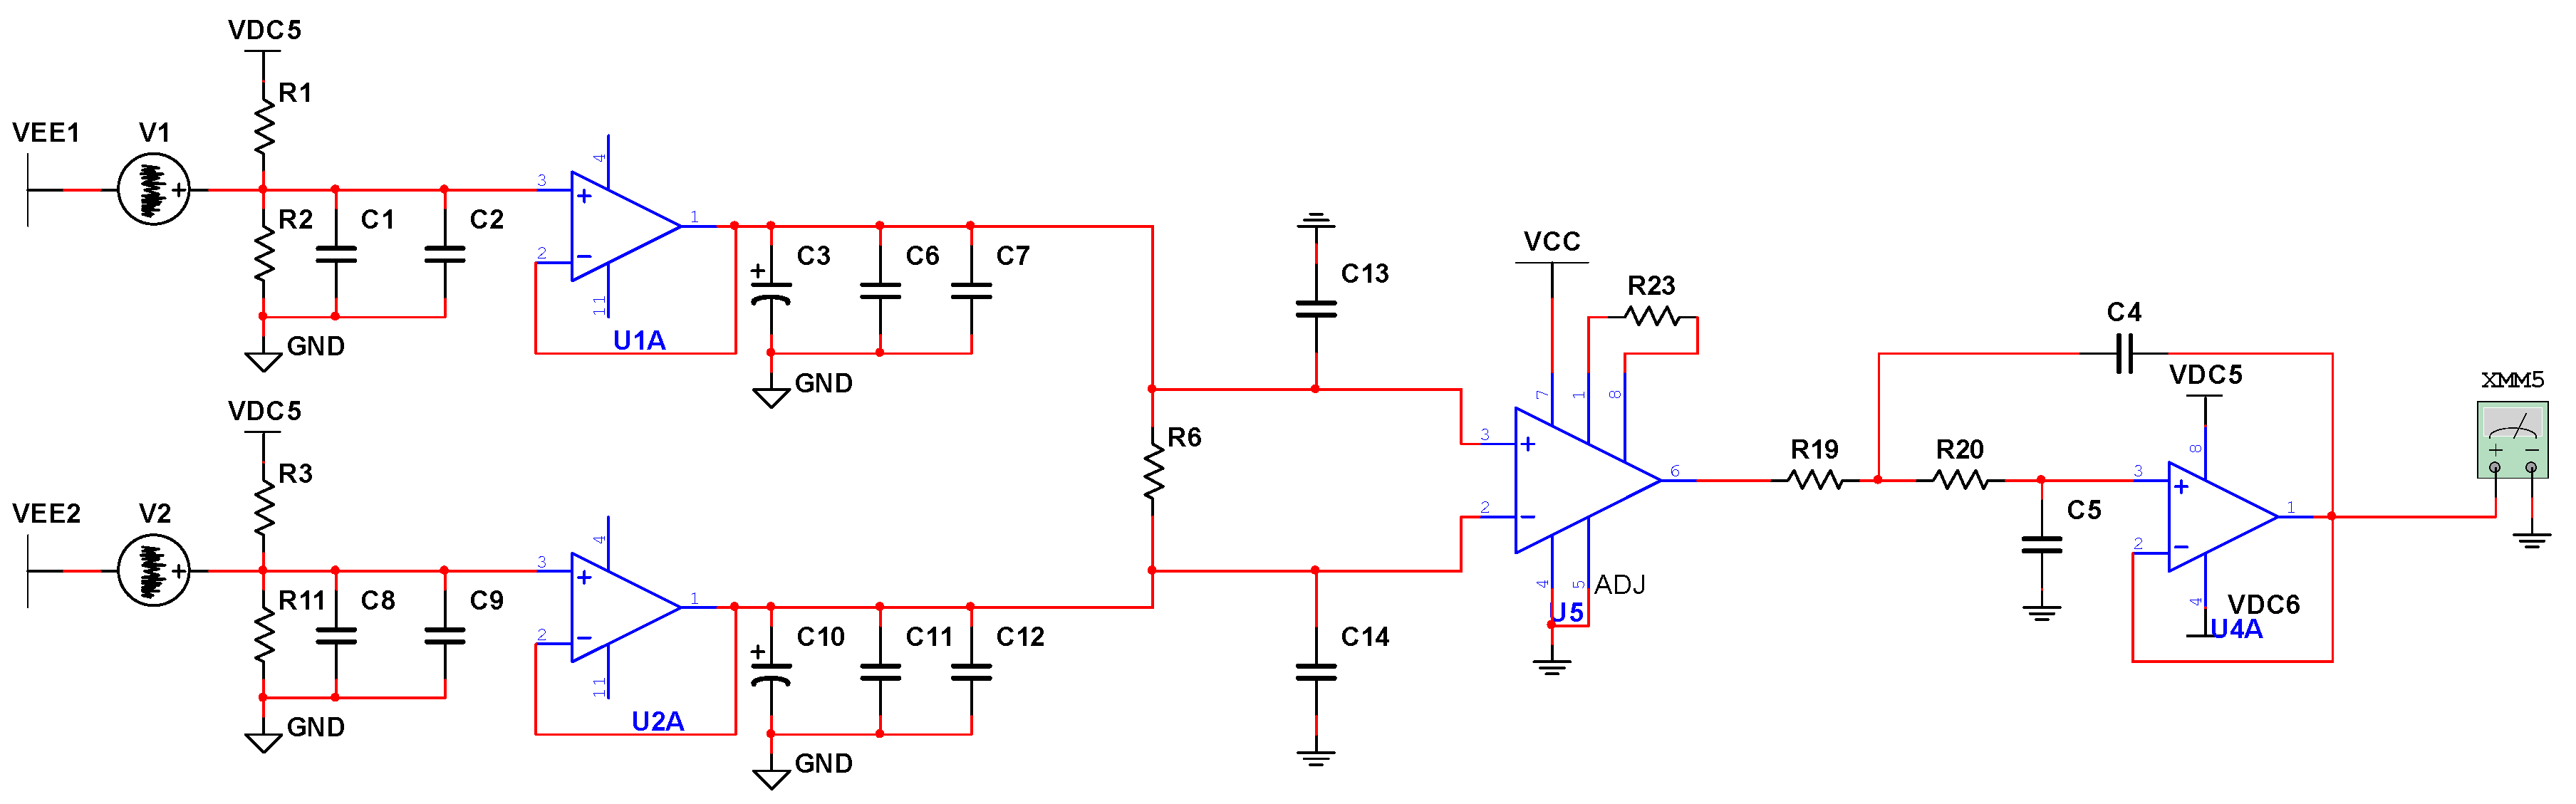
Simultaneously, this work developed a circuit for detecting internal damage in wire ropes, as seen in Figure 13. The circuit comprises an input protection circuit, a buffer circuit, a differential amplifier circuit, and a filter circuit. One of these devices is the AD620AN differential amplifier, which offers a high DC voltage gain, a broad range of differential mode input voltage, strong anti-jamming capabilities, and other features that are often utilized in high-precision circuits.

Figure 13.
Hall effect sensor circuit diagram.
4.2. Quantitative Experimental Design
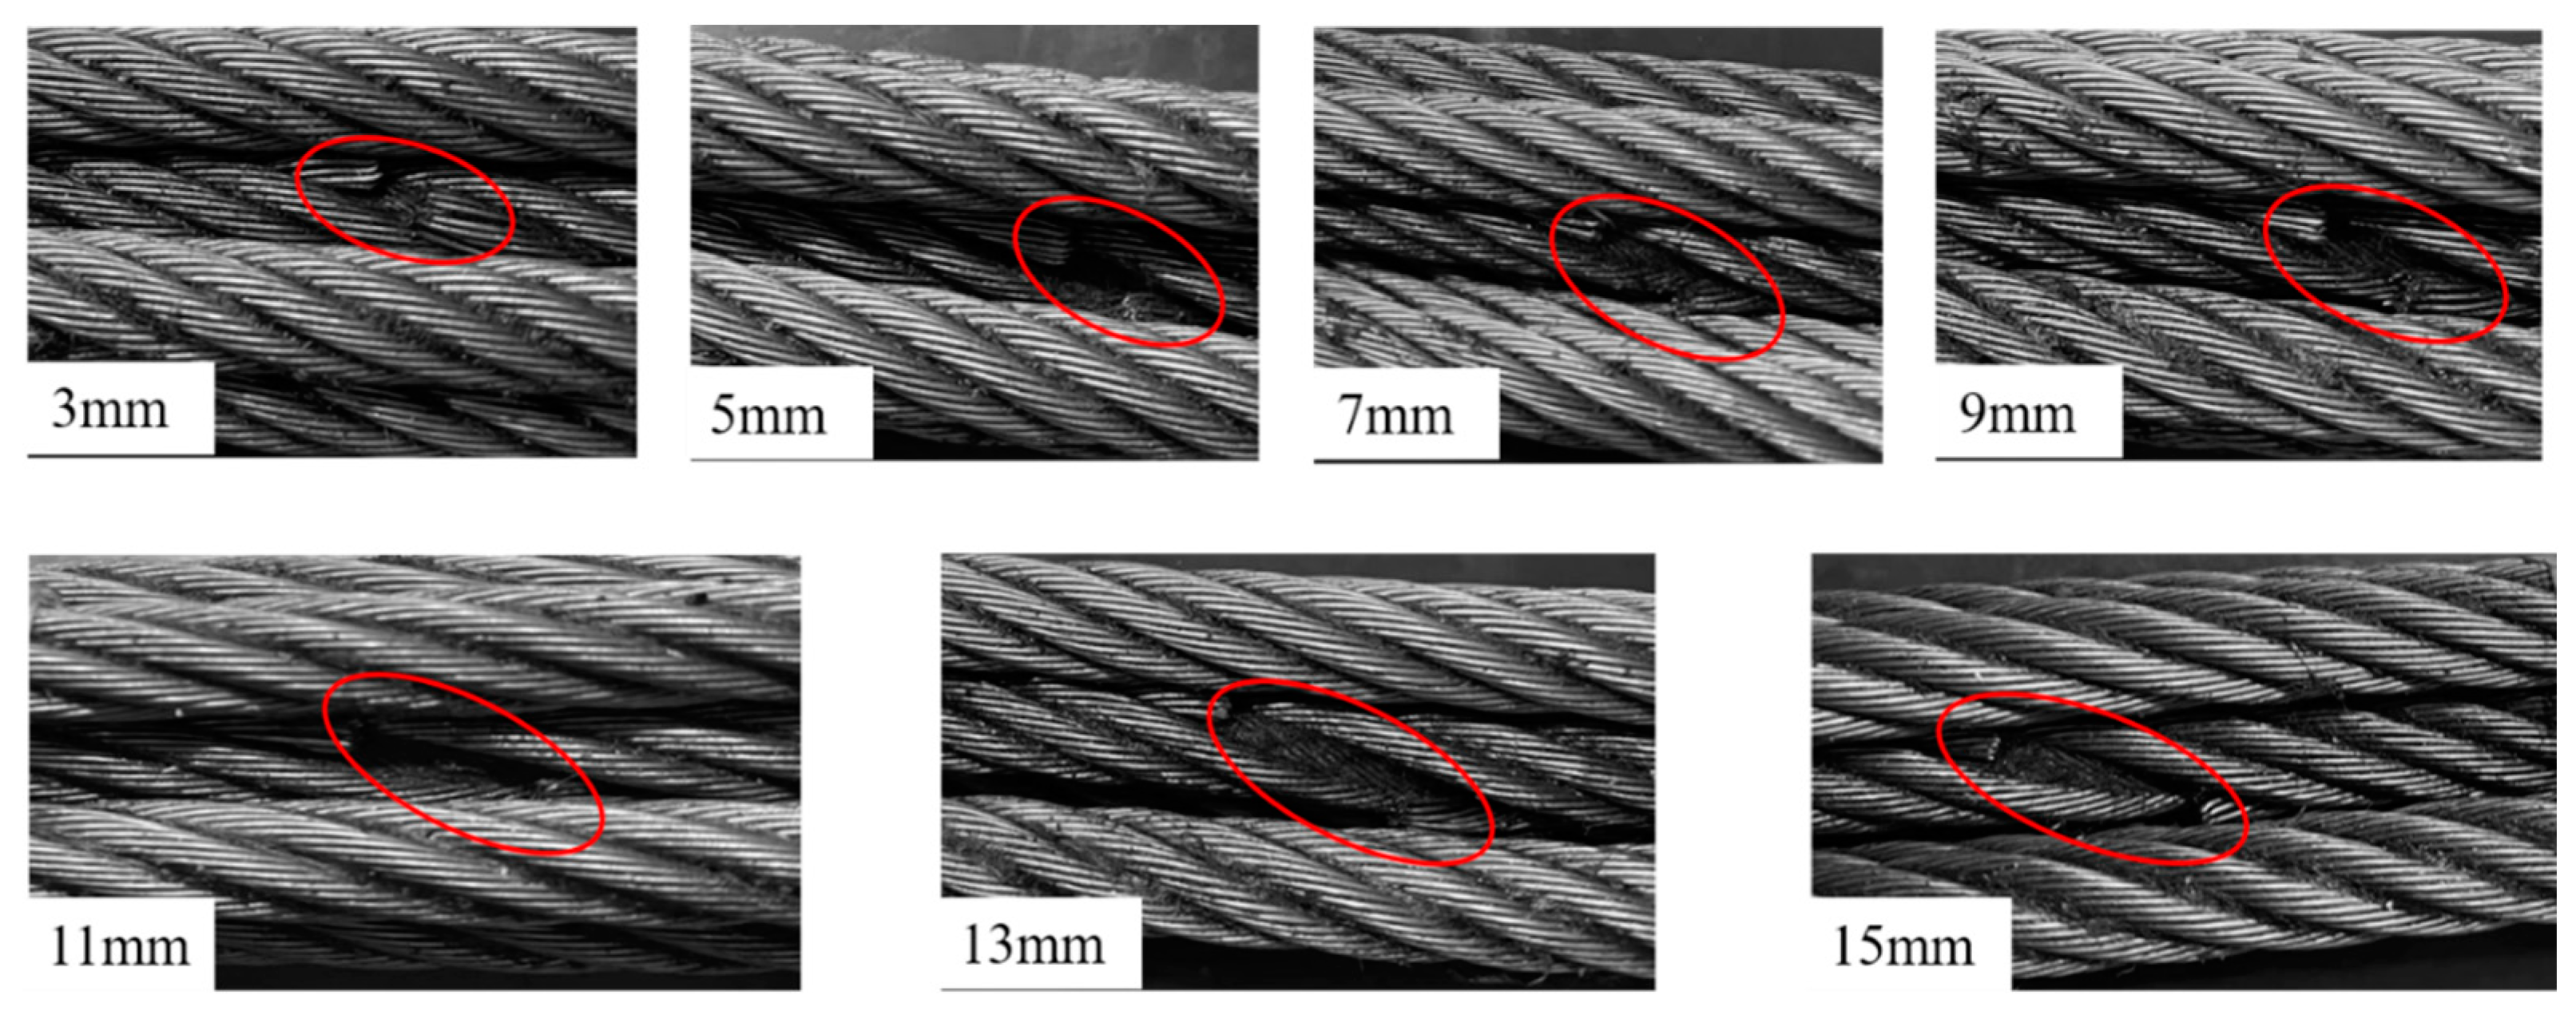
Numerous experiments are required to achieve the quantitative detection of damage. Steel wire rope with a 30 mm diameter was chosen for several experiments in this investigation. The damage depth was 10 mm, while the damage length was set to 3 mm, 5 mm, 7 mm, 9 mm, 11 mm, 13 mm, and 15 mm. The internal damage of one of the fabricated sets of wire ropes is shown in Figure 14. The picture in Figure 14 was taken after the wire rope was loosened and the internal damage was revealed.
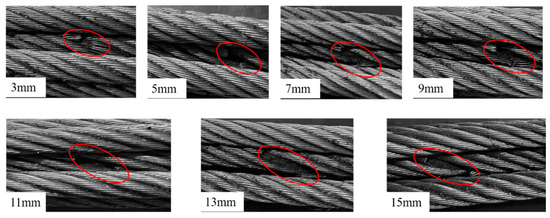
Figure 14.
Internal damage of fabricated wire rope.
5. PSO-VMD Algorithms for Noise Reduction
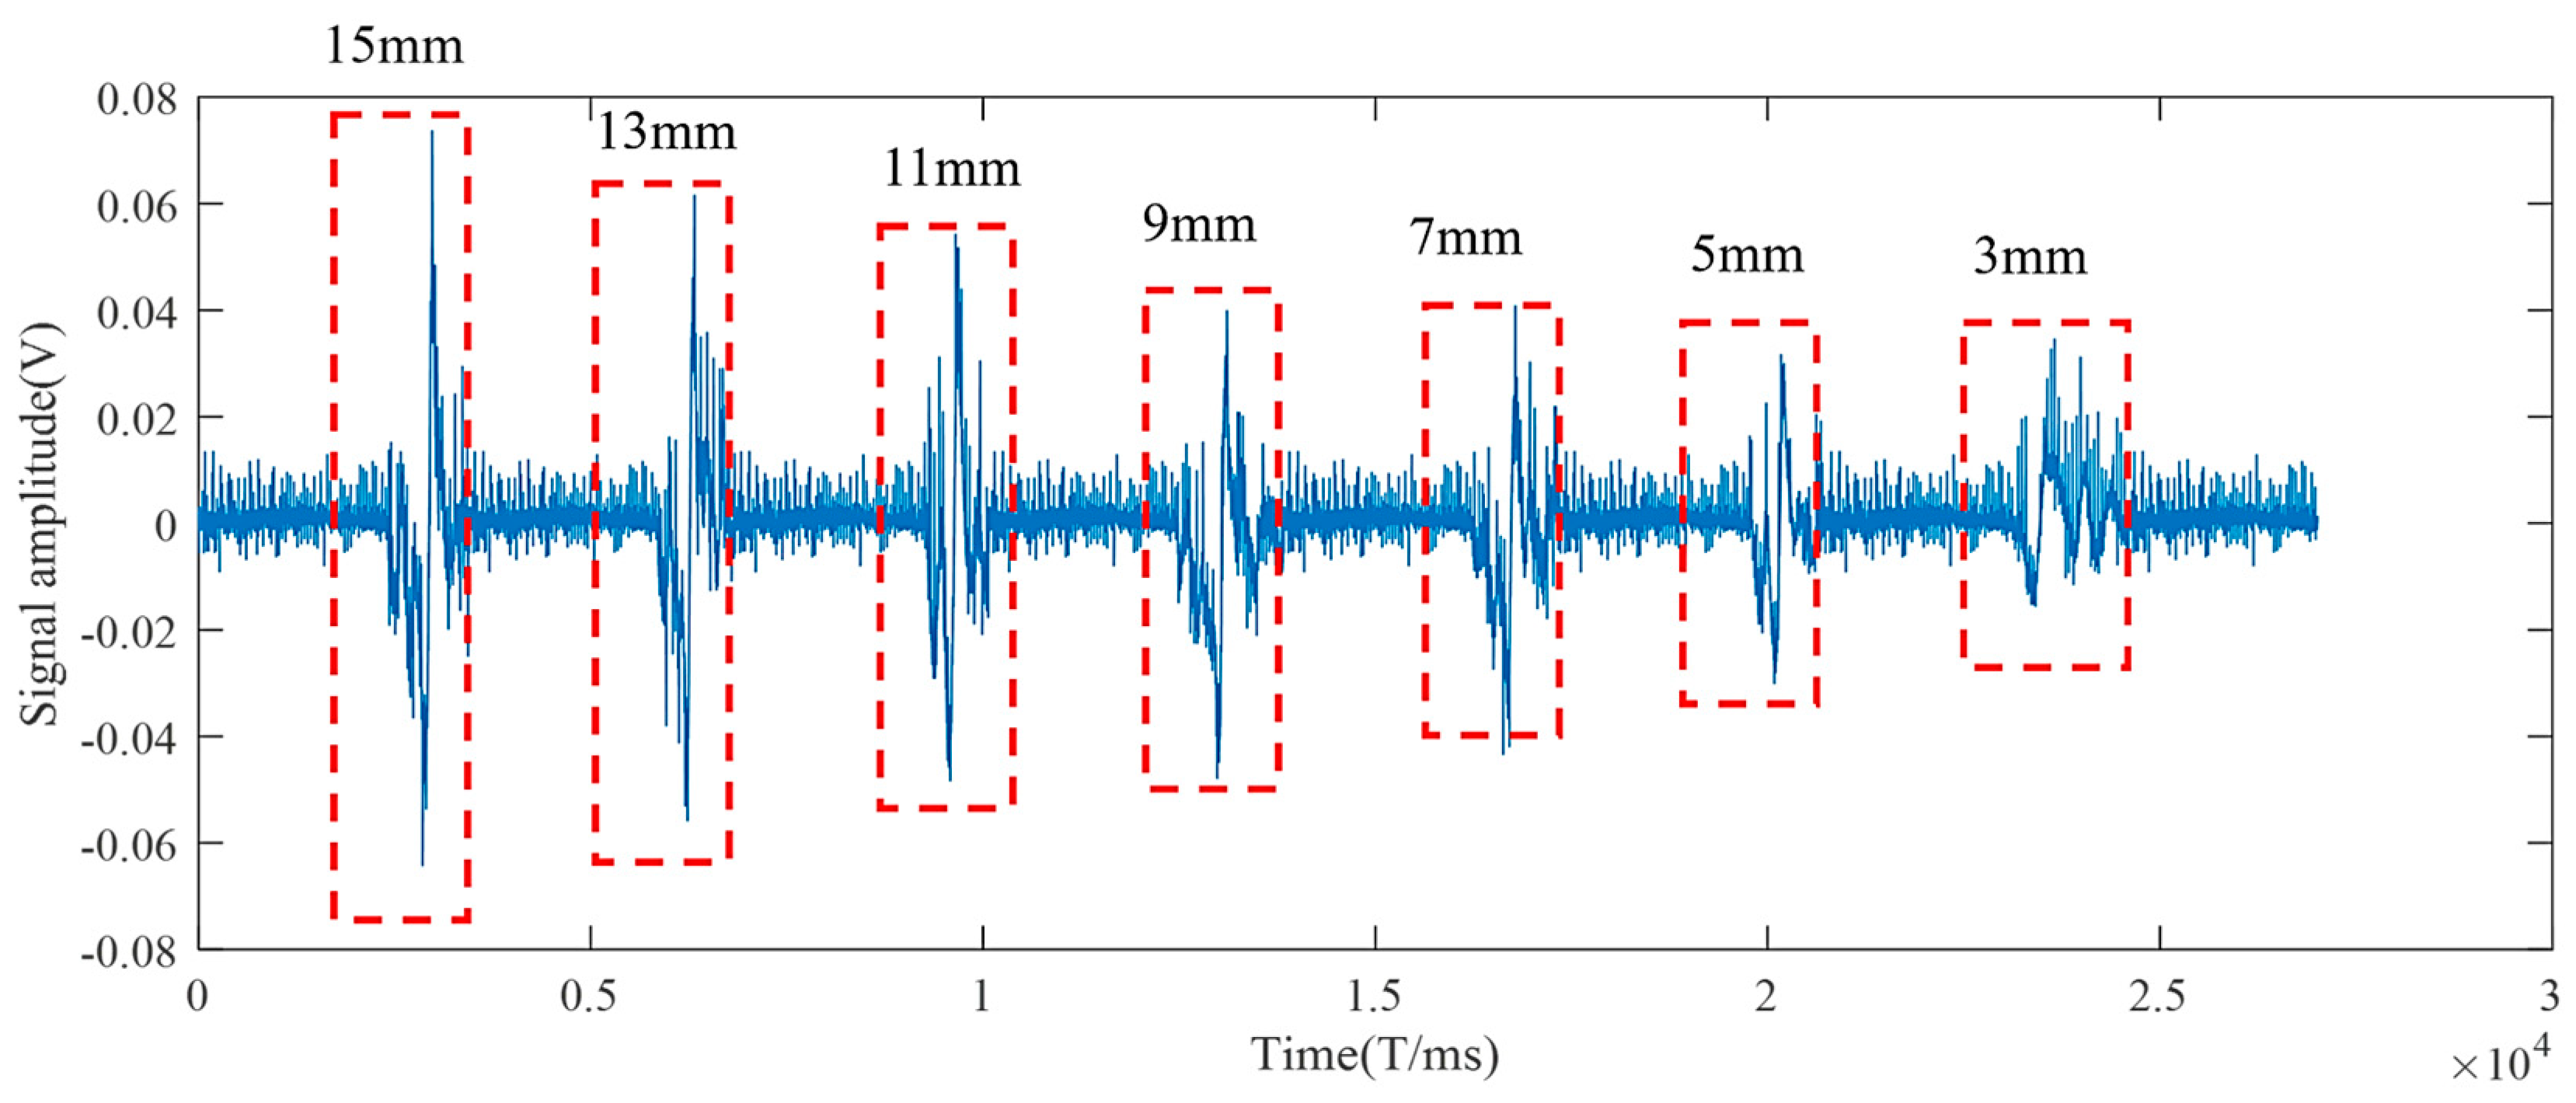
Figure 15 displays the wire rope’s collected internal length damage signal. The figure clearly illustrates the noise phenomenon of internal damage to wire rope, a significant impact on the feature extraction process and a significant reduction in recognition accuracy. Therefore, to guarantee identification accuracy, we utilize the POS-VMD algorithm for damage signal noise reduction.

Figure 15.
Internal damage signal detected by the sensor.
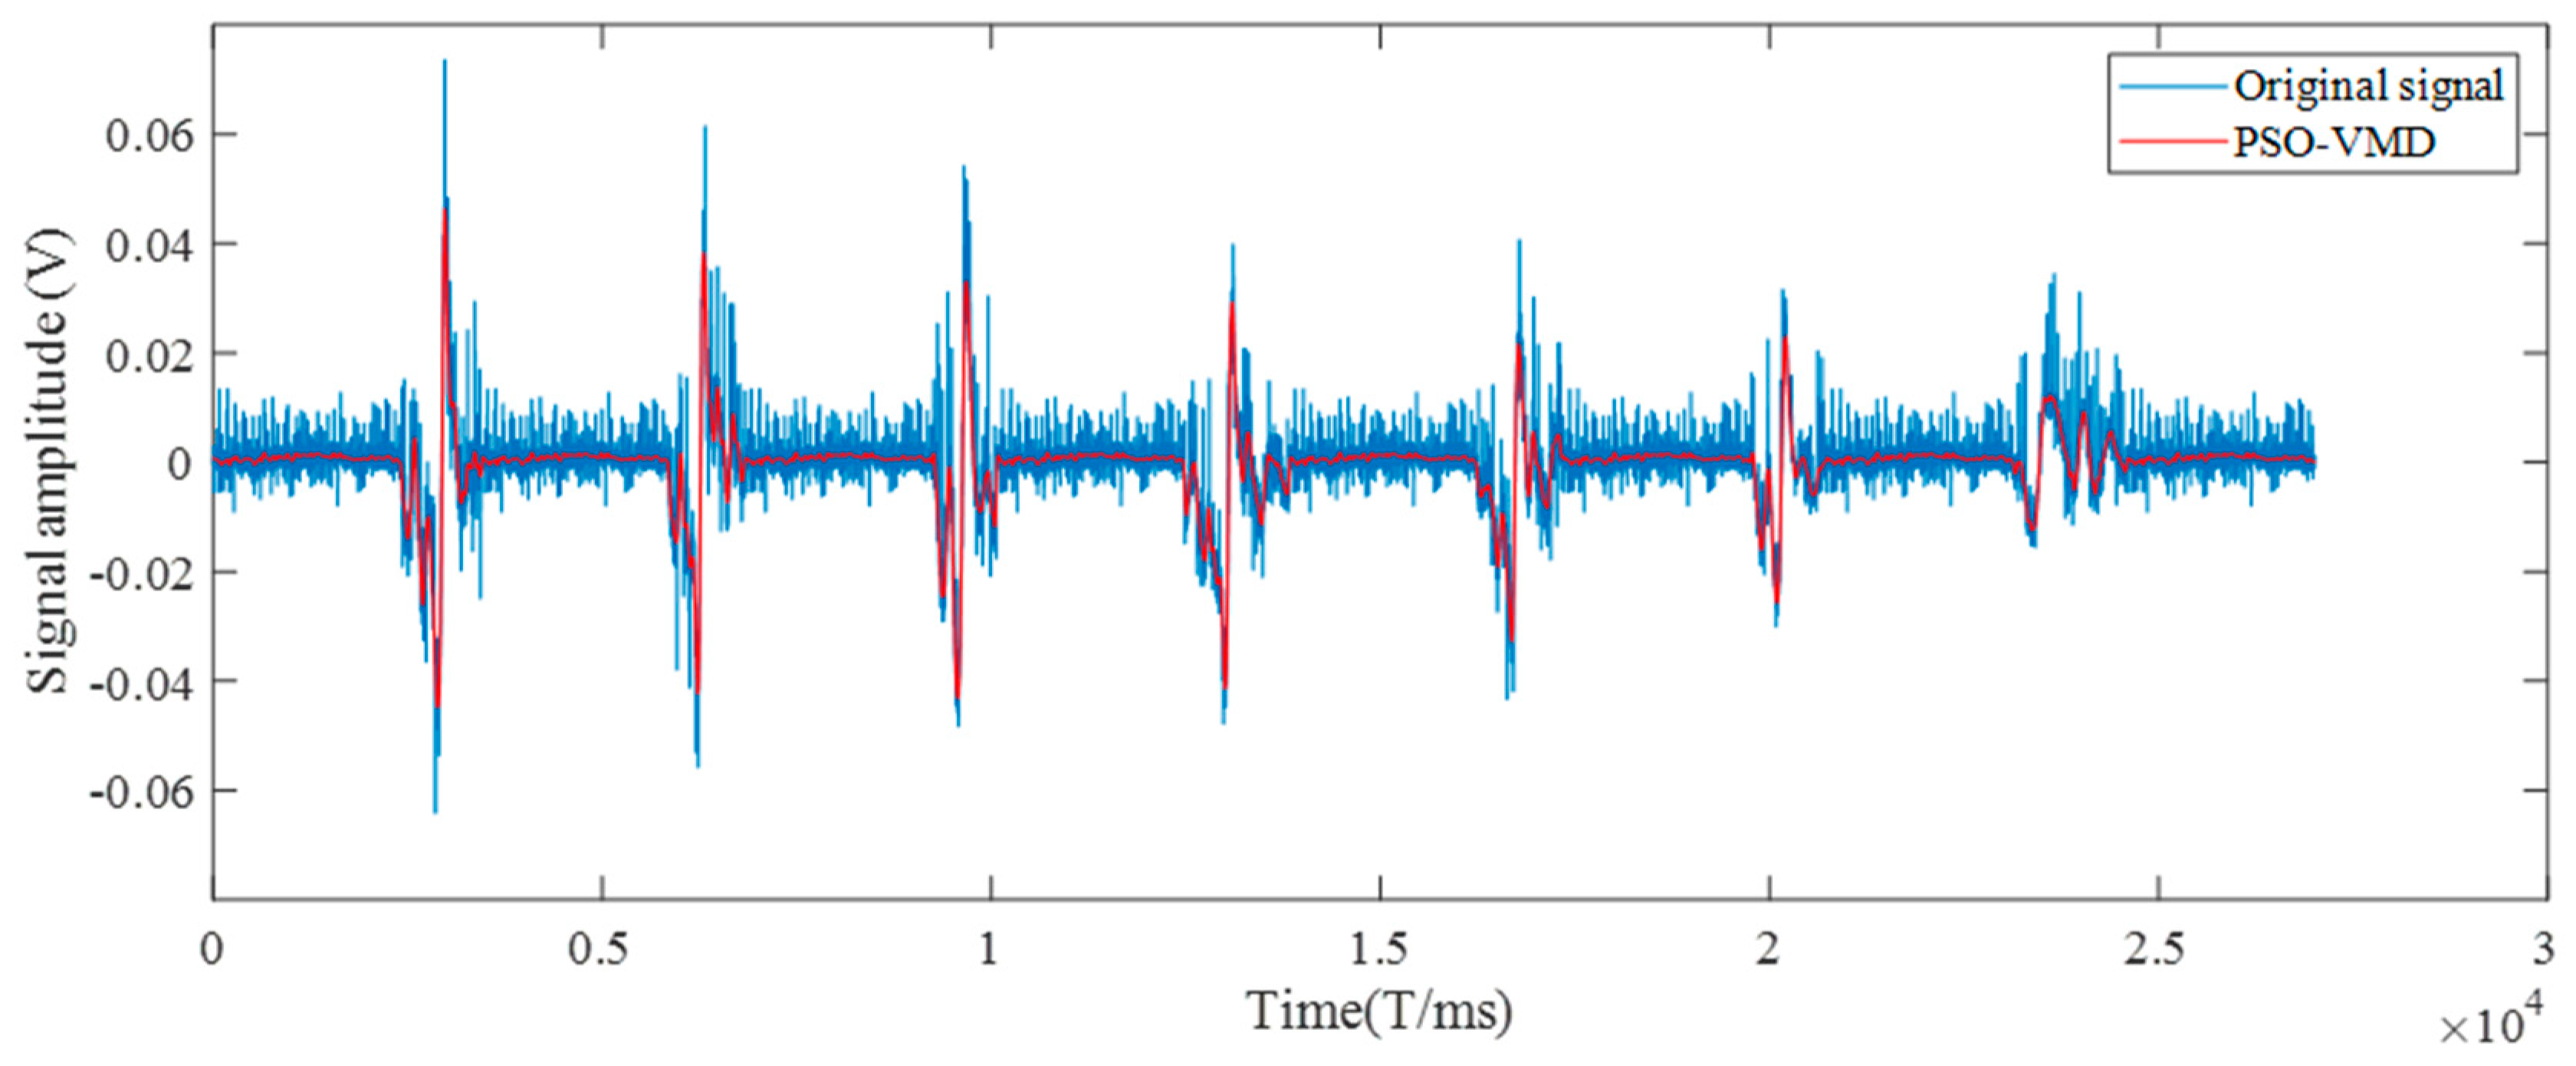
This paper uses the PSO algorithm to adaptively optimize the VMD parameters. The optimal parameter combinations for the wire rope internal damage signal noise reduction are [9, 2000], based on the optimal parameter combinations [K, α] at the end of the PSO-VMD algorithm optimization. We use the internal length damage signal of the wire rope for noise reduction to validate the impact of the PSO-VMD algorithm on noise reduction. Figure 16 displays the resulting noise reduction outcomes.
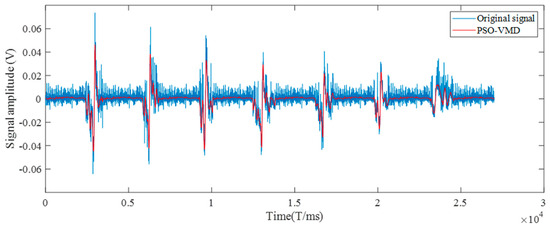
Figure 16.
Comparison of noise reduction of internal damage signal of wire rope.
Figure 16 demonstrates that the signal rebuilt using the PSO-VMD method has a strong resemblance to the original signal, indicating effective noise reduction. Furthermore, noise reduction effectively handles non-linear and localized signals, such as spikes and mutations, while preserving the essential characteristics of the original signal. The impact of noise reduction is clear.
To evaluate the noise reduction capabilities of the PSO-VMD method, we provide the AWT, EMD, and VMD algorithms for comparison study. Four metrics, specifically signal-to-noise ratio (SNR), mean square error (RMSE), correlation coefficient (R), and smoothness (C), are employed to assess the efficacy of noise reduction. The outcomes are presented in Table 2.
Table 2.
Noise reduction effect of different noise reduction methods.
Table 2 demonstrates that the PSO-VMD noise reduction method has a signal-to-noise ratio of about 28.542 dB. This value is 6.299 dB, 7.224 dB, and 1.081 dB higher than the AWT, EMD, and VMD algorithms, respectively. The noise reduction impact is clear. Furthermore, the POS-VMD noise reduction approach has a correlation coefficient of about 0.991, indicating strong similarity to the original signal in terms of its structure. This method effectively eliminates unwanted noise components while preserving the essential characteristics of the signal.
6. Quantitative Identification
(1) CNN-GRU-Attention network model performance verification. Once the principal analysis of the network model is complete, we need to determine the model’s parameters. To mitigate overfitting, the CNN and GRU network layers use the ReLu function as the activation function. Moreover, the network employs the cross-entropy loss function as its loss function. Furthermore, we use the Adam function as a model optimization function to improve the adaptive learning rate of various parameters and expedite the network’s convergence rate. Table 3 presents the specific parameters for this optimization function.
Table 3.
Parameters of the network model.
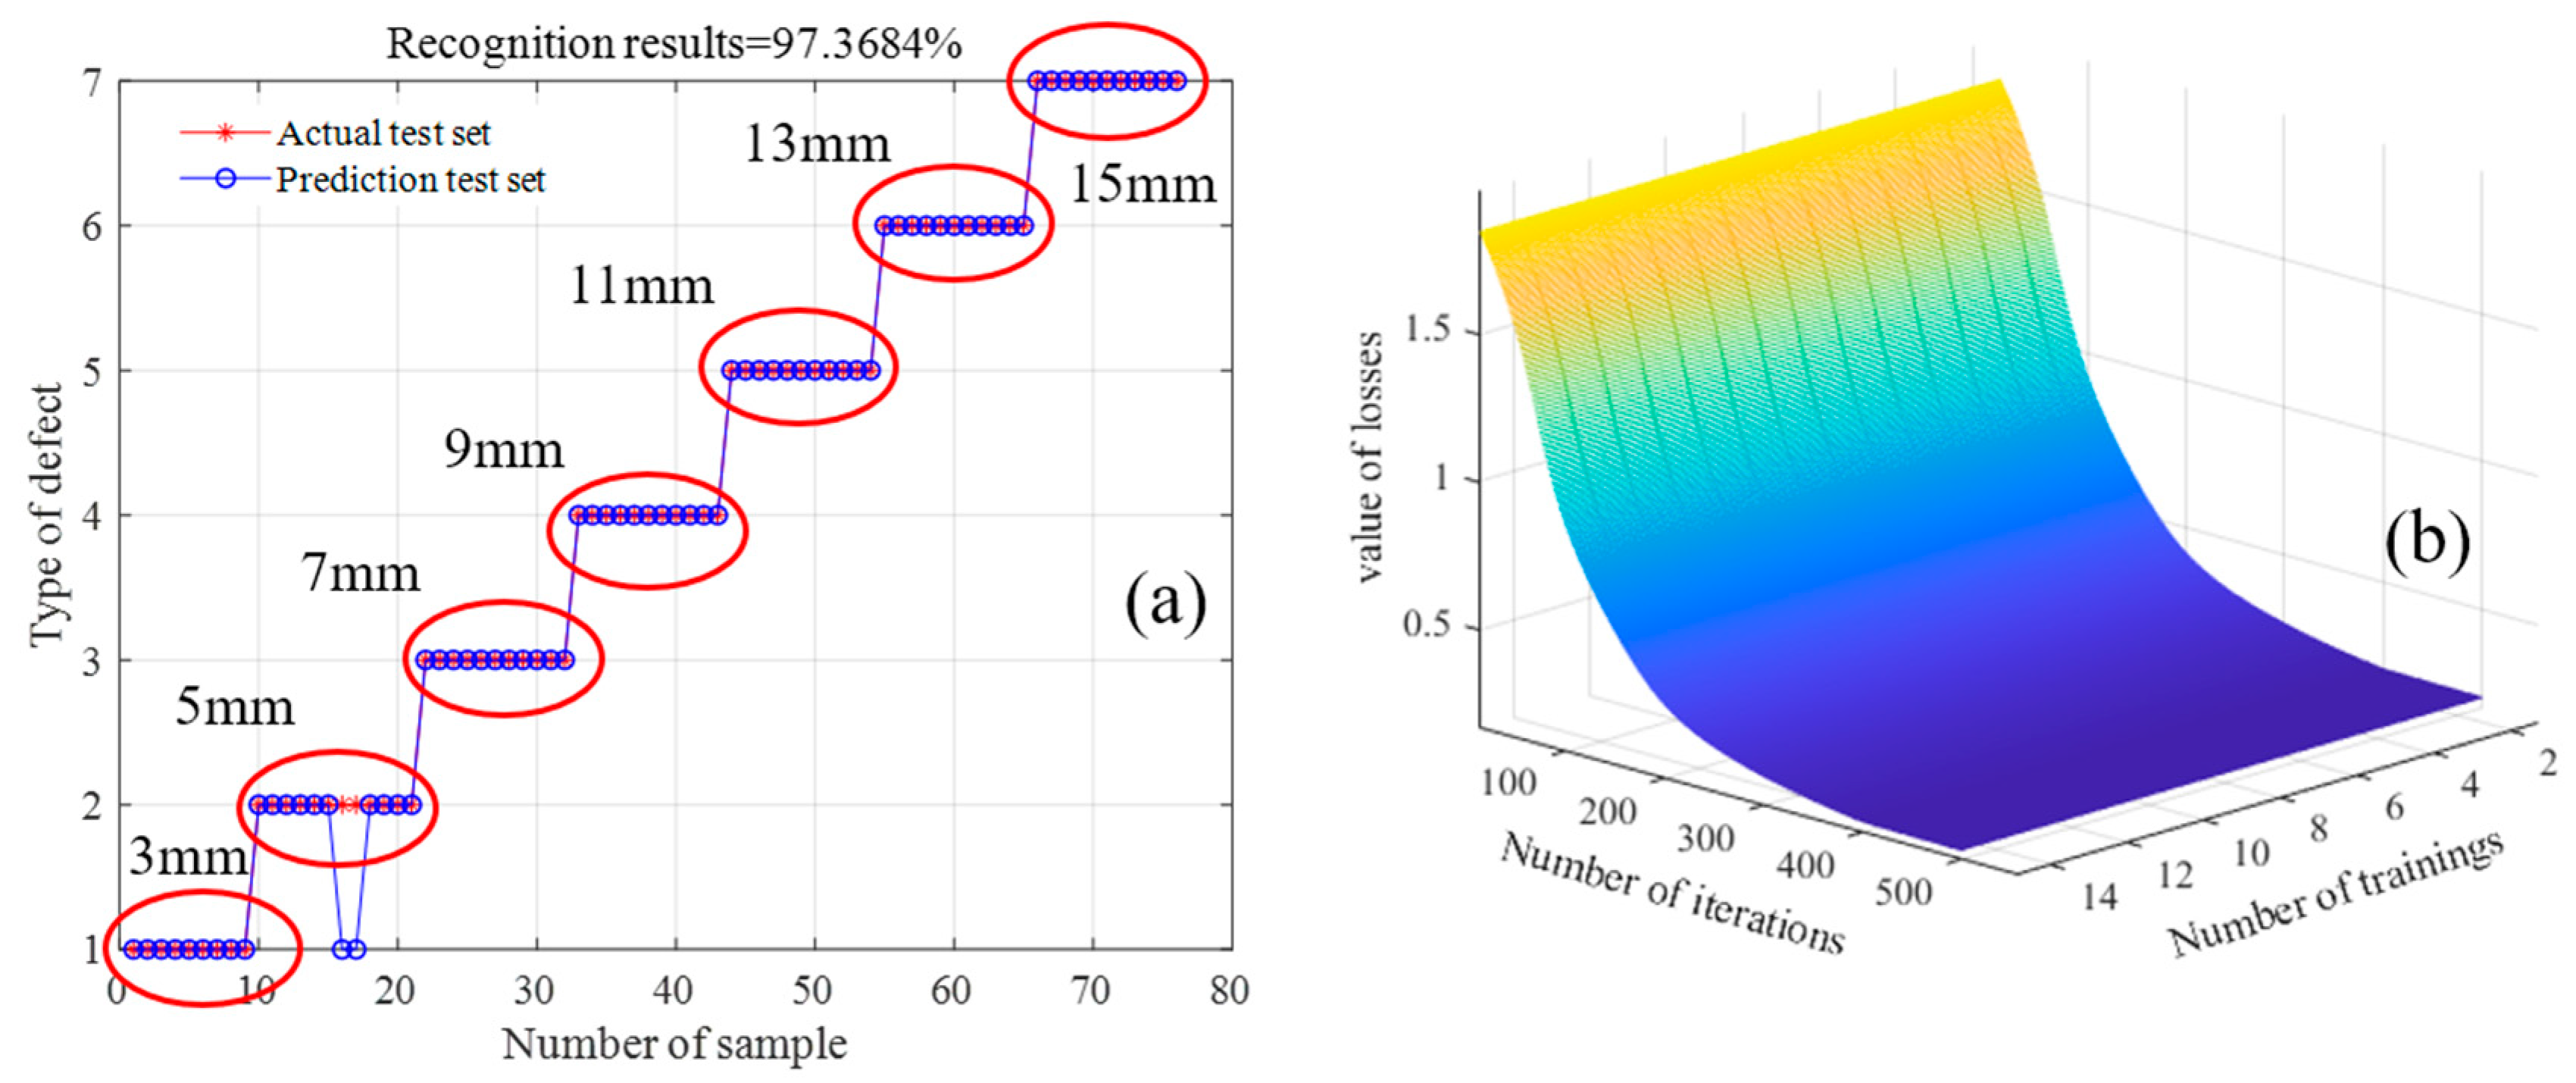
The recognition results are shown in Figure 17. Figure 17a demonstrates that this method effectively recognizes the internal damage of the wire rope, with a recognition rate of 97.37% for the internal length damage dataset. Figure 17b demonstrates that the method accurately identifies the internal damage of the wire rope, reaching a good convergence at 326 times for the internal length damage dataset.

Figure 17.
Recognition results of CNN-GRU-Attention network (a) Length damage recognition results (b) Length damage loss function results.
(2) Effect of the Attention Mechanism on Accuracy. We put data about the wire rope’s internal length damage into both the CNN-GRU Attention network model and the CNN-GRU-Attention model to see how the dual attention mechanism affected the efficiency of the CNN-GRU Attention network model. This research employs accuracy, precision, recall, and the F1 score as evaluation metrics for the models. We present the confusion matrix in Table 4 and compute the metrics as shown below. Table 5 presents our comparison of the recognition results from the different models.
Table 4.
Confusion matrix.
Table 5.
Effect of the dual attention mechanism on recognition results.
Table 5 clearly demonstrates that the CNN-GRU-Attention network model exhibits a substantial enhancement in recognition rate compared to the CNN-GRU model, with a notable increase of 4.94% in recognition rate. The CNN-GRU-Attention network model utilizes a dual-attention method to enhance recognition accuracy by focusing on the aspects of the damage signal that have a greater impact on the recognition results. Simultaneously, the dual-attention mechanism exhibits a notable enhancement in the accuracy rate, recall rate, and F1 value, thereby greatly improving the recognition model’s performance.
(3) Comparative analysis of the PSO-VMD-CNN-GRU algorithm in relation to other algorithms. We tested the proposed PSO-VMD-CNN-GRU algorithm against CNN-RNN, CNN-LSTM, CNN-Attention, and GRU-Attention in the same experiment. Table 6 presents the results of these comparison experiments.
Table 6.
Comparison of the identification results of internal length damage of wire rope.
Table 6 demonstrates that the PSO-VMD-CNN-GRU method outperforms other models in detecting internal damage in wire ropes. The PSO-VMD-CNN-GRU algorithm enhances the effect by 4.94% and 8.68% compared to the CNN-RNN model, respectively. We attribute this improvement to the RNN’s inability to handle long sequence data, which results in gradient explosion. In contrast, the GRU effectively addresses the issues of gradient dispersion and explosion, thereby enhancing the recognition effect. The improvement, when compared to CNN-LSTM, is 5.54% and 6.17%, respectively. This is due to GRU’s ability to combine the input and forgetting gates from LSTM into a single update gate. This reduces both the training parameters and the model convergence time, resulting in a decrease in training complexity. When compared to the CNN-attention model, it demonstrates improvements of 9.65% and 9.16%, respectively. The model demonstrates a significant improvement of 4.44% and 4.56% compared to the GRU-Attention model. The model’s ability to extract important local characteristics from CNN and use GRU to extract latent features from the data significantly enhances recognition accuracy.
In summary, this paper investigates three aspects of the network model: network model performance validation, the effect of attention mechanism on recognition rate, and algorithm superiority validation. Table 7 displays the final evaluation results.
Table 7.
Algorithm evaluation result.
7. Conclusion and Outlook
7.1. Conclusions
This paper presents a method for detecting internal damage in wire ropes using the PSO-VMD-CNN-GRU algorithm. Additionally, we designed a sensor system to effectively detect internal damage in wire ropes for experimental validation. We can summarize this study’s primary groundbreaking contribution as follows:
(1) This study uses the fundamental concept of magnetic dipoles to create a three-dimensional magnetic dipole model that can explain defect direction information. Simultaneously, this study carried out dynamic modelling of the wire rope’s internal damage to serve as a theoretical guide in the wire rope sensor experimental system.
(2) To reduce noise in the wire rope identification process, we suggest a PSO-VMD-based noise-reduction technique. It is evident that the PSO-VMD algorithm performs better at reducing noise in the damage signal and enhancing recognition accuracy when compared to the AWT, EMD, and VMD noise-reduction techniques.
(3) Experiments on internal damage of wire rope based on a multilevel circuit system were designed and validated with comparative analysis. The experimental results indicate that the study’s methodology has a good recognition effect on wire rope internal damage, with a 97.37% recognition rate for the internal length damage dataset and a significant improvement in the recognition rate of the recognition model following the addition of the dual-attention mechanism. Additionally, the recognition of the wire rope’s internal damage length is improved by 4.94% when compared to the network model without the attention mechanism. It is further demonstrated through comparison with other models that the CNN-GRU-attention network model has certain benefits when it comes to determining the interior damage of wire rope.
7.2. Outlook
(1) There are many machine learning methods, but this paper only uses a CNN-GRU network. The method of prediction is not comprehensive and different models can be used to identify the internal damage signal of the wire rope research.
(2) This paper adopts the particle swarm optimization variational modal decomposition noise reduction method on the internal damage signal of the wire rope for noise reduction, so that the model prediction value can reach 97.37%, but the prediction accuracy still has room for improvement and strives for a more effective noise reduction method to make the prediction accuracy improve further.
(3) Indoor experiment-based research only provides research methods and ideas; field applications should be combined with on-site inspection data to build more accurate detection algorithms.
Author Contributions
J.T.: Funding acquisition, proofreading, supervision. P.L.: Simulation, analysis, experiment, data collation, writing-original manuscript. All authors have read and agreed to the published version of the manuscript.
Funding
Under Grant Nos. 2022JCCXJD02 and 2022YJSJD09, the Fundamental Research Funds for Central Universities provided financial assistance for this study’s research. The National Natural Science Foundation of China also funded this study under Grant No. 51774293.
Data Availability Statement
The original contributions presented in the study are included in the article, and further inquiries can be directed to the corresponding author.
Acknowledgments
The authors would like to thank the anonymous reviewers and the editor for their valuable and insightful suggestions.
Conflicts of Interest
The authors declare no conflicts of interest.
References
- Peterka, P.; Krešák, J.; Kropuch, S.; Fedorko, G.; Molnar, V.; Vojtko, M. Failure analysis of hoisting steel wire rope. Eng. Fail. Anal. 2014, 45, 96–105. [Google Scholar] [CrossRef]
- Peterka, P.; Krešák, J.; Vojtko, M.; Halek, B.; Heinz, D. The failure analysis of the drilling rig hoisting steel wire rope. Eksploat. I Niezawodn.-Maint. Reliab. 2020, 22, 667–675. [Google Scholar] [CrossRef]
- Tytko, A.A.; Ridge, I.M.L. The influence of rope tension on the LMA sensor output of magnetic NDT equipment for wire ropes. Nondestruct. Test. Eval. 2013, 19, 153–163. [Google Scholar] [CrossRef]
- Zhang, G.; Tang, Z.; Fan, Y.; Liu, J.; Jahanshahi, H.; Aly, A.A. Steel Wire Rope Surface Defect Detection Based on Segmentation Template and Spatiotemporal Gray Sample Set. Sensors 2021, 21, 5401. [Google Scholar] [CrossRef]
- Li, B.; Zhang, J.; Chen, Q. Theoretical and experimental research on wire rope magnetic memory testing under weak magnetic excitation. Insight 2022, 64, 91–98. [Google Scholar] [CrossRef]
- Chang, X.D.; Peng, Y.X.; Zhu, Z.C.; Gong, X.S.; Yu, Z.F.; Mi, Z.T.; Xu, C.M. Breaking failure analysis and finite element simulation of wear-out winding hoist wire rope. Eng. Fail. Anal. 2018, 95, 1–17. [Google Scholar] [CrossRef]
- Xue, Y.; Luo, G.; Liu, X.; Xing, Y.; Hu, B.; Liu, Z. An Analysis on the Engineering Failure of the Wire Rope Used in Surgical Instruments. J. Fail. Anal. Prev. 2022, 22, 724–737. [Google Scholar] [CrossRef]
- Hongjun, S. Failure analysis of lifting wire rope fracture in elevator installation accident. In Proceedings of the Third International Conference on Mechanical, Electronics, and Electrical and Automation Control (METMS 2023) Other Conferences, Hangzhou, China, 17–19 February 2023. [Google Scholar]
- Zhou, P.; Zhou, G.; Han, L.; Yan, X.; Wang, H.; He, Z. Failure analysis for hoisting wire ropes with local accumulated broken wire damage on the surface. J. Mech. Sci. Technol. 2023, 37, 3459–3468. [Google Scholar] [CrossRef]
- Yan, X.; Zhang, D.; Pan, S.; Zhang, E.; Gao, W. Online nondestructive testing for fine steel wire rope in electromagnetic interference environment. NDT & E Int. 2017, 92, 75–81. [Google Scholar]
- Kaur, A.; Gupta, A.; Aggarwal, H.; Arora, K.; Garg, N.; Sharma, M.; Sharma, S.; Aggarwal, N.; Sapra, G.; Goswamy, J.K. Non-destructive Evaluation and Development of a New Wire Rope Tester Using Parallely Magnetized NdFeB Magnet Segments. J. Nondestruct. Eval. 2018, 37, 61. [Google Scholar] [CrossRef]
- Li, W.; Dong, T.; Shi, H.; Ye, L. Defect detection algorithm of wire rope based on color segmentation and Faster RCNN. In Proceedings of the International Conference on Control, Automation and Information Sciences, Xi’an, China, 14–17 October 2021. [Google Scholar]
- Zhou, P.; Zhou, G.; He, Z.; Tang, C.; Zhu, Z.; Li, W. A novel texture-based damage detection method for wire ropes. Measurement 2019, 148, 106954. [Google Scholar] [CrossRef]
- Zhou, P.; Zhou, G.; Wang, S.; Wang, H.; He, Z.; Yan, X. Visual sensing inspection for the surface damage of steel wire ropes with object detection method. IEEE Sens. J. 2022, 22, 22985–22993. [Google Scholar] [CrossRef]
- Liu, S.; Sun, Y.; Jiang, X.; Kang, Y. A new MFL imaging and quantitative nondestructive evaluation method in wire rope defect detection. Mech. Syst. Signal Process. 2022, 163, 108156. [Google Scholar] [CrossRef]
- Zhang, J.; Peng, F.; Chen, J. Quantitative detection of wire rope based on three-dimensional magnetic flux leakage color imaging technology. IEEE Access 2020, 8, 104165–104174. [Google Scholar] [CrossRef]
- Liu, S.; Sun, Y.; Jiang, X.; Kang, Y. Comparison and analysis of multiple signal processing methods in steel wire rope defect detection by hall sensor. Measurement 2021, 171, 108768. [Google Scholar] [CrossRef]
- Li, L.J.; Zhang, X.G. Discrimination method of wire rope fault signal based on Holzer sensor for multi array weak magnetic detection. Clust. Comput. 2019, 22 (Suppl. S2), 4901–4906. [Google Scholar] [CrossRef]
- Zhang, D.; Zhang, E.; Pan, S. A new signal processing method for the nondestructive testing of a steel wire rope using a small device. NDT & E Int. 2020, 114, 102299. [Google Scholar]
- Shan, Z.; Yang, J.; Sanjuán, M.A.; Wu, C.; Liu, H. A novel adaptive moving average method for signal denoising in strong noise background. Eur. Phys. J. Plus 2022, 137, 50. [Google Scholar] [CrossRef]
- Rostami, J.; Tse, P.W.; Yuan, M. Detection of broken wires in elevator wire ropes with ultrasonic guided waves and tone-burst wavelet. Struct. Health Monit. 2020, 19, 481–494. [Google Scholar] [CrossRef]
- Gao, W.; Zhang, D.; Zhu, X. Tension monitoring and defect detection by magnetostrictive longitudinal guided wave for fine wire rope. IEEE Trans. Instrum. Meas. 2021, 70, 1–7. [Google Scholar] [CrossRef]
- Zhang, J.; Li, J. Recognition of broken wire rope based on adaptive parameterless empirical wavelet transform and random forest. Insight-Non-Destr. Test. Cond. Monit. 2019, 61, 380–394. [Google Scholar] [CrossRef]
- Yuan, R.; Lv, Y.; Kong, Q.; Song, G. Percussion-based bolt looseness monitoring using intrinsic multiscale entropy analysis and BP neural network. Smart Mater. Struct. 2019, 28, 125001. [Google Scholar] [CrossRef]
- Zhou, J.; Xiao, M.; Niu, Y.; Ji, G. Rolling bearing fault diagnosis based on WGWOA-VMD-SVM. Sensors 2022, 22, 6281. [Google Scholar] [CrossRef] [PubMed]
- Zheng, P.; Zhang, J. Application of Variational Mode Decomposition and k-Nearest Neighbor Algorithm in the Quantitative Nondestructive Testing of Wire Ropes. Shock Vib. 2019, 2019, 9828536. [Google Scholar] [CrossRef]
- Zhou, P.; Zhou, G.; Li, Y.; He, Z.; Liu, Y. A hybrid data-driven method for wire rope surface defect detection. IEEE Sens. J. 2020, 20, 8297–8306. [Google Scholar] [CrossRef]
- Lu, S.; Zhang, J. Quantitative nondestructive testing of wire ropes based on features fusion of magnetic image and infrared image. Shock Vib. 2019, 2019, 2041401. [Google Scholar] [CrossRef]
- Li, X.; Zhang, J.; Shi, J. Quantitative nondestructive testing of broken wires for wire rope based on magnetic and infrared information. J. Sens. 2020, 2020, 6419371. [Google Scholar] [CrossRef]
- Zhang, J.; Zhang, Z.; Liu, B. Non-destructive testing of steel wire ropes incorporating magnetic memory information. Insight-Non-Destr. Test. Cond. Monit. 2023, 65, 87–94. [Google Scholar] [CrossRef]
- Zhang, J.; Wang, S. Nondestructive testing of wire ropes based on image fusion of leakage flux and visible light. J. Fail. Anal. Prev. 2019, 19, 551–560. [Google Scholar] [CrossRef]
- Ye, Q.; Zhang, J.; Chen, Q. Quantitative detection of wire rope damage based on local structural characteristics. J. Intell. Fuzzy Syst. 2023, 45, 4337–4347. [Google Scholar] [CrossRef]
- Zatsepin, N.N.; Shcherbinin, V.E. Calculation of the Magnetostatic Field of Surface Defects. I. Field Topography of Defect Models. Defektoskopiya 1966, 5, 50–59. [Google Scholar]
- Huang, S.; Wang, Z.; Yang, J.; Gong, T.; Shan, Z.; Yang, Y. Adaptive fast Walsh-Hadamard transform for magnetic flux leakage signal of broken wire damage extraction under noise background. Nondestruct. Test. Eval. 2024, 1–21. [Google Scholar] [CrossRef]
- Liu, S.; Hua, X.; Liu, Y.; Shan, L.; Wang, D.; Wang, Q.; Sun, Y. Accurate wire rope defect MFL detection using improved Hilbert transform and LSTM neural network. Nondestruct. Test. Eval. 2024, 1–30. [Google Scholar] [CrossRef]

Disclaimer/Publisher’s Note: The statements, opinions and data contained in all publications are solely those of the individual author(s) and contributor(s) and not of MDPI and/or the editor(s). MDPI and/or the editor(s) disclaim responsibility for any injury to people or property resulting from any ideas, methods, instructions or products referred to in the content. |
© 2024 by the authors. Licensee MDPI, Basel, Switzerland. This article is an open access article distributed under the terms and conditions of the Creative Commons Attribution (CC BY) license (https://creativecommons.org/licenses/by/4.0/).