Article

The Microstructure, Mechanical Properties, and Precipitation Behavior of 1000 MPa Grade GEN3 Steel after Various Quenching Processes

by
Angang Ning
1,*,
Rui Gao
2,
Stephen Yue
2 and
Timothy Skszek
3
1
College of Materials Science and Engineering, Taiyuan University of Technology, Taiyuan 030024, China
2
Department of Mining and Materials Engineering, McGill University, Montreal, QC H3A 0C5, Canada
3
Pacific Northwest National Laboratory (PNNL), Richland, WA 99354, USA
*
Author to whom correspondence should be addressed.
Processes 2024, 12(9), 2039; https://doi.org/10.3390/pr12092039
Submission received: 13 August 2024 / Revised: 18 September 2024 / Accepted: 19 September 2024 / Published: 21 September 2024
(This article belongs to the Special Issue Metallurgical Process: Optimization and Control)

Abstract

:
This study examines the microstructure, mechanical properties, and precipitation behavior of 1000 MPa grade GEN3 steel when subjected to various quenching processes, with a focus on the quench and partition (Q&P) technique. The Q&P-treated samples achieved 1300 MPa tensile strength and demonstrated superior yield strength, attributed to their refined substructure and their large amounts of precipitates. The quenched samples exhibited the thinnest martensite laths due to the highest martensite volume. Despite the as-annealed samples having the smallest grain size, the Q&P treatment resulted in optimal microstructural refinement results and a high dislocation density, reaching 1.15 × 10¹⁵ m−2. Analysis of the precipitates revealed the presence of V8C7, M7C3, M2C, and Ti(C, N) across various heat treatments. The application of the McCall–Boyd method and the Ashby–Orowan correction model indicated that quench and tempered (Q&T) samples contained the largest volume of fine precipitates, contributing to their high yield strengths. These findings offer valuable insights for optimizing heat treatment processes to develop advanced high-strength steels for industrial applications.

1. Introduction

Recent advancements in third-generation advanced high-strength steels (AHSS) have increasingly focused on bainite-containing steels due to their promising mechanical properties. Steels such as CP (complex-phase) steel [1,2], CFB (carbide-free bainitic) steel [3,4,5], and Q&P (quenching and partitioning) steel [6,7] are known for their superior balance of strength, toughness, and ductility. The relationship between the microstructure and mechanical properties of TRIP (low-alloy transformation-induced plasticity) steels has become a prominent area of research, particularly concerning the role of retained austenite. Retained austenite provides sustained strain hardening under tensile strain, thereby enhancing the ductility of the steel [8,9].
The Q&P (quenching and partitioning) process, introduced by Professor John G. Speer, aims to optimize the balance of strength and ductility in low-alloy steels [10,11]. This process involves quenching to a temperature within the martensite-start (Ms) and martensite-finish (Mf) range, followed by a prescribed duration of isothermal holding. The resulting Q&P microstructure can be highly complex, and may contain carbon-depleted martensite, BF (bainitic ferrite), secondary martensite, and RA (retained austenite). The TRIP (transformation-induced plasticity) effect of retained austenite (RA) notably boosts the steel’s strength and ductility by improving its work-hardening ability [12]. Additionally, the fine substructure and elevated dislocation density from martensite and bainite further enhance the steel’s strength.
The production of ultra-high-strength steel parts via hot stamping of quenchable steel sheets has been on the rise. Many automobile manufacturers are increasingly adopting hot stamping processes to produce various ultra-high-strength components, such as A/B-pillars and bumper beams, which reduce vehicle weight and enhance safety. However, steels like 22MnB5, after undergoing hot stamping (heating above the Ac3 temperature, forming, followed by die quenching), typically achieve a tensile strength of around 1.5 GPa but exhibit low ductility, which can negatively impact vehicle safety [13].
This study simulates the hot stamping process in combination with various quenching methods to investigate the effects of precipitation behavior on the yield strength of 1000 MPa grade low-alloyed lightweight bainitic steel. Additionally, this study aims to retain a significant proportion of austenite that can transform into martensite during a crash, thereby enhancing crashworthiness. The microstructure and mechanical properties, alongside precipitation behavior after different heat treatments are carried out and analyzed so that an optimal heat-treating process can be concluded. The calculations of four strengthening mechanisms devoted to yield strength were carried out. The results provide a guideline for optimizing hot stamping parameters and aim to establish a solid foundation for the subsequent development of high-quality lightweight vehicle manufacturing processes.

2. Experimental

Table 1 describes the chemical composition of typical GEN3 steel manufactured by U.S. Steel Corporation, Pittsburgh, PA, USA.
Dilatometer (DIL805A) (TA Instrument, New Castle, DE, USA) measurements were conducted to determine the critical transformation temperatures (Ac1, Ac3, Ms) of GEN3 steel, where Ac1 and Ac3 are the starting and finishing temperatures of ferrite to austenite during the heating process, and Ms represents the starting temperature of martensite formation during a fast-cooling process. Specimens, in the form of 4 × 1.2 × 10 mm billets, were heated from room temperature (RT) to 950 °C at a rate of 15 °C/s, maintained at 950 °C for 5 min, and then cooled to RT at a rate of 50 °C/s, as illustrated in Figure 1.
From Figure 1, the Ac1 and Ac3 temperatures were determined to be 738 °C and 890 °C, respectively, with an Ms temperature of 355 °C. The Bs temperature was calculated using a semi-empirical equation [14]:
B s ( ) = 830 270 w [ C ] 90 w [ Mn ] 37 w [ Ni ] 70 w [ Cr ] 83 w [ Mo ]
where Bs represents the starting temperature of bainite formation, °C, and w refers to the mass fraction of elements in steel, %. Thus, Bs is determined at 552 °C based on Equation (1).
The as-annealed sample had been subject to the cold rolling and annealing process. The as-annealed specimen was marked as 1#. This sample was then heated to 900 °C, held for 5 min, and water-quenched, producing Sample 2# (the as-quenched sample). For the quench and temper (Q&T) process, Sample 2# was further tempered at 450 °C for 10 min, resulting in Sample 3#. Finally, the quench and partition (Q&P) process was carried out, where the steel was heated to 900 °C, held for 5 min, and then heated to 330 °C for 10 min in a salt bath before air cooling, producing Sample 4#. The procedures for Samples 2, 3, and 4 are shown in Figure 2.
Microhardness tests were conducted with the Digital Micro Vickers Hardness Tester, Model No. HVS-1000 (Guangdong Micro Accuracy Co., Ltd., Dongguan, China). We also employed a CMT4105 electronic universal testing machine (MTS System Corporation, Shenzhen, China) to measure the yield strength and ultimate tensile strength. The test samples had a total length of 25 mm, with a thickness of 1.2 mm, a gauge length of 15 mm, and a width of 5 mm. Furthermore, the radius between the parallel section and the shoulder section was 2.5 mm. Sample microstructures were observed with a ZEISS Gemini 300 SEM (Zeiss, Oberkochen, Germany). The scanning electron microscope (SEM, Model No. JSM-7001F) with a Pegasus XM2 detector (JEOL, Akishima, Japan) was used to perform electron backscatter diffraction. The samples were subjected to electropolishing in an ethanol solution of 10% perchloric acid and 5% glycerol. Subsequently, the acquired data were analyzed using OIM (Orientation Imaging Microscopy) which was provided by EDAX Company, Boston, MA, USA.
Further investigation of precipitate morphology and distribution was conducted using a JEOL F200 high-resolution transmission electron microscope (HR-TEM) (JEOL, Akishima, Japan). TEM samples were prepared using both carbon extraction replicas and twin-jet electropolishing methods. Thermodynamic calculations were carried out with JMatPro 7.0 software (Sente Software Ltd., Surry, UK). Retained austenite (RA) content and dislocation density were determined using X-ray diffraction (XRD) with a Smartlab SE instrument (Rigaku, Tokyo, Japan).
The volume fraction of RA was calculated based on the following equation [12]:
V γ = 1.4 I γ I α + 1.4 I γ
where Vγ is the volume fraction of RA, Iγ, and Iα are the integral intensity of the {111}γ austenite peak and the integral intensity of the {110}α ferrite peaks, respectively. aγ is the lattice parameter of austenite in Angstrom, which is calculated using the following equation based on the {111}γ peak [15].
a γ = λ h 2 + k 2 + l 2 2 sin θ h k l
where λ, (hkl), and θhkl are the wavelength of the radiation, the three Miller indices of a plane, and the Bragg angle, respectively. To evaluate the stability of carbon in austenite, the following equation is introduced [16]:
C γ = a γ 3.547 0.046
where Cγ is carbon content in austenite, wt.%.

3. Results

3.1. Microstructure

In this section, the results are presented in two parts. One part focused on the SEM observation, and the other part dealt with the results from EBSD and XRD analyses.

3.1.1. SEM Results

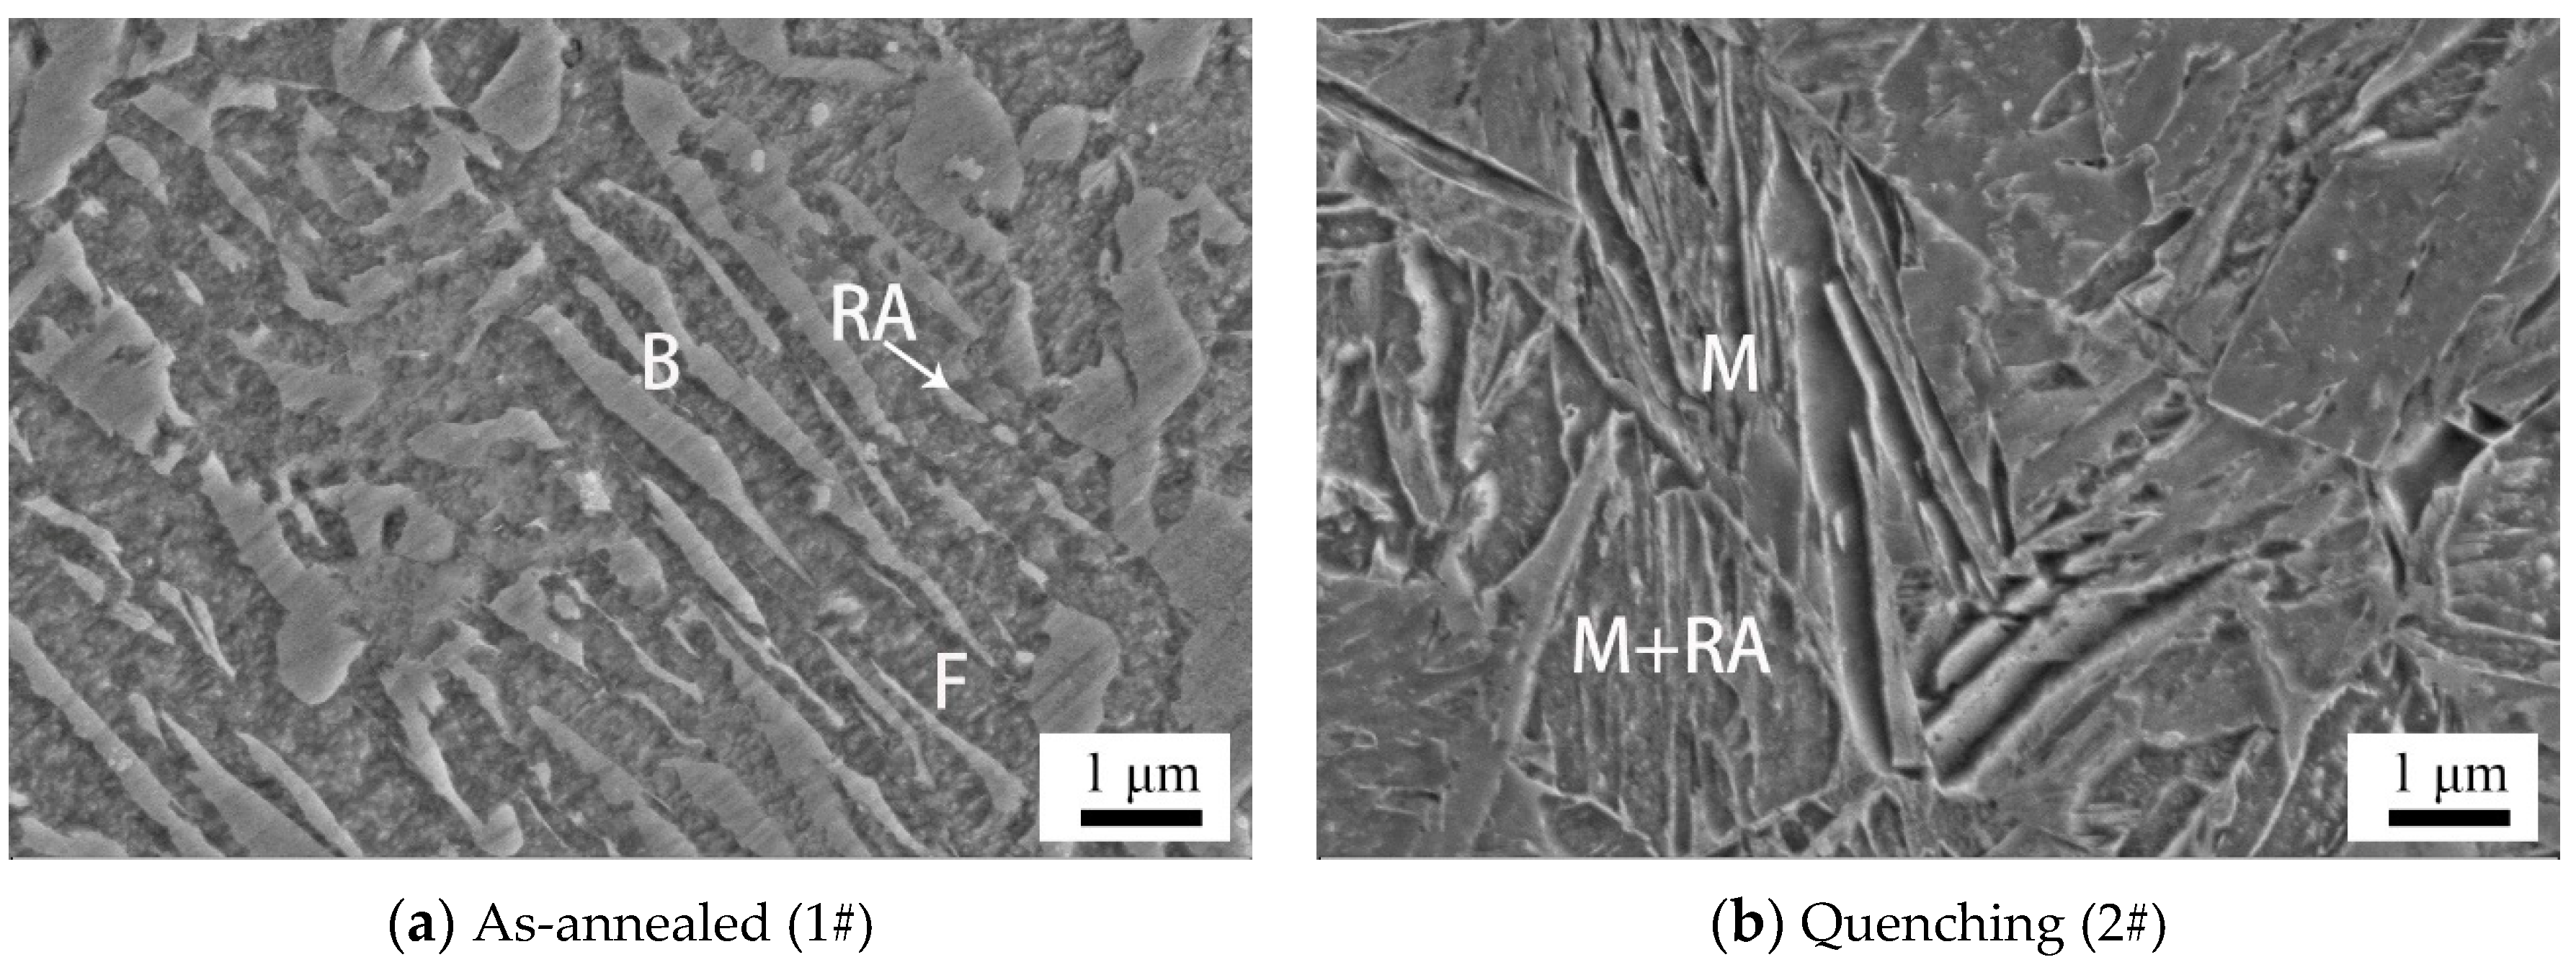
Figure 3a shows that the steel, after rolling and annealing, consists primarily of bainite, ferrite, and retained austenite. After austenitizing at 900 °C and water quenching, martensite forms, appearing as needle-like, elongated laths, as illustrated in Figure 3b. After tempering at 450 °C for 10 min, the steel exhibits distinct tempered characteristics, where the lath martensite begins to recover and decompose, with increased carbide presence in the martensite laths. Ferrite is also identified in Figure 3c. The microstructure of Sample 4 shows martensite laths and some retained austenite (RA) islands, as well as bainite laths observed in Figure 3d. The partitioning process stabilizes RA by carbon diffusion from martensite, enhancing the plasticity of Sample 4.
The measured average bainite lath width in Sample 1 and martensite lath width in Sample 3 are 314 nm and 306 nm, respectively. In Sample 2, the rapid cooling during the quenching process results in the finest martensite lath width of 193 nm. The Q&P sample, with a lath width of 221 nm, is characterized by rapid cooling during quenching and the subsequent formation of fresh, fine martensite during the partitioning process.

3.1.2. EBSD and XRD Results

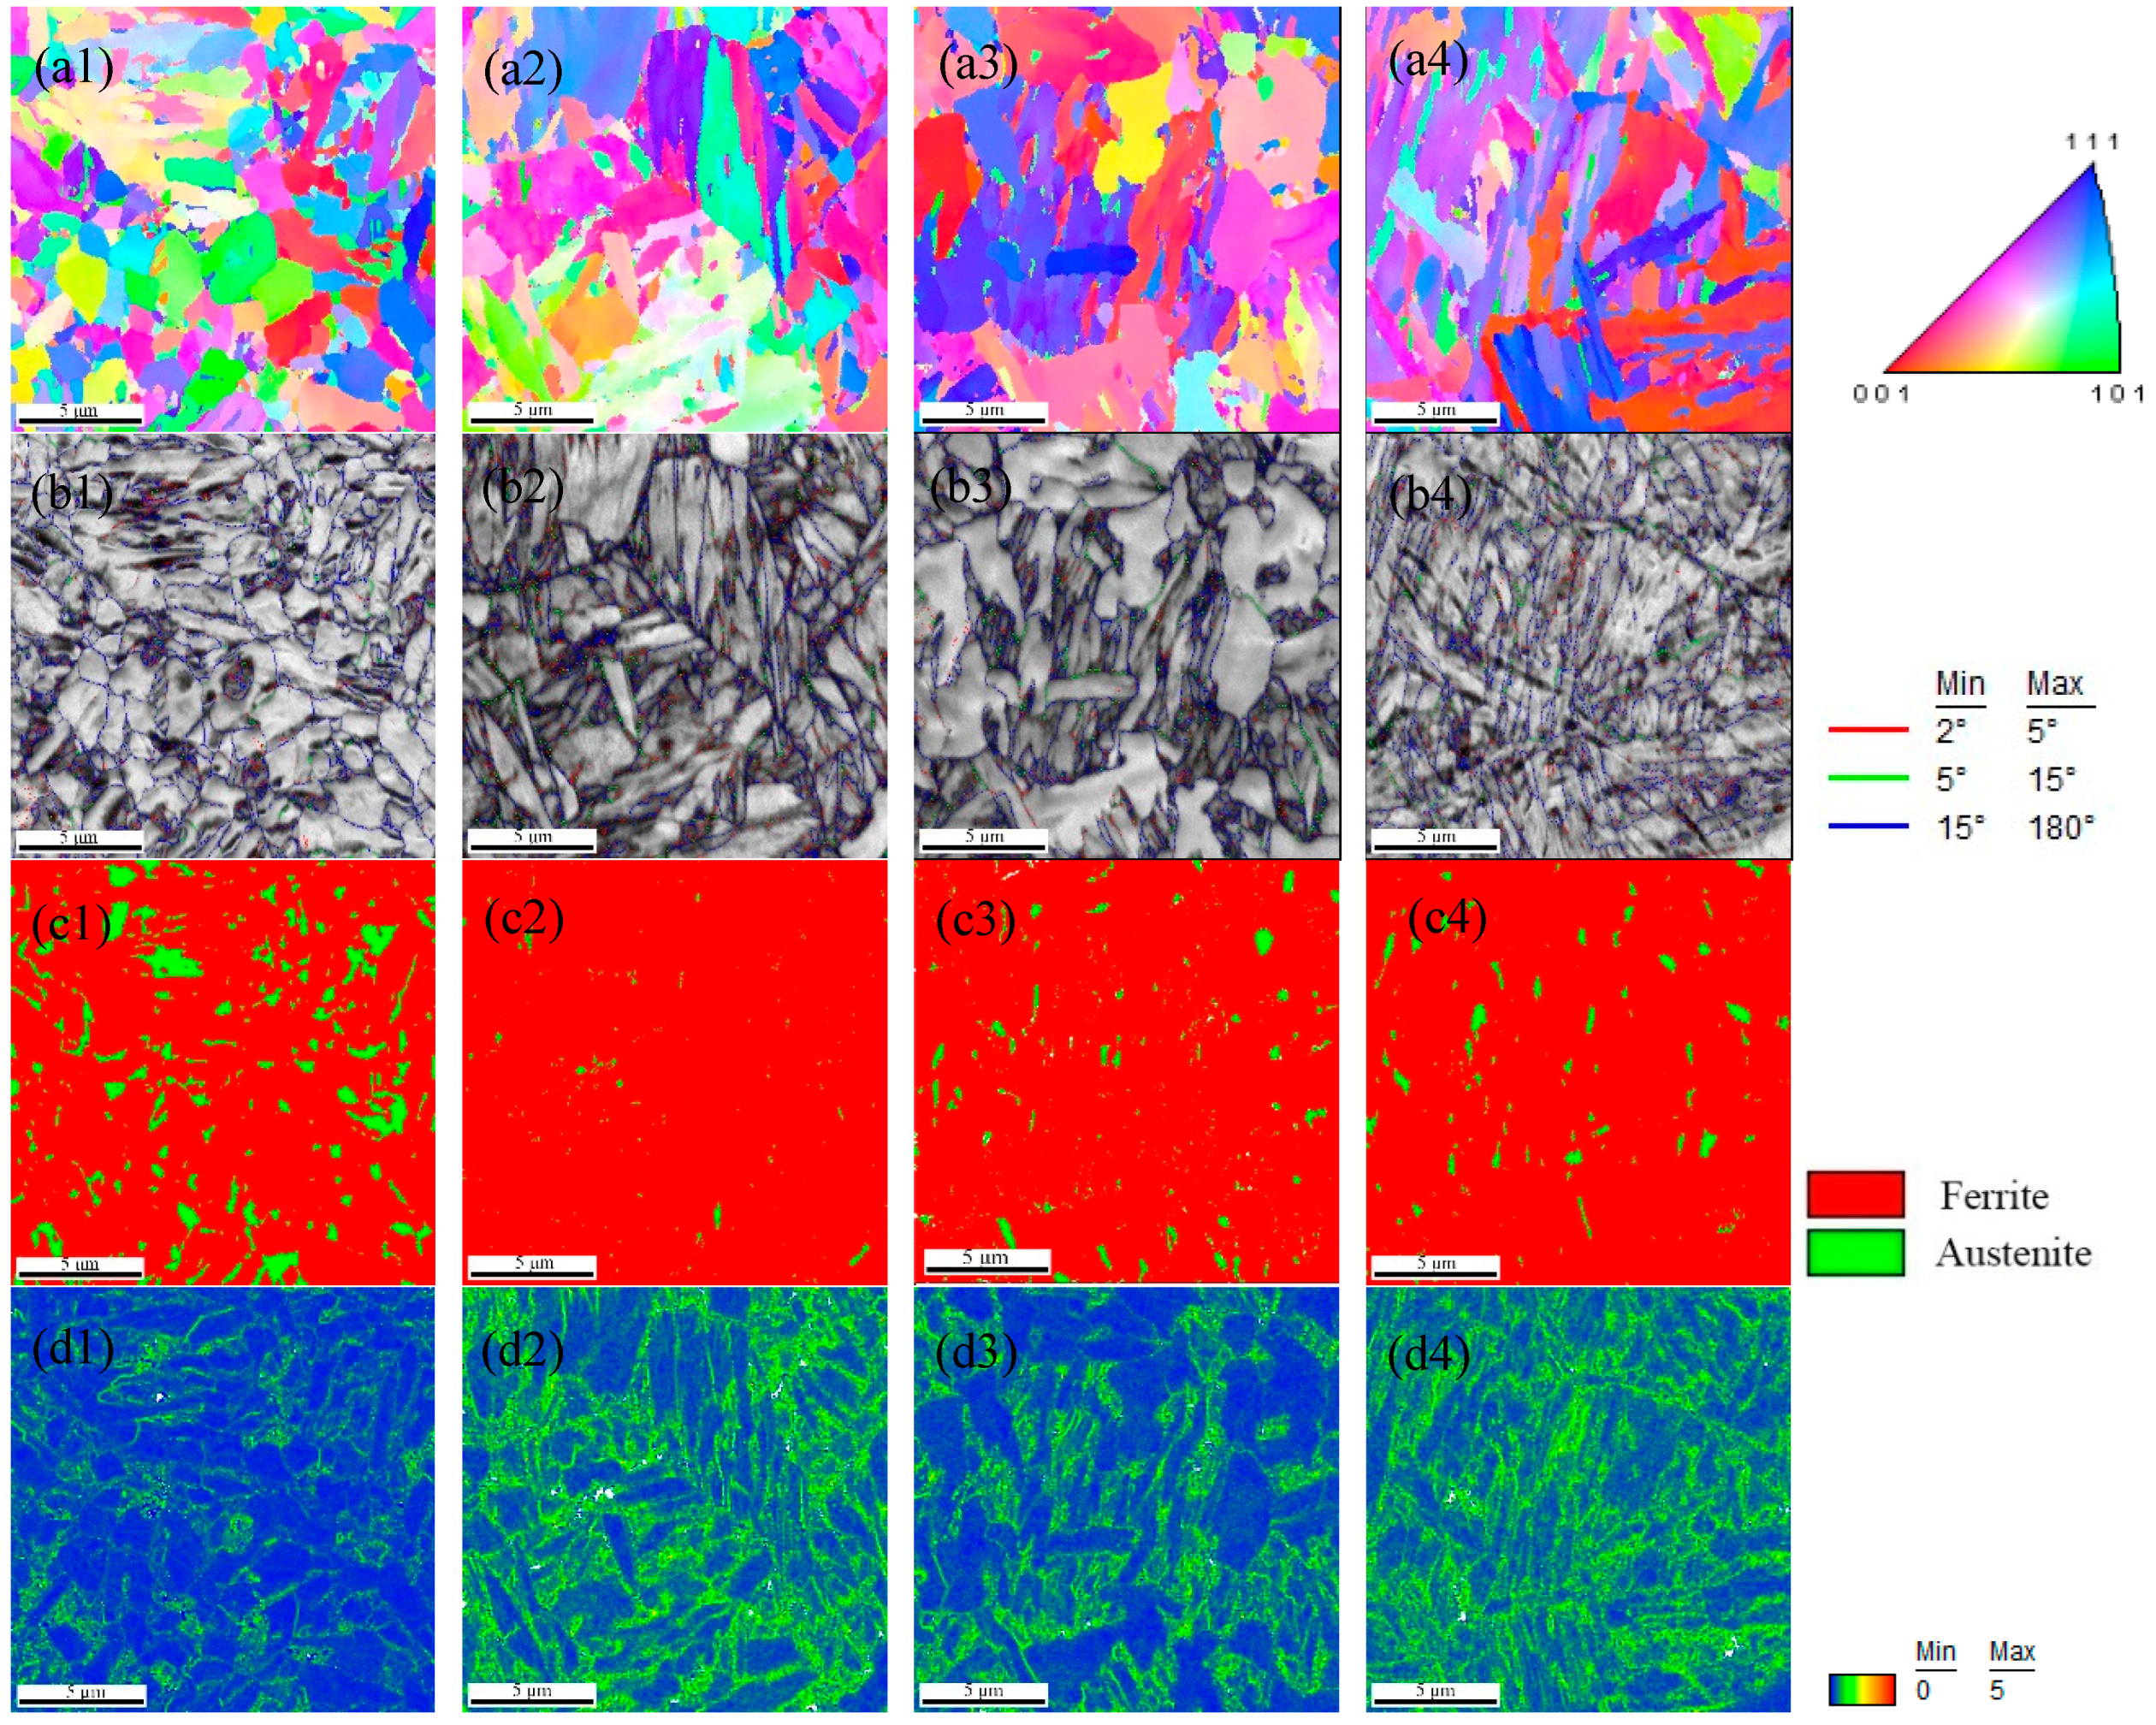
From the IPF maps in Figure 4a1–a4, the microstructure mainly consists of polygonal grains in the as-annealed sample. Martensite laths increase after quenching, Q&T, and Q&P processes. Misorientation boundary maps (Figure 4b1–b4) show the average grain size (AGS), high-angle grain boundaries (HAGBs), and low-angle grain boundaries (LAGBs) listed in Table 2. The as-annealed sample has the lowest AGS and LAGBs, with the highest HAGBs. Quenching significantly increases martensite, leading to more LAGBs and an increase in AGS.
Tempering results in static recovery, where martensite decomposes into ferrite, sub-grains, and carbides. The movement of sub-grains forms more HAGBs, refining AGS compared to the quenched sample. The Q&P sample has a similar number of HAGBs, LAGBs, and AGS.
Figure 4c1–c4 illustrates the phase distributions of fcc and bcc structures. The calculated volume fractions of retained austenite (RA) are presented in Table 3, alongside the XRD measurement results derived from Equation (2). The data indicate that the as-annealed sample contains the highest volume of RA, while the Q&T and Q&P samples have similar but lower RA content. Notably, there is a significant discrepancy between the RA volume fractions obtained from the two methods. This variance may be attributed to EBSD’s increased error potential, which arises from phase analysis over a small area. In summary, X-ray diffraction (XRD) methods provide a relatively accurate approach for estimating the volume fraction of retained austenite (RA). Among all samples, the as-annealed sample exhibits the highest volume of RA.
To further estimate the lattice constants of RA and their stability, Equations (3) and (4) are employed to determine these parameters based on XRD results, as shown in Table 4.
From Table 4, it can be observed that an increase in lattice parameter aγ resulted from carbon concentrations in RA; however, there is no significant difference between the as-annealed and various quenched samples in the lattice parameter aγ. Meanwhile, the increase in carbon content within RA indicates that the stability of RA generally improves following different quenching processes.
Figure 4d1–d4 shows the kernel average misorientation (KAM) maps for the four samples. The as-annealed sample exhibits the lowest local strain concentration. In Sample 2, internal strain significantly increases due to martensite formation. After partitioning at 330 °C, the strain levels remain high, as the decomposition of some martensite is offset by the formation of fresh martensite. However, a substantial reduction in strain is observed following tempering at 450 °C, attributed to the formation of tempered martensite.

3.2. Mechanical Properties

The mechanical properties of the steel are listed in Table 5. A Vickers Hardness Tester, using a 500 g load, was selected to measure the steel’s hardness. The results show that both the Vickers hardness (HV0.5) and ultimate tensile strength (UTS) follow a similar trend: the steel quenched at 900 °C exhibits the highest UTS and HV0.5. Regarding yield strength (YS), the steel subjected to the quench and partition process shows the highest YS. Its average elongation is 10.4%, comparable to the quenched and Q&T samples, but lower than that of the as-annealed sample.
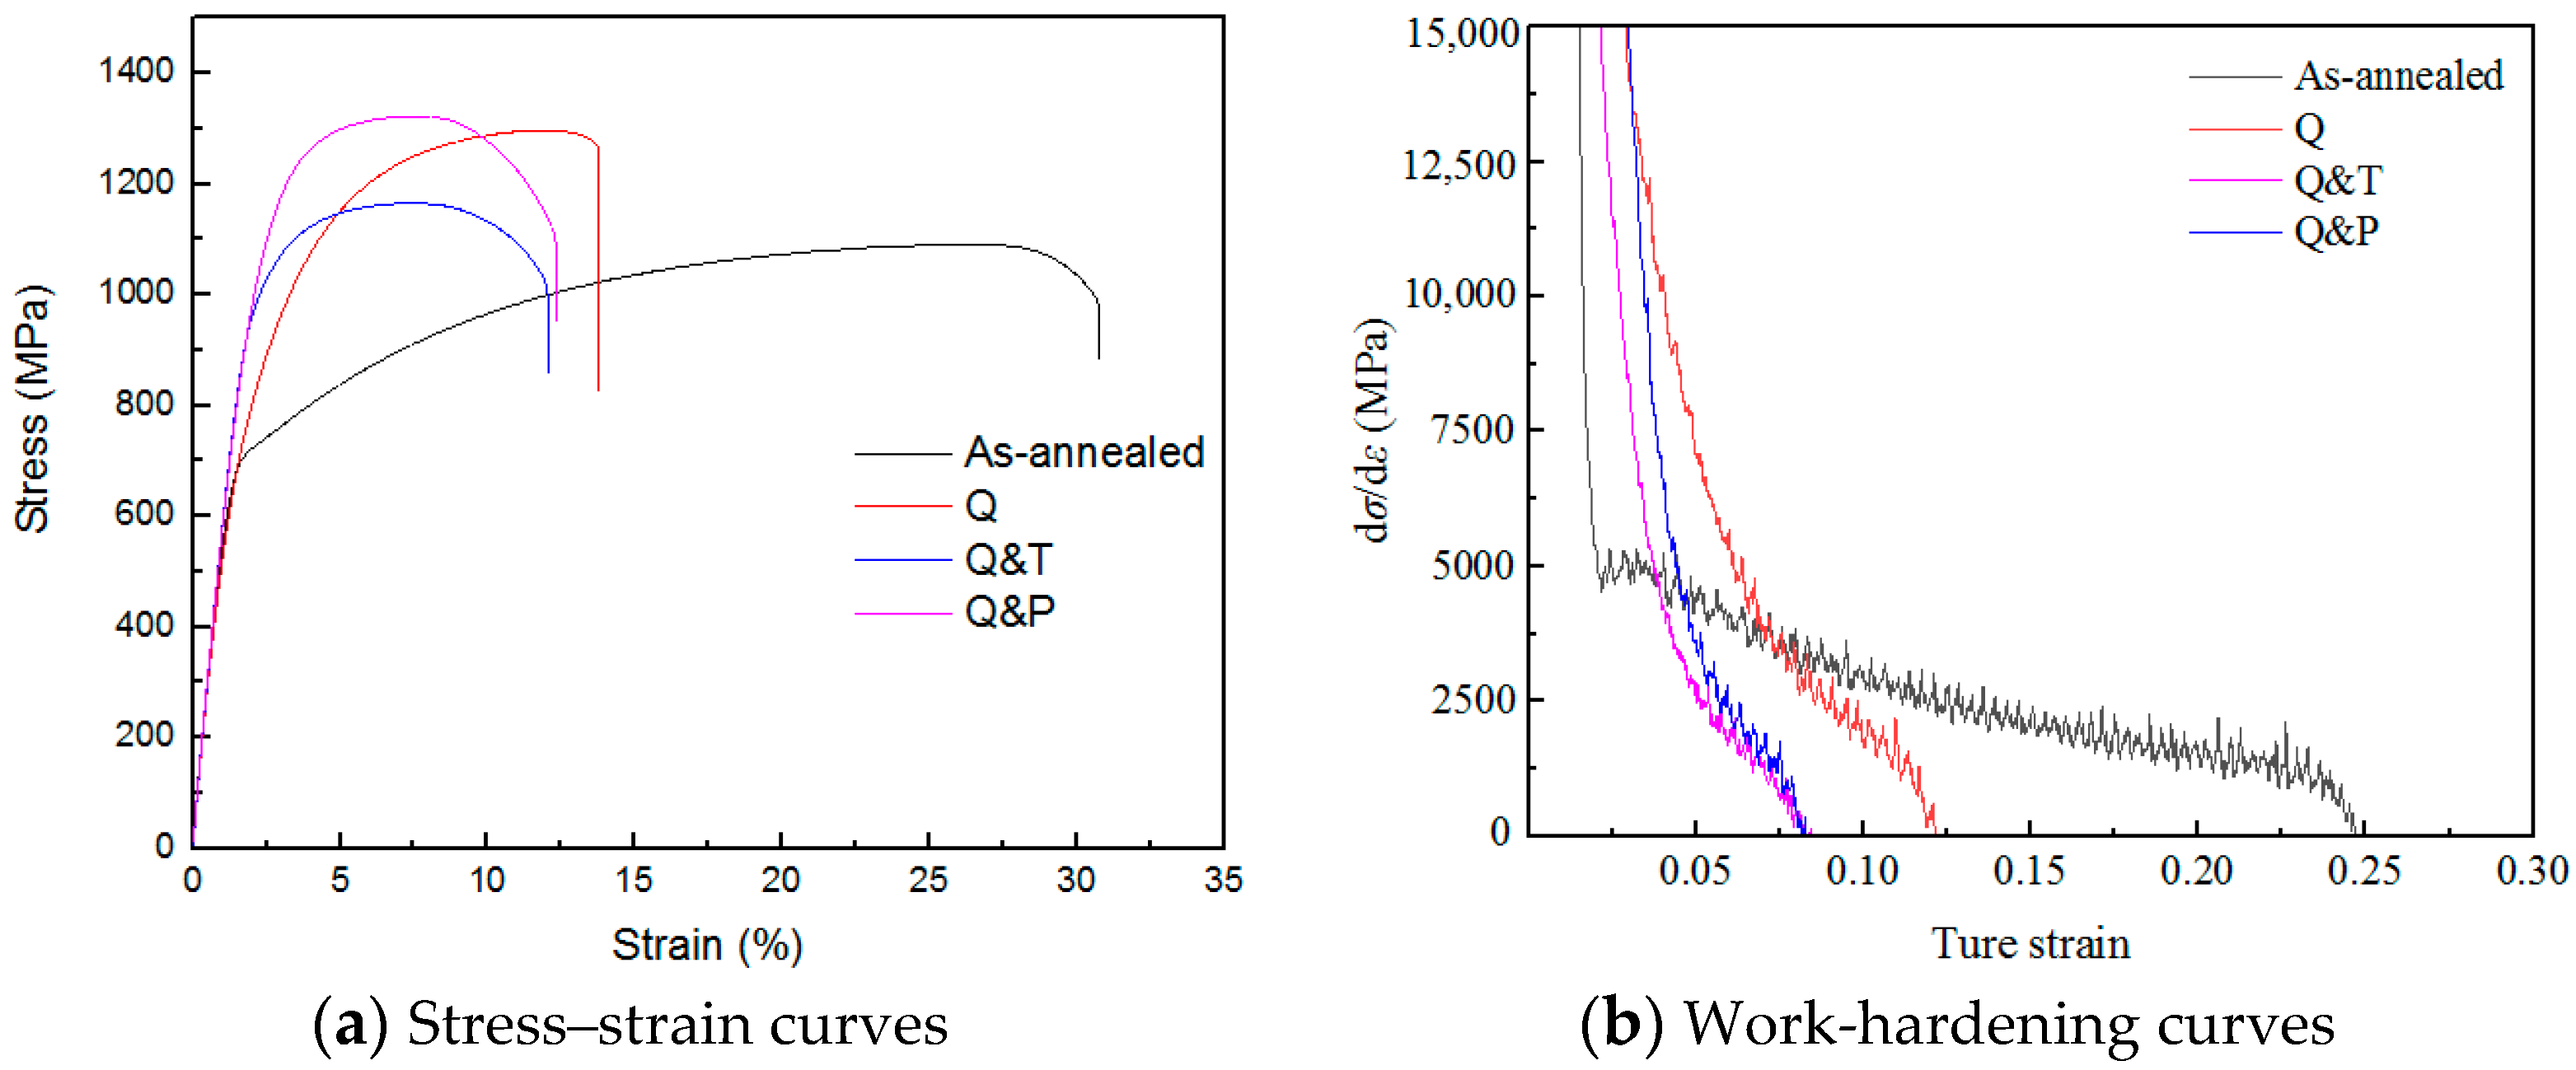
To evaluate the structural stability of the steel, the yield ratio (the ratio of yield strength to tensile strength) is introduced as an indicator. Reasonable selection of yield ratio is of great significance to control engineering cost. Thus, the yield ratios for the four samples are 0.64, 0.54, 0.9, and 0.78, respectively. Sample 2 exhibits a low yield ratio, which means that the utilization rate of the steel is relatively low. It may cause waste of steels due to their low available stress value. Sample 3 shows a high yield ratio, meaning increased steel utilization but reduced plastic reserve. This makes it prone to brittle fracture from impact or overload, resulting in structural damage. Thus, both samples have the potential to adversely affect the performance of steel, particularly in critical applications such as A/B-pillars and bumper beams of automobile body structures, where considerations of economy and safety are paramount. In contrast, Samples 1 and 4 have more suitable yield ratios thanks to the complex phases present in the steel, including bainite, martensite, ferrite, and retained austenite (RA). These combinations of soft and hard phases contribute to the steel’s balanced strength and ductility. Figure 5 illustrates the stress–strain and work-hardening characteristics of the steel.
Figure 5a shows that the as-annealed sample exhibits the largest plastic strain, while Samples 3 and 4 display similar plastic strain. Sample 2 displays a larger plastic strain than 3 and 4 because it has the highest carbon concentration in its RA. The steel treated with the quench and partition (Q&P) process achieves an ultimate tensile strength (UTS) comparable to the quenched sample with an acceptable level of ductility. As illustrated in Figure 5b, the work-hardening rate decreases sharply in both the quench and temper (Q&T) and Q&P samples within the 0–0.08 strain range, dropping to zero until the strain reaches 0.12. This behavior suggests that the higher retained austenite (RA) content enhances the transformation-induced plasticity (TRIP) effect, which inhibits the decrease in strain. The as-annealed sample shows a gradual decrease in the work-hardening rate, with a plateau appearing in the strain range of 0.02 to 0.24. This behavior is attributed to the highest fraction of RA, despite the fact that the RA in this sample is the least stable. Therefore, it appears that the RA content is the primary factor influencing the ductility of GEN3 steel.

3.3. Dislocation Density Measurement

To investigate and quantify the dislocation density in the samples, XRD analysis was employed. The integral breadth method, based on the principles of Bragg diffraction, was used to estimate both lattice microstrain and mean crystallite size. The ferrite or martensite phase exhibited three distinct peaks, and their profiles, accounting for grain size and strain broadening, were approximated using Cauchy and Gaussian models. These approximations resulted in the following equation [17]:
δ 2 θ 2 tan 2 θ 0 = λ d δ 2 θ tan θ 0 sin θ 0 + 25 e 2
where δ2θ represents the measured integral breadth; θ0 is the maximum position of the selected diffraction peak; d is the average crystallite size; and e is the lattice microstrain. The dislocation density ρ could be calculated by the following equation [18]:
ρ = 2 3 e 2 1 2 / d × b
Here, b stands for the Burgers vector, with a value of 0.248 nm for body-centered cubic (bcc) iron alloys [19]. The parameters d and e can be obtained from the slope and intercept of a plot of ( δ 2 θ / tan θ 0 ) 2 against δ 2 θ / tan θ 0 sin θ 0 . The resulting values for dislocation density, lattice microstrain, and crystallite size are presented in Table 6. After quenching and partitioning, the dislocation density was observed to reach around 1015 m−2, indicating significant refinement of the substructure.

3.4. Precipitates

This section focuses on the precipitation behaviors of the steel, specifically examining the calculations, types, and distributions of precipitates. The findings are presented in three parts.

3.4.1. Calculation of Precipitations

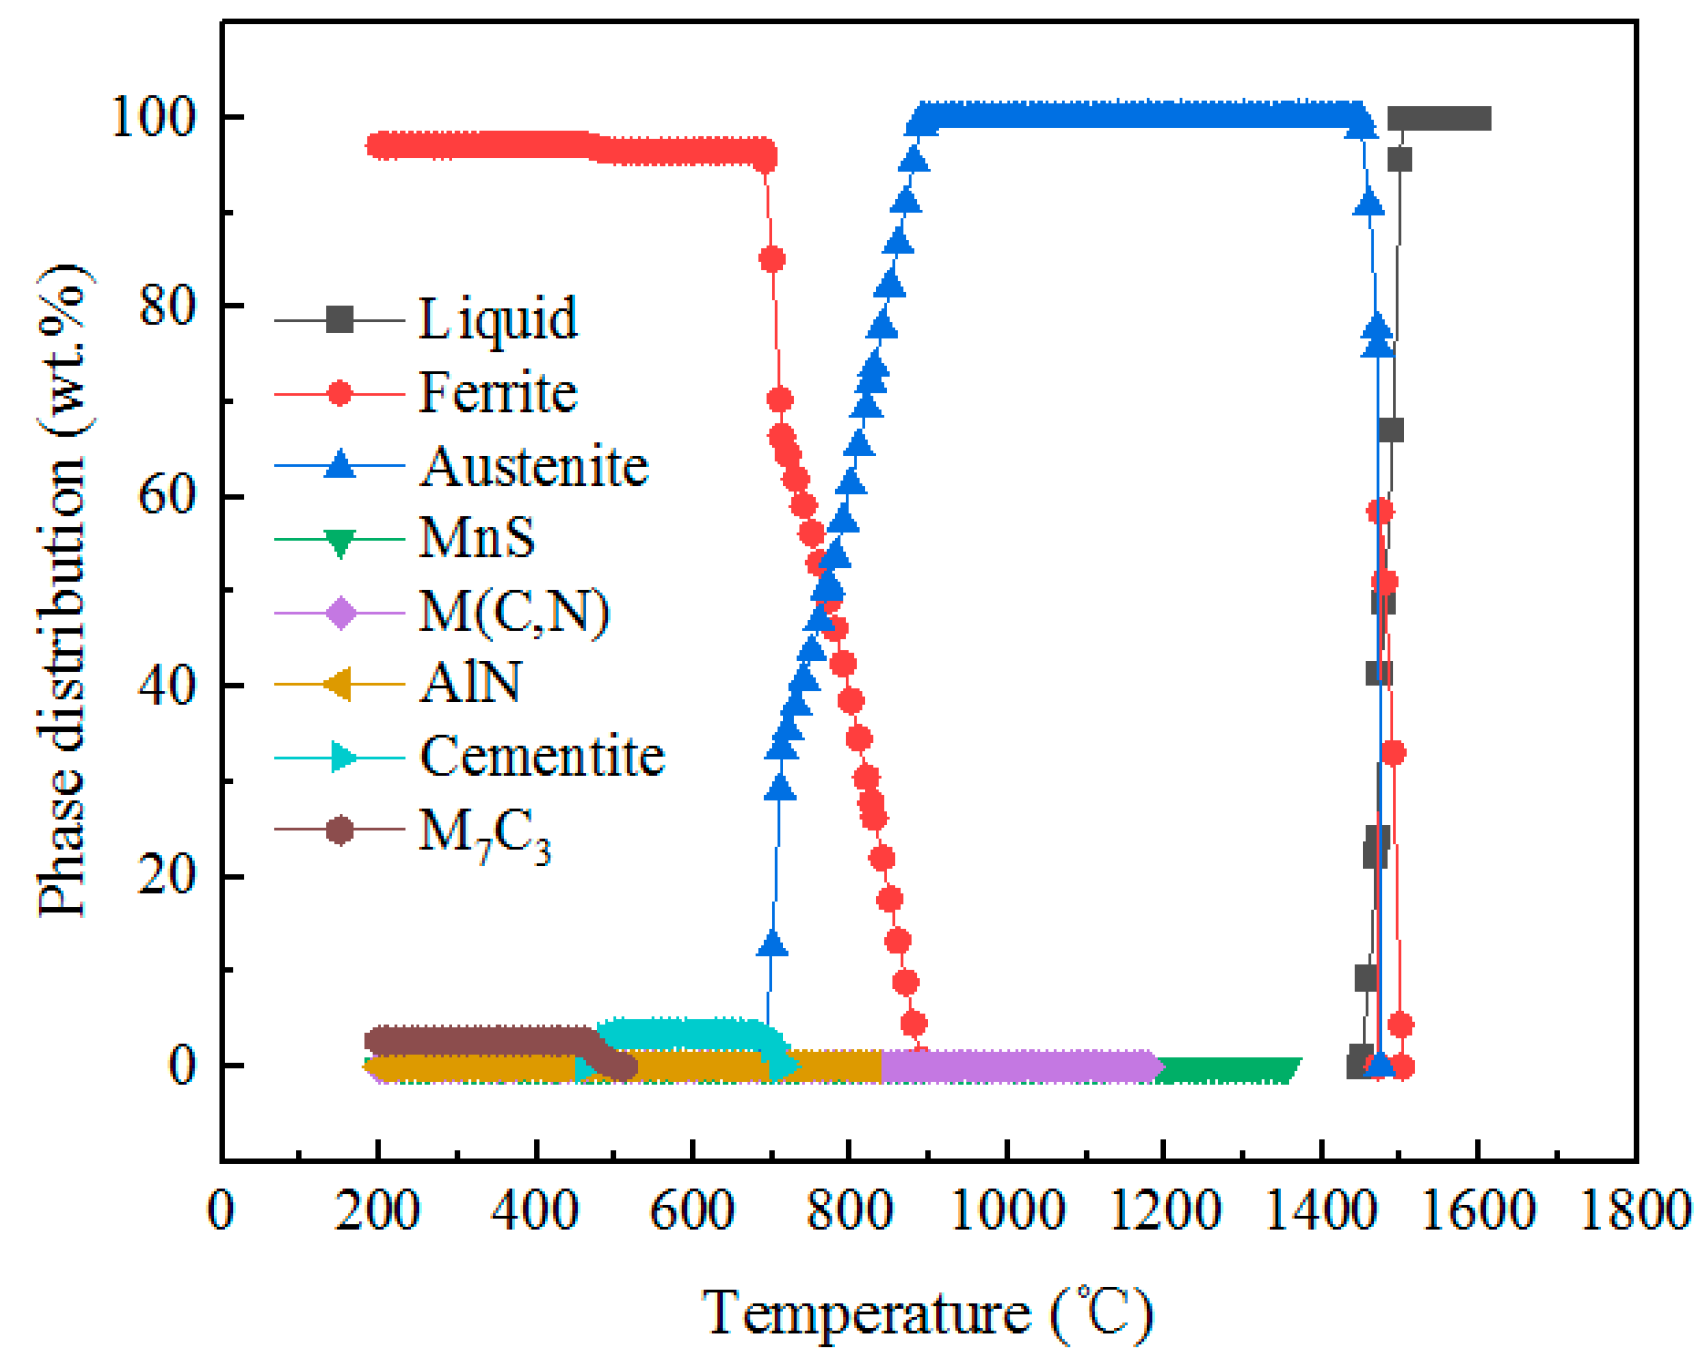
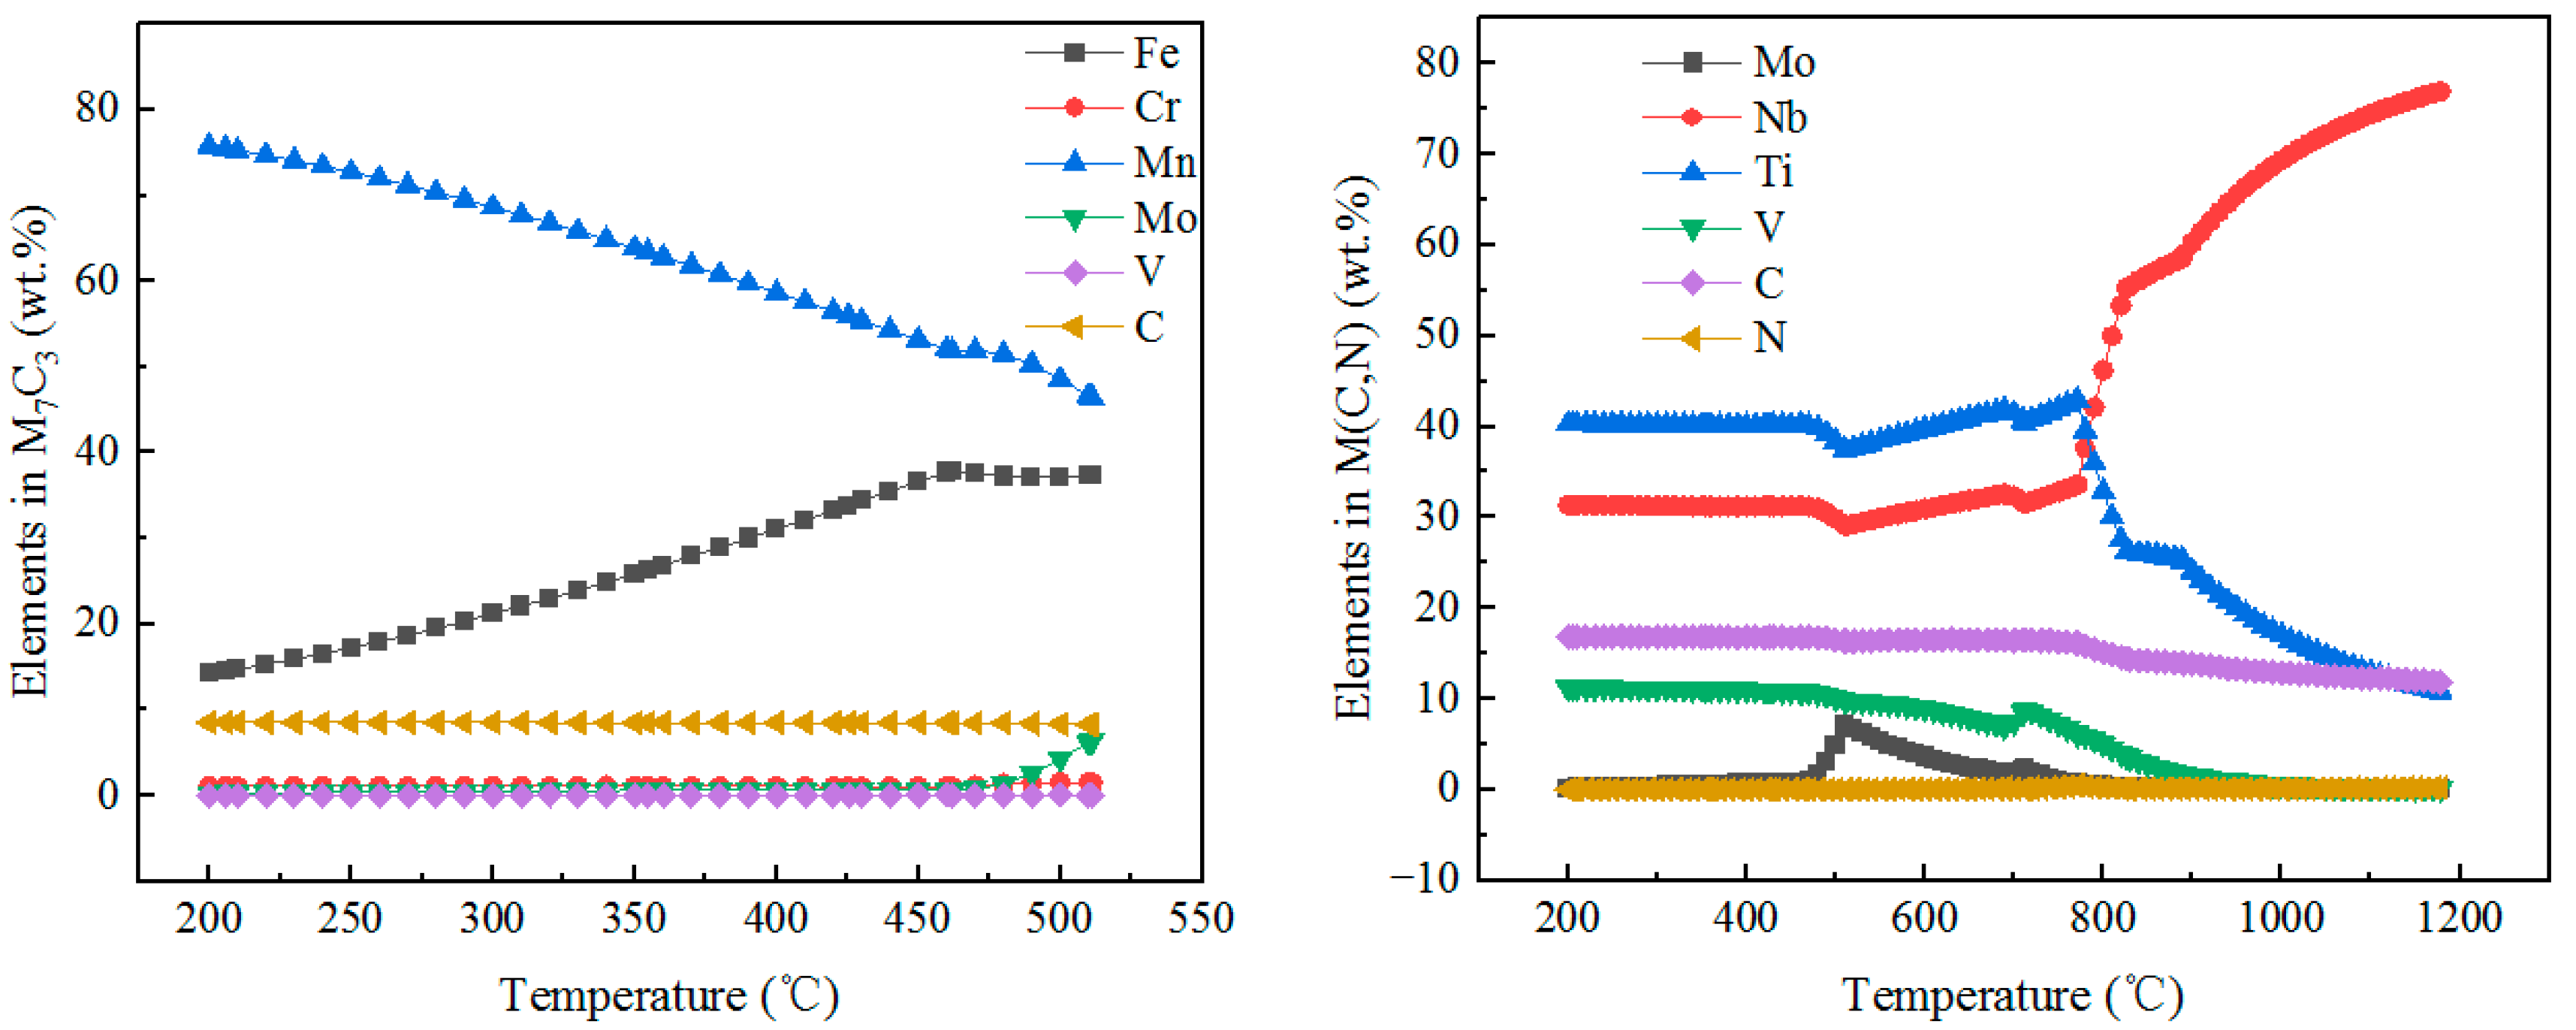
Figure 6 illustrates the thermodynamic diagram generated using JMatPro software. At room temperature, ferrite, alongside equilibrium precipitates, represents the predominant phases in the sample steel. As the temperature decreases from 1600 °C, a solid–liquid coexistence zone exists between 1448 °C and 1501 °C. Upon entering the solid phase, MnS is the first to precipitate at 1354 °C, followed by M(C, N) at approximately 1178 °C, and AlN at around 826 °C. M3C (cementite) forms at 712 °C but is unstable and decomposes rapidly at 462 °C. M7C3 is a stable precipitate that forms at 511 °C. Consequently, the primary precipitates include MnS, M(C, N), AlN, and M7C3. The elemental composition of M7C3 and M(C, N) is shown in Figure 7, with Fe, Mn, and Cr as the primary components of M7C3, while Nb, V, Ti, and Mo are the main metallic elements in M(C, N).

3.4.2. Types of Precipitates

Several precipitate types, including carbides and carbonitrides, were identified using TEM.
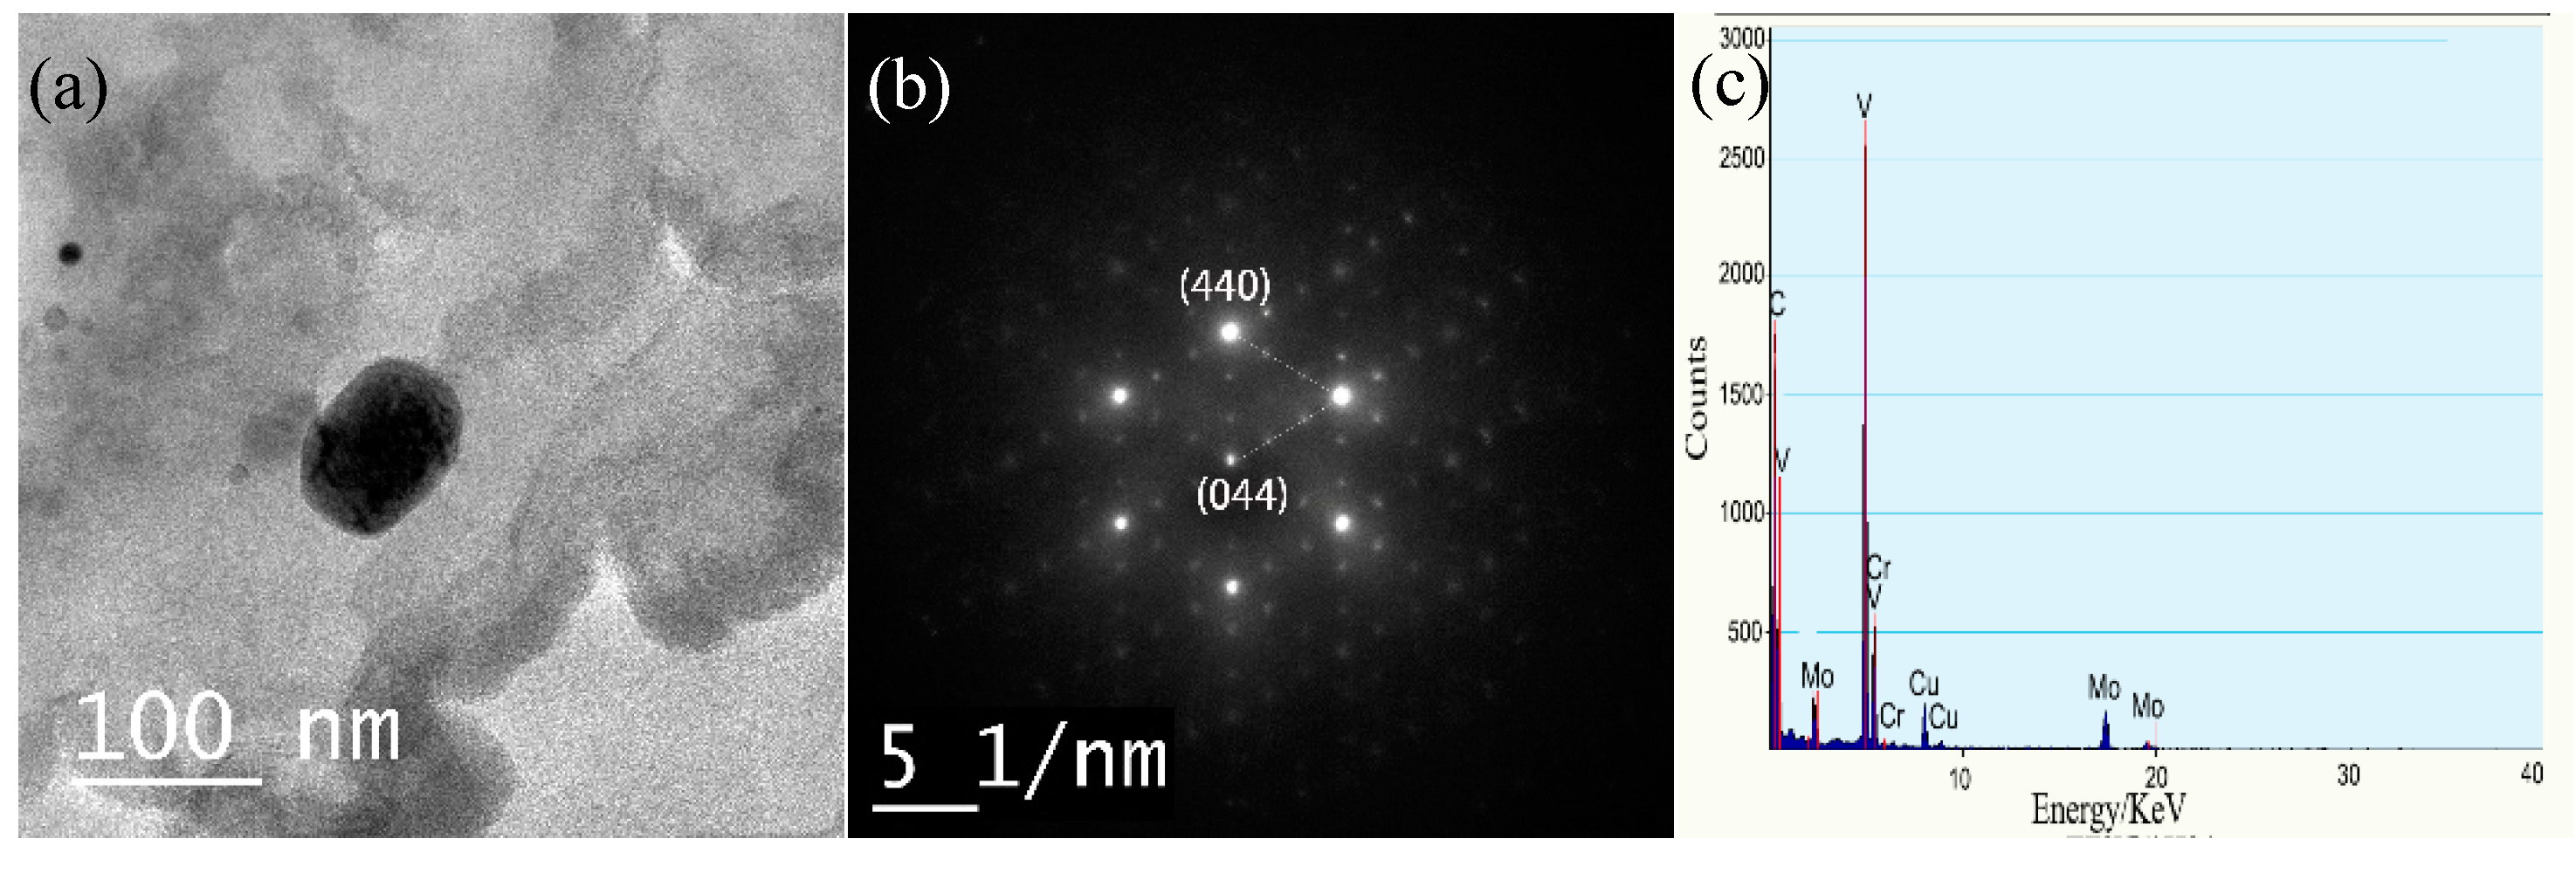
After analyzing 20 photomicrographs and the EDS results, it was determined that most particles are MX and M7C3 type carbides, typically square or elongated in shape and smaller than 200 nm, as shown in Figure 8, Figure 9 and Figure 10. MnS and AlN were not observed in this experiment, likely due to the very low sulfur and nitrogen content in GEN3 steel. M2C carbides are square-like, rich in vanadium and molybdenum, and possess an orthorhombic structure with lattice constants of a = 0.458 nm, b = 0.574 nm, and c = 0.504 nm. These were observed in the Q&T sample, as shown in Figure 8. M2C carbides nucleate between martensite laths after the Q&T process as secondary hardening carbides, which may inhibit the growth of austenite [20]. M7C3 was detected in the Q&P sample, appearing irregularly square. As shown in Figure 9, it has a hexagonal structure and primarily contains chromium, according to EDS. Its lattice constants are a = b = 1.398 nm and c = 0.452 nm. V8C7 was detected after the quenching process and belongs to cubic MC-type carbides. As shown in Figure 10, it is irregularly spherical and rich in vanadium, as indicated by EDS, with a lattice constant of a = b = c = 0.833 nm.
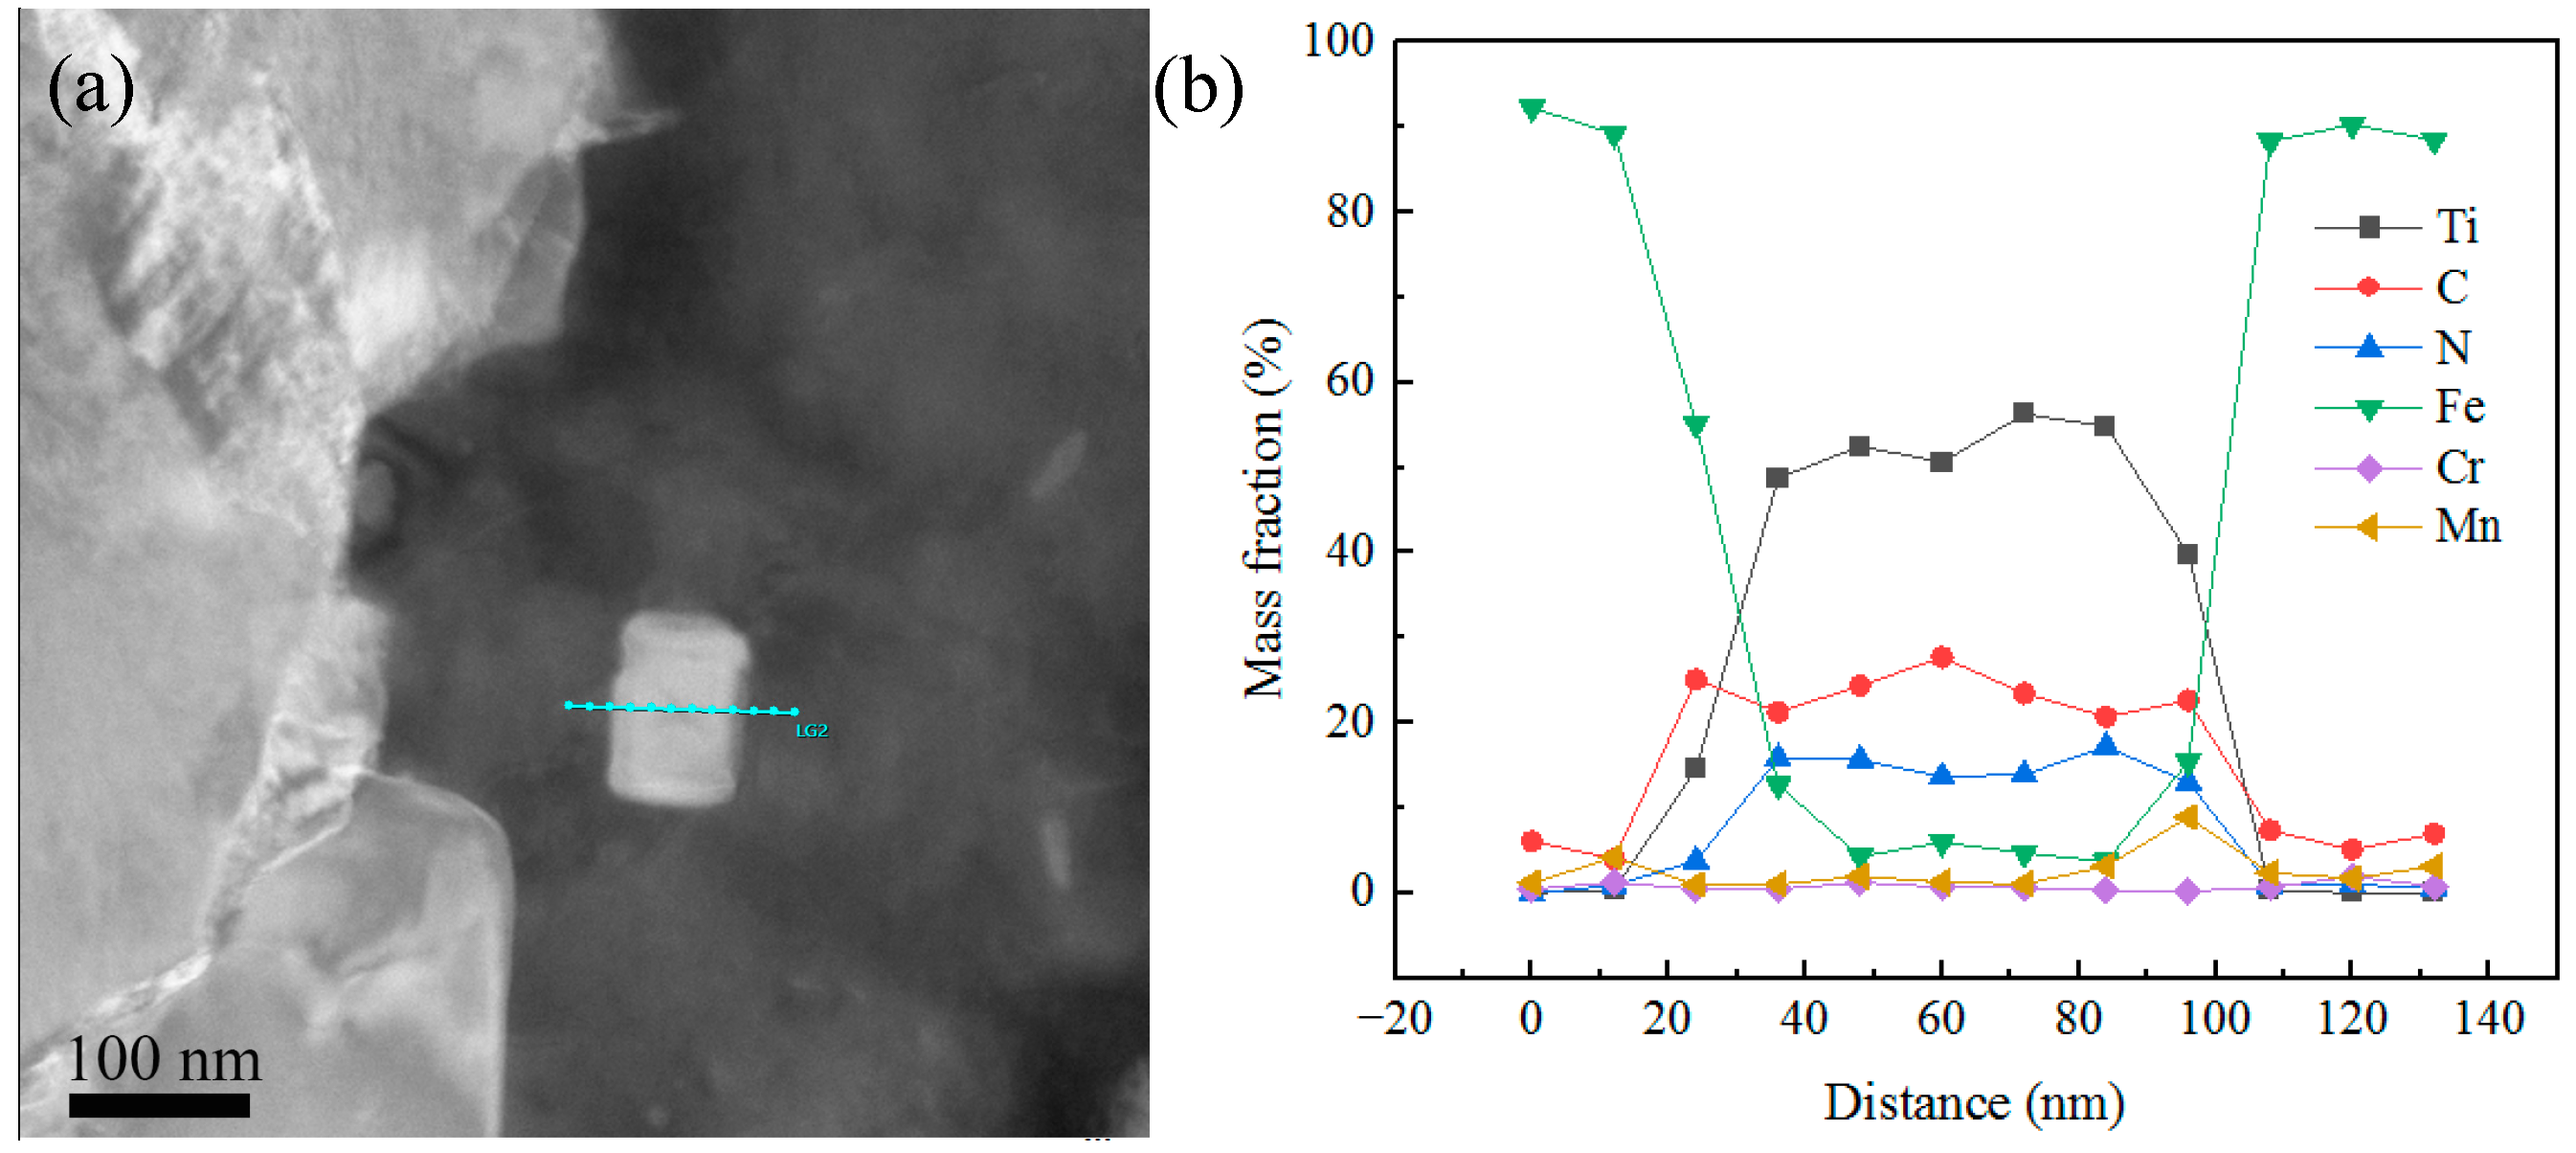
Ti(C, N) was observed in the as-quenched sample. The line scanning result (Figure 11a) under STEM mode, via twin-jet electropolishing, shows a square-like precipitate composed of Ti, C, and N (Figure 11b). Although the nitrogen content in this steel is low (0.0017%), titanium and nitrogen form a stronger bond compared to aluminum and nitrogen at temperatures up to 900 °C, as discussed in Section 3.4.1.

3.4.3. Distribution of Precipitates

Precipitate counts were performed on 20 SEM images per sample. Precipitate volume fractions were estimated using the following equation [21]:
V = 1.4 π 6 N D 2 S
Here, S denotes the area covered by the photographs measured in square micrometers (μm2), N stands for the count of precipitates, and D is the mean diameter of precipitates in micrometers.
Table 7 provides a summary of the precipitate count, their volume fraction, and average sizes.
It can be concluded that Sample 3, following the Q&T process, exhibits the largest volume fraction of precipitates due to martensite decomposition during tempering. In contrast, Sample 2 has the fewest precipitates because most of the carbon remains dissolved in the martensite, with insufficient time to precipitate during the rapid cooling process. The Q&P process results in a significant quantity of precipitates, second only to the Q&T sample, which can be attributed to the low silicon content in the steel [2].

4. Discussion

4.1. Microstructure Comparisons of Q&T and Q&P Specimens

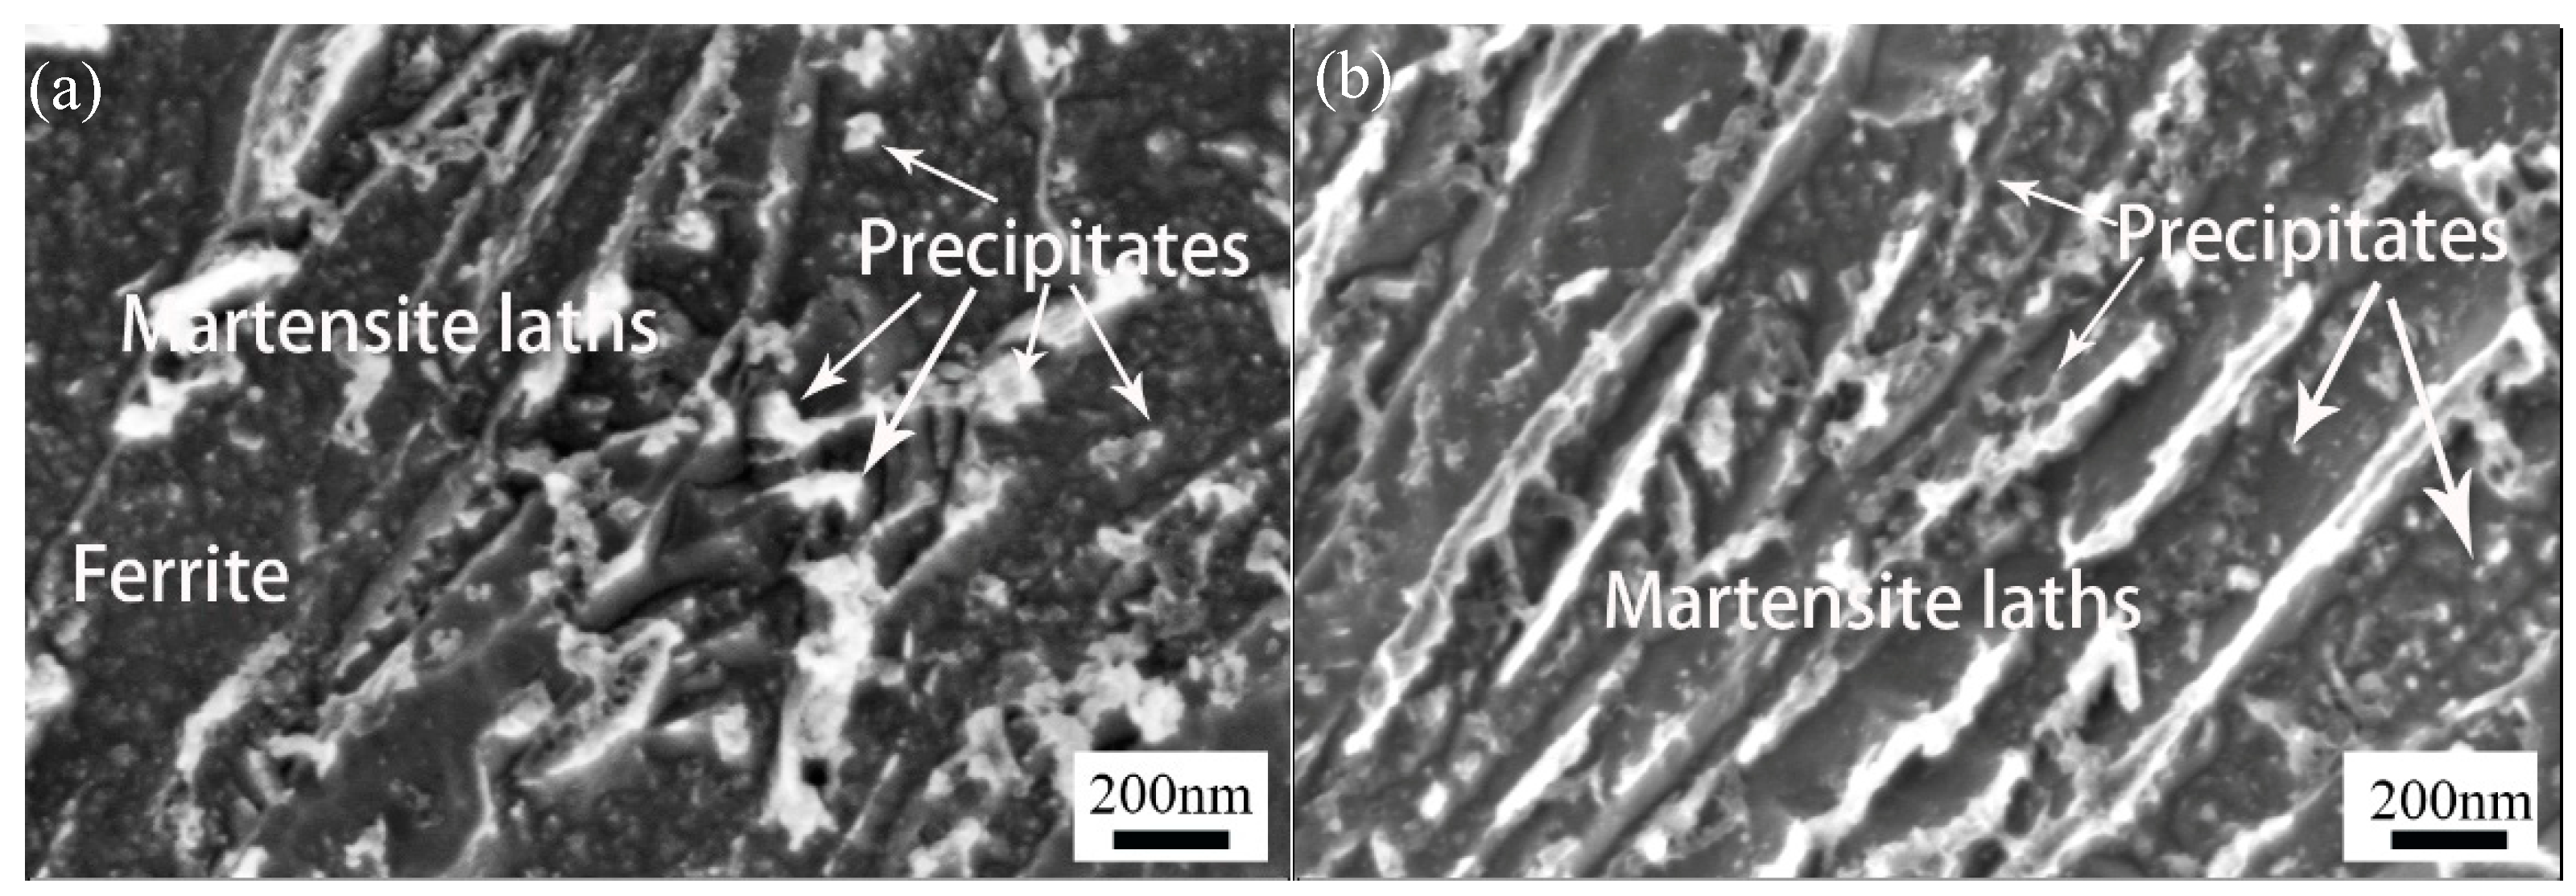
Figure 12 illustrates the differences in the martensite structures and the presence of a significant amount of precipitates. In Figure 12a, the tempered martensite structure reveals partially decomposed martensite laths that have transformed into α-ferrite and precipitates during the tempering process. In contrast, Figure 12b shows a martensite structure mainly consisting of primary martensite, fresh martensite (secondary martensite), and precipitates. Here, primary martensite specifically refers to the martensite formed after quenching but before the partitioning process. It is important to note that primary and fresh martensite could not be distinctly differentiated in this study, and further investigation may be needed in the future. Current observations suggest that the partitioning process enhances carbon diffusion, which not only stabilizes retained austenite (RA) but also promotes the formation of various carbides by combining with Fe, Cr, and other alloying elements. These findings align with the significant number of precipitates reported in Table 7.
Furthermore, Figure 12 reveals the presence of fine martensite laths characterized by their small longitudinal length in both Q&P and Q&T samples. In the Q&P samples, these fine martensites likely originate from fresh martensite, while in the Q&T samples, they may result from tempered martensite after decomposition. These fine martensites are often unevenly distributed within the prior austenite grains and coexist with RA or ferrite, as depicted in Figure 3c,d. They are more susceptible to fragmentation and fibrous transformation under deformation, which can lead to the narrowing of the work-hardening plateau observed in Figure 5b. This provides a plausible explanation for the presence of a narrow work-hardening plateau despite a considerable amount of RA remaining after the Q&P and Q&T processes.

4.2. Discussion on Strengthening Mechanism

4.2.1. Grain Boundary Strengthening

It has been established that as-annealed GEN3 steel primarily consists of bainite, ferrite, and retained austenite (RA), while the quench and partition (Q&P) sample is mainly composed of martensite and RA. Grain boundary strengthening in this steel can be described by the Hall–Petch equation [22]:
σ gb = k d M 1 2
Here, dM represents the average width of bainite or martensite laths in GEN3 steels, measured in micrometers (μm), while k is the Hall–Petch constant as reported in the literature [23]. The calculated grain boundary strengthening values are 157 MPa, 112 MPa, 125 MPa, and 138 MPa for the respective samples. The as-annealed sample shows the highest contribution to strengthening due to its finer bainite laths.

4.2.2. Dislocation Strengthening

The contribution of dislocations to yield strength can be calculated using a variant of the Taylor equation [24]:
σ dis = C × ρ 1 2
where C is 7.34 × 10⁻⁶ MPa·m, and ρ is dislocation density in m−2.
Calculations show dislocation strengthening values of 149 MPa, 186 MPa, 155 MPa, and 249 MPa, respectively. The high dislocation density in the Q&P sample results in a significant contribution to dislocation strengthening.

4.2.3. Precipitation Strengthening

When precipitates have a relatively larger average diameter, the primary strengthening mechanism shifts to the Orowan dislocation bypass process [24]. Based on Gladman’s theory, the formula for the precipitation strengthening mechanism can be derived using the Ashby–Orowan correction model [25]:
σ ppt = 10 G b 5.72 π 3 / 2 r V 1 2 ln r b
Here, r denotes the mean radius of the precipitates. Based on the precipitation strengthening model suggested by Fu et al. [26], the enhancement from precipitation strengthening can be determined using the formula. For the four samples, the strengthening to the yield strength is 197 MPa, 203 MPa, 421 MPa, and 400 MPa, respectively. The Q&T sample exhibits the highest value, attributed to its high-volume fraction of precipitates.

4.2.4. Solid Solution Strengthening

The increase in yield strength due to solid solution strengthening can be expressed by the equation [27]:
σ ss = 4570   w [ C ] + 32   w [ Mn ] + 84   w [ Si ] + 3   w [ V ] + 11   w [ Mo ] 30   w [ Cr ] + 30   w [ Ni ] + 38   w [ Cu ]
An equilibrium concentration of interstitial carbon, assumed to be 0.02 wt.% [24,28], was used in the calculation. It is important to note that this calculation excludes the potential effects of carbon supersaturation, providing a conservative lower-bound estimate for solid solution strengthening [29]. Table 8 presents the alloy element concentrations in GEN3 steel under various heat treatments, which were used to compute the strengthening contribution. These values were derived using the thermodynamic software, JMatPro.
Using Equation (11), the solid solution strengthening contributions are determined as 179 MPa, 219 MPa, 175 MPa, and 157 MPa, respectively. The quenched sample exhibits the highest solid solution strengthening due to the dissolution of carbon and alloying elements.

4.2.5. Comprehensive Strengthening

This research evaluates the overall strengthening mechanisms of GEN3 steel by considering factors such as lattice fractional shear stress, solid solution effects, grain boundary strengthening, dislocation strengthening, and precipitation hardening [30]. Consequently, the theoretical yield strength σy is derived, as shown in Equation (12):
σ y = σ 0 + σ ss + σ gb + σ dis + σ ppt ( M P a )
Here, σ ss , σ gb , σ dis , and σ ppt denote the respective effects of solid solution strengthening, grain boundary enhancement, dislocation hardening, and precipitation strengthening. σ 0 corresponds to the lattice fractional shear stress, which is typically estimated at 54 MPa [31].
The full results are summarized in Table 9. Precipitation strengthening appears to be the primary contributor to yield strength in Samples 3 and 4. In Sample 3, both precipitation strengthening and dislocation strengthening play significant roles. The discrepancy between calculated and experimental yield strength values is minimal and within the accepted error range. However, the calculated value for the as-annealed sample is higher than the experimental value, possibly due to the overlapping effects of dislocation and precipitation mechanisms during calculations. Overall, the prediction model is rudimentary, and key phases such as retained austenite have been disregarded due to their low volume fractions.

5. Conclusions

In this paper, various quenching processes were employed to simulate the hot stamping process and produce steel with varying levels of strength and ductility. We examined the structure–property characteristics of a 1000 MPa grade low-alloyed lightweight TRIP-assisted GEN3 steel with different matrix structures. The main conclusions are as follows:
(1) The retained austenite (RA) content in the as-annealed sample reaches up to 11.9%, resulting in a more gradual decrease in the work-hardening rate compared to other heat-treated samples.
(2) Although the stability of retained austenite (RA) improves after different quenching processes, both Q&P and Q&T samples still exhibit low work-hardening rates. This is primarily due to the uneven distribution of martensite laths with fine structures.
(3) GEN3 steel treated with the quench and partition (Q&P) process exhibits the highest dislocation density, indicating significant refinement of the substructure.
(4) Precipitation strengthening is the primary contributor to yield strength in the Q&P and Q&T processes due to the diffusion of carbon during the partition process and the formation of tempered martensite.

Author Contributions

Conceptualization, A.N. and T.S.; methodology, A.N.; software, A.N.; validation, T.S. and S.Y.; formal analysis, A.N.; investigation, T.S.; resources, T.S.; data curation, A.N.; writing—original draft preparation, A.N.; writing—review and editing, R.G.; visualization, R.G.; supervision, S.Y.; project administration, A.N.; funding acquisition, A.N. All authors have read and agreed to the published version of the manuscript.

Funding

The research was supported by the Research Project funded by the Shanxi Scholarship Council of China (Grant No. 2023-064).

Data Availability Statement

The original contributions presented in the study are included in the article, further inquiries can be directed to the corresponding author.

Acknowledgments

The authors would like to acknowledge the technical support from the Instrumental Analysis Center at Taiyuan University of Technology.

Conflicts of Interest

The authors declare no conflict of interest.

References

  1. Varshney, A.; Sangal, S.; Kundu, S.; Mondal, K. Super strong and highly ductile low alloy multiphase steels consisting of bainite, ferrite, and retained austenite. Mater. Des. 2016, 95, 75–88. [Google Scholar] [CrossRef]
  2. Zhao, J.L.; Zhao, X.M.; Zhao, X.Y.; Dong, C.Y.; Kang, S.X. Effects of nucleation site and morphology of carbide-free bainite on microstructures and properties of bainite/martensite multi-phase steels. Mater. Sci. Eng. A 2019, 744, 86–93. [Google Scholar] [CrossRef]
  3. Caballero, F.; Bhadeshia, H. Very strong bainite. Curr. Opin. Solid State Mater. Sci. 2004, 8, 251–257. [Google Scholar] [CrossRef]
  4. Rementeria, R.; Morales-Rivas, L.; Kuntz, M.; Garcia-Mateo, C.; Kerscher, E.; Sourmail, T.; Caballero, F. On the role of microstructure in governing the fatigue behaviour of nanostructured bainitic steels. Mater. Sci. Eng. A 2015, 630, 71–77. [Google Scholar] [CrossRef]
  5. Garcia-Mateo, C.; Caballero, F. Ultra-high-strength bainitic steels. ISIJ Int. 2005, 45, 1736–1740. [Google Scholar] [CrossRef]
  6. Speer, J.; Edmonds, D.; Rizzo, F.; Matlock, D. Partitioning of carbon from supersaturated plates of ferrite, with application to steel processing and fundamentals of the bainite transformation. Curr. Opin. Solid State Mater. Sci. 2004, 8, 219–237. [Google Scholar] [CrossRef]
  7. Gao, G.; Zhang, H.; Gui, X.; Tan, Z.; Bai, B.; Weng, Y. Enhanced strain hardening capacity in a lean alloy steel treated by a “disturbed” bainitic austempering process. Acta Mater. 2015, 101, 31–39. [Google Scholar] [CrossRef]
  8. Pierman, A.P.; Bouaziz, O.; Pardoen, T.; Jacques, P.J.; Brassart, L. The influence of microstructure and composition on the plastic behaviour of dual-phase steels. Acta Mater. 2014, 73, 298–311. [Google Scholar] [CrossRef]
  9. Mark, A.F.; Wang, X.; Essadiqi, E.; Embury, J.D.; Boyd, J.D. Development and characterisation of model TRIP steel microstructures. Mater. Sci. Eng. A 2013, 576, 108–117. [Google Scholar] [CrossRef]
  10. Speer, J.; Matlock, D.K.; De Cooman, B.C.; Schroth, J.G. Carbon partitioning into austenite after martensite transformation. Acta Mater. 2003, 51, 2611–2622. [Google Scholar] [CrossRef]
  11. Edmonds, D.V.; He, K.; Rizzo, F.C.; De Cooman, B.C.; Matlock, D.K.; Speer, J. Quenching and partitioning martensite—A novel steel heat treatment. Mater. Sci. Eng. A 2006, 438–440, 25–34. [Google Scholar] [CrossRef]
  12. Tan, X.D.; Xu, Y.; Yang, X.; Wu, D. Microstructure–properties relationship in a one-step quenched and partitioned steel. Mater. Sci. Eng. A 2014, 589, 101–111. [Google Scholar] [CrossRef]
  13. Mori, K.; Bariani, P.F.; Behren, B.A.; Brosius, A.; Bruschi, S.; Maeno, T.; Merklein, M.; Yanagimoto, J. Hot stamping of ultra-high strength steel parts. CIRP Ann. 2017, 66, 755–777. [Google Scholar] [CrossRef]
  14. Leslie, W.C. The Physical Metallurgy of Steels; Hemisphere Publishing Corporation: Washington, DC, USA, 1981. [Google Scholar]
  15. Zhou, S.; Zhang, K.; Wang, Y.; Gu, J.F.; Rong, Y.H. High strength-elongation product of Nb-microalloyed low-carbon steel by a novel quenching-partitioning-tempering process. Mater. Sci. Eng. A 2011, 528, 8006–8012. [Google Scholar] [CrossRef]
  16. Zhou, S.; Zhang, K.; Chen, N.; Gu, J.; Rong, Y. Investigation on high strength hot-rolled plates by quenching-partitioning-tempering process suitable for engineering. ISIJ Int. 2022, 51, 1688–1695. [Google Scholar] [CrossRef]
  17. Alexander, L.; Klug, H.P. X-ray Diffraction Procedures for Polycrystalline and Amorphous Materials; John Wiley & Sons: New York, NY, USA, 1974; pp. 150–170. [Google Scholar]
  18. Zhao, Y.H.; Liao, X.Z.; Jin, Z.; Valiev, R.Z.; Zhu, Y.T. Microstructures and mechanical properties of ultrafine grained 7075 Al alloy processed by ECAP and their evolutions during annealing. Acta Mater. 2004, 52, 4589–4599. [Google Scholar] [CrossRef]
  19. Mazaheri, Y.; Kermanpur, A.; Najafizadeh, A. Strengthening mechanisms of ultrafine grained dual phase steels developed by new thermomechanical processing. ISIJ Int. 2015, 55, 218–226. [Google Scholar] [CrossRef]
  20. Cui, Z.Q.; Qin, Y.C. Metal Science and Heat Treatment; Machinery Industry Press: Beijing, China, 2007. [Google Scholar]
  21. Pellissier, G.E.; Purdy, S.M. Stereology and Quantitative Metallography; American Society for Testing & Materials: Philadelphia, PA, USA, 1972. [Google Scholar]
  22. Petch, N.J. The cleavage strength of polycrystals. J. Iron Steel Inst. 1953, 174, 25–28. [Google Scholar]
  23. Cao, J.; Yong, Q.L.; Liu, Q.; Sun, X. Precipitation of MC phase and precipitation strengthening in hot rolled Nb–Mo and Nb–Ti steels. J. Mater. Sci. 2007, 42, 10080–10084. [Google Scholar] [CrossRef]
  24. Hasan, H.S.; Peet, M.J.; Avettand-Fenoel, M.N.; Bhadeshia, H.K.D.H. Effect of tempering upon the tensile properties of a nanostructured bainitic steel. Mater. Sci. Eng. A 2014, 615, 340–347. [Google Scholar] [CrossRef]
  25. Kneissl, A.C.; Garcia, C.I.; Deardo, A.J. HSLA Steels: Processing, Properties, and Applications; Geoffrey, T., Zhang, S., Eds.; The Minerals, Metals and Materials Society: San Diego, CA, USA, 1992; pp. 99–102. [Google Scholar]
  26. Fu, J.; Li, G.Q.; Mao, X.P.; Fang, K.M. Nanoscale cementite precipitates and comprehensive strengthening mechanism of steel. Metall. Mater. Trans. A 2011, 42, 3797–3812. [Google Scholar] [CrossRef]
  27. Li, Q. Modeling the microstructure–mechanical property relationship for a 12Cr-2W-V-Mo-Ni power plant steel. Mater. Sci. Eng. A 2003, 361, 385–391. [Google Scholar] [CrossRef]
  28. Hutchinson, B.; Hagstrom, J.; Karlsson, O.; Lindell, D.; Tornberg, M.; Lindberg, F.; Thuvander, M. Microstructures and hardness of as-quenched martensites (0.1–0.5%C). Acta Mater. 2011, 59, 5845–5858. [Google Scholar] [CrossRef]
  29. Islamgaliev, R.K.; Nikitina, M.A.; Ganeev, A.V.; Sitdikov, V.D. Strengthening mechanisms in ultrafine-grained ferritic/martensitic steel produced by equal channel angular pressing. Mater. Sci. Eng. A 2019, 744, 163–170. [Google Scholar] [CrossRef]
  30. Charleux, M.; Poole, W.J.; Militzer, M.; Deschamps, A. Precipitation behavior and its effect on strengthening of an HSLA-Nb/Ti steel. Metall. Mater. Trans. A 2001, 32, 1635–1647. [Google Scholar] [CrossRef]
  31. Ebrahimi, F.; Bourne, G.R.; Kelly, M.S.; Matthews, T.E. Mechanical properties of nanocrystalline nickel produced by electrodeposition. Nanostruct. Mater. 1999, 11, 343–350. [Google Scholar] [CrossRef]
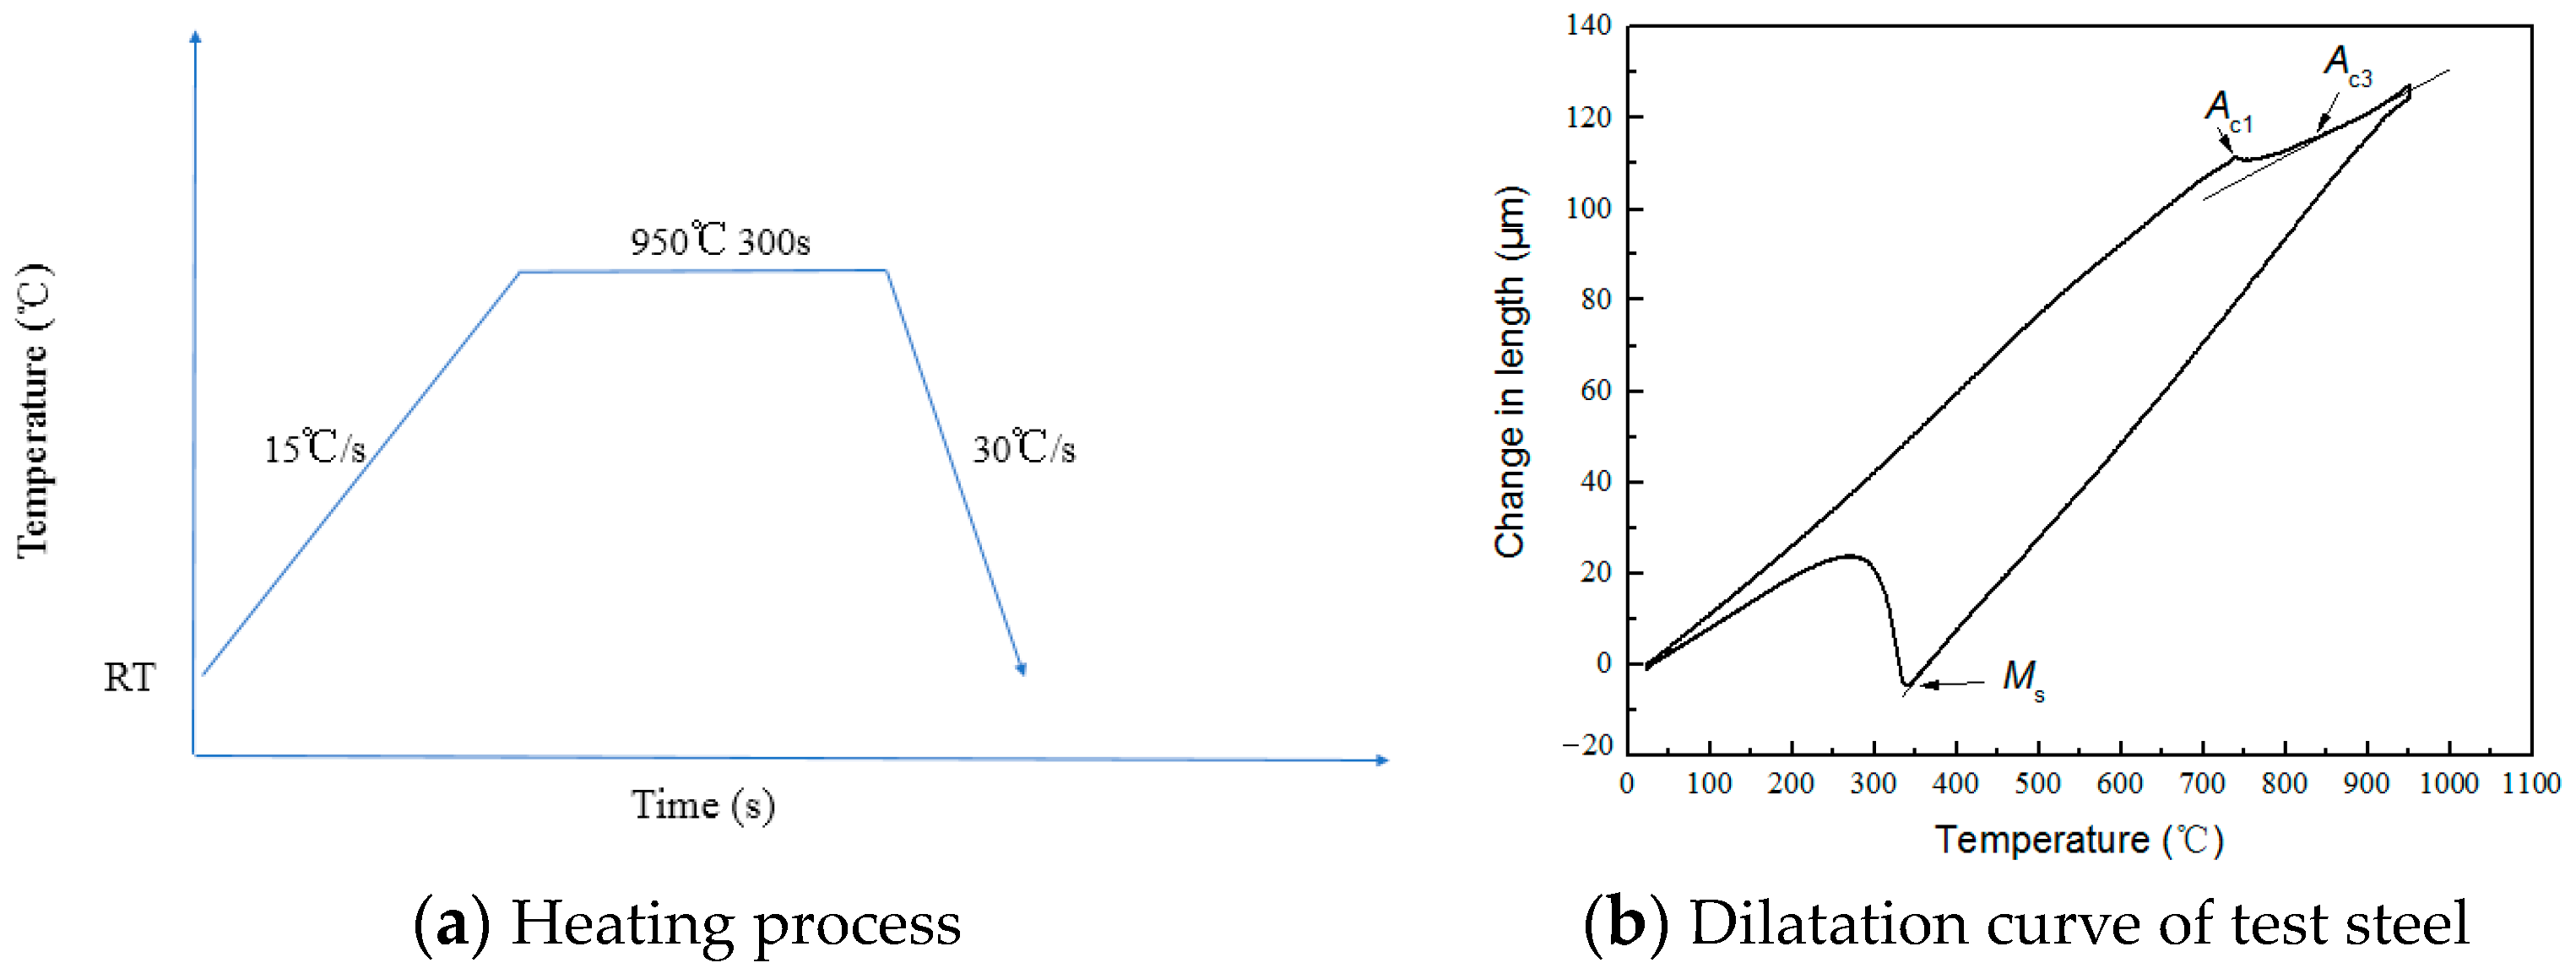
Figure 1. The heating process and dilatometer results of the GEN3 steel.
Processes 12 02039 g001
Figure 2. Schematic diagram of Sample 2#, 3#, and 4#.
Processes 12 02039 g002
Figure 3. The microstructure of steel after different heat treatments.
Processes 12 02039 g003aProcesses 12 02039 g003b
Figure 4. EBSD results of steel after different heat treatments: (a1a4) show Inverse Pole Figure (IPF) maps for body-centered cubic (bcc) structures; (b1b4) illustrate misorientation boundary maps with color codes: red for 2–5°, green for 5–15°, and blue for >15°; (c1c4) phase distributions (green: fcc; red: bcc); (d1d4) represents the KAM (kernel average misorientation maps) of the body-centered cubic (bcc) structures.
Processes 12 02039 g004
Figure 5. Stress–strain and work-hardening curves of steels after heat treatment.
Processes 12 02039 g005
Figure 6. Change in phase distribution of the steel as a function of temperature.
Processes 12 02039 g006
Figure 7. Elements in M7C3 and M(C, N).
Processes 12 02039 g007
Figure 8. M2C after quench and temper: (a) Morphology by TEM; (b) SAED (Selected Area Electron Diffraction) analysis; (c) EDS (Energy Dispersive X-ray Spectrum) analysis.
Processes 12 02039 g008
Figure 9. M7C3 after quench and partition: (a) Morphology; (b) SAED analysis; (c) EDS result.
Processes 12 02039 g009
Figure 10. V8C7 after quench and partition: (a) Morphology; (b) SAED analysis; (c) EDS result.
Processes 12 02039 g010
Figure 11. Ti(C, N) after quenching by water: (a) Morphology under STEM mode; (b) EDS result by line scanning.
Processes 12 02039 g011
Figure 12. The comparison of typical martensite microstructure for Samples 3 and 4: (a) Tempered martensite in Q&T sample; (b) Martensite microstructure after Q&P process.
Processes 12 02039 g012
Table 1. The chemical compositions of GEN3 steel (%).
CSiMnPSONAlNiCrCuMoVTiNb
0.240.622.140.0140.00140.00230.00170.850.00890.03170.0340.01730.0050.0180.014
Table 2. AGS (average grain size) and the HAGB/LAGB number fractions of the GEN3 steel.
HAGBs (>15°)LAGBs (<15°)AGS (μm)
As-annealed78.121.91.8
Q60.939.13.5
Q&T74.325.72.8
Q&P73272.3
Table 3. The volume fractions of retained austenite in GEN3 steel.
Volume Fraction of RA(%)As-AnnealedQQ&TQ&P
EBSD11.90.73.43.3
XRD14.47.15.36.4
Table 4. Lattice constants aγ of RA and their carbon contents Cγ.
ParametersAs-AnnealedQQ&TQ&P
aγ (Å)3.60 ± 0.0343.63 ± 0.0323.62 ± 0.0283.63 ± 0.044
Cγ (wt.%)1.22 ± 0.0661.82 ± 0.0681.60 ± 0.0801.77 ± 0.022
Table 5. Mechanical properties of the GEN3 steel.
HV0.5UTS (MPA)YS (MPA)Elongation (%)
As-annealed299.5 ± 2.61060 ± 39678 ± 2326.5 ± 0.7
Quenched569.3 ± 8.81318 ± 26714 ± 2112.0 ± 0.4
Q&T439.0 ± 3.61069 ± 4957 ± 1911.8 ± 0.9
Q&P499.0 ± 6.41298 ± 301010 ± 1010.4 ± 1.5
Table 6. Dislocation density calculated from XRD data.
SampleAverage Crystallite Size,
d (nm)
Lattice Microstrain,
e
Dislocation Density,
ρ (m−2)
124.180.000714.12 × 1014
220.210.000936.42 × 1014
315.290.000494.43 × 1014
417.040.00141.15 × 1015
Table 7. Number, volume, and average size of precipitates.
SampleNumber (10 μm−2)Volume Fraction (%)Average Size (nm)
As-annealed84 ± 121.08 ± 0.0321.7 ± 9.1
Quenched75 ± 201.90 ± 0.0430.4 ± 8.4
Q&T339 ± 506.98 ± 0.0427.4 ± 5.4
Q&P330 ± 435.04 ± 0.0723.6 ± 7.5
Table 8. Concentrations of alloying elements after various heat treatment (wt.%).
Sample w [ Mn ] w [ Si ] w [ V ] w [ Mo ] w [ Cr ] w [ Ni ] w [ Cu ]
As-annealed1.0700.5550.0020.0130.0150.0010.026
Quenched2.1350.6180.0050.0170.0320.0090.034
Q&T0.7360.6210.00020.0090.0050.0090.034
Q&P0.2700.6211.38 × 10−57.46 × 10−50.0010.0080.007
Table 9. Yield strength (MPa) contributions from different strengthening mechanisms.
Sample σ 0 σ ss σ gb σ dis σ ppt σ y (Calculation) σ y (Experiment)
As-annealed54179157149197736678 ± 23
Quenched54219112186203774714 ± 21
Q&T54175125155421930957 ± 19
Q&P541571382494009981010 ± 10
Disclaimer/Publisher’s Note: The statements, opinions and data contained in all publications are solely those of the individual author(s) and contributor(s) and not of MDPI and/or the editor(s). MDPI and/or the editor(s) disclaim responsibility for any injury to people or property resulting from any ideas, methods, instructions or products referred to in the content.