Abstract
A pump-turbine may generate high-amplitude hydraulic excitations during operation, wherein the flow-induced response of the spiral case and concrete is a key factor affecting the stable and safe operation of the unit. The preloading spiral case can enhance the combined bearing capacity of the entire structure, yet there is still limited research on the impact of the preloading pressure on the hydrodynamic response. In this study, the pressure fluctuation characteristics and dynamic behaviors of preloading a steel spiral case and concrete under different preloading pressures at rated operating conditions are analyzed based on fluid–structure interaction theory and contact model. The results show that the dominant frequency of pressure fluctuations in the spiral case is 15 , which is influenced by the rotor–stator interaction with a runner rotation of short and long blades. Under preloading pressures of 0.5, 0.7, and 1 times the maximum static head, higher preloading pressures reduce the contact regions, leading to uneven deformation and stress distributions with a near-positive linear correlation. The maximum deformation of the PSSC can reach 2.6 mm, and the stress is within the allowable range. The preloading pressure has little effect on the dominant frequency of the dynamic behaviors in the spiral case (15 ), but both the maximum and amplitudes of deformation and stress increase with higher preloading pressure. The high-amplitude regions of deformation and stress along the axial direction are located near the nose vane, with maximum values of 0.003 mm and 0.082 MPa, respectively. The contact of concrete is at risk of stress concentrations and cracking under high preloading pressure. The results can provide references for optimizing the structural design and the selection of preloading pressure, which improves operation reliability.
1. Introduction
Pumped-storage power stations have been widely promoted for ensuring the stability of a grid system, which has the function of power generation, energy storage, peak modulation, frequency modulation, etc. In large-scale stable energy storage and regulation projects, the station plays a vital role in achieving China’s carbon peaking and carbon neutrality goals [1]. The pump-turbine is the key component of the pumped-storage unit, which operates under high pressure and flow velocity, potentially generating high hydraulic excitation that can lead to structural resonance or stress concentration [2,3,4]. With the increasing demand for high-capacity units, the flow stability and load-bearing capabilities of structures are critical for the reliable operation of the unit [5,6].
As the key flow-passage component of the unit, the spiral case withstands operational hydraulic pressures as well as structural loads from the upper structures. Its design needs to minimize head losses while ensuring sufficient strength for safe operation [7]. By pouring concrete around the spiral case, the partial load is transferred from the spiral case to the surrounding concrete, enhancing the bearing capacity of the entire structure. Therefore, the embedment of the spiral case has a great impact on the stress and deformation characteristics, which can be categorized into three structural forms, i.e., padded spiral case, preloading spiral case, and directly embedded spiral case. As the design of spiral cases trends toward larger scale and higher capacity, the preloading steel spiral case (PSSC) has become widely used in pumped-storage power stations due to its good combined load-bearing performance. The construction process is first to close off the opening of the PSSC using a test head and fill the spiral case with water, pressurizing it to the preloading pressure. Once the pressure remains stable, the concrete is placed outside the PSSC and hardens over several days. Then, the pressure should be released with the test head removed. The shrinkage of the PSSC creates an initial preloading clearance between the PSSC and concrete. The clearance, determined by the preloading pressure, varies with hydraulic pressure changes during operating conditions. As a result, the preloading pressure impacts the mechanism of hydraulic excitation transmission and the structural characteristics of the unit. However, the recommended range for preloading pressure values varies widely across engineering experience and relevant codes, typically ranging from 50% to 100% of the maximum static head [8]. On the one hand, lower preloading pressures may fail to fully utilize the tensile strength of the steel spiral case, requiring the surrounding concrete to bear more hydraulic pressure, which will be economically disadvantageous in terms of the cost of the steel bar. On the other hand, excessive preloading pressure can result in significant clearance, which is likely to cause stress concentration and excessive vibration of the PSSC, especially under low-head operating conditions [9,10]. Compared to the experimental test, the numerical method can provide a more detailed representation of the contact status and response behaviors between the spiral case and the concrete. Therefore, numerical research on the hydrodynamic behaviors of the pump-turbine, considering the effects of preloading pressure, is important for optimizing the structural design and selecting the appropriate preloading pressure.
Early simplified methods for modeling preloading spiral cases assume that the contact status of bond or separation can be determined by whether the hydraulic pressure exceeds the preloading pressure or not. The simplified method uses a simple model and low computational complexity, but it underestimates stress values, making it unreliable for safety assessments [11,12,13]. Numerous studies have proved that the calculation error of the simplified method is much higher than that of the simulation method, which considers nonlinear contact behaviors [9,14,15,16,17].
The nonlinear clearance opening and closing phenomena increase the complexity of the contact behavior, which can be solved by simulation methods. Most numerical computation processes in existing research are used to simulate the initial preloading clearance by modifying grid node coordinates or contact element types. Li et al. [18] analyzed the bearing ratio and the contact of the spiral case and the exterior concrete under different preloading pressures. Xu et al. [19] revealed premature and delayed closure phenomena of the preloading clearance. Fu et al. [20,21,22] used a small-sliding contact model and found that the structural characteristic is determined by a clearance closing characteristic. However, it has been found that these simulation methods may lead to model penetration and stress concentration, resulting in a non-negligible decrease in accuracy [23]. As a contact algorithm, the augmented Lagrange method can simulate the behaviors of contact and separation status and has been widely used due to its enhanced stability and convergence. Guo [24] and Qian [9] analyzed the contact status and verified the accuracy of the augmented Lagrange algorithm in the simulation of preloading clearance. Since the sealing device is removed after construction, the changes in structural boundary conditions cause unbalanced forces, which have an influence on the contact behavior. Gao X et al. [14] studied the impact of construction condition and the shape of the steel spiral case on the structural characteristics and damage. Guo et al. [24], Wei et al. [25] and Zhang [23] studied the stress and clearance distribution of the PSSC and concrete under normal operating conditions. Todorov, G et al. [17] aimed to assess the structure-to-concrete embedment for possible causes of damage and destruction by simulating the full process of construction and pressurization of the PSSC. However, the above literature applied static loads as hydraulic pressure on the PSSC without considering the effects of pressure fluctuation in the flow domain. Ouyang et al. [26] analyzed the flow-induced response of the PSSC by introducing harmonic waves. The structural dynamic response to fluctuations can be obtained, but it is different from the actual flow-induced responses. The fluid–structure interaction (FSI) method can provide a more precise and comprehensive simulation of the hydrodynamic responses and vibrations of structures, considering pressure fluctuation and additional water mass. Numerous studies [27,28] have confirmed the reliability of FSI simulation methods for pump-turbines by comparing the results with measured data. Compared with the characteristic length of the entire flow, the effect of the PSSC deformation on the fluid domain is negligible, i.e., only several millimeters, so the one-way method is appropriate for the FSI solution of the units. Some scholars have verified the feasibility of the one-way method. Guo et al. [29], Khalfaoui, K et al. [4], Ru et al. [30] and He et al. [31] established an FSI model to analyze the dynamic response characteristics of the pump-turbine’s structural components, including the shaft, runner, head cover, bottom ring and so on. However, studies on the hydrodynamic characteristics of the PSSC and concrete are still few in number.
In this paper, pressure fluctuation and streamline distribution under the turbine’s rated condition are calculated to analyze the flow characteristics in the fluid domain based on a 3D CFD model of the prototype pump-turbine. A simulation method for the preloading spiral case model is proposed for the initial preloading clearance. FSI modeling of the units under three different preloading pressures is established to study the impact of preloading clearance on the flow-induced responses of the PSSC and concrete. Then, the relationships between preloading pressure and the hydrodynamic deformation and stress characteristics under the turbine’s rated condition are discussed. A complete CFD model considering the clearance flow of the head cover and bottom ring, and an FEM model that considers the preloading clearance, enhance the accuracy of the dynamic behavior results. The numerical methods developed in this paper can also be applied to other types of pump-turbines with PSSC. The results provide references for structural optimization and the selection of preloading pressure.
2. Methods of Numerical Calculations
The numerical calculation methods in this paper include 3D computational fluid dynamics (CFD), FSI and a contact algorithm for flow and structural analysis.
2.1. Governing Equations of the 3D Computational Fluid Dynamics
The water flow in the pump-turbine is considered a three-dimensional incompressible unsteady flow and holds a turbulent state. The Reynolds-Averaged Navier–Stokes (RANS) method regards the turbulent motion in the flow passage as the combination of time-averaged flow and instantaneous fluctuating flow, which can effectively capture the primary turbulence characteristic and handle the large-scale computational domain of the units. The time-averaged expressions of the continuity equation and the momentum equation (N-S) are:
where i and j are indicators within the range (1, 2, 3), are the Reynolds averaged velocity components along the Cartesian coordinate axes of the x, y and z directions; are the Reynolds stresses; is the averaged pressure. is density; is pressure; is dynamic viscosity; are the body forces.
To account for the turbulent shear stress’s transportation and the good predictability of flow separation in the reverse pressure gradient region, SST k- mode is a method that uses a standard k-ε model in the near-wall area and a standard k-ω model in the turbulent core area. The standard k-ε model is not able to accurately represent the behavior of turbulent boundary layers up to separation, while the standard k-ω model fails for flows with pressure-induced separation [32]. SST k- is widely used in the numerical calculation of pump-turbine units and commonly adopted as the turbulence model [33,34]. Therefore, SST k- is applied in this research and the expressions are as follow:
where is the turbulent viscosity; is the turbulent kinetic energy; is the turbulent frequency; is the bending function; are model coefficients.
2.2. Governing Equations of the Fluid–Structure Interaction
The profound investigations have verified that the structural deformation of the pump-turbine has a negligible impact on fluid domain. Thus, the hydraulic excitation on the structural response is calculated by the one-way FSI method with high computational efficiency. Applying hydraulic pressure to the fluid–structure interfaces of the flow passage components, the structural response based on the finite element methods can be solved by the governing equation of structural dynamic:
where are the mass, damping matrix and stiffness matrices of the structure, respectively; are the node acceleration, velocity and displacement vectors, respectively; is the external excitation load vector acting on structures; is the hydraulic pressure load vector at the interface; is time.
The equivalent stress is adopted to evaluate the structural strength of the PSSC. Considering the poor tensile strength of concrete, the maximum principal stress is used for the judgment on concrete cracking.
where are the principal stresses.
2.3. Contact Algorithm
Nonlinear contact is assumed between the PSSC and concrete. As the contact state of the PSSC experiencing bonding and separation, the augmented Lagrange function is adopted to solve this nonlinear contact problem, and its function expression is as follows:
The surface–surface contact model is introduced to better describe the contact state and the free movement of the target surfaces. Based on the augmented Lagrange function, the Augmented Lagrange Method (ALM) is chosen as the contact algorithm, because it is easier to converge and less sensitive to the magnitude of the contact stiffness compared to the Normal Lagrange and Pure Penalty. The expressions of ALM are:
where is the Lagrange multiplier, is the modified function, is the total potential energy function, is the additional function of Normal Lagrange, is the additional function of Pure Penalty.
The repeated iterations of are calculated by the following expression:
where is the preloading clearance.
According to the iterations of the contact constraint is modified to find the exact without increasing the unknowns. One iteration will continue until there is no change in the contact state.
3. Numerical Models of the Pump-Turbine and Plant Concrete
The numerical models of the pump-turbine and plant concrete in this paper include the pump–turbine flow model, the preloading spiral case structural model and pump-turbine and plant concrete structural model. The models will perform in sequential order to simulate the construction and operation process in a PSSC.
3.1. Numerical Simulation Flowchart
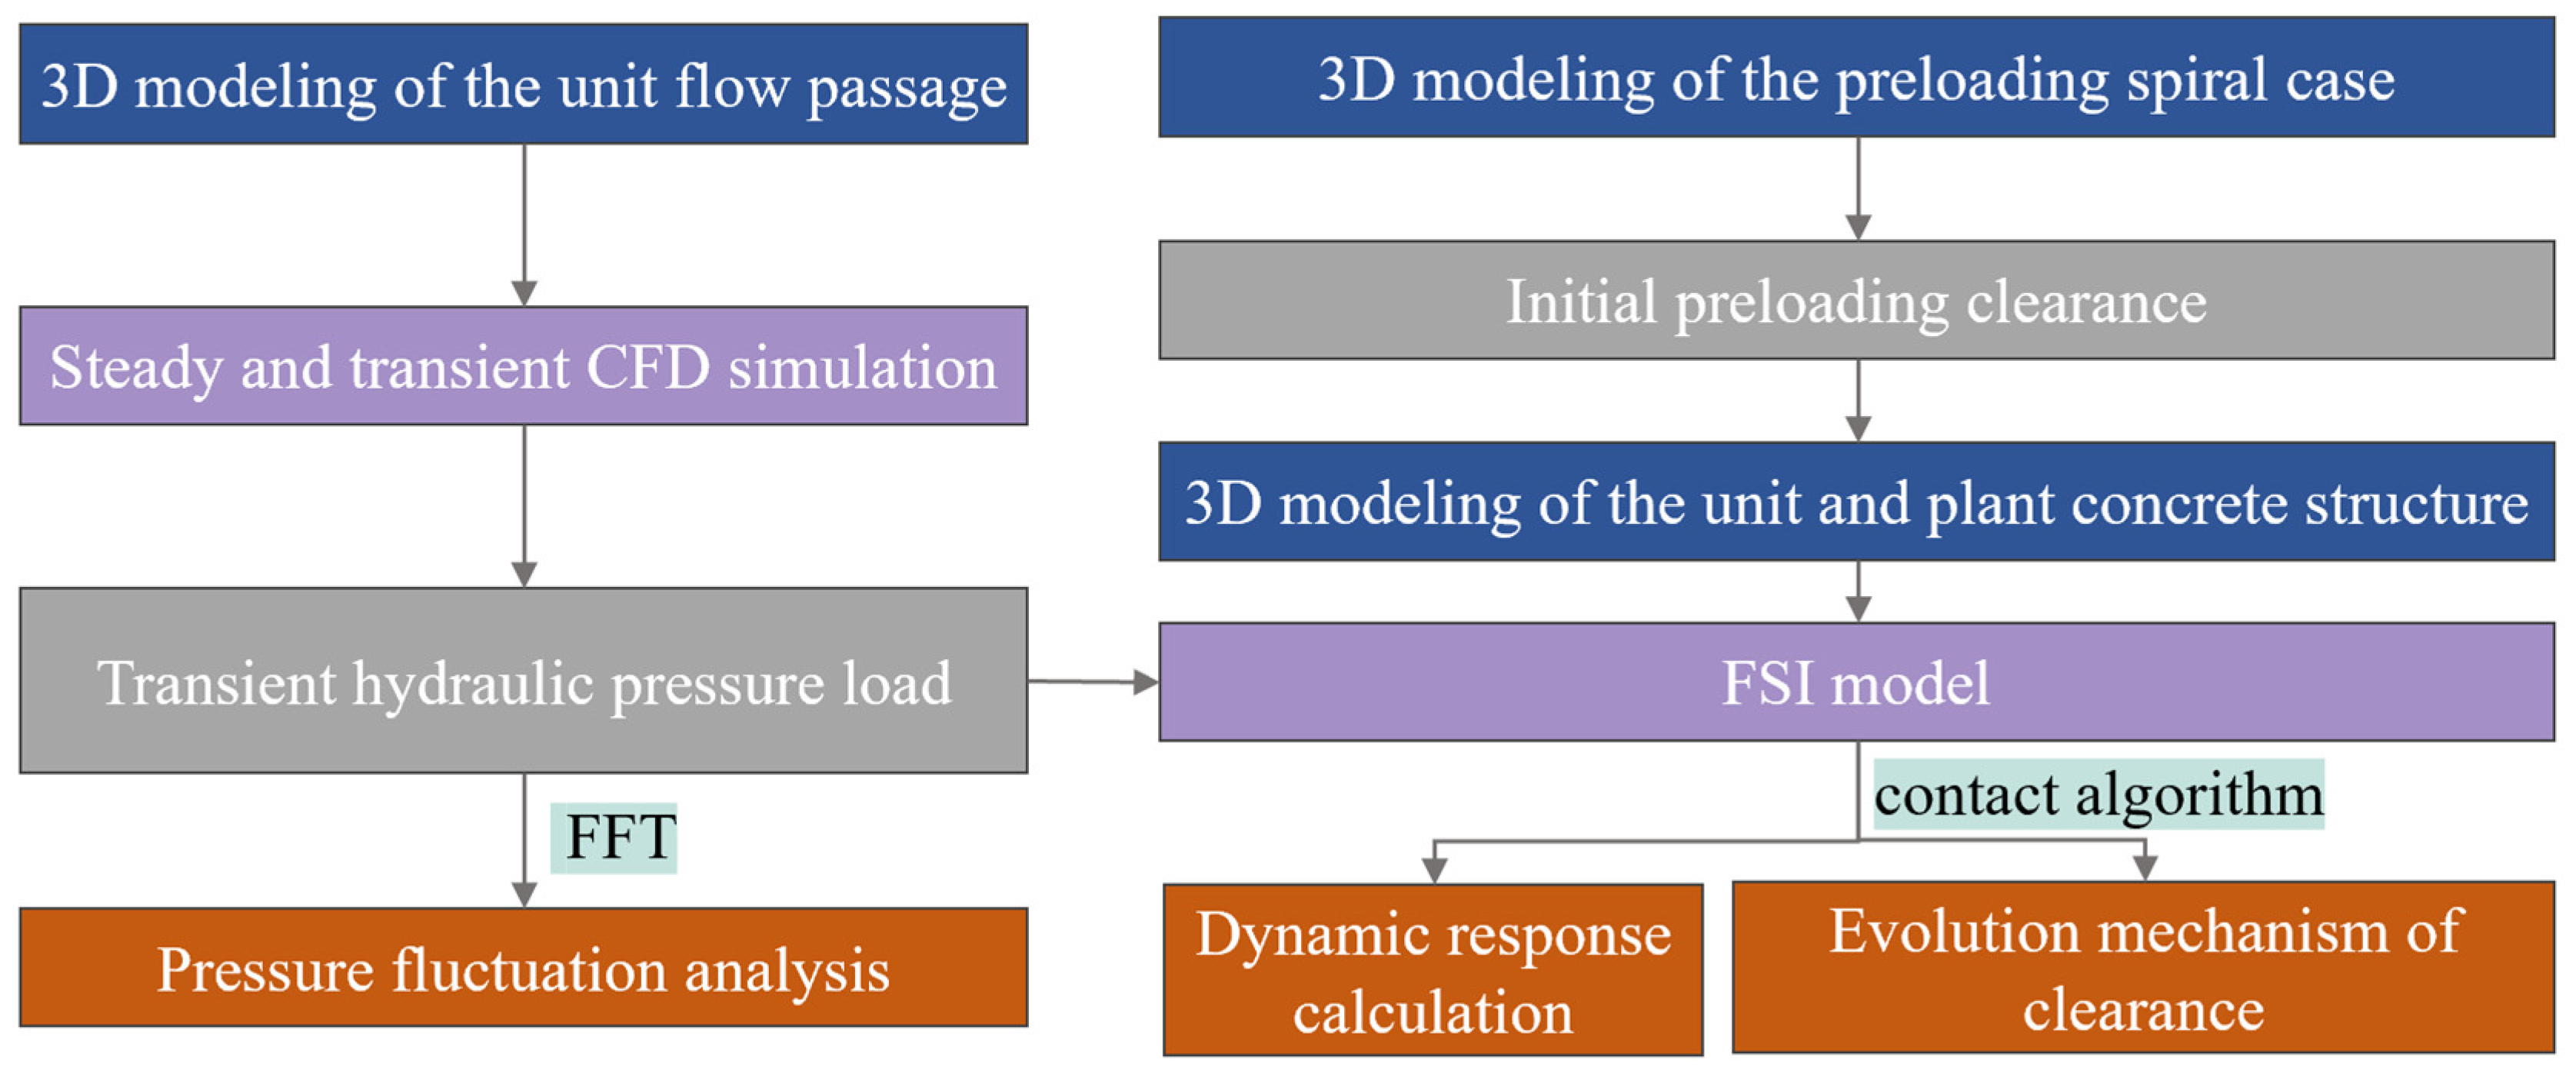
The numerical simulation of the fluid and structure models should be performed under a certain work step. To take the preloading clearance and contact nonlinearity into consideration, the preloading spiral case model is first established to simulate the initial preloading clearance between the PSSC and concrete. Nodes on the interfaces between these two structures in the FSI model are set to be separated due to the clearance, which will change when under hydraulic excitation. The hydraulic pressure load is calculated by steady and transient CFD simulation of the unit flow passage model. After Fast Fourier Transformation (FFT), the time-frequency distribution of the load can be used to analyze the hydraulic pressure fluctuation characteristics. The hydraulic pressure load per timestep is applied on the locations associated with the structural mesh of the unit and the plant concrete model based on the FSI method. By introducing the contact algorithm, the structural dynamic response and evolution mechanism of preloading clearance can be simulated for the analysis of the hydrodynamic characteristics and contact status of the PSSC and concrete.
To ensure the grid nodes of PSSC correlate with that of the concrete, the FEM model of the entire structure, including all the components of the two structural models, should be meshed together first. Other components and concrete in the preloading spiral case model are suppressed. Then, its solution part is applied to the unit and plant concrete model, in which the previous spiral case and mandoor are replaced by the deformed one. There will be an initial preloading clearance between the PSSC and concrete in the unit and plant concrete model.
The entire flowchart of the simulation process is shown in Figure 1 and more details of the model establishment are described in the following sections.
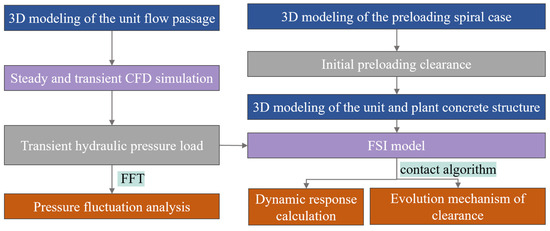
Figure 1.
Flowchart of the work steps.
3.2. Pump-Turbine Flow Model
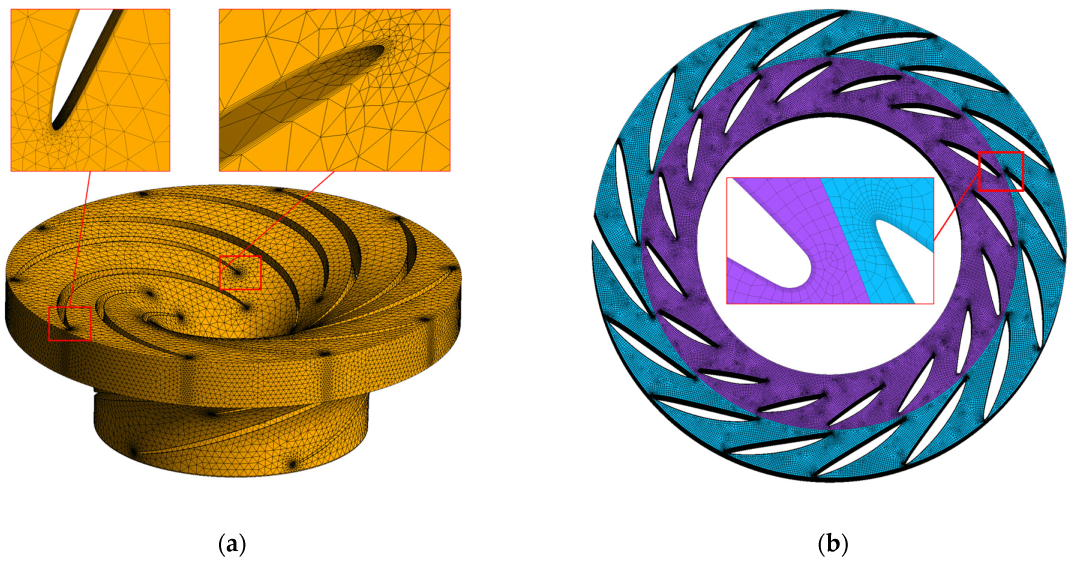
The prototype pump-turbine model is analyzed, and its 3D modeling of the flow passage is composed of a spiral case, stay vanes, guide vanes, a runner, a draft tube and two pressure balance pipes. In addition, the clearances, such as the headcover and bottom ring, are also considered. A penstock in front of the spiral case is set to reduce the numerical simulation error of the spiral case pressure fluctuation influenced by the inlet boundary conditions. The mesh of the CFD modeling of the flow passage is shown in Figure 2 and Figure 3. The basic parameters of the unit are shown in Table 1.
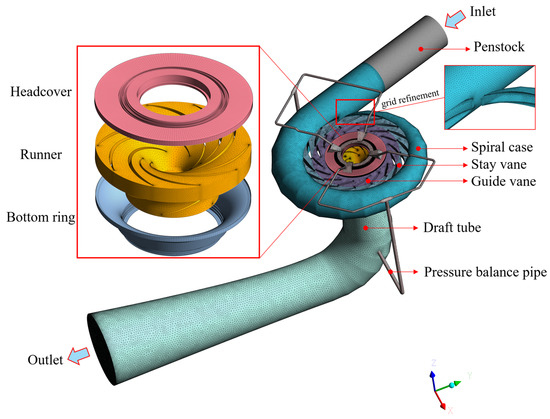
Figure 2.
Three-dimensional modeling and mesh of flow passage.

Figure 3.
The flow domain mesh of the pump-turbine unit. (a) Runner; (b) guide vanes and stay vanes.

Table 1.
Basic parameters of the pump–turbine unit.
is the grid refinement ratio, and the expression is as follows:
where is the number of grid elements, is the computational dimension.
is the relative error of the numerical calculation results using two sets of grids with adjacent quantities:
where is the normalized efficiency for the numerical discrete solution of the selected convergence parameter.
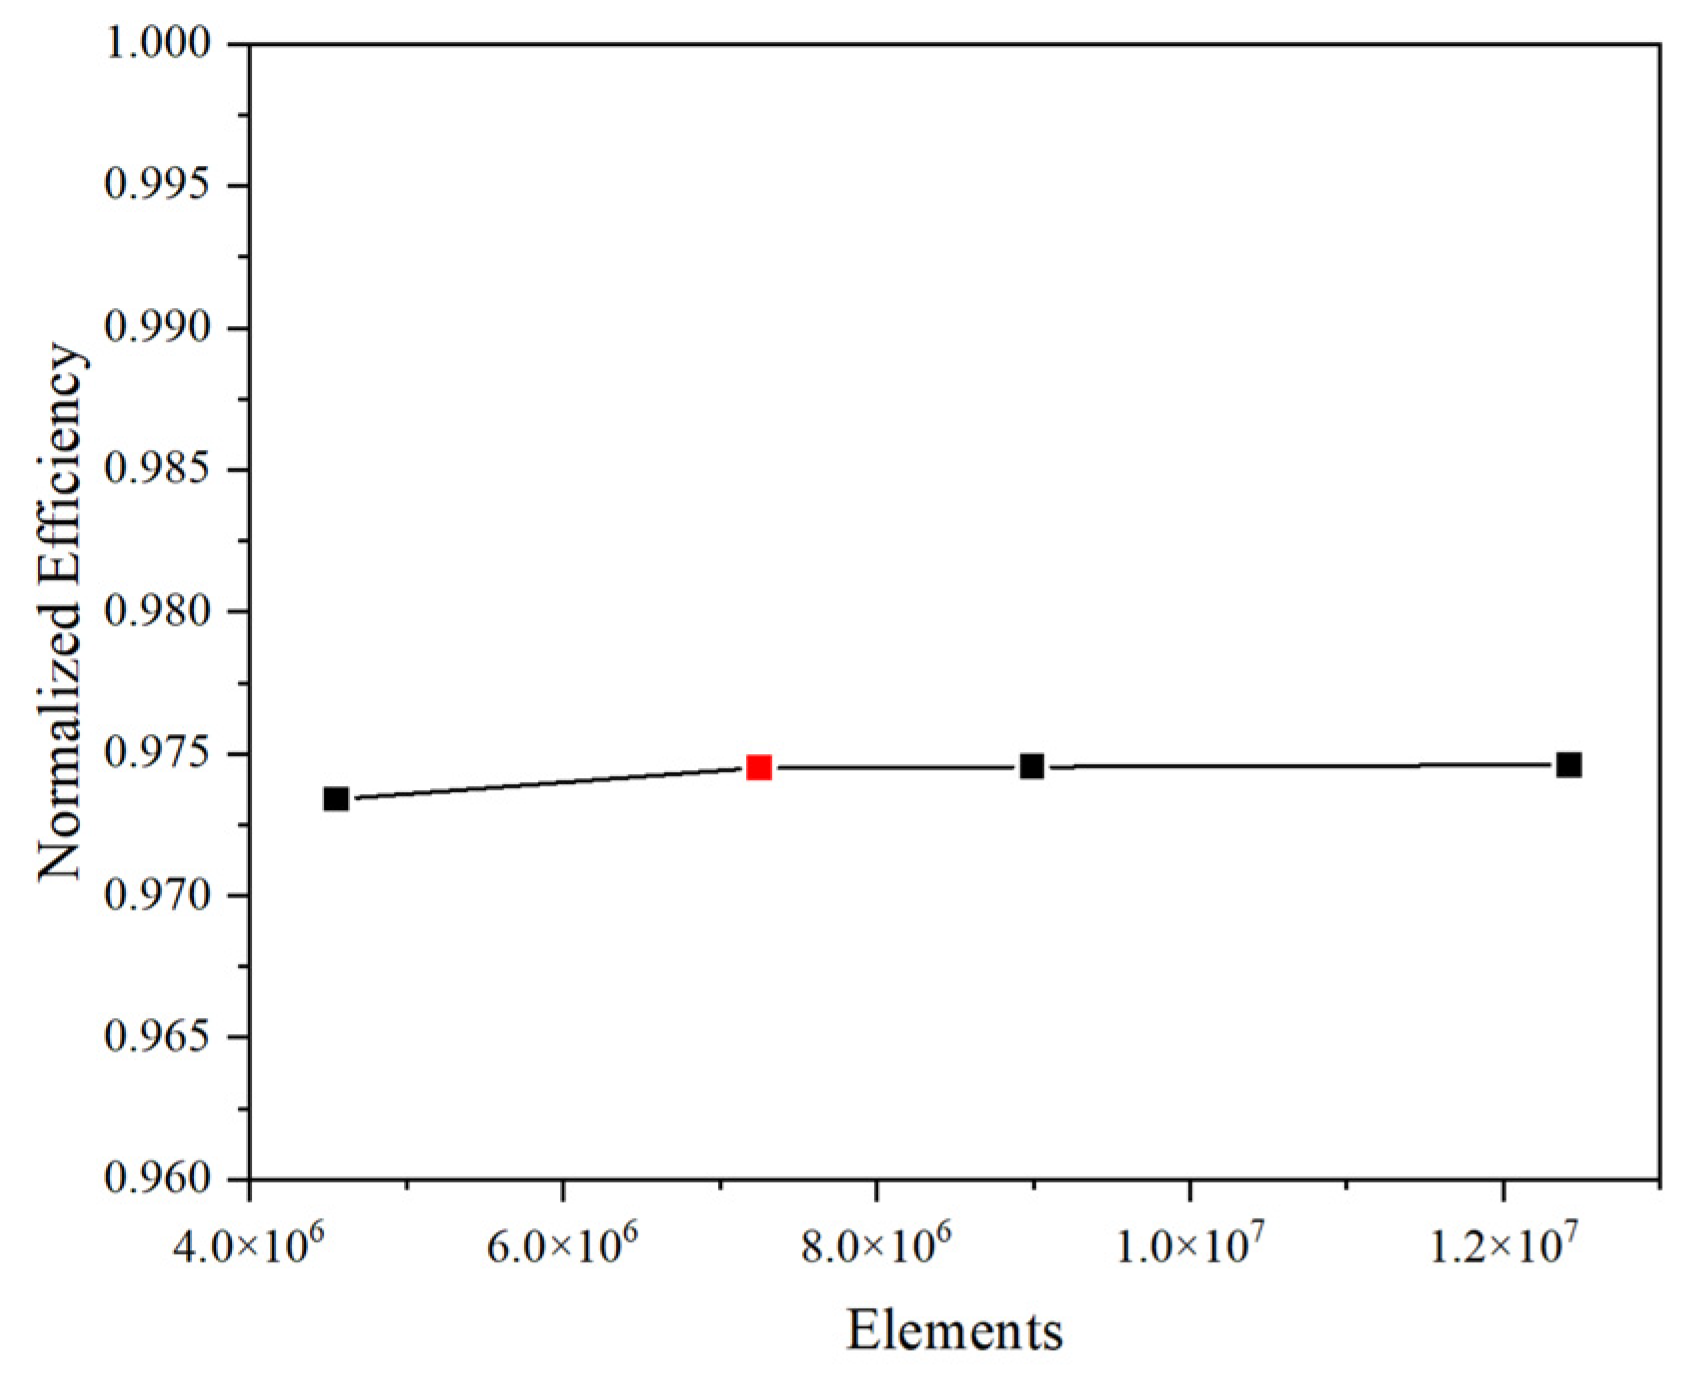
The fluid domain is meshed by the tetrahedron–hexahedron hybrid elements based on ANSYS MESH 2021. The spiral case, runner, draft tube, pressure balance pipe and penstock are modeled using tetrahedral elements, while the vane space, headcover and bottom ring are modeled using hexahedral elements. There is grid refinement near the nose vane of the spiral case where swirling flow may occur. Considering the flow in the near-wall region, a boundary layer mesh is set with five layers and a first layer thickness of 1.0 mm under a 1.2 growth rate at the near wall of vanes and blades, ensuring that the y+ meets the requirements of the SST k- model. Four sets of meshes with different element sizes are constructed to verify the mesh independence and the calculation accuracy by comparing the results of normalized efficiency under the rated condition in Figure 4. The grid convergence index (GCI) is calculated to quantitatively verify the reliability of the mesh, which is related to the approximation error and the true error [33,35,36]. The expressions of GCI and the relative errors are shown above. As is shown in Table 2, the GCI of 7.25 × 10⁶ mesh setting is 0.0345%, which is much less than 5%, indicating that the mesh setting has met the accuracy requirement. As a result, the mesh size of the spiral case, stay vanes, guide vanes, runner, draft tube, pressure balance pipe, headcover, bottom ring and penstock can be adjusted with 1,453,828, 543,760, 431,608, 2,791,382, 1,091,405, 260,108, 134,800, 158,200, and 388,136, respectively. A total of 7,253,227 elements are finally adopted in the pump-turbine flow passage model.
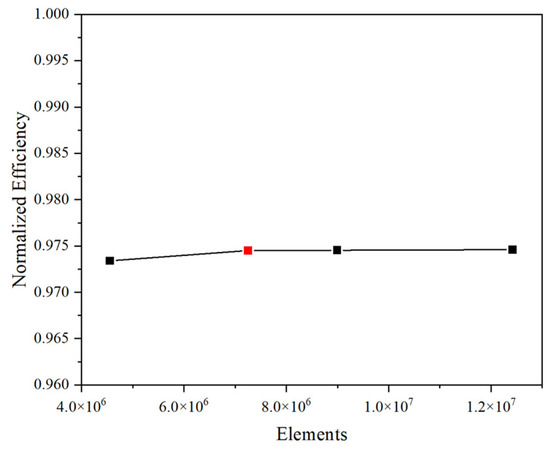
Figure 4.
Fluid mesh independence analysis.
Table 2.
Basic parameters of the pump-turbine unit.
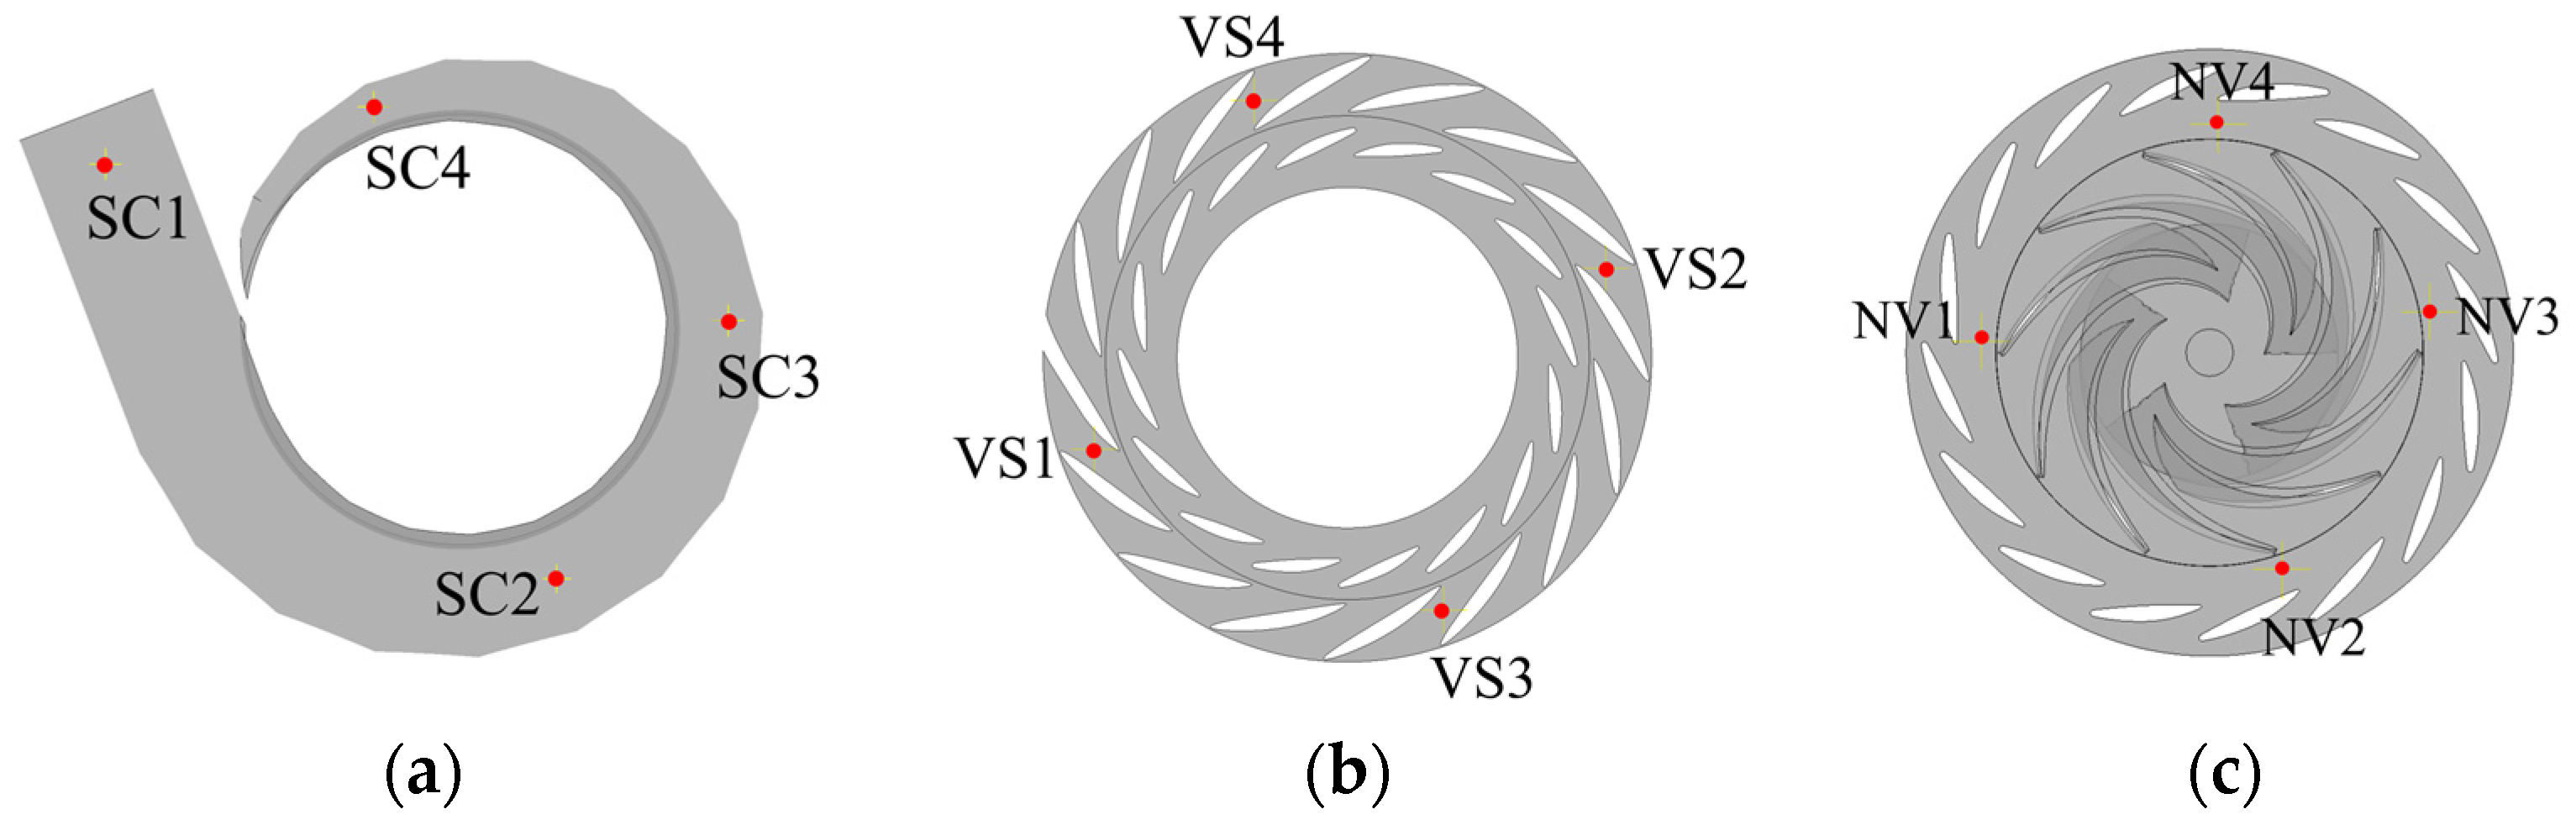
To exactly describe the pressure variation in the fluid domain, the locations of a dozen monitoring points are shown in Figure 5, wherein SC1–SC4 are located at the spiral case, VS1–VS4 are located in the inter-vane space of stay vanes, and NV1–NV4 are located in the vaneless space.
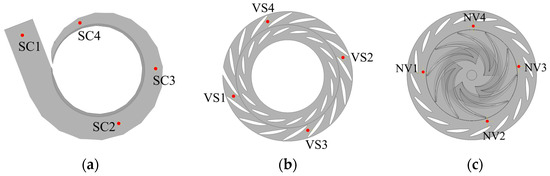
Figure 5.
Pressure pulsation monitoring points. (a) Spiral case; (b) inter-vane space; (c) zaneless space.
ANSYS CFX 2021 is used to carry out the 3D CFD simulation under the turbine’s rated conditions. Since pump-turbines generally operate close to their rated conditions with stable flow characteristics, the research on the turbine’s rated conditions can exclude disturbances caused by hydraulic instability when analyzing the impact of preloading pressure and thus have better practical application benefits. The turbulence model is set as shear stress transport (SST) with a convergence criterion of 10−4. According to the rated rotational speed of the runner (375 rpm), the total time is set to the duration required for ten revolutions (1.6 s), and the time step is 8.889 × 10⁻⁴ s corresponding to the time needed for a 2° rotation. The total pressure type inlet as well as the static pressure outlet are applied to the model boundary condition. The rotor–stator interfaces between the runner and guide vanes and runner and draft tube are set to the Transient Rotor Stator [37]. The wall boundary condition is set as a non-slip wall. For a rotation modeling, the Transient Rotor Stator is used to account for transient interaction effects at a sliding (frame change) interface. It simulates the transient relative motion between the components on each side of the General Grid Interface (GGI) connection, updating the interface position at each timestep as the grid changes. This model is widely used to predict the transient flow interaction between the stator and rotor passage.
To validate the accuracy of the simulation method, we compared the simulation results with those from the model test. The whole model of the pump-turbine has been fabricated, which includes the flow passage of the spiral case, stay ring, stay vanes, headcover, guide vanes, runner, bottom ring, and draft tube, as shown in Figure 6. None of the flow surfaces of the turbine model are coated with any paint or varnish. The flow passage of the pump-turbine model, from the spiral case inlet to the draft tube outlet, is geometrically similar to the prototype pump-turbine, with a scale ratio λL = DP/DM of 9.9. Other basic parameters are listed in Table 1. Except for the straight conical section of the draft tube, which is made of transparent acrylic to facilitate flow observation, all other components are made of metal.
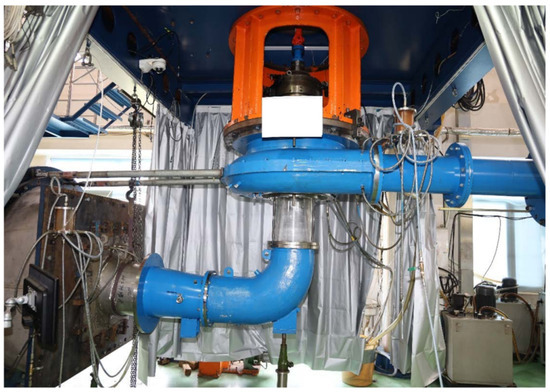
Figure 6.
Pump-turbine model test.
The rated operating condition is simulated in this paper, and the parameter settings are illustrated in Table 3. Compared with the model test results, the calculation error is less than 3%, which proves the reliability of the numerical methods used in this paper.
Table 3.
Basic parameters of the rated operating condition.
3.3. Preloading Spiral Case Structural Model
The preloading spiral case structural model is first developed to calculate the initial preloading clearance between the PSSC and concrete, which encompassed the PSSC (with mandoor), stay ring, test head and steel pedestal, as shown in Figure 7a. The structural components share the same meshes with the pump-turbine and plant concrete structural model mentioned above, so the mesh setting will be introduced in the following section in detail. A total of 2,016,116 elements and 3,858,253 nodes are used in this model, ensuring adequate grid density for accuracy.
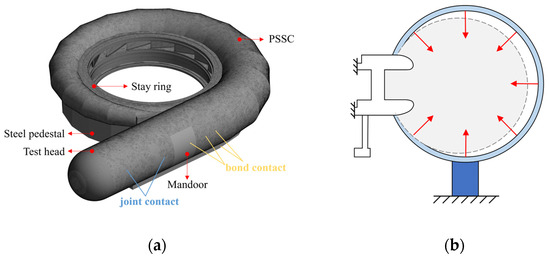
Figure 7.
Three-dimensional modeling and mesh of the preloading spiral case. (a) FEM model; (b) cross-sectional schematic of the boundary condition of the negative pressure.
The material properties of the components are configured according to Table 4.
Table 4.
Material and mechanical properties of the components.
During the actual construction, the spiral case will be deformed in an expansion way as the preloading pressure is applied to the inside. The concrete is placed around the PSSC later to maintain pressure. At that time, the inner surfaces of the concrete coincide with the ektexine of the PSSC. After the concrete has already hardened, the preloading pressure inside the spiral case begins to release, during which the PSSC shrinks back to its original shape and separates from the inner surfaces of the concrete. There will be an initial clearance between the PSSC and concrete after all the above steps have been completed. However, the inner surface of the concrete should adjust to the deformation of the spiral case in the simulation procedure by changing grid node coordinates or performing Boolean operations with grid models. This may lead to model penetration and stress concentration, resulting in a non-negligible decrease in accuracy.
As a result, the simulation methods proposed in this paper are used to apply negative pressure to the inside of the spiral case and guarantee the same absolute deformation value as that of the preloading pressure, as shown in Figure 7b. The spiral case shrinks instead of being inflated, and thus a deformation equivalent to the initial preloading clearance can be achieved without modifying the concrete model. Compared to the PSSC diameter, the value of the deformation varies in the range of millimeters and has almost no impact on the subsequent analysis, whether positive or negative. In this way, the new methods can not only improve precision but also simplify the simulation process significantly.
Three different preloading schemes have been chosen for the discussion on the impact of the preloading clearance. Based on the engineering experience, it is determined that the 0.5, 0.7 and 1 multiples of the maximum static head can be regarded as representative preloading pressures, which are 3.2 MPa, 4.564 MPa and 6.52 MPa, respectively, as shown in Table 5.
Table 5.
Three different preloading schemes.
3.4. Pump-Turbine and Plant Concrete Structural Model
The 3D modeling of the pump-turbine and plant concrete structural model consists of the deformed PSSC (with mandoor), stay ring, headcover, bottom ring and plant concrete in Figure 8, wherein the PSSC and stay ring are bolted together as a single structure. To better accommodate the complex geometries, the structural models are meshed using high-quality tetrahedral elements. The mesh is refined in typical stress concentration regions of the guide vanes and nose vane. The adaptive sizing of the mesh is set at a resolution of 2, which is used to control the mesh size, and its valid inputs are integers between 1 and 12. The model uses fast transition meshing and coarse span angle center. Considering the difference of the internal and external force transmission of the spiral case, a two-layer grid is set on the spiral case in a radium direction. Also, the contact region of the concrete is meshed by the same element size as the spiral case, ensuring the accuracy of passing data.

Figure 8.
Three-dimensional modeling and mesh of the pump-turbine and plant concrete structural model.
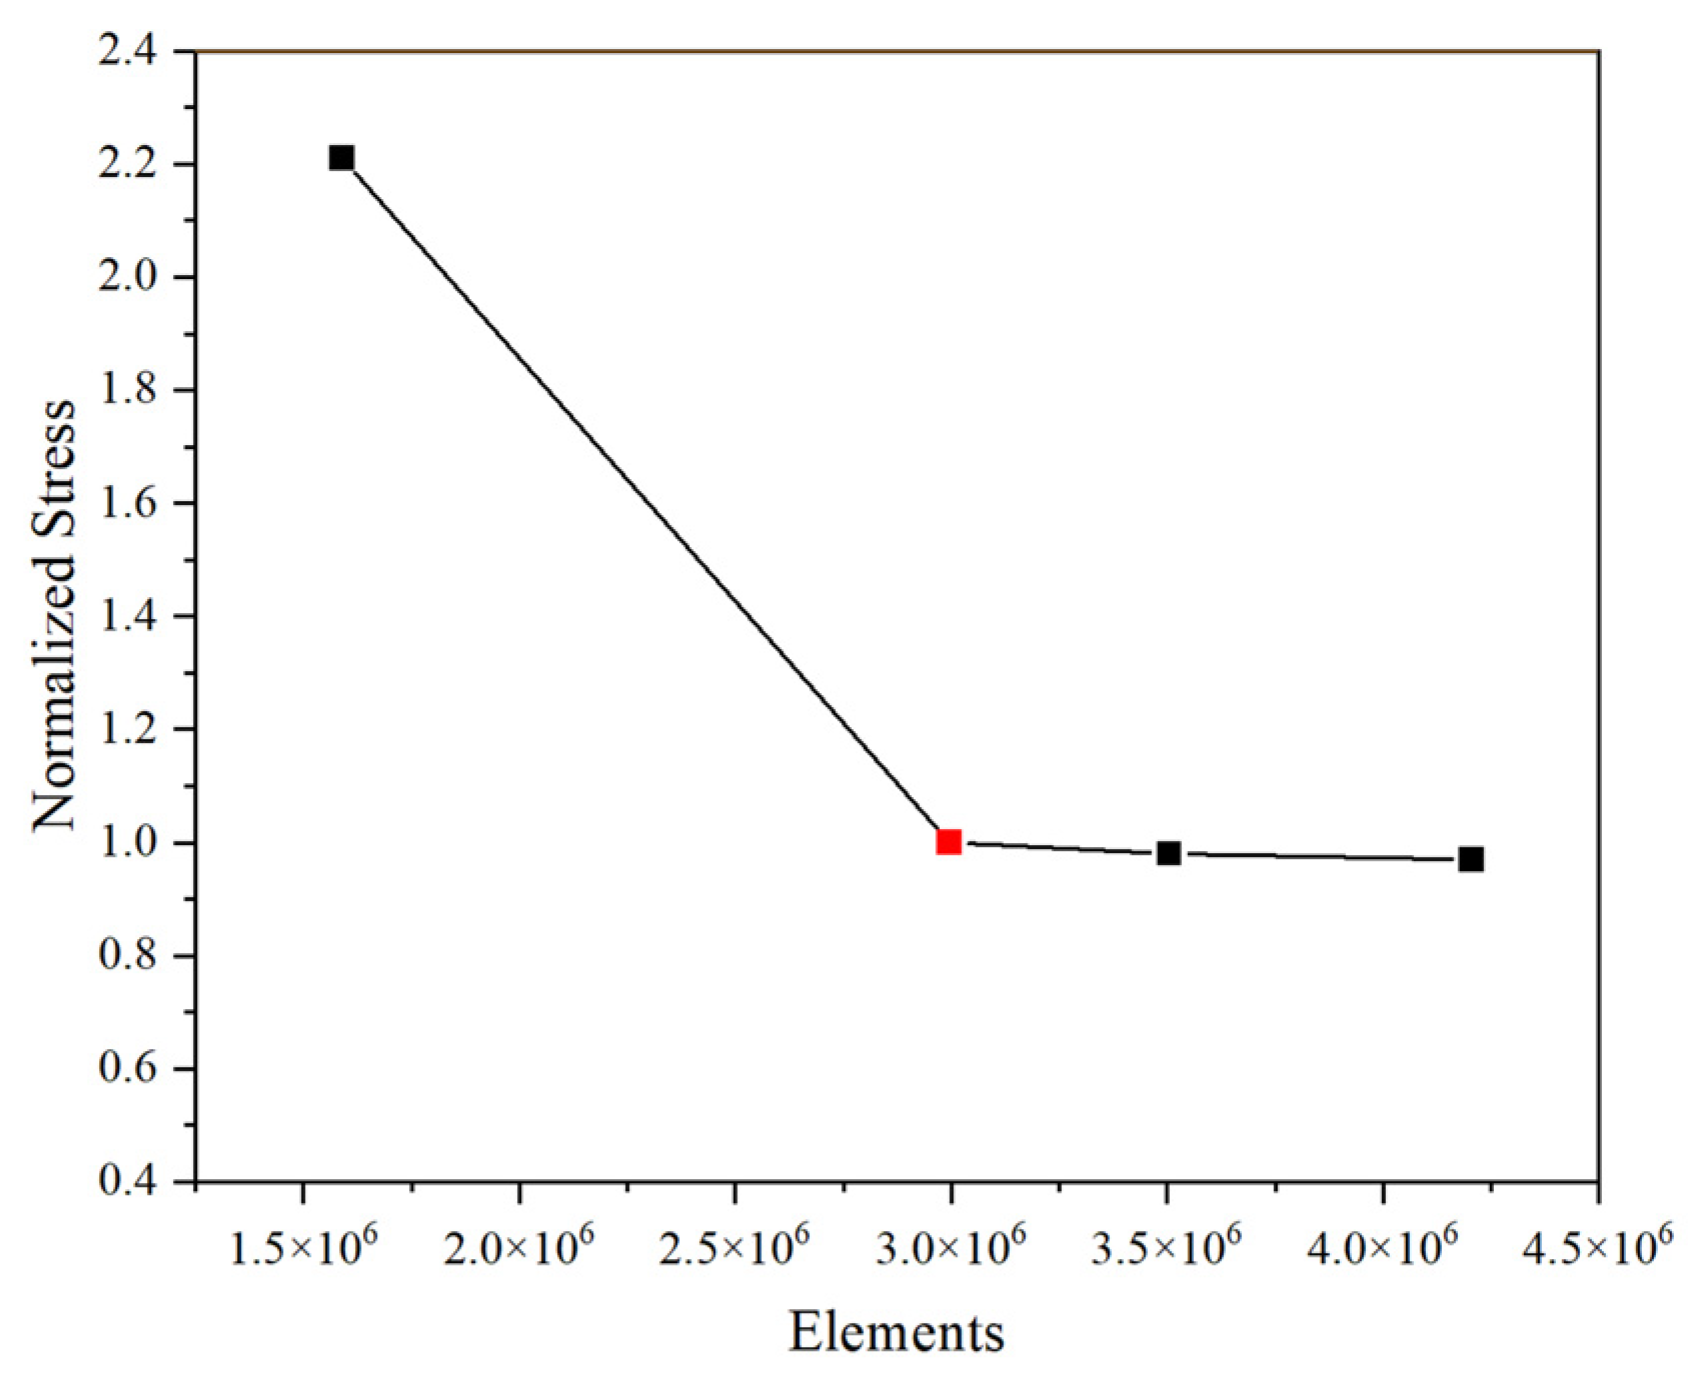
Four sets of mesh with different element numbers are plotted for the structural model in a mesh independent analysis, including 1.589 × 10⁶, 2.996 × 10⁶, 3.505 × 10⁶, 4.204 × 10⁶ elements. Figure 9 presents the simulation results of normalized stress for four different sets of meshes. The element number of the first set is not so high that singularities exist and cause an abnormal high stress. Compared to the normalized stress, the mesh with 2.996 × 10⁶ element numbers is the best choice for further analysis to save calculation time and ensure accuracy.
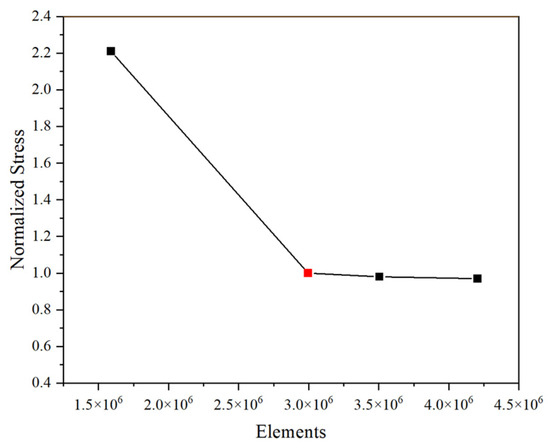
Figure 9.
Structural mesh independence analysis.
The boundary conditions of the structural model for fluid–structure coupling are shown in Figure 10. Standard earth gravity is applied to the structures. The hydraulic pressure distributions exported from the CFD analysis are applied to the corresponding structural components at different time points. Each pressure file includes the 3D coordinates and the pressure values of each mesh node in the form of (x, y, z, pressure) on the fluid–structure coupling interface. The initial preloading clearance has been simulated in the preloading spiral case structural model, so the connection surfaces between the spiral case and the concrete are designated as the nonlinear contacts. Considering the potential separation and sliding behaviors, the friction type is introduced to the contact model. The friction coefficient is defined as 0.25, and the interface treatment is set as ‘adjust to touch’ for simulating the nonlinear contact behaviors. The remote displacement of the headcover restricts one face’s movement in the x and y direction. The lower part of the bottom ring is bonded with the concrete. Considering the constraint from the mountain, the outer surfaces of the plant concrete are assigned as fixed support.
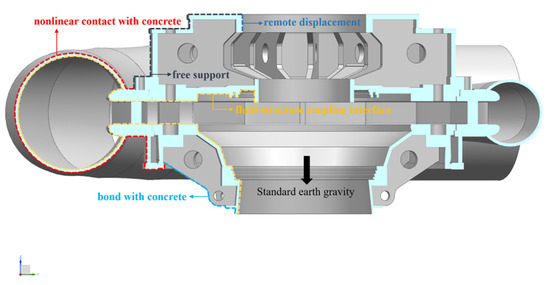
Figure 10.
Boundary conditions of the pump-turbine unit.
4. Results and Discussion
4.1. Hydraulic Performance
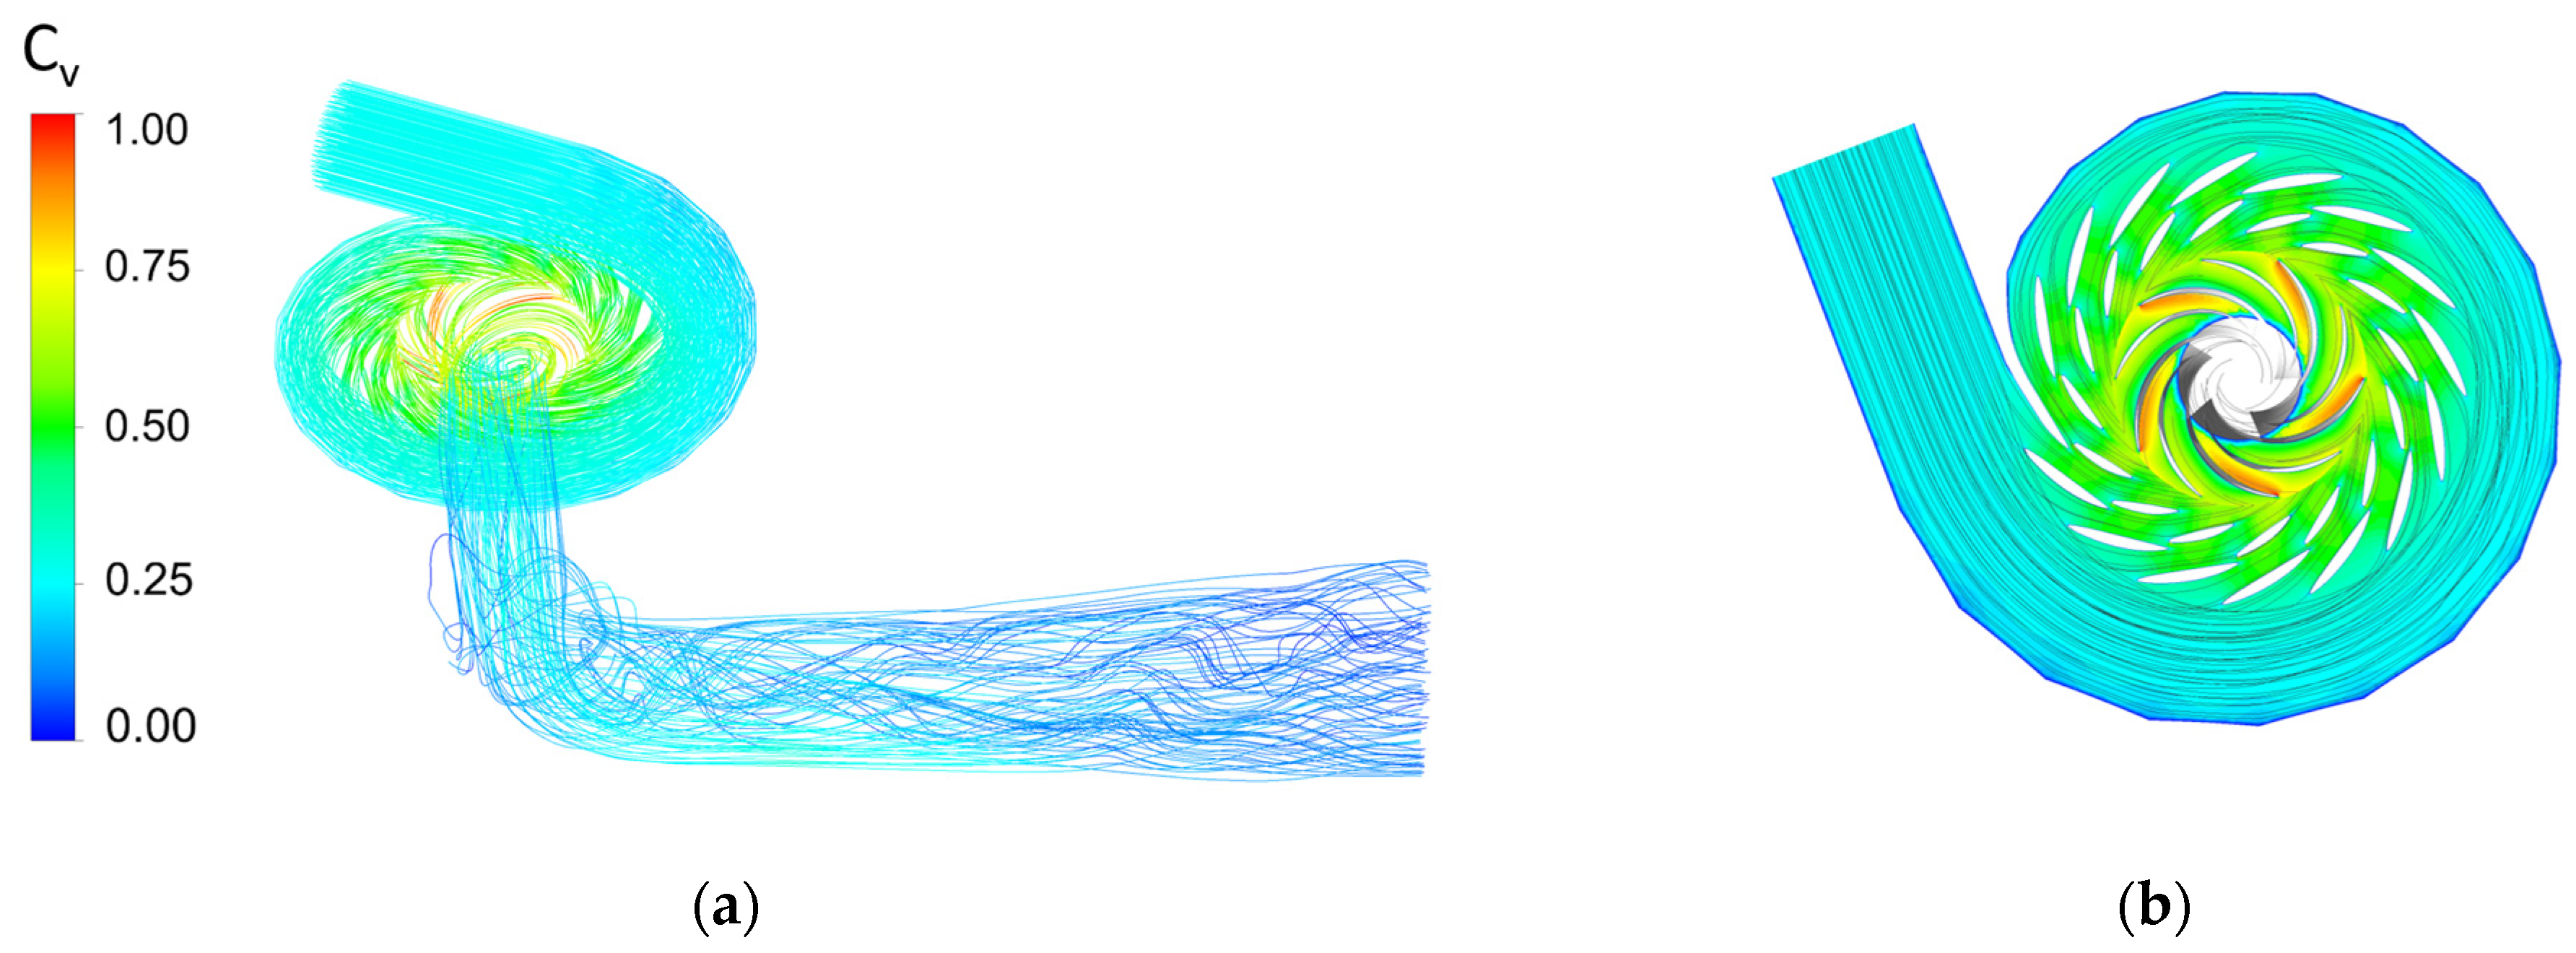
The flow from the spiral case to the draft tube outlet is close to the optimal flow state under the rated condition. As shown in Figure 11, the streamline shows stable flow characteristics with the maximum velocity located at the long runner blade tips. The flow enters the spiral case smoothly through the penstock, and then forms a velocity circulation following the equiangular helix of the spiral case. Compared with the flow rate at the inlet, the velocity inside the spiral case increases to a certain extent with local reduction at the section.

Figure 11.
Streamline distribution of the unit. (a) Whole flow passage; (b) cross-section view.
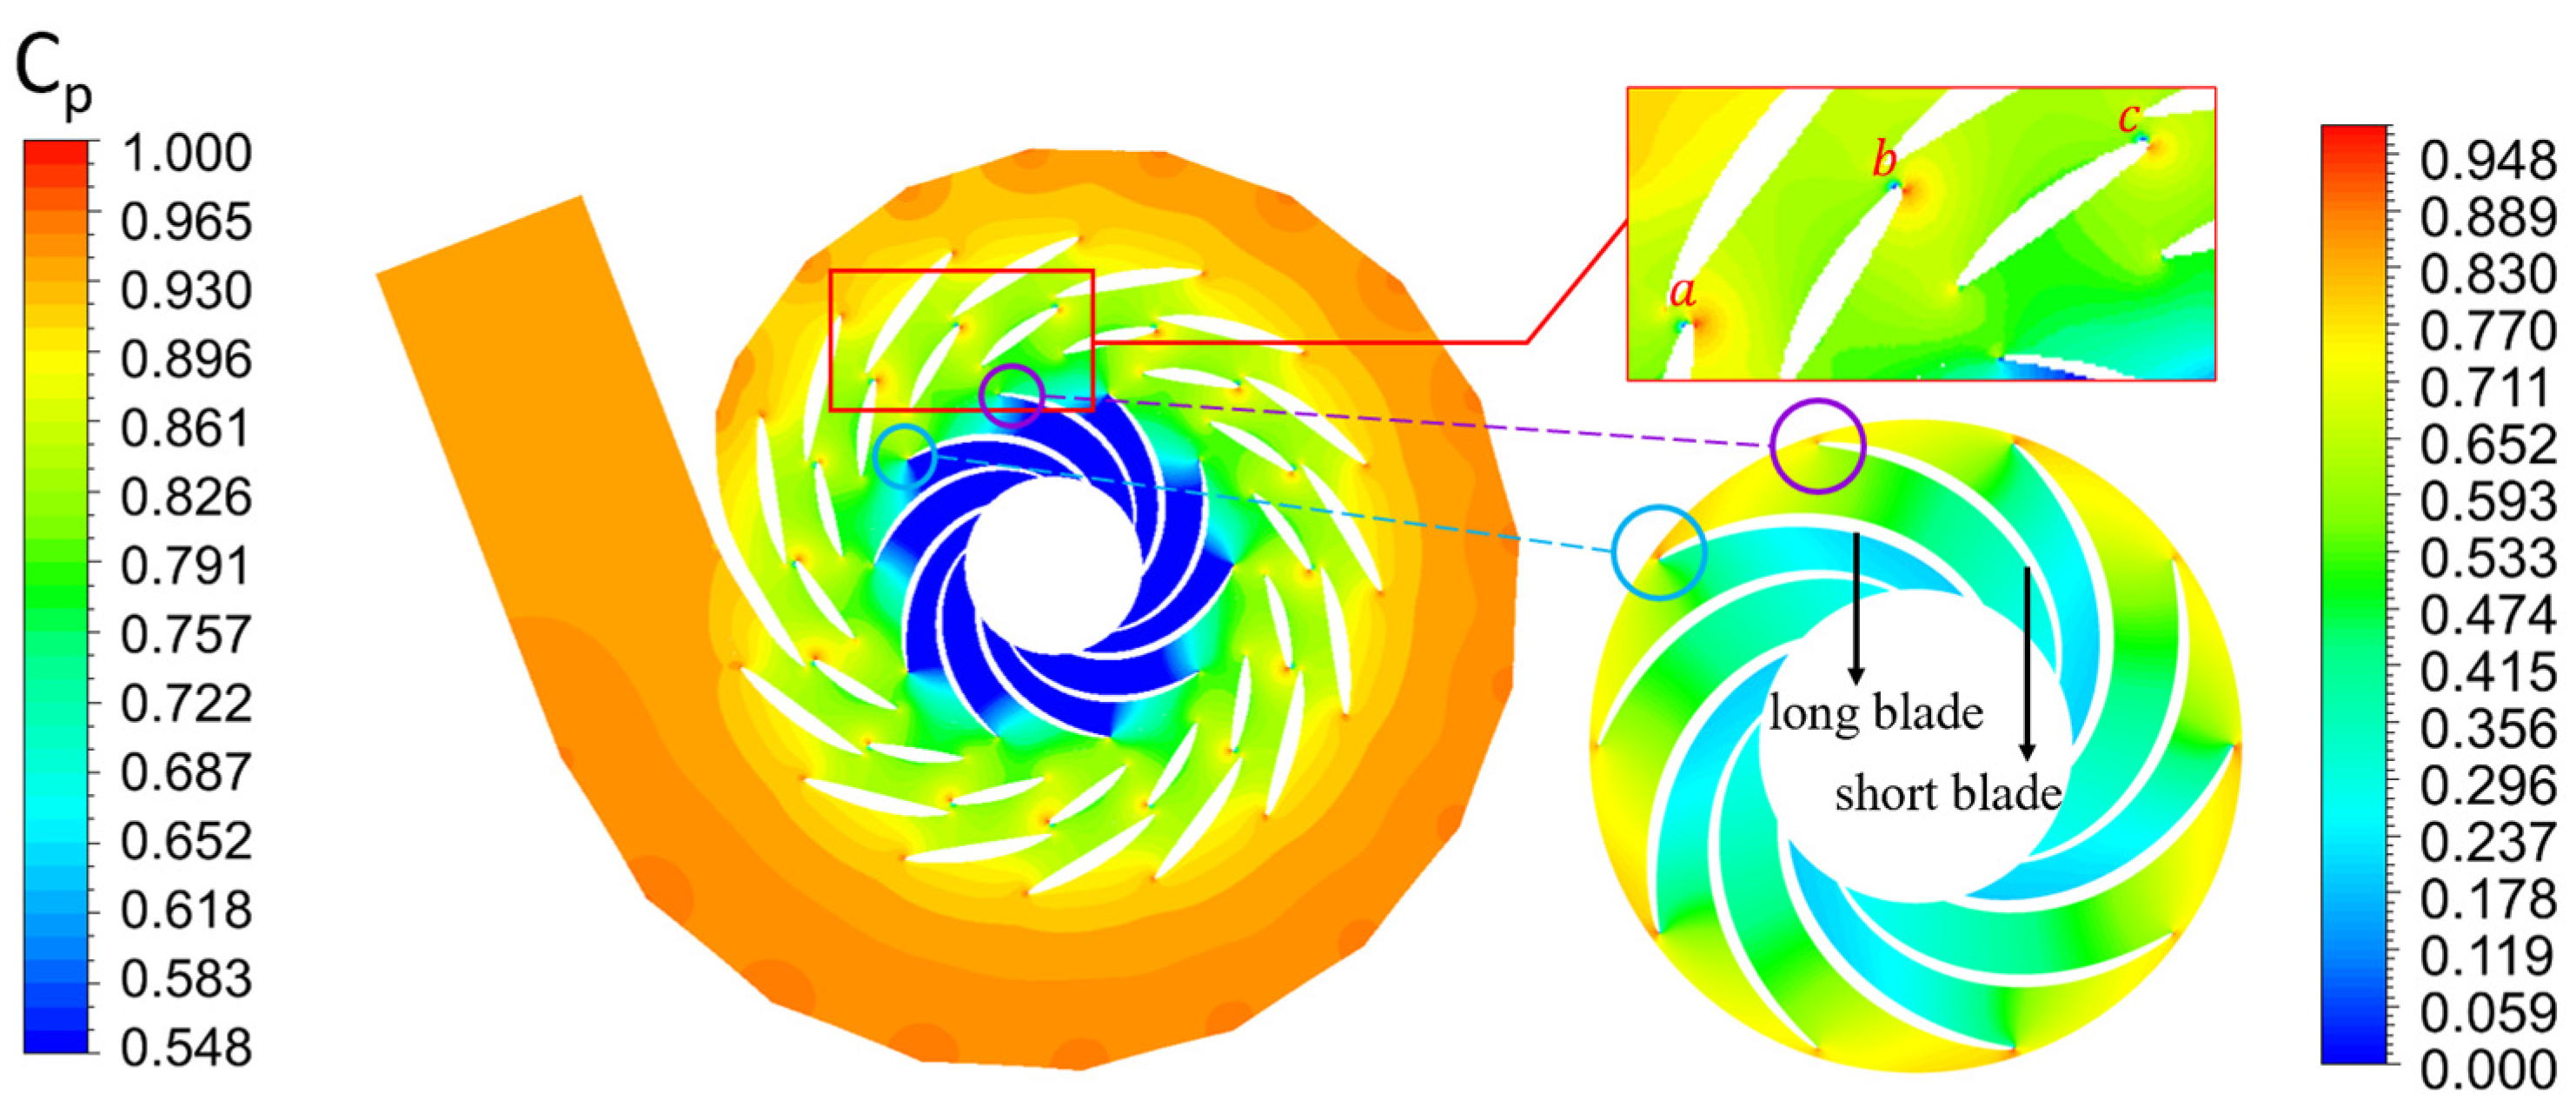
The high-pressure region is mainly concentrated in the spiral case and the stay vanes domain, while the low-pressure region is in the runner domain in Figure 12. The pressure distribution of the spiral case is uniform and gradually increases from the outer radius to the inner radius. As the flow passes through the guide vanes, pressure decreases significantly with the increase in local pressure at the vane tip. The pressure in the vaneless space is further reduced due to the restriction of the flowing area and the high rotational speed. Greatly affected by the different shape between the short and long blades, the pressure inside the runner domain after the short blades is much lower than that of the long blades, which causes different degrees of pressure fluctuations to be transmitted to the vanes and spiral case space. As the long blade passes through, the pressure in the vaneless space increases relatively, so the pressure distribution of the runner domain is symmetrical but nonuniform. The difference between the long and short blades results in localized pressure increases of large, medium, and small degrees at points a, b, and c near the guide vane tip.
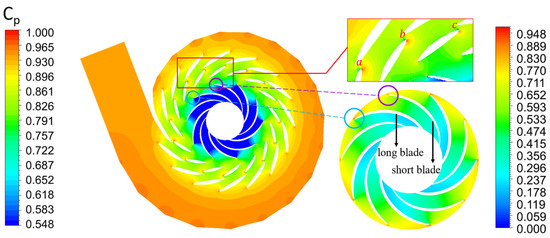
Figure 12.
Pressure distribution in the flow passage.
4.2. Pressure Fluctuation Characteristics
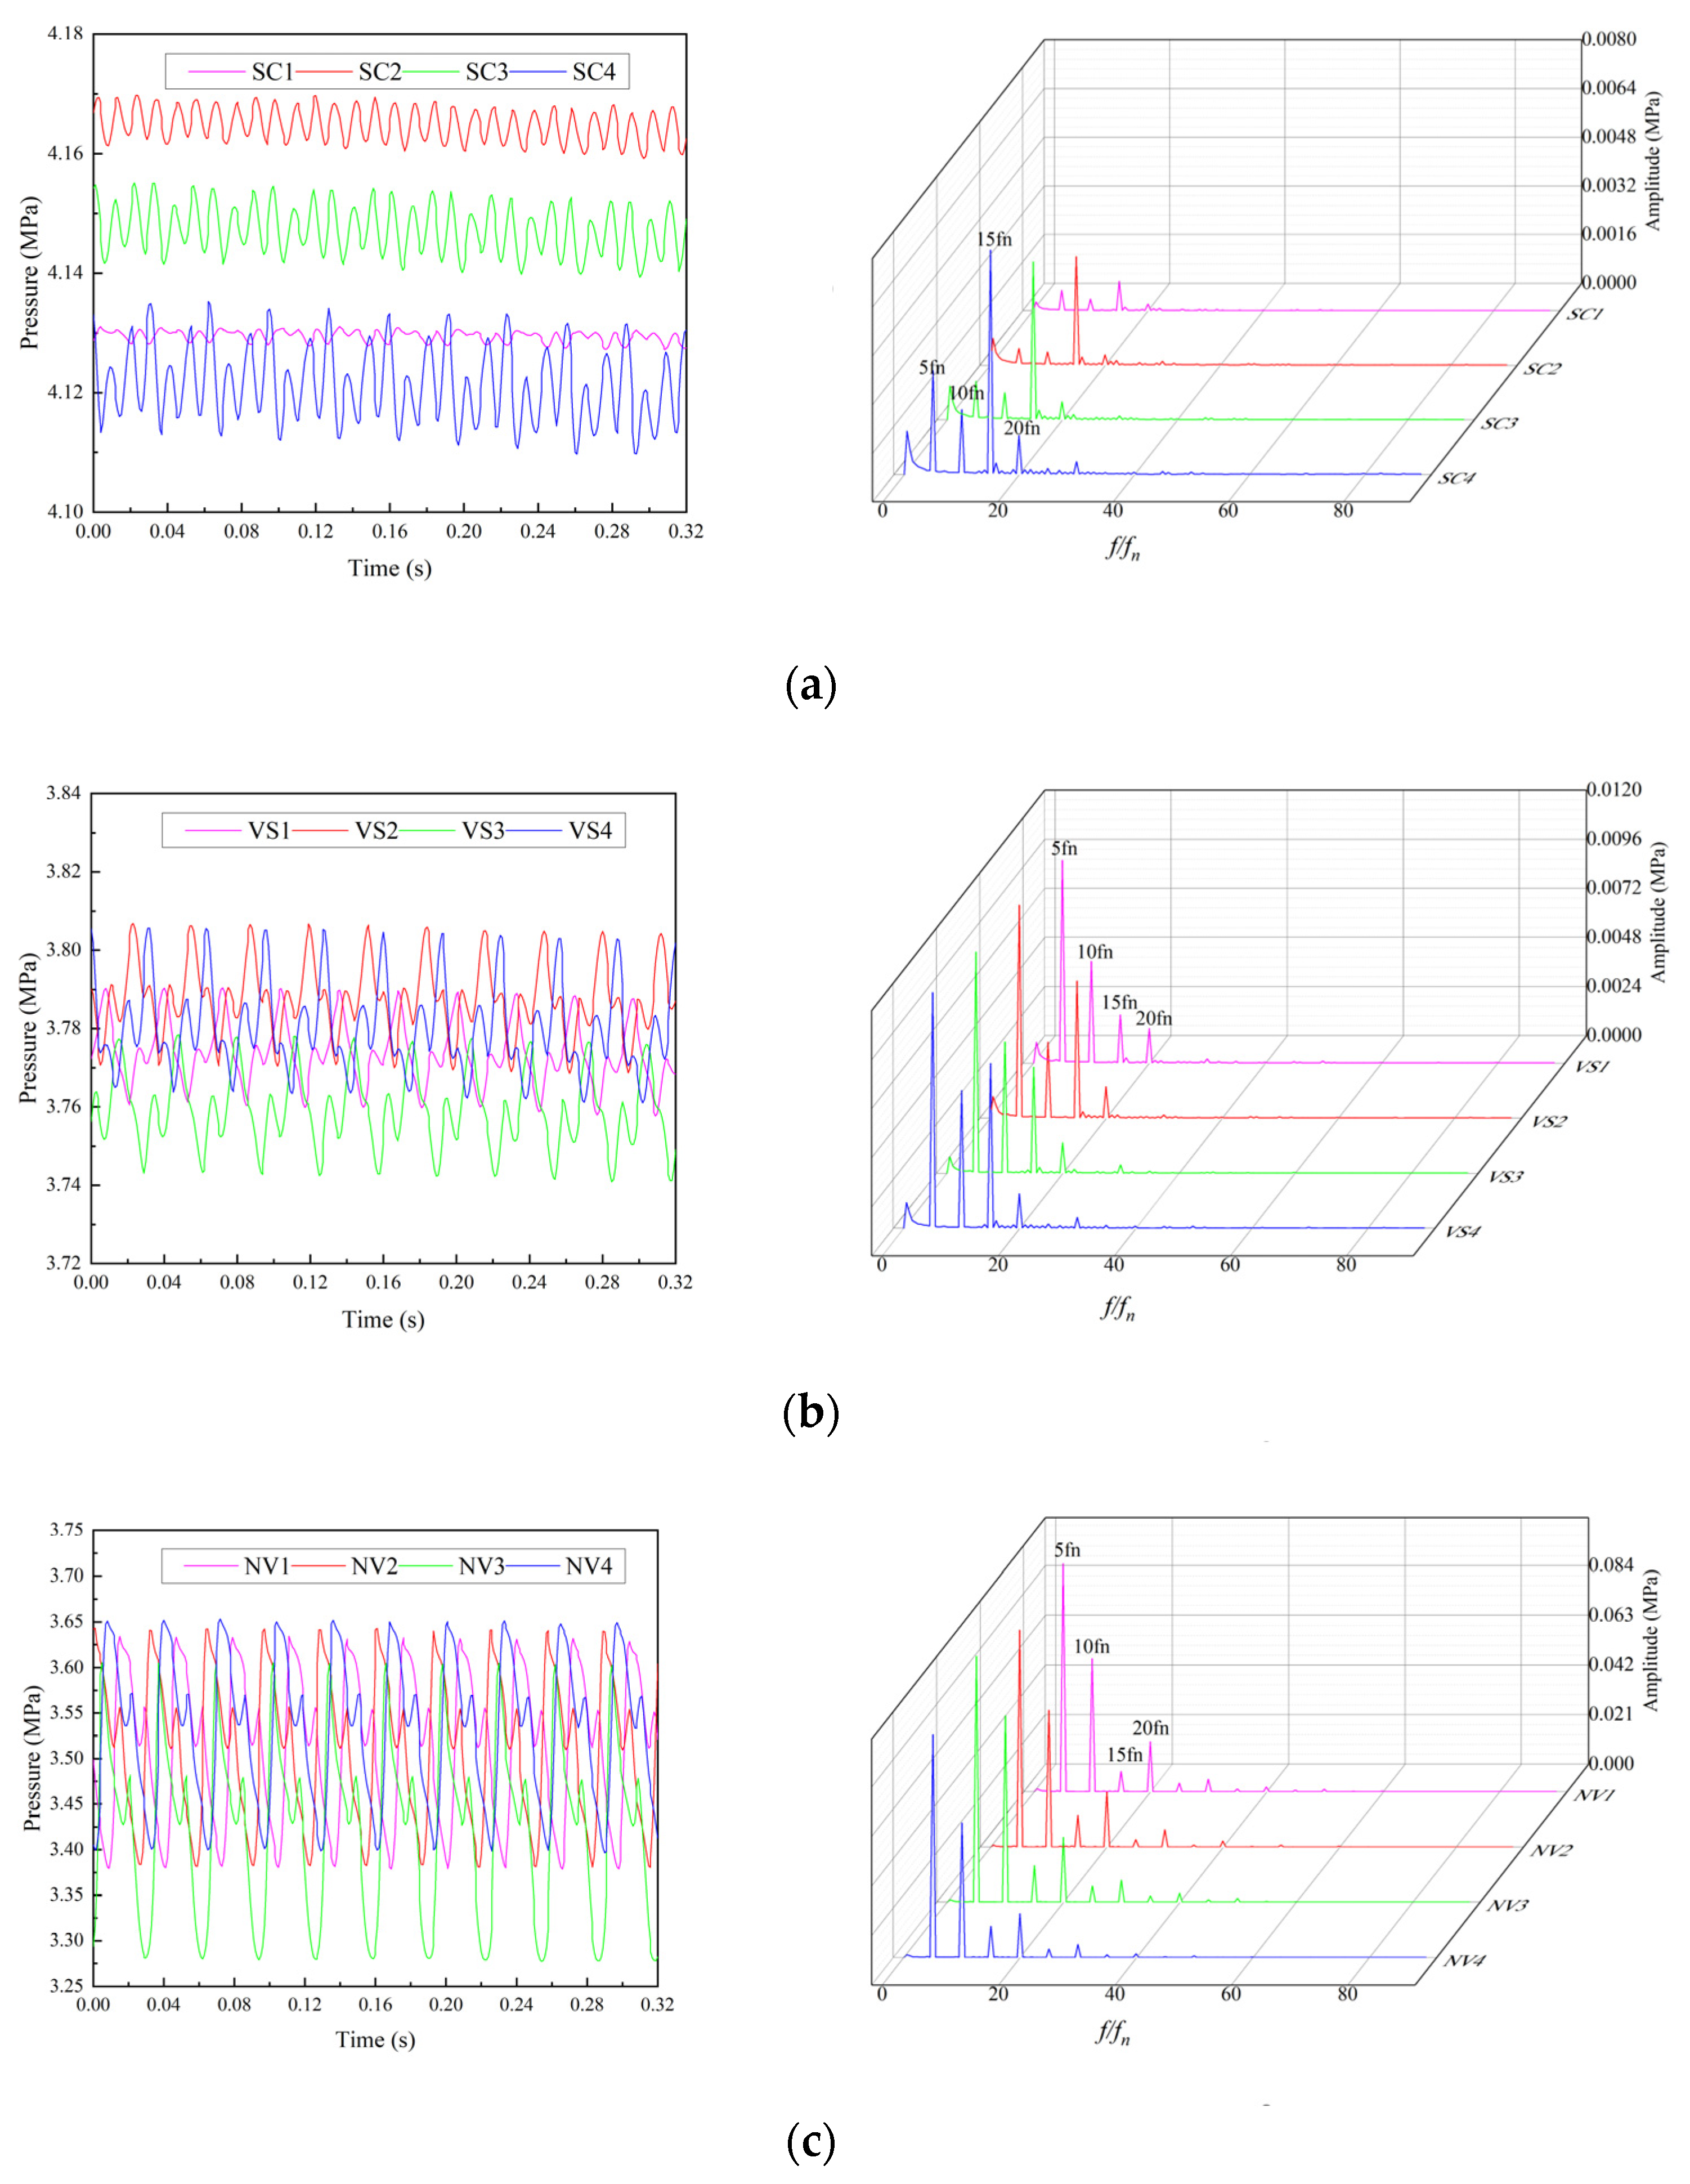
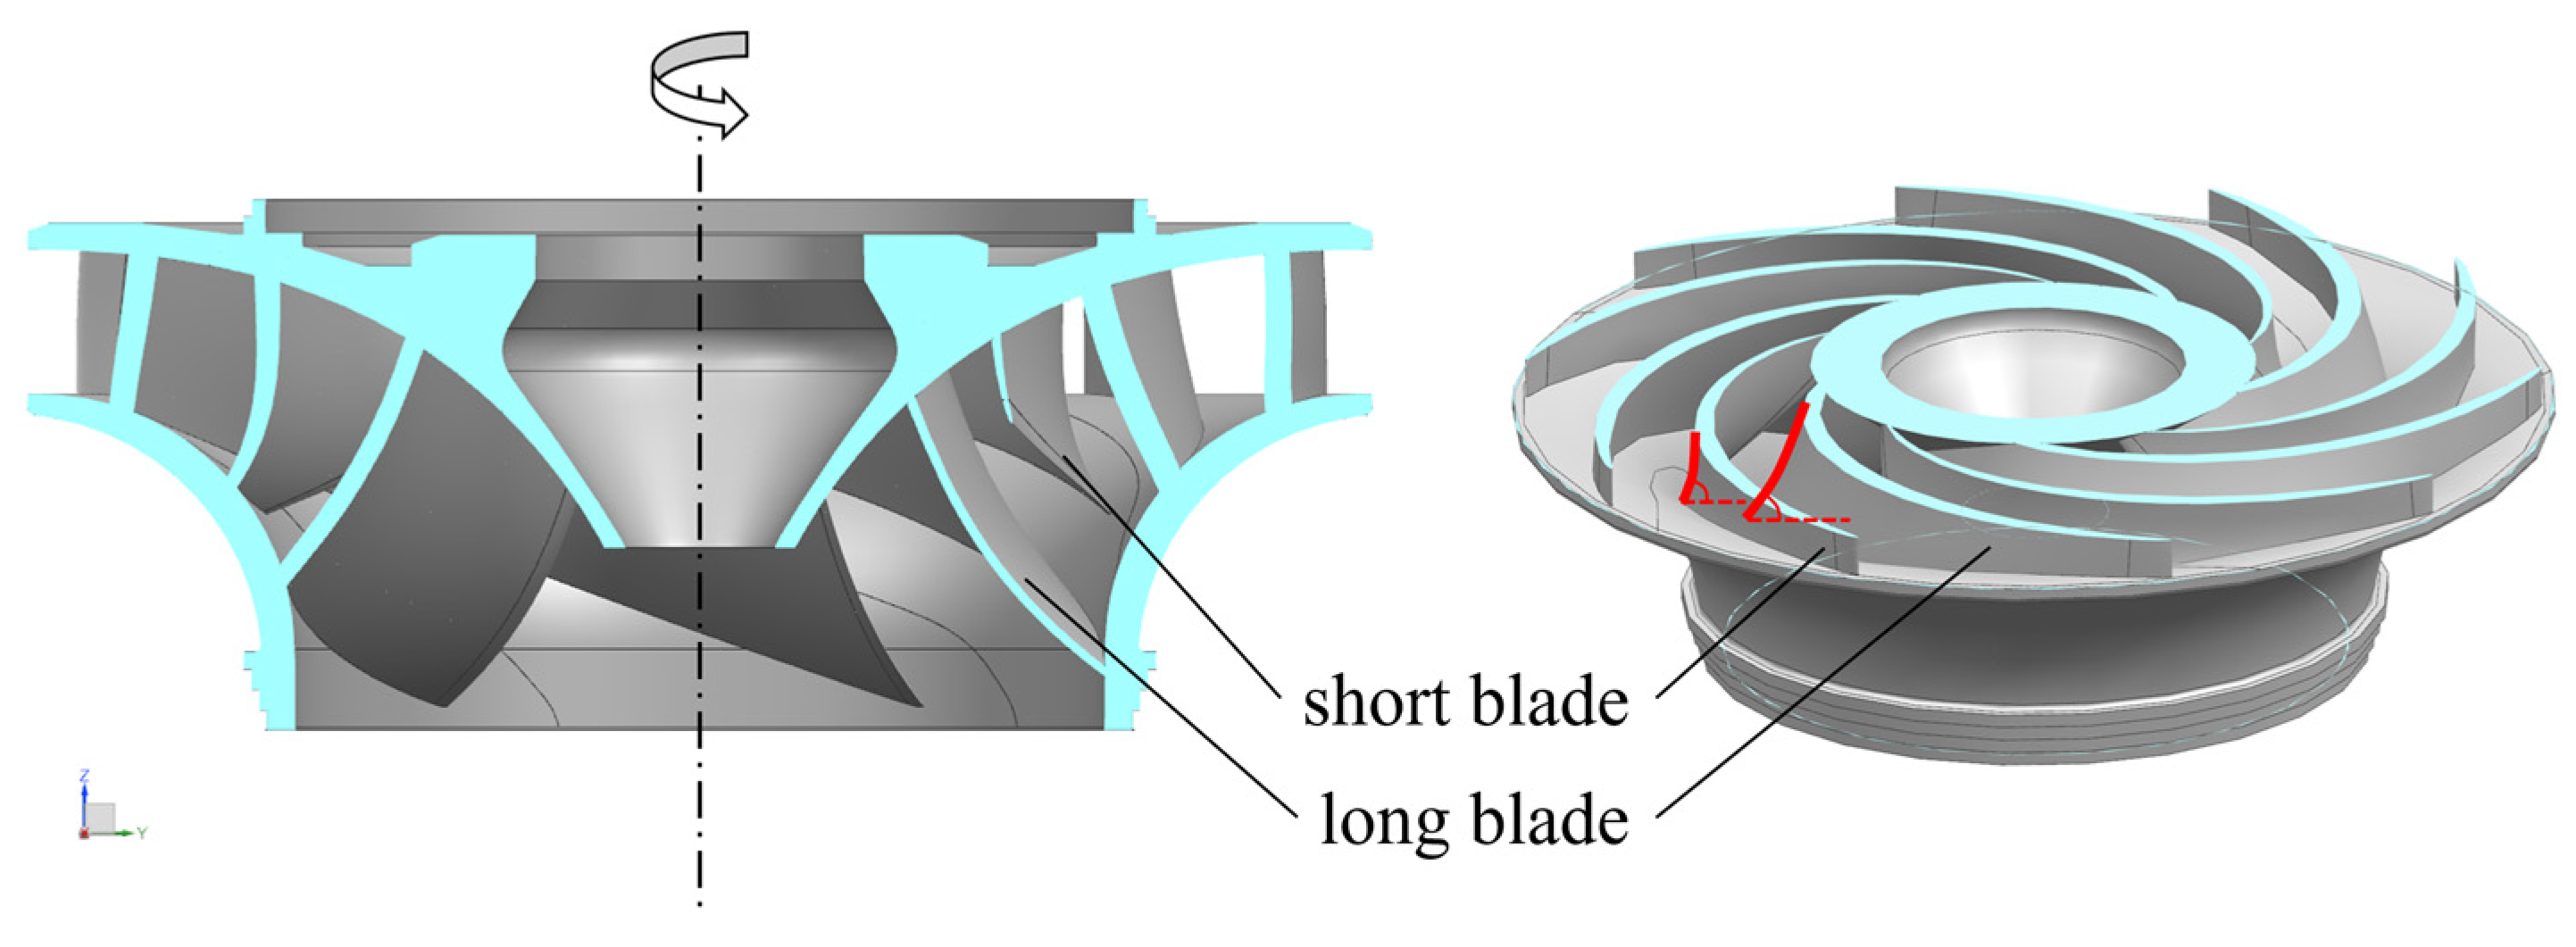
In the analysis of the pressure distribution in the rated condition of the turbine mode, particular interest is given to the pressure fluctuation of the spiral case, intervene space and vaneless space, wherein represents the ratio of frequency to rotation frequency. The time history and frequency spectra of the pressure fluctuation of the monitoring points in two rotational periods are shown in Figure 13. Taking different flow characteristic of the short and long blades into consideration, the rotor–stator interaction (RSI) frequency should be 15 (when ), and it should also be 15 —the same as a normal runner with 10 blades (when ). It is reasonable to take the number of runner blades as five to calculate the RSI frequency. This is because the different angles between the long and short blades and the inner wall at the shroud, as well as the different distances from the draft tube at the hub, as shown in Figure 14, can significantly affect the distribution of the pressure wave. In addition, the runner blades passing (RBP) frequency is associated with 5 , 10 and 20 , according to the integral multiples of runner blade numbers.
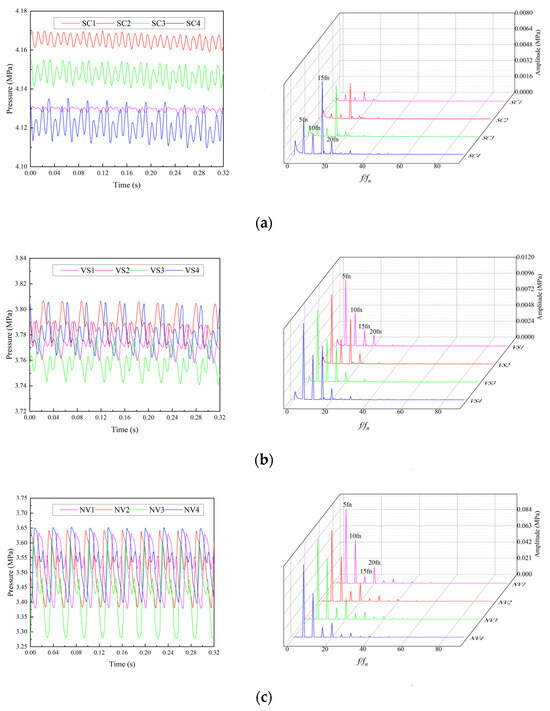
Figure 13.
The time history and frequency spectra of the pressure fluctuation. (a) Spiral case; (b) inter-vane space; (c) vaneless space.

Figure 14.
The cross-sections of runner blades.
As one can see, the dominant frequency of the pressure fluctuation in the spiral case, intervene space and vaneless space are 15 , 5 , 5 , respectively. The pressure fluctuation in the vaneless space becomes more complex because of its short distance to the runner, resulting in larger pressure amplitude compared to that of the spiral case. The pressure fluctuation is mainly affected by the RSI and RBP frequency.
When comparing the frequency spectra of the different domains, an interesting phenomenon appears in which the dominant frequency changes from 15 to 5 as the streamline flows from the spiral case to the vaneless space, which suggests that there are considerable differences between the scope of RSI and RBP.
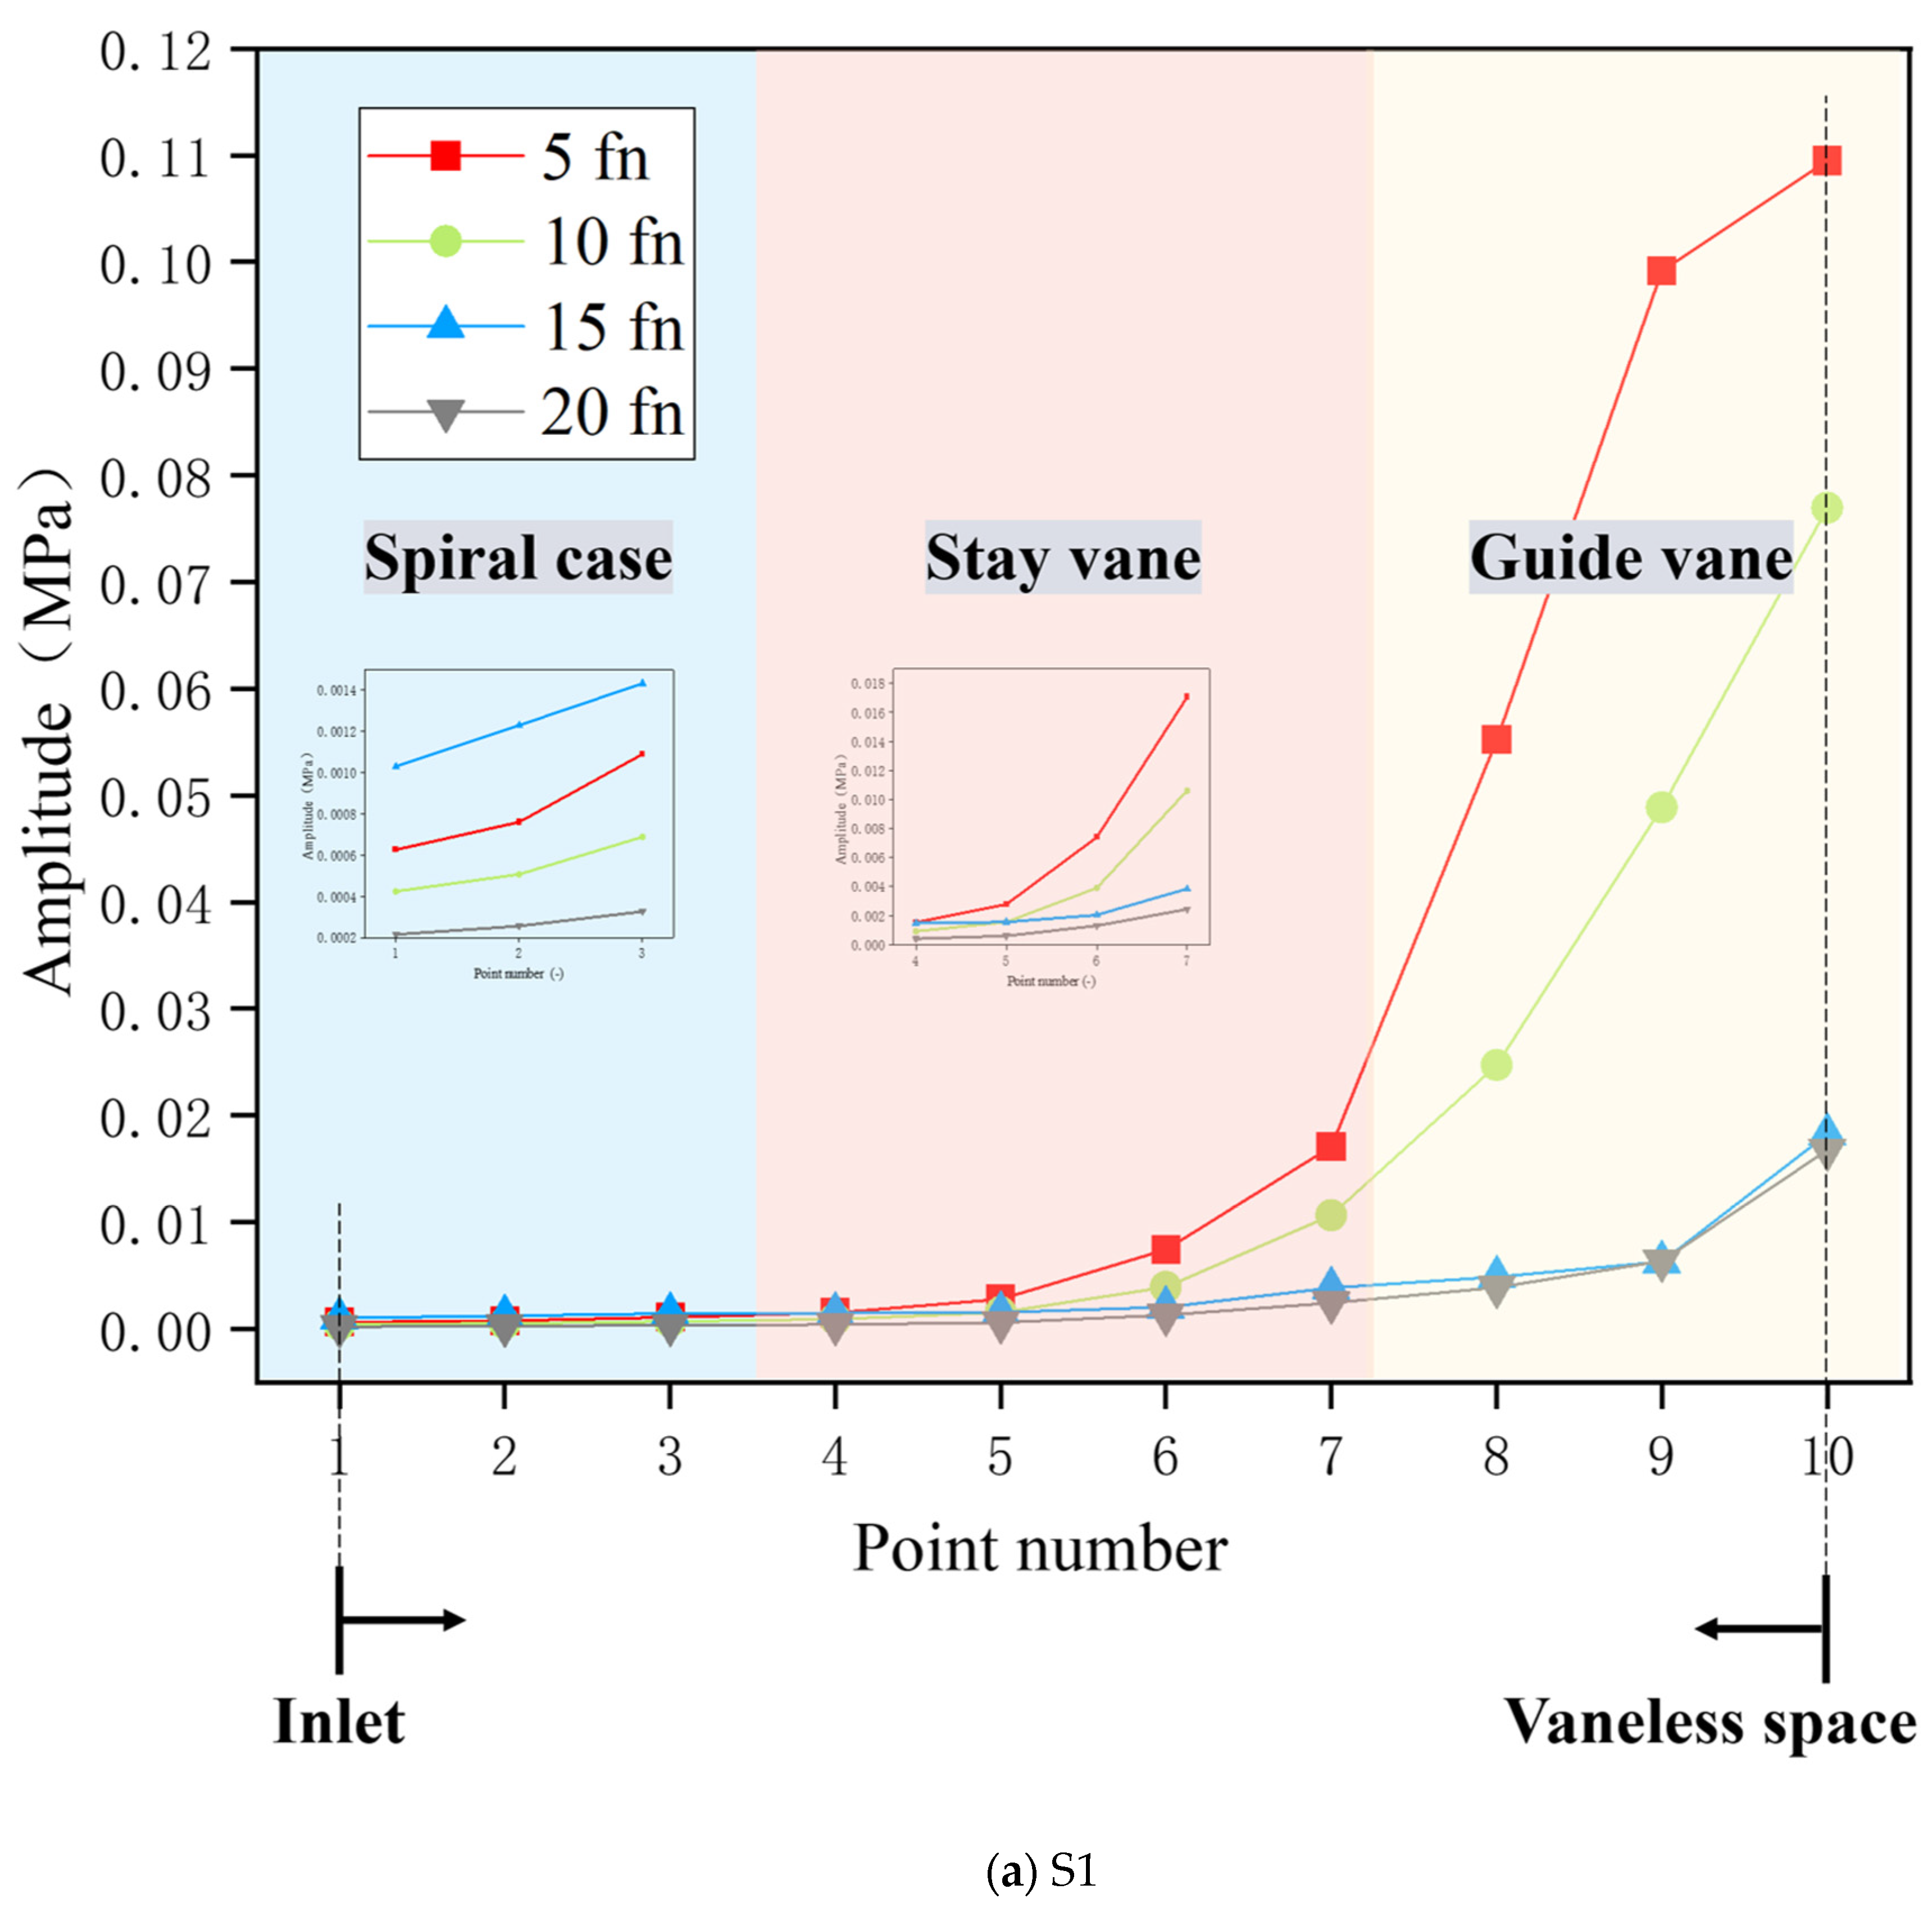
Two streamlines starting from the spiral case to the vaneless space are extracted from the flow domain, wherein S1 passes through the nose vane and S2 passes through the normal vanes, as shown in Figure 15. Ten monitoring points are chosen in different domains, wherein P1–P3 are located at the spiral case, P4–P7 are located at the stay vane space, and P8–P10 are located at the guide vane space.
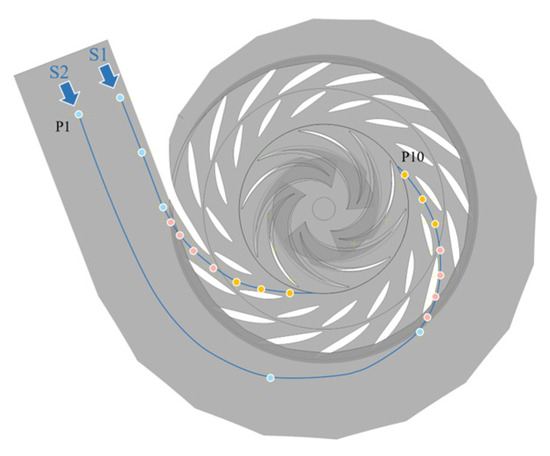
Figure 15.
Pressure pulsation monitoring points in S1 and S2.
Based on unsteady numerical calculation, the pressure amplitudes of the monitoring points on the first four dominant frequencies, i.e., 5 , 10 , 15 , 20 , are shown in Figure 16. Since the pressure wave arises from the rotation of the runner, its propagation direction is opposite to the flow direction. It is noted that the amplitudes of the first four dominant frequencies all gradually diminish as the pressure wave moves from the vaneless space to the spiral case, with lower frequency attenuating more rapidly. The 5 and 15 are prominently manifested in both the spiral case and vaneless space because of their proximity to the vanes. The presence of the moving and stationary domains is on either side of the vaneless space, but the spiral case has both domains on one side. Thus, the pressure fluctuation corresponding to the RSI frequencies is more dominantly in the vaneless space. In addition, as previously analyzed, the 5 results from the effects of the RBP frequency, rendering it the dominant frequency in the vaneless space. The spiral case region, being relatively distant from the runner, is less affected. Figure 10 above demonstrates that the difference between the long blade and short blade greatly impacts the distribution of the pressure wave during propagation, making 15 the dominant effect in the spiral case domain.
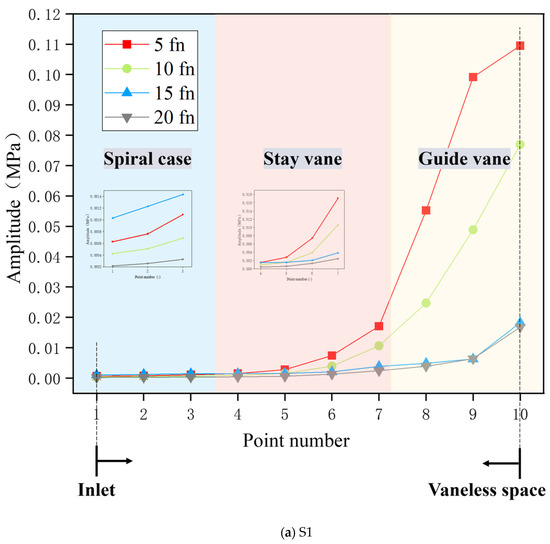
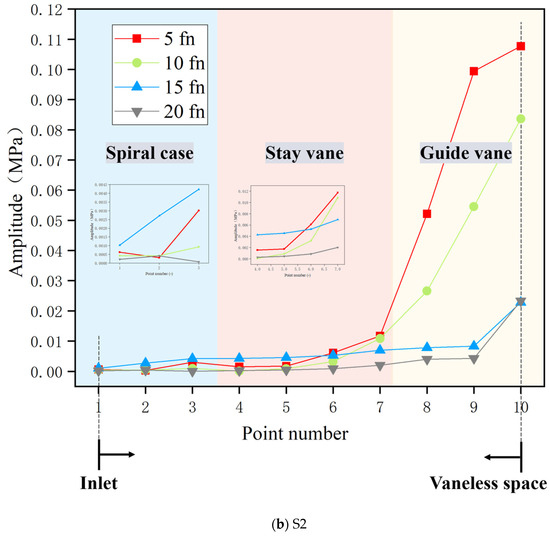
Figure 16.
The pressure amplitude of the monitoring points on the first four dominant frequencies. (a) S1; (b) S2.
4.3. Effect of Preloading Clearance on Hydrodynamic Structural Performance
Based on the structural model with the imported load of the rated condition, the dynamic response behaviors of the PSSC and concrete are analyzed. Figure 17 shows the locations of deformation and stress monitoring points on the ektexine of the PSSC. Points n1, n3, n5, and n7 on the spiral case section are used to monitor the dynamic response of deformation, while points n2, n4, n6, and n8 between the sections monitor the dynamic response of stress. Maximum principal stress is chosen over equivalent stress since the latter may not effectively capture variations in the stress tensor, particularly when different principal stress magnitudes are similar. Also, the spiral case expands outward under internal hydraulic pressure, with the outer surface primarily experiencing tensile stress. Thus, maximum principal stress is the best fit for revealing the dynamic stress characteristics of the PSSC.
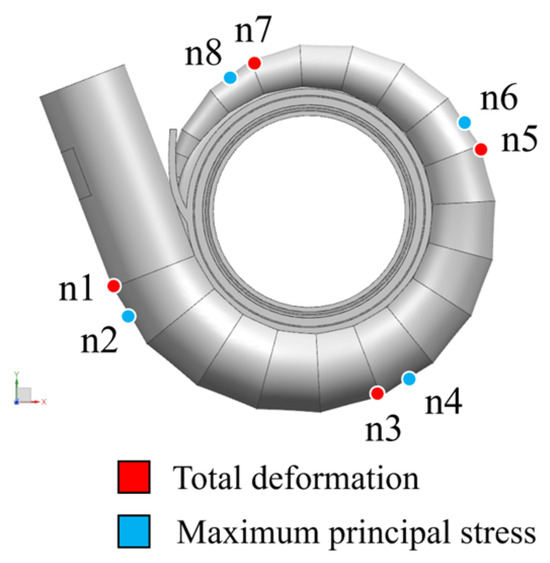
Figure 17.
Deformation and stress monitoring points (red points for total deformation, blue points for maximum principal stress).
4.3.1. Contact Status
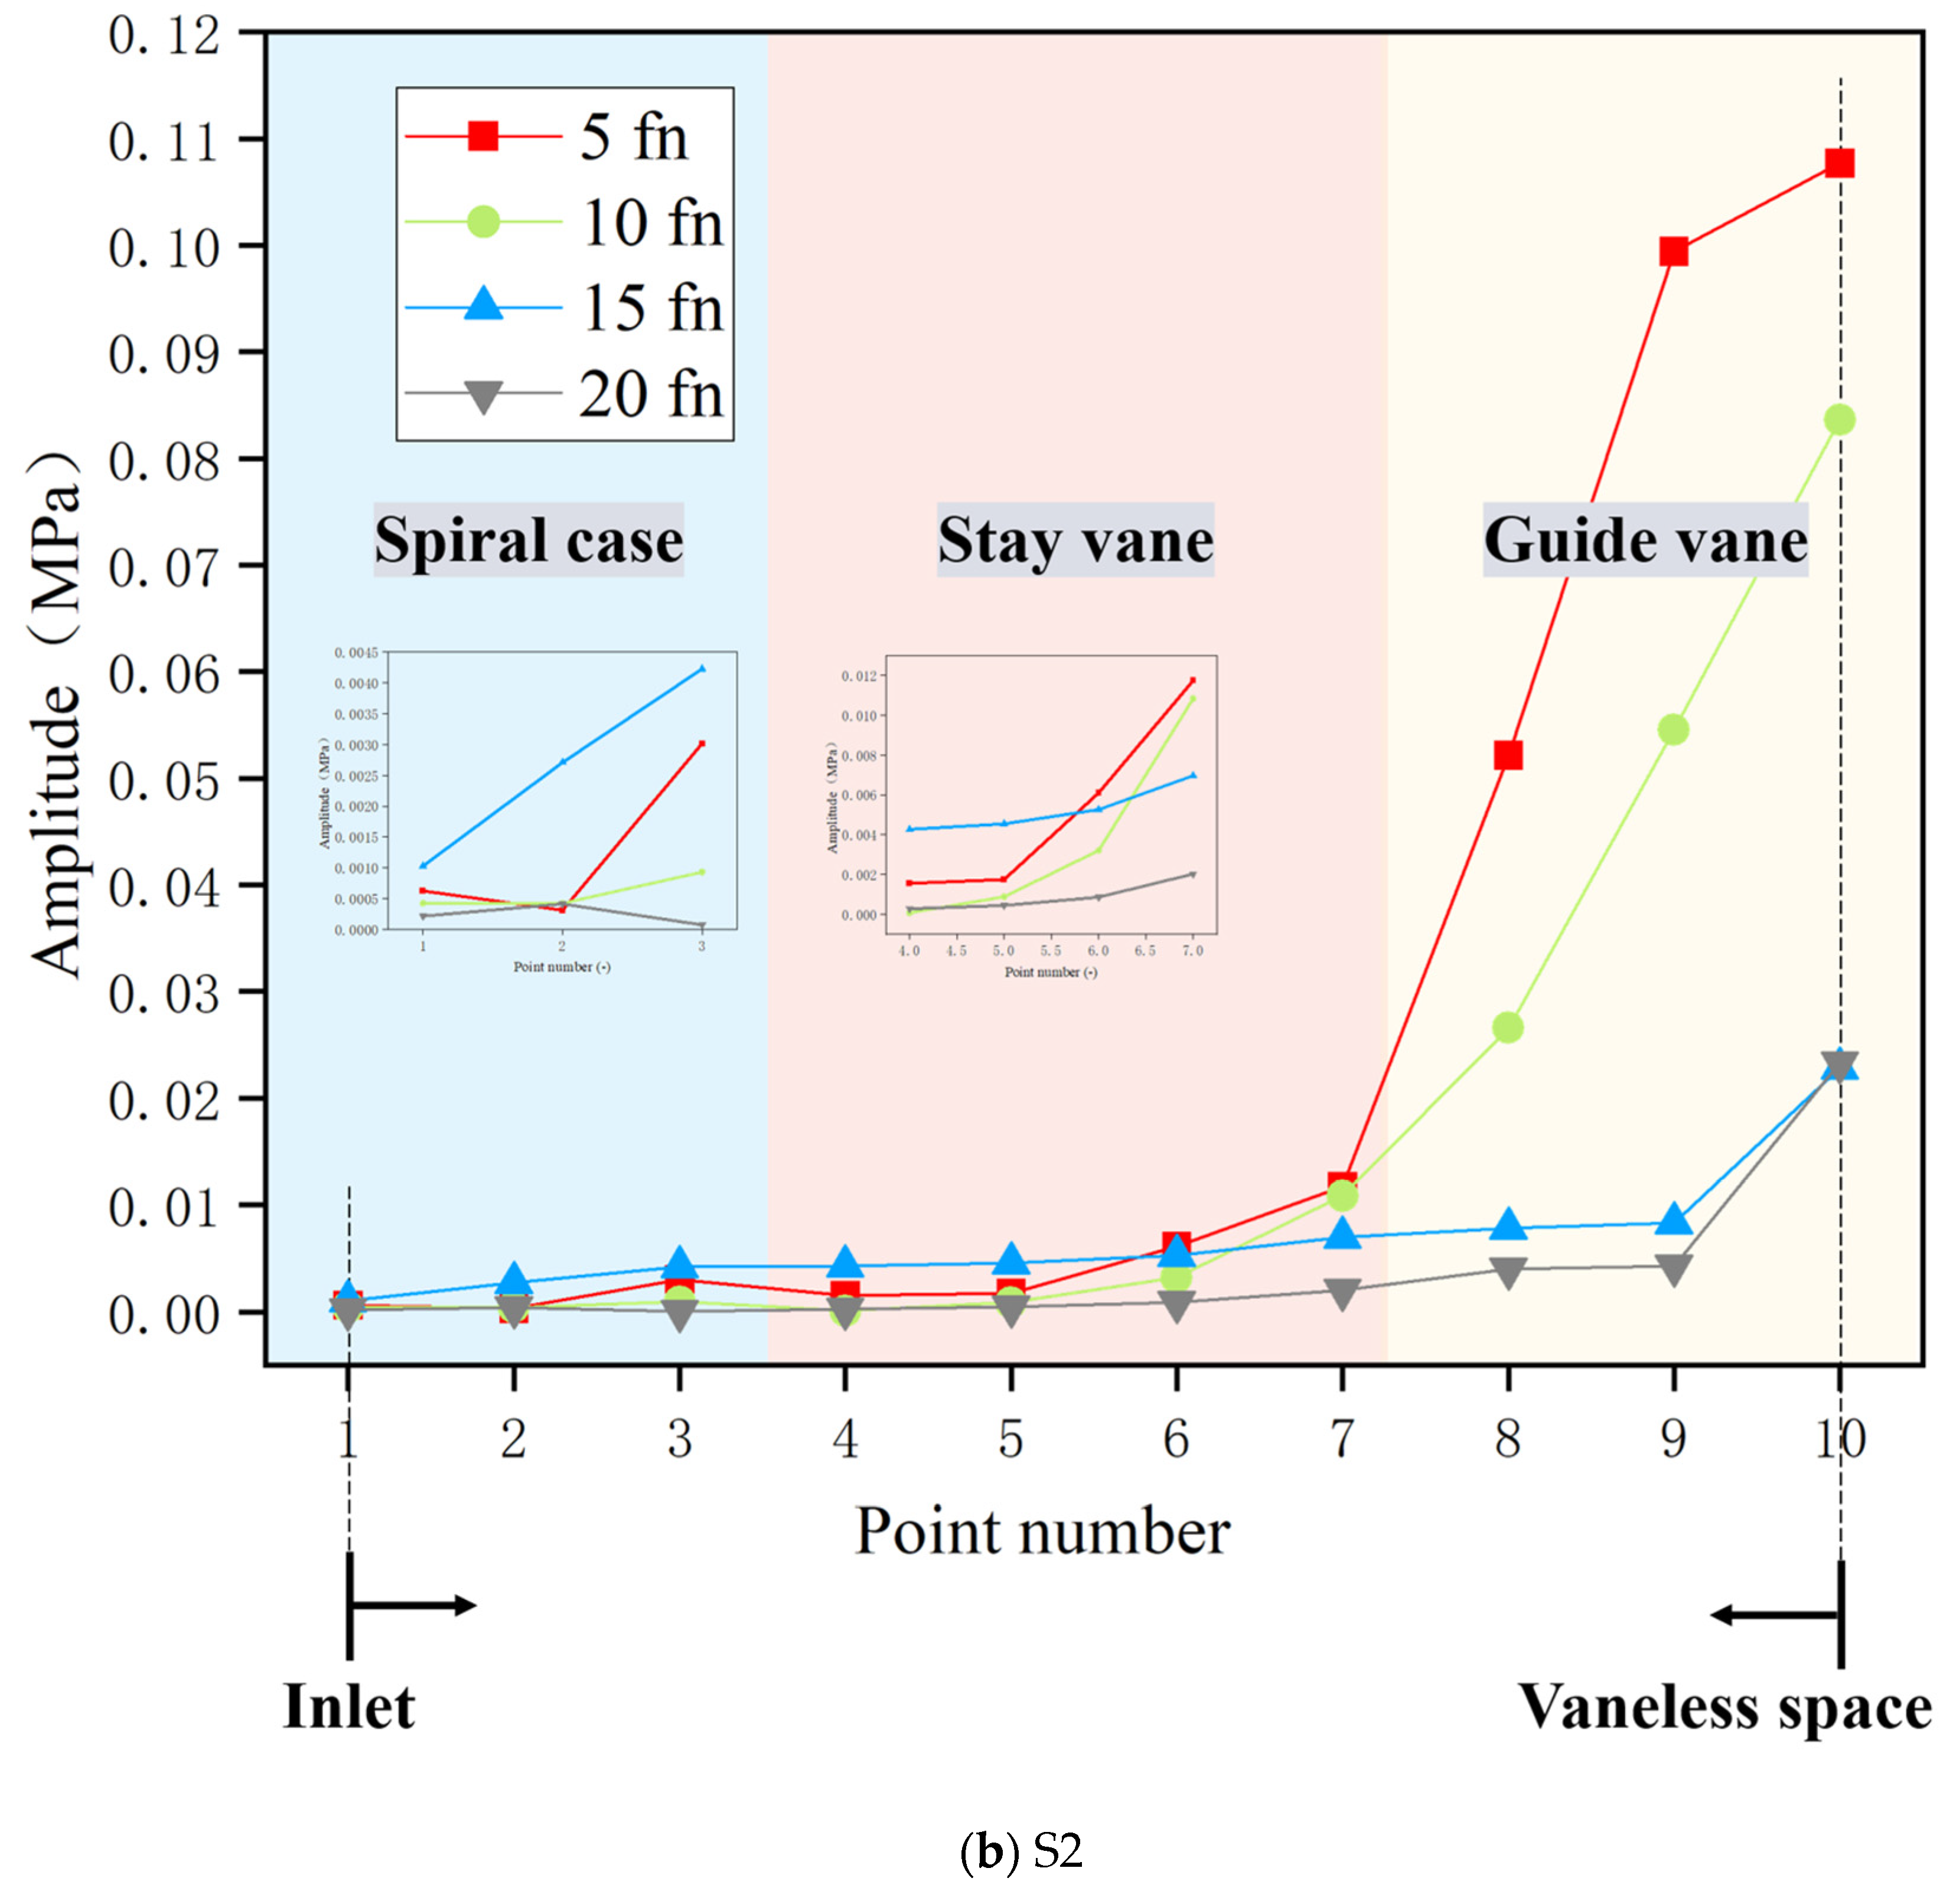
The contact state between the PSSC and concrete under three preloading pressures shows great differences under the same conditions, presenting an uneven spatial distribution characteristic. In Figure 18, red and orange represent sticking and sliding as clearance is closed, while yellow, blue, and pink represent near, far, and over constrained, respectively, indicating that the clearance is in an open state.
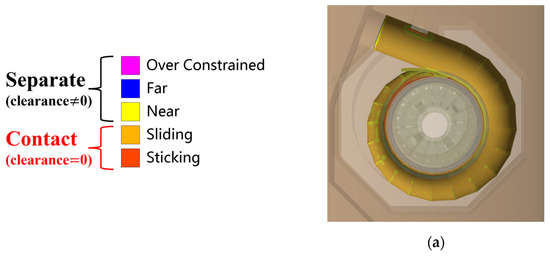
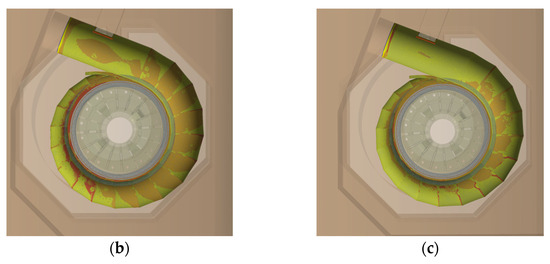
Figure 18.
Contact status between the PSSC and concrete under different preloading pressures; (a) 3.2 MPa; (b) 4.564 MPa; (c) 6.52 MPa.
According to the flow pressure distribution in Figure 12, the hydraulic pressure exerted on the inner wall of the PSSC is approximately 4 MPa. For a preloading pressure of 3.2 MPa, the hydraulic pressure greatly exceeds this value. As a result, most areas of the PSSC are in contact with the concrete in a sliding way, with only local clearances occurring near the inlet edges and the sections close to the nose vane. The clearance distribution characteristics for the other two preloading pressures exhibit a certain degree of similarity. When the preloading pressure increases to 4.564 MPa, approaching the hydraulic pressure, the PSSC is not in complete contact with the concrete. Separation occurs in the inlet and the area between sections in the rear half, while the sticking contact is located near the nose vane. As the preloading value reaches 6.52 MPa, which is approximately 1.5 times the hydraulic pressure, the PSSC exhibits partial sliding contact only between each section from section 2 to 10, the inlet as well as the nose vane. Compared with Figure 18a, there is an interesting phenomenon in that the locations of contact areas in Figure 18c correspond to the separation regions in Figure 18a. It is speculated that during the increase in hydraulic pressure, these regions contact first but subsequently undergo detachment due to greater deformation in the surrounding areas.
As one can see, the contact state between the PSSC and concrete is closely related to both the preloading pressure and the hydraulic pressure. Higher preloading pressure under the same hydraulic pressure leads to decreased contact areas. The boundary condition of the inlet changes after the test head is removed, and the unbalanced hydraulic force occurs under the excitation of internal hydraulic pressure. Due to the asymmetry shape of the PSSC, the unbalanced hydraulic force induces a torsion of the PSSC in the direction of the flow on the horizontal plane based on the force analysis [24]. The torsion leads to the structural horizontal deflection and premature contact between the PSSC and the surrounding concrete at the inlet and the front half. These interesting phenomena of premature and delayed closure of the preloading clearance occur because of the combined effect of the unevenness of the hydraulic pressure and the imbalance in hydraulic stress. Specifically, when the preloading pressure is lower than the hydraulic pressure, a few regions remain unclosed, whereas when it is higher, certain areas of the spiral case are already in contact with the concrete. The variations in contact state help reveal the impact of different preloading values on the dynamic response between the PSSC and concrete structure. The interesting phenomena also demonstrate the noticeable calculation errors in simplified methods for modeling preloading spiral cases.
4.3.2. Deformation Characteristics
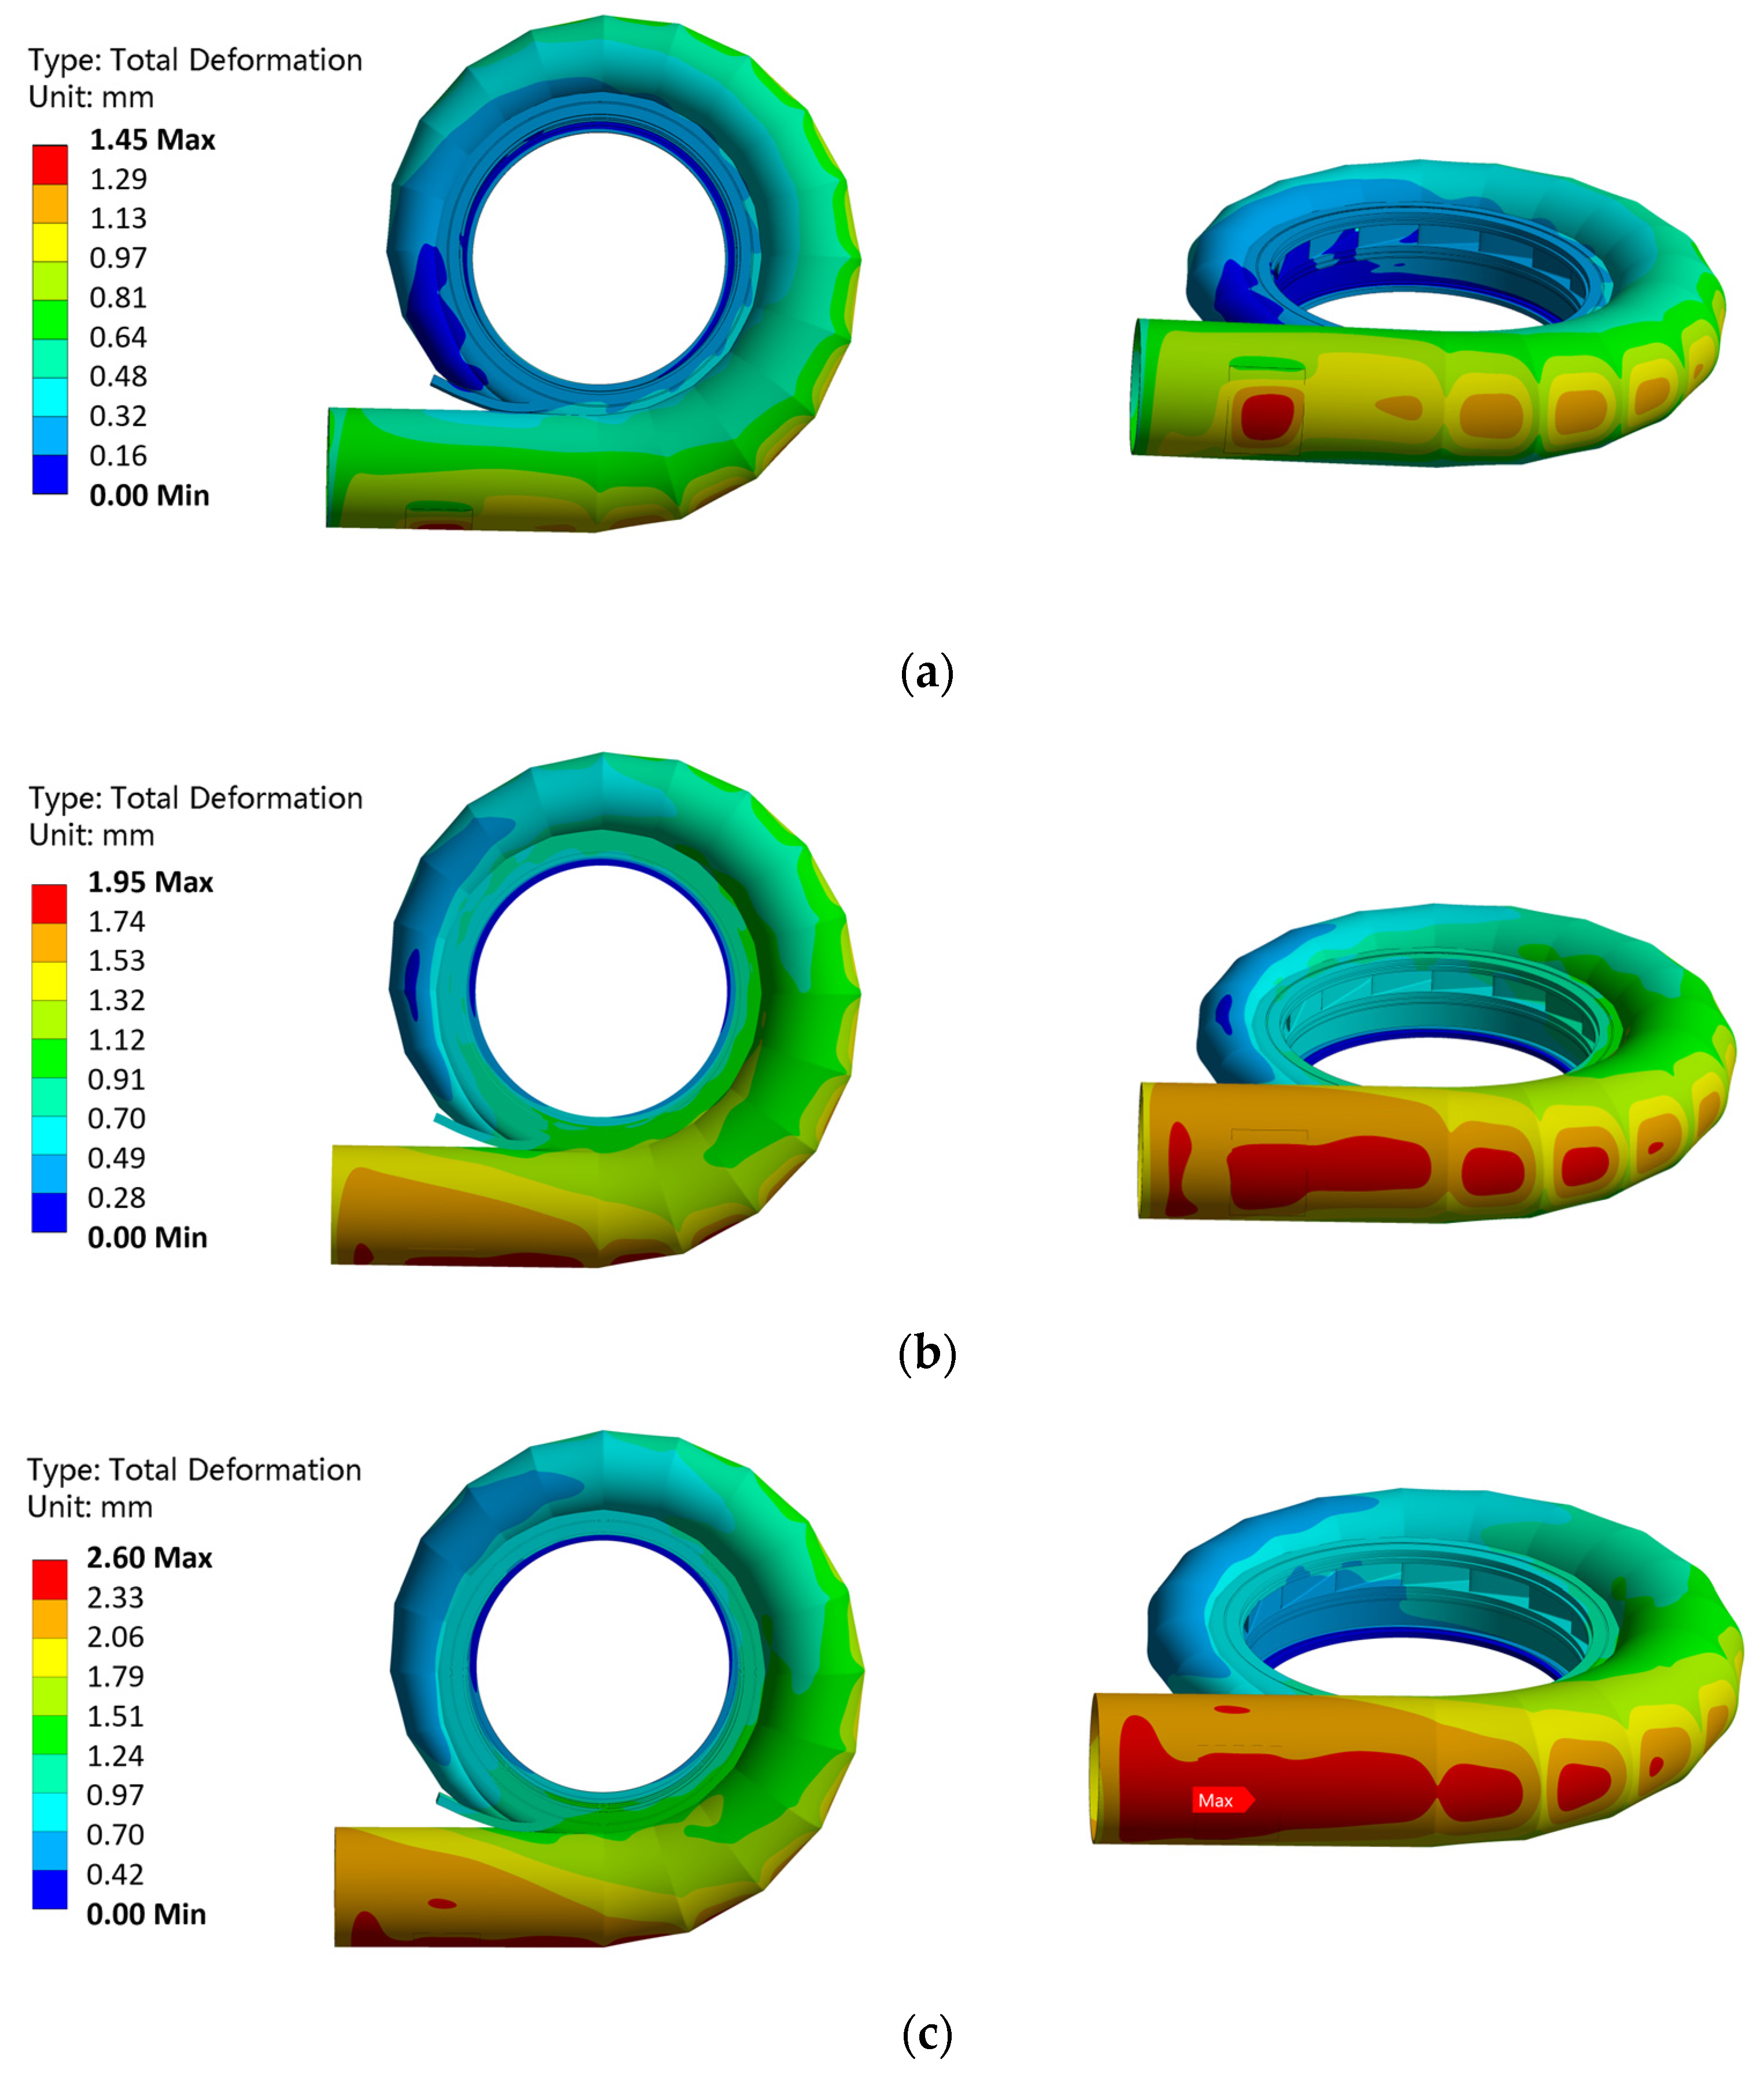
The huge hydraulic pressure acting on the inner surface of the PSSC resulted in relatively large deformation on the waist between each section, and the maximum deformation occurs at the mandoor where there is no support from concrete, as shown in Figure 19. The initial preloading clearance, caused by the shrinkage of PSSC, increases with higher preloading pressures, allowing for greater deformation under the same hydraulic pressure. The large deformation of the PSSC is also mainly concentrated in the front half, with an increase near the nose vane. Due to the imbalanced hydraulic stress of the test head removal, the deformation in the straight inlet pipe is at a larger level under higher preloading pressure.

Figure 19.
The total deformation distribution of the PSSC under different preloading pressure; (a) 3.2 MPa; (b) 4.564 MPa; (c) 6.52 MPa.
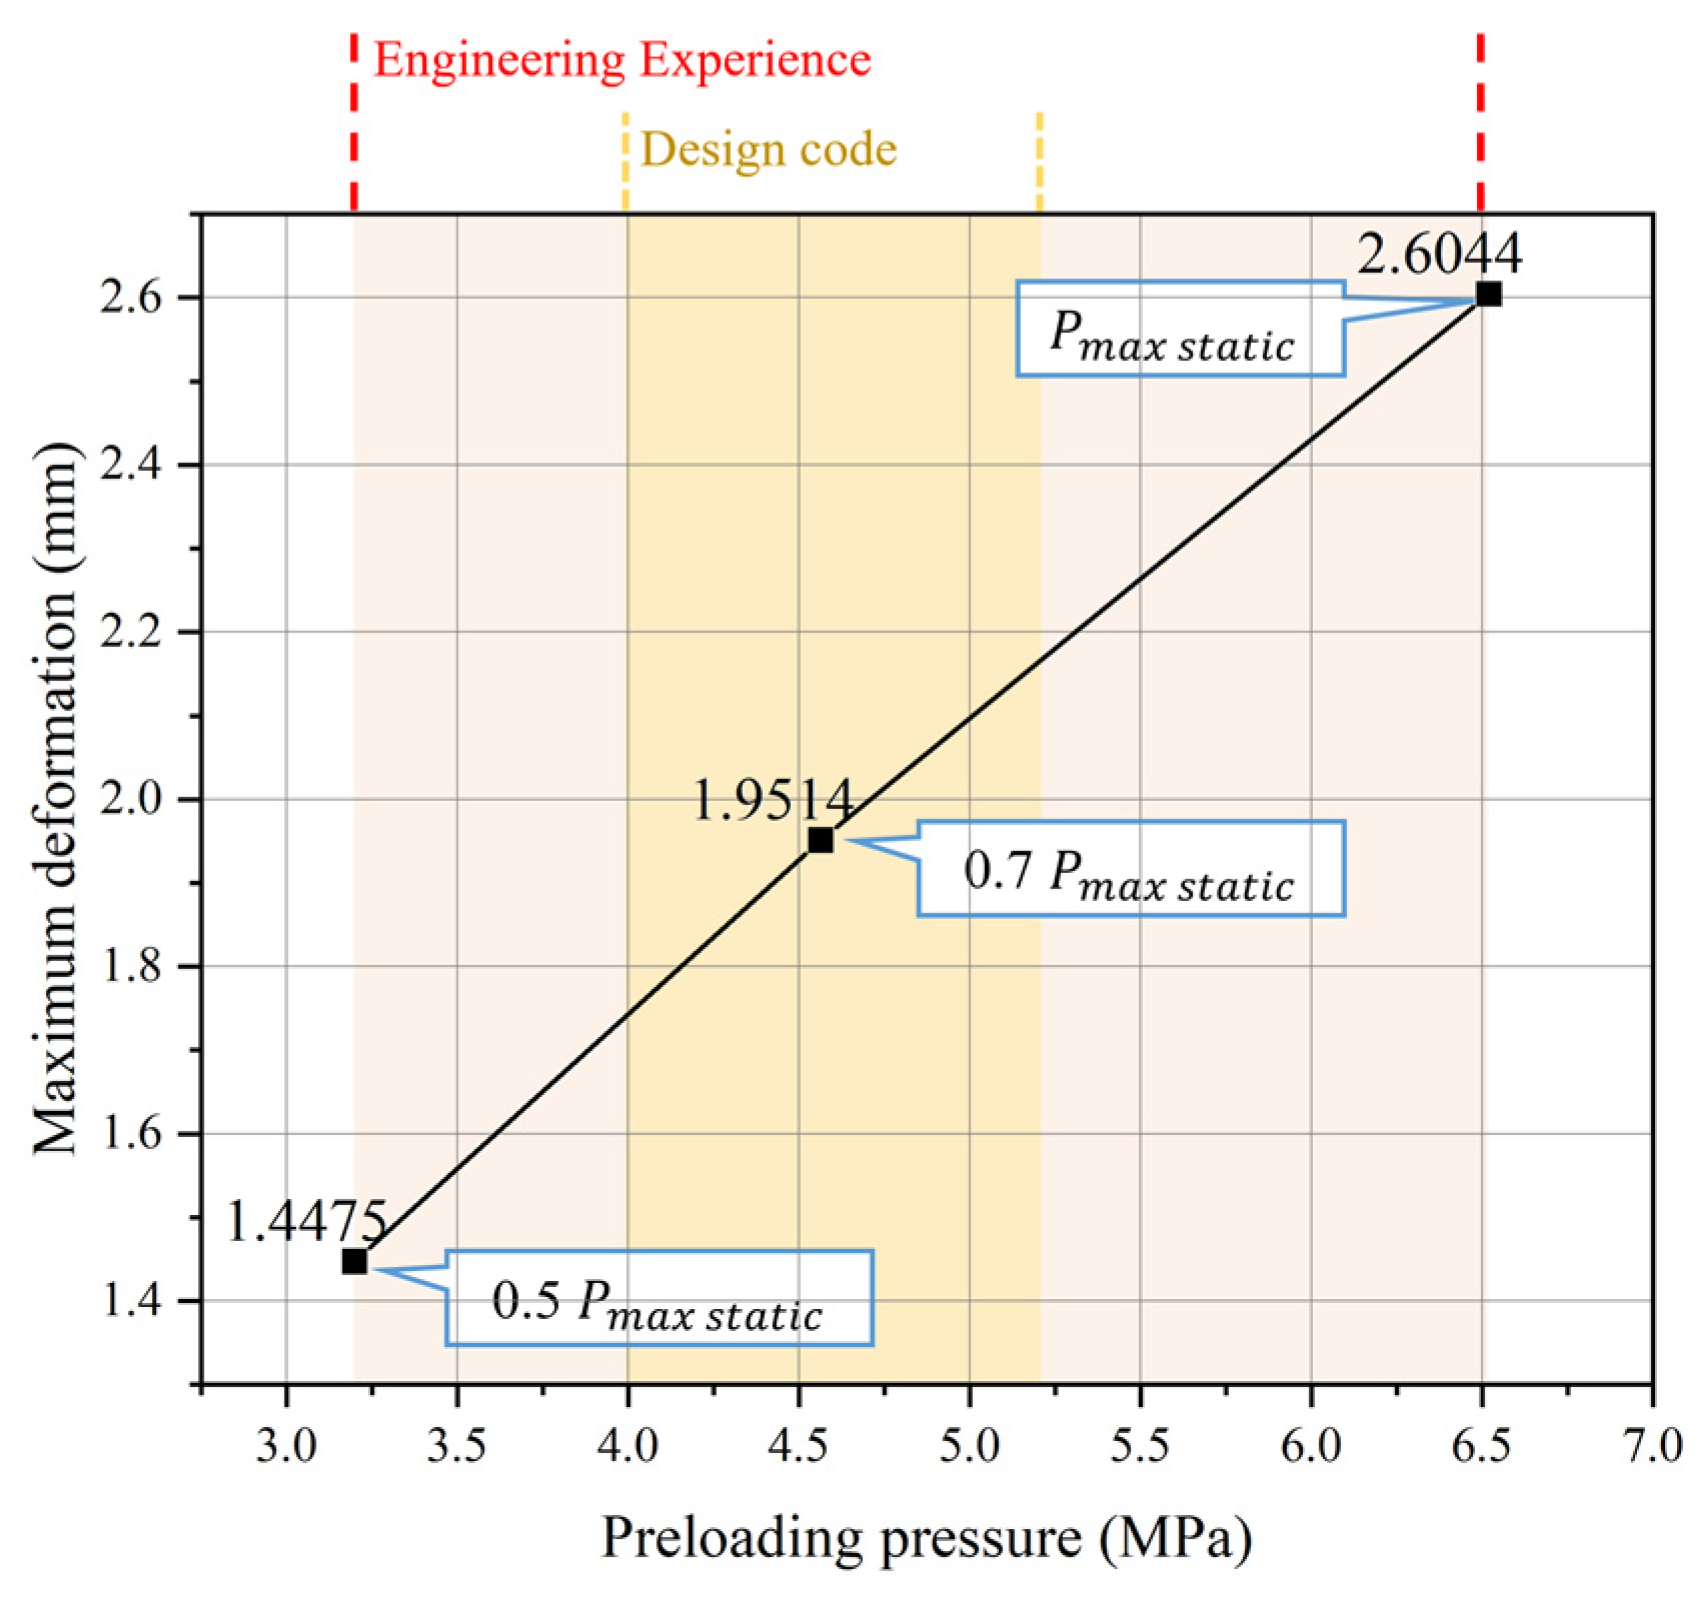
In engineering practice, the preloading pressure is chosen within 0.5 to 1.0 times the maximum static head (red area in Figure 20). Design codes for the hydropower house recommend the preloading pressure to be 0.6 to 0.8 times the maximum static head (yellow area in Figure 17). The relationship between the maximum deformation and the preloading pressure can be represented using the point plot in Figure 15. The maximum deformations of the PSSC under three preloading pressures are 1.4475 mm, 1.9514 mm and 2.6044 mm, respectively, which shows a positive linear correlation within these two preloading pressure ranges.
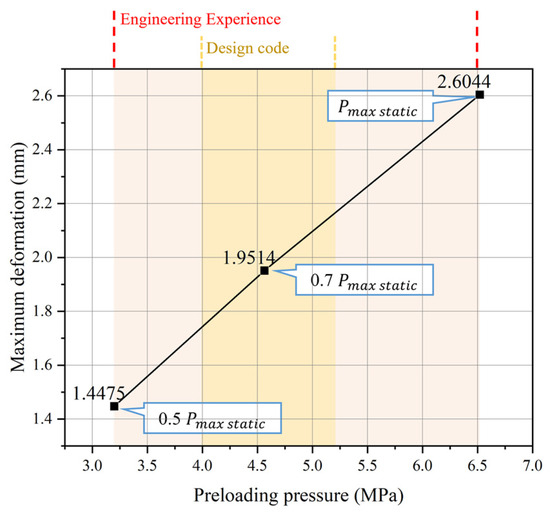
Figure 20.
The maximum deformation of the PSSC versus the preloading pressure.
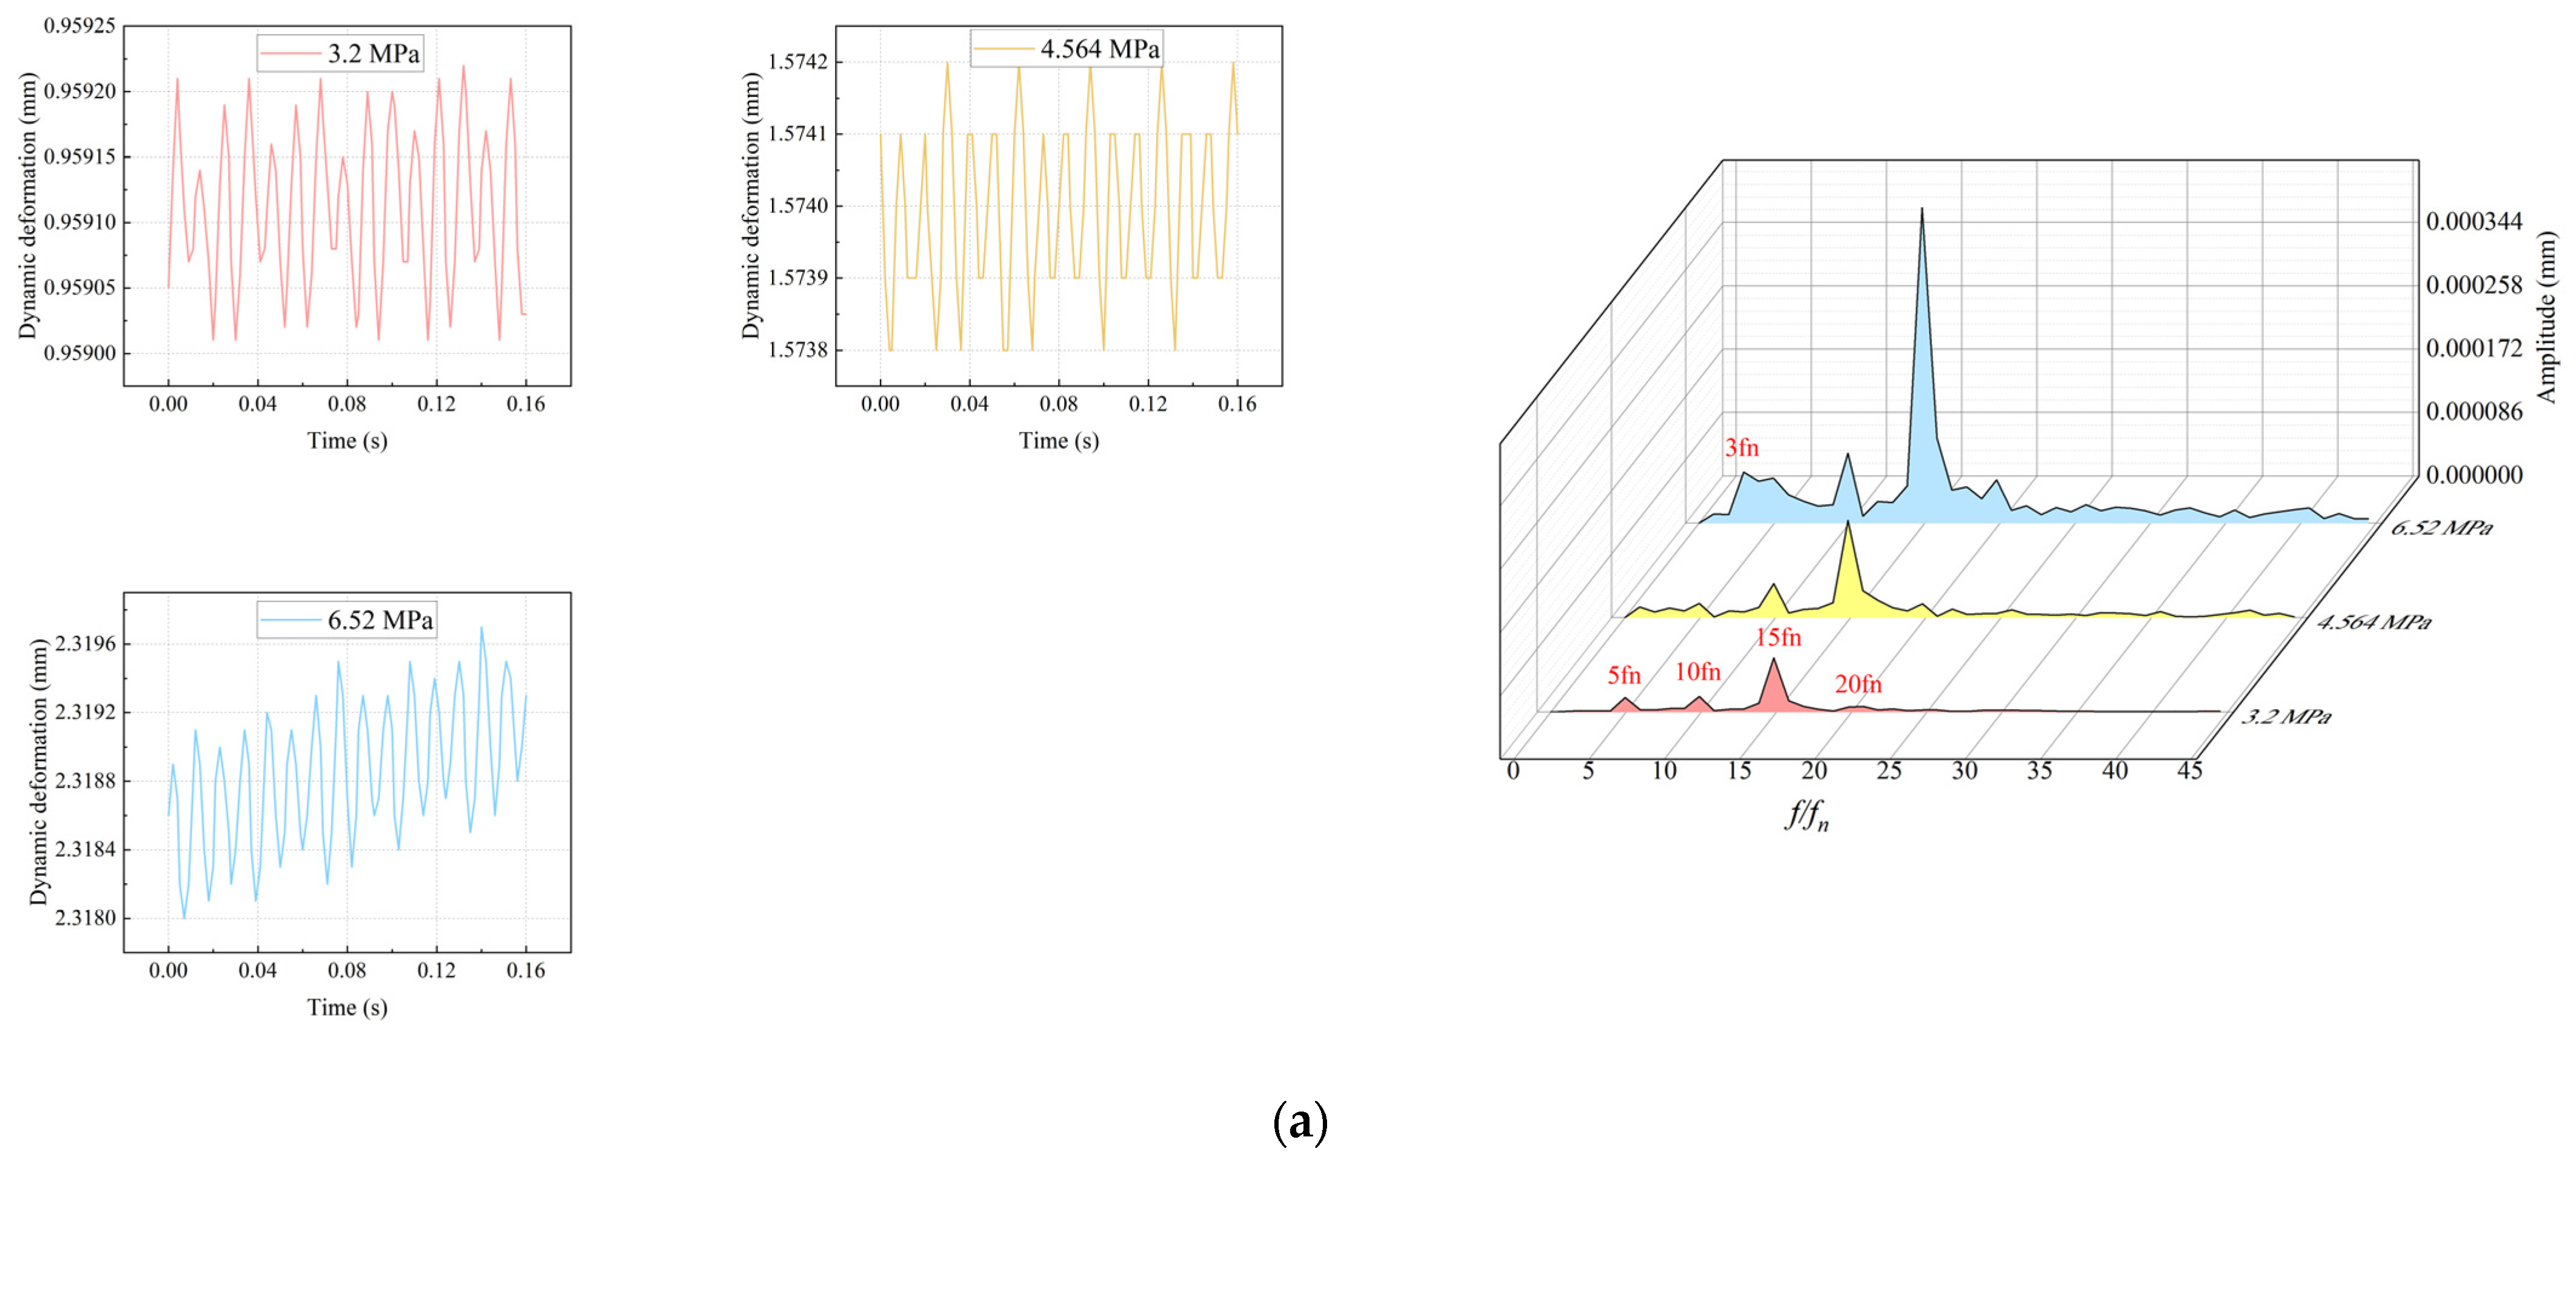
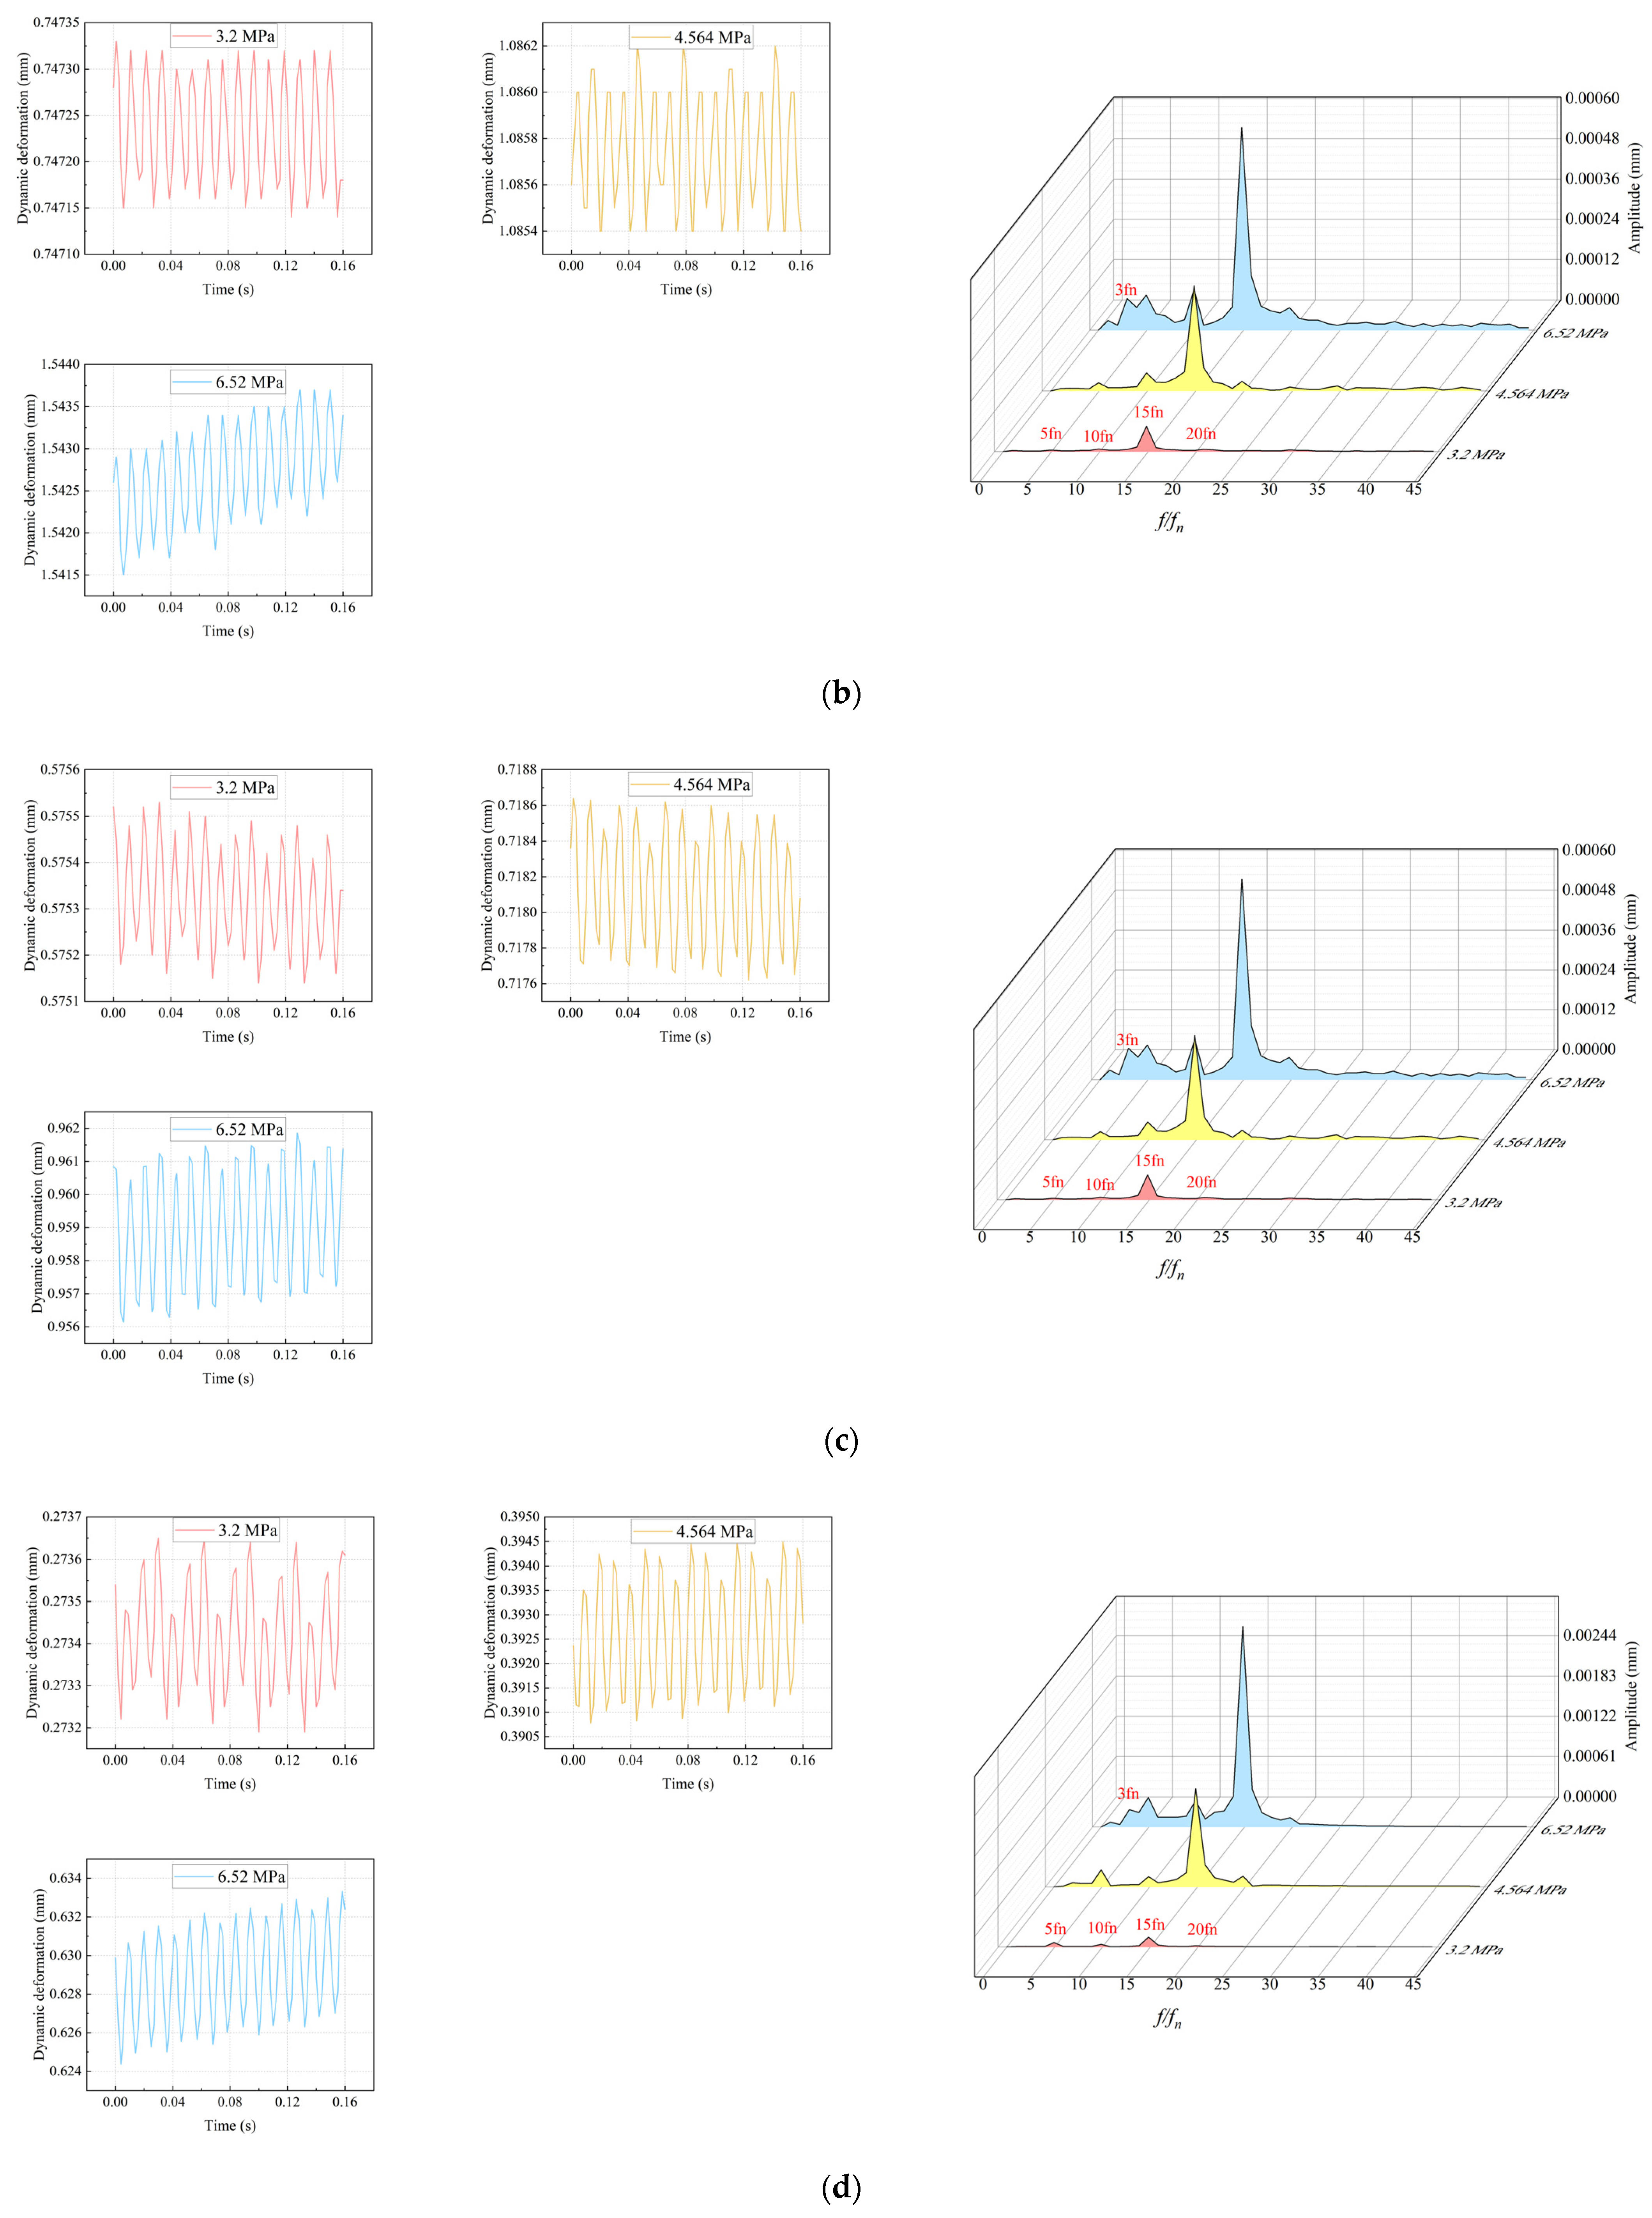
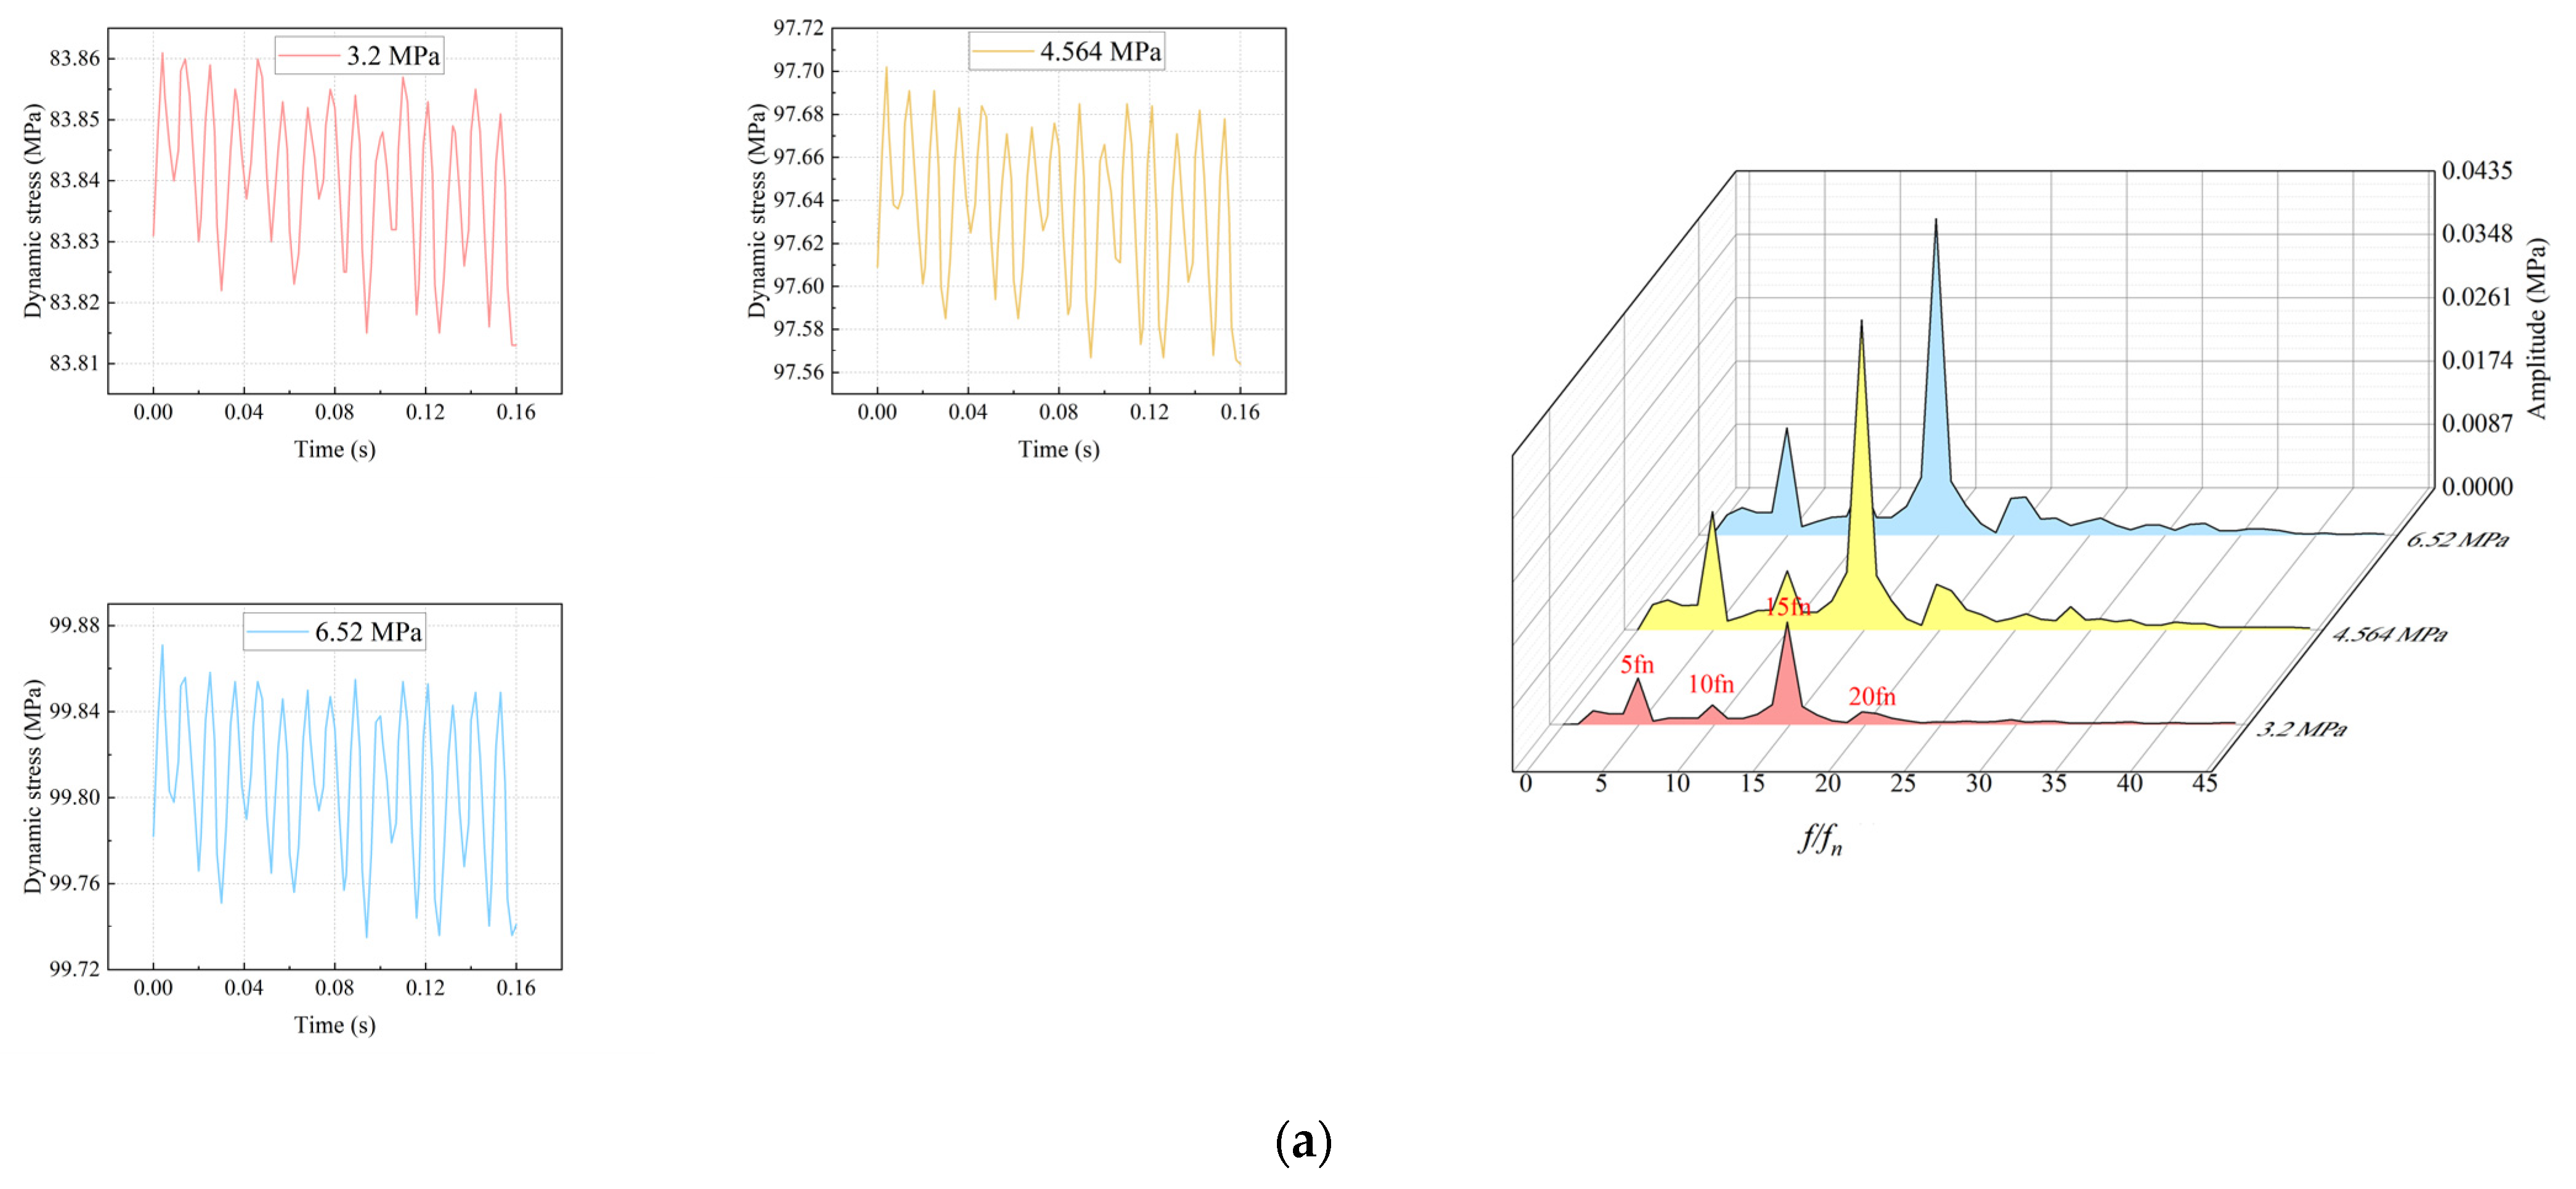
Having discussed the spatial distribution under different preloading pressures, the time–frequency characteristics of flow-induced responses during operation will now be analyzed. The time history and frequency spectra of dynamic deformation of the PSSC can reflect differences in vibration mode. As shown in Figure 21, the tendency of these four monitoring points follows the same pattern, and the dominant frequency is 15 . Due to the analysis of 15 in Figure 14, it is speculated that the RSI is the dominant factor in the deformation distribution.
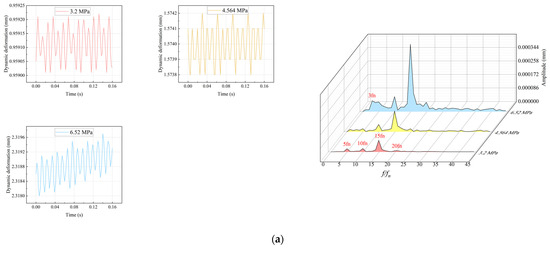
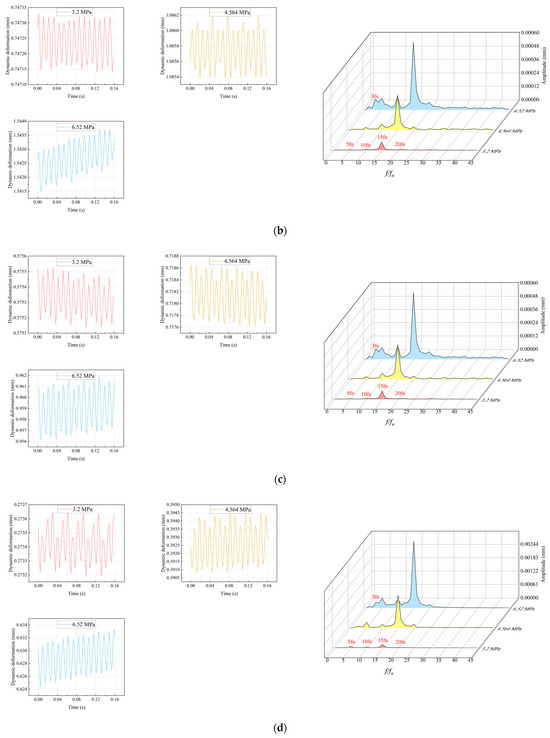
Figure 21.
The time history and frequency spectra of dynamic deformation of the PSSC under different preloading pressures; (a) n1; (b) n3; (c) n5; (d) n7.
Similar to the pressure fluctuation in the spiral case, variations in preloading pressure have minimal impact on the first four dominant frequencies of dynamic deformation, which remain at 5 , 10 , 15 , 20 . As one can see, hydraulic pressure fluctuation plays a vital role in determining the dominant frequency of dynamic deformation. However, the amplitudes of these frequencies change significantly under different preloading pressures, increasing as the preloading pressure rises. The maximum amplitude is located at n7 near the nose vane, and the value is below 0.00244 mm. It is concluded that optimizing the selection of preloading pressure can enhance the vibration performance of the PSSC.
4.3.3. Stress Characteristics
When the PSSC is contact with concrete, the hydraulic pressure is jointly borne by both, leading to different structural stress conditions under the same internal water pressure but different preloading values. The internal hydraulic pressure remains constant, so the flow-induced deformation and stress responses exhibit similar characteristic relationships under different preloading pressures. The difference lies in how varying preloading pressures lead to different preloading clearance distributions, which affect the joint load-bearing capacity of the PSSC and concrete. As the preloading pressure increases, the deformation and stress at the inner edge, straight pipe section, and waistline of the PSSC increase sequentially.
The maximum value of stress is located at the tong of the PSSC under preloading pressure of 6.52 MPa, which can reach 247.01 MPa but only in a small region. The overall stress distribution of the PSSC is within the allowable stress range. To better illustrate the distribution, the legend is standardized to 0–200 MPa for the comparison of high-stress regions under different preloading pressure in Figure 22. As a preloading pressure of 3.2 MPa, most of the hydraulic pressure loaded onto the PSSC is balanced by both itself and the concrete support. Therefore, the overall stress is relatively small. However, since the pressure is transmitted to the stay ring through the head cover, resulting in stress concentration at the rounded corners on the outlet side of the stay vane. Obviously, the equivalent stresses in the majority of the PSSC are below 100 MPa, with increases only near the nose guide vane and mandoor. For 4.564 MPa and 6.52 MPa, the stress distributions share similar characteristics. According to the analysis in Figure 18, the PSSC only partially contacts with the concrete at these two pressures, leaving substantial regions where only the PSSC suffers from the hydraulic pressure. This results in higher stress in corresponding regions. Under these two preloading pressures, the high-stress region occurs near the straight inlet pipe and the waist, wherein the stressed region in the straight inlet pipe is larger at 6.52 MPa.
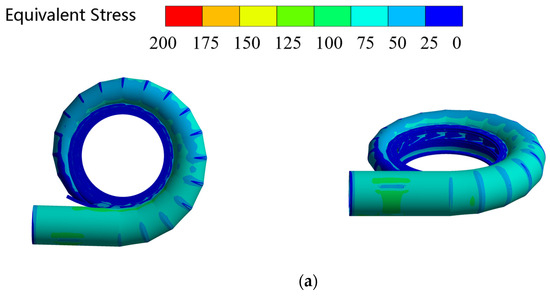
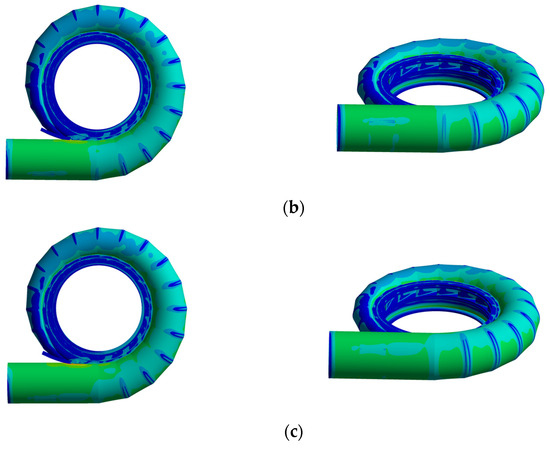
Figure 22.
The equivalent stress distribution of the PSSC under different preloading pressures; (a) 3.2 MPa; (b) 4.564 MPa; (c) 6.52 MPa.
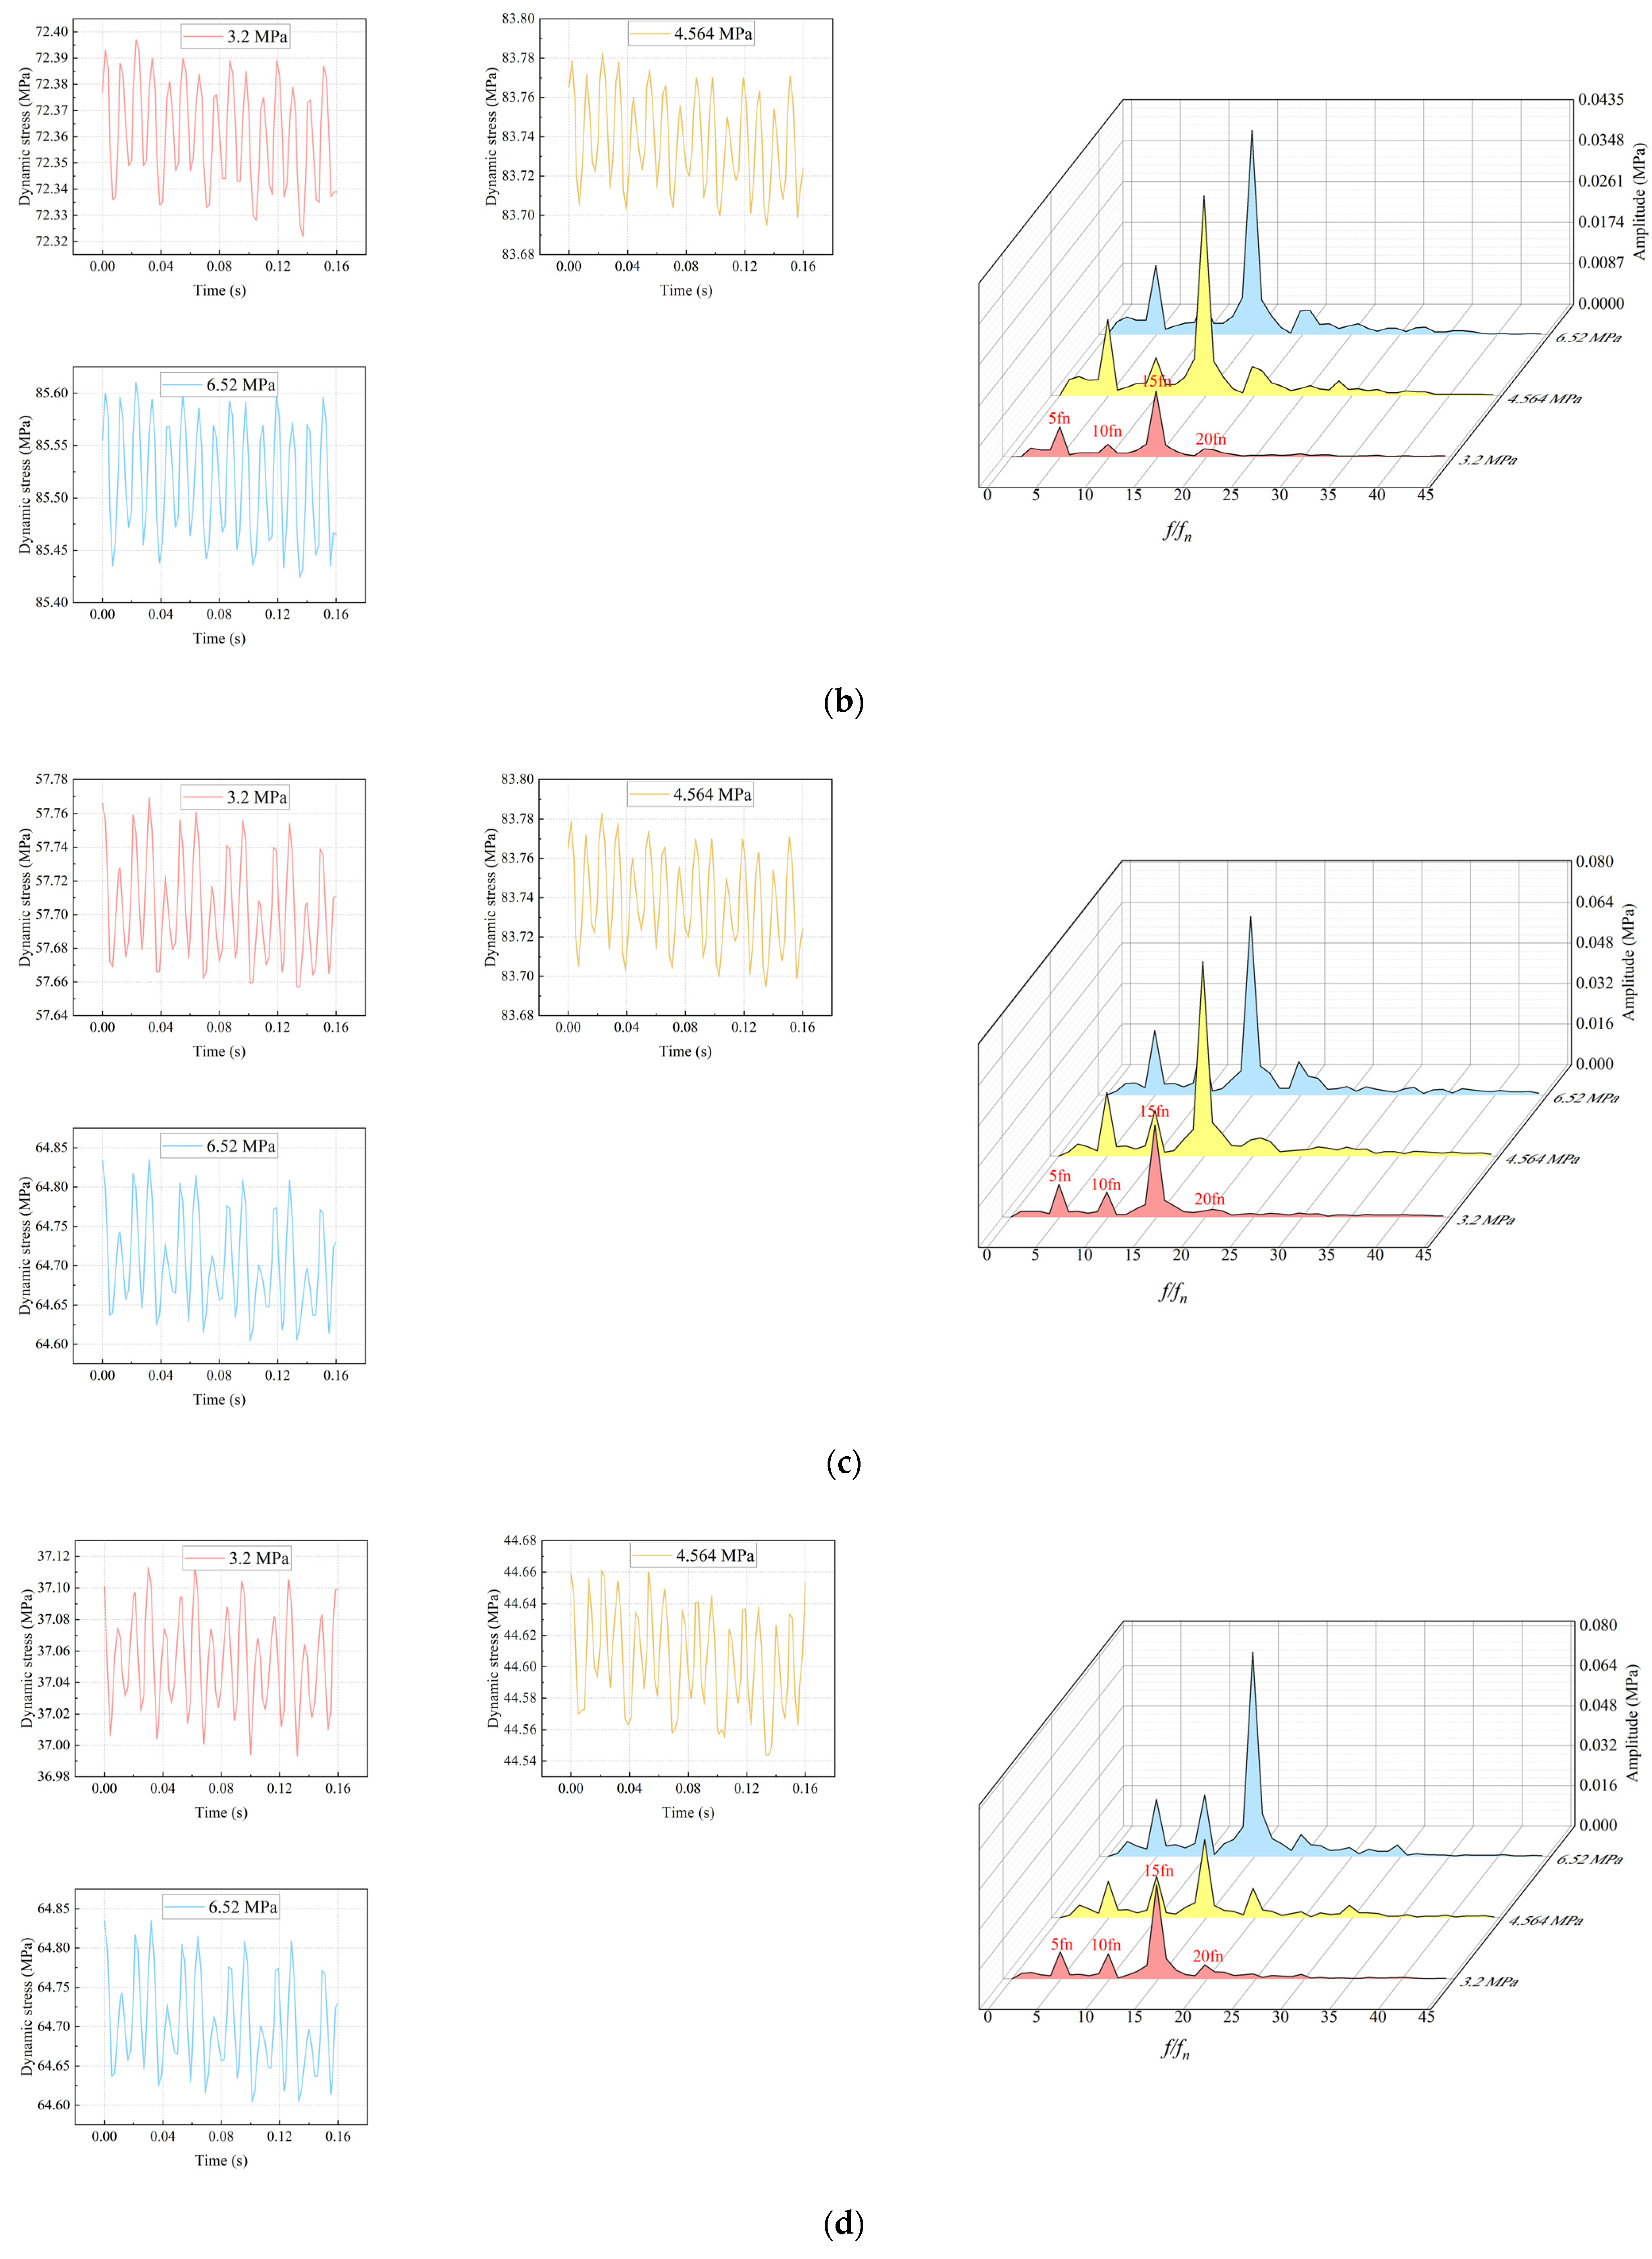
As for the time–frequency characteristics of dynamic stress, the results under different preloading pressure exhibit consistent variation patterns in Figure 23, indicating that the preloading pressure has little effect on the dominant frequency of the total deformation in PSSC, but it affects the amplitude significantly. The dominant frequency of the dynamic stress in PSSC is the same as the RSI frequency (15 ), and the amplitudes of 15 increase with the rise in preloading pressure. The high-amplitude stress regions along the axial direction are concentrated in the rear half of the PSSC. Compared to its internal hydraulic pressure, the stress fluctuations are within a safe range. Among these measurement points, the amplitude near the nose vane (n7) reaches a maximum of 0.082 MPa under the preloading pressure of 6.52 MPa.
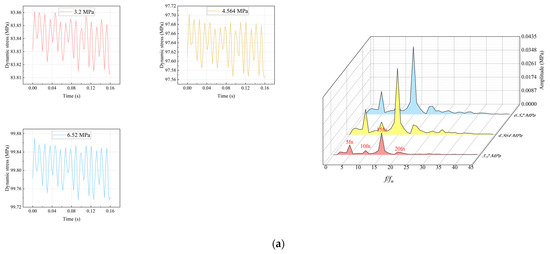
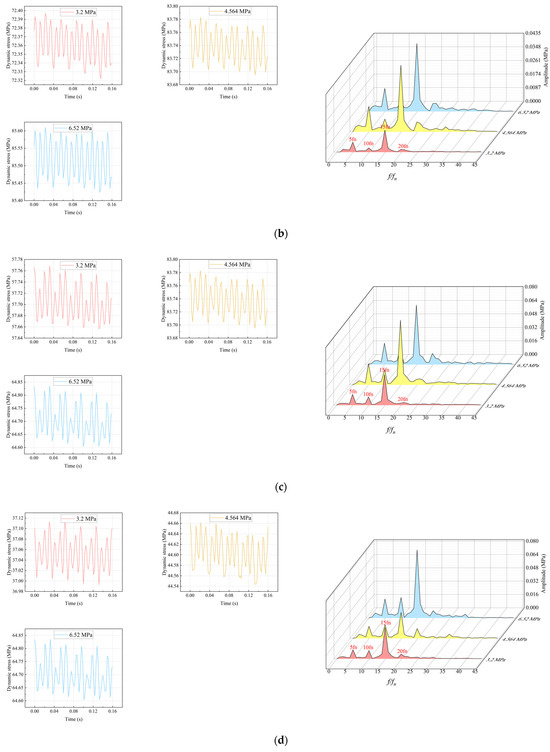
Figure 23.
The time history and frequency spectra of dynamic stress of the PSSC under different preloading pressures; (a) n2; (b) n4; (c) n6; (d) n8.
Using maximum principal stress to measure concrete strength, the risk of cracking is considered when stress exceeds the tensile limit of concrete (3 MPa), as shown in Figure 24 in the red region. At a preloading pressure of 3.2 MPa, the inner wall of the concrete uniformly bears the load transmitted from the spiral case due to the complete contact status. The stress concentration occurs only in a small part near the nose vane. In practical engineering, the steel bar embedded in concrete significantly enhances the overall tensile strength of the material, while the concrete model in this paper does not take the steel bar into account. It implies that the concrete in the red areas may not have cracked in reality due to the support of the steel bar. However, the red region still represents regions of high stress in the concrete, which requires significant attention.

Figure 24.
The maximum principal stress distribution of the concrete under different preloading pressures; (a) 3.2 MPa; (b) 4.564 MPa; (c) 6.52 MPa.
When the preloading pressure is much higher than the hydraulic pressure, the contact regions shown in Figure 18 reduce as the preloading pressure increases, which also means that the PSSC is no longer in complete contact with the concrete. As for PSSC, the support provided by the concrete is balanced with the inside hydraulic pressure. Therefore, as the contact area decreased, the concrete contact regions bear increased loads at higher preloading pressures under the same hydraulic pressure, resulting in localized stress concentration zones. This phenomenon introduces a risk of cracking in the concrete regions that come into contact with the PSSC. For 4.564 MPa and 6.52 MPa, a high-stress region is located near the inner edge and the nose vane. Specially, the concrete in contact with the inner edge and nose vane is too thin to withstand excessive loads. Therefore, it the structure need to be reinforced with steel bars or other methods to enhance the tensile strength. Since the concrete in this area is not the primary load-bearing component of the plant, cracking here will not greatly impact the operational safety and stability of the unit.
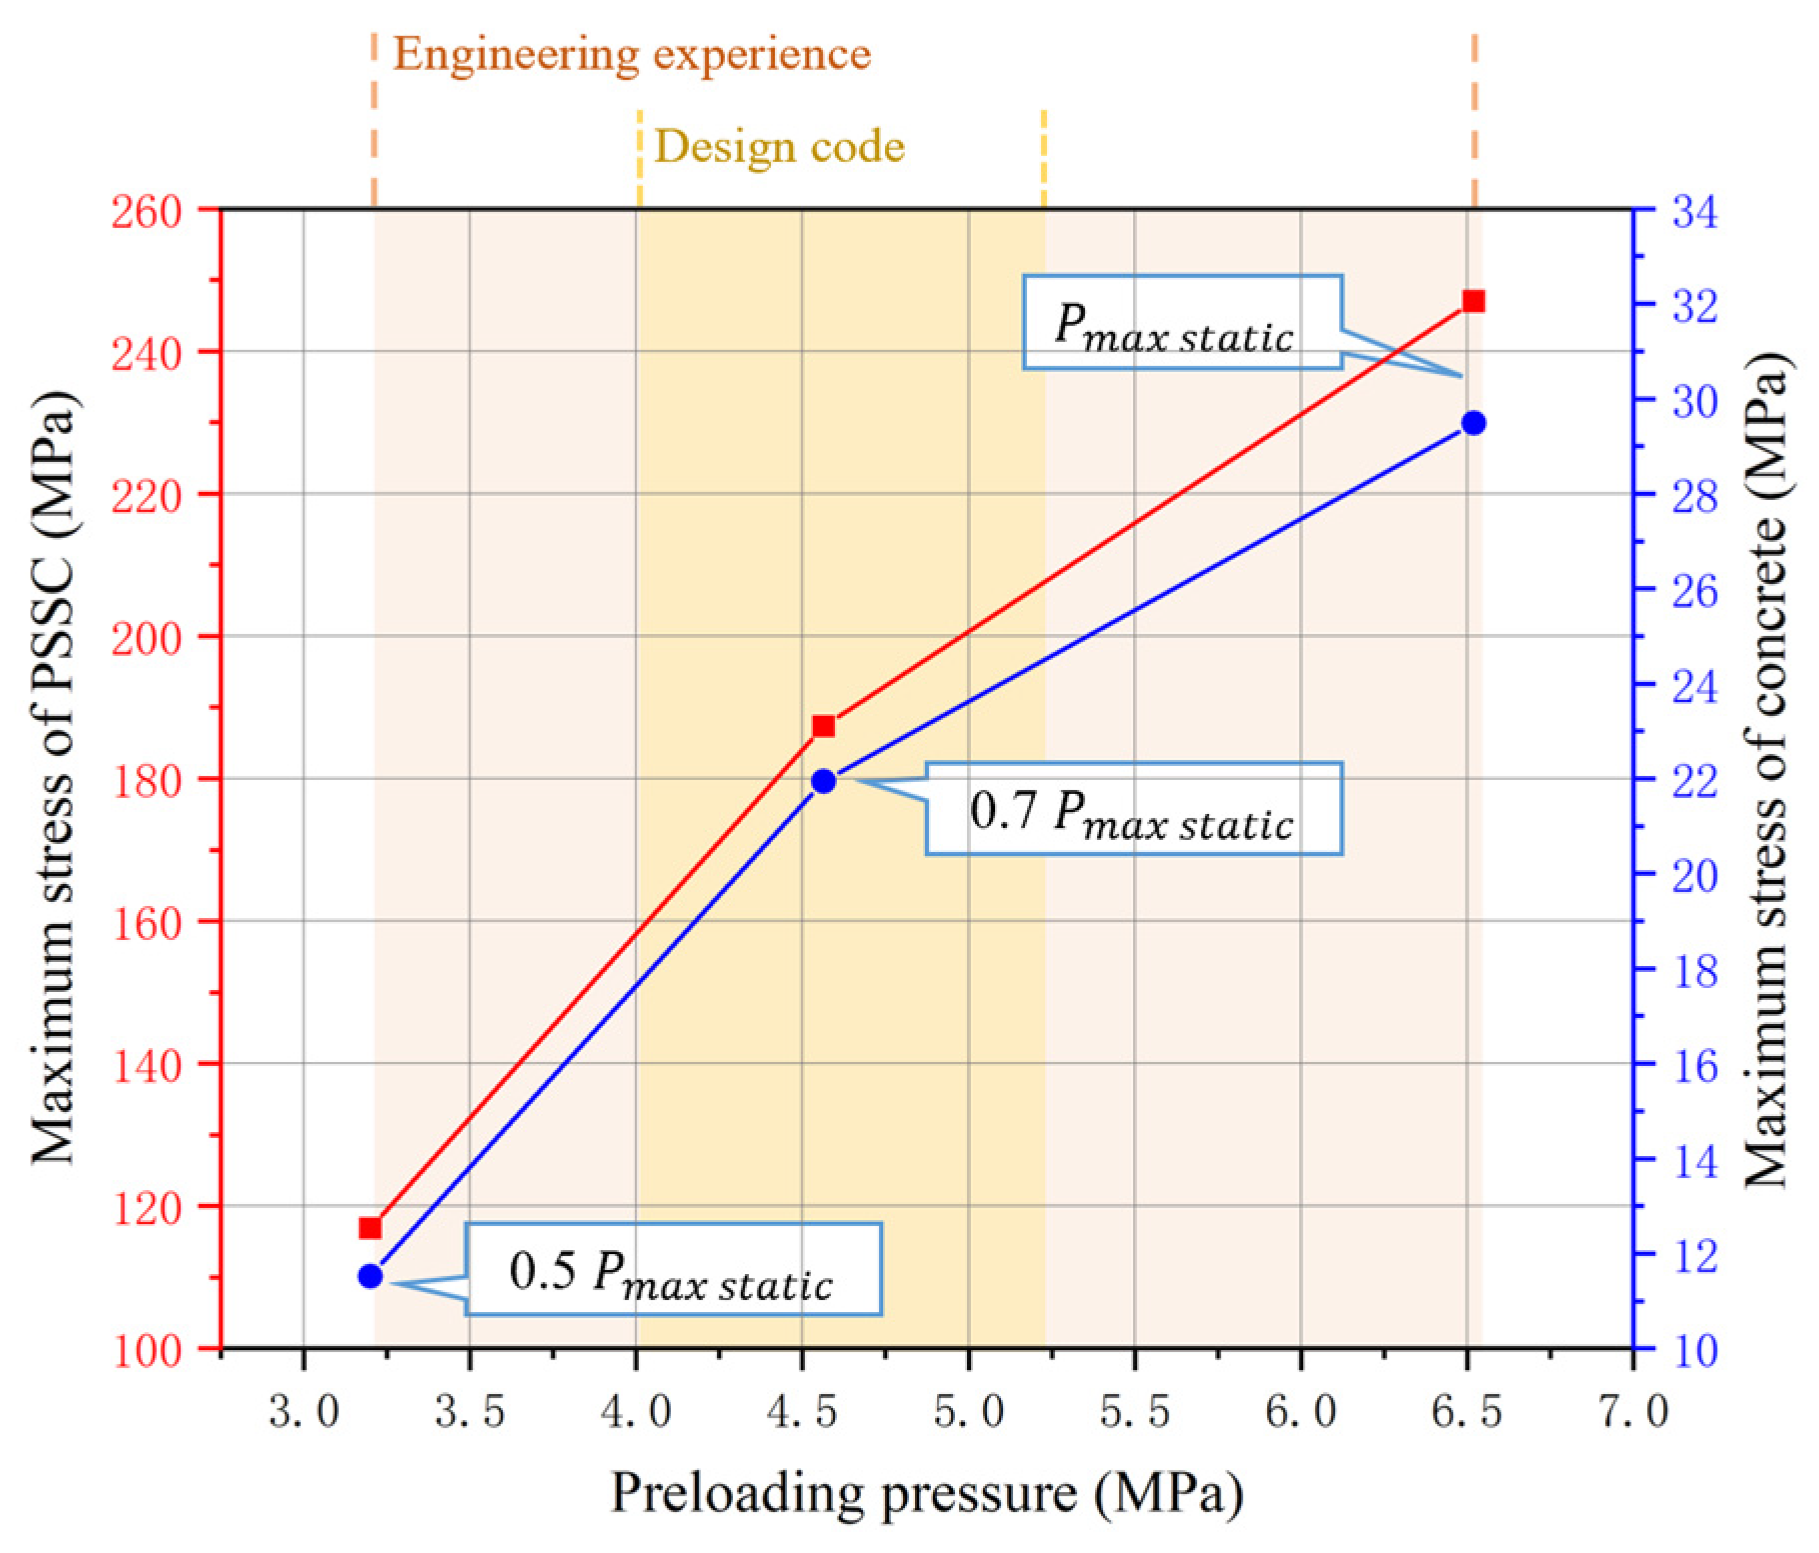
The relationships between the maximum stress of the structures and the preloading pressure are shown in Figure 25. The maximum stress in both the PSSC and concrete also exhibits a nearly linear positive correlation with preloading pressure, with a reduced rate of increase at higher preloading pressures. It demonstrates that higher preloading pressure requires the PSSC to bear greater loads, while also increasing stress values in the localized stress concentration regions of concrete.
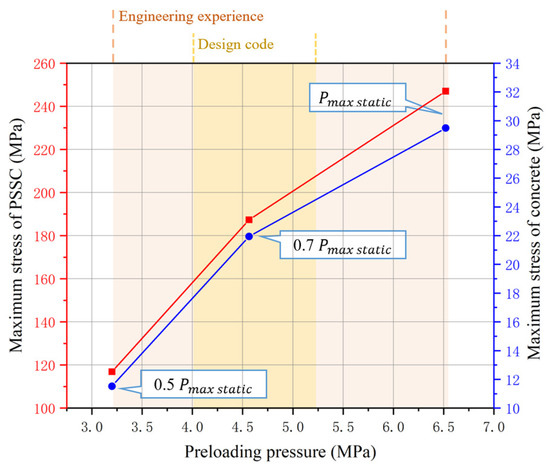
Figure 25.
The maximum stress of the PSSC and concrete versus the preloading pressure.
4.3.4. Study Limitations
According to the engineering practices, the study limitations in this paper can be summarized as follows:
- The applicability of this study is limited by the fact that the concrete model does not account for the presence of a steel bar. To better analyze potential locations of structural failure in reinforced concrete, a concrete model that includes steel bars and reinforcement ratios should be established.
- The quantity of the chosen preloading pressure is insufficient for an in-depth analysis of the relationship between preloading and the structural response. In future research, FSI models with a wider range of preloading pressure should be analyzed, such as 0.6, 0.8, and 0.9 of the maximum static head and so on.
5. Conclusions
In this paper, the flow characteristics and hydrodynamic structural responses of the PSSC and concrete with different preloading pressures under turbine rated conditions are analyzed based on fluid–structure interaction theory and the nonlinear contact model. The key conclusions drawn are as follows.
The hydraulic performance shows stable flow characteristics with a smooth streamline. The short and long runner blades lead to different degrees pressure fluctuations transmitted to the vanes and the spiral case space. The scope variation of RSI and RBP causes the changes in the dominant frequencies of the pressure fluctuation across different domains. The dominant frequency of the spiral case is 15 , while that of the vaneless space is 5 .
The hydrodynamic responses of the PSSC under different preloading pressures exhibit consistent variation patterns, and their dominant frequencies (15 ) are mainly determined by hydraulic pressure fluctuations. Higher preloading pressure under the same hydraulic pressure leads to decreased contact area. The combined effects of the initial preloading clearance, imbalanced hydraulic forces, as well as pressure fluctuations leads to the phenomena of premature and delayed closure of the preloading clearance, resulting in uneven distribution of the deformation and stress.
The preloading pressure has a minimal impact on the dominant frequency of the dynamic deformation and stress in PSSC, but it affects the amplitudes significantly. As for the preloading pressure of 0.5, 0.7 and 1 times the maximum static pressure (6.52 MPa), 0.5 times is the optimal for the studied spiral case based on the hydrodynamic results. The maximum values and amplitudes in the deformation and stress of the PSSC increase with higher preloading pressure. The maximum deformation located near the mandoor should be reinforced under three preloading pressures and can reach 1.45 mm, 1.95 mm and 2.6 mm, respectively, and the stresses are all within the allowable range. The amplitudes of the deformation and stress are below 0.003 mm and 0.082 MPa. The maximum stress of the concrete also exhibits a nearly linear positive correlation with preloading pressures due to the stress concentration in the contact areas, which have the risk of cracking.
Overall, the analysis contributed to an in-depth understanding on the dynamic behavior of the PSSC and concrete and the selection of the preloading pressure. The proposed simulation method of the initial preloading clearance helps enhance the accuracy of structural response simulations, which can also be helpful for optimizing the design of the unit. Further works are needed to analyze the structural response under higher preloading pressure to provide a more detailed quantitative description of the impact mechanism and develop a layered pouring model of concrete, including a steel bar, for better simulation accuracy.
Author Contributions
Conceptualization, Y.L. and Z.W.; methodology, Y.L.; software, Y.L. and S.Z.; validation, Y.L. and S.Z.; investigation, Y.L., S.Z., Z.L. and Q.R.; data curation, Q.R.; writing—review and editing, Z.L.; project administration, Z.L.; funding acquisition, Z.L., Q.R. and Z.W. All authors have read and agreed to the published version of the manuscript.
Funding
This research was funded by the Science and Technology Project of State Grid Xinyuan Group Company Limited under the Contract No. SGXYKJ-2023-110.
Data Availability Statement
Data are contained within the article.
Conflicts of Interest
Authors Zonghua Li and Qingfeng Ren were employed by the State Grid Xinyuan Hebei Yixian Pumped Storage Co., Ltd. The remaining authors declare that the research was conducted in the absence of any commercial or financial relationships that could be construed as a potential conflict of interest. The authors declare that this study received funding from the Science and Technology Project of State Grid Xinyuan Group Company Limited. The funder was not involved in the study design, collection, analysis, interpretation of data, the writing of this article or the decision to submit it for publication.
Abbreviations
The following abbreviations are used in this manuscript:
| PSSC | preloading steel spiral case |
| FSI | fluid–structure interaction |
| CFD | computational fluid dynamics |
| RSI | rotor–stator interaction |
| RBP | runner blades passing |
| FEM | finite element method |
| RANS | Reynolds-averaged Navier–Stokes |
| SST | shear stress transport |
| ALM | augmented Lagrange method |
| FFT | fast Fourier transformation |
References
- National Energy Administration. Medium and Long Term Development Planning of Pumped Storage (2021–2035); National Energy Administration: Beijing, China, 2021. [Google Scholar]
- Cao, J.; Liu, X.; Zeng, C. Numerical simulation on the flow characteristics of a pump-turbine in load rejection process. J. Phys. Conf. Ser. 2024, 2752, 012091. [Google Scholar] [CrossRef]
- Kuznetsov, N.; Yuldashev, M.; Yuldashev, R. Analytical-numerical analysis of closed-form dynamic model of Sayano-Shushenskaya hydropower plant: Stability, oscillations, and accident. Commun. Nonlinear Sci. Numer. Simul. 2021, 93, 105530. [Google Scholar] [CrossRef]
- Khalfaoui, K.; Zorn, M.; Ségoufin, C.; André, F.; Kerner, J.; Riedelbauch, S. Dynamic stress prediction for a Pump-Turbine in Low-Load Conditions: Experimental validation and phenomenological analysis. Eng. Fail. Anal. 2024, 162, 108428. [Google Scholar] [CrossRef]
- Zanetti, G.; Cavazzini, G.; Santolin, A.; Nascimben, F. Enhancing operational stability of a reversible pump-turbine through blade lean design. J. Energy Storage 2024, 92, 112218. [Google Scholar] [CrossRef]
- Xia, M.; Zhao, W.; Wang, Z.; Qiao, M. Pulsation Stability Analysis of a Prototype Pump-Turbine during Pump Mode Startup: Field Test Observations and Insights. Processes 2024, 12, 838. [Google Scholar] [CrossRef]
- Zhang, Q.-L.; Hu, L.; Gao, X.-F. Fatigue life prediction of steel spiral cases in pumped-storage power plants: Factors to be considered. Eng. Fail. Anal. 2024, 157, 107908. [Google Scholar] [CrossRef]
- Wu, Y.; Su, C.; Xu, H. Study on Optimization of Preloading Water Head of Preloading Filling Spiral Case. J. China Three Gorges Univ. 2019, 41, 9–12. [Google Scholar]
- Qian, J. Analysis of Combined Stress and Structural Reinforcement Design for the Spiral Case and Large Concrete of the Xinjiang Gazi Hydropower Station. Tech. Superv. Water Resour. 2020, 4, 217–220+247. [Google Scholar]
- Zhang, Z.; Wu, H.; Shi, C.; Zhang, Q.; Su, K.; Hu, L. Numerical modeling of preloaded filling spiral case structure. Lat. Am. J. Solids Struct. 2018, 15, e110. [Google Scholar] [CrossRef]
- Yang, F.; Wu, H. Structural Study on the Spiral Case of Large Hydraulic Turbines. Eng. J. Wuhan Univ. 2004, 37, 46–49. [Google Scholar]
- Sun, H.; Wu, H.; Wang, S. Three-dimensional Nonlinear Damage Analysis of Combined Bearing Structure of Spiral Case Keeping Constant Internal Pressure. Eng. J. Wuhan Univ. 2010, 43, 589–592+598. [Google Scholar]
- Wang, H.; Huang, J.; Wang, R. Research on Stress Analysis Method for Periphery Concrete of Steel Spiral Case Keeping Internal Water Pressure. China Rural Water Hydropower 2007, 6, 131–133+136. [Google Scholar]
- Gao, X.; Fu, D.; Wu, H. Embedment of Steel Spiral Cases in Concrete: Lessons from a Structural Deformation Accident in China. Appl. Sci. 2022, 12, 8395. [Google Scholar] [CrossRef]
- Sun, C.; Zhang, P.; Jiang, Z.; Fu, D.; Fei, B. Rationality Analysis of the Preloading Water Head of the Spiral Case in Zhen’an Pumped Storage Power Station. Northwest Hydropower 2022, 5, 98–102. [Google Scholar]
- Rempel, G.I.; Dolgikh, A.P. Stress-Strain Analysis of Turbine Blocks with Steel-Lined Reinforced Concrete Spiral Case of High-Head Hydraulic Power Plants. Power Technol. Eng. 2023, 57, 214–227. [Google Scholar] [CrossRef]
- Todorov, G.; Kralov, I.; Kamberov, K.; Zahariev, E.; Sofronov, Y.; Zlatev, B.N. An Assessment of the Embedding of Francis Turbines for Pumped Hydraulic Energy Storage. Water 2024, 16, 2252. [Google Scholar] [CrossRef]
- Li, Y.; Li, X. Study on Optimization of Pressure-securing Value of Spiral Case with Pressure Secured by Filling Water. Northwest Hydropower 2016, 6, 55–58. [Google Scholar]
- Xu, X.; Ma, Z.; Zhang, H. Simulation algorithm for spiral case structure in hydropower station. Water Sci. Eng. 2013, 6, 230–240. [Google Scholar]
- Fu, D.; Wu, H.; Hu, L. Gap Closing and Contact Transferring Mechanism in Preloading Filling Spiral Case of Hydropower Station. J. Huazhong Univ. Sci. Tech. 2014, 42, 27–32. [Google Scholar]
- Fu, D.; Wu, H.; Shi, C. Study on Contact Behavior and Forced State of Stay Ring for Preloading Filling Spiral Case in Hydropower Station. J. Sichuan Univ. (Eng. Sci. Ed.) 2014, 46, 54–59. [Google Scholar]
- Fu, D.; Wu, H. A New Numerical Simulation Method of Initial Gap between Steel and Concrete after Pressure Relief in Spiral Cases Embedded under Pressurized Conditions. Water Resour. Power 2017, 35, 165–167+216. [Google Scholar]
- Zhang, Z. Force-Transferring Mechanism of Spiral Case and Characteristics of Flow-Induced Vibration of Powerhouse in Hydropower Station; Wuhan University: Wuhan, China, 2019. [Google Scholar]
- Guo, T.; Zhang, L.; Li, S. Research on Three-dimensional Simulation Algorithm of Preloading Filling Spiral Case with Non-uniform Gap. J. Hydraul. Eng. 2015, 46, 1434–1443. [Google Scholar]
- Wei, B.; Wang, F.; Xu, Z.; Jiang, Z. Nonlinear Contact Analysis on the Spiral Case Composite Structure in Pumped Storage Power Station. J. Yangtze River Sci. Res. Inst. 2015, 32, 109–114+118. [Google Scholar]
- Ouyang, J.; Chen, H.; Zhang, C. Analysis on powerhouse vibrations with spiral cases in different embedding manners for large-scale hydropower station. J. Hydroelectr. Eng. 2012, 31, 162–166+174. [Google Scholar]
- Ciocan, G.D.; Iliescu, M.S.; Vu, T.C.; Nennemann, B.; Avellan, F. Experimental Study and Numerical Simulation of the FLINDT Draft Tube Rotating Vortex. J. Fluids Eng. 2006, 129, 146–158. [Google Scholar] [CrossRef]
- Goyal, R.; Cervantes, M.J.; Gandhi, B.K. Characteristics of Synchronous and Asynchronous modes of fluctuations in Francis turbine draft tube during load variation. Int. J. Fluid Mach. Syst. 2017, 10, 164–175. [Google Scholar] [CrossRef]
- Guo, J.; Zhou, D.; Chen, H.; Wang, H. Flow-induced vibration analysis in a pump-turbine runner under transient operating conditions. Eng. Appl. Comput. Fluid Mech. 2023, 17, 2266662. [Google Scholar] [CrossRef]
- Ru, S.; Zhang, S.; Zhou, K.; Huang, X.; Huang, W.; Wang, Z. Numerical Study on the Flow and Structural Characteristics of a Large High Head Prototype Pump-Turbine under Different Operating Conditions. Processes 2023, 11, 2970. [Google Scholar] [CrossRef]
- He, Q.; Huang, X.; Yang, M.; Yang, H.; Bi, H.; Wang, Z. Fluid–Structure Coupling Analysis of the Stationary Structures of a Prototype Pump Turbine during Load Rejection. Energies 2022, 15, 3764. [Google Scholar] [CrossRef]
- Menter, F.; Kuntz, M.; Langtry, R. Ten years of industrial experience with the SST turbulence model. Turbul. Heat Mass Transf. 2003, 4, 625–632. [Google Scholar]
- Trivedi, C.; Cervantes, M.J.; Gandhi, B.K.; Dahlhaug, O.G. Experimental and Numerical Studies for a High Head Francis Turbine at Several Operating Points. J. Fluids Eng. 2013, 135, 11. [Google Scholar] [CrossRef]
- Luo, Y.; Cao, J.; Zhai, L.; Wang, Z. Pressure pulsation and dynamic behavior analysis of an ultra-low head bidirectional rim-generator turbine with special emphasis on the gravity effect. Ocean Eng. 2023, 286, 115524. [Google Scholar] [CrossRef]
- Roache, P.J. Quantification of uncertainty in computational fluid dynamics. Annu. Rev. Fluid Mech. 1997, 29, 123–160. [Google Scholar] [CrossRef]
- Yang, Y.; Wang, H.; Wang, C.; Zhou, L.; Ji, L.; Yang, Y.; Shi, W.; Agarwal, R.K. An entropy efficiency model and its application to energy performance analysis of a multi-stage electric submersible pump. Energy 2024, 288, 129741. [Google Scholar] [CrossRef]
- Ciappi, L.; Stebel, M.; Smolka, J.; Cappietti, L.; Manfrida, G. Analytical and Computational Fluid Dynamics Models of Wells Turbines for Oscillating Water Column Systems. J. Energy Resour. Technol. 2022, 144, 050903. [Google Scholar] [CrossRef]


Disclaimer/Publisher’s Note: The statements, opinions and data contained in all publications are solely those of the individual author(s) and contributor(s) and not of MDPI and/or the editor(s). MDPI and/or the editor(s) disclaim responsibility for any injury to people or property resulting from any ideas, methods, instructions or products referred to in the content. |
© 2024 by the authors. Licensee MDPI, Basel, Switzerland. This article is an open access article distributed under the terms and conditions of the Creative Commons Attribution (CC BY) license (https://creativecommons.org/licenses/by/4.0/).