Review

Induced Casing Deformation in Hydraulically Fractured Shale Gas Wells: Risk Assessment, Early Warning, and Mitigation

1
State Key Laboratory of Oil and Gas Reservoir Geology and Exploitation, Southwest Petroleum University, Chengdu 610599, China
2
Key Laboratory of Shale Gas Evaluation and Extraction in Sichuan Province, Chengdu 610056, China
3
PetroChina Southwest Oil and Gasfield Company, Chengdu 610056, China
*
Author to whom correspondence should be addressed.
Processes 2024, 12(9), 2057; https://doi.org/10.3390/pr12092057
Submission received: 18 August 2024 / Revised: 31 August 2024 / Accepted: 9 September 2024 / Published: 23 September 2024

Abstract

:
In recent years, casing deformation has become a key factor affecting the scale and efficiency of shale gas development. Consequently, a fast and efficient integrated prevention, control, and treatment technology for casing deformation is of great significance in terms of both theory and application. This paper combines a geological mechanics analysis and multi-cluster fracture propagation to investigate the risk evaluation, early warning and identification, and warning and identification technology relating to casing deformation and its application. It proposes a method for the dynamic and static evaluation of casing deformation risk levels and types, and establishes an index system incorporating stress, fracture, time, and space factors. This four-factor evaluation method is in greater alignment with field conditions. It also proposes a method for the early warning and identification of casing deformation based on fracture monitoring and an operation curve, and clarifies the dominant engineering factors around casing deformation. According to the findings, the total fluid volume per stage has a greater impact on casing deformation than a high pump rate. The prevention and control of casing deformation should preferably be realized by optimizing the fracturing parameters. Moreover, the paper reviews existing technologies for treating casing deformation, several of which are defined as major technologies: small-diameter bridge plug staged fracturing and small-size gun perforation, and long-stage multi-cluster asynchronous fracture initiation and composite temporary plugging and diversion. The study results provide support for a significant reduction in the casing deformation rate during fracturing, improving the effective stimulation degree in the casing deformation section in shale gas wells in the southern Sichuan Basin. These results could serve as references for subsequent research.

1. Introduction

There have been rapid developments in shale gas technology in China over the last 10 years, driving the year-on-year increase in shale gas production, with significant contributions toward mitigating gas supply shortages and ensuring national energy security. However, the extensive development of shale gas has been challenged by severe casing deformation during the multi-stage, multi-cluster fracturing of horizontal shale gas wells. Casing deformation refers to change(s) in the shape of the casing, such as a reducing diameter, collapse, shearing, slip, or bending under a compressive or shearing force. In particular, casing deformation frequently occurs in deep shale gas production areas, such as the Luzhou block (PetroChina) and the Weirong and Yongchuan blocks (Sinopec), where the proportion of affected wells was recorded as higher than 50% [1,2,3,4,5]. Casing deformation significantly impedes the commissioning of shale gas wells [6,7,8]. Statistics show that the fracturing efficiency of deformed casing wells in the Sichuan Basin is generally reduced by 30% to 50%, increasing the fracturing cost. Thus, the prediction, control, and treatment of casing deformation are both theoretically and practically significant [9,10].
In the petroleum industry, it is believed that casing deformation mainly occurs under three mechanisms. First, non-uniform external pressure on the casing induces casing yield and deformation, leading to the extrusion damage of the casing. Second, non-uniform forces on the fracturing wellbore lead to the bending deformation of the casing, which leads to difficulty in terms of the stress in a single direction, exceeding the internal pressure resistance strength of the casing, which can crush it. Third, during hydraulic fracturing, as the hydraulic energy is captured by large-scale faults/fractures, a large quantity of fracturing fluid penetrates the fractures to activate them, resulting in formation slip and leading to casing shear failure [11,12,13,14]. Field practices demonstrate that casing deformation occurs universally in the positions (1) near small faults or natural fractures, as evidenced by the shale gas wells in the Changning and Luzhou blocks, where 74% and 54%, respectively, of the casing deformation points are adjacent to faults/fractures; (2) with high energy, according to microseismic monitoring; (3) with several microseismic events; (4) with strong microseismic activity; (5) with relatively active natural fractures (the small b value, the constant in the Gutenberg–Richter recurrence relationship [15], refers to the ratio of small earthquakes to large earthquakes over a sufficiently long period of time in a certain area); and (6) with a low microseismic P-wave/S-wave (or P/S) ratio and a strong shear of natural fracture. The Multifinger Imaging Tool (MIT) and downhole TV logs have shown that the casing deformation of shale gas wells mainly follows the third mechanism [16,17,18,19].
The factors involved in casing deformation have been studied from geological, engineering, and chemical perspectives [20,21,22,23]. Geological factors mainly include structural uplift and subsidence, structural weak plane disposition, the lithologic interface, local in situ stress concentration, shale creep, and formation swelling [24]. Engineering factors mainly involve the wellbore trajectory, cementing quality, borehole diameter change, casing performance, surrounding rock creep, alternating load, alternating temperature, fracturing injection volume, and fracturing operation sequence [25]. Specifically, the structurally weak plane disposition of shale is considered a major geological factor [26], and high-fracturing operation intensity is considered a major engineering factor, in casing deformation. Integrated prevention and control in terms of casing deformation are challenged by the following factors: (1) the complex mechanism of casing deformation, which is the result of several geological and engineering factors; (2) difficulty in the accurate acquisition of casing deformation data; (3) difficulty identifying precursor information regarding casing deformation; and (4) limited technologies for treating casing deformation. In the shale gas production wells of PetroChina in the Sichuan Basin, more than 70% of casing deformation points are in natural fracture zones. Guided by the understanding that casing deformation was induced by shear slip in fractures, we propose the concept of the integrated prevention and control of casing deformation by geology–engineering integration. Using this perspective, we conducted research with respect to risk evaluation, early warning and identification, and control and treatment.

2. Risk Evaluation of Casing Deformation

Research on casing deformation positions and characteristics indicates that casing deformation is jointly affected by geological and engineering factors, which represent the internal and external causes, respectively. Therefore, a risk evaluation of casing deformation depending on geological conditions is supportive of the optimization of subsequent engineering operations. According to the mechanism where casing deformation is caused by formation slip in the activated fracture zone, a risk evaluation of casing deformation is performed with consideration of the geological stability of the fracture zone and the macro-scale (region) and micro-scale (fracturing section).

2.1. Regional Geological Stability Evaluation Based on Tectonic Movement History

The geological characteristics of regional development objects represent a decisive factor in casing deformation [27,28]. In China, shale gas production areas are mainly located in the Sichuan Basin, which is a province under compressive stress, with strong stratigraphic activity resulting from multi-period tectonic movements. To exemplify, structurally, the Luzhou block is in a “scattered broom” shape as a whole, which is believed to have been caused by the superposition of multi-direction compressions during the orogeny of Longmen Mountain, Dalou Mountain, and Daba Mountain [29,30]. The block contains a three-direction compressive stress field, including strike–slip tectonic stress, potentially inducing a risk of slip in the fracture zone. The history of this block shows frequent faulting and earthquake activity, suggesting that this is a region with a high risk of casing deformation. The geological structure in the northeastern Sichuan Basin is relatively stable, with a regional in situ stress test revealing that the normal fault stress is dominant, which means that the risk of formation slip is low and the probability of casing deformation in shale gas wells is low. According to the seismogenic fault distribution and in situ stress state, the high-, medium- and low-risk areas of casing deformation are divided. This division provides support for the optimization of well placement and the pace of hydrocarbon development.

2.2. Local Formation Stability Evaluation Based on Fracture Zone Stability Evaluation

2.2.1. Evaluation of Fracture Zone Stability under Initial Formation Conditions

In addition to the macro-scale evaluation of regional geological stability, the evaluation of near-wellbore fracture zone slip at the scale of a single shale gas well provides a basis for optimizing the prevention and control of casing deformation. Fracture zone slip is mainly assessed with the Mohr–Coulomb failure criterion.
Under initial conditions, a rock with a fracture zone is in a stable state, and the fracture zone plane does not move (Figure 1). Force analysis shows that the fracture zone is subjected to three-directional normal stress, friction on the fault plane, and pore pressure within the fault, and that the resultant force is 0. According to the principle of effective stress, the effective normal stress on the fault plane is expressed as follows:
σ i = S i α P p
The friction force f on the fracture zone plane is expressed as follows:
f = μ σ i
where Si is the principal stress in i (i = 1, 2, 3) direction; α is the Biot coefficient; Pp is the pore pressure, MPa; and μ is the friction coefficient of the fracture zone plane.
According to the Mohr–Coulomb failure criterion, a Mohr–Coulomb stress circle is established (Figure 2), where σ 1 , σ 2 , and σ 3 are the maximum, intermediate, and minimum effective stresses, respectively. When the shear stress on the fracture zone τ < f , that is, L1 is far away from the Mohr–Coulomb circle, it is in a stable state and does not slip. When τ = f , that is, L2 is tangent to the Mohr–Coulomb circle, the fracture zone is in a critical state of slip. When τ = f , that is, L3 intersects the Mohr–Coulomb stress circle, the fracture zone is in an unstable state and is dislocated along the fault plane.
Accordingly, it is known that the stability of the fracture zone plane is affected by three factors. The first is the fracture zone trend. Figure 2 shows a dominant slip belt. When the angle between the maximum principal stress and the fracture zone is within the dominant slip belt, there is a high risk of fracture zone slip, and the inclination of the dominant slip fracture is β = π 4 + 1 2 tan 1 μ . The second factor is the stress difference, with a higher stress difference imposing a higher risk of fracture zone slip. The third factor is the friction coefficient, with a smaller friction coefficient implying a higher risk of fracture zone slip. A previous study showed that the friction coefficient μ was 0.6–0.7 in most shale faults in the southern Sichuan Basin [31] (An et al., 2020). Under normal fault conditions, the dominant slip belt has a dip of 60°–80° and a strike parallel to the SHmax direction. Under strike–slip stress conditions, the dominant slip belt has an angle of 10°–30° between the strike and the SHmax direction. Under the reverse fault conditions, the dominant slip belt has a dip of 60°–80° and a strike perpendicular to the SHmax direction.
Due to the limitations of the existing geophysical technology, it is difficult to obtain accurate natural fracture dip angles in the field. Consequently, natural fracture dip angles were not used in the actual field. At the same time, almost all casing deformation occurred in the strike slip fault stress zone, such as in the N201 well area. Furthermore, the natural crack direction was characterized by the distribution of microseismic event points, and the correlation between the natural crack direction and the casing deformation was studied. Statistical results show that the angle between the ant body orientation and the SHmax direction, which induced casing deformation in 58 cases, was between 10° and 30°, accounting for 45% cases; and 198 cases that did not induce casing deformation had an angle of 40–60° between their body orientation and SHmax direction, accounting for 27% cases. This conclusion is consistent with the theoretical understanding outlined above.

2.2.2. Evaluation of Fracture Zone Stability under Fracturing Fluid Injection Conditions

Fluid is continuously injected in the fracturing process. On one hand, a series of hydraulic fractures are generated to connect the wellbore with the natural fracture zone. On the other hand, the continuous fluid injection changes the initial stress state of and around the hydraulic fractures and fracture zones, increasing the probability of fracture zone slip. As shown in Figure 2, during the fluid injection, the pore pressure in the fracture zone rises continuously, and the Mohr–Coulomb stress circle moves from right to left. When the pore pressure rises to a certain value, the fault is in transition from a stable state to a slip critical state. According to the Mohr–Coulomb stress circle, the critical value of the increase in pore pressure during the transition from a stable state to a slip critical state is expressed as follows:
Δ P p c r i t i c a l = σ 1 + σ 3 2 σ 1 σ 3 2 sin θ
θ = a r c tan μ
where θ is the fracture dip.
Based on the multi-stage, multi-cluster fracturing mode of shale gas wells, a hydraulic fracture model communicating with the fracture zone is established (Figure 3). The pressure change from the wellhead to the fracture zone is divided into five stages: (1) a pipe flow in the wellbore; (2) a choked flow in the perforation hole; (3) a multi-fracture flow near the wellbore; (4) a single-fracture flow far from the wellbore; and (5) seepage into a matrix from the fracture tip to the fracture zone. The practices and field tests of shale gas well fracturing show a single-fracture morphology in the far-end fractures of the shale [32]. Therefore, the following assumptions were made from the above model.
(1) A single cluster of fractures propagates to form a single dominant fracture; that is, N clusters are perforated and fractured to form N fractures. With regard to this assumption, in addition to direct proof of the coring results of HFTS2, there have also been recent application cases in North America and China that have achieved a significant improvement in the single-well EUR by increasing the number of clusters in the stage and shortening the cluster spacing, indirectly proving the existence of dominant fractures in shale gas fracturing. Otherwise, improvements in the single-well EUR would not have been so significant.
(2) Each fracture meets the conditions of the GDK plane fracture model. The commonly used two-dimensional fracture propagation models include the PKN and GDK models [33], both of which assume that the fracture height H and displacement Q are constants. The PKN model assumes that the transverse section of hydraulic fractures is elliptical, while the GDK model assumes that it is rectangular. Shale reservoirs have well-developed bedding planes, which have a significant influence on fracture height. Previous studies have shown that the hydraulic fracture height is mostly distributed in a rectangular pattern on steps [34]. Therefore, the GDK model was selected for this article.
(3) As the shale matrix reservoir is tight and the fluid seeps slowly into the matrix, fluid loss during hydraulic fracture propagation is not considered.
The pressure propagation in each stage of the model is expressed as follows:
(1) Pipe flow in the wellbore:
P I = P B h = P w h + P H Δ P f r
Δ P f r = λ L v 2 ρ 2 D
where P B h is the bottomhole pressure, MPa; P w h is the wellhead pressure, MPa; P H is the wellbore fluid column pressure, MPa; Δ P f r is the wellbore fluid flow friction, MPa; λ is the hydraulic friction coefficient, dimensionless; L is the wellbore length, m; D is the wellbore diameter, m; v is the fracturing fluid flow velocity, m/s; and ρ is the mixed density of the fracturing fluid, kg/m3.
(2) Limited flow in the perforation hole:
P I I = P B h Δ P p f
Δ P p f = 2.2326 × 10 10 Q 2 ρ n 2 d 4 C 2
where P B h is the bottomhole pressure through the perforation hole, MPa; Δ P p f is the perforation hole friction, MPa; Q is the fracturing fluid injection rate, m3/min; n is the total perforation number; d is the perforation hole diameter, m; and C is the flow coefficient of the perforation hole, generally 0.8–0.85, dimensionless.
(3) Multi-fracture flow near the wellbore:
P I I I = P I I Δ P 2
Δ P 2 = Δ P T = μ ρ 2 Q / N L T 1 2 H 2 N E Δ P ¯ 3
Δ P ¯ = P f σ   Net   pressure
E = G 2 1 ε = E 4 1 ε 2
where N is the perforation cluster number; LT1 is the length of the multi-fracture area III, m; H is the height of the multi-fracture area, m; Δ P ¯ is the net pressure in the fracture, MPa; G is the shear modulus, GPa; E is Young’s modulus, GPa; and ε is Poisson’s ratio.
In this stage, hydraulic fracture propagation is affected by multi-perforation fracture initiation in the cluster. The fractures initially propagate along the perforation orientation and then immediately form a convergent fracture in the same direction under the control of in situ stress. Curved fractures are generated from multi-perforation fracture initiation to single-fracture propagation.
(4) Single-fracture flow far from the wellbore:
P = μ ρ q 2 W 3
is the Hamiltonian operator in mathematical methods, and the calculation formula is as follows:
= x i + y j + z k
The GDK model is as follows:
W = L T 2 Ψ E E Δ P ¯
The relationship between the fracture opening and the opening pressure is expressed as follows:
W = Γ W 2 1 ν Ψ E G H ξ Δ P ¯
where LT2 is the length of the multi-fracture area VI, m; Γ W is a generalized influence function; Ψ E is the stiffness factor; H ξ is the characteristic value of the fracture half-height; W is the fracture width, m; and L T 2 is the length of the multi-fracture area:
L T 2 = Γ W 2 1 ν G E H ξ
The criterion for hydraulic fracture arrest is 0 net pressure—that is, the difference between the fluid pressure in the fracture and the fracture propagation pressure—and rock tensile strength T is 0 MPa. Therefore, L T is the maximum length and is mainly affected by   Γ W , Ψ E , and H ξ and indirectly affected by the injection rate (pressure).
Δ P = P f σ H m i n T = 0
L T = L T 1 + L T 2
(5) Seepage into the matrix from the fracture tip to the fracture zone:
According to the theory of single-phase micro-compressible fluid and unstable seepage in elastic porous media, pressure transmission is expressed as follows:
2 σ H m i n + T 2 r = 1 χ σ H m i n + T t
χ = K ξ C t
where r is the coordinate, m; t is the transmission time, s; χ is the transmissibility, cm2·s−1; K is the reservoir composite permeability, D; ξ is fluid viscosity, mPa·s; and Ct is the reservoir composite compressibility, 10 MPa−1.
According to the nodal analysis method, the intersection points of stages meet the constraint conditions of equal pressure and equal flow rate. The distribution characteristics of fluid pressure under dynamic fracture propagation during hydraulic fracturing are obtained by solving the above equations simultaneously. The time of communicating with the fracture zone is controlled by the time that the major fracture propagates to the limit length and the pressure transmission time from point L T to the fracture zone. A smaller injection rate causes a longer time for the hydraulic fracture to L T . According to Equation (21), the smaller the critical transmission pressure difference Δ P c o n = σ H m i n + T P p Δ P p c r i t i c a l , the lower the pressure transmission coefficient of the matrix reservoir, the longer the transmission time from the limit point to the fracture zone, and the smaller the risk of fault activation. As shown in Figure 4, A1–A8 pads were developed in an area of the Luzhou block, and the fracturing and production of a single well were carried out for three years. The wells on the A5-North, A7, and A4-East pads were completed in 2021; the wells on the A3, A1, A2, and A4-West pads were completed in 2022; the wells on the A5-South, A6, and A8 pads were completed in 2023. The bold lines represent wells with casing deformation. Because of pressure depletion around the previously produced wells, the critical transmission pressure difference Δ P c o n increased, and the risk of fracture zone slip around the wells increased. Casing deformation occurs in a certain proportion of fracturing wells at later stages, and there is no obvious correlation between casing deformation and the injection rate in this area (Figure 5). This is consistent with our understanding that the injection rate has no significant effect on L T .
The main fault characteristics are the contrast between the three-dimensional (3D) direction of the fault and the dominant sliding direction. Based on the above research and understanding, an evaluation index system of fracture zone stability was established (Table 1). Based on four factors (stress, fracture, time, and space), the fault stability evaluation was first divided into static and dynamic evaluations, with the former focusing on the stability of the fracture zone in the initial state. The slip factor of the fracture zone was mainly evaluated based on the fault and stress characteristics. The fault characteristics were mainly the contrast between the 3D direction of the fault and the dominant slip orientation. As the fault was caused by the current status of geophysical technology, it is difficult to achieve a fine 3D characterization of it. The stress characteristics were mainly evaluated with the critical value of pore pressure increase. Dynamic evaluation focuses on the communication and activation risk of hydraulic fractures to faults during fracturing. Consequently, fault- and matrix-dominated reservoirs were proposed. In fault-dominated reservoirs, the wellbore closer to the fault belts has a higher risk of communicating with and activating faults. In shale gas wells in the Changning block, 74% of casing deformation was less than 100 m away from the faults, and only five percent was more than 400 m away from the faults. In matrix-dominated reservoirs, the larger critical transmission pressure difference causes a higher risk of communicating with and activating faults and casing deformation.

2.3. Casing Deformation Prediction

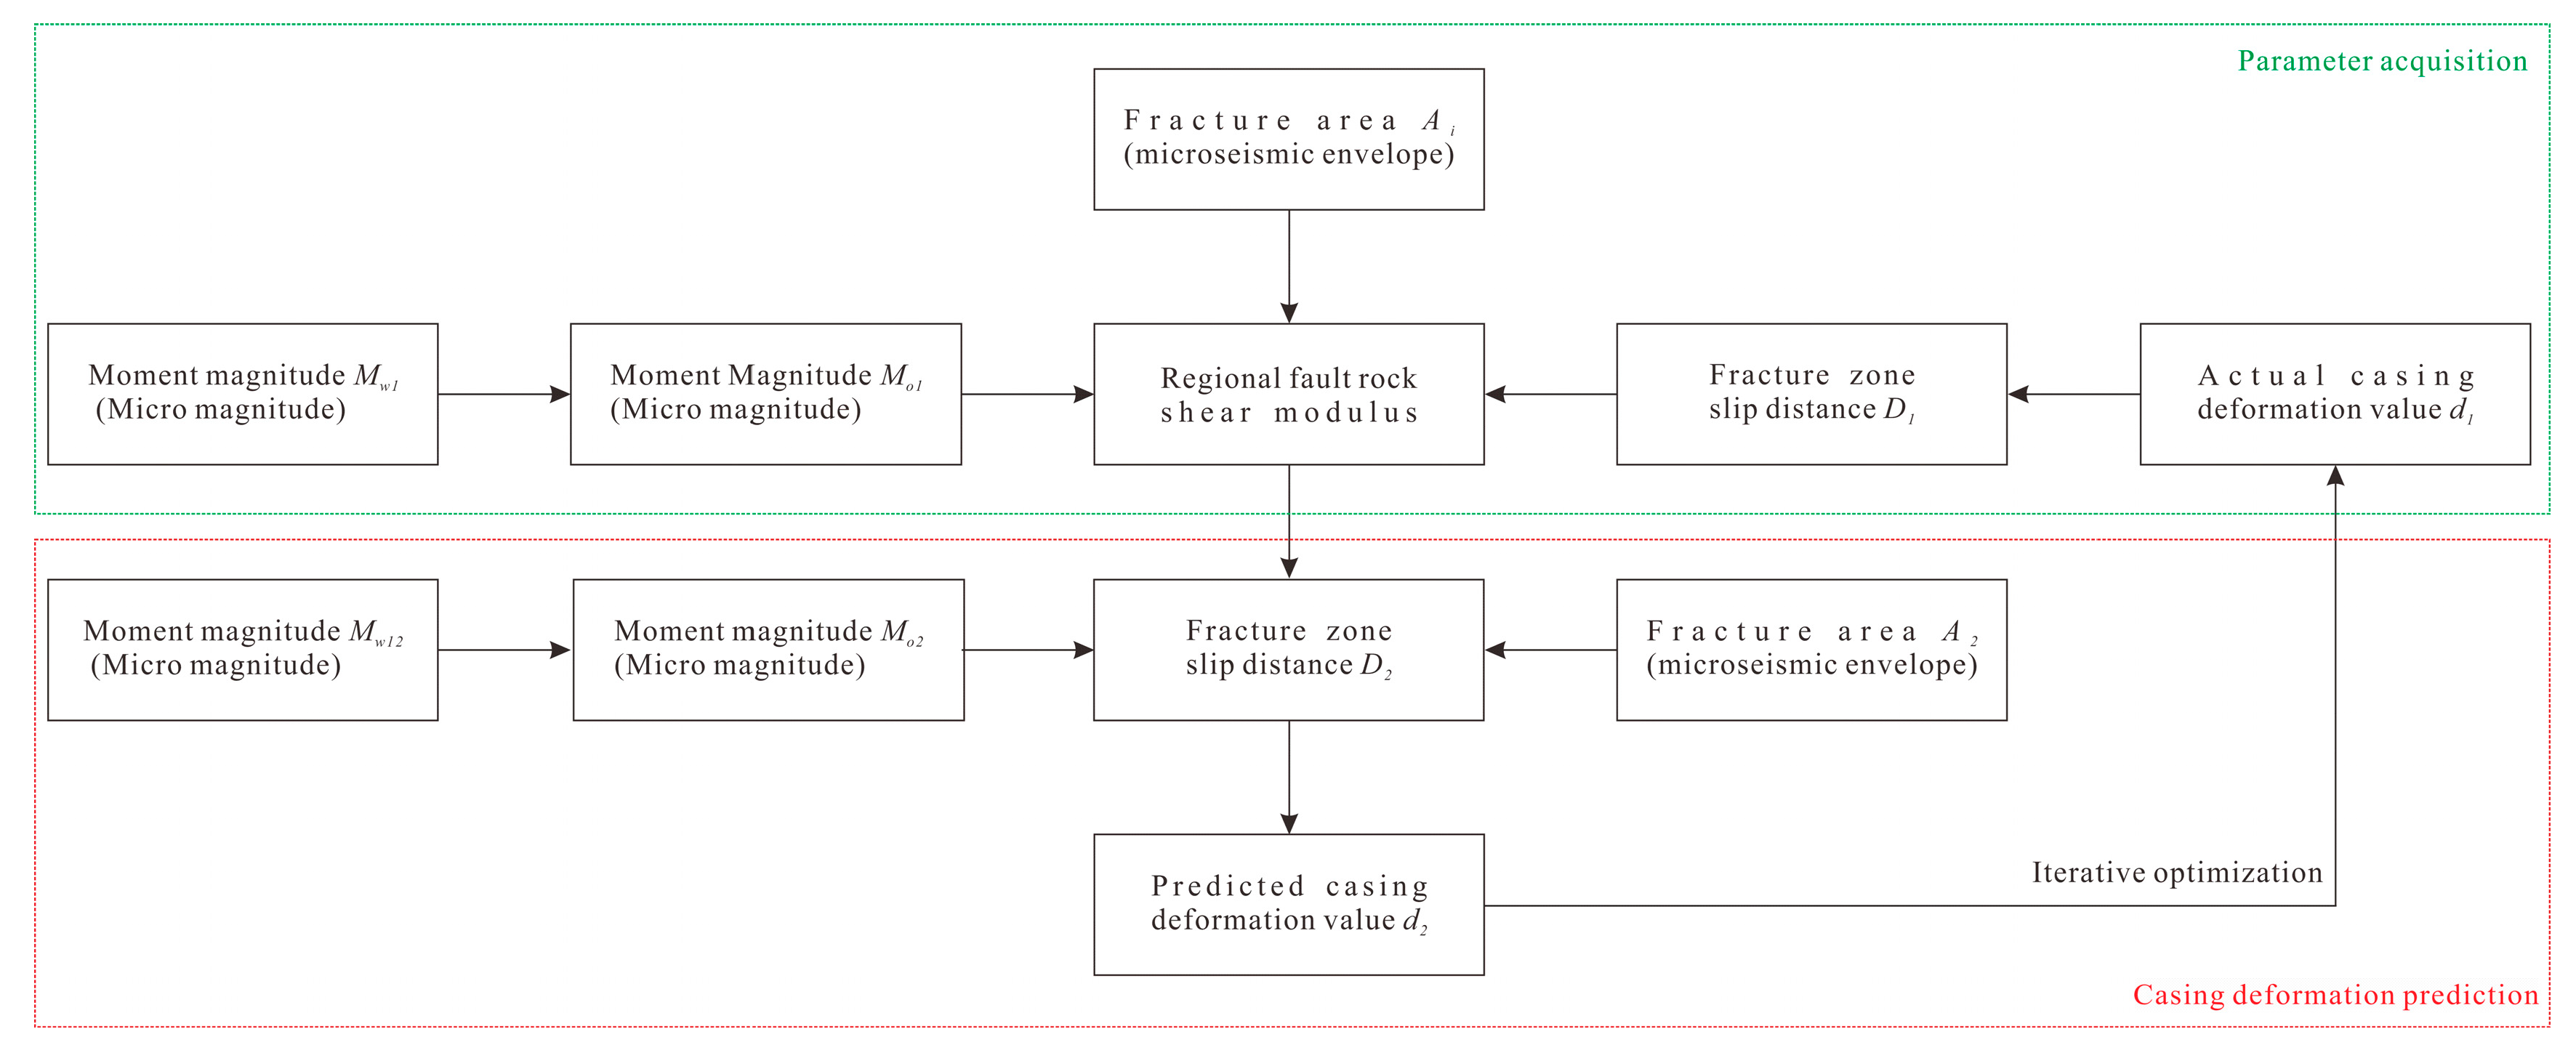
Assuming that the casing deformation was caused by fault shear slip, to predict the casing deformation value, the fracture zone slip value was first obtained. Based on the microseismic monitoring results of the fracturing wells and the caliper log data of the casing deformation wells, the characteristic parameter of the fault, the shear modulus γ , Pa, was solved using the microseismic focal mechanism method. The fracture zone slip value was then predicted using the microseismic results of the new well. Finally, the casing deformation value was predicted by finite element analysis. The prediction model correction and optimization were carried out by caliper logging of the new wells. The prediction process of casing deformation is shown in Figure 6.
In the process of solving the model, the relationship between the moment magnitude and seismic moment was expressed as follows:
M w = 2 3   l g M 0 9.1
where Mw is the moment magnitude, N·m. According to Aki’s seismic moment and fracture plane models, the relationship between the seismic distance, the fracture plane area, and the fracture plane slip momentum is established as follows:
M 0 = γ A R
where M0 is the seismic moment, N·m; A is the fracture area, m2; R is the fracture zone slip value, m; and γ is the shear modulus of the fractured rock, Pa.
In the process of inverting the shear modulus of fractured rocks through the MIT results in the field, there were significant differences in the shear modulus. Taking the X platform in the Changning block as an example, the shear modulus was inverted from 5 × 10⁵~2 × 10⁷ Pa through seven cases. Therefore, there was a certain error in predicting the deformation value of the casing at a specific point. However, upon increasing the number of predicted sample points, the predicted deformation value of the casing was mainly located in the 20~50 mm range, which is consistent with the actual deformation range in the field.

3. Early Warning of Casing Deformation

3.1. Early Warning of Casing Deformation Based on Fracture Monitoring Results

Fracture monitoring is a characterization of hydraulic fracture propagation through a series of techniques during hydraulic fracturing. Common fracture monitoring techniques include microseismic monitoring, wide-area electromagnetic monitoring, fiber optic monitoring, and 4D image monitoring. “Microseismic” refers to micro formation fractures. Microseismic monitoring is used to monitor the micro-fracture information generated by continuous formation failure by hydraulic energy during fracturing operations. It actualizes the inversion of the dynamic propagation of hydraulic fractures and the dynamic characterization of fracture morphology by processing the signals collected by detectors through professional microseismic interpretation software, which can support the evaluation of fracturing effects and the optimization of the fracturing scheme. In addition to the characterization of fracture morphology, another important role of microseisms is to explore the mechanism of rock fracture. Shear failure and compressive failure in the rock fracture point are determined by the observation and recording of the elastic wave signal released by microseismic activity [35], which reflects the formation fracture mechanism and the in situ stress state of the fracture area and provides support for the complex prevention and control of fracturing wells.
When light waves are transmitted in optical fibers, changes in the vibration, temperature, pressure, strain, and magnetic field cause changes in amplitude, phase, polarization, wavelength, and other optical characteristics. Hydraulic fracture propagation is characterized by monitoring the change in optical characteristics. The optical fiber that monitors vibration is called distributed acoustic fiber sensing (DAS). A fiber that monitors temperature changes is called distributed temperature fiber sensing (DTS), and a fiber that monitors stress–strain is called distributed strain fiber sensing (DSS). Using professional processing and interpretation software to process sound, temperature, and strain to obtain relevant information, such as gas and liquid production profiles, hydraulic fracture propagation, etc. (Wu et al., 2019) [36], wide-area electromagnetic monitoring was used to characterize the swept area of hydraulic fractures by monitoring small changes in reservoir fluid resistivity during hydraulic fracturing. Microseismic monitoring is the most widely used fracture monitoring technology in China, where casing deformation is identified through microseismic monitoring technology.
The fracture zone is the mechanical weak plane of a rock mass and an important medium in inducing shear slip of a rock mass. During hydraulic fracture propagation near a natural fracture zone, microseismic events occur with the following characteristics. First, the microseismic event points show obvious directional distribution in the existing fracture zone and divergent distribution in reservoirs with underdeveloped natural fractures. Second, the microseismic event points are not distributed strictly in the direction perpendicular to the minimum horizontal principal stress in the fracture zone but in the direction perpendicular to the minimum horizontal principal stress in the reservoirs with underdeveloped natural fractures. Third, the microseismic event points show a larger energy level. Affected by the fracture zone, more hydraulic energy for rock fractures should be accumulated to break through the constraint of the fracture; the fracture can block the propagation of hydraulic fractures, and a large energy level and intensive fracture often occur during hydraulic fracture propagation. Fourth, the microseismic event point b value is approximately equal to 1. In seismology, the Gutenberg–Richter relationship is established through extracting seismic frequency and magnitude data, and the fracture zone characteristics are described by calculating the b value and the corresponding evaluation criteria (Table 2).
log 10 N m M = a b × M
where N (m ≥ M) represents the number of earthquakes with a magnitude (m) greater than or equal to M (x-axis); b is the absolute value of the slope of the linear portion of the frequency–magnitude distribution (FMD); and a is the intercept of the slope of the FMD. Essentially, b is a fractal dimension characterizing the major stress mechanisms and failure modes of seismic events.
Taking the C block as an example, by mining microseismic monitoring data and combining it with actual casing deformation characteristics, a widely used risk assessment standard for casing deformation based on microseismic monitoring results has been established in the field (Table 3).
The fiber optic monitoring of adjacent wells resulted in the identification and warning of casing deformation by monitoring the wellbore strain in adjacent wells. On a pad in the southern Sichuan Basin, for example, Wells A, B, and C (Figure 7) have natural fracture zones through the wellbore, which intersect with the wellbore of Well B at 4900 m and 5800 m MD. During the fracturing of Well A, the underground optical fiber was run into the adjacent Well B for strain monitoring. The results show that, during the fracturing of stages 7 to 19 of Well A, obvious large strain characteristics were detected in Well B at 4900 m and 5800 m, respectively. Especially at 4900 m, there is a risk of casing deformation. Subsequently, an 88 mm OD bridge plug was stuck at 4900 m during fracturing in Well B, confirming casing deformation.

3.2. Early Warning of Casing Deformation Based on Abnormal Change of Surface Pump Pressure, the Bridge Plug Pumping Curve, and Caliper Logging

Based on field experience, when hydraulic fractures are arrested by natural fractures, the fracturing parameters exhibit three characteristics. First, the pumping pressure drops suddenly; that is, when the pumping rate is not changed, the fracture fluid loss suddenly increases and the fracture propagation resistance decreases. Second, the difficulty of adding proppant slurry into the fractures increases, which is manifested in the insufficient energy from proppant migration in the hydraulic fracture and the tendency of the proppant to settle down and bridge. Third, a sudden drop of instantaneous shut-in pressure ensues as well as an increase in the pressure drop rate after shut-in, with a high formation diffusion coefficient and higher permeability.
Nolte and Smith [37] established the modes of fracture propagation based on the difference in the slope of the double-log curve of surface pump pressure: the small and positive slope indicates the hindering of fracture propagation in the direction of the fracture; a slope of 0 indicates stable growth in the fracture height, opening of natural fractures, or T-shaped fractures; a slope of 1 indicates a hindering of the fracture tip propagation and a possibility of plugging within the fracture; the negative slope indicates fracture propagation to a low in situ stress area or communication with natural fractures, resulting in increased fluid loss and a reduction in surface pump pressure. The judgment conclusion of this method is consistent with the results of the sharp drop in surface pump pressure and shut-in pressure in field fracturing.
Surface pump pressure during fracturing is a comprehensive response to the continuous injection from surface equipment with a periodic frequency change and disordered transient formation fracture information. To characterize the surface pump pressure response caused by formation rock fracture, a method was proposed for characterizing formation fracture information through the surface pump pressure curve [38]. In this method, the formation fracture is identified through a frequency division treatment of the surface pump pressure curve and a localized time frequency analysis. Finally, the time subdivision at high frequency is conducted, and the frequency subdivision at low frequency results in formation fracture information. According to the formation fracture information, fracture propagation in the vicinity of an existing fracture zone is used for the early warning of casing deformation risk.
Following fracturing completion in a single stage of a shale gas well, the bridge plug and perforation gun are pumped to the designated location, and subsequent fracturing is executed after the setting and perforation of the bridge plug. To understand the wellbore condition in real time, the corresponding wellbore quality test tool is added to the perforation gun string, and the tool is tripped out to read the post-perforation data. The casing deformation interval is identified through data analysis characterizing the wellbore conditions. Casing magnetic anomaly logging is always used to detect casing deformation in the field.
Caliper logging is currently one of the most effective techniques used to evaluate the casing deformation degree and influence length. The multi-arm caliper mechanical integrity test (MIT), the electromagnetic thickness gauge MTT, and the electromagnetic flaw detector EMDS are often used to measure changes in the inner diameter and wall thickness of casings. In shale gas wells in the Sichuan Basin, 24-arm caliper MIT and EMDS are often used to detect damage and corrosion in downhole pipes without killing the well. In the process of tripping out the probe arm of the caliper gauge, the change in the inside diameter is characterized by the motion characteristics of the crankshaft, connecting arm, moving block, and pressure lever, and the precise identification of the change in the inside diameter of the deformed casing is performed by special interpretation software.

4. Control of Casing Deformation

4.1. Casing Deformation Control Fracturing Operations

A combination of special in situ stress state and fracture zone characteristics are the main geological factors inducing casing deformation. Among the geological factors, the high-angle and large-scale natural fracture belt, coupled with the formation strike–slip stress state, is most common in the shale gas production areas of the Sichuan Basin. The main engineering factor inducing casing deformation are changes in near-wellbore formation stability by fault activation or natural fracture by hydraulic fracturing. Therefore, avoiding the communication and activation of fracture zones during hydraulic fracturing and reducing formation slip are key to controlling casing deformation.
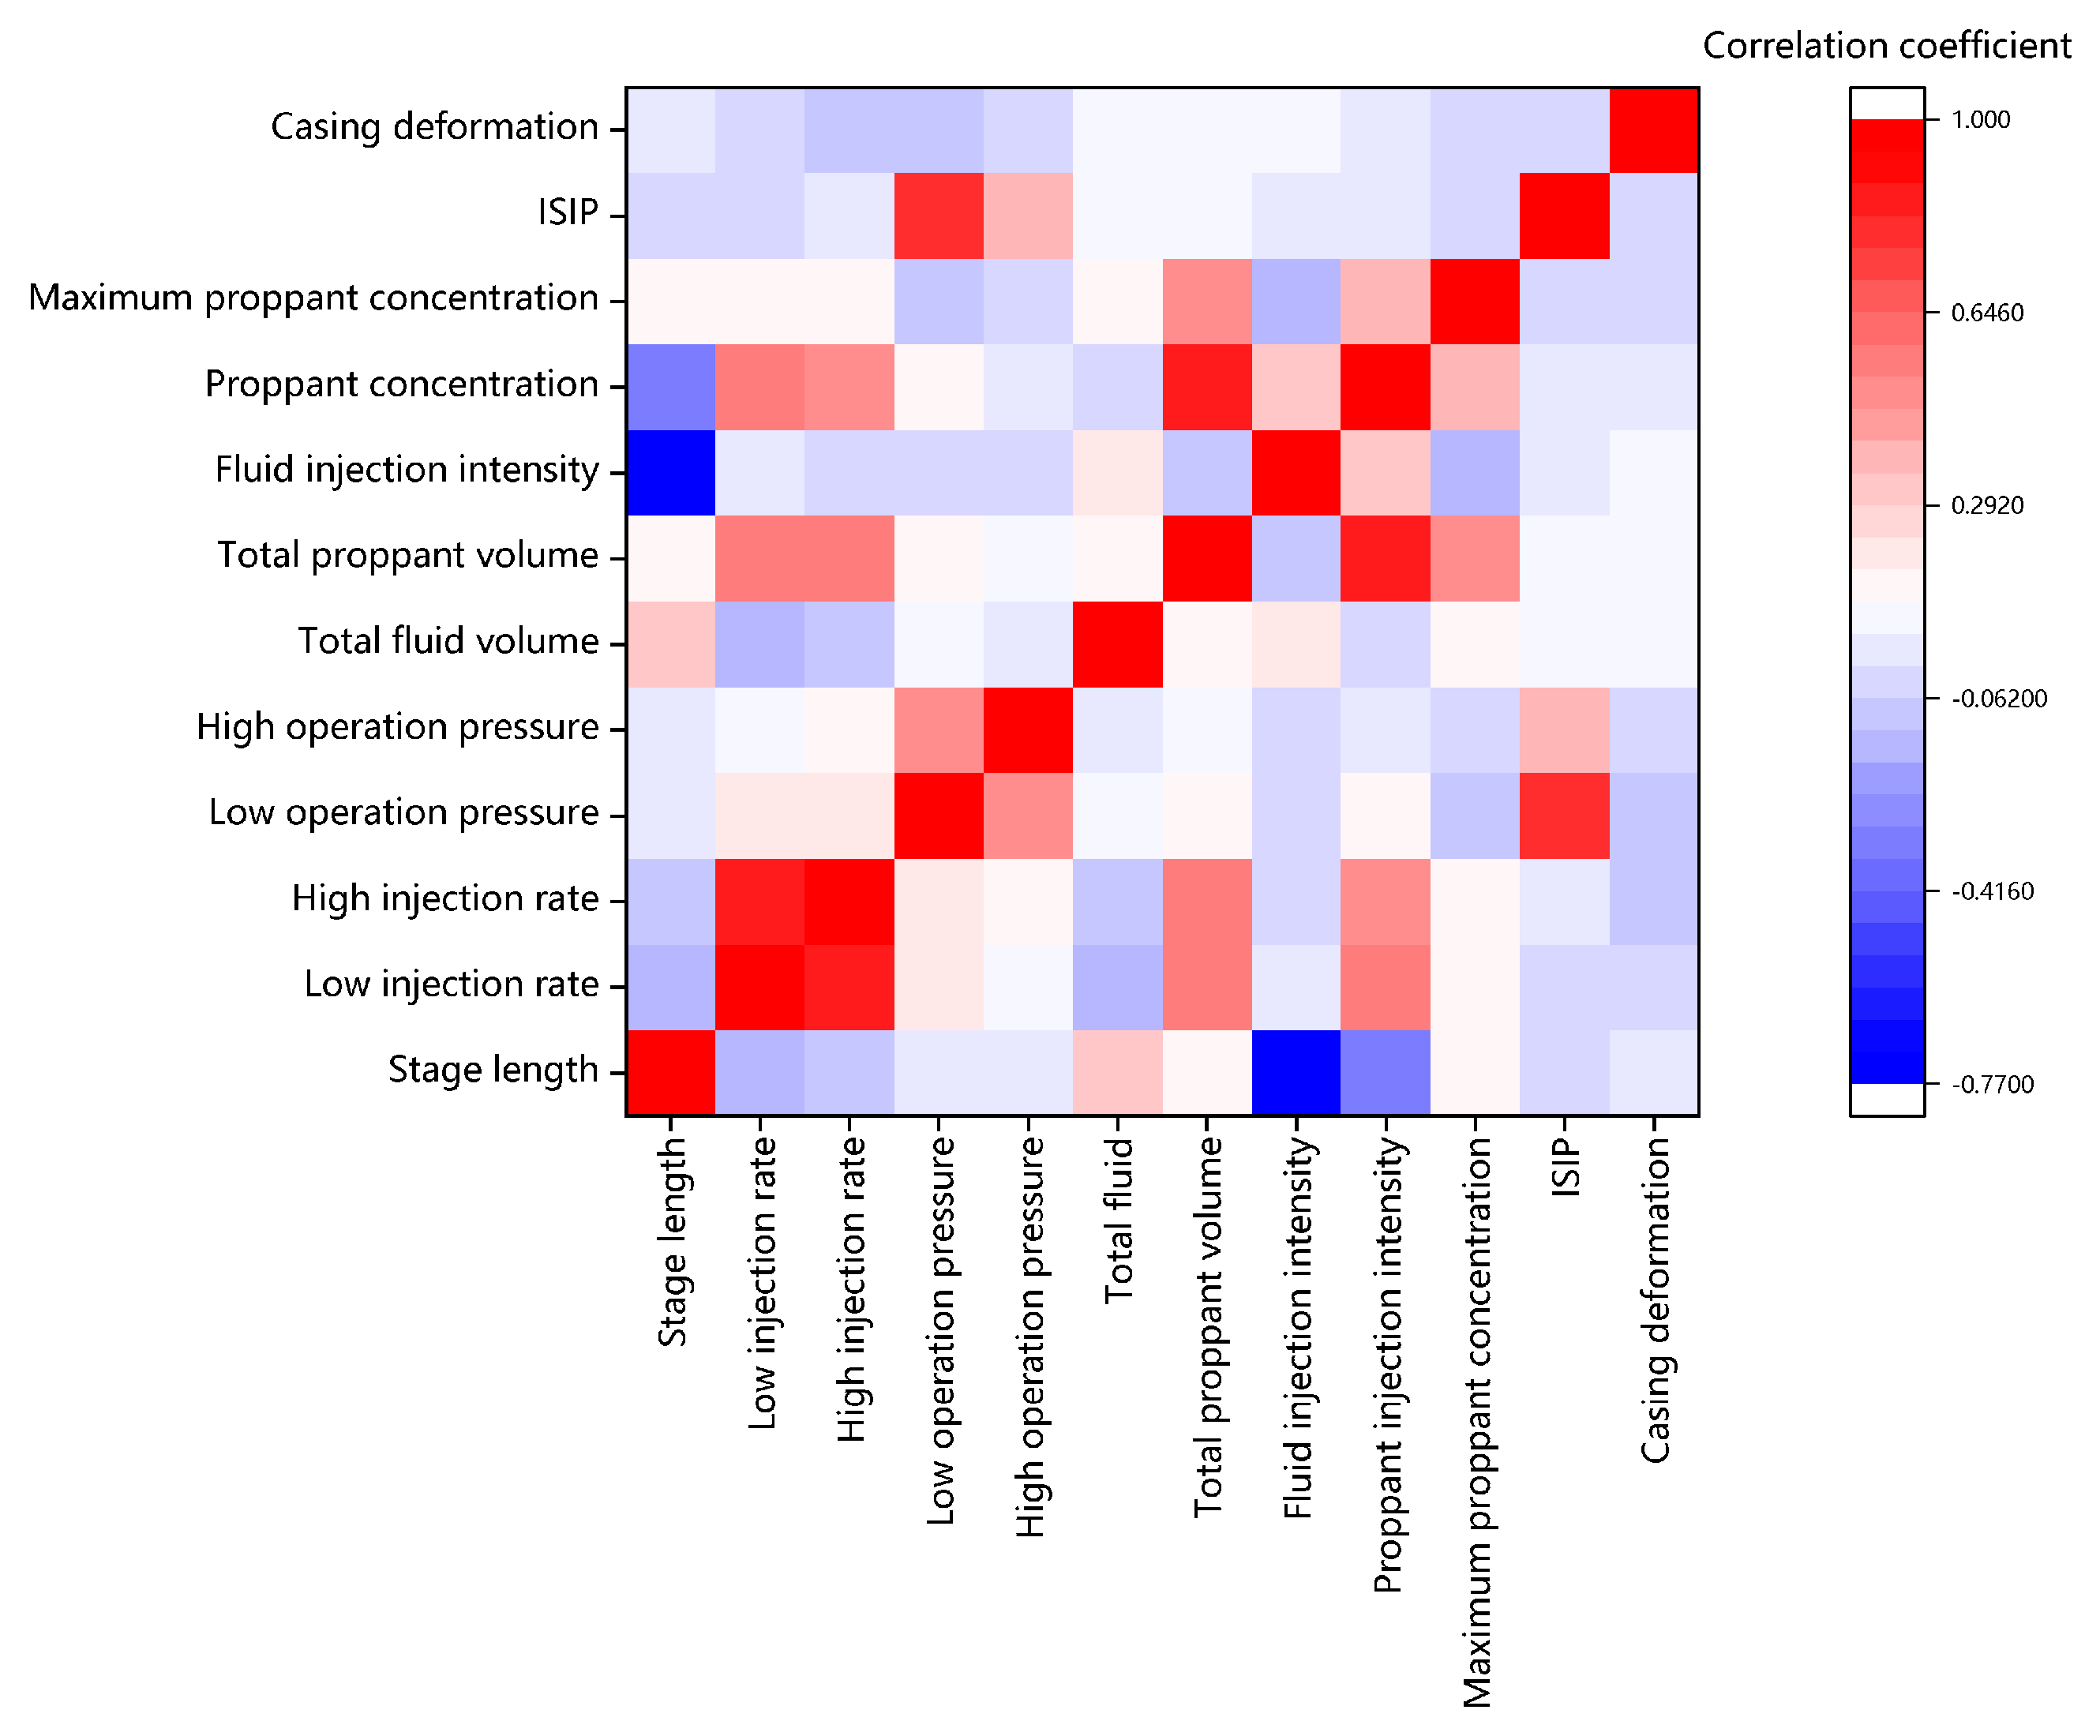
Fracturing parameters are the key elements to achieving a high gas well production. To clarify the direction of optimizing fracturing parameters, we analyzed the main engineering factors regarding casing deformation based on the fracturing parameters of 7428 stages in shale gas wells in southern Sichuan Basin by considering the stage length; injection rate; surface pump pressure; total fluid volume; total proppant volume; fluid injection intensity, which is injected based on volume per meter; proppant injection intensity, which is injected based on proppant weight per meter; maximum proppant concentration; and shut-in pressure. Pearson correlation analysis [39] was first performed, as shown in Figure 8. Casing deformation was significantly correlated to injection rate, surface pump pressure, total fluid volume, total proppant volume, shut-in pressure, fluid injection intensity, and proppant injection intensity. There was a strong co-linearity between the low and high injection rates, between surface pump pressure and shut-in pressure, between proppant injection intensity and total proppant volume, and between proppant injection intensity and fluid injection intensity. Thus, the Pearson correlation analysis showed that the injection rate, surface pump pressure, total fluid volume, and proppant injection intensity were the major engineering factors in casing deformation.
Grey correlation analysis [40] was conducted for 7428 stage sample points and four selected parameters, and the parameters were ranked as follows: total fluid volume > proppant injection intensity > low injection rate > low surface pump pressure, according to the correlation degree (Figure 9). The importance of engineering parameters based on the BP neural network analysis [41] was evaluated with 60% of the training samples and 40% of the test samples. The results showed that the casing deformation engineering factors ranked according to importance were as follows: total fluid volume > low injection rate > proppant injection intensity > low surface pump pressure (Figure 10).
The analysis showed that the total fluid volume of a single stage was the main engineering factor affecting casing deformation, followed by the injection rate. In this paper, the analysis results based on field data are consistent with the conclusions on fracture propagation based on the effect of the rate on casing deformation in risk evaluation technology. Thus, control of the total fracturing fluid volume of a single stage is the main method for controlling casing deformation.
Based on a fracture zone stability evaluation and analysis of the main factors of fracturing engineering, the casing deformation control method of reducing the probability of hydraulic fracture propagation to an existing fracture zone is established by the following method: (1) having no perforation near or at the intersection of the fracture zone, and the recommended “stay-away” distance of guns to existing fractures should be greater than 5 m; (2) increasing perforating clusters and reducing the fracturing injection volume to control the hydraulic fracture length; and (3) using temporary plugging and diversion to force diverted hydraulic fracture propagation.

4.2. Casing Deformation Control Cementing

When shale reservoir slip occurs, the set cement formed by conventional elastic cement slurry has a limited absorption and deformation capacity. The laboratory evaluation and numerical simulation show that increasing the thickness of the set cement and reducing the elastic modulus have no obvious effect on increasing the deformation capacity. Han Lihong, and Yang Shangyu et al. from the PetroChina Engineering Materials Research Institute proposed that modified cement slurry can provide space for formation slip absorption [42]; that is, high-strength hollow particles are added to the conventional elastic cement slurry system to modify the cement slurry, the formation slip displacement is absorbed by the space generated by the hollow particles in the set cement, and casing load and deformation are reduced.

5. Treatment of Casing Deformation

Casing deformation has the following influences: (1) it affects the bridge plug tripping and milling operation in the stimulated section; and (2) it impacts increased production. Shale gas volume fracture improves the EUR of gas wells and is particularly important in effectively stimulating the casing deformation section. Therefore, most existing technologies target the effective stimulation of the casing deformation section.

5.1. Small-Diameter Bridge Plug Staged Fracturing + Small-Size Gun Perforation

This technology stimulates the stages of the casing deformation section and allows stage fracturing by reducing the outer diameter of the common plug and pumping tools. There are challenges related to three main areas. First, after reducing the external diameter of the bridge plug, the gap between the bridge plug and the wellbore inner wall increases during tripping in the bridge plug within the wellbore, reducing pumping efficiency. A higher pumping rate and surface pump pressure are required to trip the bridge plug to the designed position, and increments of the pumping rate and pressure increase the risk of the downhole tool string getting stuck within the wellbore because it is difficult to stop the inertia of the tool. Second, it is necessary to seal off the casing. In the original wellbore without casing deformation and the irregular deformed wellbore, the sealing effect and pressure difference of the small-diameter bridge plug were known to be inferior to that of the conventional size bridge plug. Third, a reduced perforation gun size causes a reduced perforation charge size and explosive weight, resulting in a smaller perforation hole diameter and perforating penetration, ultimately leading to problems of high perforation friction and formation fracture pressure. Therefore, this technology is suitable in fracturing operations in wells with relatively benign casing deformation and relatively good tripping conditions, such as the stimulation of a casing deformation section with a minimum inner diameter exceeding 65 mm. This technology is widely used in the L block, and statistics show that its use has almost no impact on gas well production.

5.2. Long-Stage Multi-Cluster Asynchronous Fracture Initiation + Composite Temporary Plugging and Diversion

When mechanical staging is infeasible or time-consuming, with high downhole risks, operating in the casing deformation section is completed by long-stage fracturing. To reduce the problem of uneven fracture propagation caused by long-stage combined fracturing, temporary plugging and diversion are applied to achieve stage isolation. To improve the uniform stimulation effect of large-section combined fracturing, measures such as variable density perforation and composite temporary plugging and diversion are applied. The principle of this technology is to consider factors such as the physical reservoir conditions, rock mechanics profiles, natural fracture distribution, and casing deformation degree, and adopt measures such as variable density perforation density, length, orientation, and number to enable the artificial control of the fracture initiation sequence during long-stage fracturing. By combining the composite temporary plugging and diversion, the real-time adjustment and optimization of the fracturing fluid entry profile along the wellbore are enabled, and the efficient stimulation of the casing deformation section is finally achieved, thus solving the problem of uneven fracture propagation caused by an insufficiently effective rate and net pressure from a single cluster in long-stage, multi-cluster fracturing. This technology is widely used in the L block, and statistical data show that its use reduces the EUR of gas wells by about three percent.

5.3. Sand-Plug Staged Fracturing

For casing deformation sections where mechanical staging is infeasible but long-stage perforation is acceptable, the stimulated stages are sealed temporarily with high-concentration proppant as a mechanical bridge plug [43]. After the fracturing of a single stage, subsequent stages are perforated and fractured until the stimulated section is no longer affected by casing deformation, after which the bridge plug sealing is restored. This technology is relatively mature, but field operations are time-consuming. Moreover, there is a high risk of sand blockage, and, even if microseismic monitoring is used, it is still difficult to accurately determine the fluid entry. Further, it is difficult to efficiently enable and control artificial sand plugging, especially in horizontal wells. When the fluid entry into the stimulated section is not clear, it is difficult to determine the time of the artificial sand plugging, the appropriate proppant concentration, and the sand plug volume. When the above three parameters cannot be accurately matched with the formation, it is likely to cause artificial sand plugging failure or excessive sand plugging, resulting in wellbore blockage and other complicated downhole situations. To resolve the above problems, this technology is rarely applied in shale gas fracturing wells with casing deformation.

5.4. Workover

When casing deformation is serious and the affected section cannot be mechanically sealed or perforated, fracturing stimulation of the affected section can only occur by workover. To restore wellbore integrity, a series of workover measures, such as mechanical diameter expansion and shaping, hydraulic shaping, drilling and grinding, and the casing patch, are often adopted to resolve the possible diameter reduction, damage, and misalignment of the deformed wellbore [44] (Figure 11). Currently, the workover technology of seriously deformed shale gas wells is still in the optimization stage, with the key problems of downhole tools being stuck or non-ideal workover results caused by a mismatch between the workover tool type and size and the wellbore conditions, high operation risk, long operation time, and high operation cost.

6. Application

A regional geological stability evaluation was used to divide the shale gas production areas into high-, medium-, and low-risk, providing support for well deployment and production. Fracture zone stability evaluation is conducive to the division of shale gas wells into high-, medium-, and low-risk stages and the optimization of the casing deformation prevention and control technology for individual wells and stages. A combination of early warning, identification, and control technologies have been applied in more than 300 wells. In the Changning block, the deformation rate decreased from 44.44% in 2018 to 3.45% in 2023. In shale gas wells in the Luzhou block, which recorded severe casing deformation in the early stage (Figure 12), the casing deformation rate reduced from 55.93% in 2022 to 25% in 2023. Through a casing deformation treatment technology based on “small-diameter bridge plug staged fracturing + small-size gun perforation fracturing,” the length of the combined fracturing stage in the Luzhou block reduced from 111,426 m in 2022 to 7040 m in 2023, and remarkable effects have been achieved in the prevention, control, and treatment of casing deformation.

7. Conclusions and Suggestions

Casing deformation is a significant element restricting the progress and effect of fracturing in shale gas wells. It is jointly affected by geological and engineering factors, and its integrated prevention and control represent a systematic project. Based on the assumption that it is caused by fault shear slip, risk areas, pads, wells, and stages were identified. Early warning and the identification of risk and related technologies for control and treatment can be of practical significance.
(1) Fault slip is the result of comprehensive effects of in situ stress and fault characteristics. The dominant orientation of fracture zone slip exists under various stress states, and different fracture zones have different critical values of pore pressure increase. However, limited by geophysical science and technology, it is proposed that more detailed predictions of existing fracture zones and the 3D spatial distribution of fracture zones should be strengthened, which could support the evaluation of slip risk by defining the dominant orientation of existing natural fracture zones.
(2) A combination of an evaluation of fracture zone slip risk and hydraulic fracture propagation showed that reducing or avoiding the communication and activation of faults was an important method in reducing the probability of fault shear and slip. For fault-dominated shale reservoirs, the distance between the wellbore and fault is an important index for evaluating slip risk. For matrix-dominated shale reservoirs, σ Hmin + T P p Δ P pcritical and reservoir transmissibility are important evaluation indices. The current evaluation mainly targeted the initial state of the formation fracture zone. Here, the method and index of dynamic evaluation of fault slip risk were proposed, and we suggest that more robust research should be conducted on the 4D geostress field during hydraulic fracture propagation, which would provide support for the development of the technology for casing deformation warning and control.
(3) Both the analysis of hydraulic fracture propagation and the engineering factors regarding casing deformation showed that the total fluid volume of a single stage had a larger effect on casing deformation risk than the injection rate. The injection rate is an important method for maintaining net pressure within the fracture, promoting fracture diversion, improving fracture complexity, and ensuring the fracturing stimulation effect. It is suggested that techniques of casing deformation prevention and control should target the optimization of fracturing parameters.
(4) The effective stimulation of slight casing deformation sections has been achieved using a series of treatment technologies, such as small-diameter bridge plug staged fracturing and small-size gun perforation fracturing, long-stage multi-cluster asynchronous fracture initiation and composite temporary plugging and diversion, and sand-plug staged fracturing. However, in wells with severe casing deformation, existing workover technology continues to face problems, including long operation periods, high risk, and high cost. Thus, more robust research and the development of relevant tools and technologies is warranted to support the restoration of wells with severe casing deformation.

Author Contributions

Writing—original draft preparation and funding acquisition, X.Z.; formal analysis, Y.D. (Yonggang Duan); data curation, Y.S. (Yu Sang), L.Z., and B.Z.; validation, Y.S. (Yi Song) and J.H.; methodology, Y.D. (Yan Dong) and J.H. All authors have read and agreed to the published version of the manuscript.

Funding

The study was supported by the Science and Technology Project of PetroChina Southwest Oil & Gas Field Company “Research on Mechanism and Prevention Measures of Casing Deformation in Deep Shale Gas Well” (No.: 20220304-20), the PetroChina Science and Technology Innovation Fund (No.: 2023DQ02-0206), and the Science and Technology Project of PetroChina Southwest Oil and Gas Field Company “Comprehensive Evaluation of Fracturing of Deep Shale Gas Wells in Luzhou Block” (No.: 20220302-05).

Informed Consent Statement

Informed consent was obtained from all individual participants included in the study.

Conflicts of Interest

Authors Xiaojin Zhou, Yu Sang, Lang Zhou, Bo Zeng, Yi Song, Yan Dong, and Junjie Hu were employed by PetroChina Southwest Oil and Gasfield Company. The remaining author declare that the research was conducted in the absence of any commercial or financial relation-ships that could be construed as a potential conflict of interest.

Nomenclature

aintercept of the slope of the frequency–magnitude distribution
Afracture area
bthe absolute value of the slope of the linear portion of the frequency–magnitude distribution
Cflow coefficient of the perforation hole
Ctreservoir composite compressibility
dperforation hole diameter
Dwellbore diameter
EYoung’s modulus of rock
f friction force
Gshear modulus of rock
Hheight of the multi-fracture area
Kreservoir composite permeability
Lwellbore length
LT1length of the multi-fracture area III
LT2length of the multi-fracture area VI
Mwthe moment magnitude
M0the seismic moment
ntotal perforation number
Nperforation cluster number
P B h bottomhole pressure
P H wellbore fluid column pressure
P p pore pressure
P w h wellhead pressure
Qfracturing fluid injection rate
rcoordinate
Rfracture zone slip value
S i principal stress in i (i = 1,2,3) direction
ttransmission time
vfracturing fluid flow velocity
W fracture width
Greek
α Biot coefficient
γ is the shear modulus of the fractured rock
ε Poisson’s ratio of rock
θ fracture dip
λhydraulic friction coefficient
μ friction coefficient of the fracture zone plane
ξ fluid viscosity
ρmixed density of fracturing fluid
σ i effective normal stress
σ 1 the maximum effective stresses
σ 2 the intermediate effective stresses
σ 3 the minimum effective stresses
χ transmissibility
Γ W generalized influence function
Δ P p c r i t i c a l the critical value of pore pressure increase
Δ P f r wellbore fluid flow friction
Δ P p f perforation hole friction
Δ P ¯ net pressure in the fracture
H ξ characteristic value of fracture half-height
Ψ E stiffness factor

References

  1. Han, L.; Li, X.; Liu, Z.; Duan, G.; Wan, Y.; Guo, X.; Guo, W.; Cui, Y. Influencing factors and prevention measures of casing deformation in deep shale gas wells in Luzhou block, southern Sichuan Basin, SW China. Pet. Explor. Dev. 2023, 50, 979–988. [Google Scholar] [CrossRef]
  2. Yang, L.; Qi, T.; Hao, W.; Ma, T. Research Status and Prospect of Casing Deformation Mechanism and Control Methods in Shale Gas Wells in Sichuan Basin. In Proceedings of the 57th U.S. Rock Mechanics/Geomechanics Symposium, Atlanta, GA, USA, 25–28 June 2023. [Google Scholar] [CrossRef]
  3. Li, Z.; Li, H.; Li, G.; Yu, H.; Tang, B.; Jiang, Z.; Liu, H.; Hu, S. The influence of shale swelling on casing deformation during hydraulic fracturing. J. Pet. Sci. Eng. 2021, 205, 108844. [Google Scholar] [CrossRef]
  4. Ran, W.; Bian, X.; Zhang, X.; Xiao, B.; Cao, N.; Zuo, L.; Du, J.; Su, Y. Three-Dimensional High Efficiency Fracturing Technology for Preventing Casing Deformation in W Deep Shale Gas. In Proceedings of the 57th U.S. Rock Mechanics/Geomechanics Symposium, Atlanta, GA, USA, 25–28 June 2023. [Google Scholar] [CrossRef]
  5. Zhao, C.; Li, J.; Liu, G.; Zhang, H.; Wang, C.; Ren, K.; Zhang, X. The Casing Deformation During Shale Gas Hydraulic Fracturing: Why it is so Serious in Weiyuan-Changning, China. In Proceedings of the SPE Trinidad and Tobago Section Energy Resources Conference, Port of Spain, Trinidad and Tobago, 25–26 June 2018. [Google Scholar] [CrossRef]
  6. Dong, K.; Liu, N.; Chen, Z.; Huang, R.; Ding, J.; Niu, G. Geomechanical analysis on casing deformation in Longmaxi shale formation. J. Pet. Sci. Eng. 2019, 177, 724–733. [Google Scholar] [CrossRef]
  7. Zhang, X.; Liu, J.; Cheng, W.; Jiang, W.; Jin, J.; Shen, L. New Type of Casing Deformation Rising in Weiyuan Changning Shale Gas Play. In Proceedings of the International Petroleum Technology Conference, Riyadh, Saudi Arabia, 21–23 February 2022. [Google Scholar] [CrossRef]
  8. Gandomkar, A.; Katz, D.; Gomez, R.; Gundersen, A.; Khan, P. Casing Deformation Mitigation Achieved Through Ball Activated Sliding Fracturing Sleeves—An Alternative to Plug and Perf Fracturing Operations. In Proceedings of the SPE International Hydraulic Fracturing Technology Conference & Exhibition, Muscat, Oman, 11–13 January 2022. [Google Scholar] [CrossRef]
  9. Yoshida, H.; Jafri, S.; Okura, M.; Takahashi, S.; Li, W. The Effect of Casing Deformation on Frac Plug Sealing Element Performance. In Proceedings of the SPE Hydraulic Fracturing Technology Conference and Exhibition, The Woodlands, TX, USA, 31 January–2 February 2023. [Google Scholar] [CrossRef]
  10. Al Hinai, A.S.; Al Jahdhami, A.R.; Al Farsi, S.A.; Chavez, J.C. The Reasons and Mitigations Behind the Casing Deformation After Hydraulic Fracturing: Cases Studies from Oman Deep Tight Gas Wells. In Proceedings of the ADIPEC, Abu Dhabi, United Arab Emirates, 31 October–3 November 2022. [Google Scholar] [CrossRef]
  11. Chen, Z.; Shi, L.; Xiang, D. Mechanism of casing deformation in the Changning-Weiyuan national shale gas project demonstration area and countermeasures. Nat. Gas Ind. B 2017, 4, 1–6. [Google Scholar] [CrossRef]
  12. Yin, F.; Han, L.; Yang, S.; Deng, Y.; He, Y.; Wu, X. Casing deformation from fracture slip in hydraulic fracturing. J. Pet. Sci. Eng. 2018, 166, 235–241. [Google Scholar] [CrossRef]
  13. Radakovic-Guzina, Z.; Damjanac, B.; Savitski, A.A.; Suarez, N. Analysis of the Production Casing Deformation Due to Shearing of Offset Hydraulic Fractures. In Proceedings of the SPE/AAPG/SEG Unconventional Resources Technology Conference, Houston, TX, USA, 20–22 June 2022. [Google Scholar] [CrossRef]
  14. Huang, R.; Chen, Z.; Zhang, F.; Zhou, X.; Wang, Q.; Cao, H.; Zhang, H.; Yang, X. Fault Slip Risk Assessment and Treating Parameter Optimization for Casing Deformation Prevention: A Case Study in the Sichuan Basin. Geofluids 2020, 2020, 8894514. [Google Scholar] [CrossRef]
  15. Greig, D.W. Analysis of the Crooked Lake Sequence Near Fox Creek, Alberta: Comparison of a Waveform Correlation Detection Method to a Traditional STA/LTA Picker. Presented at the 2014 SEG Annual Meeting, Denver, CO, USA, 26–31 October 2014. [Google Scholar]
  16. Chen, Z.; Fan, Y.; Huang, R.; Zeng, B.; Walsh, R.; Zhou, X.; Zoback, M.; Song, Y. Case Study: Fault Slip Induced by Hydraulic Fracturing and Risk Assessment of Casing Deformation in the Sichuan Basin. In Proceedings of the SPE/AAPG/SEG Asia Pacific Unconventional Resources Technology Conference, Brisbane, Australia, 18–19 November 2019. [Google Scholar] [CrossRef]
  17. Lu, Q.; Liu, Z.; Guo, J.; He, L.; Li, Y.; Zeng, J.; Ren, S. Hydraulic fracturing induced casing shear deformation and a prediction model of casing deformation. Pet. Explor. Dev. 2021, 48, 394–401. [Google Scholar] [CrossRef]
  18. Lu, Q.; Liu, Z.; Guo, J.; Wang, S.; He, L.; Li, Y. Prediction Analysis of Induced Casing Deformation of Horizontal Well in Fractured Shale Reservoir: Case Study of Weiyuan Gasfield. In Proceedings of the SPE International Hydraulic Fracturing Technology Conference & Exhibition, Muscat, Oman, 11–13 January 2022. [Google Scholar] [CrossRef]
  19. Chen, Z.; Huang, R.; Zhou, X.; Song, Y.; Qing, C.; Yang, Y. Case Study: Casing Deformation and Fault Slip Induced by Hydraulic Fracturing in Sichuan Basin. In Proceedings of the ARMA-CUPB Geothermal International Conference, Beijing, China, 5–8 August 2019. [Google Scholar]
  20. Espindola, B.; Romero, A.N.; Rodríguez, M.J.; Sosa Luna, R.D.; Weimann, M.I.; Velo, R.D.; Escobar, R.A.; Suarez, F.; Pucho, M.; Gonzalez, N.; et al. Analysis of Casing Deformation in Different Unconventional Areas with a Comprehensive Approach in the Study. In Proceedings of the SPE/AAPG/SEG Latin America Unconventional Resources Technology Conference, Buenos Aires, Argentina, 4–6 December 2023. [Google Scholar] [CrossRef]
  21. Zhu, H.; He, X.; Li, Y.; Tang, X.; Huang, C.; Zeng, B.; Song, Y. Investigation to Integrated Geomechanics of Casing Deformation and a New Technique: A Case in Deep Gas Shale of Sichuan Basin, China. In Proceedings of the 57th U.S. Rock Mechanics/Geomechanics Symposium, Atlanta, GA, USA, 25–28 June 2023. [Google Scholar] [CrossRef]
  22. Jia, B.; Xian, C.; Tsau, J.S.; Zuo, X.; Jia, W. Status and outlook of oil field chemistry-assisted analysis during the energy transition period. Eng. Fuels 2022, 36, 12917–12945. [Google Scholar] [CrossRef]
  23. Wang, K.; Chang, Y.; Chen, G.; Sun, B.; Sun, H.; Li, H.; Dai, Y. Three-dimensional mechanical behaviors of casing during gas production from marine hydrate reservoirs using depressurization. Energy 2022, 247, 123526. [Google Scholar] [CrossRef]
  24. Ross, T.S.A.; Chang, K.W.; Sobolik, S.R. Geomechanical Tool for Evaluating Casing Deformation in Storage Caverns in Salt Dome. In Proceedings of the 57th U.S. Rock Mechanics/Geomechanics Symposium, Atlanta, GA, USA, 25–28 June 2023. [Google Scholar] [CrossRef]
  25. Zeng, B.; Zhou, X.; Cao, J.; Zhou, F.; Wang, Y.; Wang, Y.; Song, Y.; Hu, J.; Du, Y. A Casing Deformation Prediction Model Considering the Properties of Cement. Processes 2023, 11, 695. [Google Scholar] [CrossRef]
  26. Chen, Z.; Huang, R.; Zeng, B.; Song, Y.; Zhou, X. Case Study: Treating Parameters Optimization in Casing Deformation Wells of Shale Gas in Sichuan Basin. In Proceedings of the 54th US Rock Mechanics/Geomechanics Symposium, Virtual, 28 June 2020–1 July 2020. [Google Scholar]
  27. Last, N.C.; Mujica, S.; Pattillo, P.D.; Kelso, G.T. Evaluation, Impact, and Management of Casing Deformation Caused By Tectonic Forces in the Andean Foothills, Colombia. SPE Drill. Complet. 2006, 21, 116–124. [Google Scholar] [CrossRef]
  28. Markley, M.E.; Last, N.; Mendoza, S.; Mujica, S. Case Studies of Casing Deformation due to Active Stresses in the Andes Cordillera, Colombia. In Proceedings of the IADC/SPE Drilling Conference, Dallas, TX, USA, 26–28 February 2002. [Google Scholar] [CrossRef]
  29. Zhu, Y.; Chen, G.; Liu, Y.; Shi, X.; Wu, W.; Luo, C.; Yang, X.; Yang, Y.; Zou, Y. Sequence stratigraphy and lithofacies paleogeographic evolution of Katian Stage–Aeronian Stage in southern Sichuan Basin, SW China. Pet. Explor. Dev. 2021, 48, 1126–1138. [Google Scholar] [CrossRef]
  30. Dong, D.; Liang, F.; Guan, Q.; Jiang, Y.; Zhou, S.; Yu, R.; Gu, Y.; Zhang, S.; Qi, L.; Liu, Y. Development model and identification evaluation technology of Wufeng-Longmaxi Formation quality shale gas reservoirs in the Sichuan Basin. Nat. Gas Ind. 2022, 42, 96–111. [Google Scholar] [CrossRef]
  31. An, M.; Zhang, F.; Chen, Z.; Elsworth, D.; Zhang, L. Temperature and fluid pressurization effects on frictional stability of shale faults reactivated by hydraulic fracturing in the changing block, Southwest China. J. Geophys. Res. Solid Earth 2020, 125, e2020JB019584. [Google Scholar] [CrossRef]
  32. Wang, Z.P.; Zhang, Y. Unconventional Reservoirs Require Unconventional Thinking: Using Fracturing Model as an Example. In Proceedings of the International Petroleum and Petrochemical Technology Conference, Beijing, China, 27–29 March 2019. [Google Scholar]
  33. Eker, E.; Uzun, I.; Kazemi, H.; Rutledge, J.M. Hydraulic Fracture Propagation Modeling for Well Performance Analysis: Eagle Ford Formation Case Study. In Proceedings of the SPE Western Regional Meeting, Bakersfield, CA, USA, 23–27 April 2017. [Google Scholar] [CrossRef]
  34. Xie, J.; Tang, J.; Sun, S.; Li, Y.; Song, Y.; Zhou, X.; Huang, H. Numerical Study of Proppant Transport and Distribution along Opened Bedding Planes. In Proceedings of the Unconventional Resources Technology Conference, Virtual, 20–22 July 2020; pp. 1098–1114. [Google Scholar]
  35. Haege, M.; Maxwell, S.; Sonneland, L.; Norton, M. Integration of Passive Seismic and 3D Reflection Seismic in an Unconventional Shale Gas Play: Relationship Between Rock Fabric and Seismic Moment of Microseismic Events. In Proceedings of the 2012 SEG Annual Meeting, Las Vegas, NV, USA, 4–9 November 2012. [Google Scholar]
  36. Meyer, J.J.; Gallop, J.; Chen, A.; Reynolds, S.; Mildren, S. Can Seismic Inversion Be Used for Geomechanics? A Casing Deformation Example. In Proceedings of the SPE/AAPG/SEG Unconventional Resources Technology Conference, Houston, TX, USA, 23–25 July 2018. [Google Scholar] [CrossRef]
  37. Wu, Q.; Nair, S.; van Oort, E.; Guzik, A.; Kishida, K. Concurrent Real-Time Distributed Fiber Optic Sensing of Casing Deformation and Cement Integrity Loss. In Proceedings of the SPE/IADC International Drilling Conference and Exhibition, The Hague, The Netherlands, 5–7 March 2019. [Google Scholar]
  38. Nolte, K.G.; Smith, M.B. Interpretation of Fracturing Pressures. J. Pet. Technol. 1981, 33, 1767–1775. [Google Scholar] [CrossRef]
  39. Han, L.; Yang, S.; Dai, L.; Cao, J.; Mou, Y.; Wu, X. Casing Deformation and Controlling Methods During Hydraulic Fracturing Shale Gas Reservoirs in China: What We Known and Tried. In Proceedings of the SPE Oklahoma City Oil and Gas Symposium, Oklahoma City, OK, USA, 17–19 April 2023. [Google Scholar] [CrossRef]
  40. Mindygaliyeva, B.; Bekbossinov, N.; Kazemi, H. Application of Fracture Injection Test, Rate Transient Analysis, and Pearson Correlation in Niobrara and Codell Formations to Evaluate Reservoir Performance in a Northern DJ Basin. In Proceedings of the 56th U.S. Rock Mechanics/Geomechanics Symposium, Santa Fe, NM, USA, 26–29 June 2022. [Google Scholar] [CrossRef]
  41. Hu, D.; Lei, Z.; Cartwright, S.; Samoil, S.; Xie, S.; Chen, Z. Refracturing Candidate Selection in Tight Oil Reservoirs Using Hybrid Analysis of Data and Physics Based Models. In Proceedings of the SPE Canadian Energy Technology Conference, Calgary, AB, Canada, 16–17 March 2022. [Google Scholar] [CrossRef]
  42. Gogoi, T.; Chatterjee, R. Neural network analysis and seismic-velocity model building in Upper Assam Basin, India: An aid to reservoir-characterization study. In Proceedings of the 2018 SEG International Exposition and Annual Meeting, Anaheim, CA, USA, 14–19 October 2018. [Google Scholar] [CrossRef]
  43. Wang, J.; Sun, H.; Ren, B.; Yin, J. Application of staged sand filling fracturing technology in horizontal shale oil wells with deformed casings. Pet. Drill. Tech. 2021, 49, 139–142. [Google Scholar]
  44. Zhang, H. Hydraulic shaping technology of deformed casing after fracturing in horizontal shale oil wells. Pet. Drill. Tech. 2023, 51, 173–178. [Google Scholar]
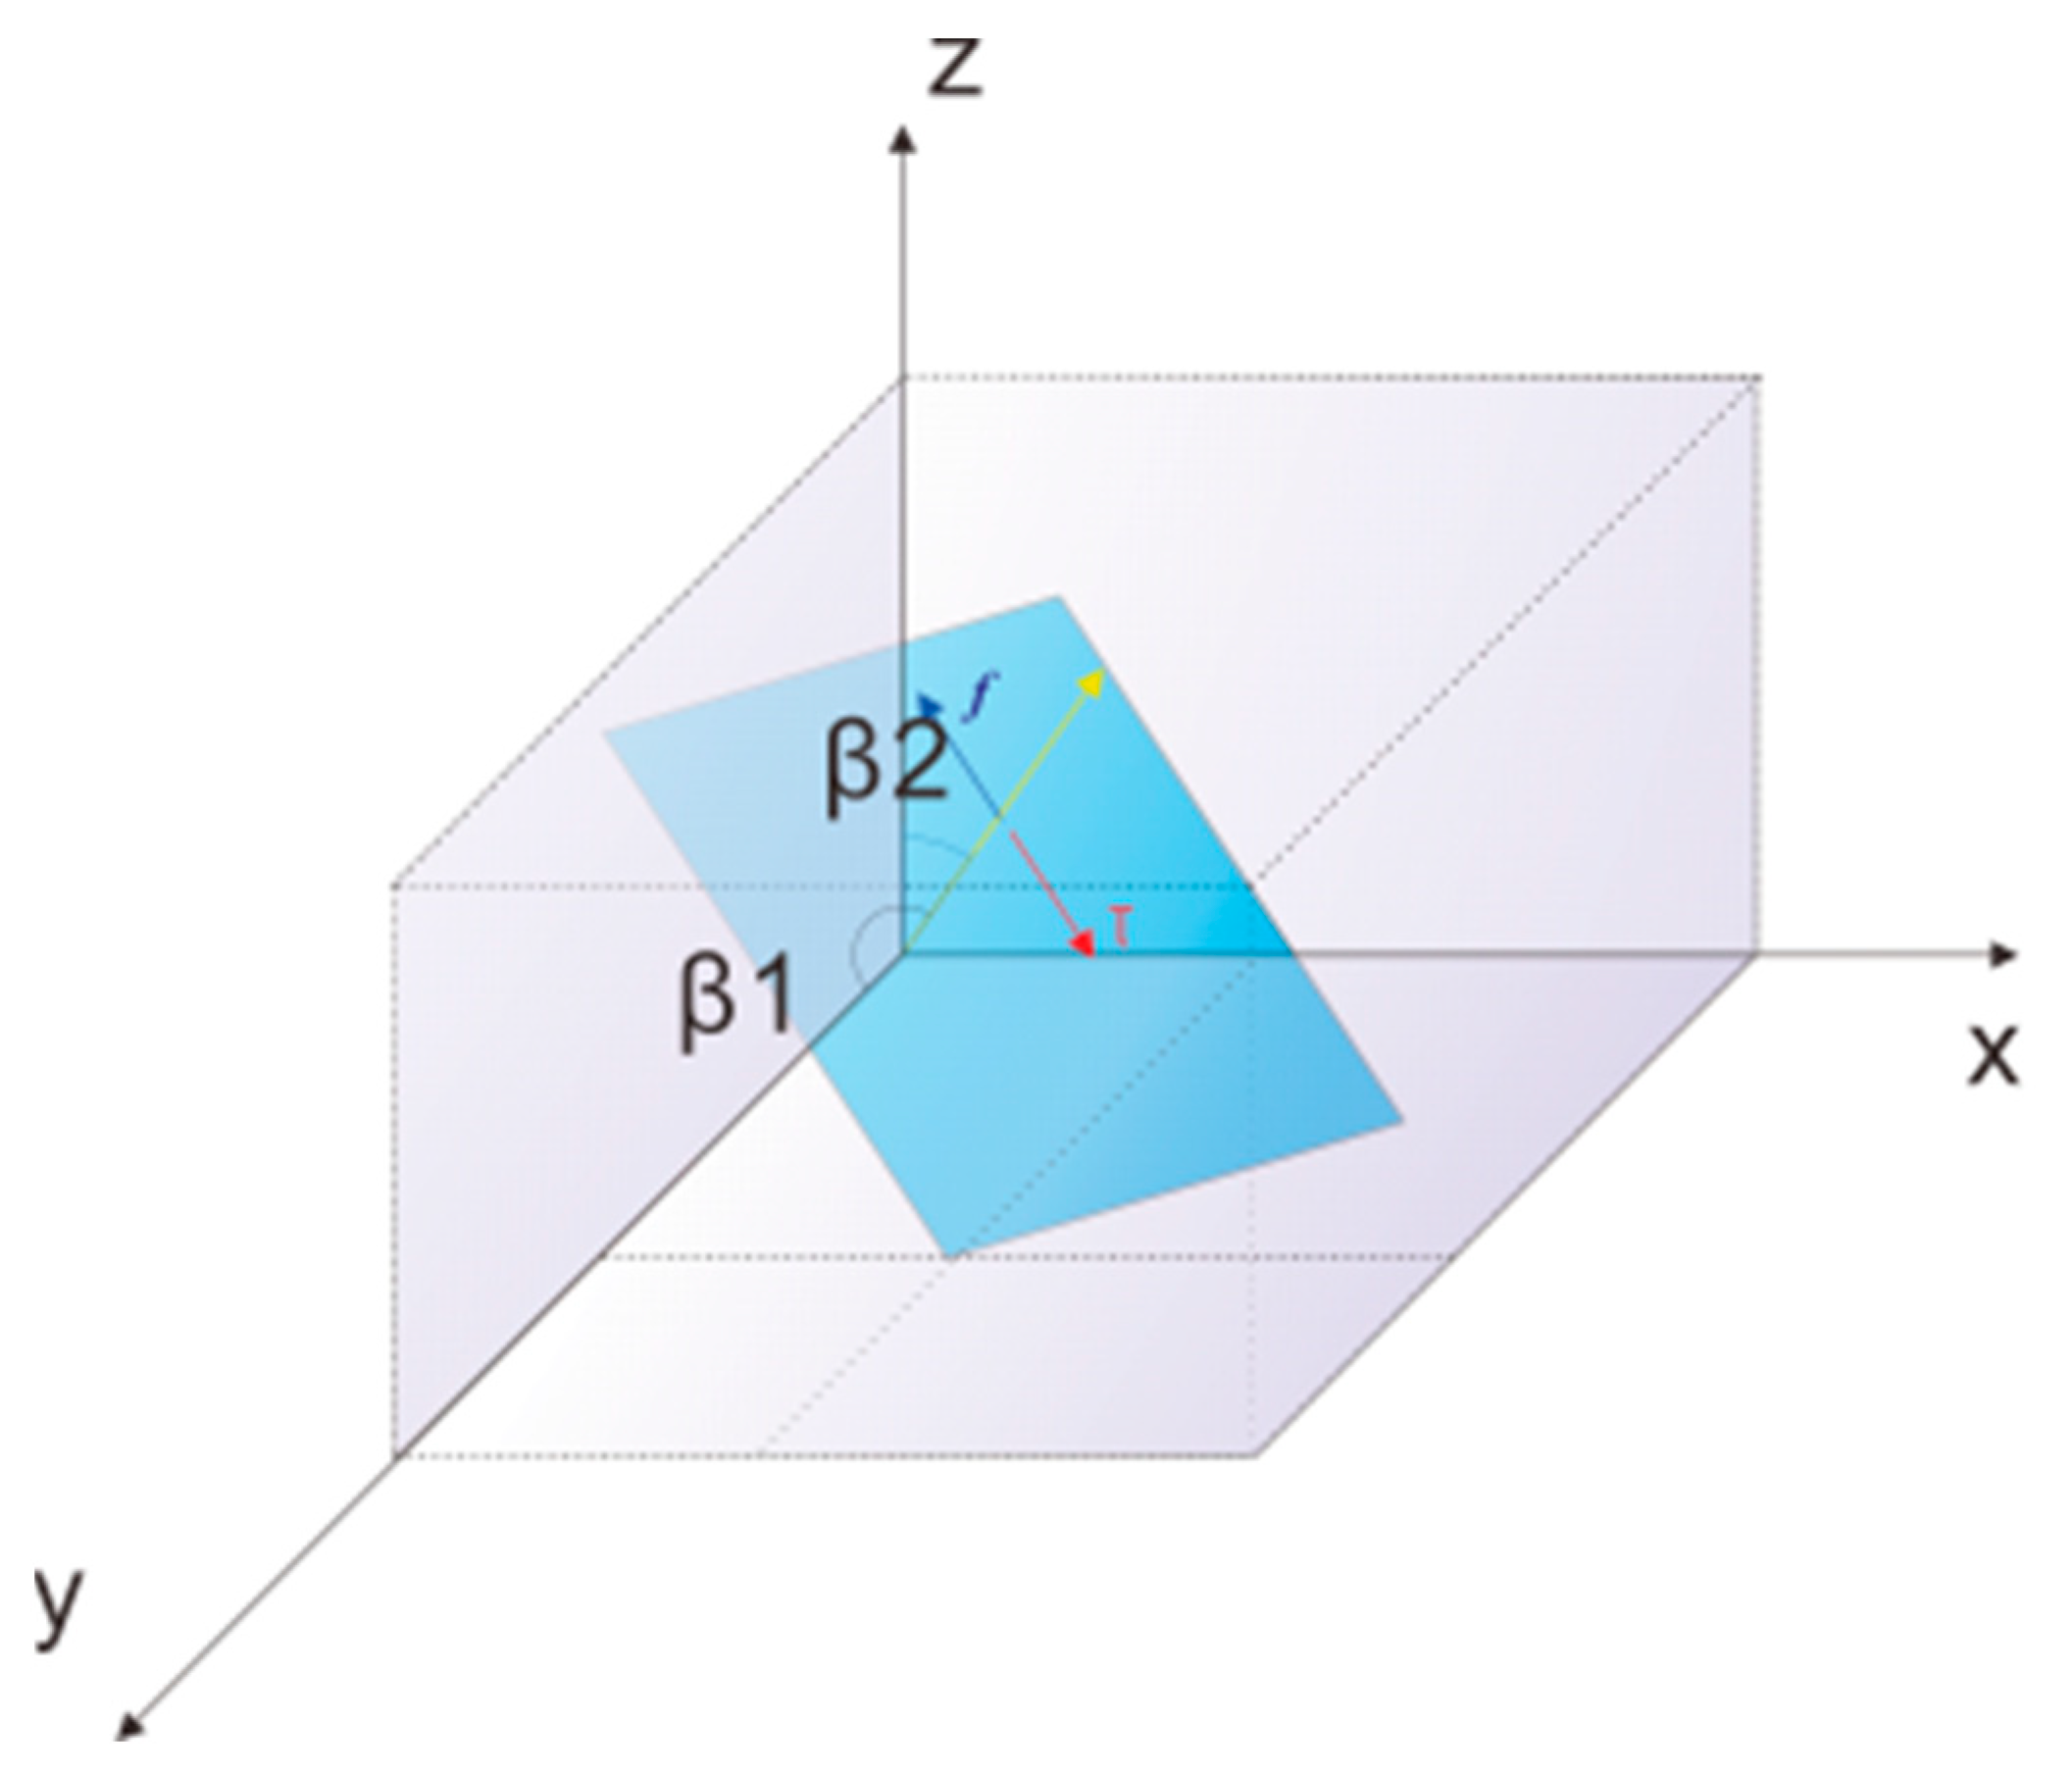
Figure 1. Distribution and stress of fracture zone.
Processes 12 02057 g001
Figure 2. Mohr–Coulomb stress circle.
Processes 12 02057 g002
Figure 3. Model of hydraulic fracture communicating with the fracture zone.
Processes 12 02057 g003
Figure 4. Production time and casing deformation distribution of shale gas wells in an area of the Luzhou block.
Processes 12 02057 g004
Figure 5. Relationship between injection rate and casing deformation for shale gas wells in an area of the Luzhou block.
Processes 12 02057 g005
Figure 6. Flow chart of casing deformation prediction.
Processes 12 02057 g006
Figure 7. Early warning of casing deformation based on optical fiber monitoring of an adjacent well.
Processes 12 02057 g007
Figure 8. Correlation between fracturing engineering parameters and casing deformation.
Processes 12 02057 g008
Figure 9. Grey correlation analysis of fracturing engineering parameters and casing deformation.
Processes 12 02057 g009
Figure 10. Neural network analysis of fracturing engineering parameters and casing deformation.
Processes 12 02057 g010
Figure 11. Workover process of seriously deformed shale gas wells.
Processes 12 02057 g011
Figure 12. Casing deformation in the Luzhou block in the last two years.
Processes 12 02057 g012
Table 1. Local formation stability evaluation based on fracture zone stability.
Type of EvaluationItemIndexApplication
StaticInitial slip of fracture zone (fault + stress) Dominant   orientation   of   fracture   zone   slip   under   different   in   situ   stress   states :   β = π 4 + 1 2 tan 1 μ Verification of casing deformation prior to fracturing;
Division of risk section prior to fracturing.
Critical   value   of   pore   pressure   increase :   Δ P p c r i t i c a l = σ 1 + σ 3 2 σ 1 σ 3 2 sin α
DynamicCommunication of fracture zone (time + space)Fault-
dominated reservoir
Distance   between   fracture   zone   and   wellbore :   D w N F Division of risk section prior to fracturing;
Fine design of fracturing parameters.
Matrix-
dominated reservoir
Critical   transmission   pressure   difference :   Δ P c o n = σ H m i n + T P p Δ P p c r i t i c a l
Reservoir   transmissibility   χ = K ξ C t
Table 2. Explanation of the stress mechanism of the b value and rock failure mechanism.
ValueMagnitudeStress MechanismFailure Mechanism
b < 1Large Compressive stress (reverse fault)Compression
b ≈ 1Moderate Shear stress (strike–slip fault)Shear
b > 1Low Tensile stress (normal fault)Tension
Table 3. Risk assessment criteria for deformation based on microseismic results in the C block.
Risk Level of Casing DeformationMagnitude from Ground MicroseismicMagnitude from Microseismic in Wellsb from Ground Microseismicb from Ground Microseismic in Wells
HighMw ≥ −0.1Mw ≥ −0.46b ≤ 1.59b ≤ 1.02
Middle−0.6 < Mw < −0.1−1.3 < Mw < −0.461.59 < b < 1.621.02 < b < 1.11
LowMw ≤ −0.6Mw ≤ −1.3b ≥ 1.62b ≥ 1.11
Disclaimer/Publisher’s Note: The statements, opinions and data contained in all publications are solely those of the individual author(s) and contributor(s) and not of MDPI and/or the editor(s). MDPI and/or the editor(s) disclaim responsibility for any injury to people or property resulting from any ideas, methods, instructions or products referred to in the content.