Article

The Optimization of the Rear Guide Vane of a Bulb Tubular Pump Based on Orthogonal Tests

1
National Research Center of Pumps, Jiangsu University, Zhenjiang 212013, China
2
General Irrigation Canal Management Office of Jiangsu Province, Huai’an 223001, China
*
Author to whom correspondence should be addressed.
Processes 2025, 13(1), 264; https://doi.org/10.3390/pr13010264
Submission received: 29 November 2024 / Revised: 3 January 2025 / Accepted: 5 January 2025 / Published: 17 January 2025

Abstract

:
Bulb tubular pumps have been widely used in hydraulic engineering because of their compact structure, easy maintenance, high adaptability, and other characteristics. In this paper, the performance optimization of the bulb tubular pump in the South-to-North water diversion project is studied, as well as the influence of the design of the rear guide vane structure on the hydraulic efficiency of the pump. This study takes a certain type of bulb tubular pump as its research object, optimizing the rear guide vane. Firstly, the accuracy of the numerical simulation method is verified using grid convergence analysis and model experimentation. The orthogonal experimental design method is used to optimize the design, and the range analysis results show that the blade wrap angle has the most significant influence on the hydraulic efficiency and head. Finally, the optimization results under a 0° impeller setting angle were verified by numerical analysis, and the hydraulic efficiency of the optimized pump was increased by 0.7%, 0.88%, and 1.1% under low flow, design flow, and high flow, respectively. By introducing entropy generation theory for inflow analysis, the reduction in energy loss in the pump is proven, thus verifying the effectiveness of the optimization. Through the optimization, the separation fluid phenomenon on the guide vane surface is improved, the vortex scale is reduced, and the flow field in the pump is improved to a certain extent.

1. Introduction

Bulb tubular pumps are extensively utilized in hydraulic engineering applications because of their characteristics of substantial flow, low head, high efficiency, and high reliability. In addition, it is essential to have bulb turbine pumps that can work in two modes in order to reduce the need for ultra-low head pumping. Bulb tubular pumps hold great potential for utilization in ultra-low head storage and cost-effective power generation facilities [1,2]. Scholars have conducted extensive research on performance optimization, flow field analysis, mechanism design, vibration, and noise [3,4,5,6]. Bulb tubular pumps mainly comprise an impeller, diffuser vane, and other flow components, as shown in Figure 1. The inlet channel is mainly responsible for the smooth flow of water into the impeller. The impeller, as a work component, provides energy for the fluid. The guide vane and outlet flow channel are mainly responsible for cooperation and function as a pressure recovery part and flow guide.
Scholars have conducted a lot of research in relation to the optimization of the impeller [7,8]. Optimizing the design of the diffuser, as an important flow component, can further improve the efficiency of the pump, reduce operating costs, and extend its service life.
Nguyen et al. [9] investigated the effect of the inlet orientation and setting angle of the guide vane of an axial flow pump to investigate hydraulic performance through the numerical simulation method. Zhao et al. [10] used five design schemes with different guide vane angles in their study to comparatively investigate the improvement in hydraulic efficiency for each design configuration of an axial flow pump through numerical simulation and experimental validation. In order to study the internal flow characteristics of centrifugal pumps with diffused guide vanes, Li et al. [11] adopted the delayed separation eddy simulation method to simulate the unsteady flow phenomenon of centrifugal pumps with guide vanes. Investigating the cavitation problem in the pump, Long et al. [12] analyzed the cavitation–vortex interaction through experimental and numerical simulation methods. Exploring the unstable flow phenomenon caused by flow separation, Nguyen et al. [13] used a multi-objective optimization method to optimize the guide vane of an axial flow pump.
Furthermore, Shi et al. [14] analyzed the impact of different guide vane rotation angles and inlet angles on the performance of axial flow pumps. The results show that adjusting the different guide vane rotation angles significantly improves the efficiency of the axial flow pumps.
Yan et al. [15] used optimization algorithms to optimize the design parameters of the guide vanes, verifying them through numerical simulations. Tong et al. [16] used the EDH optimization method to expand the high-efficiency zone of the slanted axial flow pump, and the head and efficiency of the pump were improved after optimization. The optimized design scheme improved the hydraulic performance of the axial flow pump device. Zhang et al. [17] analyzed the influence of the trailing edge stacking of diffusion guide blades on pump flow and proposed that the reasonable adjustment of the envelope angle difference could restrain the generation of a secondary flow separation vortex on the wheel hub surface. Wang et al. [18] optimized the design of the return channel between the guide vane with a shunt blade and the blade through orthogonal experimental design, and the efficiency of 0.6Qd was improved by nearly 3% through optimization. Xu et al. [19] adjusted the angle of the guide vane inlet section to 0° and −12°, respectively, to analyze the pump’s performance after adjustment. The results showed that when the angle of the guide vane at the inlet section was adjusted in the clockwise direction, the efficiency of the equipment at the optimal working point would be improved. Pei et al. [20] used the entropy generation method to simulate the effect of the distance between the impeller and the guide vane on internal flow resistance and total power loss to understand the mechanism of hydraulic losses. To ensure the stable operation of the pump turbine, Zhang et al. [21] optimized the guide vane shape using guide vane strength as a constraint. CFD methods were used and experimentally validated to investigate the pump turbine’s performance before and after optimization. The results showed that the unit’s grid-connected performance was improved through optimized guide vanes. Li et al. [22] used numerical simulation to compare and analyze the performance of axial flow pumps with different guide vane inlet slopes. The results revealed that reducing the hub height of the guide vane improves the head and efficiency of the axial flow pump. The entropy production theory can be used to analyze the energy loss mechanism inside the pump, which provides a practical reference for the pump’s performance optimization. Tian et al. [23] investigated internal flow characteristics and entropy generation as the main components of low-head bulb tube pumps. They found that as the head decreases, the entropy generation increases progressively. However, the impeller contributes a large proportion of the total entropy generation. Sun et al. [24] explored the energy loss of bulb tubular pumps under off-design conditions through numerical simulation. Their study focused on analyzing the power loss characteristics of each flow channel component and quantitatively investigated the energy loss distribution under different flow rates through the combination of entropy generation and energy balance equations, providing theoretical guidance for the design optimization of bulb tubular pumps. Shi et al. [25] analyzed the effect of cascade density on flow dissipation in the pump using the CFD method.
Yu et al. [26] investigated the effect of tip clearance on cavitation performance and entropy generation in a tubular pump. Their research focused on the relationship between tip clearance and cavitation and its impact on energy dissipation characteristics. The size of the tip clearance was found to significantly affect the spatial distribution of the tip leakage vortex cavitation. In contrast, the entropy generation rate distribution at the tip is related to the cavitation drain level of the pump and the shape of the tip drain. Cheng et al. [27] studied the energy, cavitation, runaway characteristics, and pressure pulsation of the tubular pump under different blade angles through model tests. The efficiency of the optimal efficiency point of the pump under different blade angles was compared, and the optimal blade installation angle was obtained.
Shi et al. [28] calculated the energy loss of a tubular pump under stall conditions based on the principle of entropy generation. Turbulent entropy generation in the impeller was higher under low flow conditions, especially in the flow separation region at the exit of the impeller suction surface, and showed divergence at the inlet of the guide vane and the guide vane trailing edge.
Ji et al. [29] investigated the energy loss distribution characteristics of an axial flow pump system based on entropy generation theory. The impeller and outlet channel were found to be the main regions of energy loss, and turbulent entropy generation was the main cause of this loss. This study further optimizes the theoretical basis for axial flow pump systems.
Meng et al. [30] investigate energy dissipation distribution in a tubular pump with different backflow clearance radii based on the entropy generation theory. The guide vanes of bulb tubular pumps have been extensively studied through numerical simulations and experimental investigations, with a focus on internal flow field characteristics and structural design optimization. For optimization design, scholars mainly focus on the effect of the number of guide vanes and the variation in the design parameters of individual guide vanes on external characteristics. Limited research was found on the multi-parameter optimization of downstream guide vanes.
In this study, the orthogonal experimental design method is used to optimize the design parameters of the rear guide vanes of bulb tubular pumps. Five main design parameters that significantly affect the external characteristics were selected to fabricate an L27 orthogonal table. Parametric modeling and numerical calculations were then performed according to the order in the orthogonal table. The numerical results were analyzed to evaluate the specific effect of each design parameter on head and performance. Based on these results, the optimized design was determined, and the efficiency of the optimized design was evaluated using internal flow field analysis and energy loss analysis.

2. Numerical Methodology and Verification

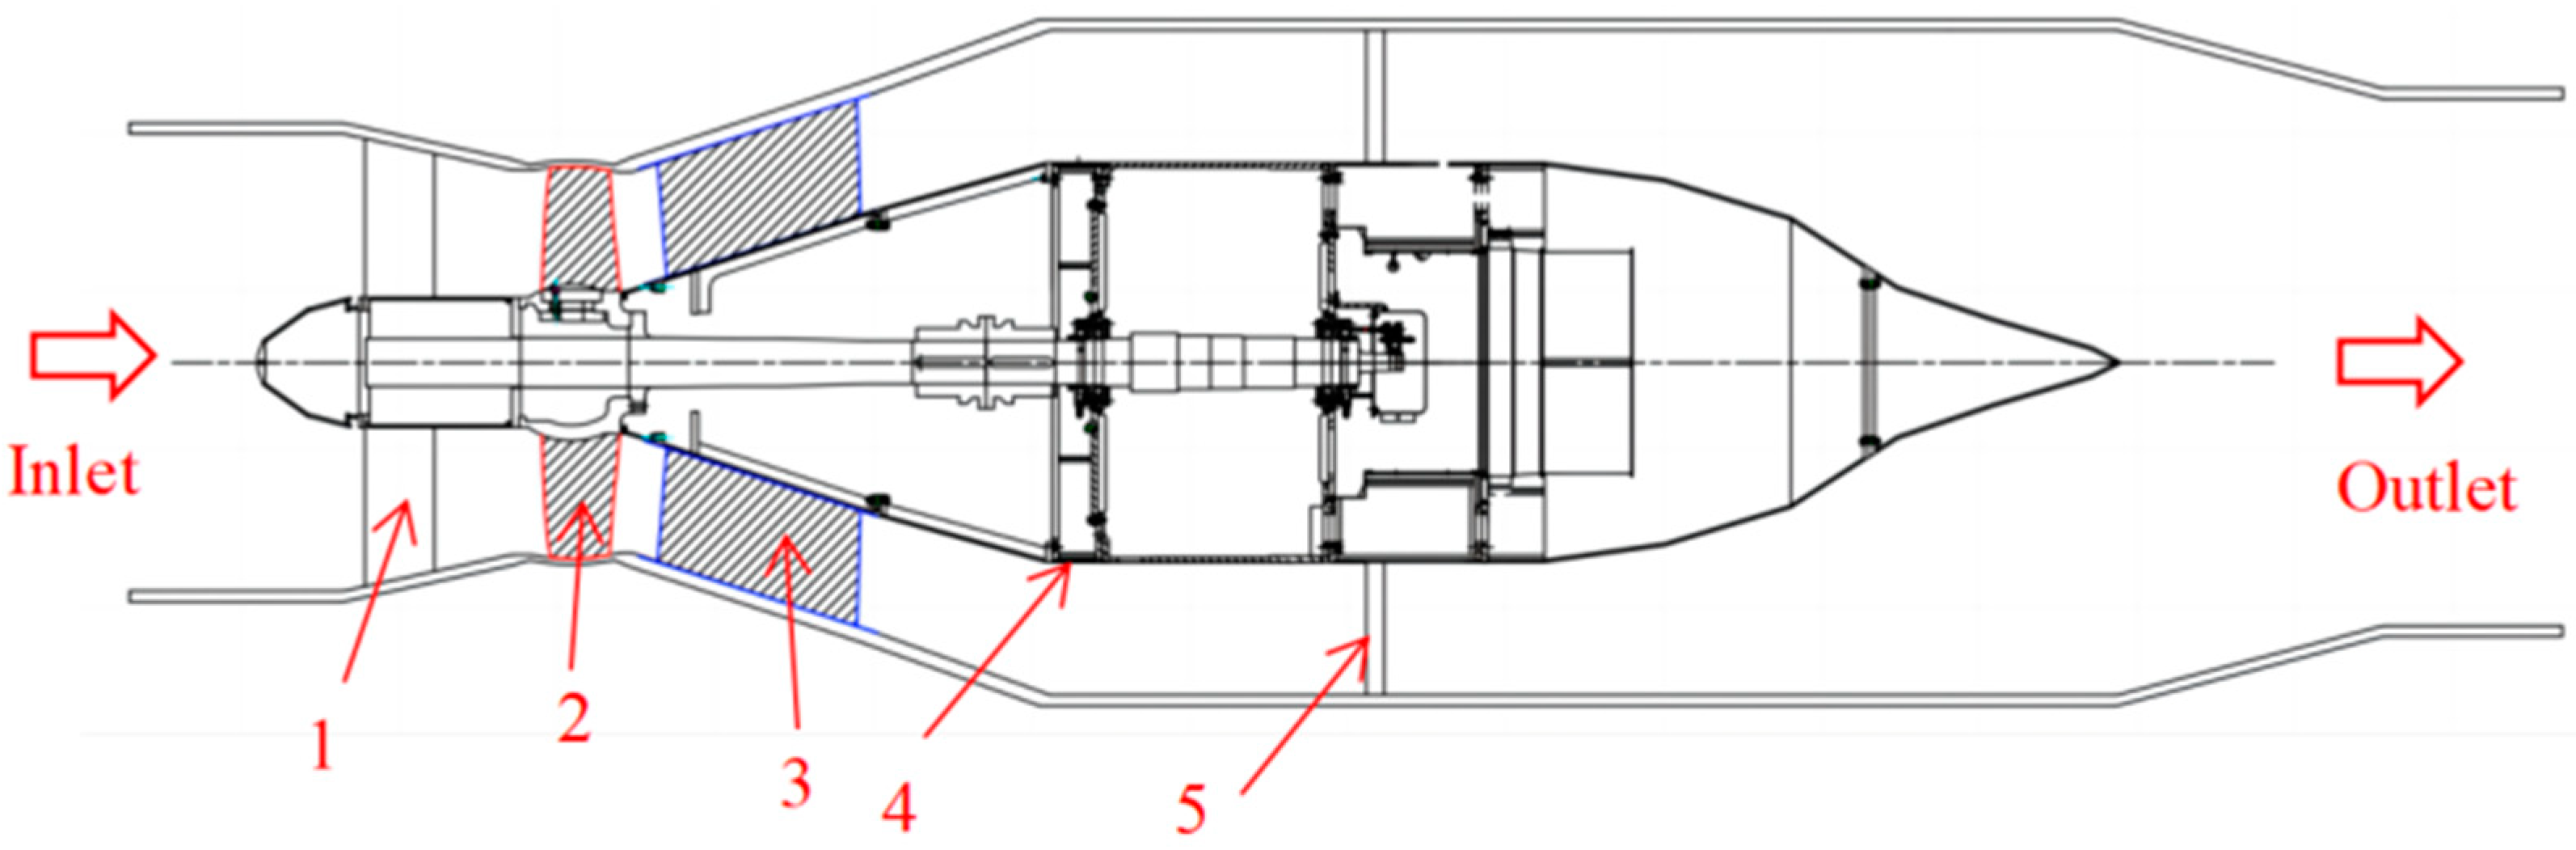
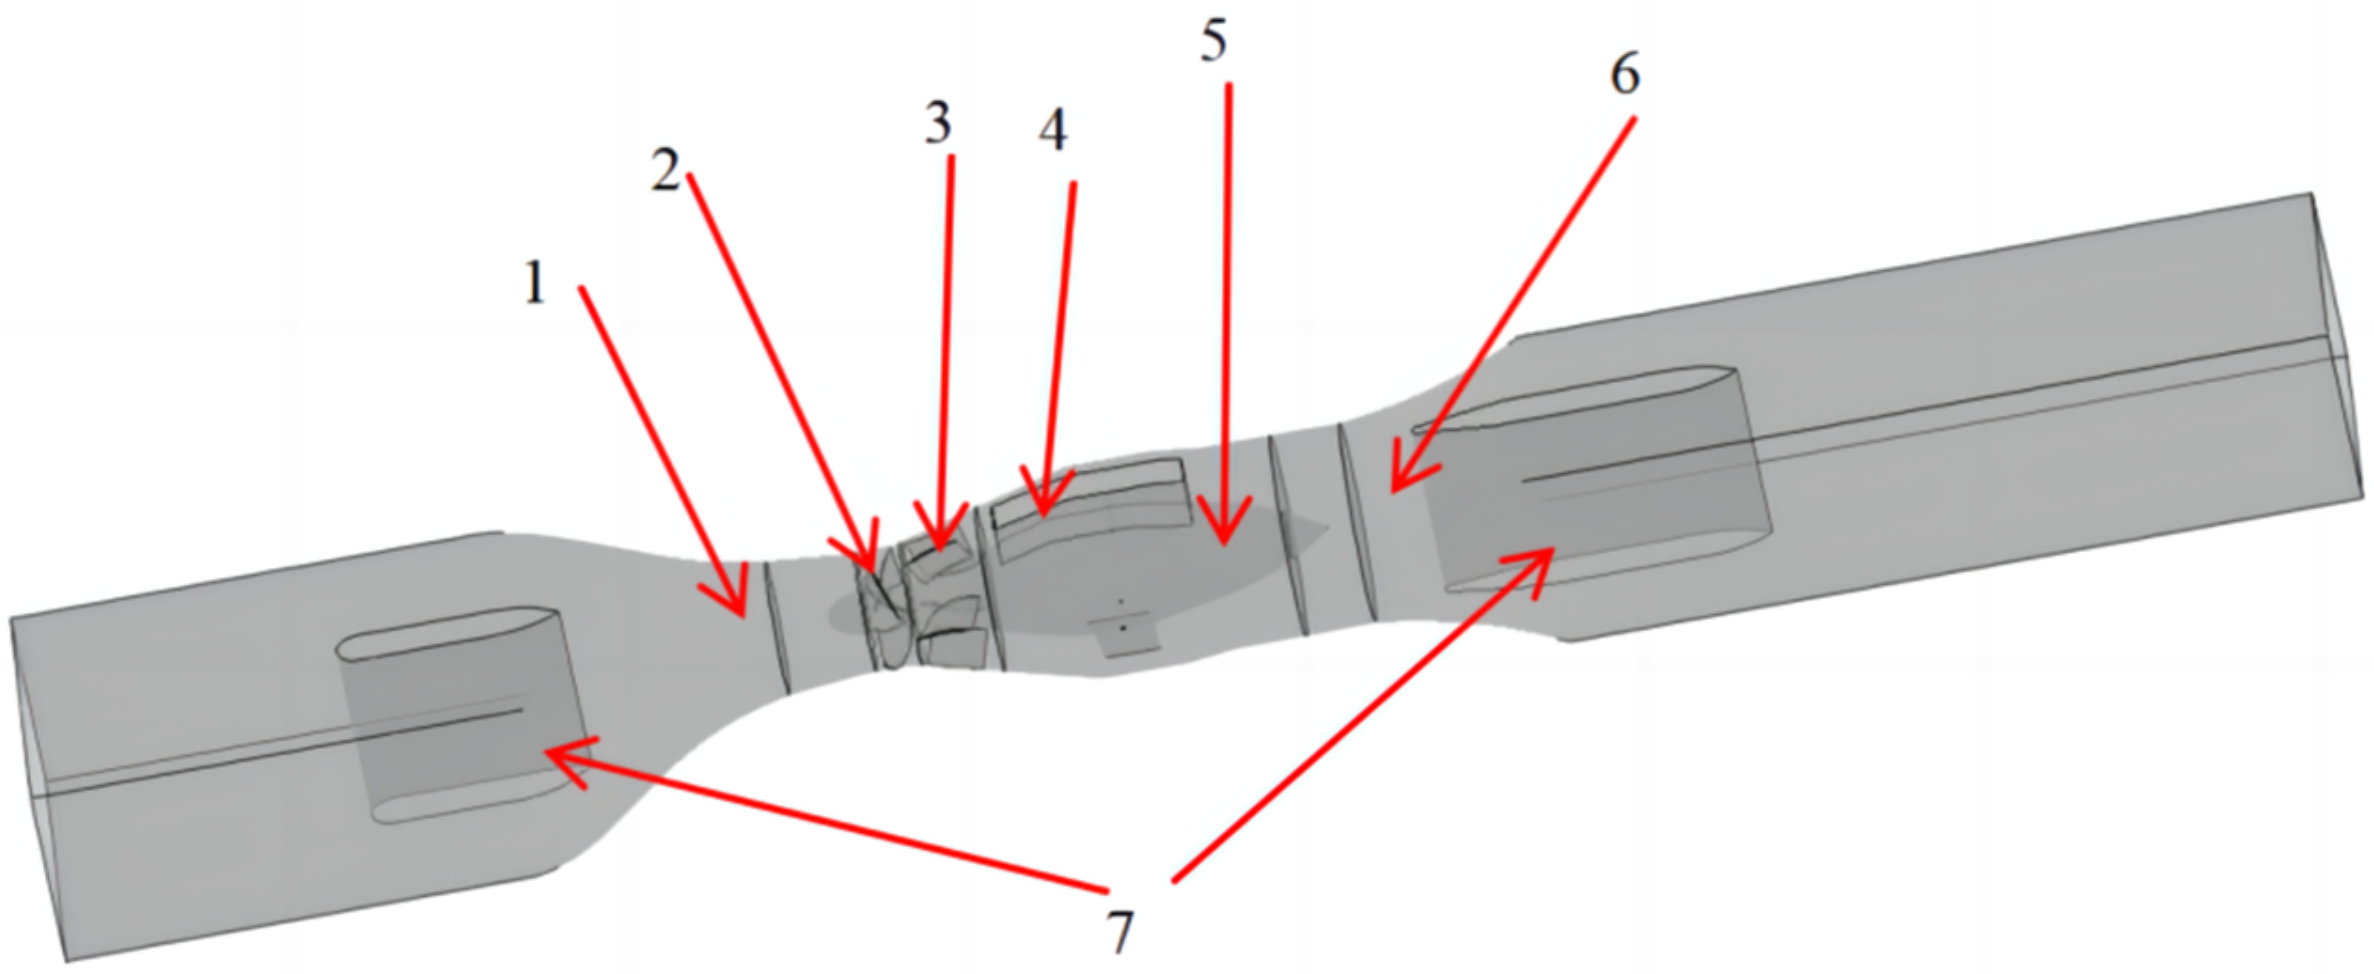
2.1. Model Description

In this work, a large bulb tubular pump device in the east route of the South-to-North water transfer project is taken as the research object. The basic design parameters of the device are as follows: flow rate is 64 m3/s and speed is 85.7 r/min. The specific structural parameters of the guide vane and impeller are shown in Table 1. The modeling software CREO was used to model the full-channel water body of the bulb tubular pump assembly, and the fluid calculation domain was divided into an inlet channel, impeller, guide vane, bulb body, and outlet channel. The conveying medium of the bulb tubular pump is clear water, for which the density and dynamic viscosity are ρ = 1   g / cm 3 and μ = 1.01 × 10 3   P a · s at nominal temperature, respectively. The Reynolds number [Equation (1)] is about 1.79 × 10⁷ in the nominal condition. The material of the pump impeller and shaft is stainless steel. The overall computing domain is shown in Figure 2.
R e = ρ u d μ
where ρ is the fluid density and u is the fluid flow velocity; here, the average velocity of the impeller inlet is the fluid flow velocity; d is the hydraulic diameter; here, the impeller inlet diameter is the hydraulic diameter; μ is the dynamic viscosity.

2.2. Numerical Simulation Method

2.2.1. Governing Equations

The flow control equation is the core equation that is used in fluid mechanics. For incompressible, Newtonian fluids, the flow-governing equations usually include the continuity equation, the N-S equation, and the energy equation.
(1)
Continuity equation
The continuity equation describes the principle of mass conservation in fluids. For incompressible fluids, the continuity equation can be expressed as follows:
ρ t + · ( ρ u ) = 0
where ρ is the density of the fluid; t is time; is the Hamilton operator; = x i + y j + z k ; and u is the velocity vector of fluid motion.
For a relatively simple steady flow, the following is true:
· ( ρ u ) = 0
If the fluid medium is an incompressible fluid, then
u x x + u y y + u z z = 0
(2)
N-S equation
For incompressible fluids, the N-S equation is as follows:
d u d t = f 1 ρ p + ν 2 u
where u represents the fluid velocity vector; t is time; ρ is the density of the fluid; p is static pressure; f is the external force on the fluid; and ν is the kinematic viscosity.
(3)
Energy equation
For incompressible, Newtonian fluids, the energy equation is usually expressed as a temperature equation to describe how the fluid’s temperature changes over time and space; for incompressible fluids, the energy equation (in the form of temperature) can be expressed as follows:
ρ c p T t + u · T = k 2 T + ϕ
where ρ is the density of the fluid; Cp is the specific heat capacity of the fluid; T is the temperature of the fluid; t is time; u is the velocity vector; is the gradient operator; k is the coefficient of heat conduction; and ϕ is the heat due to viscous dissipation.

2.2.2. Turbulence Model

The turbulence model is a mathematical model that is used to simulate and predict turbulent flow. Due to the complexity and randomness of turbulence, the direct solution of the N-S equation of fluid motion requires very high computational resources, so the turbulence model is usually used in engineering applications to approximate turbulence effects. Commonly used turbulence models include RNG k-ε, standard k-ω, SST k-ω, etc.
By modifying the viscous term in the governing equation and introducing the renormalization theory to modify the coefficient, RNG k-ε has a higher credibility and accuracy in the actual flow [31]. In order to better solve the wall function problem, Wilcox proposed a simpler form of the standard k-ω turbulence model. In order to better take into account the effect of the main shear stress transport, the SST k-ω turbulence model improves the definition of vortex viscosity based on the standard k-ω model so that the model’s prediction of the reverse pressure gradient flow is significantly improved.
The equation k of turbulent kinetic energy is as follows:
( ρ k ) t + ( ρ k u i ) x i = P k β * ρ k ω + x j μ + σ k μ t k x j
The turbulent frequency ω equation is as follows:
( ρ ω ) t + ρ ω μ i z i = α ω k P k β ρ ω 2 + z j μ + σ ω μ t ω x j + 2 1 F 1 ρ σ ω 2 1 ω k x j ω x j
where Pk is the turbulence generation term; μt is turbulent viscosity; α , β , β * , σ k , σ ω , σ ω 2 are the constants; and F1 is a mixed function.

2.2.3. Entropy Production Theory

The hydraulic efficiency of the pump device is closely related to the energy loss. By introducing the concept of entropy production, the entropy production is calculated to determine the degree of irreversibility in the system; then, the size of the energy loss can be estimated. In turbulent flow, the fluid velocity is composed of the average velocity and the pulsating velocity, and the corresponding entropy production rate is also divided into two parts. The first part is the entropy production rate caused by the time-averaged motion of the water flow. The second component is the entropy production rate resulting from the dissipation of turbulent kinetic energy due to the pulsating velocity of the turbulence.
The formula for calculating entropy production corresponding to time–mean motion is as follows:
S D ¯ = 2 μ e f f T u 1 ¯ x 1 2 + u 2 ¯ x 2 2 + u 3 ¯ x 3 2 + μ e f f T u 2 ¯ x 1 + u 1 ¯ x 2 2 + u 2 ¯ x 3 + u 3 ¯ x 2 2 + u 3 ¯ x 1 + u 1 ¯ x 3 2
The formula for calculating entropy production due to the dissipation of turbulent kinetic energy in the system is as follows:
S D = 2 μ e f f T u 1 x 1 2 + u 2 x 2 2 + u 3 x 3 2 + μ e f f T u 2 x 1 + u 1 x 2 2 + u 2 x 3 + u 3 x 2 2 + u 3 x 1 + u 1 x 3 2
μ e f f   = μ + μ t
where μ e f f is the dynamic viscosity, μ is the turbulent viscosity, and μ 1 is the turbulent dynamic viscosity.
The main entropy production due to turbulence can be expressed as follows:
S D ˙ = S D ˙ + S D ¯ ˙
S D ˙ = ρ ε T
where ε is the dissipation rate of turbulent kinetic energy.
The entropy production at the wall is calculated as follows:
S w ˙ = τ · v T
where τ is the wall shear stress and v is the velocity vector at the center of the first layer of the wall grid.
The total entropy production is calculated by integrating and summing the main flow entropy production and the wall entropy production. The formula is as follows:
S p r o , D ¯ = v S D ¯ ˙ d V
S p r o , D = v S D ˙ · d V
S p r o , W = A τ · v T d A
S p r o = S p r o , D + S p r o , D + S p r o , W
where S p r o , D ¯ is the time-averaged entropy production, S pro , D is the pulsating entropy production, S pro , W is the wall entropy production, V is the calculated volume, and A is the wall area.

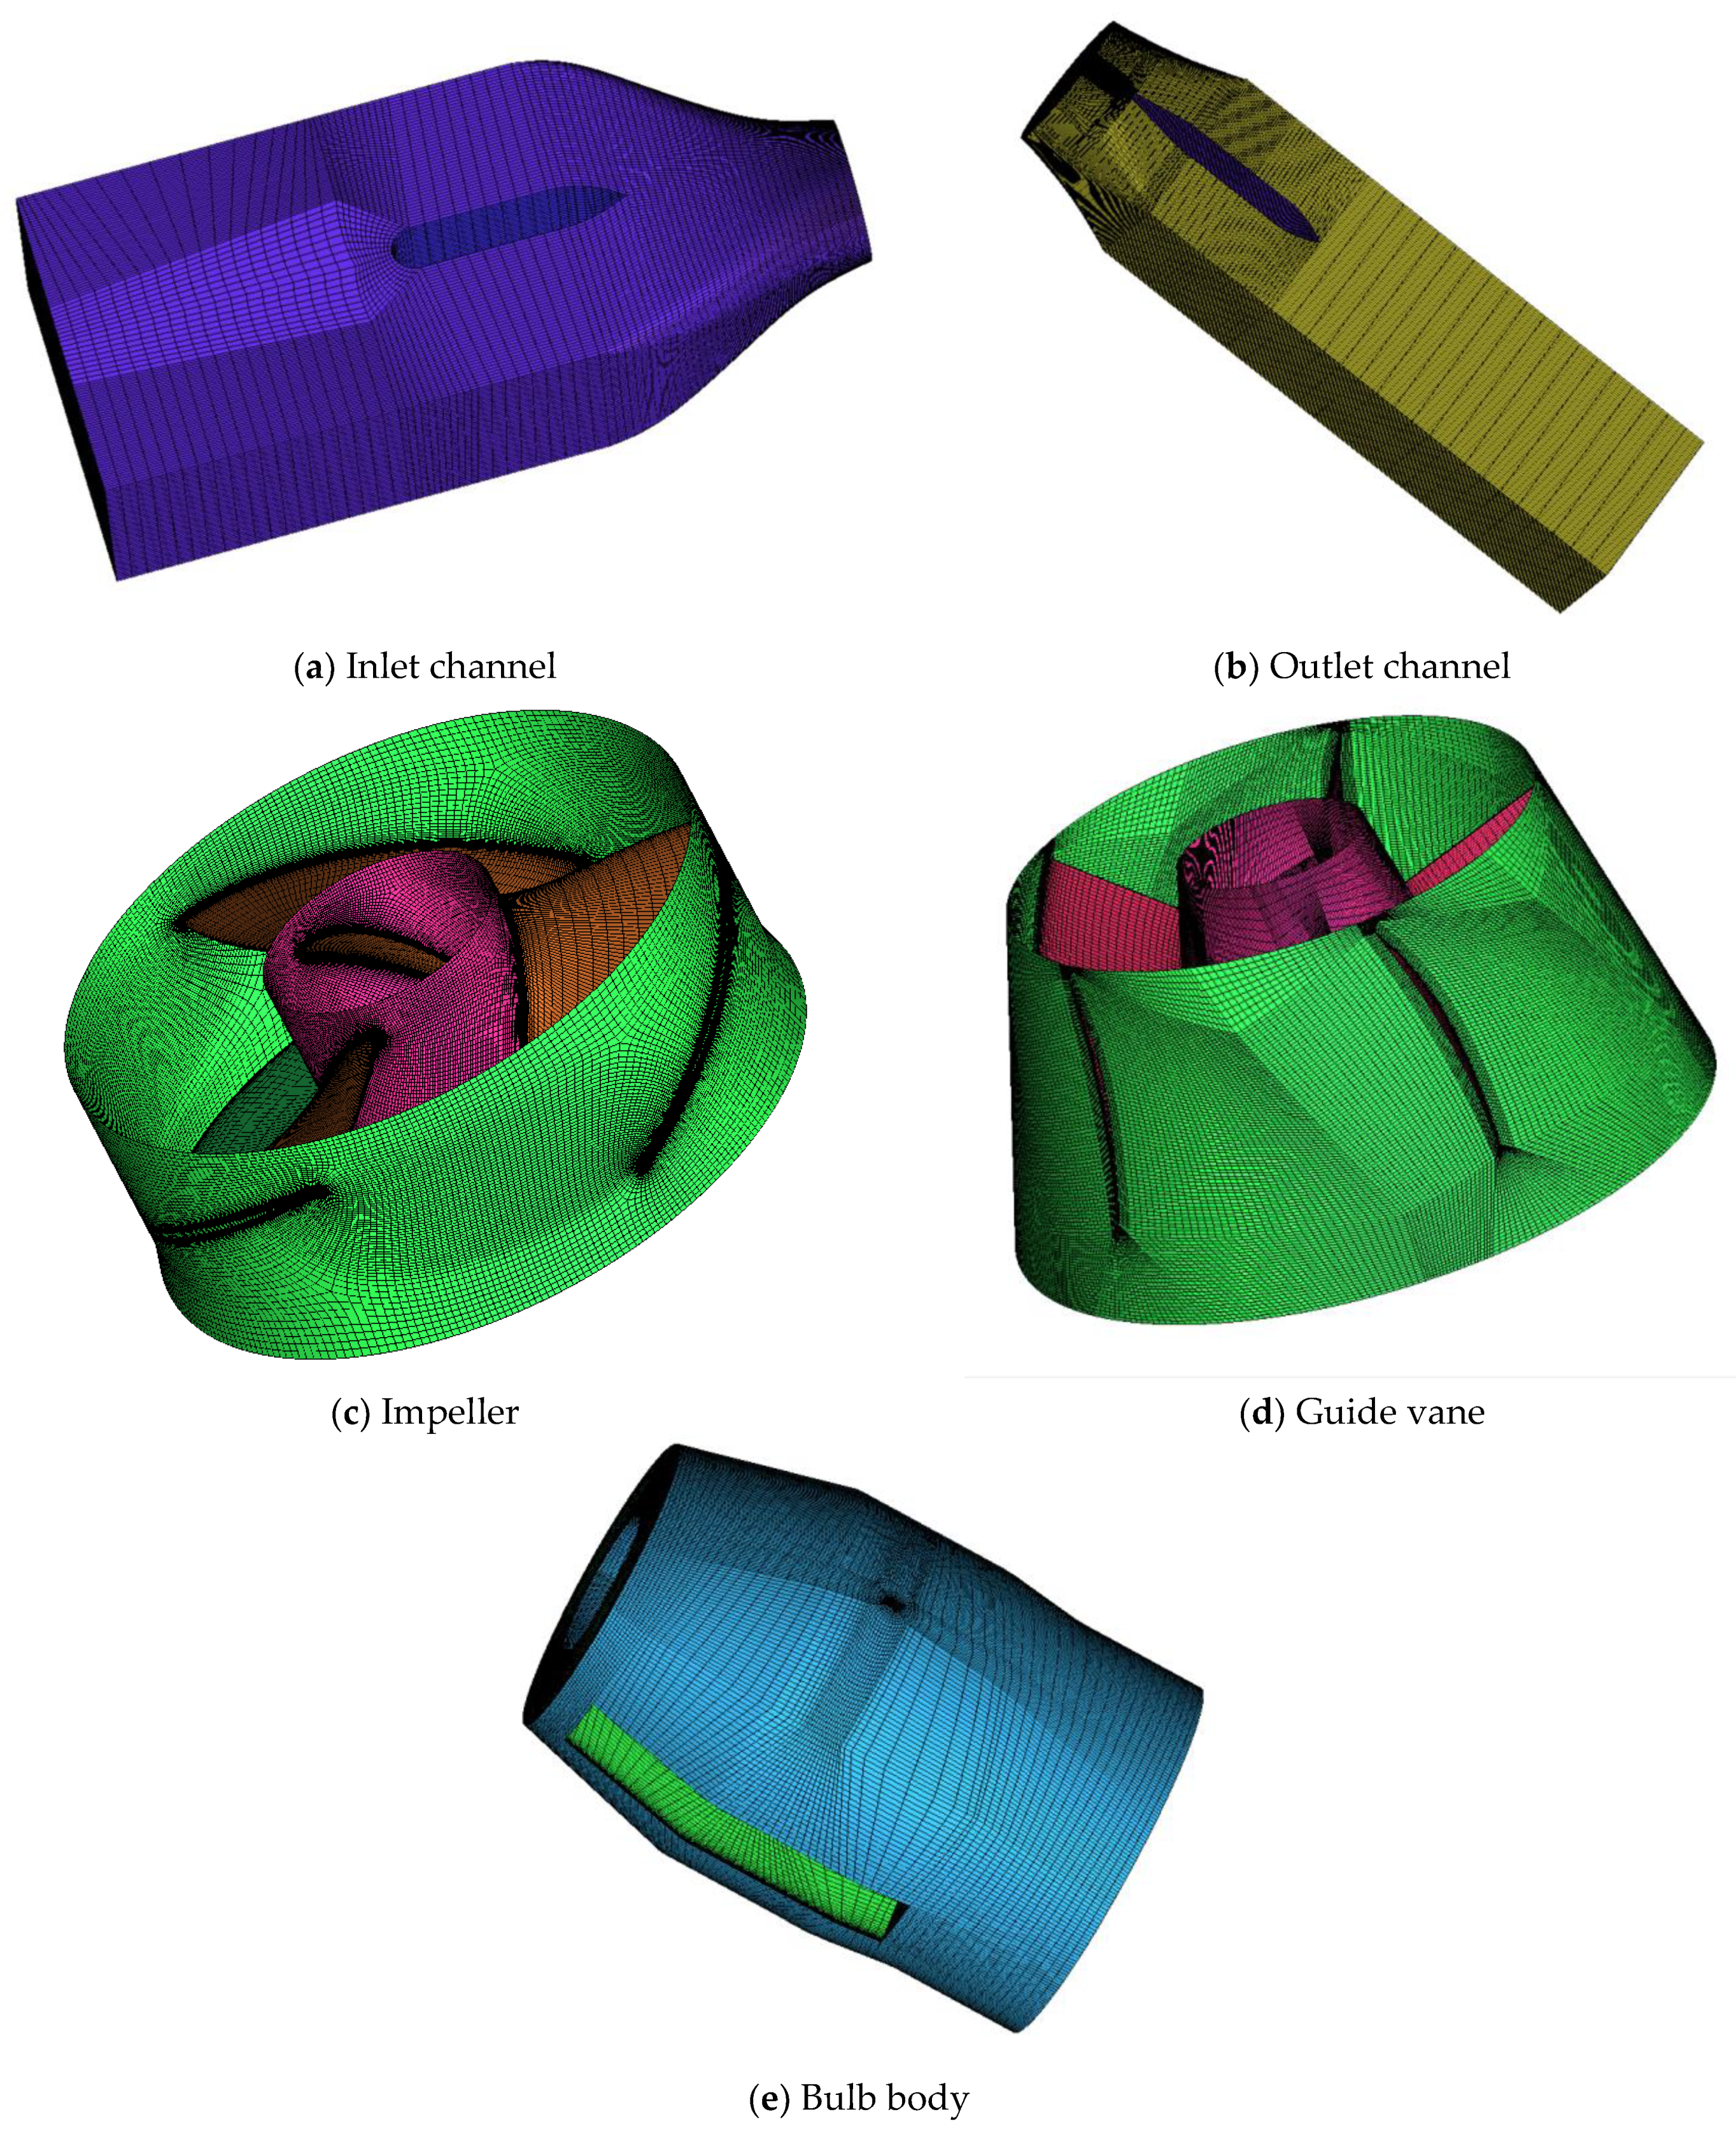
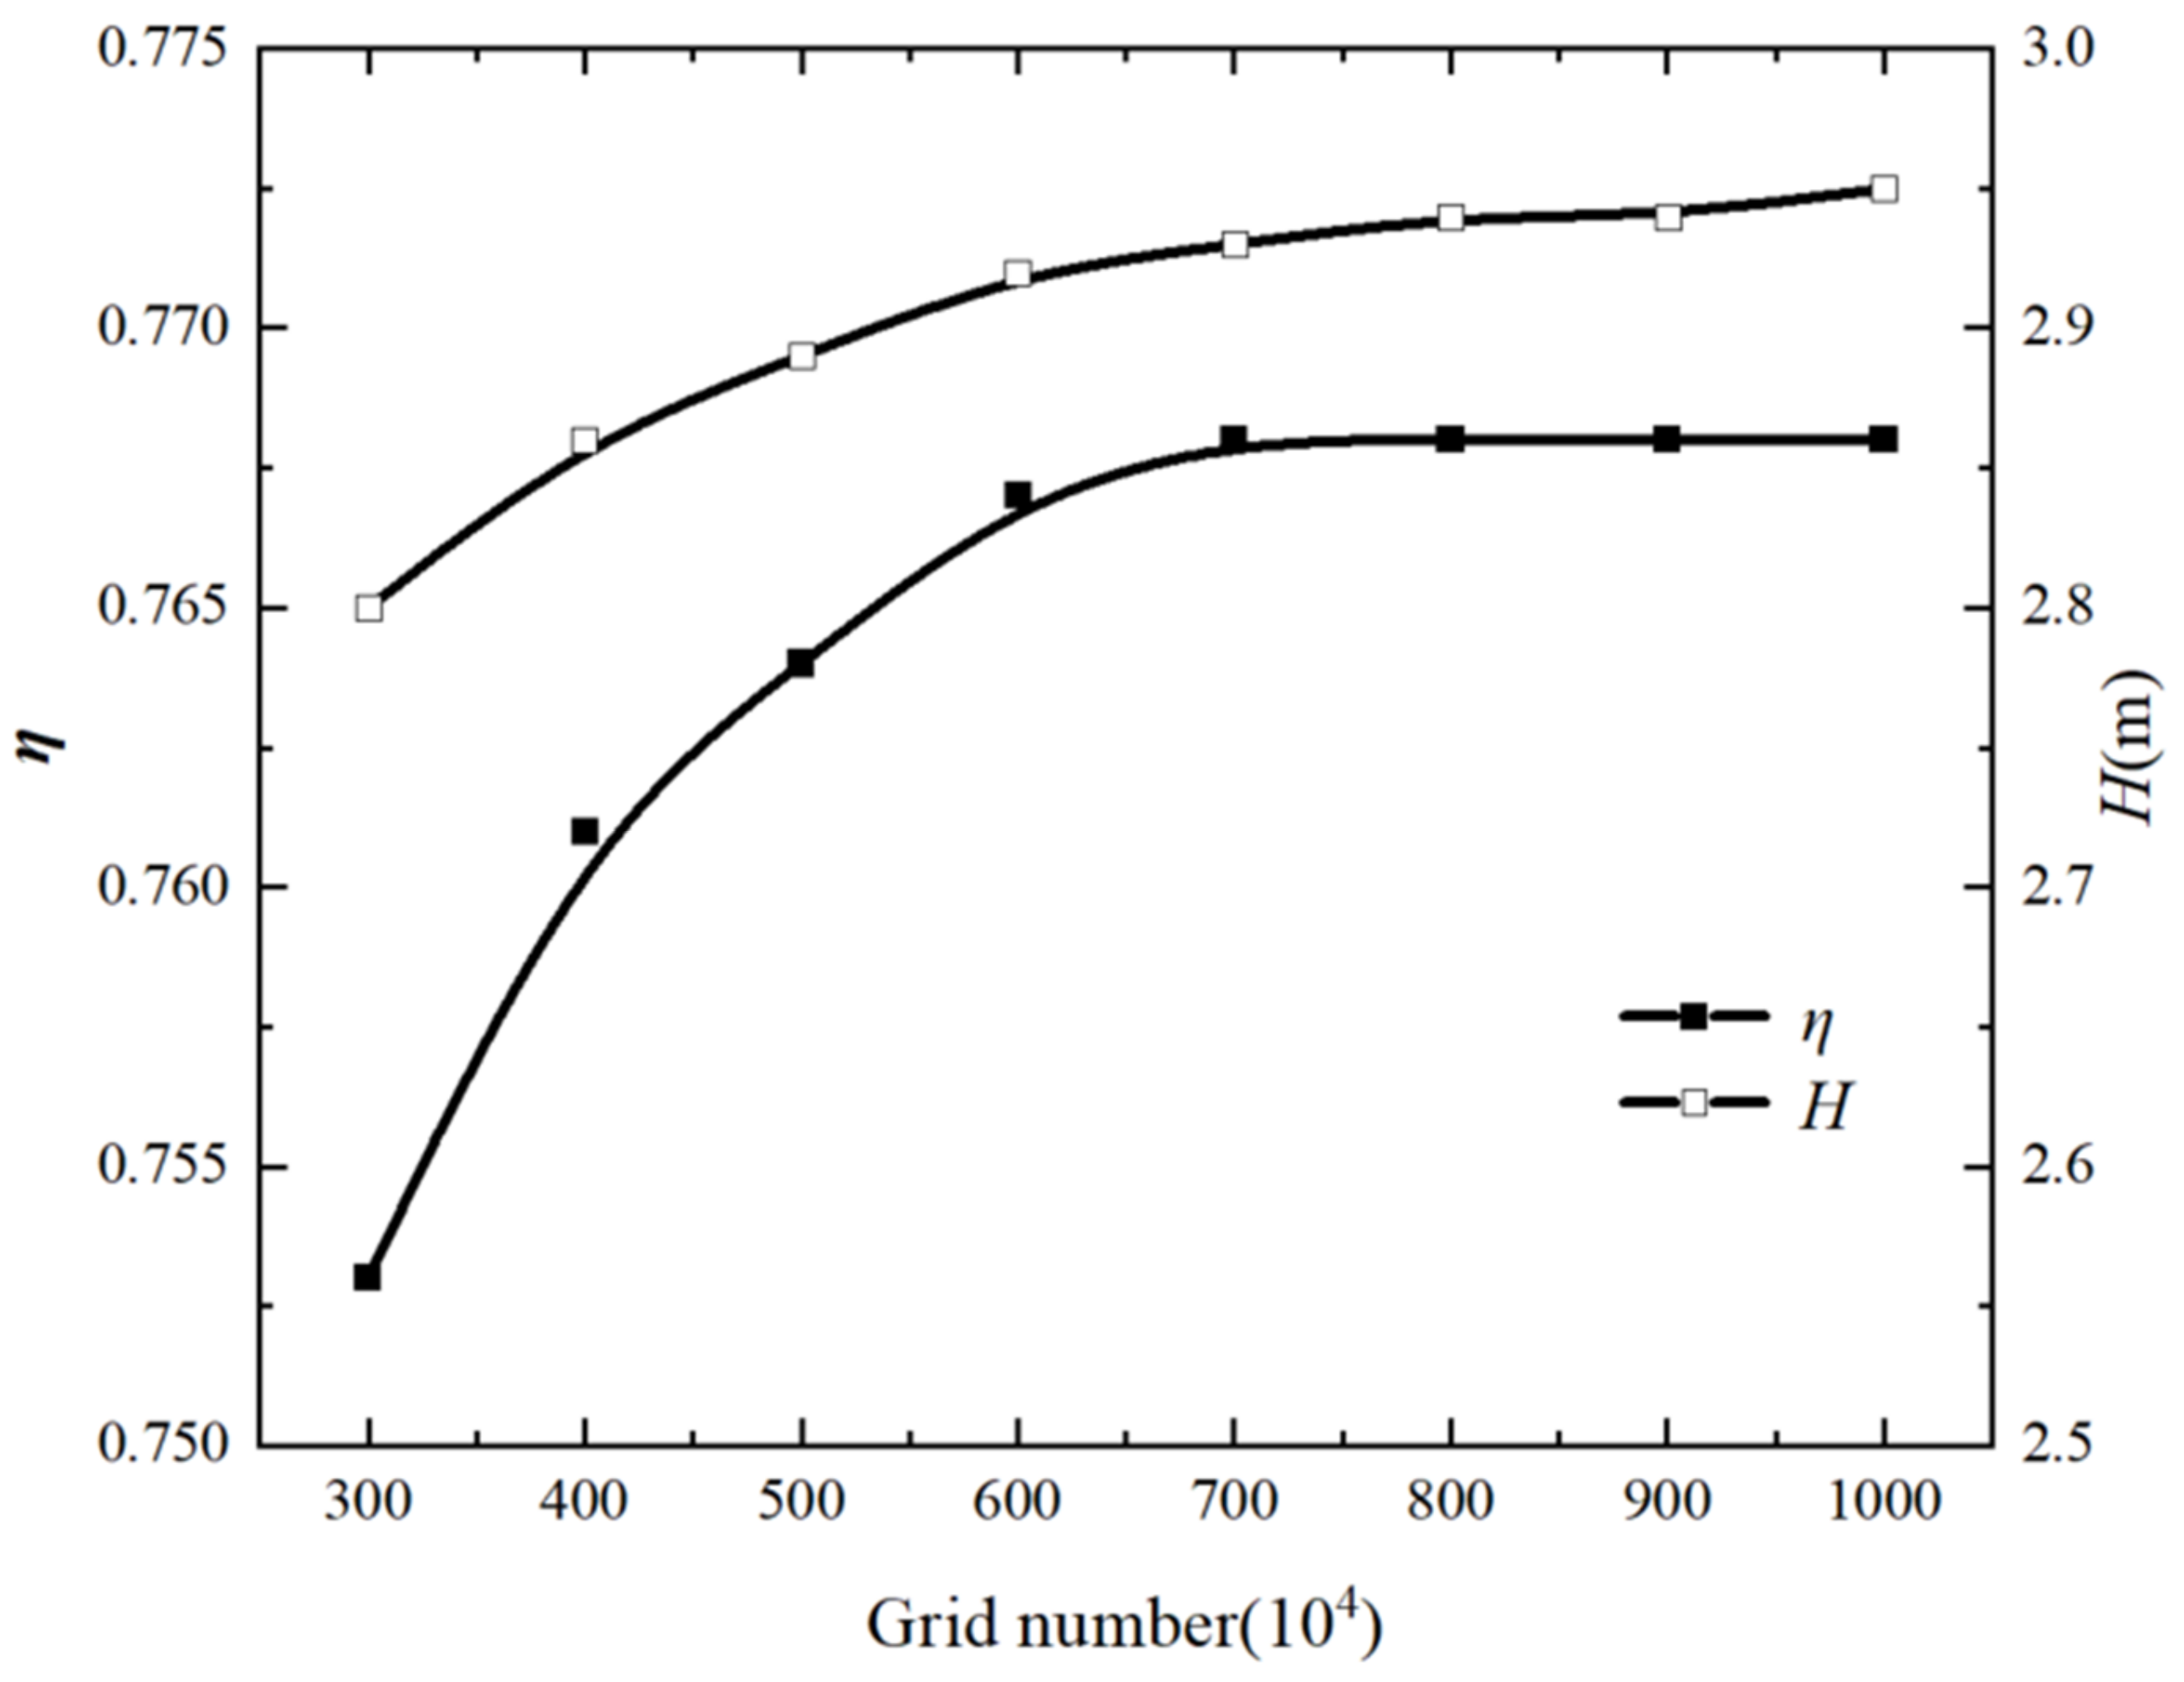
2.2.4. Mesh Generation

ANSYS ICEM 2020R2 and ANSYS TurboGrid 2020R2 were used to develop the structural mesh of the full-flow field. A hexahedral structural mesh was selected to improve the numerical accuracy and enhance the analytical ability of the flow field. In order to make the numerical model closer to the actual flow, a boundary layer mesh was used to locally encrypt the near wall. The mesh details of each flow component are shown in Figure 3.
Firstly, eight mesh schemes were established, and the external characteristics of axial flow pumps under each scheme were calculated. Figure 4 shows the grid convergence curve in the fluid calculation domain. It can be seen from the figure that when the number of grids exceeds 7 million, the head and hydraulic efficiency gradually stabilize and the relative change rate is less than 0.5%. The head and hydraulic efficiency formulas used in this paper are as follows:
H = Δ P ρ g
η = ρ g Q H ω T
where Δ P is the total pressure difference between import and export; ρ is the fluid density; g is the gravitational acceleration; Q is the outlet volume flow rate; ω is the angular velocity of the impeller; and T is the impeller torque.
Therefore, after comprehensively considering computing resources and accuracy, a mesh number of 7 million was finally selected for follow-up analysis, among which the inlet channel was 1.5 million, the impeller grid was 1.73 million, the guide vane grid was 1.48 million, the bulb structure grid was 1.03 million, and the outlet channel grid was 1.26 million. The grid quality reached 0.23, meeting the calculation requirements.

2.2.5. Boundary Condition for Numerical Simulations
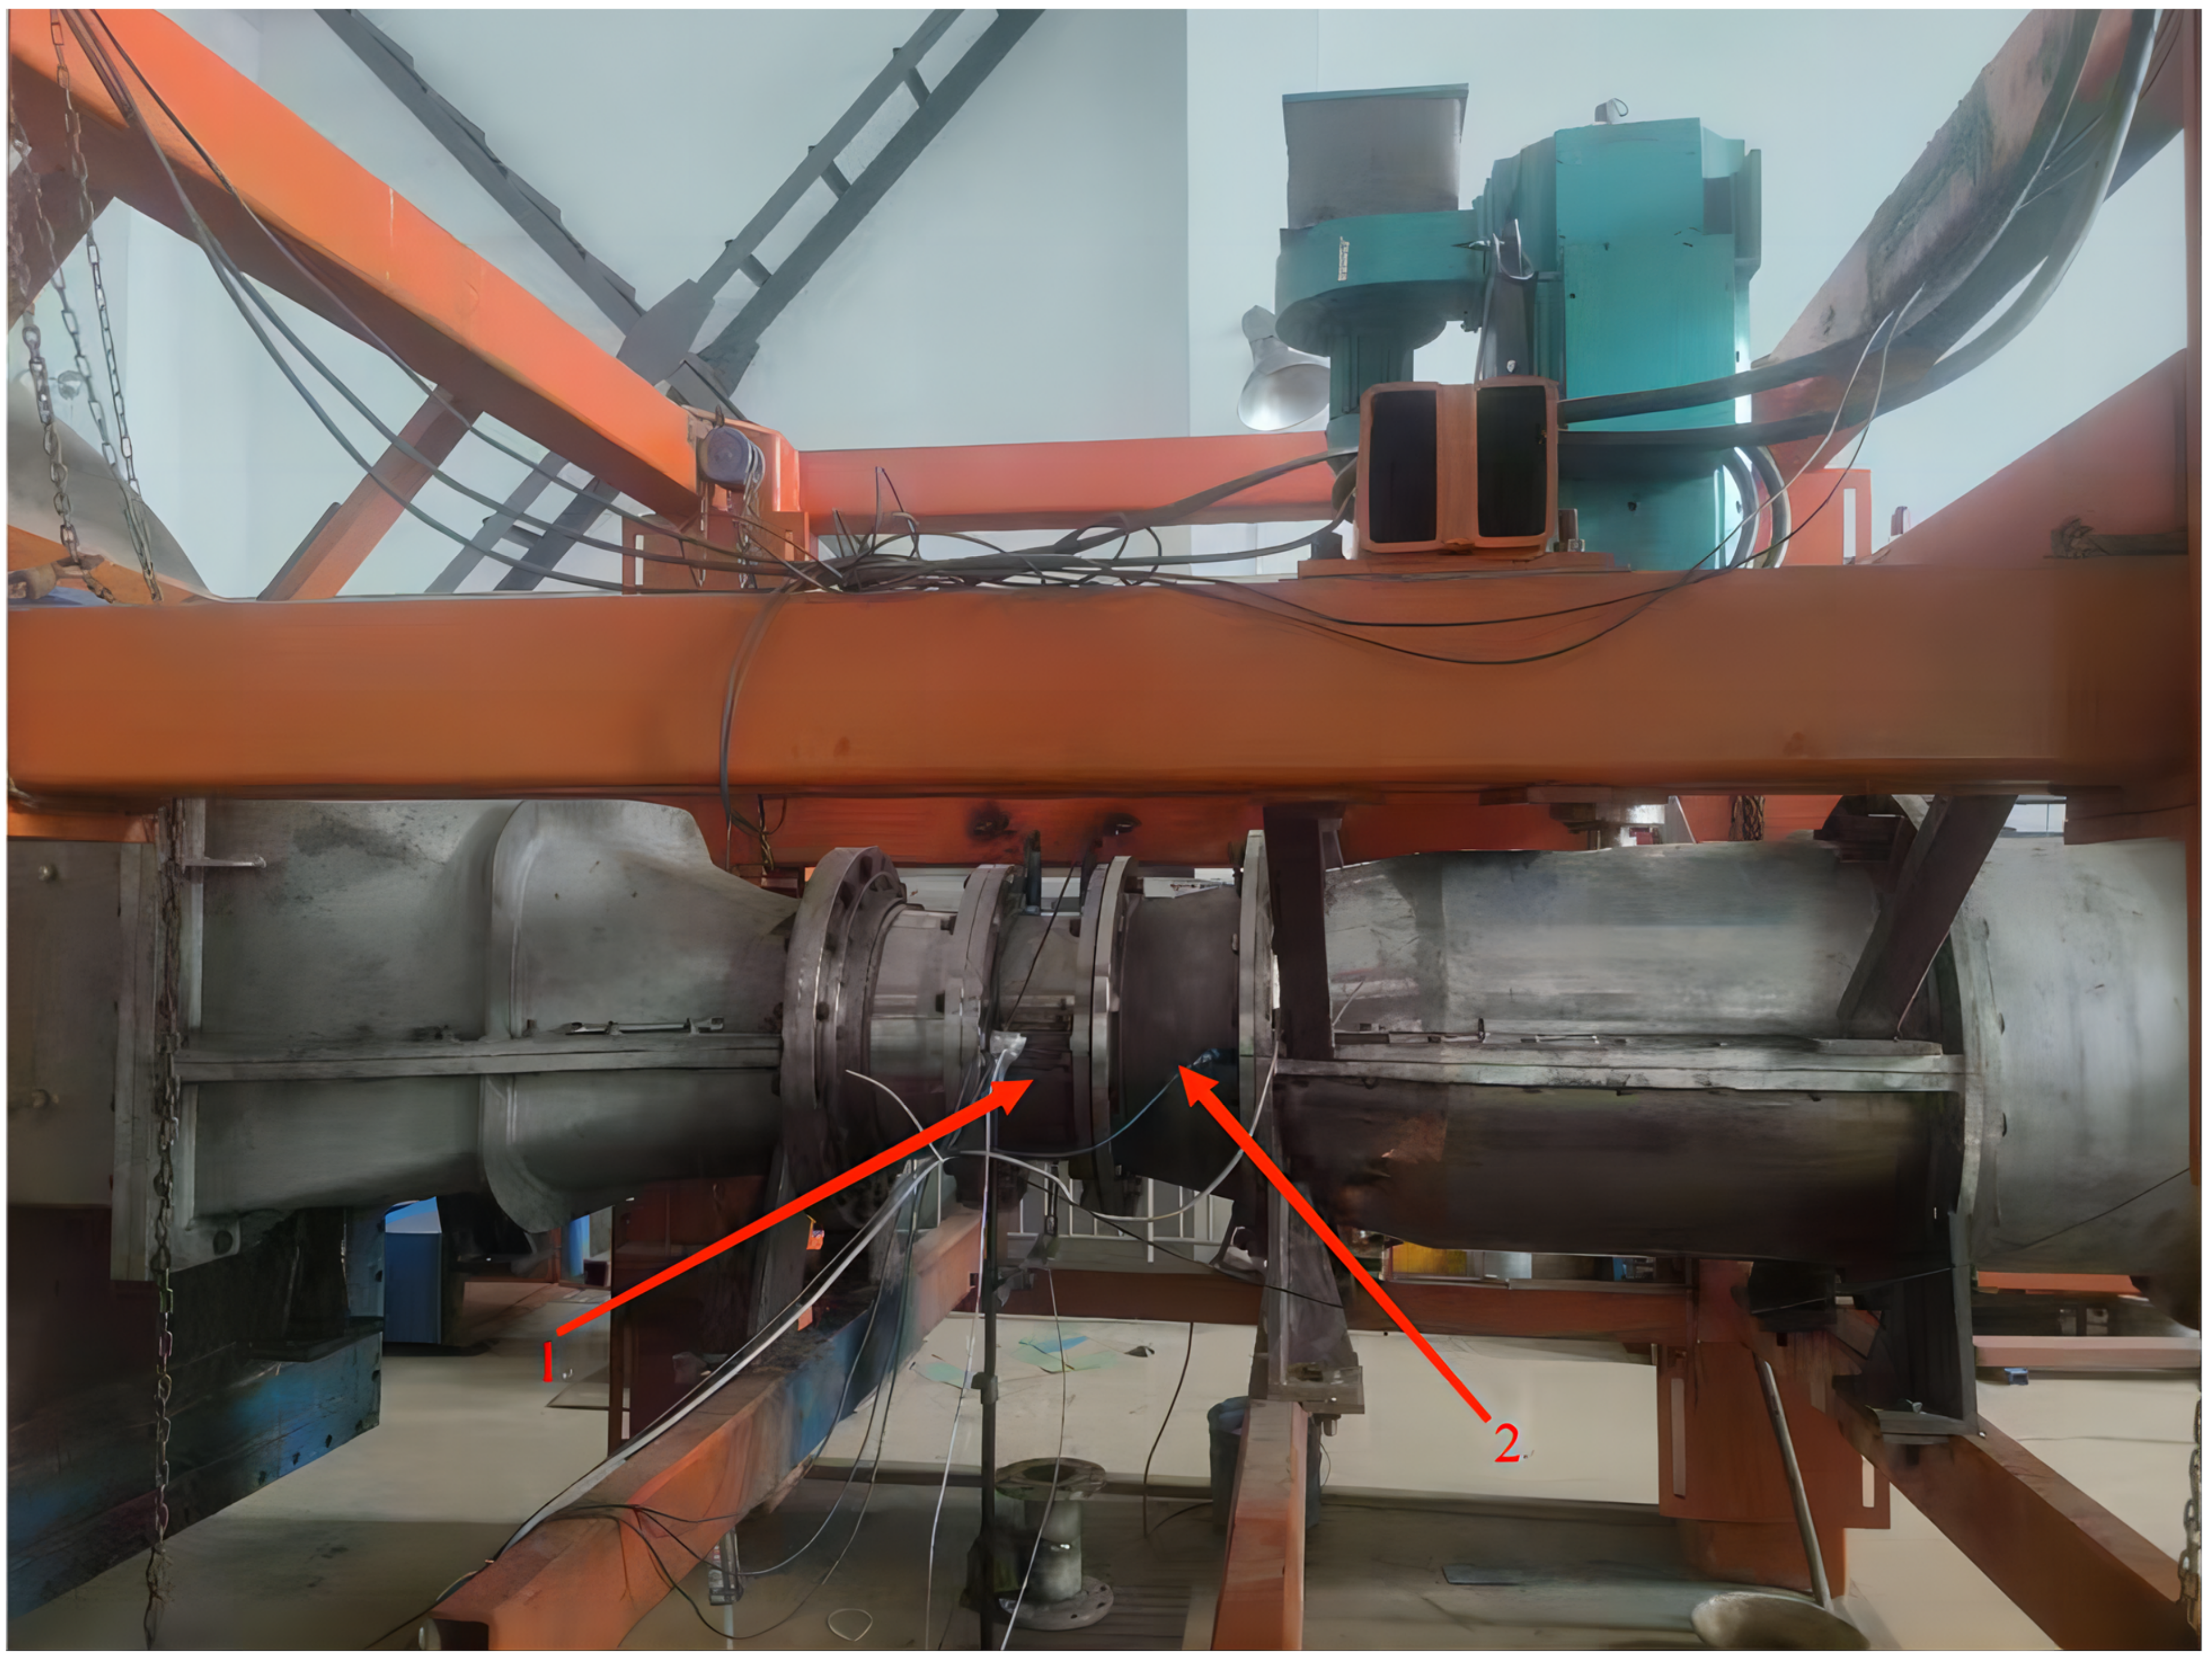
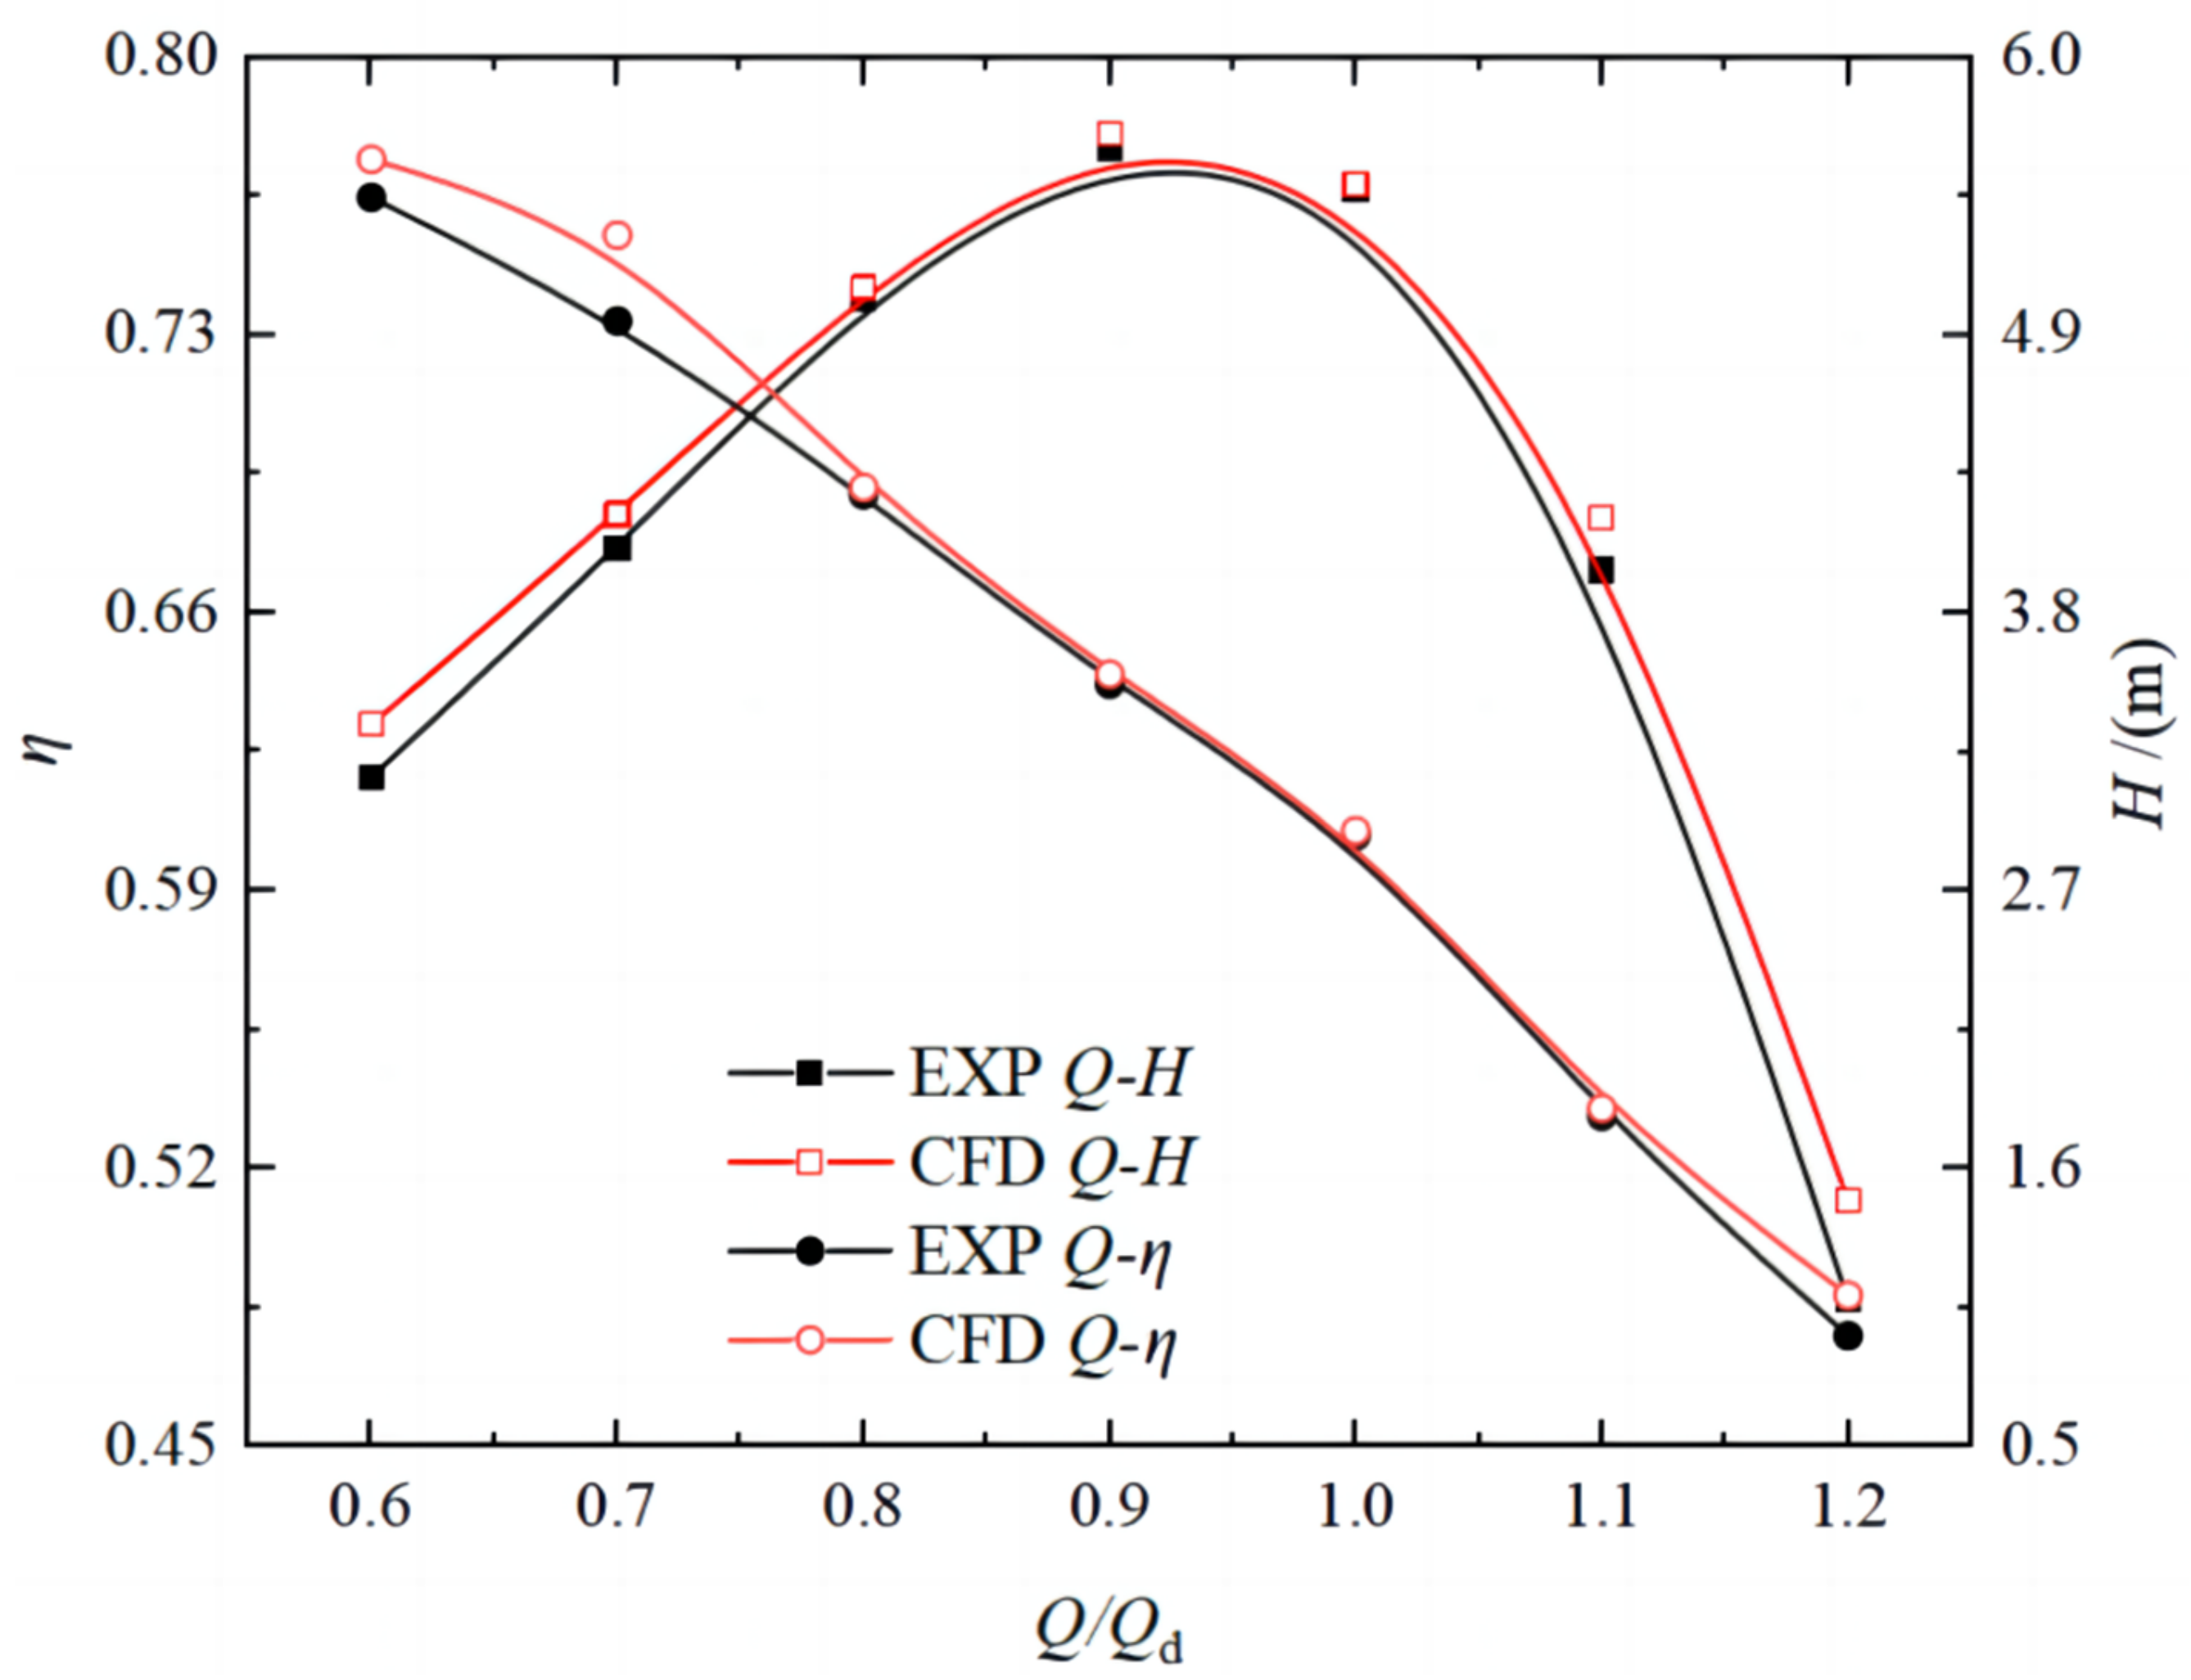
In this study, ANSYS CFX 2020R2 was used for the numerical simulation of a large bulb tubular pump device. The SST k-ω turbulence model was used. The inlet condition was total pressure, the outlet condition was mass flow, the medium was 25 °C clean water, all the walls were non-slip, and the dynamic and static interface was set as Frozen Rotor. Convergence was defined as a residual value of less than 10−5.

2.3. Model Test

To verify the accuracy of the numerical calculation results, the bulb tubular pump device was scaled down, and a model test was carried out on the closed cycle test bench. The test pump is shown in Figure 5.
Specific flow conditions were selected to determine the overall uncertainty of the testing process, and five measurement data sets were collected. The corresponding mean value and standard deviation were then calculated. The detailed uncertainty of the model test has two main components—random uncertainty and system uncertainty. The flow, head, torque, and rotational speed vary under random uncertainty. The systematic uncertainty, as estimated in this study, is 0.1%. These were combined to set the mean uncertainty to 0.2%. After the test on the closed cycle test bench, the external characteristics of the real test data were compared with the numerical simulation calculation, and the external characteristics are shown in Figure 6.
Under the design flow rate, the test head of the 0° impeller was 2.92 m and the hydraulic efficiency was 76.7%, while the numerical simulation head was 2.94 m and the hydraulic efficiency was 76.8%. The results show that the error between the numerical simulation and the experimental data is less than 1%, which meets the accuracy requirements of the numerical simulation.

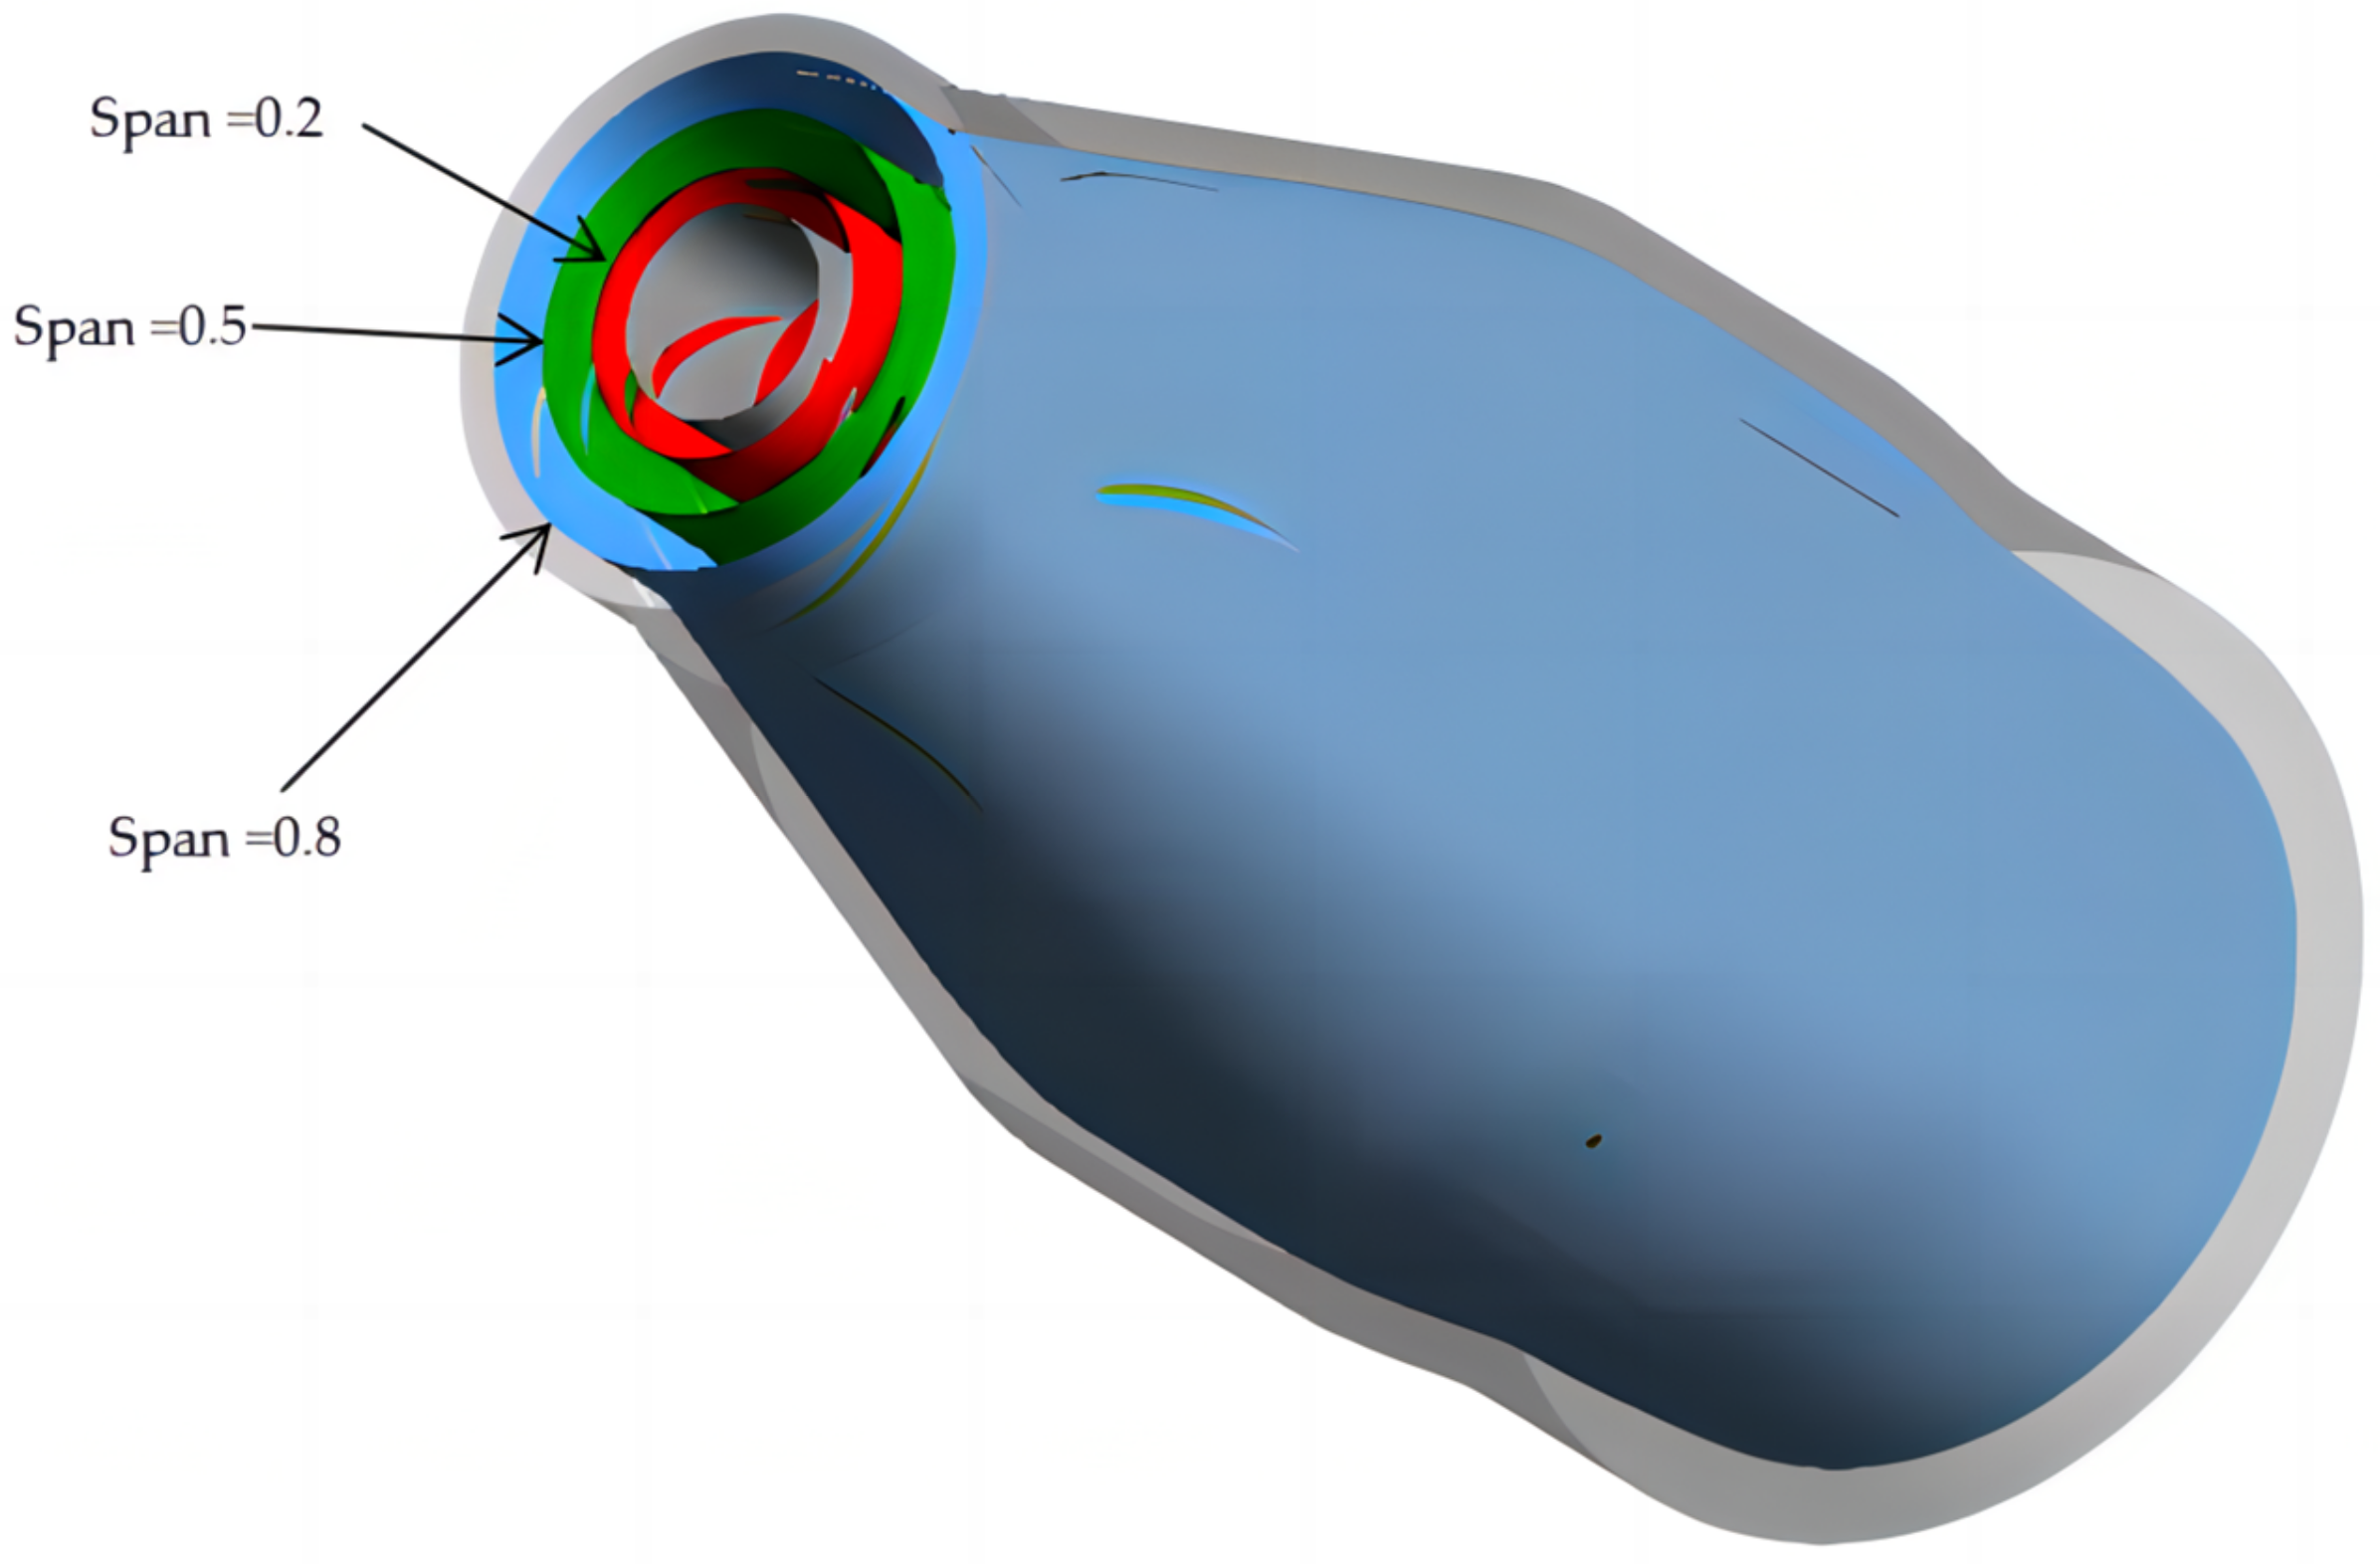
2.4. Internal Flow Analysis

Numerical simulations under the design flow rate yielded streamlines along the full flow path of the bulb tubular pump, as seen in Figure 7.
Through the analysis, it is found that the flow state becomes worse after the fluid flows through the guide vane, resulting in turbulent flow and disordered flow. After flowing into the guide vane body, a large number of vortexes are generated. As a result, the flow separation phenomenon is observed at the guide vane, resulting in the formation of a vortex structure, so there is a large space for the optimal design of the guide vane.
The expansion of the structure of the impeller, guide vane, and bulb body is defined as shown in Figure 8. The cross sections along the hub to the rim are Span = 0.2, Span = 0.5, and Span = 0.8, respectively.
The impeller and guide vane were unfolded under three conditions of blade height (0.2, 0.5, and 0.8), and a streamlined figure (Figure 9) under unfolded conditions was obtained.
By analyzing the spread streamline of the blade height of the impeller and guide vane, it can clearly be seen that the flow separation phenomenon begins when the fluid approaches the inlet front of the guide vane, which affects the effectiveness of the guide vane in changing the flow direction. As a result, the flow quality deteriorates and a large number of vortex structures are formed in the middle of the guide vane and the trailing edge of the outlet. It is necessary to improve the hydraulic efficiency of the device.

3. Methodology

3.1. Orthogonal Test

The design of the guide vane involves many parameters, with each parameter affecting the performance of the guide vane to a certain extent. However, this study focuses specifically on the inlet and outlet angles, as well as the vane wrap angle, because they play a decisive role in adjusting and optimizing the hydraulic efficiency and overall performance of the pump device. The inlet and outlet angles directly affect the flow direction and energy conversion of hydraulic efficiency when the fluid enters and leaves the guide vane, while the blade wrap angle determines the shape of the blade and the diffusion effect of the flow channel, thus affecting the fluid pressure recovery and flow stability. Therefore, by precisely controlling these parameters, we can effectively improve pump hydraulic efficiency, reduce energy loss, and optimize pump performance and reliability.
Therefore, in this study, the hub inlet angle α β h 1 (factor A) of the guide vane, the rim inlet angle α β s 1 (factor B), the hub outlet angle α β h 2 (factor C), the rim outlet angle α β s 2 (factor D), and the blade wrap angle φ (factor E) were selected as five factors of the orthogonal test; three different levels were set for each factor, and a detailed factor level table was constructed (Table 2).
This study aimed to explore the interactions between the guide vane design parameters and their combined impact on the performance of the pump device; the orthogonal test design scheme for L27 was chosen. This design allows for a comprehensive analysis of the effects of factors and their interactions in the setting of five factors, each at three levels. The orthogonal test table of L27 provides a wider combination of experiments than tables L9 or L18, allowing the study to more carefully and comprehensively evaluate the impact of the design parameters on the performance of the pump device, ensuring the depth and breadth of the analysis. The following is a detailed orthogonal test protocol table (Table 3).

3.2. Numerical Calculation Results and Range Analysis

3.2.1. Numerical Calculation

The numerical simulation of the design conditions was based on the L27 orthogonal test design scheme using the ANSYS CFX 2020R2 to obtain the head and hydraulic efficiency data under different schemes. The specific calculation results are shown in Table 4.

3.2.2. Range Analysis

Range analysis is a commonly used analysis method in orthogonal tests, and is mainly used to evaluate the influence of each factor on the test results. By calculating the range of the experimental results at different levels, this method can preliminarily determine which factors have a significant influence on the experimental results, particularly the method difference between the maximum and minimum test results at different factor levels. The larger the range, the greater the difference in the effect of that factor across levels on the experimental results, indicating a more significant effect on the experimental results; conversely, the smaller the range, the lesser the impact.
A range analysis of the numerical head was carried out; Table 5 shows the results of the head difference analysis.
Based on the range analysis data, the relationship between the head and factor levels (Figure 10) is obtained.
As seen from Table 5 and Figure 10, the primary and secondary order affecting the head of the pump device is EDCBA; namely, the blade wrap angle φ > the rim outlet angle α β s 2 > the hub outlet angle α β h 2 > the rim inlet angle α β s 1 > the hub inlet angle α β h 1 . The optimal scheme is E3D1C1B1A2; namely, the blade wrap angle φ is 16°, the rim outlet angle α β s 2 is 93°, the hub outlet angle α β h 2 is 89°, the rim inlet angle is α β s 1 99°, and the hub inlet angle α β h 1 is 90°. This combination is the optimal design scheme based on the head index.
Table 6 shows the results of the head range analysis of the hydraulic efficiency of the numerical calculation results.
Based on the range analysis data, the relationship between the hydraulic efficiency and factor levels (Figure 11) is obtained.
As seen in Table 6 and Figure 11, the primary and secondary order affecting the hydraulic efficiency of the pump device is EBACD; namely, the blade wrap angle φ > the rim inlet angle α β s 1 > the hub inlet angle α β h 1 > the hub outlet angle α β h 2 > the rim outlet angle α β s 2 . The optimal combination scheme is E3B1A2C1D1; namely, the blade wrap angle φ is 16°, the rim inlet angle α β s 1 is 99°, the hub inlet angle α β h 1 is 90°, the hub outlet angle α β h 2 is 89°, and the rim outlet angle α β s 2 is 93°. This combination is the optimal combination based on the hydraulic efficiency index. However, different factors affect head or hydraulic efficiency differently. The comparison showed that the optimal combination for the head is consistent with the optimal hydraulic efficiency combination. After analyzing and comparing 27 groups of design data, the optimal design scheme was identified as group 18 in the trial. A further comparison of the numerical simulation results under the standard condition shows that optimizing the orthogonal test method improves the head and hydraulic efficiency by 1.7% and 0.88%, respectively.

4. Results and Discussion

4.1. Comparative Analysis of the External Characteristics

The optimal combination obtained using the orthogonal testing method was calculated under different conditions, and its external characteristics were compared with the original guide vane model.
Analyzing the external characteristics before and after the optimization of the guide vanes reveals that the pump head and hydraulic efficiency at different operating points are higher than those of the original model when the orthogonal test method optimized the parameters.
It can be reasonably concluded that the external characteristics of the bulb tubular pump can be improved to some extent by increasing the blade wrap angle and decreasing the rim inlet and outlet angles, as well as the hub and outlet angles, compared to the original design. As seen in the external characteristic curves, the performance increases by 0.7% at low flow rates, 0.88% at design, and 1.1% at high flow rates. The results revealed that the orthogonal test method achieved the optimization objective.

4.2. Internal Flow Contrast Analysis

The main function of the guide vane is to convert the kinetic energy from the impeller into pressure energy. Hence, the pressure distribution of the guide vane directly affects the energy conversion efficiency. An uneven pressure distribution may lead to fluid in the guide vane channel vortex or separation. Therefore, the comparison of the pressure distribution on the guide vane before and after optimization is an important parameter for determining the hydraulic performance of the pump. A streamlined analysis of the pump’s flow field can verify whether the optimization measures improve the flow field as expected, ensuring the effectiveness of the design and improving our understanding of its internal flow. An entropy production analysis can quantitatively evaluate the energy loss in the internal flow process of the pump, and the magnitude of the entropy production directly reflects the irreversibility of the flow process: the greater the entropy production, the more the energy loss. By comparing the entropy production distribution map before and after the optimization, the performance effect of the optimization can be intuitively evaluated. In this section, we analyze three aspects—the guide vane pressure distribution, streamline distribution, and entropy production—to comprehensively compare the model before and after optimization and verify the effectiveness of the optimization results.

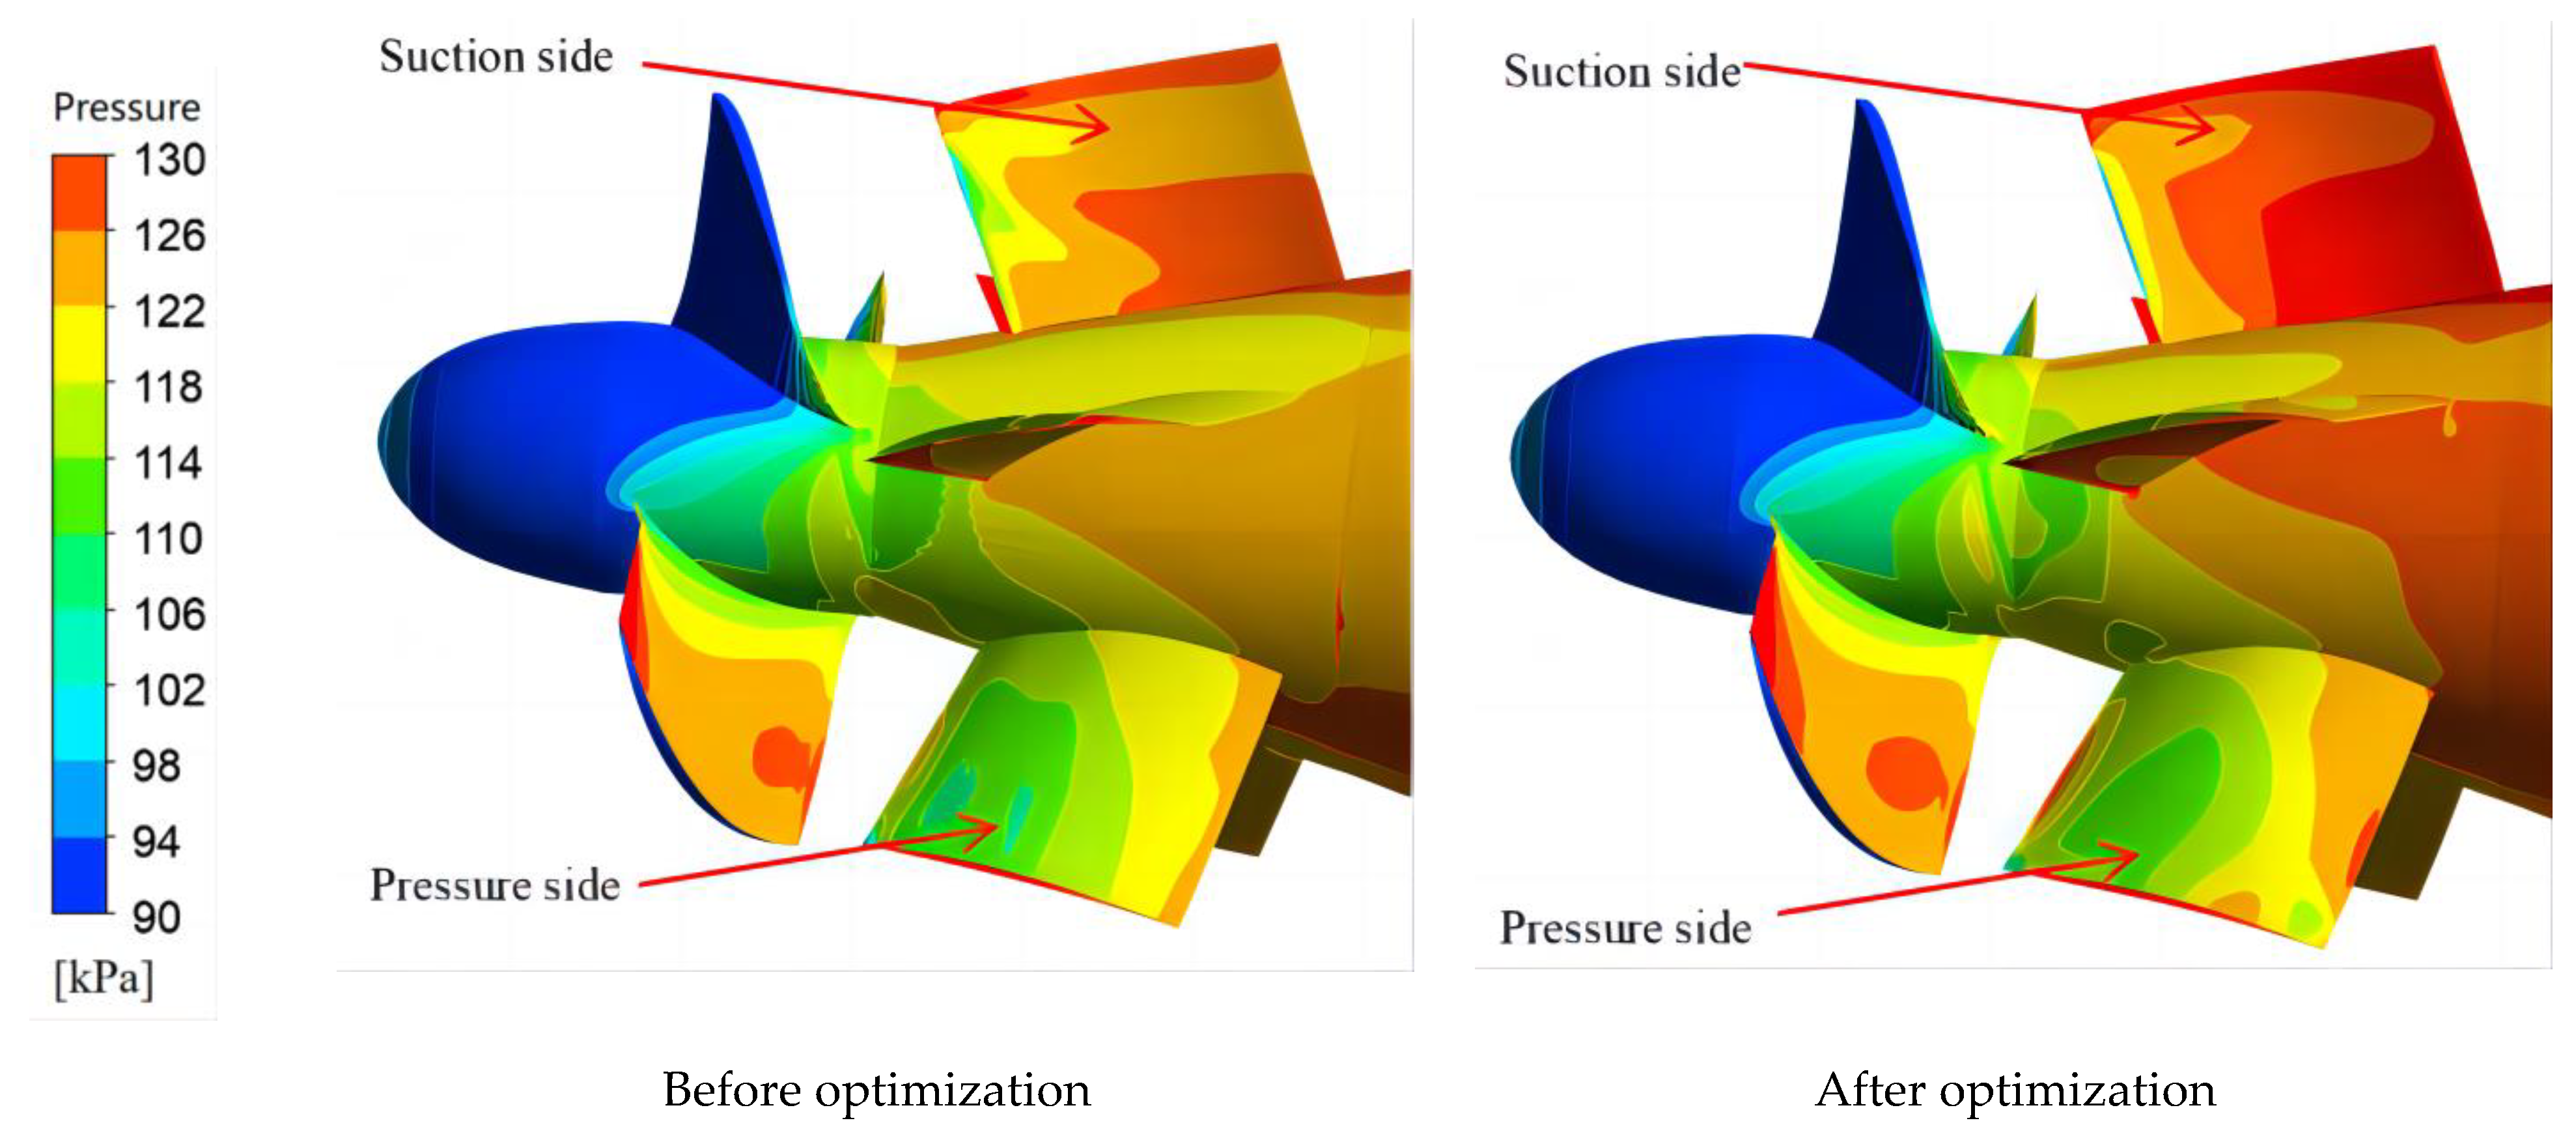
4.2.1. Pressure Analysis

Figure 12 shows the comparison of the pressure contour image of the guide vane before and after optimization. By comparing the pressure distribution before and after optimization, there are some high-pressure areas in the leading edge of the guide vane’s working face and the middle part of the guide vane. This is because this area plays a major role in the kinetic energy conversion of the fluid. However, due to the uneven pressure distribution and the influence of the pressure value, the performance of the pump device is relatively poor. Through optimization, the high-pressure area of the guide vane’s working and back faces expands and the pressure distribution on the working face is more uniform. By further comparing the pressure distributions on the guide vane’s back face before and after optimization, although the two are similar in general, the distribution of high-pressure areas after optimization is more continuous, which also indicates that the pressure recovery ability of the guide vane has been improved. At the same time, the pressure value on the back face is higher than that of the working face, both before and after optimization, mainly because most of the fluid impinges on the back face in the process of fluid energy conversion, resulting in the formation of high-pressure areas. By further comparing the pressure distribution on the hub before and after optimization, it is found that the high-pressure area on the hub of the guide vane increases, indicating that the expansion ability of the guide vane is enhanced, the flow is more stable, and the separation flow and vortex phenomena caused by the uneven pressure distribution are reduced. Therefore, through the pressure analysis of the guide vane, it can be shown that the energy conversion efficiency of the guide vane after the orthogonal test design is improved, and the pressure distribution is also improved.

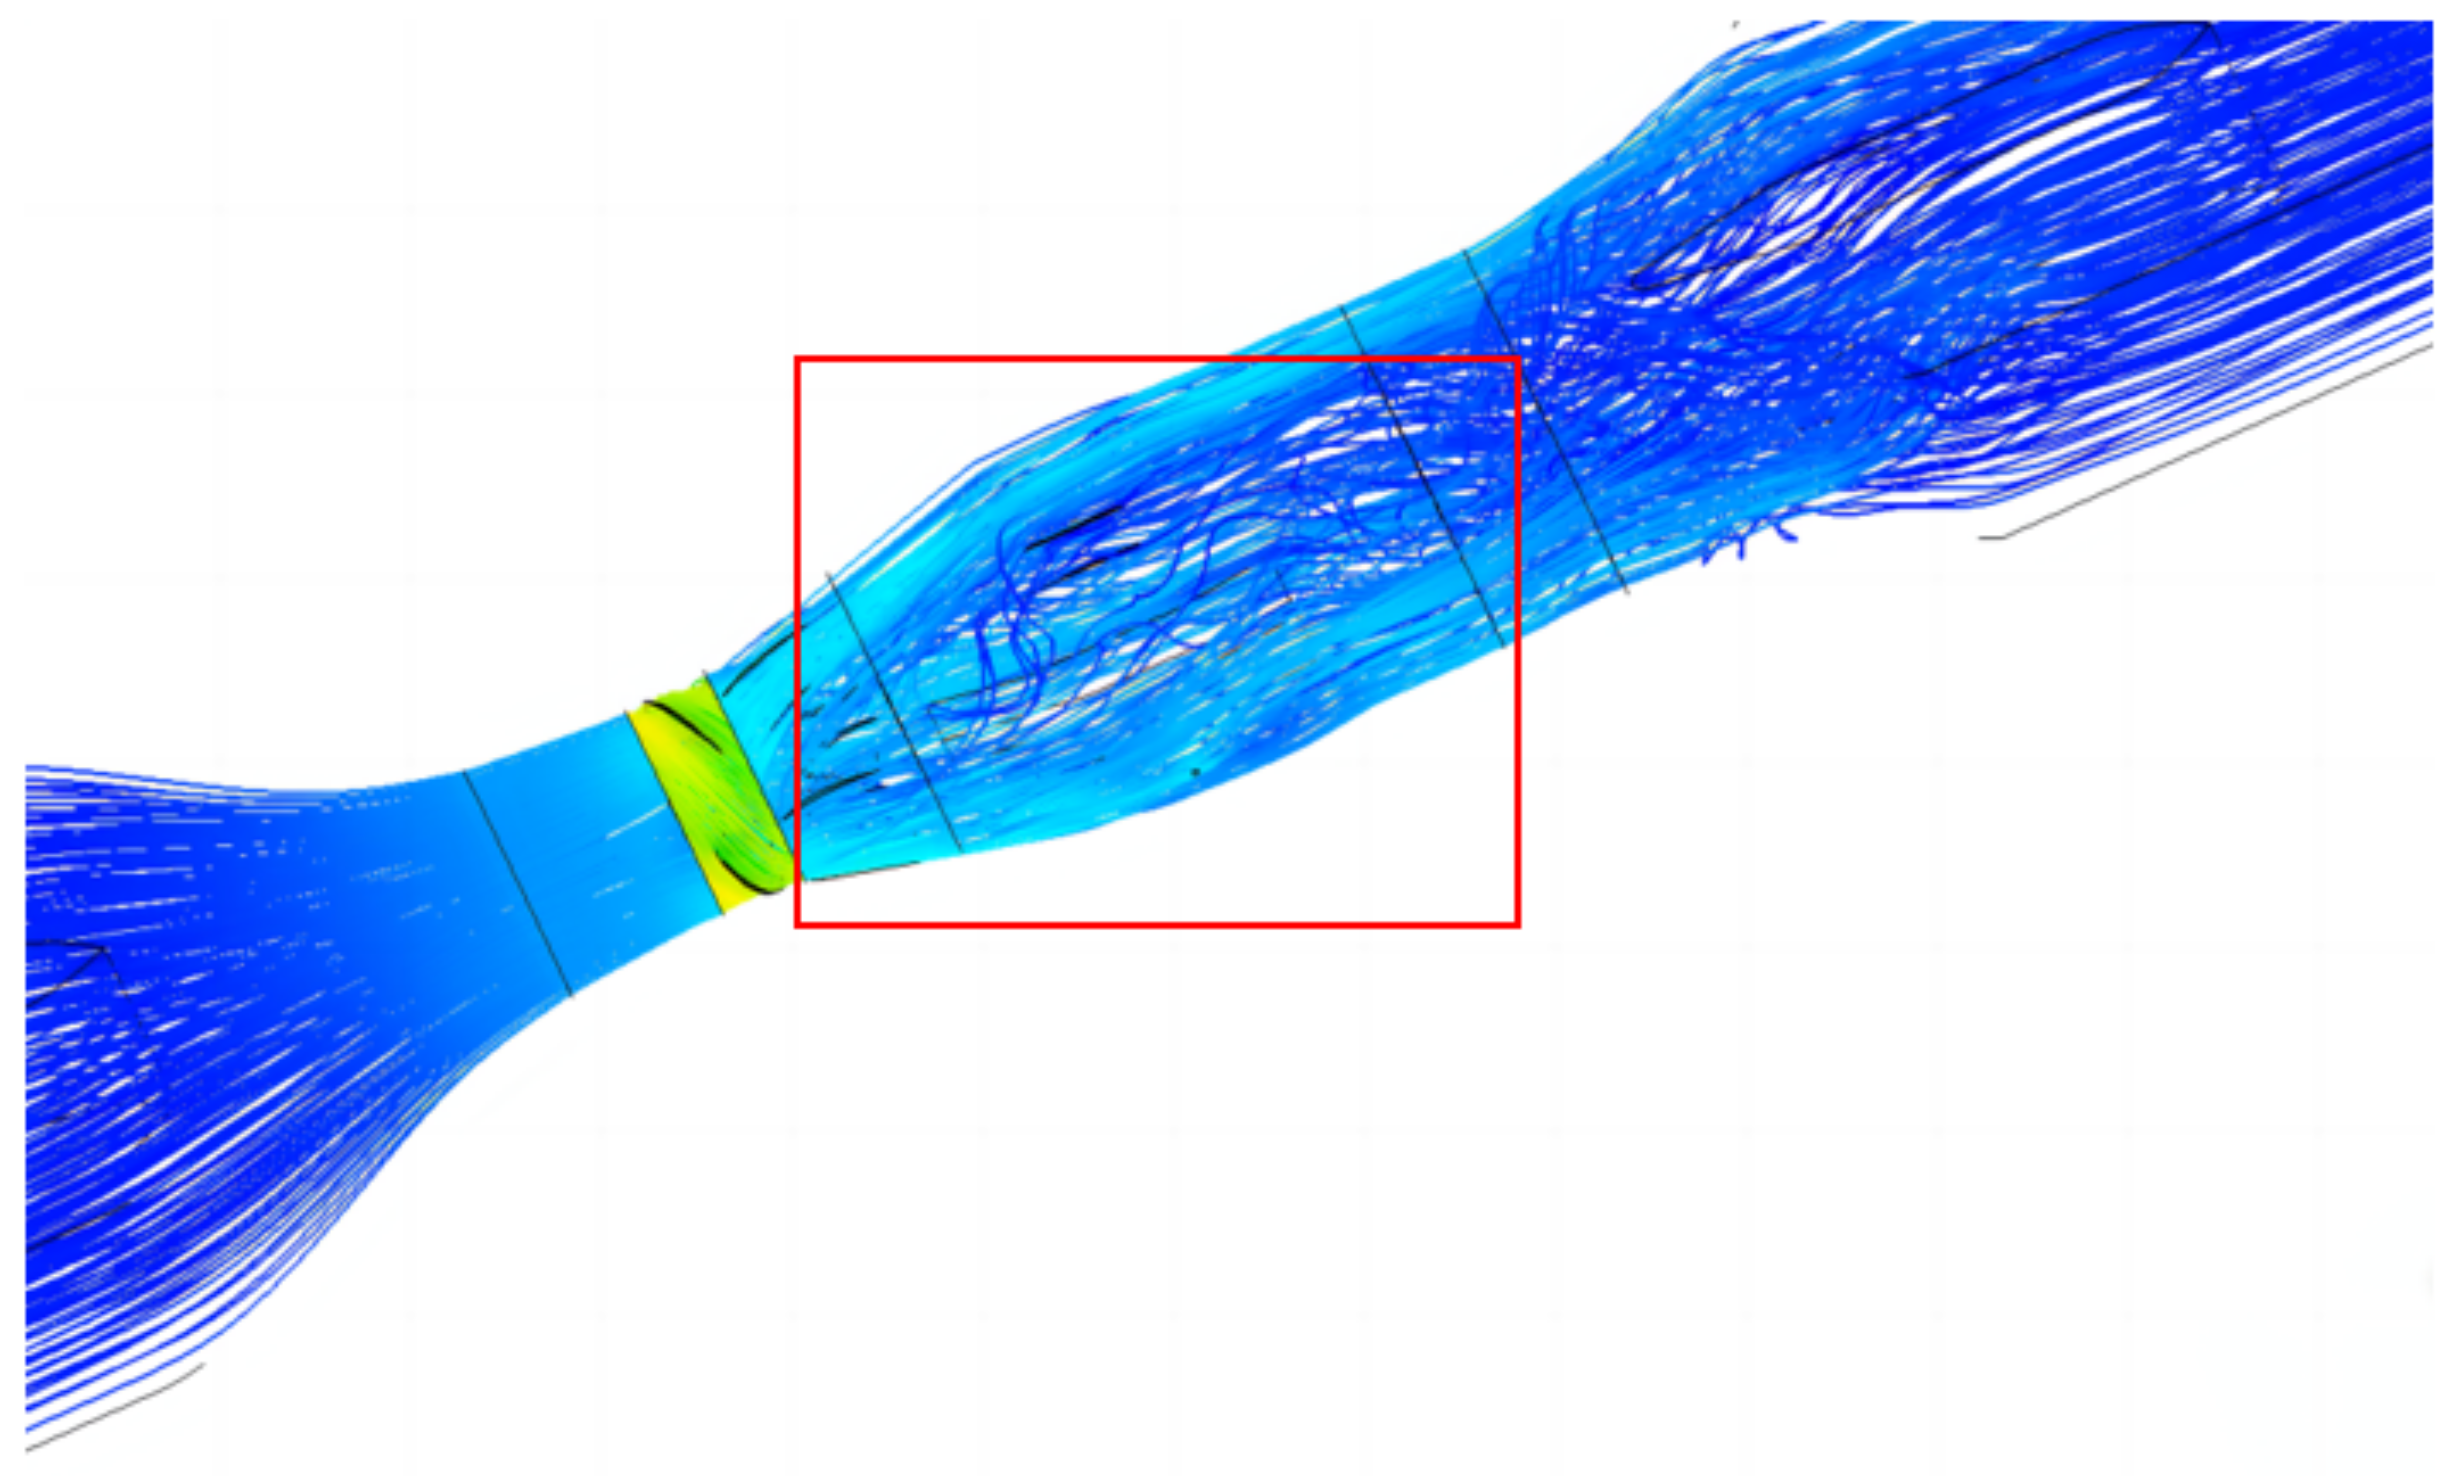
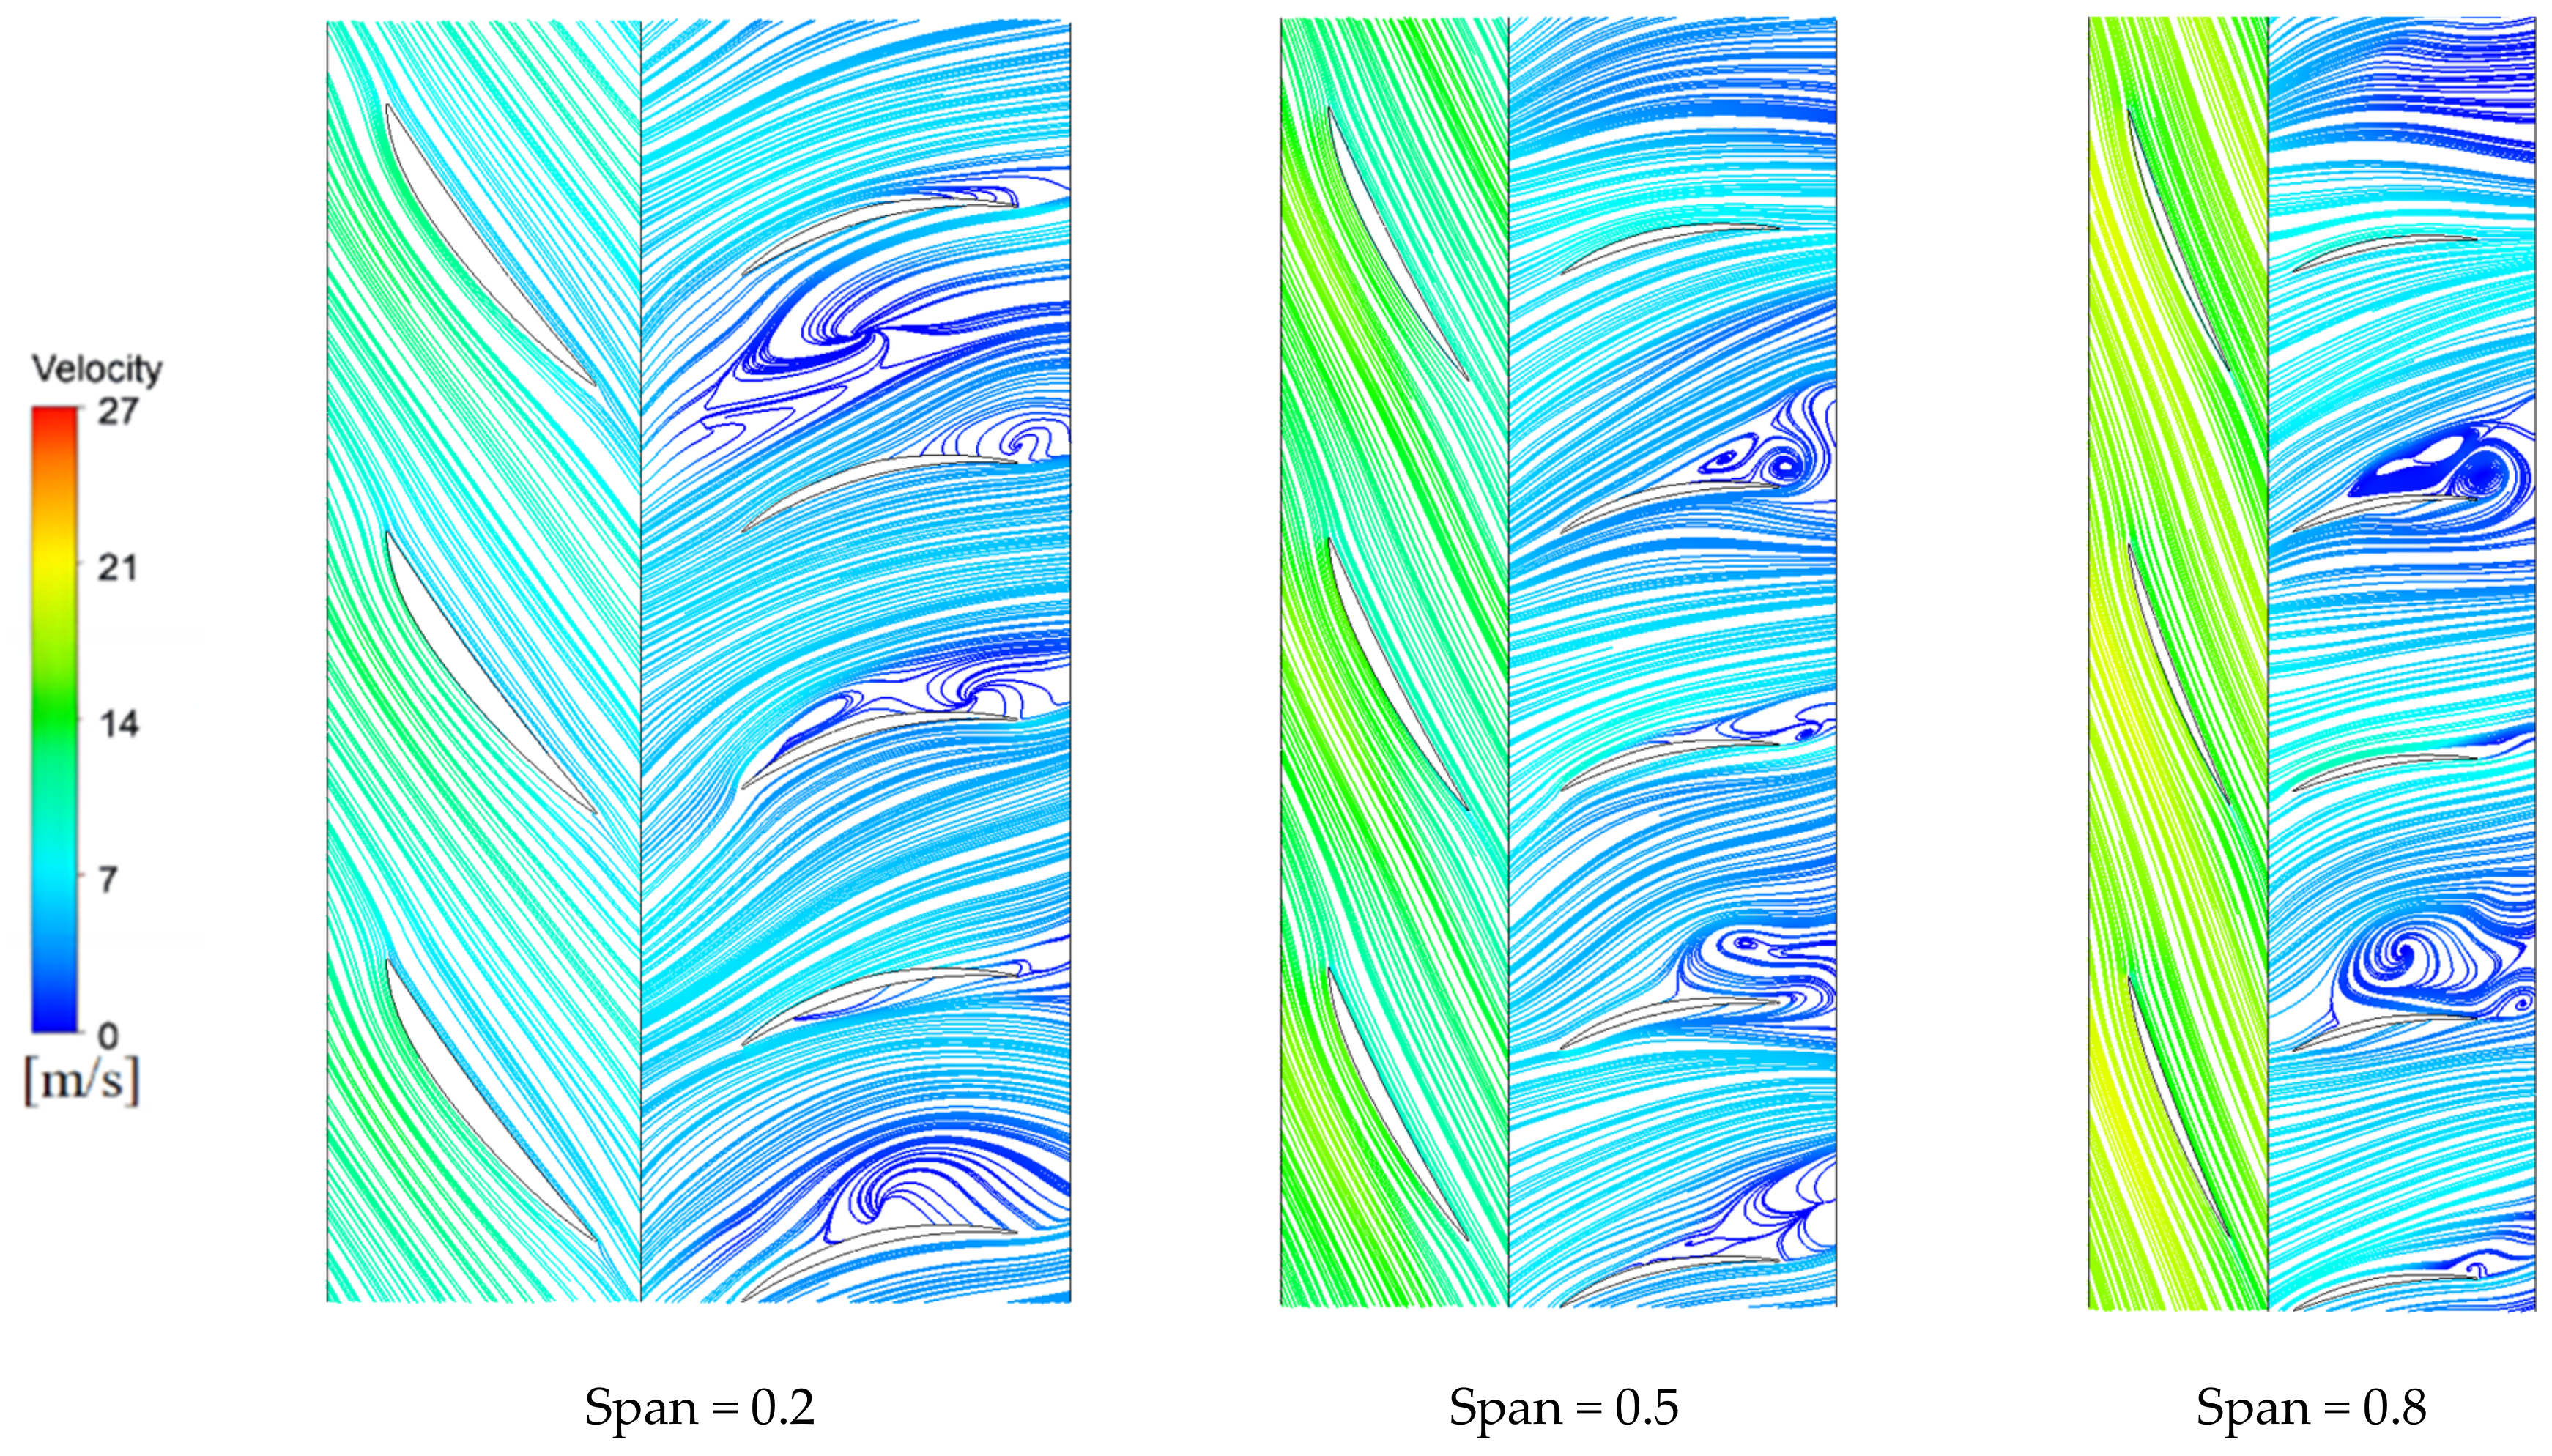
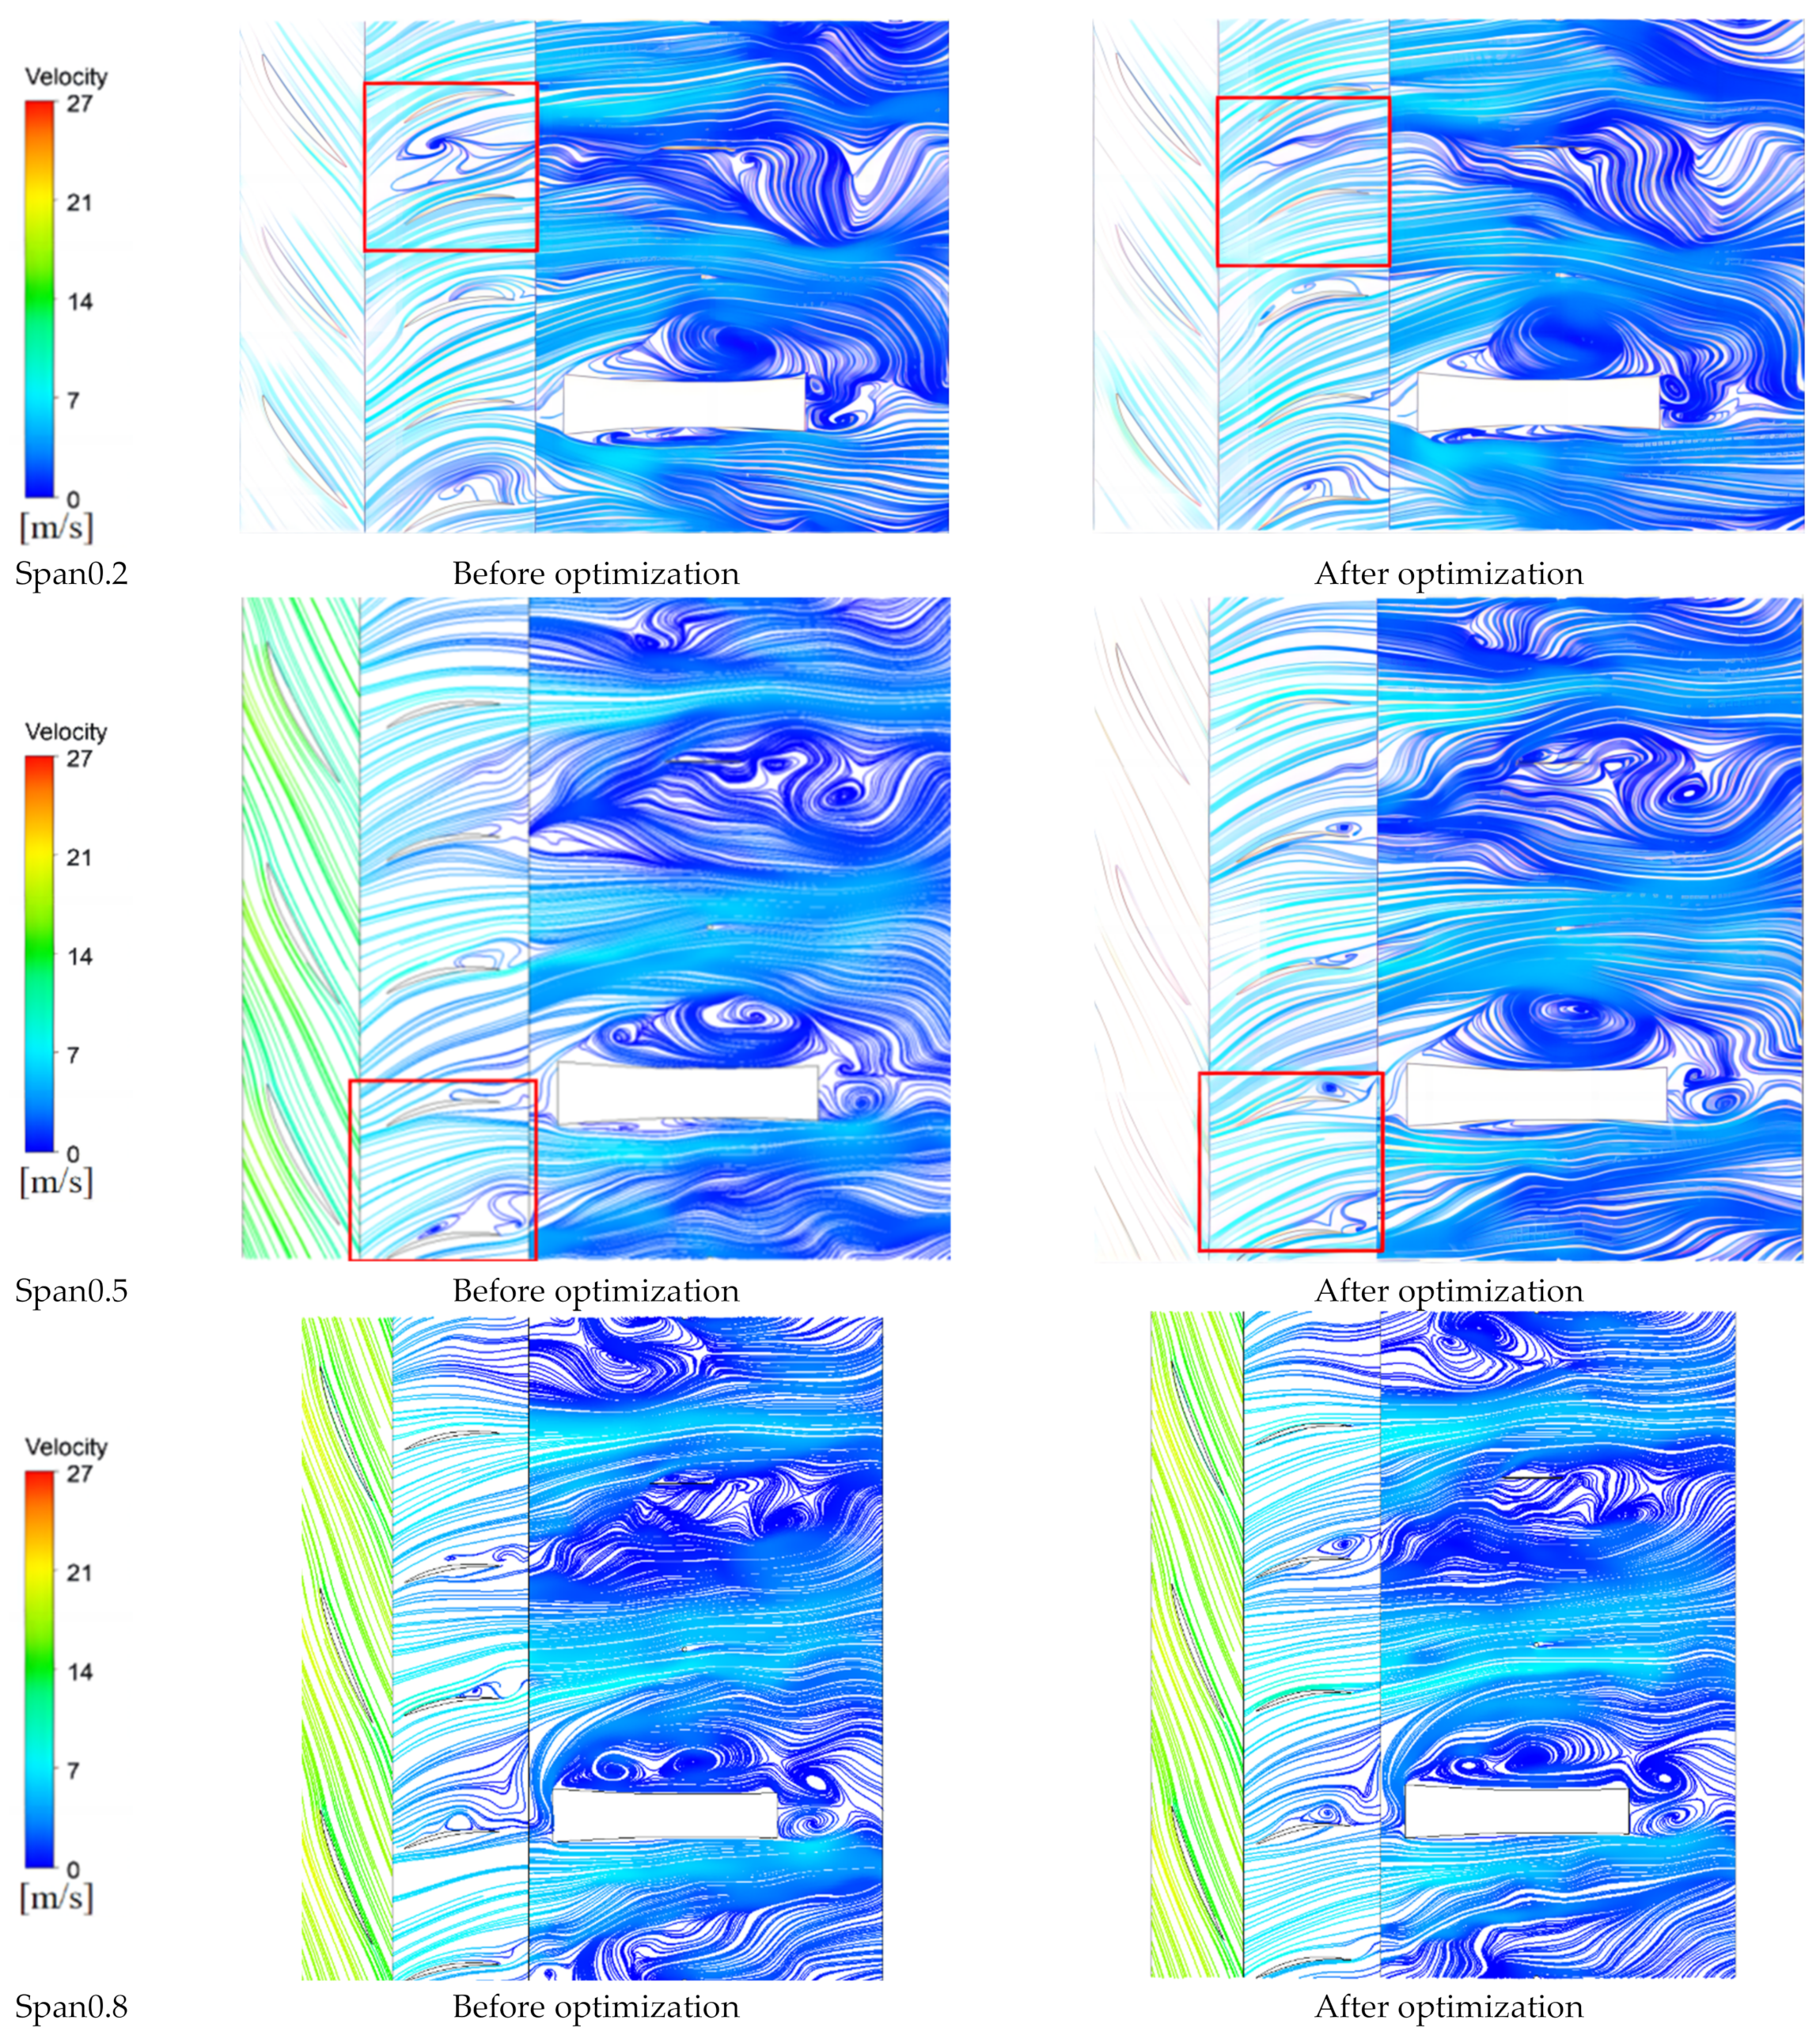
4.2.2. Streamline Analysis

The guide vane was unfolded with different blade heights, internal streamlines of different blade heights were integrated, and internal flow states before and after optimization were visually compared. Based on the design parameters in the orthogonal test, the impeller, guide vane, and outlet channel were unfolded along the radial direction under three conditions—blade heights of 0.2, 0.5, and 0.8. The velocity streamline diagrams of different blade heights are shown in Figure 13. Nguyen et al. [13] optimized the flow of an axial flow pump. By comparing the flow diagrams of the two pumps, it is easy to find that the overall flow state of the fluid in the axial flow pump is better after flowing through the guide vane, while there is still a certain vortex phenomenon after the fluid flows through the guide vane in the bulb tubular pump studied in this paper. This is mainly because this study takes into account the role of the support structure in the bulb flow pump, and the flow separation and vortexes still occur when the fluid flows through the support. At the same time, at the hub of the two pumps, a certain vortex, known as the horseshoe vortex, appears.
The flow state in the expansion area of the impeller is good, and the streamline is smooth and continuous. However, when the fluid passes through the guide vane and flows to its trailing edge, a certain degree of flow separation occurs, which causes the flow to become unstable. When flowing to the bulb body, due to the support body inside the bulb body, there is a clear flow separation phenomenon. In particular, a large number of vortexes are observed at the bottom and side supports of the bulb body. When fluid flows out of these support structures, it forms a wake. The flow states before and after the optimization at the blade height of 0.2 are compared and analyzed. Near the hub of the guide vane, the flow state after optimization is evidently better. Compared with before optimization, the vortex structure on the concave surface of the guide vane disappears, and the vortex that does not disappear also has a significant decreasing trend. The smoothness of the streamline is better, and the disappearance of the vortex in between the guide vane runner can be found due to the improvement in the separation fluid phenomenon. Further comparative analysis of the expansion diagram of the flow parts with a blade height of 0.5 before optimization shows that the streamline at the trailing edge of each guide blade has a flow separation phenomenon, which leads to the formation of a vortex and the deterioration of the flow state. Although the optimized guide vane could not completely avoid the wake, the flow separation phenomenon is significantly improved so that the overall flow state is improved to a certain extent after flowing into the bulb body. In the expanded diagram with a blade height of 0.8 near the wall, the situation before optimization is similar to the situation with a blade height of 0.5, and the flow separation phenomenon affects the flow pattern of the guide vane and the flow stability inside the next flow component. Although the vortex between the guide vane flow channels is increased to some extent after optimization, the separation fluid trend on the guide vane surface is improved by optimization, and the vortex scale on the support surface of the bulb body is reduced. By comparing with different blade heights, the separation fluid phenomenon on the guide blade surface is improved. At the same time, the scale of the vortex near the bulb support body is also reduced. Thus, a smaller pressure drop is observed, which corresponds to the reduction in the low-pressure area on the guide vane surface in Figure 13.

4.2.3. Entropy Production Analysis

The guide vane is expanded with different blade heights, and the entropy production of the flow parts with different blade heights is synthesized. The guide vane optimization results were also analyzed through the entropy production method. The entropy production diagram of different blade heights is shown in Figure 14.
By comparing the distribution of entropy production before and after optimization, entropy is mainly produced at the trailing edge of the impeller and the guide vane. This is mainly due to the high fluid speed when the fluid flows out of the impeller; this high-speed flow will increase the internal action of the fluid, such as the friction and eddy current, resulting in increased entropy production. The fluid has to overcome a large pressure drop as it passes through the blade, which also leads to an increased energy loss conversion and increasing entropy production. According to the comparative analysis of a blade height of 0.2, entropy production mainly occurs in the impeller outlet and guide vane inlet regions. The region before optimization has a large area of entropy production, and after design optimization, regions with a high entropy production are significantly improved; when the blade height increases to 0.5, regions with high entropy production are also significantly reduced. After optimization, the high-entropy-production region in the middle of the guide vane disappears. The overall entropy production distribution also has a significant decreasing trend, and at a blade height of 0.8, the entropy production greatly decreases after optimization. As shown from the results of the entropy production analysis, optimizing the design parameters of the guide vane improves the energy conversion efficiency of the guide vane to the fluid, reduces unnecessary energy loss, and improves the operating efficiency of the pump. At the same time, the entropy production on the guide vane surface is significantly reduced due to the improved separation fluid phenomenon on the guide vane surface. As shown in the entropy production analysis, an improved flow in the pump leads to a lower energy loss and a higher hydraulic efficiency through the optimized design.

5. Conclusions

In this study, orthogonal experimental design and numerical analysis are employed to optimize the rear guide vane design. Five key design parameters are considered—the hub inlet, rim inlet, hub outlet, rim outlet, and blade wrap angles. Using an orthogonal test design scheme based on these parameters, numerical simulations are conducted to obtain relevant data on head and hydraulic efficiency, followed by a range analysis of the numerical results.
The impact of each design parameter on head and hydraulic efficiency is evaluated, leading to the optimization and combination of the parameters to determine the optimal design scheme. The effectiveness of the optimized design is then validated by comparing the internal flow field of the optimal scheme with that of the original design. The following conclusions are drawn:
(1)
Selection of Key Parameters—Five design parameters that significantly influence the pump’s external characteristics are chosen as factors for the orthogonal experiment, with each factor set at three levels. An L27 orthogonal table is constructed, and the design schemes in the table are numerically simulated.
(2)
Range Analysis and Optimal Design—A range analysis is performed to evaluate the influence of each factor on the test results. The optimal combination, according to the analysis, is a wrap angle (φ) of 16°, a rim inlet angle of 99°, a hub inlet angle of 90°, a hub outlet angle of 89°, and a rim outlet angle of 93°. Numerical calculations under three operating conditions show a hydraulic efficiency increase of 0.7% at a low flow rate, 0.88% at the design flow rate, and 1.1% at a high flow rate.
(3)
Flow Field and Energy Loss Analysis—The internal flow field under standard working conditions is analyzed, comparing the pressure distribution and streamline turbulence. The entropy generation theory is introduced to assess energy loss within the impeller, guide vane, and bulb body. The optimized design improves pressure distribution and reduces flow separation, thereby minimizing unnecessary energy loss.
(4)
Outlook—Due to limited resources and other reasons, this study does have its limitations. Although the role of structures such as the water barrier pier and the support body is considered in the computational domain model, only the guide vane is optimized. Additionally, the unstable flow near the support body also highlights that the optimization space is large. In a follow-up study, the guide vane and other flow components such as the bulb body can be matched and optimized.

Author Contributions

Methodology, X.M. and W.W. (Wenjie Wang); Software, T.W.; Validation, K.W.; Formal analysis, R.J.; Investigation, W.Y. and W.W. (Wentong Wang); Resources, M.Z. All authors have read and agreed to the published version of the manuscript.

Funding

The study was supported by the National Natural Science Foundation of China (Grant No. 52209112), the National Key Research and Development Program of China (Grant No. 2022YFC3202901), and China Postdoctoral Science Foundation (Grant No. 2024M751178).

Data Availability Statement

The original contributions presented in this study are included in the article. Further inquiries can be directed to the corresponding author.

Conflicts of Interest

No potential conflicts of interest were reported by the author(s).

References

  1. Hoffstaedt, J.P.; Truijen, D.P.K.; Fahlbeck, J.; Gans, L.H.A.; Qudaih, M.; Laguna, A.J.; De Kooning, J.D.M.; Stockman, K.; Nilsson, H.; Bricker, J.D.; et al. Low-head pumped hydro storage: A review of applicable technologies for design, grid integration, control and modelling. Renew. Sustain. Energy Rev. 2022, 158, 112119. [Google Scholar] [CrossRef]
  2. Kan, K.; Xu, Z.; Chen, H.; Xu, H.; Zheng, Y.; Zhou, D.; Muhirwa, A.; Maxime, B. Energy loss mechanisms of transition from pump mode to turbine mode of an axial-flow pump under bidirectional conditions. Energy 2022, 257, 124630. [Google Scholar] [CrossRef]
  3. Shi, L.; Yuan, Y.; Jiao, H.; Tang, F.; Cheng, L.; Yang, F.; Jin, Y.; Zhu, J. Numerical investigation and experiment on pressure pulsation characteristics in a full tubular pump. Renew. Energy 2021, 163, 987–1000. [Google Scholar] [CrossRef]
  4. Shi, L.; Zhang, W.; Jiao, H.; Tang, F.; Wang, L.; Sun, D.; Shi, W. Numerical simulation and experimental study on the comparison of the hydraulic characteristics of an axial-flow pump and a full tubular pump. Renew. Energy 2020, 153, 1455–1464. [Google Scholar] [CrossRef]
  5. Zhu, Z.; Gu, Q.; Chen, H.; Ma, Z.; Cao, B. Investigation and optimization into flow dynamics for an axial flow pump as turbine (PAT) with ultra-low water head. Energy Convers. Manag. 2024, 314, 118684. [Google Scholar] [CrossRef]
  6. Kan, K.; Chen, H.; Zheng, Y.; Zhou, D.; Binama, M.; Dai, J. Transient characteristics during power-off process in a shaft extension tubular pump by using a suitable numerical model. Renew. Energy 2021, 164, 109–121. [Google Scholar] [CrossRef]
  7. Shi, L.; Zhu, J.; Tang, F.; Wang, C. Multi-disciplinary optimization design of axial-flow pump impellers based on the approximation model. Energies 2020, 13, 779. [Google Scholar] [CrossRef]
  8. Dai, Z.; Tan, L.; Han, B.; Han, S. Multi-parameter optimization design of axial-flow pump based on orthogonal method. Energies 2022, 15, 9379. [Google Scholar] [CrossRef]
  9. Nguyen, D.A.; Ma, S.B.; Kim, S.; Kim, J.H. Influence of inflow directions and setting angle of inlet guide vane on hydraulic performance of an axial-flow pump. Sci. Rep. 2023, 13, 3468. [Google Scholar] [CrossRef] [PubMed]
  10. Zhao, Z.; Guo, Z.; Qian, Z.; Cheng, Q. Performance improvement of an axial-flow pump with inlet guide vanes in the turbine mode. Proc. Inst. Mech. Eng. Part A J. Power Energy 2020, 234, 323–331. [Google Scholar] [CrossRef]
  11. Li, D.; Zhang, N.; Jiang, J.; Gao, B.; Alubokin, A.A.; Zhou, W.; Shi, J. Numerical investigation on the unsteady vortical structure and pressure pulsations of a centrifugal pump with the vaned diffuser. Int. J. Heat Fluid Flow 2022, 98, 109050. [Google Scholar] [CrossRef]
  12. Long, Y.; An, C.; Zhu, R.; Chen, J. Research on hydrodynamics of high velocity regions in a water-jet pump based on experimental and numerical calculations at different cavitation conditions. Phys. Fluids 2021, 33, 045124. [Google Scholar] [CrossRef]
  13. Nguyen, D.A.; Lee, H.J.; Kim, S.; Choi, B.L.; Choi, D.H.; Kim, G.S.; Sun, S.; Kim, J.H. Multiobjective hydraulic optimization of the diffuser vane in an axial flow pump. Phys. Fluids 2024, 36, 075125. [Google Scholar] [CrossRef]
  14. Shi, L.; Chai, Y.; Wang, L.; Xu, T.; Jiang, Y.; Xing, J.; Yan, B.; Cheng, Y.; Han, Y. Numerical simulation and model test of the influence of guide vane angle on the performance of axial flow pump. Phys. Fluids 2023, 35, 015129. [Google Scholar] [CrossRef]
  15. Yan, P.; Chen, T.; Wu, D.Z.; Wang, L.Q. Multi-point optimization on the diffuser of an axial flow pump. IOP Conf. Ser. Mater. Sci. Eng. 2013, 52, 022011. [Google Scholar] [CrossRef]
  16. Tong, Z.; Yang, Z.; Tong, S.; Shu, Z.; Cao, X.E. Investigating the hydraulic performance of slanted axial flow pumps using an enstrophy dissipation-based hybrid optimization approach. Phys. Fluids 2023, 35, 057117. [Google Scholar] [CrossRef]
  17. Zhang, H.; Cao, P.; Ni, D.; Gong, X.; He, B.; Zhu, R. Investigation on the Impact of Trailing Edge Stacking Styles on Hydraulic Performance in the Multistage Submersible Pump Space Diffuser. Processes 2023, 11, 3358. [Google Scholar] [CrossRef]
  18. Wang, W.; Qiu, G.; Pei, J.; Pavesi, G.; Tai, G.; Yuan, S. Effect of return channel on performance and pressure fluctuation of pump turbine. Phys. Fluids 2024, 36, 105129. [Google Scholar] [CrossRef]
  19. Xu, L.; Lv, F.; Li, F.; Ji, D.; Shi, W.; Lu, W.; Lu, L. Comparison of energy performance of shaft tubular pump device at two guide vane inlet angles. Processes 2022, 10, 1054. [Google Scholar] [CrossRef]
  20. Pei, J.; Meng, F.; Li, Y.; Yuan, S.; Chen, J. Effects of distance between impeller and guide vane on losses in a low head pump by entropy production analysis. Adv. Mech. Eng. 2016, 8, 1–11. [Google Scholar] [CrossRef]
  21. Zhang, F.; Fang, M.; Pan, J.; Tao, R.; Zhu, D.; Liu, W.; Xiao, R. Guide vane profile optimization of pump-turbine for grid connection performance improvement. Energy 2023, 274, 127369. [Google Scholar] [CrossRef]
  22. Li, Y.; Song, Y.; Xia, S.; Li, Q. Influence of guide vane slope on axial-flow hydraulic performance and internal flow characteristics. Energies 2022, 15, 6103. [Google Scholar] [CrossRef]
  23. Tian, X.; Cheng, L.; Jiao, W.; Wang, Y.; Luo, C. Analysis of internal flow characteristics and entropy generation of low head bulb tubular pump. Front. Energy Res. 2023, 11, 1183086. [Google Scholar] [CrossRef]
  24. Sun, L.; Pan, Q.; Zhang, D.; Zhao, R.; van Esch, B.B. Numerical study of the energy loss in the bulb tubular pump system focusing on the off-design conditions based on combined energy analysis methods. Energy 2022, 258, 124794. [Google Scholar] [CrossRef]
  25. Shi, L.; Han, Y.; Xu, P.; Sun, Y.; Qiao, F.; Chen, Y.; Xue, M.; Chai, Y. Experimental study and numerical simulation of internal flow dissipation mechanism of an axial-flow pump under different design parameters. Sci. Rep. 2024, 14, 27619. [Google Scholar] [CrossRef]
  26. Yu, L.; Cheng, L.; Xu, W.; Lei, S. Study on the Influence of Tip Clearance on Cavitation Performance and Entropy Production of an Axial Flow Pump. J. Mar. Sci. Eng. 2024, 12, 101. [Google Scholar] [CrossRef]
  27. Cheng, K.; Li, S.; Cheng, L.; Sun, T.; Zhang, B.; Jiao, W. Experiment on Influence of Blade Angle on Hydraulic Characteristics of the Shaft Tubular Pumping Device. Processes 2022, 10, 590. [Google Scholar] [CrossRef]
  28. Shi, L.; Jiang, Y.; Shi, W.; Sun, Y.; Qiao, F.; Tang, F.; Xu, T. Numerical analysis of energy loss in stall zone for full tubular pump based on entropy generation theory. J. Mar. Sci. Eng. 2023, 11, 895. [Google Scholar] [CrossRef]
  29. Ji, D.; Lu, W.; Xu, B.; Xu, L.; Lu, L. Study of Energy Loss Characteristics of a Shaft Tubular Pump Device Based on the Entropy Production Method. Entropy 2023, 25, 995. [Google Scholar] [CrossRef] [PubMed]
  30. Meng, F.; Li, Y.; Pei, J. Energy characteristics of full tubular pump device with different backflow clearances based on entropy production. Appl. Sci. 2021, 11, 3376. [Google Scholar] [CrossRef]
  31. Yakhot, V.; Orszag, S.A.; Thangam, S.; Gatski, T.B.; Speziale, C.G. Development of turbulence models for shear flows by a double expansion technique. Phys. Fluids A Fluid Dyn. 1992, 4, 1510–1520. [Google Scholar] [CrossRef]
Figure 1. A schematic diagram of the post positional bulb tubular pump system. (1) Ribs. (2) Impeller. (3) Diffuser (4) Bulb body. (5) Support body.
Processes 13 00264 g001
Figure 2. The layout of the bulb tubular pump. (1) Inlet channel. (2) Impeller. (3) Guide vane. (4) Support body. (5) Bulb body. (6) Outlet channel. (7) Water barrier pier.
Processes 13 00264 g002
Figure 3. Flow passage component mesh.
Processes 13 00264 g003
Figure 4. Grid convergence curve.
Processes 13 00264 g004
Figure 5. Bulb tubular pump hydraulic model test. (1) Impeller. (2) Diffuser.
Processes 13 00264 g005
Figure 6. External characteristics comparison.
Processes 13 00264 g006
Figure 7. Overall streamline diagram.
Processes 13 00264 g007
Figure 8. Diagram of leaf expansion.
Processes 13 00264 g008
Figure 9. Impeller guide vane blade height expansion.
Processes 13 00264 g009
Figure 10. Relationship between head and factor levels.
Processes 13 00264 g010
Figure 11. Relationship between hydraulic efficiency and factor levels.
Processes 13 00264 g011
Figure 12. Pressure contour of guide vane before and after optimization.
Processes 13 00264 g012
Figure 13. Velocity streamlines at different blade heights.
Processes 13 00264 g013
Figure 14. Entropy production chart at different blade heights.
Processes 13 00264 g014
Table 1. Specific parameters of the impeller and guide vane.
Flow Passage ComponentGeometric ParameterValue
ImpellerHub diameter1600 mm
Hub ratio0.37
Impeller outlet diameter4300 mm
Number of blades3
Inlet diameter4520 mm
Outlet diameter5520 mm
Blade tip clearance5 mm
Guide vaneGuide vane diffusion angle13.4°
Number of blades5
Blade setting angle
Table 2. Factors and levels.
Factors and Levels
LevelsFactors
α β h 1 /(°) α β s 1 /(°) α β h 2 /(°) α β s 2 /(°) φ /(°)
18989979314
29090989415
39191999516
Table 3. Orthogonal experiment design table.
SchemesFactors
A/(°)B/(°)C/(°)D/(°)E/(°)
18997899314
28997909415
38997919516
48998899416
58998909514
68998919315
78999899515
88999909316
98999919414
109097909516
119097919314
129097899415
139098909315
149098919416
159098899514
169099909414
179099919515
189099899316
199197919415
209197899516
219197909314
229198919514
239198899314
249198909416
259199919316
269199899414
279199909515
Table 4. Scheme numerical calculation results.
SchemesH/m η /%SchemesH/m η /%SchemesH/m η /%
12.97477.2522.97477.3432.9877.45
42.9977.6252.9777.2462.97777.41
72.97277.3882.98877.5992.97477.29
102.98777.58112.97577.25122.97777.4
132.97777.4142.97577.41152.97177.24
162.97477.3172.97577.41182.99777.68
192.97777.36202.98277.49212.97577.24
222.9777.24232.9777.24242.98377.5
252.98477.54262.97577.31272.97577.41
Table 5. Head range analysis.
IndexABCDE
Head H/m K 1 26.79926.80126.80826.81726.758
K 2 26.80826.78326.80326.79926.774
K 3 26.79126.81426.78726.78226.876
K 1 ¯ 2.9782.9782.9792.982.973
K 2 ¯ 2.9792.9762.9782.9782.975
K 3 ¯ 2.9772.9792.9762.9762.986
R0.0020.0030.0030.0040.013
Table 6. Hydraulic efficiency range analysis.
IndexABCDE
E f f i c i e n c y
η /%
K 1 696.57696.36696.61696.6695.36
K 2 696.67696.3696.6696.53696.35
K 3 696.33696.91696.36696.44697.86
K 1 ¯ 77.477.37377.40177.477.262
K 2 ¯ 77.40877.36777.477.39277.372
K 3 ¯ 77.3777.43477.37377.38277.54
R0.0380.0670.0280.0180.278
Disclaimer/Publisher’s Note: The statements, opinions and data contained in all publications are solely those of the individual author(s) and contributor(s) and not of MDPI and/or the editor(s). MDPI and/or the editor(s) disclaim responsibility for any injury to people or property resulting from any ideas, methods, instructions or products referred to in the content.

